pronosticos con pocofhfdhgs datos
DESCRIPTION
fgh fhdfhgfdghfdghfdghdfghfgdh hggfdhfdgh fdgh dfgh fd hdfhfgh hgfhdfghdf fghfdgh dghdfgh fh fghfdhTRANSCRIPT

7/18/2019 Pronosticos Con Pocofhfdhgs Datos
http://slidepdf.com/reader/full/pronosticos-con-pocofhfdhgs-datos 1/24
Ejercicio 2
Se dispone de información del PBI anual en millones de S/. desde 1950 ha
Año (1 + r.t) r.t r t
1950 2192(.( 2192(.(
1951 23987.1 25065.7 1.1 0.1 0.143 1
1952 25230.7 28202.6 1.3 0.3 0.143 2
1953 26469.6 31339.5 1.4 0.4 0.143 3
1954 28086.0 34476.4 1.6 0.6 0.143 4
1955 29719.5 37613.3 1.7 0.7 0.143 5
1956 31006.3 40750.2 1.9 0.9 0.143 6
1957 33097.4 43887.1 2.0 1.0 0.143 7
1958 32855.1 47024.0 2.1 1.1 0.143 8
1959 33369.2 50160.9 2.3 1.3 0.143 91960 36354.6 53297.8 2.4 1.4 0.143 10
1961 39412.8 56434.7 2.6 1.6 0.143 11
1962 43053.8 59571.6 2.7 1.7 0.143 12
1963 45386.6 62708.5 2.9 1.9 0.143 13
1964 48198.4 65845.4 3.0 2.0 0.143 14
1965 51406.4 68982.4 3.1 2.1 0.143 15
1966 55589.8 72119.3 3.3 2.3 0.143 16
1967 58045.6 75256.2 3.4 2.4 0.143 17
1968 58271.2 78393.1 3.6 2.6 0.143 18
1969 60527.9 81530.0 3.7 2.7 0.143 19
1970 64274.8 84666.9 3.9 2.9 0.143 20
1971 67177.2 87803.8 4.0 3.0 0.143 21
1972 69479.4 90940.7 4.1 3.1 0.143 22
1973 73980.2 94077.6 4.3 3.3 0.143 23
1974 80480.6 97214.5 4.4 3.4 0.143 24
1975 84024.0 100351.4 4.6 3.6 0.143 25
1976 85003.8 103488.3 4.7 3.7 0.143 26
1977 85528.5 106625.2 4.9 3.9 0.143 27
1978 82296.0 109762.1 5.0 4.0 0.143 28
1979 83920.3 112899.0 5.1 4.1 0.143 29
1980 90353.8 116035.9 5.3 4.3 0.143 30
1981 95290.8 119172.8 5.4 4.4 0.143 31
1982 94978.7 122309.7 5.6 4.6 0.143 32
1983 86110.7 125446.6 5.7 4.7 0.143 33
1984 89381.6 128583.5 5.9 4.9 0.143 34
1985 91249.6 131720.4 6.0 5.0 0.143 35
1986 102300.5 134857.3 6.1 5.1 0.143 36
1987 110222.4 137994.2 6.3 5.3 0.143 37
PBI (Mill. S/.)BCRP
PBI (Mill. S/.)PRO!S"ICO

7/18/2019 Pronosticos Con Pocofhfdhgs Datos
http://slidepdf.com/reader/full/pronosticos-con-pocofhfdhgs-datos 2/24
1988 99839.2 141131.1 6.4 5.4 0.143 38
1989 86431.4 144268.0 6.6 5.6 0.143 39
1990 82032.2 147404.9 6.7 5.7 0.143 40
1991 83759.7 150541.8 6.9 5.9 0.143 41
1992 83400.6 153678.7 7.0 6.0 0.143 42
1993 87374.6 156815.6 7.2 6.2 0.143 43
1994 98577.4 159952.5 7.3 6.3 0.143 441995 107063.9 163089.4 7.4 6.4 0.143 45
1996 109760.0 166226.3 7.6 6.6 0.143 46
1997 117294.0 169363.2 7.7 6.7 0.143 47
1998 116522.3 172500.1 7.9 6.9 0.143 48
1999 117587.4 175637.0 8.0 7.0 0.143 49
2000 121056.9 178773.9 8.2 7.2 0.143 50
2001 121317.1 181910.8 8.3 7.3 0.143 51
2002 127402.0 185047.7 8.4 7.4 0.143 52
2003 132543.8 188184.6 8.6 7.6 0.143 53
2004 139141.2 191321.5 8.7 7.7 0.143 542005 148640.0 194458.4 8.9 7.9 0.143 55
2006 160145.5 197595.3 9.0 8.0 0.143 56
2007 174407.4 200732.2 9.2 8.2 0.143 57
2008 191505.2 203869.1 9.3 8.3 0.143 58
2009 193155.4 207006.0 9.4 8.4 0.143 59
2010 2101)2.9 2101)2.9 9.6 8.6 0.143 60
2011 213279.8 9.7 8.7 0.143 61
2012 216416.7 9.9 8.9 0.143 62
2013 219553.6 10.0 9.0 0.143 63
2014 222690.5 10.2 9.2 0.143 64
2015 225827.4 10.3 9.3 0.143 65
2016 228964.3 10.4 9.4 0.143 66

7/18/2019 Pronosticos Con Pocofhfdhgs Datos
http://slidepdf.com/reader/full/pronosticos-con-pocofhfdhgs-datos 3/24
sta 2010. !u"nto ser#a el PBI al 201$ %ajo el m&todo de crecimiento aritm&ti
*órmula
t 210142.9
o 21928.8
t 60
r 0.1430
Al 2016 228964.3
0.0
50000.0
100000.0
150000.0
200000.0
250000.0
PBI (Mill. S/.)BCRP

7/18/2019 Pronosticos Con Pocofhfdhgs Datos
http://slidepdf.com/reader/full/pronosticos-con-pocofhfdhgs-datos 4/24

7/18/2019 Pronosticos Con Pocofhfdhgs Datos
http://slidepdf.com/reader/full/pronosticos-con-pocofhfdhgs-datos 5/24
co'
PBI (Mill. S/.)PRO!S"ICO

7/18/2019 Pronosticos Con Pocofhfdhgs Datos
http://slidepdf.com/reader/full/pronosticos-con-pocofhfdhgs-datos 6/24

7/18/2019 Pronosticos Con Pocofhfdhgs Datos
http://slidepdf.com/reader/full/pronosticos-con-pocofhfdhgs-datos 7/24
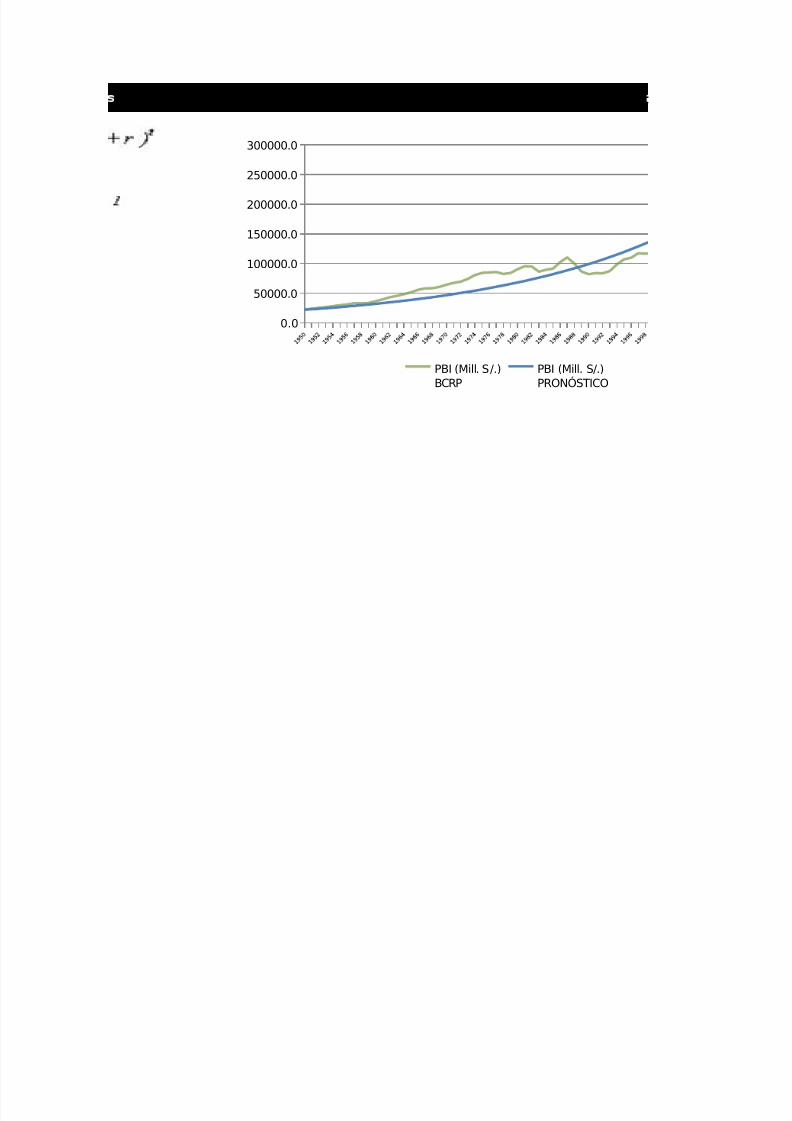
Ejercicio 1
Se dispone de información del PBI anual en millones de S/. desde 1950 ha
Año*órmulas
1950 2192(.( 2192(.(1951 23987.1 22770.6
1952 25230.7 23644.6
1953 26469.6 24552.2
1954 28086.0 25494.6
1955 29719.5 26473.2 t 210142.9
1956 31006.3 27489.4 o 21928.8
1957 33097.4 28544.6 t 60
1958 32855.1 29640.3 (1 + r) 1.0384
1959 33369.2 30778.0
1960 36354.6 31959.4 Al 2016 263429.71961 39412.8 33186.2
1962 43053.8 34460.0
1963 45386.6 35782.7
1964 48198.4 37156.2
1965 51406.4 38582.5
1966 55589.8 40063.5
1967 58045.6 41601.3
1968 58271.2 43198.2
1969 60527.9 44856.3
1970 64274.8 46578.1
1971 67177.2 48366.0
1972 69479.4 50222.5
1973 73980.2 52150.3
1974 80480.6 54152.1
1975 84024.0 56230.7
1976 85003.8 58389.1
1977 85528.5 60630.3
1978 82296.0 62957.6
1979 83920.3 65374.3
1980 90353.8 67883.6
1981 95290.8 70489.3
1982 94978.7 73195.0
1983 86110.7 76004.6
1984 89381.6 78922.0
1985 91249.6 81951.5
1986 102300.5 85097.1
1987 110222.4 88363.6
1988 99839.2 91755.4
PBI (Mill. S/.)BCRP
PBI (Mill. S/.)PRO!S"ICO
7/18/2019 Pronosticos Con Pocofhfdhgs Datos
http://slidepdf.com/reader/full/pronosticos-con-pocofhfdhgs-datos 8/24
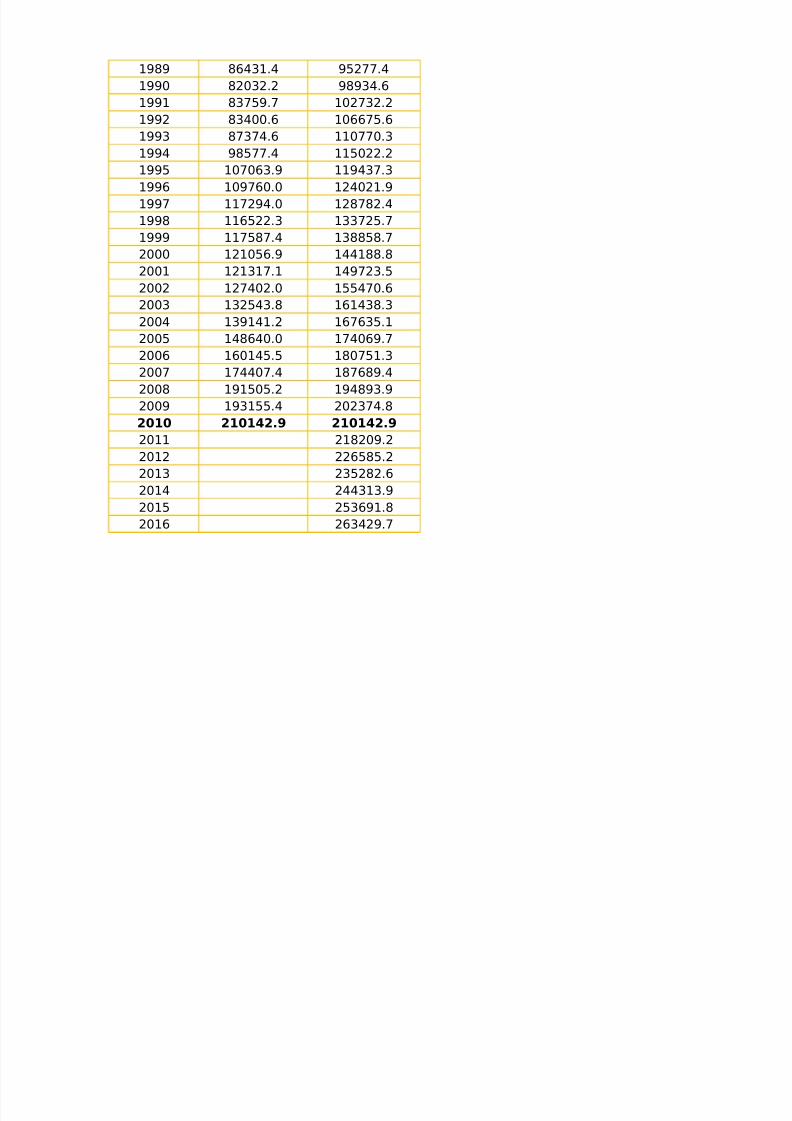
1989 86431.4 95277.4
1990 82032.2 98934.6
1991 83759.7 102732.2
1992 83400.6 106675.6
1993 87374.6 110770.3
1994 98577.4 115022.2
1995 107063.9 119437.31996 109760.0 124021.9
1997 117294.0 128782.4
1998 116522.3 133725.7
1999 117587.4 138858.7
2000 121056.9 144188.8
2001 121317.1 149723.5
2002 127402.0 155470.6
2003 132543.8 161438.3
2004 139141.2 167635.1
2005 148640.0 174069.72006 160145.5 180751.3
2007 174407.4 187689.4
2008 191505.2 194893.9
2009 193155.4 202374.8
2010 2101)2.9 2101)2.9
2011 218209.2
2012 226585.2
2013 235282.6
2014 244313.9
2015 253691.8
2016 263429.7
7/18/2019 Pronosticos Con Pocofhfdhgs Datos
http://slidepdf.com/reader/full/pronosticos-con-pocofhfdhgs-datos 9/24
ta 2010. !u"nto ser#a el PBI al 201$ %ajo el m&todo de crecimiento +eom&t
0.0
50000.0
100000.0
150000.0
200000.0
250000.0
300000.0
PBI (Mill. S/.)BCRP
PBI (Mill. S/.)PRO!S"ICO

7/18/2019 Pronosticos Con Pocofhfdhgs Datos
http://slidepdf.com/reader/full/pronosticos-con-pocofhfdhgs-datos 10/24

7/18/2019 Pronosticos Con Pocofhfdhgs Datos
http://slidepdf.com/reader/full/pronosticos-con-pocofhfdhgs-datos 11/24
ico'

7/18/2019 Pronosticos Con Pocofhfdhgs Datos
http://slidepdf.com/reader/full/pronosticos-con-pocofhfdhgs-datos 12/24

7/18/2019 Pronosticos Con Pocofhfdhgs Datos
http://slidepdf.com/reader/full/pronosticos-con-pocofhfdhgs-datos 13/24
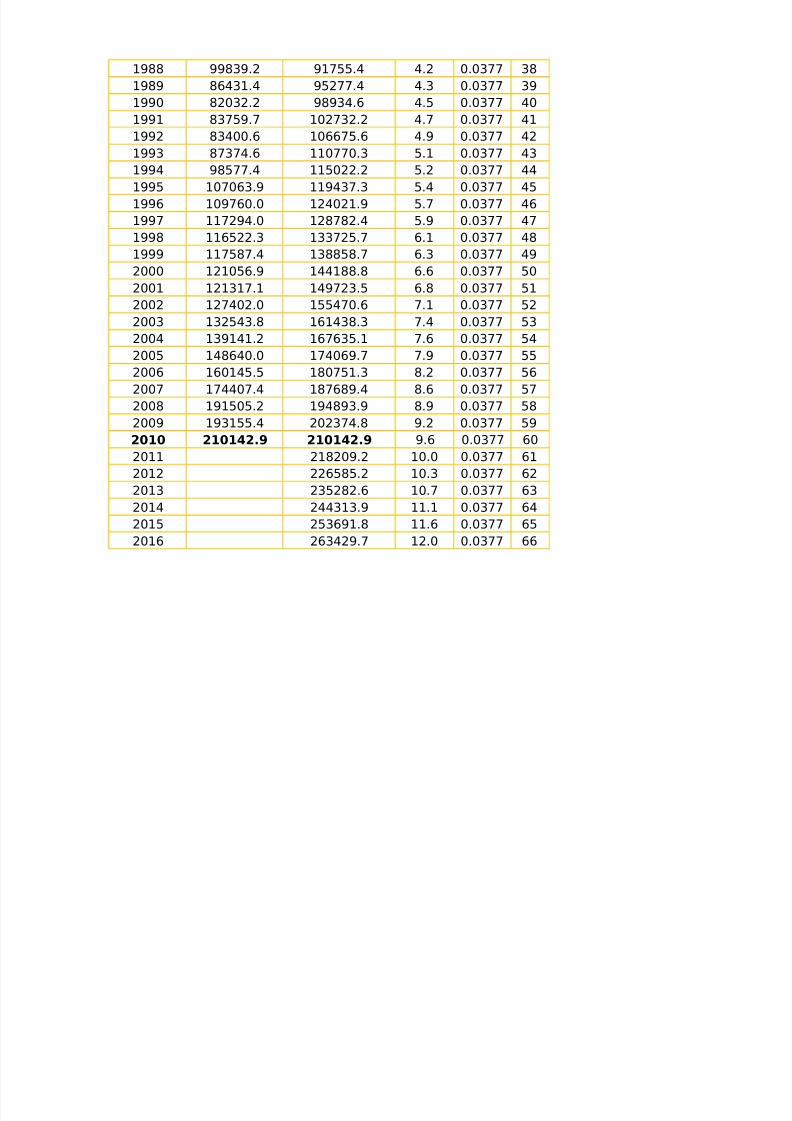
Ejercicio ,
Se dispone de información del PBI anual en millones de S/. desde 1950 hasta
Año #$ (r.t) r t
*órmulas
1950 2192(.( 2192(.(
1951 23987.1 22770.6 1.0 0.0377 1
1952 25230.7 23644.6 1.1 0.0377 2
1953 26469.6 24552.2 1.1 0.0377 3
1954 28086.0 25494.6 1.2 0.0377 4 t
1955 29719.5 26473.2 1.2 0.0377 5 o
1956 31006.3 27489.4 1.3 0.0377 6 t
1957 33097.4 28544.6 1.3 0.0377 7 r
1958 32855.1 29640.3 1.4 0.0377 8 #
1959 33369.2 30778.0 1.4 0.0377 9 Al 20161960 36354.6 31959.4 1.5 0.0377 10
1961 39412.8 33186.2 1.5 0.0377 11
1962 43053.8 34460.0 1.6 0.0377 12
1963 45386.6 35782.7 1.6 0.0377 13
1964 48198.4 37156.2 1.7 0.0377 14
1965 51406.4 38582.5 1.8 0.0377 15
1966 55589.8 40063.5 1.8 0.0377 16
1967 58045.6 41601.3 1.9 0.0377 17
1968 58271.2 43198.2 2.0 0.0377 18
1969 60527.9 44856.3 2.0 0.0377 191970 64274.8 46578.1 2.1 0.0377 20
1971 67177.2 48366.0 2.2 0.0377 21
1972 69479.4 50222.5 2.3 0.0377 22
1973 73980.2 52150.3 2.4 0.0377 23
1974 80480.6 54152.1 2.5 0.0377 24
1975 84024.0 56230.7 2.6 0.0377 25
1976 85003.8 58389.1 2.7 0.0377 26
1977 85528.5 60630.3 2.8 0.0377 27
1978 82296.0 62957.6 2.9 0.0377 28
1979 83920.3 65374.3 3.0 0.0377 291980 90353.8 67883.6 3.1 0.0377 30
1981 95290.8 70489.3 3.2 0.0377 31
1982 94978.7 73195.0 3.3 0.0377 32
1983 86110.7 76004.6 3.5 0.0377 33
1984 89381.6 78922.0 3.6 0.0377 34
1985 91249.6 81951.5 3.7 0.0377 35
1986 102300.5 85097.1 3.9 0.0377 36
1987 110222.4 88363.6 4.0 0.0377 37
PBI (Mill. S/.)BCRP
PBI (Mill. S/.)PRO!S"ICO
7/18/2019 Pronosticos Con Pocofhfdhgs Datos
http://slidepdf.com/reader/full/pronosticos-con-pocofhfdhgs-datos 14/24
1988 99839.2 91755.4 4.2 0.0377 38
1989 86431.4 95277.4 4.3 0.0377 39
1990 82032.2 98934.6 4.5 0.0377 40
1991 83759.7 102732.2 4.7 0.0377 41
1992 83400.6 106675.6 4.9 0.0377 42
1993 87374.6 110770.3 5.1 0.0377 43
1994 98577.4 115022.2 5.2 0.0377 441995 107063.9 119437.3 5.4 0.0377 45
1996 109760.0 124021.9 5.7 0.0377 46
1997 117294.0 128782.4 5.9 0.0377 47
1998 116522.3 133725.7 6.1 0.0377 48
1999 117587.4 138858.7 6.3 0.0377 49
2000 121056.9 144188.8 6.6 0.0377 50
2001 121317.1 149723.5 6.8 0.0377 51
2002 127402.0 155470.6 7.1 0.0377 52
2003 132543.8 161438.3 7.4 0.0377 53
2004 139141.2 167635.1 7.6 0.0377 542005 148640.0 174069.7 7.9 0.0377 55
2006 160145.5 180751.3 8.2 0.0377 56
2007 174407.4 187689.4 8.6 0.0377 57
2008 191505.2 194893.9 8.9 0.0377 58
2009 193155.4 202374.8 9.2 0.0377 59
2010 2101)2.9 2101)2.9 9.6 0.0377 60
2011 218209.2 10.0 0.0377 61
2012 226585.2 10.3 0.0377 62
2013 235282.6 10.7 0.0377 63
2014 244313.9 11.1 0.0377 64
2015 253691.8 11.6 0.0377 65
2016 263429.7 12.0 0.0377 66
7/18/2019 Pronosticos Con Pocofhfdhgs Datos
http://slidepdf.com/reader/full/pronosticos-con-pocofhfdhgs-datos 15/24
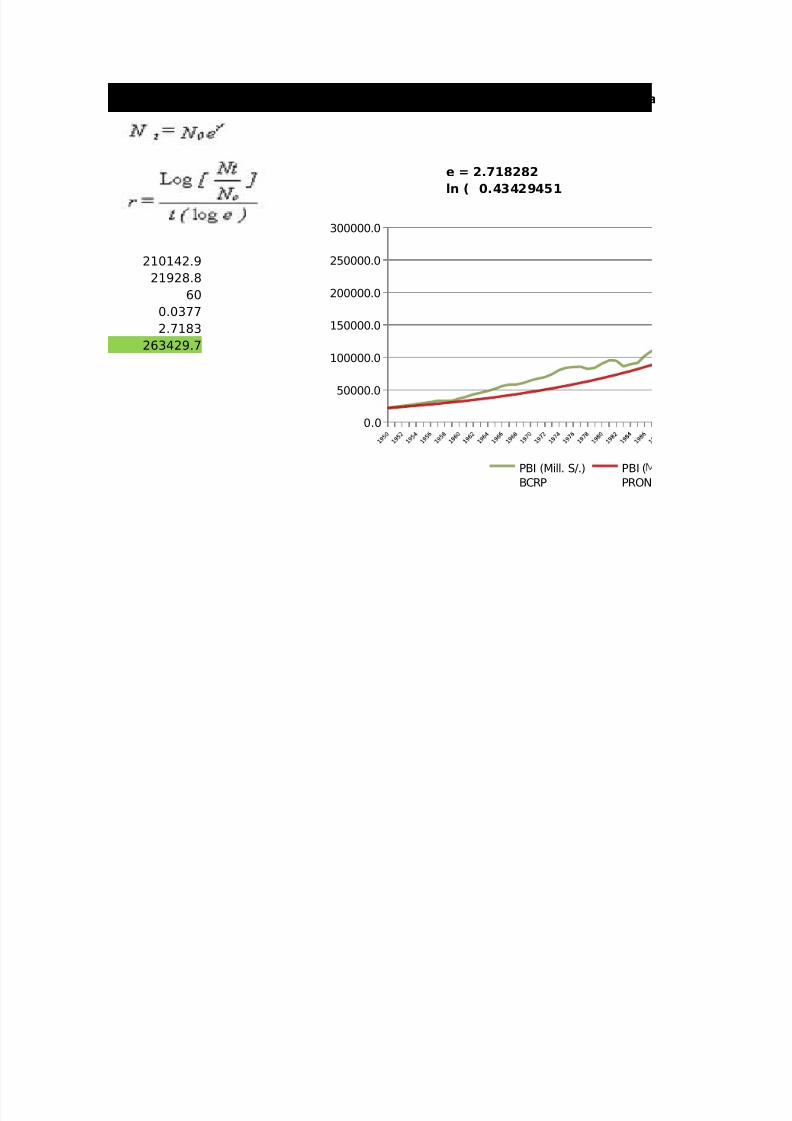
2010. !u"nto ser#a el PBI al 201$ %ajo el m&todo de crecimiento e-ponencia
e 2.1(2(2ln 0.),)29)51
210142.9
21928.8
60
0.0377
2.7183
263429.7
0.0
50000.0
100000.0
150000.0
200000.0
250000.0
300000.0
PBI (Mill. S/.)BCRP
PBI (PRO

7/18/2019 Pronosticos Con Pocofhfdhgs Datos
http://slidepdf.com/reader/full/pronosticos-con-pocofhfdhgs-datos 16/24

7/18/2019 Pronosticos Con Pocofhfdhgs Datos
http://slidepdf.com/reader/full/pronosticos-con-pocofhfdhgs-datos 17/24
l'
ill. S/.)!S"ICO

7/18/2019 Pronosticos Con Pocofhfdhgs Datos
http://slidepdf.com/reader/full/pronosticos-con-pocofhfdhgs-datos 18/24
7/18/2019 Pronosticos Con Pocofhfdhgs Datos
http://slidepdf.com/reader/full/pronosticos-con-pocofhfdhgs-datos 19/24
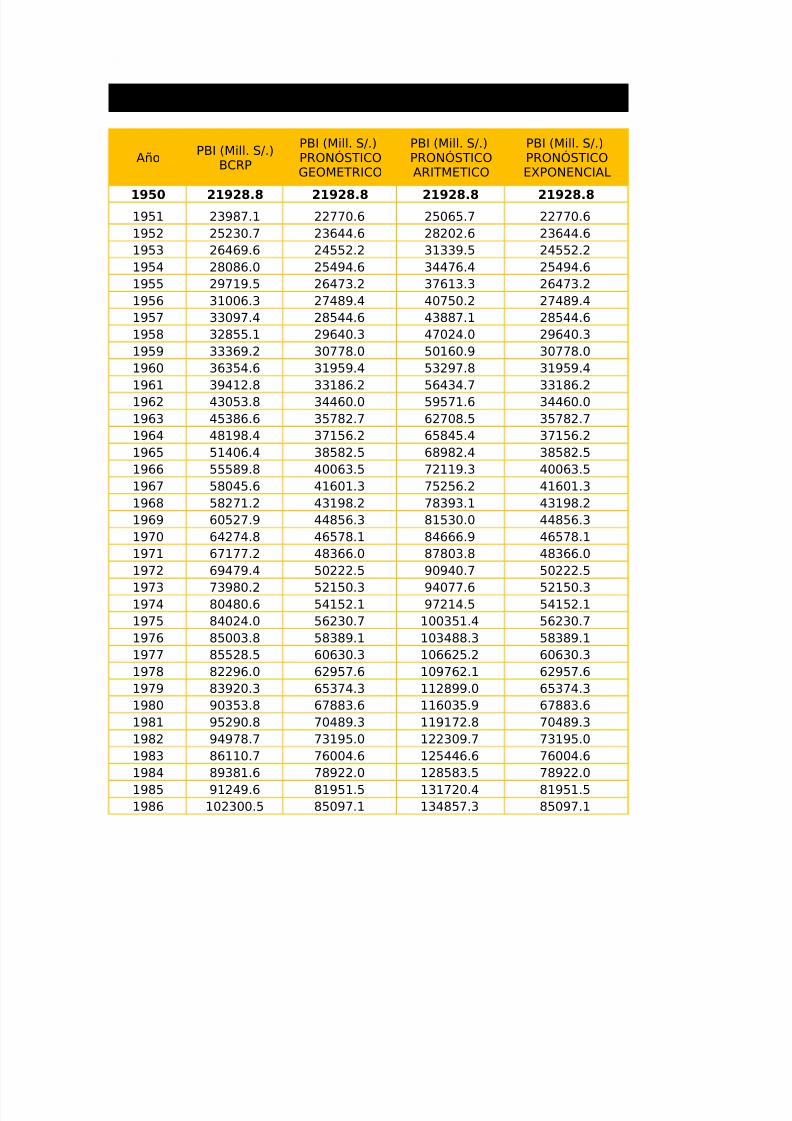
esumen de los m&todos de pronósticos
Año
1950 2192(.( 2192(.( 2192(.( 2192(.(
1951 23987.1 22770.6 25065.7 22770.6
1952 25230.7 23644.6 28202.6 23644.6
1953 26469.6 24552.2 31339.5 24552.2
1954 28086.0 25494.6 34476.4 25494.6
1955 29719.5 26473.2 37613.3 26473.2
1956 31006.3 27489.4 40750.2 27489.4
1957 33097.4 28544.6 43887.1 28544.6
1958 32855.1 29640.3 47024.0 29640.3
1959 33369.2 30778.0 50160.9 30778.0
1960 36354.6 31959.4 53297.8 31959.4
1961 39412.8 33186.2 56434.7 33186.2
1962 43053.8 34460.0 59571.6 34460.0
1963 45386.6 35782.7 62708.5 35782.7
1964 48198.4 37156.2 65845.4 37156.2
1965 51406.4 38582.5 68982.4 38582.5
1966 55589.8 40063.5 72119.3 40063.5
1967 58045.6 41601.3 75256.2 41601.3
1968 58271.2 43198.2 78393.1 43198.2
1969 60527.9 44856.3 81530.0 44856.31970 64274.8 46578.1 84666.9 46578.1
1971 67177.2 48366.0 87803.8 48366.0
1972 69479.4 50222.5 90940.7 50222.5
1973 73980.2 52150.3 94077.6 52150.3
1974 80480.6 54152.1 97214.5 54152.1
1975 84024.0 56230.7 100351.4 56230.7
1976 85003.8 58389.1 103488.3 58389.1
1977 85528.5 60630.3 106625.2 60630.3
1978 82296.0 62957.6 109762.1 62957.6
1979 83920.3 65374.3 112899.0 65374.31980 90353.8 67883.6 116035.9 67883.6
1981 95290.8 70489.3 119172.8 70489.3
1982 94978.7 73195.0 122309.7 73195.0
1983 86110.7 76004.6 125446.6 76004.6
1984 89381.6 78922.0 128583.5 78922.0
1985 91249.6 81951.5 131720.4 81951.5
1986 102300.5 85097.1 134857.3 85097.1
PBI (Mill. S/.)BCRP
PBI (Mill. S/.)PRO!S"ICO
%&OM&"RICO
PBI (Mill. S/.)PRO!S"ICO
ARI"M&"ICO
PBI (Mill. S/.)PRO!S"ICO
&'PO&CIA
7/18/2019 Pronosticos Con Pocofhfdhgs Datos
http://slidepdf.com/reader/full/pronosticos-con-pocofhfdhgs-datos 20/24
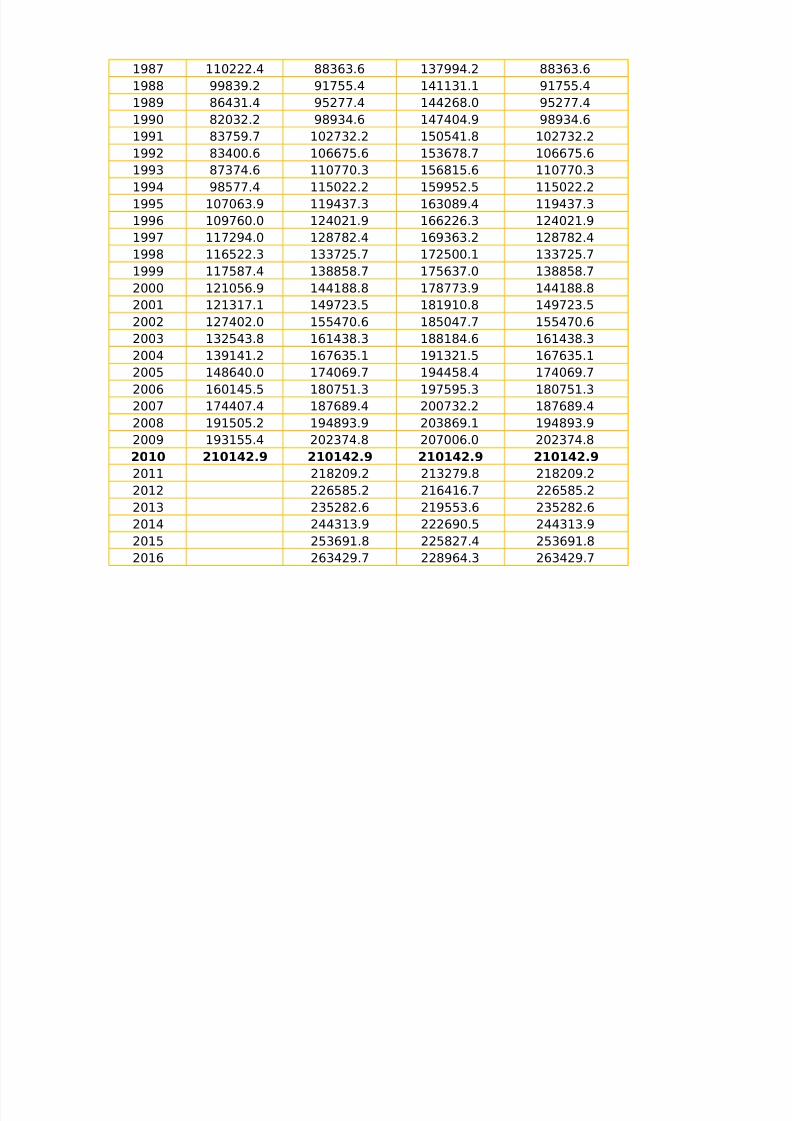
1987 110222.4 88363.6 137994.2 88363.6
1988 99839.2 91755.4 141131.1 91755.4
1989 86431.4 95277.4 144268.0 95277.4
1990 82032.2 98934.6 147404.9 98934.6
1991 83759.7 102732.2 150541.8 102732.2
1992 83400.6 106675.6 153678.7 106675.6
1993 87374.6 110770.3 156815.6 110770.31994 98577.4 115022.2 159952.5 115022.2
1995 107063.9 119437.3 163089.4 119437.3
1996 109760.0 124021.9 166226.3 124021.9
1997 117294.0 128782.4 169363.2 128782.4
1998 116522.3 133725.7 172500.1 133725.7
1999 117587.4 138858.7 175637.0 138858.7
2000 121056.9 144188.8 178773.9 144188.8
2001 121317.1 149723.5 181910.8 149723.5
2002 127402.0 155470.6 185047.7 155470.6
2003 132543.8 161438.3 188184.6 161438.32004 139141.2 167635.1 191321.5 167635.1
2005 148640.0 174069.7 194458.4 174069.7
2006 160145.5 180751.3 197595.3 180751.3
2007 174407.4 187689.4 200732.2 187689.4
2008 191505.2 194893.9 203869.1 194893.9
2009 193155.4 202374.8 207006.0 202374.8
2010 2101)2.9 2101)2.9 2101)2.9 2101)2.9
2011 218209.2 213279.8 218209.2
2012 226585.2 216416.7 226585.2
2013 235282.6 219553.6 235282.6
2014 244313.9 222690.5 244313.9
2015 253691.8 225827.4 253691.8
2016 263429.7 228964.3 263429.7

7/18/2019 Pronosticos Con Pocofhfdhgs Datos
http://slidepdf.com/reader/full/pronosticos-con-pocofhfdhgs-datos 21/24
0.0
50000.0
100000.0
150000.0
200000.0
250000.0
300000.0
PBI (Mill. S/.)BCRP
PBI (Mill. S/.)PRO!S"ICO%&OM&"RICO
PBI (Mill. S/.)PRO!S"ICOARI"M&"ICO
PBI (PRO&'PO

7/18/2019 Pronosticos Con Pocofhfdhgs Datos
http://slidepdf.com/reader/full/pronosticos-con-pocofhfdhgs-datos 22/24

7/18/2019 Pronosticos Con Pocofhfdhgs Datos
http://slidepdf.com/reader/full/pronosticos-con-pocofhfdhgs-datos 23/24

7/18/2019 Pronosticos Con Pocofhfdhgs Datos
http://slidepdf.com/reader/full/pronosticos-con-pocofhfdhgs-datos 24/24