dissert final erm - wiredspace.wits.ac.za
TRANSCRIPT

G A S P H A S E E X T R A C T I O N O F
M E T A L S F R O M O X I D E S U S I N G
T H E L I G A N D A C E T Y L A C E T O N E
Epiphania Rumbidzai Memoraine Mariba
A dissertation submitted to the Faculty of Engineering and the Built Environment,
University of the Witwatersrand, Johannesburg, in fulfillment of the requirements for
the degree of Master of Science in Engineering
Johannesburg, 2010

ii
DECLARATION
I declare that this dissertation is my own unaided work. It is being submitted for the
Degree of Master of Science to the University of the Witwatersrand, Johannesburg. It
has not been submitted before for any degree or examination to any other University.
……………………………………………………
(Epiphania Rumbidzai Memoraine Mariba)
…………………………day of…………………………year…………………………
day month year

iii
ABSTRACT
Gas phase extraction using organic ligands has been gaining interest because it
eliminates many of the problems encountered in conventional mineral processing
methods. This process was successfully used to extract iron using the ligand
acetylacetone from Fe2O3 in a fluidized bed reactor, with above 80% extraction being
achieved after four hours for some experimental conditions. The extraction was
shown to be dependent on temperature, ligand flow rate and the surface area available
for reaction, with extraction increasing as each of the variables was increased.
Chrome could not be extracted successfully, with only a maximum of 12% extraction
being achieved after four hours. It was shown that the process could be used to
successfully separate mixtures containing both iron and chrome oxides by extracting
iron and leaving chrome in the solid phase. Classic shrinking core reaction models
were tested on data obtained to evaluate their fit of experimental data with theoretical
predictions. The chemical reaction limiting shrinking core model was suggested to be
the one that predominantly described the experimental data. There is need however to
develop a model which takes into account the influence of all the variables identified
as affecting the extraction. There is also need to identify ligands which will react
selectively with other metal oxides and not iron in order to the see if the other metals
can also be successfully extracted. Further work should be done on this promising
technology.

iv
DEDICATION
For my family
Past, present & future

v
ACKNOWLEDGEMENTS
I would like to extend my sincere appreciation to the following who made it possible
for me to complete this work:
The National Research Fund (NRF) for providing the financial support to purchase
the materials required to carry out the research
The School of Chemical and Metallurgical Engineering at the University of the
Witwatersrand for providing me with the facilities to carry out the research work.
My supervisors, Prof J. H Potgieter and Dr. L VanDyk; thank you for your
supervision and guidance through the trying times when we were all not sure if the
process could actually work.
Dr Yun Chen; thank you for your help in the lab where we tried everything and
anything to make the project work. Your positivity through it all kept me going when
it would have been much easier to give up.
To my colleagues and friends at Wits, thank you for the constant encouragement and
ideas on how to proceed; you made me realise that it is not the nature of research for
everything to be smooth sailing and work as it should; that is why it is called
research- there will definitely be some hiccups along the way.
Last but not least I would like to thank my family for the continued support in
everything I do.
vi
TABLE OF CONTENTS
G A S P H A S E E X T R A C T I O N O F M E T A L S F R O M O X I D ES
U S I N G T H E L I G A N D A C E T Y L A C E T O N E.................................. i
DECLARATION ..........................................................................................................ii
ABSTRACT.................................................................................................................iii
DEDICATION ............................................................................................................. iv
ACKNOWLEDGEMENTS .......................................................................................... v
TABLE OF CONTENTS.............................................................................................vi
LIST OF FIGURES ......................................................................................................x
LIST OF TABLES .....................................................................................................xiii
LIST OF SYMBOLS ..................................................................................................xv
NOMENCLATURE...................................................................................................xvi
1 INTRODUCTION ................................................................................................ 1
1.1 Background ................................................................................................... 1
1.2 Problem Statement ........................................................................................ 3
1.3 Aim of the project ......................................................................................... 4
1.4 Hypothesis..................................................................................................... 4
1.5 Dissertation lay-out ....................................................................................... 5
2 LITERATURE REVIEW...................................................................................... 6
2.1 Sources of low grade ores ............................................................................. 6
2.2 Treatment of low grade ores ....................................................................... 10
2.2.1 Conventional treatment methods......................................................... 10

vii
2.2.2 Problems associated with conventional methods................................ 14
2.2.3 Emerging technologies........................................................................ 17
2.3 Extraction of metals using ligands .............................................................. 18
2.3.1 Description of ligands ......................................................................... 18
2.3.2 Previous work involving the use of ligands for metal extraction........ 21
2.3.3 Recovery of the ligands....................................................................... 25
2.3.4 Uses of the metal complexes............................................................... 27
2.4 Fluidization ................................................................................................. 28
2.4.1 Fluidization theory .............................................................................. 28
2.4.2 Advantages and disadvantages of fluidized bed reactors.................... 34
2.4.3 Industrial applications of fluidized bed reactors ................................. 37
3 EXPERIMENTAL PROCEDURE ..................................................................... 41
3.1 Experimental setup...................................................................................... 42
3.1.1 Process flow chart ............................................................................... 42
3.1.2 Apparatus ............................................................................................ 43
3.2 Materials Description .................................................................................. 46
3.3 Experimental design.................................................................................... 48
3.3.1 Gas film diffusion controlling............................................................. 48
3.3.2 Chemical reaction control ................................................................... 49
3.4 Experimental method .................................................................................. 49
3.5 Experimental conditions.............................................................................. 50
3.6 Analysis of the product ............................................................................... 51
3.6.1 Atomic Absorption Spectrometry ....................................................... 51

viii
4 RESULTS AND DISCUSSIONS....................................................................... 53
4.1 Extraction of Iron ........................................................................................ 53
4.1.1 Effect of temperature on extraction..................................................... 54
4.1.2 Effect of ligand flow rate on extraction .............................................. 59
4.1.3 Effect of carrier gas flow rate on extraction........................................ 62
4.1.4 Effect of mass of oxide on extraction ................................................. 63
4.1.5 Surface area effect............................................................................... 64
4.2 Extraction of Chrome.................................................................................. 67
4.3 Extraction from mixtures with chromium and iron..................................... 69
5 KINETIC MODELLING OF THE EXTRACTION OF IRON.......................... 73
5.1 General rate equation .................................................................................. 73
5.1.1 The shrinking core model for chemical reactions ............................... 76
5.1.2 The grain model for chemical reactions.............................................. 78
5.1.3 Fluidized bed reactor models .............................................................. 79
5.2 Modelling the extraction of iron ................................................................. 80
5.2.1 Shrinking core model - Chemical reaction controlled ........................ 81
5.2.2 Shrinking core model -Gas film diffusion controlled ......................... 86
6 CONCLUSIONS AND RECOMMENDATIONS ............................................. 92
6.1 Conclusions ................................................................................................. 92
6.2 Recommendations ....................................................................................... 94
REFERENCES............................................................................................................ 95
APPENDIX A ........................................................................................................... 102
Parameters for the experimental setup ...................................................................... 102
ix
APPENDIX B ........................................................................................................... 104
Material Safety Data Sheets ...................................................................................... 104
Material Safety Data Sheet IRON(III) OXIDE,.................................................... 104
Material Safety Data Sheet CHROMIUM(III) OXIDE........................................ 106
Material Safety Data Sheet ACETYLACETONE ................................................ 108
Material Safety Data Sheet ETHANOL................................................................ 111
APPENDIX C ........................................................................................................... 114
Experimental results.............................................................................................. 114
Reaction models for gas phase extraction............................................................. 119
Amount of ligand required for complete reaction..................................................... 121
APPENDIX D ........................................................................................................... 123
Contributions......................................................................................................... 123
x
LIST OF FIGURES
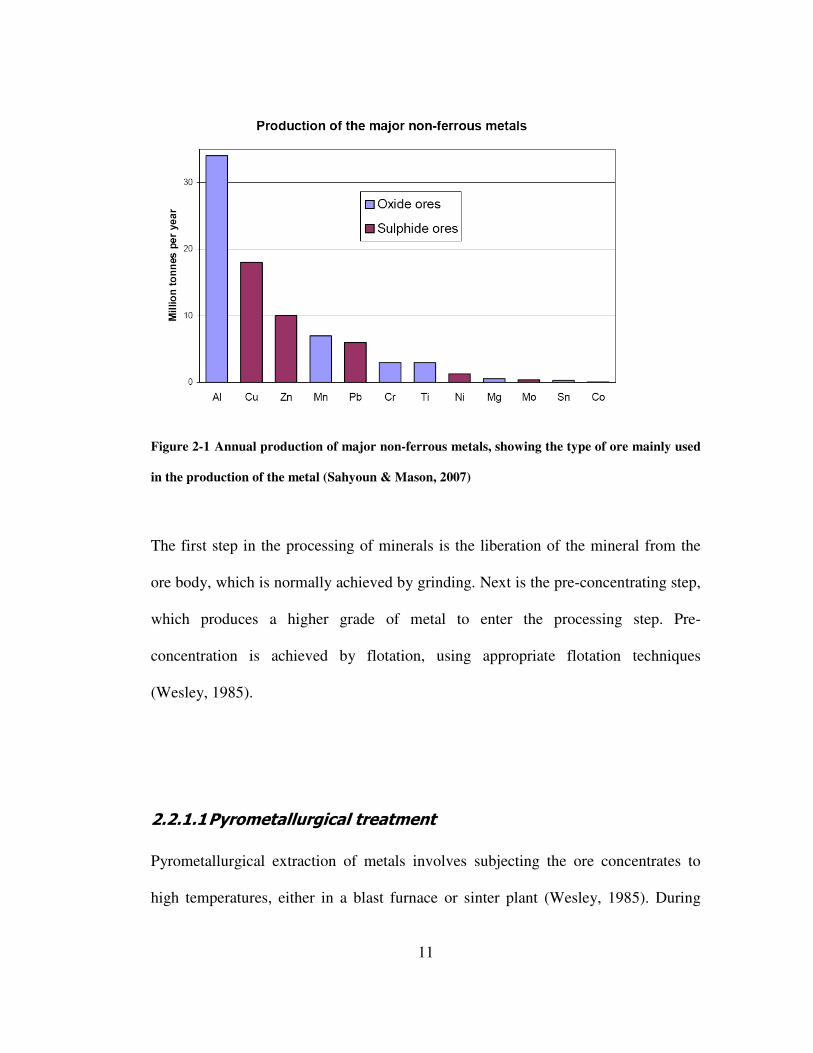
Figure 2-1 Annual production of major non-ferrous metals, showing the type of ore
mainly used in the production of the metal (Sahyoun & Mason, 2007) ..................... 11
Figure 2-2 The inter-conversion between the keto and enolic form of the acac anion20
Figure 2-3 Process flow sheet for the gas phase extraction of solid residues ............. 24
Figure 2-4 Behaviour of a packed before and at minimum fluidization velocity ....... 30
Figure 2-5 Behaviour of particles at various stages of fluidization ............................ 31
Figure 2-6 Geldart’s fluidization classification of powders (Geldart, 1986) .............. 33
Figure 3-1 Process flow sheet for metal extraction in a fluidized bed reactor............ 42
Figure 3-2 Schematic diagram of gas phase extraction .............................................. 45
Figure 4-1 Effect of temperature on extraction for a 1wt% Fe2O3 mixture ................ 55
Figure 4-2 Effect of temperature on extraction for a 3wt% Fe3O2 mixture ................ 56
Figure 4-3 Effect of temperature on extraction for a 10wt% Fe2O3 mixture .............. 57
Figure 4-4 Effect of ligand flow rate on the extraction for a 3wt% mixture at 250°C59
Figure 4-5 Effect of ligand flow rate on extraction for a 10wt% mixture at 250°C ... 60
Figure 4-6 Effect of ligand concentration on extraction at 1wt%, 3wt% and 10wt% at
250°C .......................................................................................................................... 61
Figure 4-7 Effect of metal oxide concentration on extraction at 1ml/min flow rate
after 4hrs...................................................................................................................... 63
Figure 4-8 Effect of particle size on extraction at 3ml/min on a 3wt% mixture at
230°C .......................................................................................................................... 65

xi
Figure 4-9 Effect of particle size on extraction at 3ml/min on a 3wt% mixture at
210°C .......................................................................................................................... 66
Figure 4-10 Extraction from a mixture containing 3wt%Cr2O3 at 3ml/min ............... 68
Figure 4-11 Extraction of Cr from a mixture containing Cr2O3 and 5wt% Fe2O3 at
3ml/min & 210°C........................................................................................................ 70
Figure 4-12 Extraction of Fe and Cr from mixtures containing Cr2O3 & 5wt% Fe2O3
at 3ml/min & 210°C.................................................................................................... 71
Figure 5-1Comparison of conversion predicted by chemical reaction control model
with actual data obtained at 190°C ............................................................................. 82
Figure 5-2 Comparison of conversion predicted by chemical reaction control model
with actual data obtained at 210°C ............................................................................. 82
Figure 5-3 Comparison of conversion predicted by chemical reaction control model
with actual data obtained at 230°C ............................................................................. 83
Figure 5-4 Comparison of conversion predicted by chemical reaction control model
with actual data obtained at 250°C ............................................................................. 84
Figure 5-5 Arrhenius plot for chemical reaction control model at 1wt%Fe2O3 and
1ml/min ligand flow rate............................................................................................. 85
Figure 5-6 Comparison of conversion predicted by gas film diffusion control model
with actual data obtained at 190°C ............................................................................. 87
Figure 5-7 Comparison of conversion predicted by gas film diffusion control model
with actual data obtained at 210°C ............................................................................. 87

xii
Figure 5-8 Comparison of conversion predicted by gas film diffusion control model
with actual data obtained at 230°C ............................................................................. 88
Figure 5-9 Comparison of conversion predicted by gas film diffusion control model
with actual data obtained at 250°C ............................................................................. 89
Figure 5-10 Arrhenius plot for gas film diffusion control model at 1wt%Fe2O3 and
1ml/min ligand flow rate............................................................................................. 90

xiii
LIST OF TABLES
Table 2-1: Total slag production in Australia and New Zealand in the year 2000
(Dippenaar, 2004) ......................................................................................................... 7
Table 2-2: Typical composition of non-ferrous slag (%).............................................. 8
Table 2-3: Production and use of industrial slag in India (Rai & Roa, 2005)............... 9
Table 2-4: World sulphur production from the metal industry (thousand metric
tonnes) (Sahyoun & Mason, 2007) ............................................................................. 15
Table 2-5: Net sulphur production for production of selected metals, 2005 and 2010
..................................................................................................................................... 16
Table 3-1 Properties of Fe2O3 and Cr2O3 .................................................................... 46
Table 3-2 Properties of acetylacetone and ethanol ..................................................... 47
Table 3-3 Composition of the silica sand used ........................................................... 47
Table 3-4 Values of the experimental variables used ................................................. 50
Table 4-1 Mass of iron extracted (g) after 4hrs for different charges at 1ml/min ligand
flow rate ...................................................................................................................... 58
Table 4-2 Effect of carrier gas on extraction of Fe ..................................................... 62
Table 5-1Reaction rate constants under chemical reaction control for the shrinking
core model................................................................................................................... 81
Table 5-2Reaction rate constants under gas film diffusion control for the shrinking
core model................................................................................................................... 86
Table C 1: Cumulative mass (g) of Fe extracted at 1wt% and 1ml/min ligand flow
rate............................................................................................................................. 114
xiv
Table C 2: Percentage (%) extraction of Fe at 1wt% and 1ml/min ligand flow rate 114
Table C 3: Cumulative mass (g) of Fe extracted at 3wt% and 1ml/min ligand flow
rate............................................................................................................................. 115
Table C 4: Percentage (%) extraction of Fe at 3wt% and 1ml/min ligand flow rate 115
Table C 5: Cumulative mass (g) of Fe extracted at 10wt% and 1ml/min ligand flow
rate............................................................................................................................. 115
Table C 6: Percentage (%) extraction of Fe at 10wt% and 1ml/min ligand flow rate
................................................................................................................................... 116
Table C 7: Extraction of Fe at 250°C and 3ml/min .................................................. 116
Table C 8: Extraction of Cr at 210°C and 3ml/min from a mixture containing Fe & Cr
oxides ........................................................................................................................ 117
Table C 9: Extraction of Fe at 210°C and 3ml/min from a mixture containing Fe & Cr
oxides ........................................................................................................................ 117
Table C 10: Extraction of Cr from a 3wt% mixture at 3ml/min ligand flow rate, no
Fe2O3 ......................................................................................................................... 118
Table C 11: Values of k and R2 for the shrinking core models at 3wt%Fe2O3 ......... 119
Table C 12: Activation energy for shrinking core models at 3wt% Fe2O3 ............... 119
Table C 13: Values of k and R2 for the shrinking core models at 10wt%Fe2O3 ....... 119
Table C 14: Activation energy for shrinking core models at 10wt% Fe2O3 ............. 120

xv
LIST OF SYMBOLS
CAO - initial concentration of gaseous reactant
dp – diameter of a particle
Ea – activation energy for the reaction
Fg – shape factor for a grain
I – intensity of incident light
I0 – intensity of transmitted light
k – reaction rate constant
k0 – pre-exponential factor in Arrhenius’ equation
R – ideal gas constant
r – rate of chemical reaction
umf – velocity at minimum fluidization
uo – superficial velocity
x – fractional conversion of a reaction
Greek symbols
ρg – density of gas/fluid
ρs – density of a solid
ή – effectiveness factor
µ - viscosity of a fluid
ε – voidage of a solid

xvi
NOMENCLATURE
acac – acetyl acetone anion
acacH- acetyl acetone
MS – metal sulphide
MO – metal oxide
1
1 INTRODUCTION
1.1 Background
Conventional methods for the extraction of metals from low grade sources follow
either a hydrometallurgical or a pyrometallurgical route (Cox et al., 1985). However,
these conventional methods have proven to be quite complex, with a number of
problems associated with each method. Both routes produce by-products that are
harmful to the environment, e.g. the production of large volumes of SO2 in
pyrometallurgical processing, and the production of acid fumes in the
hydrometallurgical processes. In addition, both processes produce large volumes of
solid waste as by-products (slags and sludge), which are normally dumped at slag
dumps. These slags themselves are an environmental hazard, since the low
concentrations of metals found in the slags can potentially be leached into the ground,
e.g. chromium, mercury and cadmium from landfill wastes; polluting the soil and
underground water resources (Groot & Pistorius, 2008). Additionally, fly ash
produced from the production of electric power or waste incineration is also a source
of metals that can find their way into the environment thus polluting the environment
(Allimann-Lecourt et al., 2002). Worldwide and locally, pressure to focus on
recycling of the waste produced by base metal production is increasing, with
sustainability of current practices and the environment becoming important topical
issues (Groot & Pistorius, 2008).
2
The problems associated with conventional methods of extraction have necessitated
the improvement of current practices, by the design of novel processes that try to
eliminate the problems of current practices. The extraction of metals in the gas phase
in fluidised bed reactors using organic chelating compounds is a process that will be
investigated as an alternative extraction route (Kunii & Levenspiel, 1991).
The gas phase extraction of metals using ligands is a relatively new field, with limited
work done on the subject so far. Gas phase extraction using ligands takes advantage
of the chelating properties of ligands, and the relatively low volatilization
temperatures of the complexes formed when the ligand reacts with the source of
metal. Ligands of the β-diketone family have been found to be particularly useful in
forming compounds that have the properties required for gas phase extraction. A wide
variety of metals in many matrices can be converted into volatile, thermally stable
metal β-diketonate complexes for various uses such as chromatographic separation
and analysis (Sievers & Sadlowski, 1978).
When a ligand is brought into contact with a solid matrix containing metal, for
example a metal oxide or a metal sulphide, it will form a complex with the metal
which stabilises the metal. The process can be illustrated by the equation
( ) ( )gas solid gas solidExt M Matrix M Ext Matrix+ → + (1-1)
3
Extraction of metals in the gas phase has been demonstrated in the SERVO process
where Nickel and Vanadium where successfully extracted using tetra-iso-
propyldithiophosphoramides (prps), bis(pentane-2,4-dionato)popan-1,2-diimine
(pnaa) and acetyl acetone, with prps producing the highest extraction (Allimann-
Lecourt et al., 2002). Potgieter et al. (2005) have successfully extracted Aluminium,
Iron, Chromium and Vanadium in the gas phase using acetylacetone, a β-diketone.
This work will also use the ligand acetylacetone for the extraction of metals.
Previous work carried out on gas phase extraction of metals has been mainly
concerned with preliminary feasibility of the process. Except for the effect of reaction
temperature, no work has been done to date which shows how other variables affect
the extraction. This work shows how additional variables such as ligand flow rate and
concentration of metal in the solid matrix affect gas phase extraction.
1.2 Problem Statement
The different variables that affect gas phase extraction are not known; temperature
being the only variable that has been investigated to date. Preliminary work has been
carried out, which has shown that it is possible to extract metals in a fluidized bed
reactor using acetylacetone ligand by carrying out extractions at different
temperatures (Potgieter et al., 2005). This project will aim to determine how other
4
variables affect gas phase extraction. Additionally the project will seek to investigate
the kinetics of the process which is not well understood.
1.3 Aim of the project
The aims of the project include:
� To predict the operating ranges of gas phase extraction, i.e. the temperatures
that produce reasonable extraction
� To determine how several variables such as temperature, ligand flow rate
and metal concentration in the bed affects gas phase extraction
� To determine the time need to achieve economic extraction using gas phase
extraction
� To determine how different variables affect the kinetics of gas phase
extraction
� To model the kinetics of gas phase extraction
1.4 Hypothesis
In addition to temperature the process of gas phase extraction is affected by a number
of several other variables such as ligand flow rate and concentration of metal oxide.
Once the effect of the variables is known it should be possible to develop a kinetic
5
model that can be used to predict gas phase extraction of metals by ligands in
fluidized beds from a variety of materials, such as low grade ores, slags and fly ash.
1.5 Dissertation lay-out
This dissertation constitutes further chapters as follows: Chapter 2 is a literature
review which presents some of the work utilising ligand extraction, current practices
for extraction and the problems they present together with the advantages of utilising
fluidized bed reactors. Chapter 3 presents the experimental procedures and describes
the experimental setup and the equipment used. In Chapter 4 the results of the
experimental investigation are given and discussed, whilst in Chapter 5 a model that
predicts gas phase extraction will be developed. Chapter 6 will summarize the
conclusions and the recommendations for future work to be carried out. A list of
references and appendices are given at the end of the dissertation.

6
2 LITERATURE REVIEW
This chapter begins by identifying the different sources of low grade ores that can be
used for gas phase extraction and the conventional methods used to treat these low
grade ores. Some of the problems associated with these conventional processes are
identified, together with emerging technologies regarding the processing of low grade
ores. The next section identifies previous work that has used ligand extraction in
processing different materials. The choice of fluidized beds for the extraction is
discussed by listing the advantages of using fluidized beds, and by showing some
industrial applications of fluidized beds.
2.1 Sources of low grade ores
The primary source of ores used in metallurgical refining comes from underground
ore bodies which are mined and undergo physical liberation processes before being
taken for refining. However, as ore deposits become exhausted, other sources of low
grade ores are becoming more and more important. Most resources required for the
manufacture of electrical and electronic equipment, as well as the generation of
electrical power are non-renewable, e.g. copper, steel, aluminium and other metals,
hence the need to recycle the available resources (Groot & Pistorius, 2008). Some of
the main alternative sources of metals that have been identified include slag, scrap

7
metals and fly ash from smelters (Allimann-Lecourt et al., 2002). Metal
concentrations in process residues (e.g. tailings, slag and fly ash) can exceed metal
concentrations in natural ores and may therefore present opportunities for by-product
recovery. In the USA, the copper, lead, and zinc commodity sectors (i.e. the non-
ferrous industry) generate between 23.3 million and 24 million metric tons per year of
process residues (Berry et al., 2002). The iron and steel industry also produces large
volumes of process residue, mainly in the form of slag. A selected example of the
volume of slag produced annually in New Zealand and Australia from the iron and
steel making industry is shown Table 2-1:
Table 2-1: Total slag production in Australia and New Zealand in the year 2000 (Dippenaar,
2004)
Origin Blast furnace
Air cooled slag Granulated slag
Basic oxygen
furnace
Electric-arc
furnace
Other
Mass Produced (ton)
1050000 700000 800000 155000 360000
% Produced 34 23 26 5 12
Some of the residues which have been found to contain metals that can be recovered
include:
• Dust, fine particles and tailings - these are produced during the beneficiation
of the ore in the processes of grinding, flotation, etc.

8
• Slag waste - smelting of the ores produces two immiscible phases; a heavier
sulphide phase containing the metal being extracted, the matte; and an oxide
phase, the slag. The slag is normally tapped off and dumped, but offers a
viable opportunity for recovering the metal oxides in it.
• Gas cleaning sludge – waste gases from a smelting operation carry with them
fine dust particles which can potentially contain metals. These are collected
during gas cleaning operations (e.g. passing through venturi scrubbers and
hydrocyclones,) as sludge, which can be used as a source of metals for
recovery (Berry et al., 2002).
The compositions of some non-ferrous slags are given in Table 2-2:
Table 2-2: Typical composition of non-ferrous slag (%)
Element Reverberatory
copper slag
Nickel slag Phosphorus
slag
Lead slag Lead-Zinc
slag
SiO2 36.6 29.0 41.3 35.0 17.6
Al3O2 8.1 Trace 8.8 - 6.1
Fe3O2 - 53.06 - - -
CaO 2.0 3.96 44.1 22.2 19.5
MgO - 1.56 - - 1.3
FeO 35.3 - - 28.7 -
K2O - - 1.2 - -

9
As can be seen in Table 2-2 non-ferrous slags provide a potential source of metal
oxides which can be used for the extraction of the metals.
Traditionally, process residue has been used in the construction industry, e.g. in the
manufacture of cement and concrete (Mototsugu et al., 2005), and as insulation
material. The various uses of different process residues in India are shown in
Table 2-3:
Table 2-3: Production and use of industrial slag in India (Rai & Roa, 2005)
Waste Annual production
(millions of tonnes)
Potential uses
Blast furnace slag 11 Portland cement, super sulphated cement,
oil well cement, aggregate, ceramics
Ferro-alloys slag 3.5 Masonry cement, blended cement, ceramics,
aggregate
Fly ash 95 Cement, Portland slag cement, concrete,
cellular concrete, lightweight aggregate,
calcium silicate bricks, clay fly ash bricks
By-product gypsum 4.0 Cement additive, plaster, building-blocks
and fibrous gypsum boards, special cement
Red mud 3.5 Cement raw material, bricks and tiles,
sintered aggregate
Mine tailings (zinc,
copper gold and iron)
17 Filler in concrete, calcium silicate bricks,
cellular concrete, clay bricks and cement

10
The construction industry however, does not consume all the process residues, and
large volumes still remain (Allimann-Lecourt et al., 2002). Different types of process
residues (slags) have different properties which can be used for the construction
industry. Some residues require further processing before they can be used in the
construction industry, e.g. laterite waste, building rubble, steel slag, etc. (Rai and
Rao, 2005).
It is beneficial to use the process residues as raw materials for metal processing since
they can contain higher concentrations of metals than ore bodies, as shown by the
high compositions of Al2O3 and Fe2O3 in Table 2-2. Additionally, using the process
residues as raw materials, also partly solves the disposal problems associated with the
residues, since after processing, lower volumes of residues are left to dispose.
2.2 Treatment of low grade ores
2.2.1 Conventional treatment methods
The processing of non-ferrous metals provides a significant fraction of the metal
processing industry. Conventional methods for the extraction of metals from low
grade sources (sulphides, oxides and slags) follow either a hydrometallurgical or a
pyrometallurgical route (Cox et al., 1985). The approximate total annual production
of major non-ferrous metals in 2007 is shown in the Figure 2-1:
11
Figure 2-1 Annual production of major non-ferrous metals, showing the type of ore mainly used
in the production of the metal (Sahyoun & Mason, 2007)
The first step in the processing of minerals is the liberation of the mineral from the
ore body, which is normally achieved by grinding. Next is the pre-concentrating step,
which produces a higher grade of metal to enter the processing step. Pre-
concentration is achieved by flotation, using appropriate flotation techniques
(Wesley, 1985).
2.2.1.1 Pyrometallurgical treatment
Pyrometallurgical extraction of metals involves subjecting the ore concentrates to
high temperatures, either in a blast furnace or sinter plant (Wesley, 1985). During
12
heat treatment, the ores (sulphide and oxide) are treated under different conditions to
form pure metals. Initially the sulphides are oxidised to pure metals according to the
following reaction
)(2)()(2)( gsgs SOMOMS +→+ (2-1)
In addition to the formation of pure metals, oxides of the metals are also formed.
These are reduced to pure metal by reacting with the coke that acts as the reducing
agent. The following reaction occurs
)(2)()()( 22 gsss COMCMO +→+ (2-2)
2.2.1.2 Hydrometallurgical treatment
Hydrometallurgical treatment of metals is the more commonly used process for the
extraction of metals from their ores. It involves processing the metal ores in
liquid/fluid media. Hydrometallurgy normally involves first dissolving the metals into
solution, achieved by leaching. This is followed by removing the metals from
solution, which can be achieved by electrowinning. Leaching can be grouped into two
main categories:
i. Sulphate based process
These are more widely used because they reduce the corrosion on the
equipment as compared to the other hydrometallurgical processes. In sulphate
13
based processes, the sulphate ion (SO42-) forms a complex with the metal ion
from the ore. The sulphate ion is not a strongly complexing ion, hence it will
selectively complex some metal ions whilst leaving some, which results in the
separation of different metal ions from the ore. The reaction occurring in
leaching using sulphate lixiviant is as follows:
)(2)(4)(42)( aqaqaqs OHMSOSOHMO +→+ (2-3)
The result of reaction of the metal with the acid is the dissolution of the metal
into solution.
ii. Chloride based processes
These either use hydrochloric acid, ferric chloride or brine as lixiviant
depending on the best pH, redox potential or chloride concentration required
for the process (Wesley, 1985). The metals react to form soluble chlorides,
which can then be further processed to produce pure metal. Chloride solutions
are quite corrosive however; they often dissolve the reactor walls of most
metal reactors.
iii. Other leaching processes
Nitric or organic based systems can also be used as lixiviants.
Once the metals have been dissolved into solution, they are removed from solution by
passing an electric current through the solution in the process of electrowinning. The
reactions in electrowinning are:

14
At the anode: )(
2
)( 2 saq MeM →+ −+
(2-4)
At the cathode:
−+ ++→ eHOOH aqg22 )(22
12 )( (2-5)
2.2.2 Problems associated with conventional methods
The conventional methods used for extraction of metal ores have proven to be quite
problematic.
• There are usually a number of complex processes that have to be done before
the final ore is produced, for example, pyrometallurgical treatment is rarely
just one simple step.
• The energy costs of pyrometallurgical processes are very high; the process is
very energy intensive.
• Pyrometallurgical processes usually have waste streams that are harmful to
the environment, e.g. the large volumes of sulphur dioxide gas produced in
smelters. Table 2-4 shows the volumes of sulphur dioxide produced from
2001 to 2005 years by the metal processing industry:

15
Table 2-4: World sulphur production from the metal industry (thousand metric tonnes)
(Sahyoun & Mason, 2007)
2001 2002 2003 2004 2005
Australia 817 899 863 865 950
Canada 1124 1109 992 1089 1057
Chile 1160 1275 1430 1510 1660
China 2000 2200 2400 2600 2800
Finland 227 308 305 301 300
Germany 684 754 701 591 600
India 458 458 539 539 580
Iran 50 50 50 60 60
Italy 203 142 127 113 115
Japan 1319 1326 1281 1263 1330
Kazakhstan 310 260 325 325 325
Korea, Repulic of 665 737 797 796 800
Mexico 572 588 539 703 700
Netherlands 126 124 131 137 135
Poland 227 276 294 290 600
Russia 460 500 520 570 600
South Africa 265 179 174 180 250
Spain 461 544 560 488 475
United States 982 772 683 739 711
Uzbekistan 160 170 170 170 170
Other 1260 1320 1380 1350 1350
Metallurgy Total 13530 13991 14261 14679 15248
Grand Total 61400 62600 64200 66000 66000

16
Table 2-4 shows that the amount of sulphur formed from metallurgical processes has
been increasing steadily over the years. This is despite some decreases in emissions
from some of the countries in line with global agreements for the minimization of
emissions. Additionally, it has been forecasted that the annual sulphur production
will go up if current practices continue to be used without the development of new
processes which minimize the amount of sulphur being released into the atmosphere
(Anthony et al., 2004), as shown in Table 2-5:
Table 2-5: Net sulphur production for production of selected metals, 2005 and 2010
Metal 2005, ktpa S 2010, ktpa S
Copper 6070 7280
Zinc 6090 7000
Lead 550 570
Nickel 180 -300
Others 470 540
Pyrites 4000 4400
TOTAL 17360 19490
• The processes for leaching are very sensitive, requiring fine control to
achieve high rates of leaching.
• In the electrowinning section, hydrogen fumes are normally produced if the
lixiviant contains acid. This makes the process harmful to those working in
the electrowinning section.

17
• Impurities in the lixiviant entering the electrowinning section disrupt the
production of pure metal, resulting in undesirable elements being plated onto
the metal cathode. The process needs proper control for production of pure
metal.
2.2.3 Emerging technologies
Most of the emerging technologies in the processing of sulphide and oxide ores are
aimed at improving the current hydrometallurgical and pyrometallurgical processes.
Some of the improvements made to date include:
• Copper continues to be dominated by hydrometallurgical and
pyrometallurgical techniques. Continued environmental pressures are
ensuring that the pyrometallurgical techniques used are as ‘clean’ as possible.
The same environmental pressures are ensuring that more research into
hydrometallurgical treatment is carried out (Cramer, 2003). In addition prices
for copper are ensuring that optimization of current processes is carried out in
order to lower the production costs of the metal.
• In nickel processing, bacterial leaching is receiving marked interest. BHP-
Billiton has successfully pilot tested a BioNic process that has been designed
for low process temperature mesophilic bacteria, or for high temperature
thermophile bacteria to treat nickel sulphides. However, no commercially
sized operation has been commissioned as yet (Cramer, 2003).
18
• The process of extracting the metals with organic complexing agents, which
will be carried out in this research, is still being studied, with preliminary
work having being carried out in the processing of fly ash using the Servo
process (Allimann-Lecourt et al., 2002), and work having been carried out in
investigating the feasibility of recovery of some metals from their ores in a
fluidized bed reactor (Potgieter et al., 2005).
Despite all the new methods for the processing mentioned above, more still needs to
be done in order to address future needs for cleaner and greener production processes.
2.3 Extraction of metals using ligands
2.3.1 Description of ligands
A ligand is an ion, atom or molecule that donates one of its electron pairs through a
coordinate covalent bond to one or more central atoms or ions to form a larger
complex. These complexes formed, known as co-ordination compounds, arise when a
metal cation is bonded to one or more anions through coordinate covalent bonds
(Siedle, 1987). Ligands have in the past found extensive use in industry, and an
example of this is the use of EDTA (ethylene diamine tetra acetic acid ligand) for the
binding of heavy metals in water purification and in the textile industry (Chaudhary
19
et al., 2000). Other ligands are found as building blocks for catalysts, e.g. diphosphine
ligand (BINAP) is used in the catalytic hydrogenation of rhodium or ruthenium; and also
for the catalytic isomerisation of olefins and allyic alkylation reactions (Pretorius, 2004).
Acetylacetone
The ligand chosen for the extraction of metals in the gas phase from their oxides was
the β-diketone acetylacetone (2-4-pentanedione) which is abbreviated as acacH. β-
diketone ligands are chelating ligands, i.e. they have more than one lone pair of
electrons which they can use for binding with metals. Acetylacetone is an example of
a bidentate (bi-two, dent-teeth) ligand, since it can bond to a metal via both oxygen
atoms. The outer part of the complex formed when the metal and ligand bind consists
of organic groups, making most metal acetylacetonates hydrophobic, and insoluble in
water (Szafran et al., 1991). The potential for use of β-diketones as complexing
agents for the spectrophotometric determination of metallic ions in dilute solution,
and in chromatographic separations has long since been realised by several research
groups (Pettinari et al., 2004). Additionally, complexes formed with β-diketones
have been shown to be highly volatile, forming gaseous complexes at relatively low
temperatures compared to other metal compounds (Seivers & Sadlowski, 1978).
Acetylacetone (acacH) exists as an equilibrium mixture of tautomeric keto and enol
forms. In basic solution, it is deprotonated to the acetyl acetonate anion (acac) as
shown in Figure 2-2 (Seco, 1989):

20
Figure 2-2 The inter-conversion between the keto and enolic form of the acac anion
Under appropriate conditions the enolic hydrogen atom of the acetylacetone may be
replaced by a metal cation to produce a six membered metallocycle, thereby shifting
the keto–enol equilibrium in favour of the chelated enolate anion form in metal
acetylacetonate complexes (Bai et al., 2007).
The reaction which occurs when the ligand acac reacts with a metal oxide is of the
form
2 22 2 ( )n nM O nHacac M acac nH O+ → + (2-6)
where
M is the metal to be extracted
21
2.3.2 Previous work involving the use of ligands for metal
extraction
The use of ligands for extraction has found widespread application. Ligands have
been used to selectively extract organic bonded metals in soils (Hamblin & Posner,
1979). Ligands have been used in solvent extraction for the removal of metals from
solution (Kondo et al, 1978; Moffett & Zika, 1987). Several researchers have used
ligands to extract metals from both the solid phase (Kersch et al., 2000; Ozel et al.,
2000; Takeshita et al., 2000) and the liquid phase(Galand & Wipff, 2005) using
supercritical fluid extraction (SFE) with CO2 as the fluid. Ligand extraction has also
been carried out in the gas phase to extract metals from solid residues including fly
ash (Allimann-Lecourt et al., 1999; Allimann-Lecourt et al., 2002; Cox et al., 1985;
Potgieter et al., 2005).
2.3.2.1 Solvent extraction using organic ligands
Solvent extraction of metals from industrial effluent has been carried out by
sequestering the metals using organic compounds which form complexes with the
metals forming a separate phase from the rest of the industrial waste (Chaudhary et
al., 2000). Moffett & Zika (1987) have demonstrated the use of acetylacetone for
ligand exchange/solvent extraction resulting in the formation of Cu(II) complexes
with acetylacetone in the presence of competing natural chelators. In some cases, the

22
solvent extraction of metals can also be coupled with the use of appropriate liquid
surfactant membranes as shown by Kondo et al. (1978).
2.3.2.2 Supercritical fluid extraction using organic ligands
In SFE, the ligand mixed with the supercritical fluid (CO2) has been extensively used
for most extractions because it dissolves in the fluid. The mixture of the supercritical
fluid and the ligand easily diffuses through the sample to be extracted; and the metal
complex formed is carried away in the supercritical fluid since most complexes
formed dissolve in the supercritical fluid. SFE-CO2 with acac and hfacac has been
successfully used to extract cobalt from a model matrix (Burford et al., 1999). Galand
and Wipff (2005) have studied the effect of β-diketone ligand fluorination on the
SFE-CO2 extraction of uranyl and they have also shown that SFE-CO2 can be used
for the complixation of Fe3+. Takeshita et al. (2000) have also shown that acac SFE-
CO2 can be used to extract Cu from contaminated wood.
The solubilites of complexes in supercritical CO2 have been studied for different
ligands by, amongst others, Aschenbrenner et al. (2007) and Cross & Akgerman
(1996). Ozel et al. (2000) have also studied the extraction, solubility and stability of
metal complexes in SFE-CO2.
23
2.3.2.3 Gas phase extraction using organic ligands
Extraction and recovery using volatile organic compounds is an emerging technology
developed during the 1970s. The process extracts heavy metal contaminants from
matrices such as low grade ore, soil, sediment, used catalysts, or industrial wastes; by
using volatile organic reagents which pass through the heated feed material and reacts
selectively with the metal to be extracted (Cox et al., 1985; Allimann-Lecourt et al.,
1999). Products of the reaction are volatile metal complexes which can be removed
from the residual solids by a carrier gas. These complexes can then be reduced in the
vapor phase to produce a metal product and regenerate the organic reagent for
recycling; or treated by dilute mineral acid to decompose the complex and following
separation of the liquid phase both the metal and organic extractant can be recovered
by appropriate techniques (Allimann-Lecourt et al., 2002).
The organic compounds that are used for gas phase extraction are those that form
compounds that generally exhibit high volatility. β-diketones and their derivates
(fluorinated derivatives) are typical examples of such compounds. Allimann-Lecourt
et al. (1999, 2002) have used β-diketones, β-diketodiimines and tetra-iso-
propyldithiophosphoramides to successfully extract metals from the oxide phase of
metals in fly ash and from different sediments. They have shown that by changing the
source of a ligand used one can selectively extract some metals whilst others remain
in the solid matrix. This selectivity of the ligand has also been shown by Cox et al.
(1985) who have shown that it is possible to extract copper, but not iron, using

24
different derivatives of β-diketodimines. Potgieter et al. (2005) have used acac to
extract metals from the oxides of iron, chromium, aluminium and vanadium.
The process flow sheet for the gas phase extraction of metals that has been proposed
by Potgieter et al. (2005) and Allimann-Lecourt et al. (2002) is shown in Figure 2-3
Figure 2-3 Process flow sheet for the gas phase extraction of solid residues

25
Although the possibility of extracting metals in the gas phase from different solid
matrices has been demonstrated by different research groups, most of the work
published just shows that the process is feasible. No work to date has been published
that investigates how different variables affect the extraction process.
2.3.3 Recovery of the ligands
Once the volatile metal complexes are formed, it is possible to separate the metal
from the ligand with subsequent recovery of the ligands. For a well designed process
it is therefore theoretically possible to recycle the ligand back to the extraction
process. The following processes have been proposed as potential ways of separating
the metal from the ligand and for recycling purposes.
2.3.3.1 Recovery by hydrogen reduction
Production of pure metal by precipitation from a loaded chelating agent has been
investigated as a way of separating metal from ligands. Demopoulos and Distin
(1985) have investigated the possibility of separating a chelate loaded with copper by
direct reduction with hydrogen in an autoclave. The desired metal is loaded
conventionally and instead of acid stripping followed by metal recovery (e.g.
electrowinning), the metal is precipitated in a powder form from the organic solvent
by the action of hydrogen under pressure while the original organic is regenerated
(Cox, 1985).

26
Successful application of pressure hydrogen stripping has been shown to depend on
the following conditions being satisfied:
i. Ability to recycle the stripped organic
ii. Reproducible stripping rates with acceptable kinetics.
iii. Production of metal free of organic contamination, and in powder rather than
plated form.
2.3.3.2 Recovery by reacting with mineral acid
In organic systems, the regeneration of extractants requires an acidic aqueous strip
phase. This strip phase de-complexes the metal–extractant complex by:
1. Regeneration (reprotonation) of the extractant and
2. Dissolution of the metal cation in the acid (Kersch et al., 2005).
The regeneration of the ligand is possible if the ligand has a high acid dissociation
constant (pKa) that promotes the formation of a neutral complex HX and reduces
consumption of a regeneration acid. Kersch et al. (2005) used a packed counter-
current column to recover metal and regenerate ligand from an organo-metallic
complex. Metal recovery of Cu, Zn, Ni, and Co from supercritical CO2 into nitric acid
was achieved by decomplexation from both a β-diketone (acetylacetone) compound
and an organophosphorus compound (Cyanex 272). In another report the regeneration
of hfacac from Cu(hfacac)2 via ligand protonation with concentrated H2SO4 was
27
described, with a ligand recovery yield of 89% of the theoretical value. The purity of
the recovered ligand was determined to be 99.98% by GC assay.
2.3.3.3 Recovery by electrochemical separation
This process has been carried out in a photolytic cell for the recovery of copper from
copper ethylenediaminetetra-acetic acid (EDTA) in effluent industrial waste
(Chaudhary et al., 2000). In this process, copper is recovered at the cathode whilst the
ligand is destroyed at the anode.
2.3.4 Uses of the metal complexes
Although it is possible to separate the metal complexes and recover the ligand and
metal in pure form, metal acetylacetonates are valuable in themselves. Metal
acetylacetonates are highly efficient catalysts for a wide variety of organic
transformations, e.g. oligomerization, polymerization, hydrogenation, isomerisation,
couplings etc. They are also used in rubber technology for vulcanization, for
extraction and separation of metals, as NMR shift reagents, in microelectronic
devices, for synthesis of high quality semiconductor materials for optoelectronic
devices, for separation of enantiomers, as a source of metal or metal oxides for
controlled deposition, as fungicides, in pigments as colour stabilizers, as carbon

28
scavengers for diesel fuels, as combustion control catalysts for rocket fuels, and in
laser technology.
Metal acetylacetonates have also been used in the production of transition metal
oxide nanoparticles, which themselves are used as catalysts (Willis et al., 2007). The
production of metal oxides from their acetylacetonates occurs by chemical vapour
deposition (CVD) where the complexes act as the precursors, and has been
demonstrated for the acac complexes of Fe3+, Al3+, Cr3+, Mn3+ and Ni2+ (Pal &
Sharon, 2000; Siddiqi et al., 2007). The oxides produced by CVD have been found
to be of high purity, hence the process of gas phase extraction can be an advantageous
way for the production of pure metal oxides, since it will extract the metals from
sources with a low purity (as low as 1% content used in this study). The complexes
thus produced could be used in the production of pure metal oxides (>99%).
2.4 Fluidization
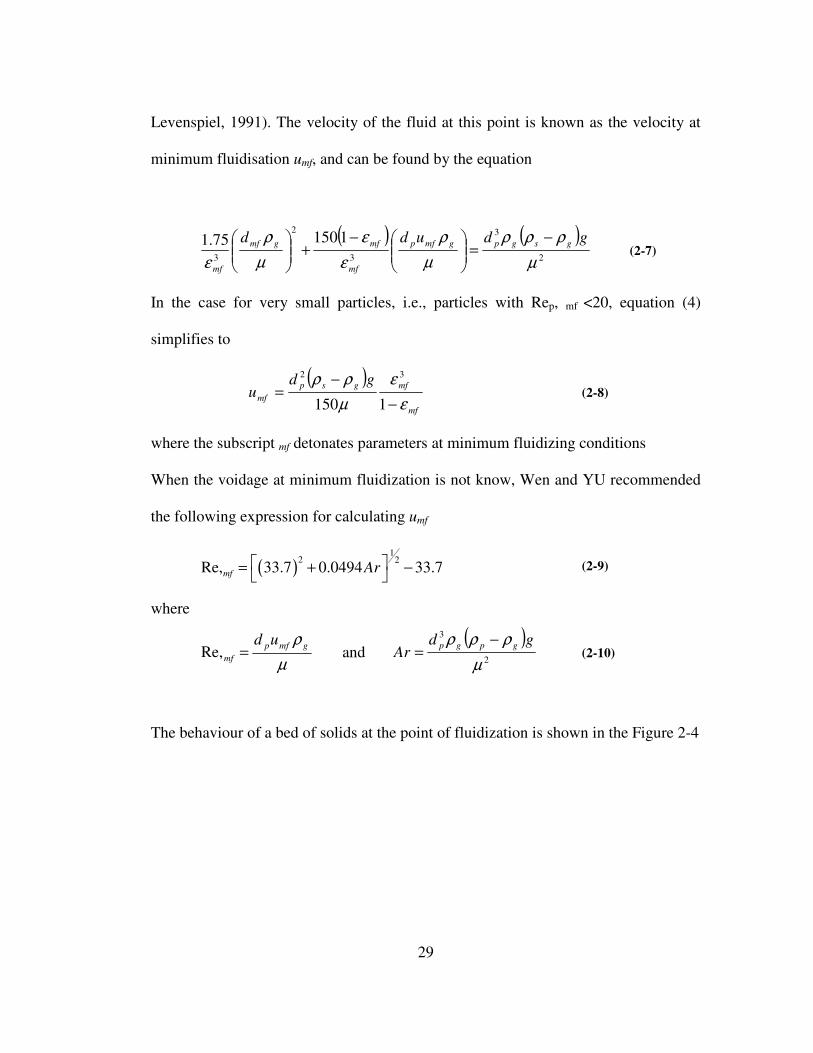
2.4.1 Fluidization theory
If a fluid is passed through a bed of fine particles it percolates through the void spaces
of the stationary particles. As the velocity of the gas is increased, a point is reached
where the particles are suspended by the up-flowing fluid. The bed is considered to be
just fluidized and is referred to as a bed at minimum fluidization (Kunii and
29
Levenspiel, 1991). The velocity of the fluid at this point is known as the velocity at
minimum fluidisation umf, and can be found by the equation
( ) ( )
2
3
3
2
3
115075.1
µ
ρρρ
µ
ρ
ε
ε
µ
ρ
ε
gdudd gsgpgmfp
mf
mfgmf
mf
−=
−+
(2-7)
In the case for very small particles, i.e., particles with Rep, mf <20, equation (4)
simplifies to
( )
mf
mfgsp
mf
gdu
ε
ε
µ
ρρ
−
−=
1150
32
(2-8)
where the subscript mf detonates parameters at minimum fluidizing conditions
When the voidage at minimum fluidization is not know, Wen and YU recommended
the following expression for calculating umf
( )1
2 2Re, 33.7 0.0494 33.7mf Ar = + −
(2-9)
where
µ
ρ gmfp
mf
ud=Re, and
( )2
3
µ
ρρρ gdAr
gpgp −= (2-10)
The behaviour of a bed of solids at the point of fluidization is shown in the Figure 2-4

30
Figure 2-4 Behaviour of a packed before and at minimum fluidization velocity
Above the minimum fluidization velocity the particles are touching each other most
of the time, but the inter-particle friction is so small in non-cohesive particles that the
fluid/solid assembly behaves like a liquid having a density equal to the bulk density
of the powder (Geldart, 1986).
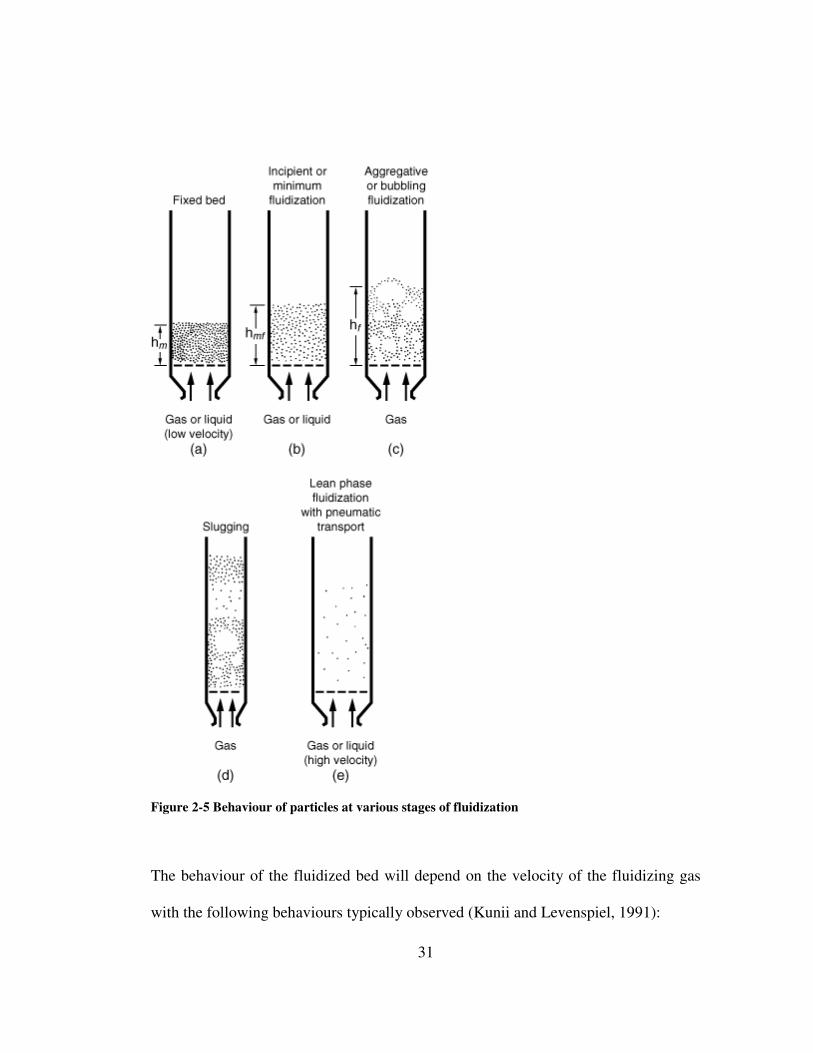
Types of fluidization behaviours
Figure 2-5 shows the behaviour of particles as a packed bed, at minimum fluidization,
and at velocities above minimum fluidization velocity. For gas-solid systems, an
increase in gas flow rate beyond umf results in large instabilities in the bed with
channelling being observed.
31
Figure 2-5 Behaviour of particles at various stages of fluidization
The behaviour of the fluidized bed will depend on the velocity of the fluidizing gas
with the following behaviours typically observed (Kunii and Levenspiel, 1991):

32
� Aggregate fluidized bed – which is characterised by violent movement of the
solids within the bed. The bed does not expand much beyond its volume at
minimum fluidization.
� Slugging fluidized bed – which is normally encountered in long narrow
fluidized beds. In this case as the gas bubbles rise up through the bed they
coalesce and grow; and may become large enough to spread across the
whole bed. As the gas rises, the solid particles, in the case of fine particles,
will flow smoothly down the walls of the fluidized bed around the void of
rising gas.
� Turbulent fluidized bed – which occurs when the terminal velocity of the
solids is exceeded. The upper surface of the bed disappears, with some of the
solid particles being entrained. Instead of bubbles in the bed, there are solid
clusters and voids of gas of differing size and shape.
� Lean phase fluidization – in which the velocity of the gas is so high that
solids are carried out of the bed together with the gas. This is the range of
operation that is carried out in the pneumatic transportation of solids.
Gas velocity is not the only parameter that influences fluidization. Additionally,
fluidization will be influenced by the particle size of the solids being fluidized. This
is because particle size and superficial gas velocity together determine the major
hydrodynamic characteristics of fluidized beds. Geldart came up with four

33
recognisable types of particle behaviour by observing the fluidization of different
sizes and types of particles (Kunii and Levenspiel, 1991). Geldart has grouped the
particles from the smallest particles in diameter to the largest diameters. This
grouping of particles is shown in Figure 2-6.
Figure 2-6 Geldart’s fluidization classification of powders (Geldart, 1986)
Geldart (1986) has observed the following characteristics for the particles:
1. Group C – these comprise very fine cohesive powders which are difficult to
fluidize. They are cohesive because the interparticle forces (van der Waals)
are larger than the gravitational forces, causing the particles to be attracted to
each other and to clump together (Knowlton, 2002). Such particles rise as a
plug of solids, and in larger beds channels of gas form through the particles.

34
Group C particles generally have a particle diameter less than 30µm. Typical
solids in this group include flour, starch and face powder.
2. Group A – these comprise particles having small mean particle size (typically
30µm-100µm) and/or low particle density which are aeratable. Inter-particle
forces in these particles are not as large as those for Group C particles, and
these particles fluidize well. On fluidization these particles give a region of
non-bubbling fluidization at umf, followed by bubbling fluidization as the
velocity of the gas is increased. Examples in this group include FCC catalyst.
3. Group B – these particles comprise particles in the range 100µm<dp<1000µm
and density 1.4<ρs <4.5g/cm3. These solids easily fluidize with vigorous
bubbling action and bubbles that grow large. Examples include sand and table
salt.
4. Group D - these comprise large and/or dense particles. Deep beds of these
particles are difficult to fluidize, producing large exploding bubbles, or severe
channelling. Sprouting may also result if gas is not evenly distributed.
Examples include grain, coffee beans, gasifying coals and some metal
roasting ores.
2.4.2 Advantages and disadvantages of fluidized bed reactors
Fluidized bed reactors have been used because they offer the following advantages:

35
• Uniform Particle Mixing: Due to the intrinsic fluid-like behaviour of the
solid material, fluidized beds do not experience poor mixing as in packed
beds. This complete mixing allows for a uniform product that can often be
hard to achieve in other reactor designs.
• Uniform Temperature Gradients: Many chemical reactions produce or
require the addition of heat. Local hot or cold spots within the reaction bed,
often a problem in packed beds, are avoided in a fluidized situation such as a
FBR. Because of the uniform temperature gradients in a FBR, the system
reacts slowly to abrupt changes in operating conditions, giving a large margin
of safety in avoiding temperature runaways for highly exothermic reactions
(Grace, 1986).
• Ability to Operate Reactor in Continuous State: The fluidized bed nature
of these reactors allows for the ability to continuously withdraw product and
introduce new reactants into the reaction vessel (Kunii and Levenspiel, 1991).
• Rate of heat transfer between a fluidized bed and an immersed object is
high: This then means that the heat exchangers within a fluidized bed require
relatively small surface areas (Grace, 1986).
Despite all these advantages, the fluidized bed reactor has some disadvantages which
include:
• Backmixing of both solids and gases: This leads to non-uniform residence
time in the reactor, and for continuous treatment of solids leads to non-
36
uniform product and lower conversions as compared to other types of reactors
(Grace, 1986; Kunii and Levenspiel, 1985).
• Pumping Requirements and Pressure Drop: The requirement for the fluid
to suspend the solid material necessitates that a high fluid velocity is attained
in the reactor. In order to achieve this, more pumping power and thus higher
energy costs are incurred. In addition, the pressure drop associated with deep
beds also requires additional pumping power.
• Particle Entrainment: The high gas velocities present in this style of reactor
often result in fine particles becoming entrained in the fluid. These captured
particles are then carried out of the reactor with the fluid, where they must be
separated. This can be a very difficult and expensive problem to address
depending on the design and function of the reactor. This may often continue
to be a problem even with other entrainment reducing technologies (Grace,
1986).
• Erosion of Internal Components: The fluid-like behaviour of the fine solid
particles within the bed eventually results in the wear of the reactor vessel.
This can require expensive maintenance and upkeep for the reaction vessel
and pipes (Grace, 1986; Kunii and Levenspiel, 1985).
Despite the disadvantages listed above, the compelling advantage of overall economy
of fluidized contacting has been responsible for its successful use in industrial
operations (Kunii and Levenspiel, 1991). Additionally, some of the limitations can be
overcome by modification in design of the fluidized bed reactor, e.g., backmixing of

37
solids can be reduced by using stages of fluidized bed reactors in series (Grace,
1986).
2.4.3 Industrial applications of fluidized bed reactors
2.4.3.1 Early uses of fluidized bed reactors
One of the pioneer uses of the fluidized bed reactor was for coal gasification in the
Winkler coal gasifier in 1926(Kunii and Levenspiel, 1991). The fluidized bed reactor
was also used as a catalytic cracking unit to separate oil fractions in the petroleum
industry. In the 1940s, the fluidized bed reactor was used in the Fischer-Tropsch
reaction to produce high grade gasoline from natural gas but it was discontinued in
1957 due to rising natural gas costs and low conversion rates in the reactor. The
fluidized bed reactor also found numerous uses in catalytic synthesis reactions due to
the temperature uniformity in the reactors. Fluidization has also been used in fields
outside the petrochemical industry, e.g. for the roasting of sulphide ores in the
FluoSolids system; and in other roasters based on the Winkler gas producer.
2.4.3.2 Physical applications of the fluidization process
The physical characteristics of the fluidization process have been exploited in
industry. The following properties of the fluidization process have been used:
38
• Heat exchange – because fluidized beds can rapidly transport heat and
maintain a uniform temperature, they have been use as heat exchangers.
• Drying of solids – a fluidized bed reactor is used where a wet solid is
contacted with and fluidized using hot gas, thereby drying the solid.
• Coating of objects – a fluidized bed reactor has been used for coating metals
with plastic, where the metals at a temperature above the melting point of the
plastic is contacted with fine particles fluidized in air. On contact, the plastic
melts and fuses with the metal. Fluidization has also been used to grow
particles in size.
• Adsorption – multistage fluidized beds have been used to adsorb dilute
components from carrier gas. Adsorption in fluidized reactors has been carried
out for removal of trace pollutants, e.g., methylene chloride, ethyl acetate and
acetone from flue gas.
2.4.3.3 Synthesis reactions of fluidized bed reactors
Fluidized bed reactors have been used in synthesis reactions involving catalysts.
Fluidized bed reactors have been preferred over fixed bed reactors because of the
need for strict temperature control in catalytic reactions. Catalytic reactions often
need strict temperature control for some catalysts because products are very sensitive
to fluctuations in temperature or the catalyst might deteriorate if there is no strict

39
temperature control and hot spots develop during the processing. Synthetic reactions
which have used fluidized bed reactors include the Fischer-Tropsch synthesis of
hydrocarbons, and polymerization of olefins.
2.4.3.4 Use of the fluidized bed reactor in hydrocarbon cracking
The catalytic cracking of hydrocarbons is an endothermic process. Fluid catalytic
cracking (FCC) reactors have been designed, where the catalyst regeneration step
supplies the heat required for the cracking of the hydrocarbons into smaller fractions.
These reactors are two unit reactors: in the 1st reactor vaporized petroleum feed
cracks on contact with hot catalyst, after which the compounds formed are
transported to a regenerator where the carbon deposit on the catalyst is reduced by
burning in air. The heated particles, i.e. the catalyst, are returned to the 1st reactor.
Other processes which also separate fractions include the fluid coking and flexi-
coking processes (separate gas oil from coke particles), and the thermal cracking
processes (separate petroleum fraction to produce ethylene and propylene).
2.4.3.5 Use of the fluidized bed reactor in combustion and
incineration
Fluidized bed combustion (FBC) was first researched in the early 1960s in an effort
to find a combustion process suitable for low grade coal and oil shale fines. In the

40
FBC, limestone or dolomite particles are fluidized by air, and then small coal
particles are injected into the bed.
A fluidized bed reactor was therefore chosen as the reactor for gas phase extraction of
metals because of the advantages offered in the discussion above. Use of a fluidized
bed reactor ensures that temperature gradients are minimized and that adequate
particle mixing to ensure reaction with the ligand is achieved.

41
3 EXPERIMENTAL PROCEDURE
The process of extraction of metals from their oxides by acetylacetone was carried
out in a fluidized bed reactor. The oxides used were iron(III) oxide and chromium(III)
oxide. The parameters which were investigated for their effect on the rate of the
reaction are:
• Concentration of the metal oxide in the fluidized bed - The concentrations
used where chosen to represent concentrations found in different types of low
grade ores. Variations of low, medium and high concentrations were used.
• Effect of bed temperature in the fluidized bed reactor on the extraction of
metals by acetylacetone - This involved varying the operating temperature
from 190˚C to 250˚C.
• Effect of concentration of the acetylacetone – The concentration was varied at
low and medium flow rates (1ml/min and 3ml/min respectively) for the
experiments where high and medium metal oxide concentration was used.
• Effect of time on the reaction - This involved, for each of the different
temperatures, collecting and analyzing the product formed at 15-30 minute
intervals for up to 4 hours of reaction. This was to allow for sufficient time for
the reaction.
The experimental setup was therefore designed to achieve the requirements of the
experimental objectives mentioned above.
42
3.1 Experimental setup
3.1.1 Process flow chart
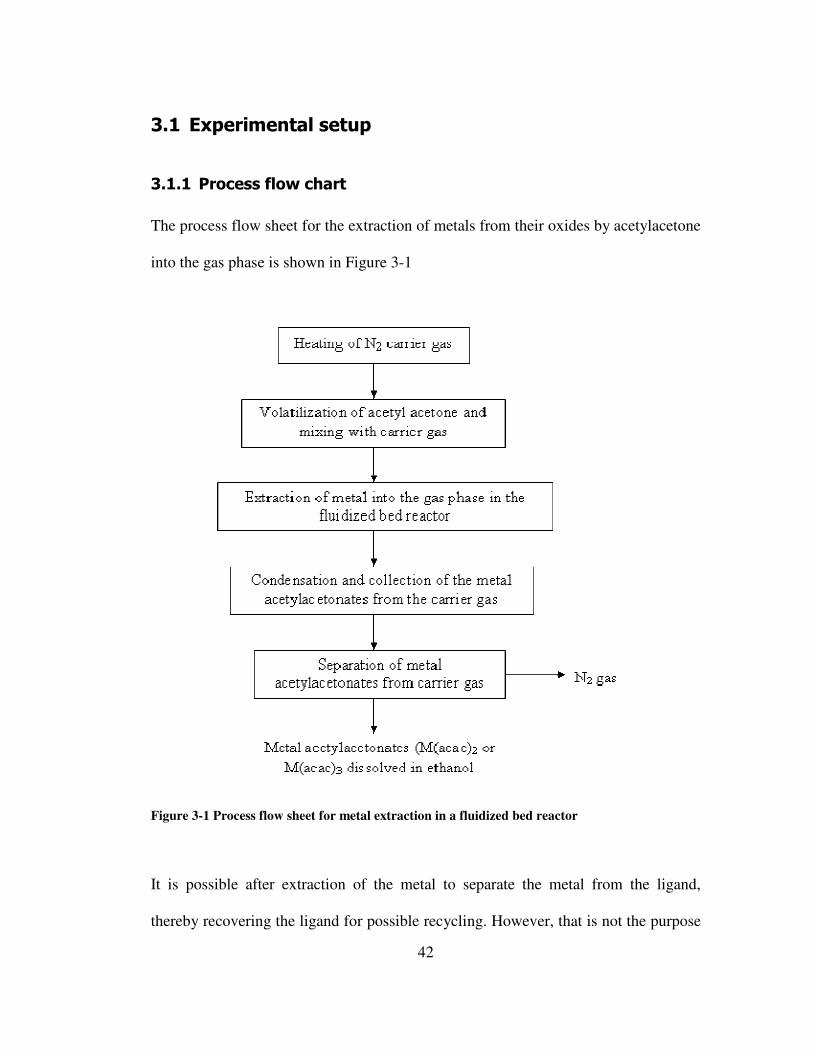
The process flow sheet for the extraction of metals from their oxides by acetylacetone
into the gas phase is shown in Figure 3-1
Figure 3-1 Process flow sheet for metal extraction in a fluidized bed reactor
It is possible after extraction of the metal to separate the metal from the ligand,
thereby recovering the ligand for possible recycling. However, that is not the purpose
43
of the present research and consequently the metal acetylacetonate is recovered for
analysis. Additionally, the use of a carrier gas is optional, since at the temperatures
used for gas phase extraction both the ligand and metal complex formed are gasified.
3.1.2 Apparatus
The process of gas phase extraction was carried out in a fluidized bed reactor (FBR).
The fluidized bed reactor consisted of a cylindrical Pyrex glass column 50 mm long
and 15 mm in diameter which is tapered at both of its ends. Midway along the length
of the FBR a thermocouple was inserted into the FBR, whose function was to
measure the temperature in the FBR during the course of the gas phase extraction.
Heating tape was coiled around the length of the FBR and connected to a temperature
controller. This controller, together with the thermocouple in the FBR, kept the
temperature close to the set point by regulating the amount of heat provided by the
heating tape. The FBR and heating tape were wrapped with ceramic wool which
served as an insulator and minimized heat loss. The fluidized bed was connected to a
round bottomed flask through its bottom taper, through which the ligand and carrier
gas were fed to the bed. The round bottomed flask was heated by sitting it on a
heating mantle which provided the heat to vaporize the ligand. The list of major
equipment used is as follows:
• Two N2 gas flow meters; gas flow range 0-50 ml
• Heating mantle to heat the acetylacetone to above 140°C i.e. its boiling
point
44
• 1/8 inch stainless steel tubing, through which N2 passes to the flask
containing the ligand
• Type K thermocouples, used to measure the temperature in the heating
mantle and in the fluidized bed reactor.
• Temperature readout to record the temperature from the thermocouples (in
the round bottomed flask)
• Temperature controller to regulate the temperature along in the fluidized
bed
• Flow control valves including an open/close valve, a three way ball valve
and a check valve to control direction of gas flow.
• Pressure regulator to regulate the pressure of the N2 carrier gas as it leaves
the gas cylinder.
• Peristaltic pump to control the flow rate of the ligand into the flask.
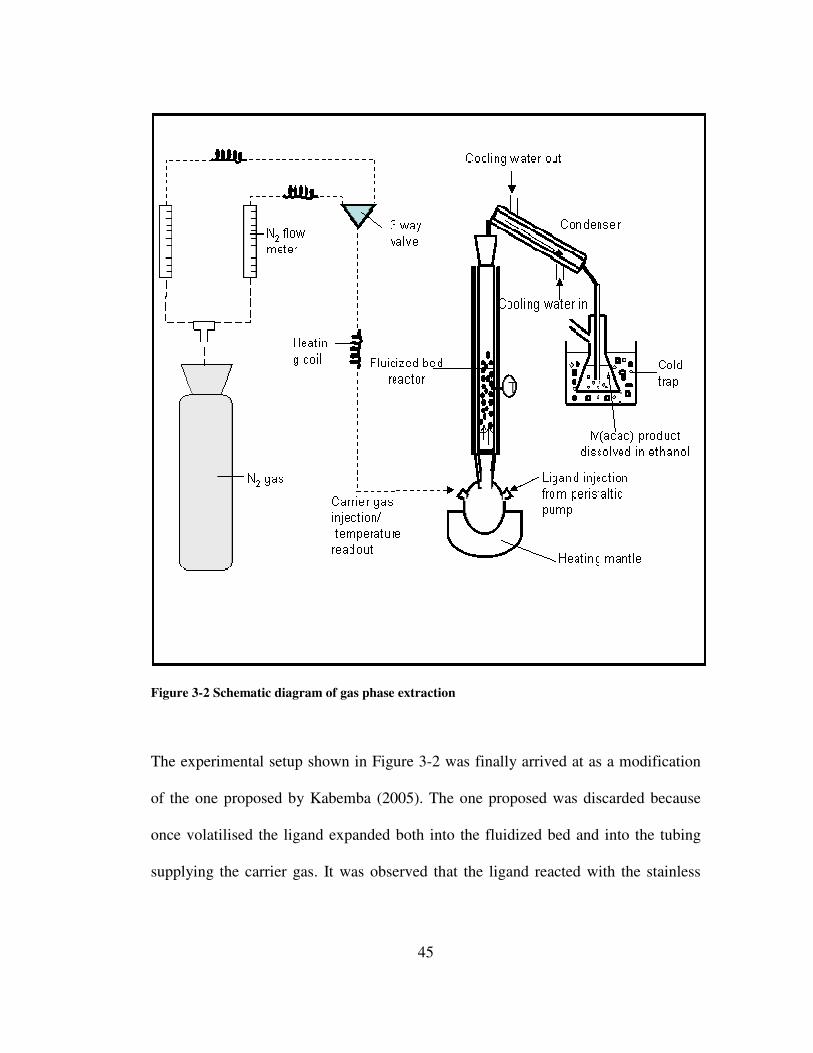
The general schematic diagram of the apparatus is shown in Figure 3-2:
45
Figure 3-2 Schematic diagram of gas phase extraction
The experimental setup shown in Figure 3-2 was finally arrived at as a modification
of the one proposed by Kabemba (2005). The one proposed was discarded because
once volatilised the ligand expanded both into the fluidized bed and into the tubing
supplying the carrier gas. It was observed that the ligand reacted with the stainless
46
steel tubing. As a result the setup finally used in this work comprised of only glass
and silicon tubing which are both inert to the ligand.
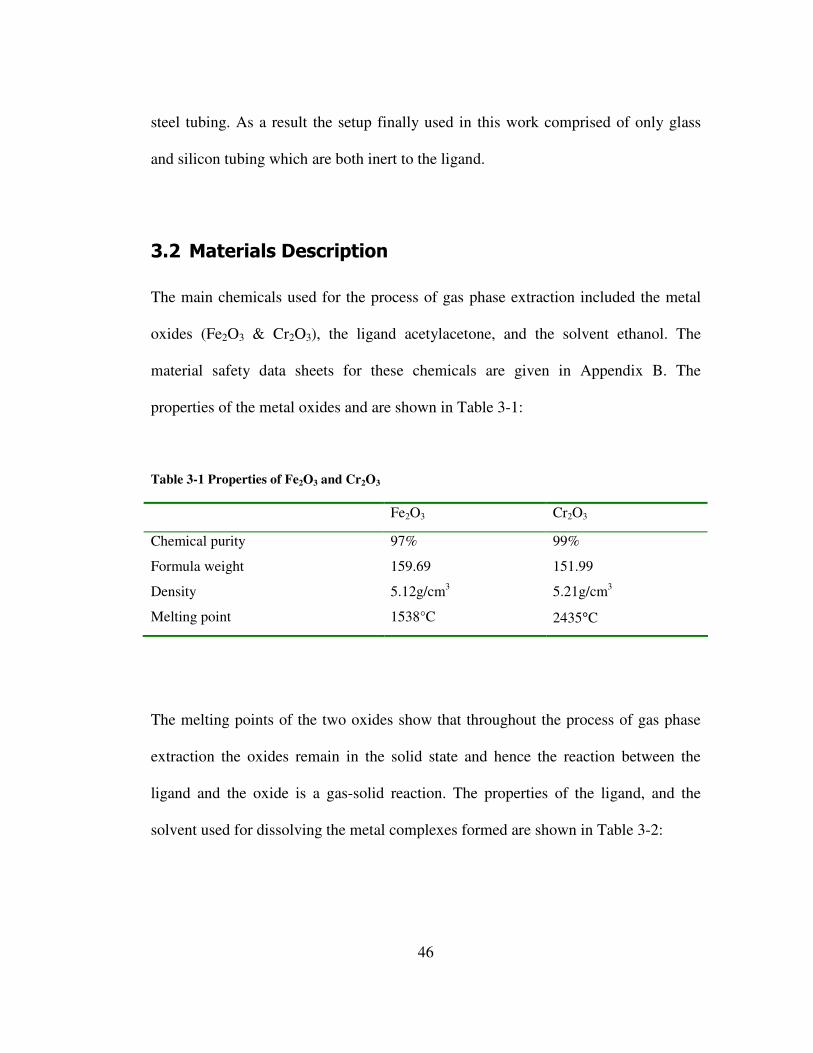
3.2 Materials Description
The main chemicals used for the process of gas phase extraction included the metal
oxides (Fe2O3 & Cr2O3), the ligand acetylacetone, and the solvent ethanol. The
material safety data sheets for these chemicals are given in Appendix B. The
properties of the metal oxides and are shown in Table 3-1:
Table 3-1 Properties of Fe2O3 and Cr2O3
Fe2O3 Cr2O3
Chemical purity 97% 99%
Formula weight 159.69 151.99
Density 5.12g/cm3 5.21g/cm3
Melting point 1538°C 2435°C
The melting points of the two oxides show that throughout the process of gas phase
extraction the oxides remain in the solid state and hence the reaction between the
ligand and the oxide is a gas-solid reaction. The properties of the ligand, and the
solvent used for dissolving the metal complexes formed are shown in Table 3-2:

47
Table 3-2 Properties of acetylacetone and ethanol
Acetylacetone Ethanol
Chemical formula C5H8O2 C2H6O
Purity 99% 99.8%
Boiling point 136-138°C 78-80°C
Vapour pressure(20°C) 800Pa 5950Pa
To simulate low grade ores and slags the metal oxides were mixed together with
sand. The composition of the sand is shown in Table 3-3:
Table 3-3 Composition of the silica sand used
% Composition
SiO2 98.01
Al2O3 0.3
Fe2O3 0.6
ZnO 0.001
CaO <0.01
MgO <0.001
L.I.O 0.12
Average Uniformity coefficient <1.4
Friability <0.7°

48
3.3 Experimental design
The reaction of the metal oxide with the ligand is a gas-solid reaction and it is
assumed that the reaction is either limited by the diffusion of the gas through the film
surrounding the solid particle or the chemical reaction between the solid particle and
the ligand. To test which of the resistances limit the reaction, different experimental
conditions have to be used in order to limit the effect of the various resistances.
3.3.1 Gas film diffusion controlling
Gas film control can be checked by reacting similarly sized particles using different
gas velocities because the mass transfer coefficient in a reaction is dependent on the
linear velocity of the gas passing the particle (Szekely et al., 1976). If similarly sized
particles are reacted at the same temperature at different gas velocities and it is
noticed that the extent of reaction is different for the different gas velocities, the
reaction is influenced by diffusion of the gas through the gas film surrounding the
particle. Once it has been established that a reaction is mass transfer controlled, mass
transfer effects can be minimized by operating the gas-solid reaction system at
sufficiently high gas velocities, so that any further increase in the gas velocity does
not produce an increase in the overall reaction rate (Szekely et al., 1976). This will
then enable one to check if there are other resistances which limit the rate of the
reaction.

49
3.3.2 Chemical reaction control
Chemical reaction control can be checked by the determination of the kinetic
parameters for the chemical reaction. Kinetic parameters cannot be predicted or
estimated, they can only be determined experimentally. Kinetic parameters can be
measured by carrying out experiments under otherwise fixed conditions with small
but varying particle size of the oxide, i.e. at fixed gas velocities and temperatures so
that the effect of gas film diffusion control are minimized. This will enable one to
calculate the value of the rate constant k (Szekely et al., 1976). Conducting similar
experiments at different temperatures can be used to calculate the activation energy
associated with that rate constant.
3.4 Experimental method
1. The fluidized bed reactor was charged with the feed, which consisted of a
mixture of sand and metal oxide. In all cases the total mass charged was 50g;
with the metal oxide concentration varying at 1wt%, 3wt% and 10wt%.
2. Once the FBR was charged all the equipment was connected and the FBR
preheated to the required reaction temperature, i.e. 190°C, 210°C, 230°C and
250°C for the different experimental runs. The heating mantle was also
switched on.
3. Once the required set temperature in the FBR was reached, the reaction was
started by switching on the pump and pumping the ligand into the heating
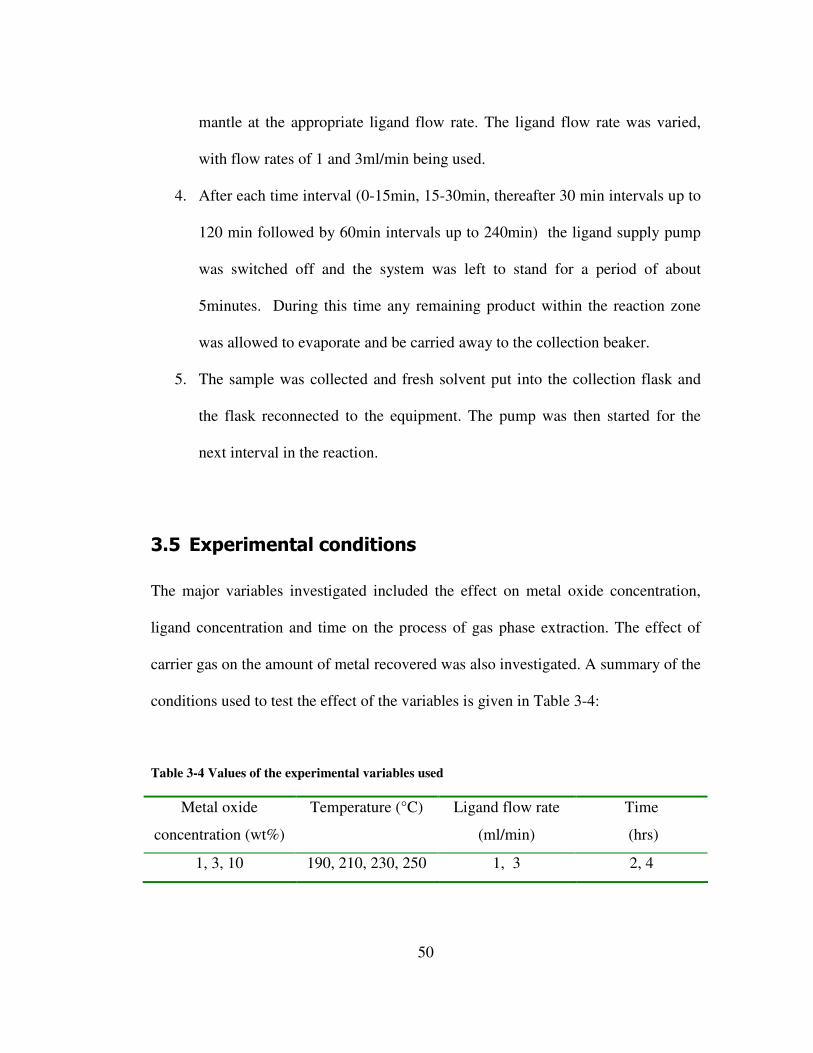
50
mantle at the appropriate ligand flow rate. The ligand flow rate was varied,
with flow rates of 1 and 3ml/min being used.
4. After each time interval (0-15min, 15-30min, thereafter 30 min intervals up to
120 min followed by 60min intervals up to 240min) the ligand supply pump
was switched off and the system was left to stand for a period of about
5minutes. During this time any remaining product within the reaction zone
was allowed to evaporate and be carried away to the collection beaker.
5. The sample was collected and fresh solvent put into the collection flask and
the flask reconnected to the equipment. The pump was then started for the
next interval in the reaction.
3.5 Experimental conditions
The major variables investigated included the effect on metal oxide concentration,
ligand concentration and time on the process of gas phase extraction. The effect of
carrier gas on the amount of metal recovered was also investigated. A summary of the
conditions used to test the effect of the variables is given in Table 3-4:
Table 3-4 Values of the experimental variables used
Metal oxide
concentration (wt%)
Temperature (°C) Ligand flow rate
(ml/min)
Time
(hrs)
1, 3, 10 190, 210, 230, 250 1, 3 2, 4

51
3.6 Analysis of the product
The previous groups that have studied extraction in the gas phase have analysed their
samples using UV spectrometry (Allimann-Lecourt et al., (2002); Potgieter et al.,
(2005)). Initially both UV and AAS were used, but AAS was finally chosen as the
best analytic technique because it has now become one of the most efficient and
sensitive approaches to determining metals in organometallic compounds (Hassan,
1984).
3.6.1 Atomic Absorption Spectrometry
Atomic Absorption Spectrometry is the measurement of the absorption of optical
radiation by atoms in the gas phase (Welz, 1984). AAS is a flame method of analysis
which uses flames to convert samples and standards into appropriate media which can
produce measurable absorption i.e. the active entities (Ramirez-Munoz, 1969). The
entities then absorb radiation at characteristic wavelengths, whose intensity can be
related to the concentration of the absorbing entities.
The source of radiation in AAS is provided by a hollow cathode lamp, whose cathode
is either made up of the analyte metal, or filled with it; whilst the anode is either
tungsten or nickel (Welz, 1984). The hollow lamp also contains pressured inert gas
(carrier gas) which generates positive ions that release atoms of the cathode on
collision. Once the atoms from the cathode meet with the excited noble gas their
spectral lines are radiated.
52
The emission spectrum from the radiation source is then passed through an absorption
cell where a portion of the radiation is absorbed by the atoms from the sample whose
concentration is to be determined. The atoms are produced by spraying the sample
into the flame by means of a pneumatic nebulizer (Welz, 1985; Ramirez-Munoz,
1969). The nebulizer produces a stable time-dependent signal whose height is
proportional to the concentration of the analyte material.
After analysis and collection of the experimental data the results were analyzed. The
results and discussion of results follow in the next chapter.
53
4 RESULTS AND DISCUSSIONS
Gas phase extraction was carried out on two different metal oxides, iron(III) oxide
and chromium(III) oxide. Iron(III) oxide was chosen partly because it is known that it
readily reacts with acetylacetone (Cox, 1985), and because there is a large volume of
waste (slag, tailings, etc) that contains iron oxides. Chromium(III) was chosen
because it has the same oxidation state as iron(III) oxide which readily reacts with
acetylacetone; and it was expected it would undergo similar reactions as the iron(III)
oxide. The results of the iron and chrome extraction experiments are presented and
discussed in this chapter.
4.1 Extraction of Iron
The extraction of iron from Fe2O3 using acac in the gas phase occurs according to the
stoichiometric reaction
2 3( ) ( ) 3( ) 2 ( )6 2 ( ) 3s g g gFe O Hacac Fe acac H O+ → + (4-1)
The extraction was investigated and the results obtained are described in this chapter.
The influence of various parameters, such as temperature, concentration of the
reactant and flow rate of the ligand were evaluated and determined. The cumulative
extraction in the graphs to follow is defined as a percentage of the total mass of metal
extracted divided by the amount of metal initially present in the charge. For all the
experiments carried out, the total amount of ligand passing through the system was in
54
large excess compared to the stoicheometric reaction amount required. The
calculation of the amount of ligand required for complete reaction for the different
charges of metal oxide used is given in Appendix C.
The reaction of Fe2O3 with acac produces a metal complex which is red in colour.
For most of the experiments, the progression of the reaction could be followed by
observing the colour of the product stream; the reaction proceeding rapidly in the
initial stages, shown by the intense red colour of the product; then gradually slowing
down as more time elapsed. For the preliminary experiments the reaction was
assumed to have gone to completion when the colour of the product stream was off-
white (yellowish); which is the colour of the acac when it has been heated up.
4.1.1 Effect of temperature on extraction
Gas phase extraction of iron from the metal oxide at different temperatures for
different metal oxide feeds (1wt%, 3wt% & 10wt %) was carried out at a constant
ligand flow rate (1ml/min). This resulted in different extraction rates as shown in
Figure 4-1.to Figure 4-3

55
0 30 60 90 120 150 180 210 240 2700
10
20
30
40
50
60
70
80
90
Cu
mu
lative
extr
actio
n(%
)
Time (min)
190°C
210°C
230°C
250°C
Figure 4-1 Effect of temperature on extraction for a 1wt% Fe2O3 mixture
The extraction is clearly dependent on the reaction temperature as can be seen from
Figure 4-1. Extraction is higher at higher temperatures; with an increase in
temperature from 190°C to 250°C resulting in the amount of iron extracted
increasing. For all four temperatures investigated, the reaction is initially rapid before
it slows down, indicated by a flattening of the graphs. The difference in extraction
between 210°C and 230°C is distinctly visible in Figure 4-1, with the extraction after
4hrs more than double i.e. 31% compared to 74%. This increase in extraction
suggests that between the two temperatures there is a potential energy barrier required
for the extraction to occur. This barrier is achieved by more atoms at higher
temperatures than is achieved at the lower temperatures of 190°C and 210°C. The
increase in extraction with an increase in temperature implies a chemically controlled

56
process because such processes are known to be highly dependent on the operating
temperature.
.
0 30 60 90 120 150 180 210 240 2700
10
20
30
40
50
60
70
80
C
um
ula
tive
extr
actio
n (
%)
Time (min)
190°C
210°C
230°C
250°C
Figure 4-2 Effect of temperature on extraction for a 3wt% Fe3O2 mixture
For the 3wt% metal oxide mixture, the graphs are similar to those for extraction with
1wt%, with higher extraction occurring at higher temperatures. The graphs are also
divided into two distinct regions, with the extraction almost doubling for the higher
temperatures as compared to the lower temperatures. The total extraction however, is
not as high as for the low iron(III) oxide charge (1wt%). This decrease in extraction
at high charge feed implies that some other variable rather than temperature becomes
limiting as the concentration of iron in the charge is increased.

57
0 30 60 90 120 150 180 210 240 2700
5
10
15
20
25
30
35
40
Cu
mu
lative
yie
ld (
%)
time (min)
190°C
210°C
230°C
250°C
Figure 4-3 Effect of temperature on extraction for a 10wt% Fe2O3 mixture
Gas phase extraction of the 10wt% charge results in a maximum extraction of about
35% at 250°C after 4hours which is very low compared with the extraction for the
low concentration charge mixtures. At this charge, the two distinct regions that were
obvious before are not visible. The initial rate of reaction is not very fast as observed
before, and none of the graphs start to flatten out as was previously observed. Rather,
all the graphs appear linear and approach straight line functions.
Because of the low extraction observed for the high metal oxide charges, it was
suspected that in addition to the extraction being influenced by the temperature it was
also influenced by the ligand flow rate. Additionally, at high charge concentrations

58
more iron was extracted after 4hrs i.e. the actual mass/amounts extracted. The actual
mass of iron extracted for the different charges is shown in Table 4-1
Table 4-1 Mass of iron extracted (g) after 4hrs for different charges at 1ml/min ligand flow rate
1wt% 3wt% 10wt%
190°C 0.122 0.399 0.588
210°C 0.179 0.473 0.722
230°C 0.428 0.655 0.821
250°C 0.501 0.769 1.107
Table 4-1 shows that more iron is extracted when the amount of iron initially
available in the feed is higher (in terms of total mass extracted). This can be
explained by the fact that when there is more mass of Fe in the charge, the surface of
Fe that is available for reaction with the ligand is more at a given ligand flow rate.
Because the amount of surface available for reaction is more, more Fe will be
extracted even when the flow rate of the ligand is kept constant.
The extraction of Fe from its oxide in the gas phase has been shown to be directly
proportional to the temperature for all the different charges investigated. This
temperature dependence has been shown in Figure 4-1 to Figure 4-3, where it was
shown that the extraction of Fe generally increases as the temperature is increased.
This temperature dependence can be expressed mathematically as
r Tα (4-2)

59
4.1.2 Effect of ligand flow rate on extraction
Once it was noticed that the flow rate of the ligand became limiting when the charge
contained a higher concentration of metal, further experiments were carried out at
higher ligand flow rates for the higher concentration charges (3wt% and 10wt%). The
experiments were carried out at 250°C since this temperature is the one that produced
the best extraction for the range of temperatures investigated. The effect of ligand
flow rate is shown in Figure 4-4 and Figure 4-5
0 20 40 60 80 100 120 1400
10
20
30
40
50
60
70
80
Cu
mu
lative
extr
actio
n (
%)
Time (min)
Vacac
=1ml/min
Vacac
=3ml/min
Figure 4-4 Effect of ligand flow rate on the extraction for a 3wt% mixture at 250°C
Gas phase extraction of iron at 3ml/min ligand flow rate results in the extraction
increasing from about 38% to 65% after only 2hrs. At this higher ligand flow rate of

60
3ml/min, the initial rate of extraction is higher as compared to that at the low flow
rate of 1ml/min as shown by the steeper gradient in the initial stages of the reaction.
0 30 60 90 120 150 180 210 240 2700
10
20
30
40
50
60
70
80
C
um
ula
tive e
xtr
actio
n (
%)
Time (min)
Vacac
=1ml/min
Vacac
=3ml/min
Figure 4-5 Effect of ligand flow rate on extraction for a 10wt% mixture at 250°C
Figure 4-5 also shows an increase in the initial rate of reaction when the flow rate of
ligand is increased. The increase in extraction and rate of reaction when the ligand
flow rate is increased can be explained by the fact that an increase in ligand flow rate
means that there is more ligand available to come into contact with the solid oxide
particles. At the lower ligand flow rate, although the ligand is present in excess, it
probably quickly passes through the FBR reactor without having enough time to react
with the oxide i.e. the residence time is insufficient for the reaction to occur. At high
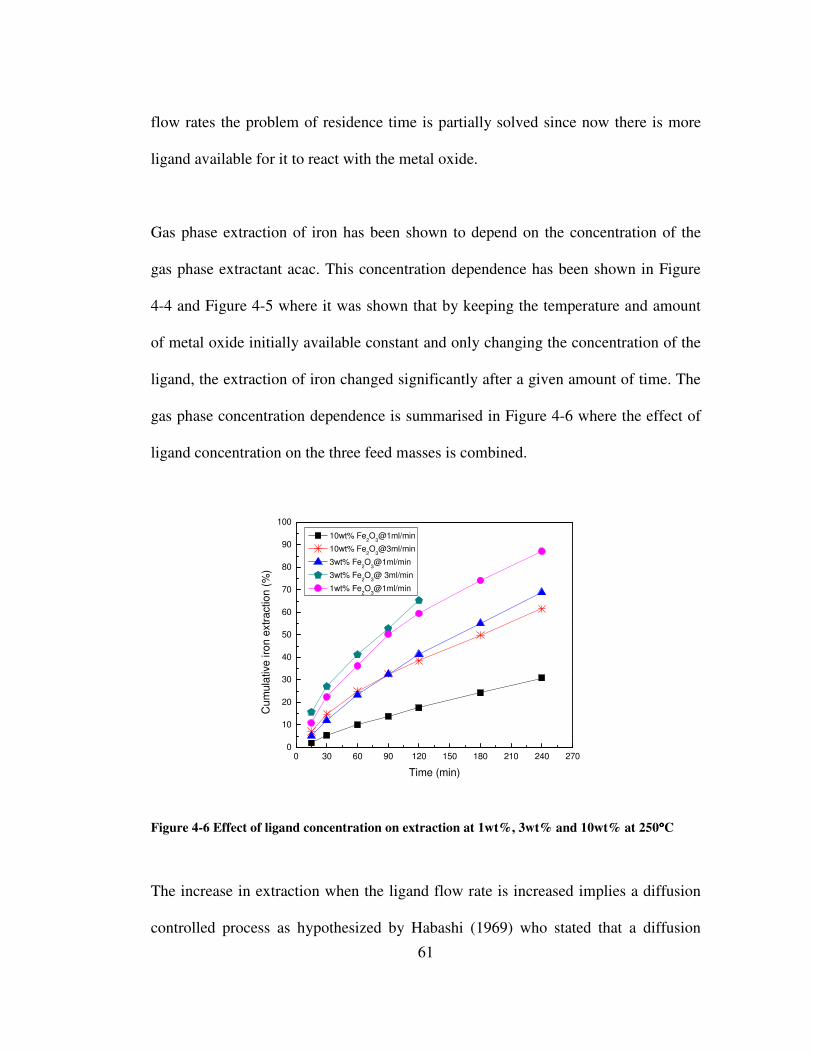
61
flow rates the problem of residence time is partially solved since now there is more
ligand available for it to react with the metal oxide.
Gas phase extraction of iron has been shown to depend on the concentration of the
gas phase extractant acac. This concentration dependence has been shown in Figure
4-4 and Figure 4-5 where it was shown that by keeping the temperature and amount
of metal oxide initially available constant and only changing the concentration of the
ligand, the extraction of iron changed significantly after a given amount of time. The
gas phase concentration dependence is summarised in Figure 4-6 where the effect of
ligand concentration on the three feed masses is combined.
0 30 60 90 120 150 180 210 240 2700
10
20
30
40
50
60
70
80
90
100
Cu
mula
tive
iro
n e
xtr
action
(%
)
Time (min)
10wt% Fe2O
3@1ml/min
10wt% Fe2O
3@3ml/min
3wt% Fe2O
3@1ml/min
3wt% Fe2O
3@ 3ml/min
1wt% Fe2O
3@1ml/min
Figure 4-6 Effect of ligand concentration on extraction at 1wt%, 3wt% and 10wt% at 250°°°°C
The increase in extraction when the ligand flow rate is increased implies a diffusion
controlled process as hypothesized by Habashi (1969) who stated that a diffusion
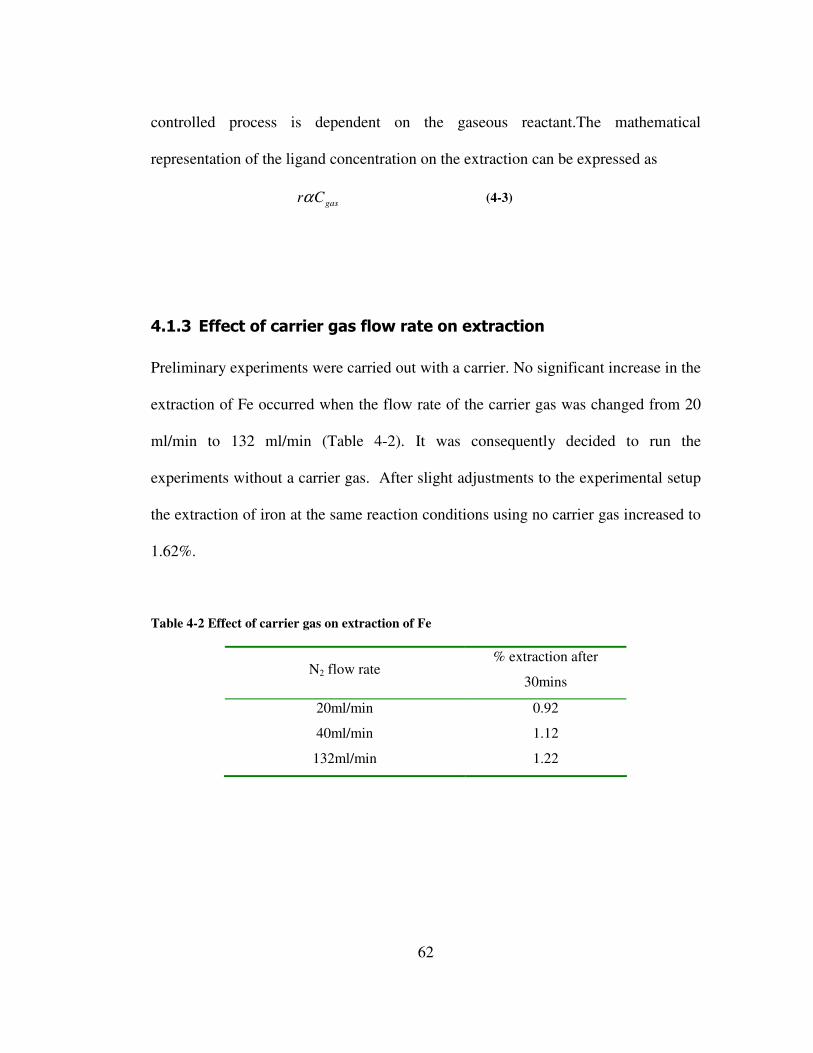
62
controlled process is dependent on the gaseous reactant.The mathematical
representation of the ligand concentration on the extraction can be expressed as
gasr Cα (4-3)
4.1.3 Effect of carrier gas flow rate on extraction
Preliminary experiments were carried out with a carrier. No significant increase in the
extraction of Fe occurred when the flow rate of the carrier gas was changed from 20
ml/min to 132 ml/min (Table 4-2). It was consequently decided to run the
experiments without a carrier gas. After slight adjustments to the experimental setup
the extraction of iron at the same reaction conditions using no carrier gas increased to
1.62%.
Table 4-2 Effect of carrier gas on extraction of Fe
N2 flow rate % extraction after
30mins
20ml/min 0.92
40ml/min 1.12
132ml/min 1.22
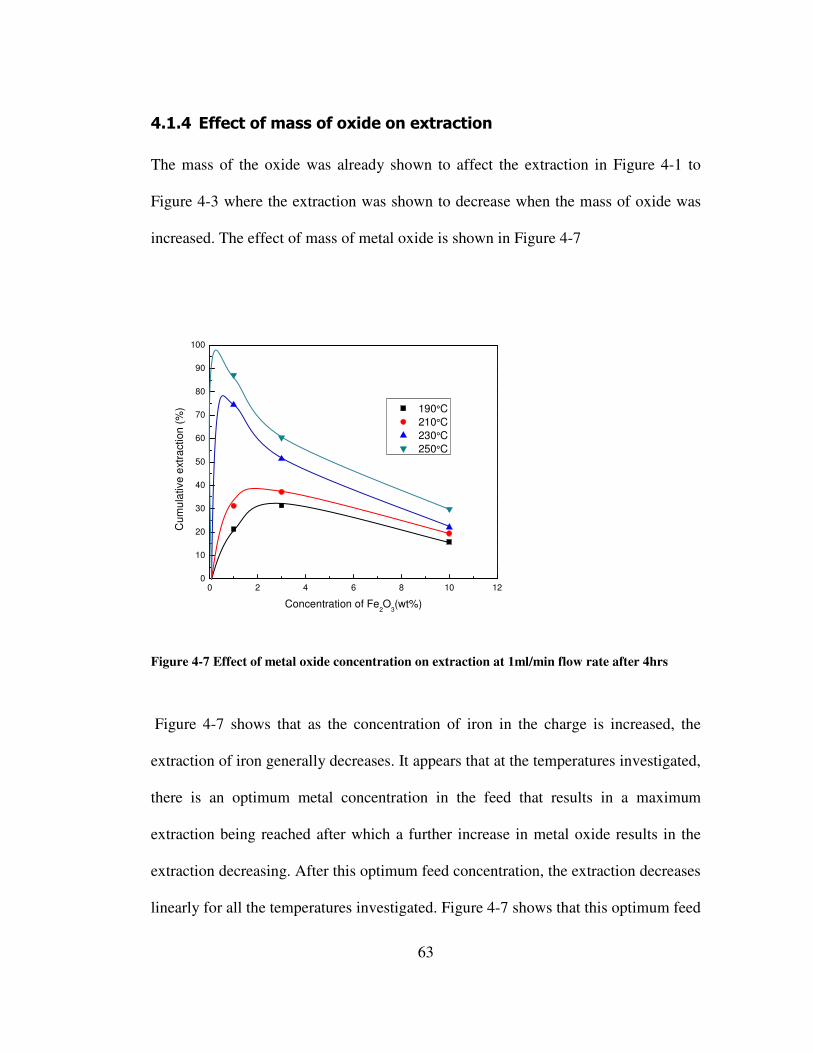
63
4.1.4 Effect of mass of oxide on extraction
The mass of the oxide was already shown to affect the extraction in Figure 4-1 to
Figure 4-3 where the extraction was shown to decrease when the mass of oxide was
increased. The effect of mass of metal oxide is shown in Figure 4-7
0 2 4 6 8 10 120
10
20
30
40
50
60
70
80
90
100
Cum
ula
tive
extr
action
(%
)
Concentration of Fe2O
3(wt%)
190°C
210°C
230°C
250°C
Figure 4-7 Effect of metal oxide concentration on extraction at 1ml/min flow rate after 4hrs
Figure 4-7 shows that as the concentration of iron in the charge is increased, the
extraction of iron generally decreases. It appears that at the temperatures investigated,
there is an optimum metal concentration in the feed that results in a maximum
extraction being reached after which a further increase in metal oxide results in the
extraction decreasing. After this optimum feed concentration, the extraction decreases
linearly for all the temperatures investigated. Figure 4-7 shows that this optimum feed
64
concentration is very low, which implies that gas phase extraction will be particularly
useful for the extraction of metals containing very low metal concentrations as
compared to feeds containing high metal concentrations.
4.1.5 Surface area effect
The effect of surface area can be investigated by either:
i. Increasing the amount of Fe2O3 present in the charge and keeping all other
experimental variables constant, or
ii. Carrying out experiments on the same mass of Fe2O3 in the charge, but with
different particle sizes.
Gas phase extraction has already been shown to depend on the surface area available
in Table 4-1 where it was shown that the mass of Fe extracted increases when the
initial amount of Fe in the charge is increased and all other variables kept constant.
Experiments were also carried on two sets of particle size fractions to confirm the
dependence of the reaction on surface area. The extraction was carried out on a
mixture of sand and hematite. The hematite had a wide particle size range, which was
classified into smaller size fractions by dry sieving. Extraction using different particle
sizes is shown in Figure 4-8 and Figure 4-9.

65
0 20 40 60 80 100 1200
4
8
12
16
20
24
28
32
36
40
Cum
ula
tive
extr
actio
n (
%)
Time (min)
-106µm+45µm hematite
-150µm+106µm hematite
Figure 4-8 Effect of particle size on extraction at 3ml/min on a 3wt% mixture at 230°°°°C
Figure 4-8 shows that when the particle size is decreased more of the Fe is extracted.
More extraction occurs for the smaller sized particles (28%) as compared to the larger
sized particles (10%) in the same amount of time This is because decreasing the
particle size for the same mass results in an increase in the number of particles, and
hence an increase in surface area, which allows for the ligand to come into contact
with more surface of the particles to be extracted, resulting in an increase in
extraction.

66
0 20 40 60 80 100 120
2
4
6
8
10
12
14
16
Cum
ula
tive
extr
action
(%
)
Time (min)
-150µm+106µm
-300µm+150µm
Figure 4-9 Effect of particle size on extraction at 3ml/min on a 3wt% mixture at 210°°°°C
Figure 4-9 also shows that decreasing the particle size results in an increase in
extraction (13% for -150µm+106µm as compared to 9% for 130µm+150µm).
Additionally when comparing Figure 4-8 and Figure 4-9 the temperature effect on
extraction can be clearly seen; with a higher extraction for the same particle size at
higher temperatures.
Chemical reaction controlled processes are sensitive to a change in particle size
(Szekely, 1976). The dependence of the reaction rate on the surface area available can
be described mathematically as
exr Sα (4-4)

67
From the above discussion where the experimental observations are discussed, it is
clearly evident that the gas phase extraction of iron is not controlled by only one
variable. In order to come up with a kinetic model that accurately describes the
process, all the variables that have an effect should be taken into account in the
model.
It can be seen from the results presented that the time required to obtain reasonable
extraction using gas phase extraction is much shorter than previously reported.
Allimann-Lecourt et al. (1999) carried out experiments for 25hrs, whilst Hamblin and
Posner (1979) carried out experiments for up to 8 days as compared to 4hrs in this
study.
The development of a model for the extraction, together with testing some
conventional models will be carried out in the next chapter.
4.2 Extraction of Chrome
Experiments were carried out for mixtures which contained 3wt% Cr2O3 at 3ml/min
acac flow rate and two different temperatures 210°C and 250°C. These conditions
were similar to the optimum conditions (3wt% Cr2O3, 6ml/min and 210°C) suggested

68
by Potgieter et al. (2005) for the extraction of chrome. The results are shown in
Figure 4-10
0 30 60 90 120 150 180 210 240 2700
2
4
6
8
10
12
14
16
Cu
mu
lative
extr
acio
n (
%)
Time (min)
Extraction at 210°C
Extraction at 250°C
Figure 4-10 Extraction from a mixture containing 3wt%Cr2O3 at 3ml/min
Figure 4-10 shows that the extraction decreases when the temperature is increased
from 210°C to 250°C. The lower extraction at the higher temperature could be
because some of the Cr(acac)3 product starts to dissociate at the higher temperature.
The trend observed is in agreement to the one identified by Kabemba (2005), who
showed that above 210°C, the extraction did not increase as compared to the lower
temperatures he investigated, but instead the extraction appeared to be decreasing.
From the figure it seems as though the extraction of chrome from chrome(III) oxide is
a linear function of time for both temperatures. The results presented here are not in
agreement with Potgieter et al. (2005) who obtained much higher extraction of

69
chrome, 48% after 150min at 210°C. No plausible explanation can be given for this
deviation in results.
The extraction of chrome with acetylacetone produces results which might not be
viable due to the low extraction amounts (12% at 210˚C and 9% at 250˚C after 4hrs).
It is therefore suggested that an alternative ligand for Cr extraction be identified in
future research. The results also suggested that it might be possible to preferentially
extract Fe from a Fe2O3/ Cr2O3 mixture using acetylacetone. Consequently some
experiments were performed using mixtures of Fe2O3 and Cr2O3.
4.3 Extraction from mixtures with chromium and iron
Gas phase extraction was also carried out using a charge that contained both iron(III)
oxide and chromium(III) oxide. A constant concentration of Fe2O3 (5wt%) was
used, whilst the concentration of Cr2O3 was varied. The results of this extraction are
shown in Figure 4-11
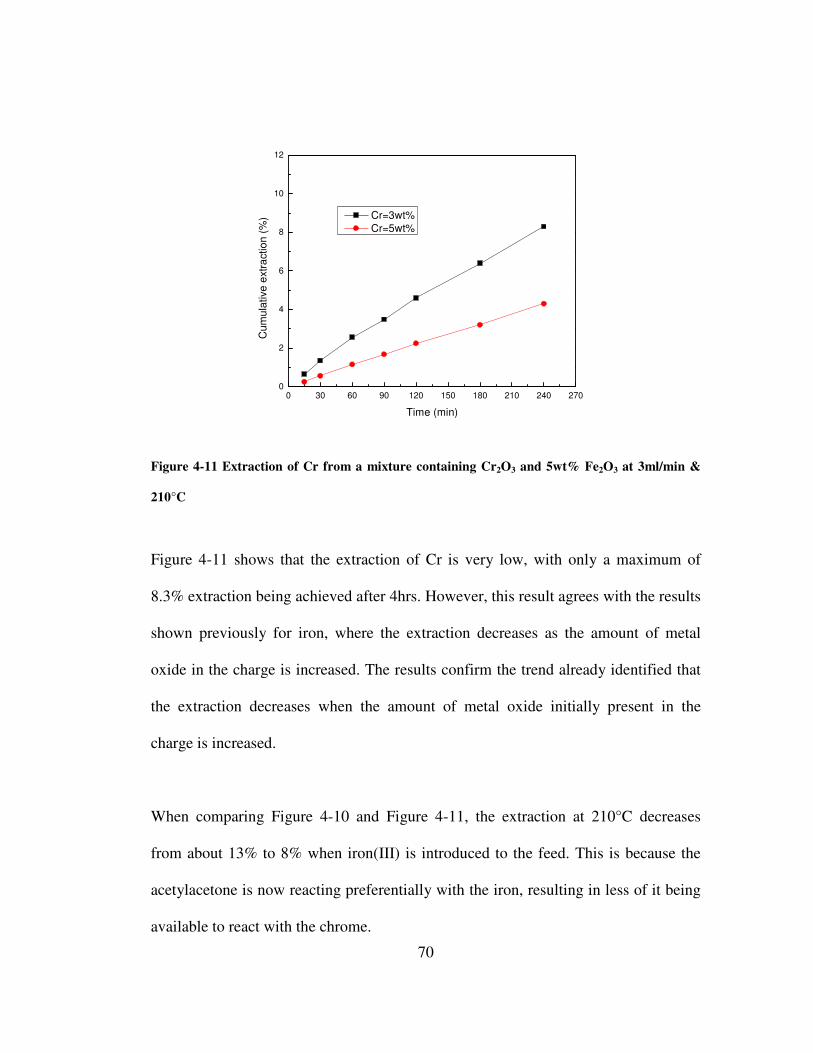
70
0 30 60 90 120 150 180 210 240 2700
2
4
6
8
10
12
Cu
mu
lative
extr
actio
n (
%)
Time (min)
Cr=3wt%
Cr=5wt%
Figure 4-11 Extraction of Cr from a mixture containing Cr2O3 and 5wt% Fe2O3 at 3ml/min &
210°C
Figure 4-11 shows that the extraction of Cr is very low, with only a maximum of
8.3% extraction being achieved after 4hrs. However, this result agrees with the results
shown previously for iron, where the extraction decreases as the amount of metal
oxide in the charge is increased. The results confirm the trend already identified that
the extraction decreases when the amount of metal oxide initially present in the
charge is increased.
When comparing Figure 4-10 and Figure 4-11, the extraction at 210°C decreases
from about 13% to 8% when iron(III) is introduced to the feed. This is because the
acetylacetone is now reacting preferentially with the iron, resulting in less of it being
available to react with the chrome.
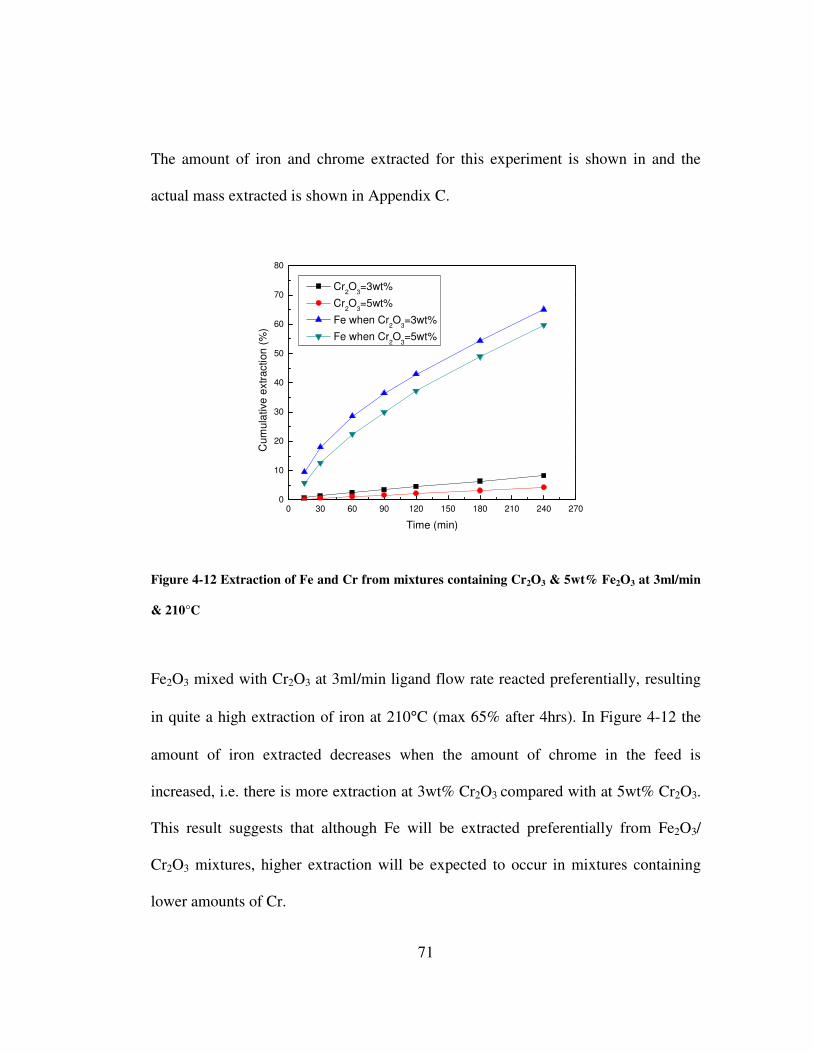
71
The amount of iron and chrome extracted for this experiment is shown in and the
actual mass extracted is shown in Appendix C.
0 30 60 90 120 150 180 210 240 2700
10
20
30
40
50
60
70
80
C
um
ula
tive
extr
action
(%
)
Time (min)
Cr2O
3=3wt%
Cr2O
3=5wt%
Fe when Cr2O
3=3wt%
Fe when Cr2O
3=5wt%
Figure 4-12 Extraction of Fe and Cr from mixtures containing Cr2O3 & 5wt% Fe2O3 at 3ml/min
& 210°C
Fe2O3 mixed with Cr2O3 at 3ml/min ligand flow rate reacted preferentially, resulting
in quite a high extraction of iron at 210°C (max 65% after 4hrs). In Figure 4-12 the
amount of iron extracted decreases when the amount of chrome in the feed is
increased, i.e. there is more extraction at 3wt% Cr2O3 compared with at 5wt% Cr2O3.
This result suggests that although Fe will be extracted preferentially from Fe2O3/
Cr2O3 mixtures, higher extraction will be expected to occur in mixtures containing
lower amounts of Cr.

72
Additionally iron was extracted from mixtures where initially there was no Fe2O3
added. This extraction was attributed to the fact that the sand used in the charge
contained small amounts of Fe2O3 (0.6%) and the iron was being extracted from this
sand. This extraction at very low Fe2O3 is in agreement with previous work which
shows that when using the ligand acac iron will be preferentially extracted even from
charges that contain very low iron (Cox et al., 1985).

73
5 KINETIC MODELLING OF THE EXTRACTION OF
IRON
Several reaction models have been proposed for gas-solid reactions, including the
classic shrinking core model. In addition, several models have also been proposed
that take into account the equipment being used. Khani et al. (2007) carried out
fluorination of uranium in a fluidized bed reactor, and they postulated that the fluid in
the fluidized bed could behave as either a fluid in plug flow or in a continuous stirred
tank reactor. Some of the classic models given in literature, together with those that
take into account the equipment; will be tested for their fit on the experimental data
obtained in the gas phase extraction of iron. The data used to model the extraction
was that obtained at 1wt% Fe2O3 because those experiments neared completion as
compared to those at other Fe2O3 concentrations.
5.1 General rate equation
The rate of a chemical reaction is the rate of change in concentration of a reactant or a
product, i.e.
[ ] [ ]
dt
d
dt
drate
productreactant=
−=
The rate law in general may be written as

74
)(),( XfTBkdt
dXg= (5-1)
where
k is the apparent rate constant which takes into account the effect of
temperature and gas phase reactant
f(X) describes changes in physical or chemical properties of the
sample as the reaction proceeds
The rate constant is dependent on the temperature and is given as
0
aERTk k e= (5-2)
where
k0 is a pre-exponential factor
Ea is the energy of activation
R is the gas constant
T is the absolute temperature
This equation gives the temperature dependence of the rate constant, hence of the
chemical reaction.
The reaction between a solid and a gas is a heterogeneous reaction which could be
any one of three types

75
( ) ( )aA fluid bB solid fluid products
solid products
fluid and solid products
+ →
→
→
In the case of reaction of metals with ligands, the solid product is formed if the
metals/solids contain some foreign particles that do not form complexes with the
ligand being used. It is assumed the soil matrix contains no metals that can react with
the ligand hence the reaction only takes place with the metal oxide.
In the development of a model for the gas solid reaction, the model chosen must be
able to interpret experimental kinetics, provide indications of the rate controlling
mechanisms, and predict the kinetics of conversion under different operating
conditions (Patisson & Ablitzer, 2000).
The major models that have been developed for non-catalytic fluid–solid reactions are
the shrinking core, shrinking particle, homogeneous and grain models. The shrinking
core model (SCM) is applicable to an initially non-porous particle, which reacts with
a reagent leaving a reacted layer around the unreacted core. The shrinking particle
model is similar to the SCM except that no product layer is left around the unreacted
core. The homogeneous model is applicable to a solid with a homogeneous
distribution of pores, where diffusional gradients may exist within the pores
(Doraiswamy & Sharma, 1984)). The grain model is applicable to a solid consisting
of individual dense grains compacted together. Among these models, the SCM has
76
been widely used in the area of hydrometallurgy to model leaching systems (Gbor
and Jia, 2003).
5.1.1 The shrinking core model for chemical reactions
Traditionally, reactions involving solids and fluids have been modelled using the
shrinking core models for chemical reactions developed by Levenspiel. The shrinking
core model envisions a chemical reaction of the form
( ) ( ) ( ) ( )sgsg dDcCbBA +→+
The model assumes that during the course of the reaction an ash layer is formed
around a shrinking core of unreacted solid reactant. As a result, as the reaction
progresses, the ash layer steadily increases inward towards the shrinking core, until
all of the reactant solid is reacted. It is envisioned the major resistance to the reactions
are as follows:
i. The diffusion of the reactant gas A to the surface of the solid through the gas
film surrounding the particle
ii. The diffusion of the reactant gas through the solid ash layer to the reaction
surface at the unreacted core
iii. Reaction of the gaseous reaction A at the reaction surface of the unreacted core
with solid B
iv. Diffusion of the gaseous product from the surface of the unreacted core through
the ash layer back to the outer part of the ash layer

77
v. Diffusion of the gaseous product through the gaseous film surrounding the
particle.
Depending on the reaction occurring, one, or a combination of the resistances
mentioned above will control the reaction, and hence can be used to develop a model
that will predict how that particular chemical process will proceed with time.
In the gas phase extraction of metal oxides by acac ligand, the only products formed
are gaseous products, hence the reaction occurring will be of the form
( ) ( ) ( ) ( )ggsg dDcCbBA +→+
The reaction will be controlled by any of three possible resistance; the chemical
reaction itself, diffusion through the fluid film surrounding the particle, or diffusion
through the ash layer of product. Since no solid product is left behind, it will be
assumed all product formed is immediately turned into the gas phase. When the
chemical reaction controls, the process can be modelled as
( )1
31 1kt x= − − (5-3)
When diffusion through the gas film controls, for small particles in the Stokes
regime, the process can be modelled as
( )2
31 1kt x= − − (5-4)
When diffusion through the solid controls, the reaction can be modelled as
( )2
321 13
kt x x= − − − (5-5)

78
where
x is the fractional conversion of the solid
When both the chemical reaction and diffusion through the gas film controls, the
overall resistance can be taken as the sum of the two individual resistances since the
resistances occur in series and hence can be assumed to be additive (Szekely et al.,
1976).
5.1.2 The grain model for chemical reactions
In many gas-solid reactions the solid is porous, allowing diffusion and chemical
reaction to occur simultaneously throughout the solid resulting in the reaction
occurring in a diffuse zone rather than at a sharp boundary as assumed by the
shrinking core model (Szekely et al., 1976). This model assumes that the particle is
made up of a large number of grains, which might differ in both size and shape,
through which the gas has to diffuse in order to react. Reaction of the pores with the
gaseous reactant is affected by any of the following steps:
1. The gaseous reactant diffuses through a boundary layer surrounding the solid
particle and enters the pores between the grains.
2. The gaseous reactant diffuses through the pores.
3. The gaseous reactant diffuses through the shell of solid product surrounding
the core of unreacted solid within a grain.
4. Reaction takes place at the spherical reaction interface within the grain.

79
5. The gaseous product diffuses back into the bulk gas stream by the reverse of
steps 1 to 3.
For a reaction where the particles have a high porosity, low specific surface area, or
low pore diameters occurring at moderate temperatures, Evans et al. (1976) have
suggested step 4 in the sequence, chemical reaction will control the process. For such
a reaction, the process can be described according to the equations
1
( )
( ) 1 (1 ) g
AO A
g
F
kC Sg x t
F
g x x
=
= − −
(5-6)
where
Fg is the shape factor for the grain, which is 3 for spherical particles
SA is the specific surface area of the solid
5.1.3 Fluidized bed reactor models
Khani et al., 2007 carried out the fluorination of uranium (a gas solid reaction) in a
fluidized bed reactor. They derived models that take into account the type of flow
occurring in the reactor in order to come up with models to predict the behavior of the
fluorination.
The rate of a non-catalytic gas-solid chemical reaction can be written as
)1(' 0 AAAF XCkCkr −⋅⋅=⋅⋅=− ηη (5-7)
where

80
k is the reaction rate constant
CAO and CA is the initial concentration and the concentration of the gas at any
given time
η is the effectiveness factor which takes diffusion effects into account
The flow of fluid in a fluidized bed reactor can be assumed be to either plug flow, or
perfectly mixed as in a continuous stirred tank reactor. Assuming that the reaction is
1st order, conversion can then be modelled using the following equations:
For plug flow: 1
. . ln1 A
kX
τ η
= −
(5-8)
For mixed flow: . .1
A
A
Xk
Xτ η =
− (5-9)
For processes where external diffusional effects are negligible, the process will be
controlled by the chemical reaction and the effectiveness factor can be taken as unity
(Khani et al., 2007). The above equations can then be used to calculate the rate
constant (k) of the reaction for plug flow or mixed flow assuming the rate of reaction
is controlled by the chemical reaction.
5.1 Modelling the extraction of iron
The gas phase extraction of iron from iron(III) oxide was modeled using the
shrinking core model, assuming chemical reaction controlled or gas diffusion
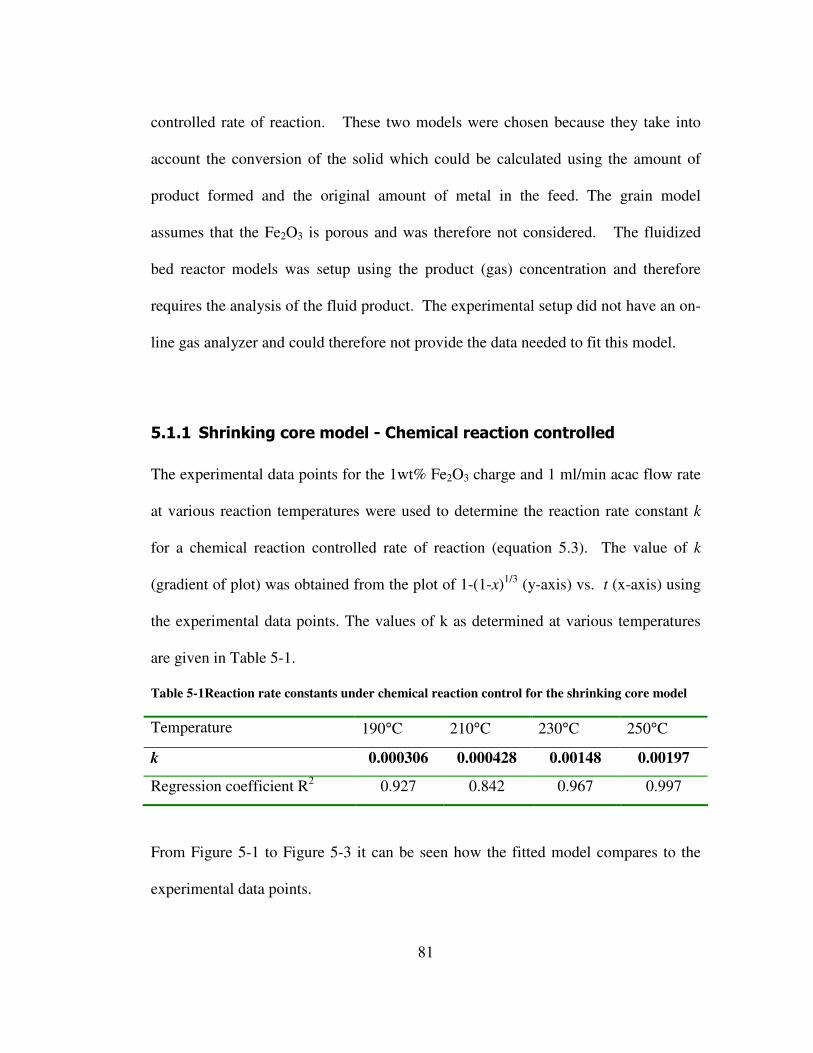
81
controlled rate of reaction. These two models were chosen because they take into
account the conversion of the solid which could be calculated using the amount of
product formed and the original amount of metal in the feed. The grain model
assumes that the Fe2O3 is porous and was therefore not considered. The fluidized
bed reactor models was setup using the product (gas) concentration and therefore
requires the analysis of the fluid product. The experimental setup did not have an on-
line gas analyzer and could therefore not provide the data needed to fit this model.
5.1.1 Shrinking core model - Chemical reaction controlled
The experimental data points for the 1wt% Fe2O3 charge and 1 ml/min acac flow rate
at various reaction temperatures were used to determine the reaction rate constant k
for a chemical reaction controlled rate of reaction (equation 5.3). The value of k
(gradient of plot) was obtained from the plot of 1-(1-x)1/3 (y-axis) vs. t (x-axis) using
the experimental data points. The values of k as determined at various temperatures
are given in Table 5-1.
Table 5-1Reaction rate constants under chemical reaction control for the shrinking core model
Temperature 190°C 210°C 230°C 250°C
k 0.000306 0.000428 0.00148 0.00197
Regression coefficient R2 0.927 0.842 0.967 0.997
From Figure 5-1 to Figure 5-3 it can be seen how the fitted model compares to the
experimental data points.

82
0 30 60 90 120 150 180 210 240 2700.00
0.05
0.10
0.15
0.20
0.25
Cum
ula
tive
extr
axtio
n (
%)
Time (min)
data
model
Figure 5-1Comparison of conversion predicted by chemical reaction control model with actual
data obtained at 190°C
0 30 60 90 120 150 180 210 240 2700.00
0.05
0.10
0.15
0.20
0.25
0.30
0.35
data
model
Cu
mula
tive
extr
action
(%
)
Time (min)
Figure 5-2 Comparison of conversion predicted by chemical reaction control model with actual
data obtained at 210°C

83
From Figure 5-1 and Figure 5-2 it is clear that the chemical reaction model under
predicts the extraction compared with what was experimentally observed. This is
especially evident at 210°C where the values predicted by the model are much lower
than those obtained experimentally.
For the higher temperature extraction experiments (230°C and 250°C), the chemical
reaction control model appears to fit much better than for the lower temperature
experiments. This is shown in Figure 5-3 and Figure 5-4
0 30 60 90 120 150 180 210 240 2700.0
0.1
0.2
0.3
0.4
0.5
0.6
0.7
0.8
data
model
Cum
ula
tive
extr
action
(%
)
Time (min)
Figure 5-3 Comparison of conversion predicted by chemical reaction control model with actual
data obtained at 230°C

84
0 30 60 90 120 150 180 210 240 2700.0
0.1
0.2
0.3
0.4
0.5
0.6
0.7
0.8
0.9
1.0
data
model
Cum
ula
tive
extr
action
(%
)
Time (min)
Figure 5-4 Comparison of conversion predicted by chemical reaction control model with actual
data obtained at 250°C
The values of the extraction predicted by the chemical reaction control model do not
differ greatly from the experimental results obtained at high temperatures.
The values of k obtained under chemical reaction control were used to calculate the
activation energy of the reaction using Equation 5-2. The activation energy predicted
using this equation is shown in Figure 5-5

85
0.00190 0.00195 0.00200 0.00205 0.00210 0.00215 0.00220
-8.0
-7.5
-7.0
-6.5
-6.0
lnk
1/T (K-1)
Chemical reaction control k
Linear fit of k
y= 9.6404-8262x
R2= 0.930
Figure 5-5 Arrhenius plot for chemical reaction control model at 1wt%Fe2O3 and 1ml/min
ligand flow rate
The activation energy calculated using the Arrhenius plot is 68.69kJ/mol for chemical
reaction controlled. The activation energy of a chemical controlled process is
characteristically >41.84kJ/mol, while for a diffusion controlled reaction it is usually
4-12kJ/mol, and for an intermediate process about 20-34kJ/mol (Habashi, 1969). The
activation energy control is within the range for a process controlled by the chemical
reaction. Additionally, chemical control can also be assumed because chemically
controlled processes are known to be highly temperature dependent (Habashi, 1969;
Rosenqvist, 1974; Wen, 1968). The gas phase extraction is indeed highly temperature
dependent, as was shown in Figure 4-1 to Figure 4-3.
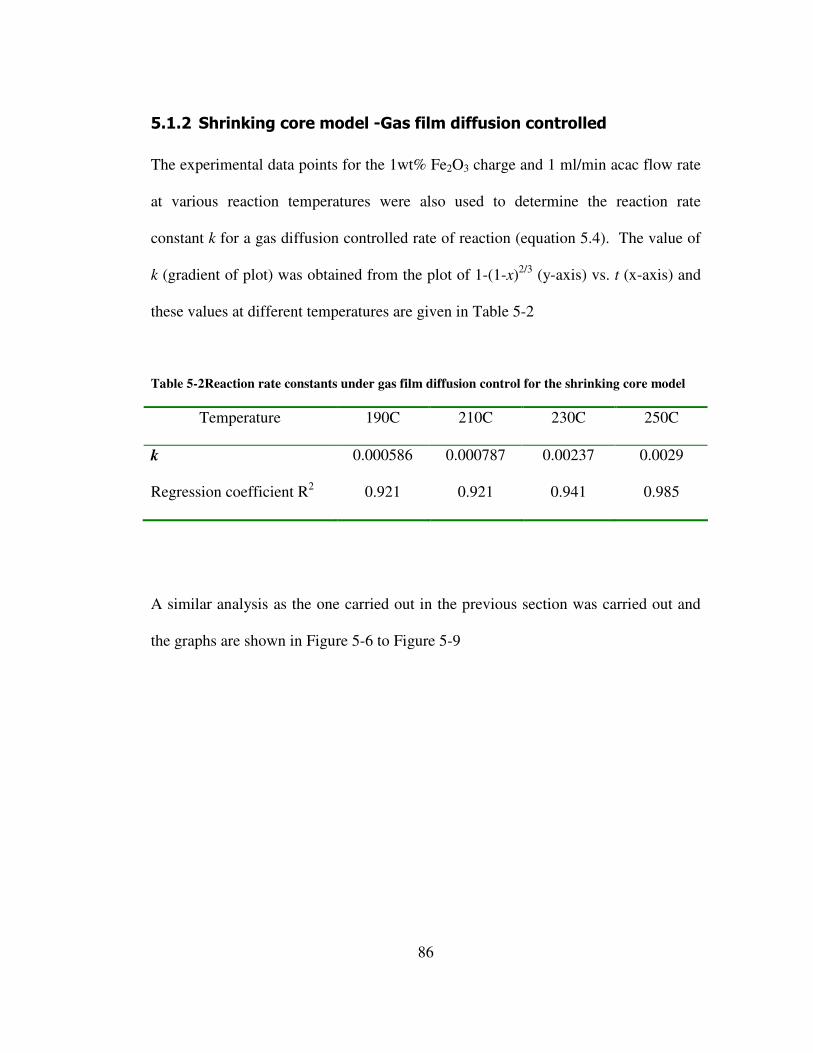
86
5.1.2 Shrinking core model -Gas film diffusion controlled
The experimental data points for the 1wt% Fe2O3 charge and 1 ml/min acac flow rate
at various reaction temperatures were also used to determine the reaction rate
constant k for a gas diffusion controlled rate of reaction (equation 5.4). The value of
k (gradient of plot) was obtained from the plot of 1-(1-x)2/3 (y-axis) vs. t (x-axis) and
these values at different temperatures are given in Table 5-2
Table 5-2Reaction rate constants under gas film diffusion control for the shrinking core model
Temperature 190C 210C 230C 250C
k 0.000586 0.000787 0.00237 0.0029
Regression coefficient R2 0.921 0.921 0.941 0.985
A similar analysis as the one carried out in the previous section was carried out and
the graphs are shown in Figure 5-6 to Figure 5-9

87
0 30 60 90 120 150 180 210 240 2700.00
0.05
0.10
0.15
0.20
0.25
data
model
Cum
ula
tive
extr
action
(%
)
Time (min)
Figure 5-6 Comparison of conversion predicted by gas film diffusion control model with actual
data obtained at 190°C
0 30 60 90 120 150 180 210 240 2700.00
0.05
0.10
0.15
0.20
0.25
0.30
0.35
data
model
Cum
ula
tive
extr
action
(%
)
Time (min)
Figure 5-7 Comparison of conversion predicted by gas film diffusion control model with actual
data obtained at 210°C

88
It can be seen in Figure 5-6 and Figure 5-7, the experimental data obtained differs
quite significantly from that predicted by the model at the lower temperatures
involved. This model does not fit the data at the lower temperatures well.
0 30 60 90 120 150 180 210 240 2700.0
0.1
0.2
0.3
0.4
0.5
0.6
0.7
0.8
data
model
Cum
ula
tive
extr
action
(%
)
Time (min)
Figure 5-8 Comparison of conversion predicted by gas film diffusion control model with actual
data obtained at 230°C

89
0 30 60 90 120 150 180 210 240 2700.0
0.1
0.2
0.3
0.4
0.5
0.6
0.7
0.8
0.9
data
model
Cum
ula
tive
extr
action
(%
)
Time (min)
Figure 5-9 Comparison of conversion predicted by gas film diffusion control model with actual
data obtained at 250°C
The gas film control model fits the experimental data better at higher temperatures as
shown in Figure 5-8 and Figure 5-9. The deviation of the values predicted by the
model from the experimental results is not too high. However, when comparing
Figure 5-8 and Figure 5-9 with Figure 5-3 and Figure 5-4, there is a smaller deviation
between the experimental data points and model values when the chemical reaction
control is used. This implies that at higher temperatures the chemical reaction control
model gives a better prediction of the extraction.
The Arrhenius plot obtained from gas film diffusion control model is shown in Figure
5-10

90
0.00190 0.00195 0.00200 0.00205 0.00210 0.00215 0.00220
-7.6
-7.4
-7.2
-7.0
-6.8
-6.6
-6.4
-6.2
-6.0
-5.8
lnk
1/T (K-1)
Gas film diffusion control k
linear fit of k
y=7.90466-7147
R2= 0.922
Figure 5-10 Arrhenius plot for gas film diffusion control model at 1wt%Fe2O3 and 1ml/min
ligand flow rate
The activation energy predicted from this model is 59kK/mol Figure 5-10. This
activation energy is too high for a diffusion controlled process as proposed by
Habashi (1969).
From the conditions used for the modeling of the reaction, it can be concluded that
chemical reaction is limiting because the reactions are highly temperature sensitive. It
has been shown that the shrinking core model under chemical reaction control fits the
experimental data, particularly at high temperatures.

91
The values for the reaction rate constant k and activation energy calculated from the
extraction at 3wt% are shown in Appendix C. From these values the conclusion that
gas phase extraction can be modeled by the shrinking core model under chemical
reaction control no longer holds. When the mass of the oxide is increased, the surface
area effects become more important, affecting the reaction more and the chemical
reaction ceases to be the limiting factor in the reaction.
There is therefore a need to find a model that will take into account all the factors
affecting the reaction which will be able to predict the extraction at any condition.

92
6 CONCLUSIONS AND RECOMMENDATIONS
6.1 Conclusions
The aim of this investigation was to investigate the process of gas phase extraction
with the objective of predicting the operation ranges and the kinetics of the process.
Gas phase extraction of Fe showed that it is possible to extract economic yields of Fe
at relatively low temperature and in a relatively short time as compared to some other
conventional extraction processes. It was shown in the previous chapters that the time
required to obtain reasonable extraction using gas phase extraction is much shorter
than previously reported. Allimann-Lecourt et al. (1999) carried out experiments for
25hrs, whilst Hamblin and Posner (1979) carried out experiments for up to 8 days as
compared to 4hrs in this study.
The extraction data obtained from gas phase extraction was used to test various gas-
solid reaction kinetic models. The data could not be used on two models based on a
fluidized bed reactor because the data needed to be used in the models requires that
the gaseous product be continually measured which was not the method of analysis in
the current research. The process was assumed to be a chemical controlled process at
low Fe2O3 concentration (1wt %) because of the very strong dependence of the
extraction on temperature. Gas phase extraction was shown to depend on the
following variables

93
• Temperature - extraction increased as the temperature was increases for the
extraction of iron
• Ligand flow rate – extraction increased as the ligand flow rate was increased
• Surface area available for reaction – extraction increased as the surface area
available for reaction was increased
When gas phase extraction was carried out on chrome(III) oxide no appreciable
extraction took place in the amount of time chosen for the reaction to take place.
Extraction on a mixture of Fe2O3 and Cr2O3 only produced reasonable extraction for
iron, 65% whilst the extraction of chrome was still very low 14% max, Figure 4-10).
The ligand acetylacetone was shown to react preferentially with iron, resulting in iron
being extracted in mixtures where even a trace amount of iron was present. Because
of this preferential reaction, acac can be used for the beneficiation of chrome in
mixtures where both iron and chrome oxides are present.
Gas phase extraction also holds much promise for other separations, as well as
recovery of low grade metal values from ores. A further application could be to the
removal of trace amounts of impurities to upgrade metal purities. This investigation
has therefore proved the stated hypothesis: “The process of gas phase extraction is
affected by a number of other variables such as ligand flow rate other than
temperature”, absolutely correct. The additional statement that “once the effect of the
variables is known it should be possible to develop a kinetic model that can be used

94
to predict gas phase extraction of metals by ligands in fluidized beds from a variety of
materials, such as low grade ores, slags and fly ash, has also been confirmed by this
work.
6.2 Recommendations
In order to better understand the process of gas phase extraction the following could
still be done:
� Design a better experimental setup which will achieve better contacting for all
the reactants needed to carry out gas phase extraction
• Carry out more extractions with different sized Fe2O3 particles in order to be
able to predict a model for the extraction of iron which includes particle size
effects.
• The variables that greatly affect the extraction have been identified, and the
way they affect each other needs to be further investigated in order to find the
optimum operating and extraction range
• There is a need to identify other ligands which can be used to extract other
metals without extracting iron. This will then enable investigations into the
extraction of other metal oxides, for example bivalent oxides.
• Carry out extractions on real ores and ‘real samples’, e.g. fly ash and tailings
to check if comparable extraction will be obtained. In this study a mixture of
sand and pure oxides was used for the extraction; using ores will show if the
extraction can be used for practical purposes

95
REFERENCES
Allimann-Lecourt, C., Bailey, T H., Cox M., Gilby, L. M. & Robinson, J. (1999)
Extraction of heavy metals from sediments using the SERVO process. Land
Contamination & Reclamation, 7 (4), 265-269
Allimann-Lecourt, C., Bailey, T H., & Cox M. (2002) Purification of combustion fly
ashes using the SERVO process. Journal of Chemical Technology and
Biotechnology, 77, 260-26
Anthony, M., Flett, D & Wells, A. (2004) Sulphur production and usage in the
processing of non-ferrous metals. Proceedings of the Sulphur Institute’s ninth
biennial international symposium ‘Sulphur Markets – Today and Tomorrow’ London,
England, Mar 2004
Aschenbrenner, O., Kemper, S., Dahmen, N., Schaber, K. & Dinjus, E. (2007)
Solubility of β-diketonates, cyclopentadienyls, and cyclooctadiene complexes with
various metals in supercritical carbon dioxide. The Journal of Supercritical Fluids,
41, 179-186
Bai, F., Su, H. & Chang, F. (2007) A Dimeric Cerium (III) Acetylacetonate Complex
Containing Intramolecular and Intermolecular Hydrogen Bond. Chemistry Letters,
36(9), 1104-1105
Berry, J. B., Ally, M. R., Dole, R. L., Ferrada, J. J., & VanDyke, J. W. (2002) Survey
of U.S. Mineral and Metal Process Residues, [WWW]
http://www.lesdole.com/TMS2002Survey.pdf (13 March 2008)

96
Burford, M. D., Ozel, M. Z., Clifford, A. A., Bartle, K. D. Lin, Y., Wai, C. M &
Smart, N. G. (1999) Extraction and recovery of metals using a supercritical fluid with
chelating agents. The Analyst, 124, 609-614
Chaudhary, A. J., Donaldson, J. D., Grimes, S. M., Mukhtar -ul- Hassan, L &
Spencer, R. J (2000) Simultaneous recovery of heavy metals and degradation of
organic species – copper and ethylenediaminetetra-acetic acid (EDTA). Journal of
Chemical Technology and Biotechnology, 75, 353-358
Cox, M., Duke, P.W. & Gray, M.J. (1985) Extraction of Metals By The Direct
Thermal Attack of Organic Reagents. Extraction Metallurgy '85. Inst of Mining &
Metallurgy, London, pp. 33-42
Cramer, L. A. (2003) Recent trends in base metal and precious metal processing. IN
Lorenzen, L., Bradshaw, D. J., Aldrich, C., Eksteen, J. J., Wright, M., & Thom E.
(eds) Proceedings of the XXII International Mineral Processing Congress, Vol 1,
South Africa, The South African Institute of Mining and Metallurgy, 150-160
Cross, W. Jr. & Akgerman (1996) Determination of metal-chelate complex
solubilities in supercritical carbon dioxide. Industrial Engineering Chemistry
Research, 35, 1765-1770
Demopoulos, G. P., & Distin, P. A. (1985) Direct Copper Precipitation from a
Loaded Chelating Extractant by Pressure Hydrogen Stripping. Metallurgical
Transactions B 16B, 13-22
Dippenaar, R. (2004) Industrial uses of slag—The use and re-use of iron and
steelmaking slags. VII International Conference on Molten Slags Fluxes and Salts,
The South African Institute of Mining and Metallurgy, Capetown, RSA, 57-70

97
Doraiswamy, L. K. & Sharma, M. M. (1984) Heterogeneous Reactions: Analysis,
Examples and Reactor Design Vol 1: Gas-Solid and Solid-Solid reactions, New York,
John Wiley & Sons
Evans, J.W., Song, S. & Leon-Sucre, C. E. (1976) The kinetics of nickel oxide
reduction by hydrogen; measurements in a fluidised bed and in a gravimetric
apparatus. Metallurgical Transactions B, 7B, 55-65
Fogler, H. S., 1999 Elements of Chemical Reaction Engineering 3rd edition, USA,
Prentice-Hall International
Galand, N. & Wipff, G. (2005) Uranyl extraction by β-diketonate to SC-CO2:
Theoretical studies on the effect of ligand fluorination and the synergistic effect of
TBP. Journal of Physical Chemistry, 109, 277-287
Gbor, P. K. & Jia, C., Q. (2004) Critical evaluation of coupling particle size
distribution with the shrinking core model. Chemical Engineering Science, 59, 1979-
1987
Geldart, D. (1986) Introduction. IN Geldart, D. (ed) Gas Fluidization Technology,
John Wiley and Sons, Great Britain
Grace, J., R. (1986) Fluid Beds as Chemical Reactors. IN Geldart, D. (ed) Gas
Fluidization Technology, John Wiley and Sons, Great Britain
Groot, D. R. & Pistorius, P. C. (2008) Can we decrease the ecological footprint of
base metal production by recycling? Journal of the Southern African Institute of
Mining and Metallurgy, 108(3), 161-169
Habashi, F. (1969) Principles of Extractive Metallurgy Vol 1: General Principles,
New York, Gordon & Breach Science Publishers
98
Hamblin, A. P. & Posner, A. M. (1979) The use of acetyl acetone as a selective
extractant of organically bonded metals in soils. Journal of Soil Science, 30, 175-181
Hassan, S. S. M. (1984) Organic analysis using atomic absorption spectrometry,
Chichester, Ellis Horwood Limited
Kabemba, M. A (2005) Recovery of valuable metals from solid compounds by gas
phase extraction, Pretoria, Tshwane University of Technology (MSc dissertation)
Kersch, C., Witkamp, G. J. & Woerlee, G. F. (2005) Supercritical Fluid Extraction: A
Study on Metal Recovery and Regeneration of β-Diketones and Organophosphorus
Extractants. Solvent Extraction and Ion Exchange, 23(2), 189-212.
Kersch, C., van Roosmalen, M. J. E., Worlee, G. F. & Witkamp, G. J. (2000)
Extraction of heavy metals from fly ash and sand with ligands and supercritical
carbon dioxide. Industrial Engineering Chemistry Research, 39, 4670-4672
Khani, M. H., Pahlavanzadeh, H. & Ghannadi, M. (2007) Kinetics study of the
fluorination of uranium tetrafluoride in a fluidized bed reactor. Annals of Nuclear
Energy, 35, 704-707
Kondo, K., Takahashi, S., Tsuneyuki, T. & Nakashio, F. (1978) Solvent extraction of
copper by benzoyl-acetone in a stirred transfer cell. Journal of Chemical Engineering
of Japan, 11(3), 193-197
Kunii, D., & Levenspiel, O. 1991 Fluidization Engineering 2nd edition, Butterworth-
Heinemann, USA
Levenspiel, O. 1972 Chemical Reaction Engineering 2nd edition, New York, John
Wiley & Sons

99
Moffett, J. W. & Zika, R. G. (1987) Solvent extraction of copper acetylacetonate in
studies of copper (II) speciation in seawater. Marine chemistry, 21, 301-313
Mototsugu, M., Katsuhiro, T., & Takasi, N. (2005) Development of technologies for
recycling incinerator fly ash and slag Proceedings of the Global Symposium on
Recycling, Waste Treatment and Clean Technology, 26-29 Sept 2004 pg 81-89
Minerals, Metals and Materials Society, Warrendale, PA 15086, United States
Ozel, M. Z., Bartle, K. D., Clifford, A. A. & Burford, M. D. (2000) Extraction,
solubility and stability of metal complexes using stainless steel supercritical fluid
extraction system. Ananlytica Chimica Acta, 417, 177-184
Pal, B. & Sharon, M. (2000) Preparation of iron oxide thin film by metal organic
deposition from Fe(III)-acetylacetonate: a study of photocatalytic properties. Thin
Solid Films, 379, 83-88
Patisson, F. & Ablitzer, D. (2000) Modelling of Gas-Solid Reactions: Kinetics, Mass
and Heat Transfer, and Evolution of the Pore Structure. Chemical Engineering
Technology, 23 (1), 75-78
Pettinari, C., Marchetti, F., & Drozdov, A. (2004) Diketone and Related Ligands IN:
Lever, A. B P., McCleverty, J. A., & Meyer, T. J., Editors, Comprehensive
Coordination Chemistry 2, Pergamon Press, Oxford, pp.97-117
Potgieter, J. H., Kabemba, M. A., Teodorovic, A., Potgieter-Vermaak, S. S., &
Augustyn, W. G. (2005) An investigation into the feasibility of recovering valuable
metals from solid oxide compounds by gas phase extraction in a fluidised bed.
Minerals Engineering, 19, 140 -146

100
Pretorius, M. (2004) Bi- and tridentate ligands and their use in catalysis.
Johannesburg, Rand Afrikaans University (PhD thesis)
Rai, A. & Rao, D. B. N. (2005) Utilisation potentials of industrial/mining rejects and
tailings as building materials. Management of Environmental Quality, 16(6), 605-614
Ramirez-Munoz, J. (1969) Flame methods: Their development and application IN
Dean, J. A. & Rains, T. C. (Eds), Basic principles of Flame emission, atomic
absorption, and fluorescence methods, Vol 1: Theory, New York, Marcel Dekker
Rosenqvist, T. (1974) Principles of Extractive Metallurgy, New York, McGraw-Hill
Sahyoun, C. & Mason, G. (2007) Dynamics of metals industry on sulphur demand
Presented by Mason G at The Sulphur Institute (TSI) Sulphur World Symposium, on
March 26-28, 2007, Amsterdam, Netherlands
Seco, M. (1989) Acetyl acetone: A versatile Ligand. Journal of Chemical Education,
66(9), 779-780
Siddiqi, M. A., Siddiqui, R. A. & Atakan, B. (2007) Thermal stability, sublimation
pressures and diffusion coefficients of some metal acetylacetonates. Surface &
Coatings Technology, 201, 9055-9059
Siedle, A. R. (1987) Diketone and Related Ligands IN Wilkinson, G., Gillard R. D. &
McCleverty, J. A. (Eds), Comprehensive Coordination Chemistry 2: Ligands,
Pergamon Press, Oxford, 365-412
Sievers, R. E. & Sadlowski, J. E. (1978) Volatile metal complexes. Science, 201
(4352) 217-223
Szafran, Z., Pike, R. M. & Singh, M. M. (1991) Microscale Inorganic Chemistry,
Wiley & Sons, New York
101
Szekely, J., Evans, J. W. & Sohn, H.Y. (1976) Gas-Solid Reactions, New York,
Academic Press
Takeshita, Y., Sato, Y. & Nishi, S. (2000) Study of Extraction from CCA-Treated
Wood with Supercritical CO2 Containing Acetylacetone: Extraction of Cu by
Continuous Addition of Acetylacetone. Industrial Chemical Resources, 39, 4496-
4499
Welz, B. (1985) Atomic Absorption Spectrometry. 2nd edition, Germany, VCH
Verlagsgesellschaft mbH
Wen, C. Y. (1968) Noncatalytic heterogeneous solid-fluid reaction models Industrial
and Engineering Chemistry Research, 60 (9), 34-54
Wesley, R. J. (1985) Complex Sulfides: New Technology and Opportunities IN
Zunkel, A. D., Boorman, R. S., Morris, A. E. & Wesley, R. J. (eds), Complex
Sulfides Processing of Ores, Concentrates and By-Products, The Metallurgical
Society, Inc, USA
Willis, A. L., Chen, Z., He, J., Zhu, Y., Turro, N. J. & O’Brien, S. (2007) Metal
acetylacetonates as general precursors for the synthesis of early transition metal oxide
nanomaterials. Journal of Nanomaterials, 1-7

102
APPENDIX A
Parameters for the experimental setup
Minimum fluidization velocity at the reactor operating condition
The minimum fluidization for the process was calculated using Equation 2-11 and
Equation 2-12 with the following parameters
dp=64µm, ρp=2638kg/m3, ρg=1.146kg/m3, µg=17.81cP,
g=9.81m/s
( )
( )
3
2
6 3
6 2
(64*10 ) *1.146 2638 1.146 *9.81
(17.81*10 )
24.499
p g p gd gAr
ρ ρ ρ
µ−
−
−=
−=
=
( )
( )
12 2
12 2
Re, 33.7 0.0494 33.7
33.7 0.0494*24.494 33.7
0.01795
mf Ar = + −
= + −
=
6
6
Re, 0.01795
0.01795*17.81*10
64*10 *1.146
0.004359 /
0.4359 /
p mf g
mf
mf
d u
u
m s
cm s
ρ
µ−
−
= =
⇒ =
=
=
The minimum flow rate to achieve Umf is
103
( )2
3
3
*
2.50.4359* *2
2.14
128.4min
mfQ u A
cms
cm
π
=
=
=
=
It is assumed the ligand expands so much that its flow rate into the FBR is higher
than the minimum fluidization velocity calculated above.

104
APPENDIX B
Material Safety Data Sheets
Material Safety Data Sheet IRON(III) OXIDE,
HAZARDS IDENTIFICATION
Irritating to eyes, respiratory system and skin.
COMPOSITION/INFORMATION ON INGREDIENTS
Product Name FERRIC OXIDE CAS Index NO.: 1309-37-1 215-168-2
Formula Fe2O3 Molecular Weight 159.69 AMU
FIRST AID MEASURES
After inhalation: If inhaled, remove to fresh air. If not breathing give artificial
respiration. If breathing is difficult, give oxygen.
After skin contact: In case of contact, immediately wash skin with soap and copious
amounts of water.
After eye contact: In case of contact, immediately flush eyes with copious amounts
of water for at least 15 minutes.
After ingestion: If swallowed, wash out mouth with water provided person is
conscious. Call a physician.
FIRE FIGHTING MEASURES
Extinguishing media: Suitable: Noncombustible. Use extinguishing media
appropriate to surrounding fire conditions.
Special risks: Specific Hazard(s): Emits toxic fumes under fire conditions.
Special protective equipment for firefighters: Wear self-contained breathing
apparatus and protective clothing to prevent contact with skin and eyes.

105
ACCIDENTAL RELEASE MEASURES
Procedure of personal precaution(s): Wear respirator, chemical safety goggles,
rubber boots, and heavy rubber gloves.
Methods for cleaning up: Sweep up, place in a bag and hold for waste disposal.
Avoid raising dust. Ventilate area and wash spill site after material pickup is
complete.
HANDLING AND STORAGE
Directions for Safe Handling: Do not breathe dust. Avoid contact with eyes, skin,
and clothing. Avoid prolonged or repeated exposure.
Storage: Conditions of Storage: Keep tightly closed.
EXPOSURE CONTROLS / PERSONAL PROTECTION
Engineering controls: Safety shower and eye bath. Mechanical exhaust required.
General hygiene measures: Wash thoroughly after handling.
Respiratory Protection: Use respirators and components tested and approved under
appropriate government.
Hand Protection: Compatible chemical-resistant gloves.
Eye Protection: Chemical safety goggles.
PHYSICAL AND CHEMICAL PROPERTIES
Appearance Physical State: Solid MP/MP Range 1,538 °C
SG/Density 5.12 g/cm3 Solubility in Water: Insoluble.
Other Solvents: hydrochloric acid, sulfuric acid slightly soluble
STABILITY AND REACTIVITY
Stability: Stable
Materials to Avoid: Strong acids, Peroxides, Chloroformates.
HAZARDOUS DECOMPOSITION PRODUCTS
Hazardous Decomposition Products: Nature of decomposition products not known.

106
Material Safety Data Sheet CHROMIUM(III) OXIDE
HAZARDS IDENTIFICATION
This substance is not classified as dangerous according to Directive 67/548/EEC.
COMPOSITION/INFORMATION ON INGREDIENTS
Formula: Cr2O3 Molecular Weight: 151.99 g/mol
FIRST AID MEASURES
If inhaled: If breathed in, move person into fresh air. If not breathing give artificial
respiration
In case of skin contact: Wash off with soap and plenty of water.
In case of eye contact: Flush eyes with water as a precaution.
If swallowed: Never give anything by mouth to an unconscious person. Rinse mouth
with water.
FIRE-FIGHTING MEASURES
Suitable extinguishing media: Use water spray, alcohol-resistant foam, dry
chemical or carbon dioxide.
Special protective equipment for fire-fighters: Wear self contained breathing
apparatus for fire fighting if necessary.
ACCIDENTAL RELEASE MEASURES
Personal precautions: Avoid dust formation.
Methods for cleaning up: Sweep up and shovel. Keep in suitable, closed containers
for disposal.
HANDLING AND STORAGE
Handling: Provide appropriate exhaust ventilation at places where dust is formed.
Normal measures for preventive fire protection.
Storage: Store in cool place. Keep container tightly closed in a dry and well-
ventilated place. Hygroscopic- Handle and store under inert gas.

107
EXPOSURE CONTROLS/PERSONAL PROTECTION
Respiratory protection: Respiratory protection is not required. Where protection
from nuisance levels of dusts are desired use dust masks. Use respirators and
components tested and approved under appropriate government standards
Hand protection: For prolonged or repeated contact use protective gloves.
Eye protection: Safety glasses
Hygiene measures: General industrial hygiene practice.
PHYSICAL AND CHEMICAL PROPERTIES
Density 5,210 g/cm3 Water solubility: no data available
STABILITY AND REACTIVITY
Storage stability: Stable under recommended storage conditions.
Conditions to avoid: Avoid moisture.
Materials to avoid: Strong oxidizing agents
Hazardous decomposition products: Hazardous decomposition products formed
under fire conditions. - Chromium oxides
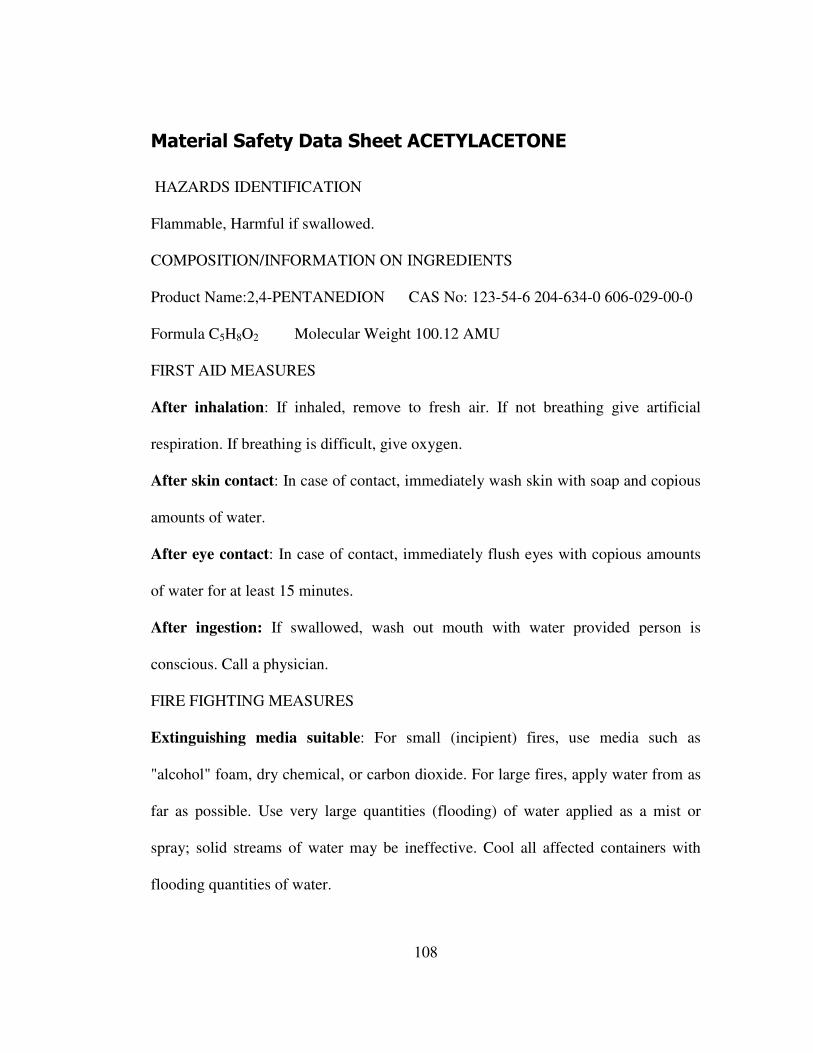
108
Material Safety Data Sheet ACETYLACETONE
HAZARDS IDENTIFICATION
Flammable, Harmful if swallowed.
COMPOSITION/INFORMATION ON INGREDIENTS
Product Name:2,4-PENTANEDION CAS No: 123-54-6 204-634-0 606-029-00-0
Formula C5H8O2 Molecular Weight 100.12 AMU
FIRST AID MEASURES
After inhalation: If inhaled, remove to fresh air. If not breathing give artificial
respiration. If breathing is difficult, give oxygen.
After skin contact: In case of contact, immediately wash skin with soap and copious
amounts of water.
After eye contact: In case of contact, immediately flush eyes with copious amounts
of water for at least 15 minutes.
After ingestion: If swallowed, wash out mouth with water provided person is
conscious. Call a physician.
FIRE FIGHTING MEASURES
Extinguishing media suitable: For small (incipient) fires, use media such as
"alcohol" foam, dry chemical, or carbon dioxide. For large fires, apply water from as
far as possible. Use very large quantities (flooding) of water applied as a mist or
spray; solid streams of water may be ineffective. Cool all affected containers with
flooding quantities of water.

109
SPECIAL RISKS
Specific Hazard(s): Vapour may travel considerable distance to source of ignition
and flash back.
Explosion Hazards: Vapour may travel considerable distance tosource of ignition
and flash back. Container explosion may occur under fire conditions. Forms
explosive mixtures in air.
Special protective equipment for fire fighters: Wear self-contained breathing
apparatus and protective clothing to prevent contact with skin and eyes.
Specific method(s) of fire fighting: Use water spray to cool fire-exposed containers.
Accidental Release Measures
Personal precaution procedures to be followed in case of leak or spill: Evacuate
area. Shut off all sources of ignition.
Procedure of personal precaution(s): Wear respirator, chemical safety goggles,
rubber boots, and heavy rubber gloves.
Methods for cleaning up: Absorb on sand or vermiculite and place in closed
containers for disposal. Ventilate area and wash spill site after material pickup is
complete.
HANDLING AND STORAGE
Handling: Directions for Safe Handling: Do not breathe vapour. Avoid contact with
eyes, skin, and clothing. Avoid prolonged or repeated exposure.
Storage: Conditions of Storage: Keep tightly closed. Keep away from heat, sparks,
and open flame.

110
EXPOSURE CONTROLS / PERSONAL PROTECTION
Engineering controls: Use only in a chemical fume hood. Safety shower and eye
bath. Use non-sparking tools.
General hygiene measures: Wash thoroughly after handling.
Personal protective equipment: Respiratory Protection: Use respirators and
components tested and approved under appropriate government standards. If the
respirator is the sole means of protection, use a full-face supplied air respirator.
Hand Protection: Compatible chemical-resistant gloves.
Eye Protection: Chemical safety goggles.
PHYSICAL AND CHEMICAL PROPERTIES
Appearance Physical State: Liquid BP/BP Range 136.0 - 138.0 °C
Flash Point 38 °C Auto ignition Temp 350 °C
Explosion Limits Lower: 1.7 % Upper: 11.4 %
Vapour Pressure 2.96 mmHg SG/Density 0.972 g/cm3
Vapour Density 3.5 g/l Surface Tension 31.2 mN/m 20 °C
Other Solvents: alcohol, ether, chloroform, acetone
Miscible with: glacial acetic acid, benzene
STABILITY AND REACTIVITY
Stability: Stable.
Materials to Avoid: Strong oxidizing agents, Reducing agents, Strong bases, Metals.

111
Material Safety Data Sheet ETHANOL
HAZARDS IDENTIFICATION
Highly flammable.
COMPOSITION/INFORMATION ON INGREDIENTS
Synonyms : Ethyl alcohol CAS-No.64-17-5 200-578-6 603-002-00-5 F, R11 -
Formula : C2H6O Molecular Weight : 46,07 g/mol
FIRST AID MEASURES
General advice: Consult a physician. Show this safety data sheet to the doctor in
attendance.
If inhaled: If breathed in, move person into fresh air. If not breathing give artificial
respiration Consult a physician.
In case of skin contact: Wash off with soap and plenty of water. Consult a
physician.
In case of eye contact: Flush eyes with water as a precaution.
If swallowed: Do NOT induce vomiting. Never give anything by mouth to an
unconscious person. Rinse mouth with water. Consult a physician.
FIRE-FIGHTING MEASURES
Suitable extinguishing media: For small (incipient) fires, use media such as
"alcohol" foam, dry chemical, or carbon dioxide. For large fires, apply water from as
far as possible. Use very large quantities (flooding) of water applied as a mist or
spray; solid streams of water may be ineffective. Cool all affected containers with
flooding quantities of water.

112
Special protective equipment for fire-fighters: Wear self contained breathing
apparatus for fire fighting if necessary.
ACCIDENTAL RELEASE MEASURES
Personal precautions: Avoid breathing vapours, mist or gas. Ensure adequate
ventilation. Remove all sources of ignition. Evacuate personnel to safe areas. Beware
of vapours accumulating to form explosive concentrations.
Environmental precautions: Prevent further leakage or spillage if safe to do so. Do
not let product enter drains.
Methods for cleaning up: Contain spillage, and then collect with non-combustible
absorbent material, (e.g. sand, earth, diatomaceous earth, vermiculite) and place in
container for disposal according to local / national regulations
HANDLING AND STORAGE
Handling: Avoid inhalation of vapour or mist. Keep away from sources of ignition -
No smoking. Take measures to prevent the build up of electrostatic charge.
Storage: Store in cool place. Keep container tightly closed in a dry and well-
ventilated place. Containers which are opened must be carefully resealed and kept
upright to prevent leakage. Hygroscopic
EXPOSURE CONTROLS/PERSONAL PROTECTION
Personal protective equipment: Respiratory protection where risk assessment
shows air-purifying respirators are appropriate use a full-face respirator with
multipurpose combination or respirator cartridges as a backup to engineering
controls. If the respirator is the sole means of protection, use a full-face supplied air
respirator.

113
Hand protection: Handle with gloves.
Eye protection: Safety glasses
Skin and body protection: Choose body protection according to the amount and
concentration of the dangerous substance at the work place.
Hygiene measures: Handle in accordance with good industrial hygiene and safety
practice. Wash hands before breaks and at the end of workday.
PHYSICAL AND CHEMICAL PROPERTIES
Appearance: Form liquid, clear Colour: colourless
Melting point -144,0 °C Boiling point 78,0 - 80,0 °C Flash point 14,0 °C
Ignition temp 363 °C Lower explosion limit 3,3 %(V) Upper limit 19 %(V)
Vapour pressure 59,5 hPa at 20,0 °C Density 0,79 g/cm3
Water solubility completely soluble
STABILITY AND REACTIVITY
Storage stability:Stable under recommended storage conditions. Conditions to
avoid- Heat, flames and sparks. Materials to avoid- Alkali metals, Ammonia,
Oxidizing agents, Peroxides
Hazardous decomposition products: Hazardous decomposition products formed
under fire conditions. - None known.
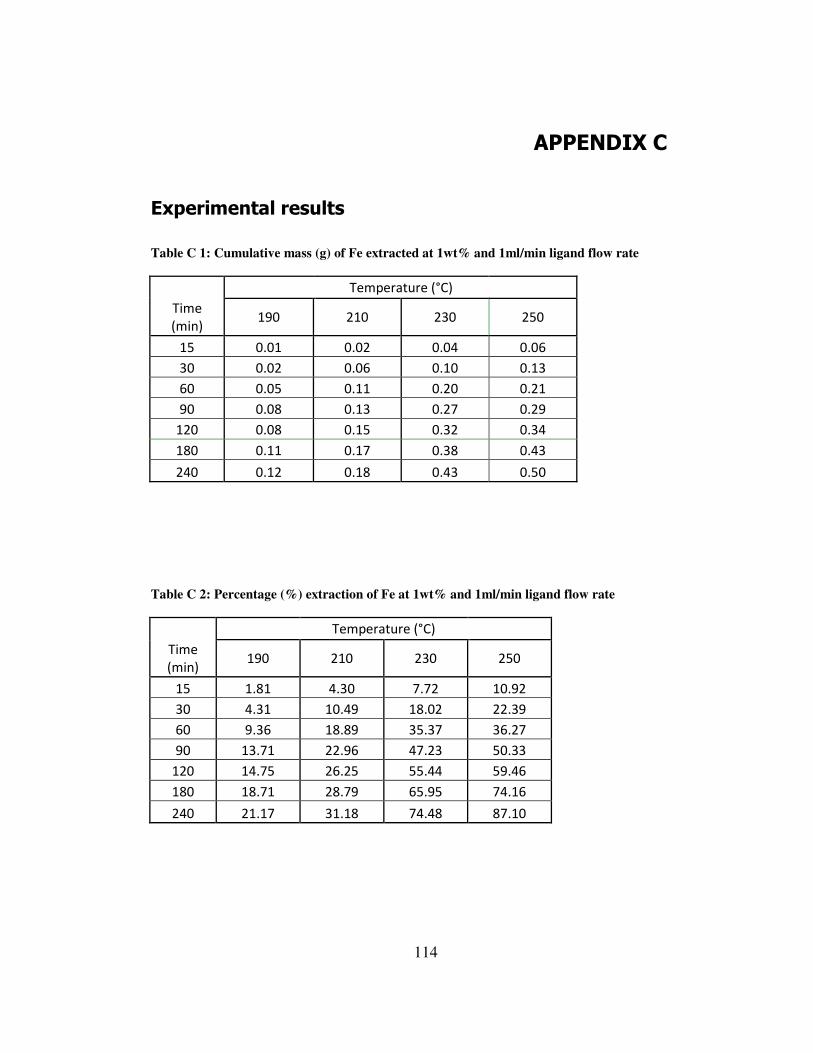
114
APPENDIX C
Experimental results
Table C 1: Cumulative mass (g) of Fe extracted at 1wt% and 1ml/min ligand flow rate
Temperature (°C)
Time
(min) 190 210 230 250
15 0.01 0.02 0.04 0.06
30 0.02 0.06 0.10 0.13
60 0.05 0.11 0.20 0.21
90 0.08 0.13 0.27 0.29
120 0.08 0.15 0.32 0.34
180 0.11 0.17 0.38 0.43
240 0.12 0.18 0.43 0.50
Table C 2: Percentage (%) extraction of Fe at 1wt% and 1ml/min ligand flow rate
Temperature (°C)
Time
(min) 190 210 230 250
15 1.81 4.30 7.72 10.92
30 4.31 10.49 18.02 22.39
60 9.36 18.89 35.37 36.27
90 13.71 22.96 47.23 50.33
120 14.75 26.25 55.44 59.46
180 18.71 28.79 65.95 74.16
240 21.17 31.18 74.48 87.10

115
Table C 3: Cumulative mass (g) of Fe extracted at 3wt% and 1ml/min ligand flow rate
Temperature (°C)
Time
(min) 190 210 230 250
15 0.02 0.04 0.03 0.06
30 0.06 0.10 0.10 0.14
60 0.13 0.21 0.25 0.27
90 0.19 0.28 0.40 0.38
120 0.26 0.35 0.53 0.48
180 0.35 0.42 0.62 0.62
240 0.40 0.47 0.66 0.77
Table C 4: Percentage (%) extraction of Fe at 3wt% and 1ml/min ligand flow rate
Temperature (°C)
Time
(min) 190 210 230 250
15 1.88 2.75 2.30 4.72
30 5.05 7.85 7.78 10.98
60 10.44 16.15 19.34 21.44
90 15.17 22.19 31.12 30.01
120 20.23 27.25 41.94 37.57
180 27.43 33.04 48.72 48.87
240 31.31 37.13 51.40 60.34
Table C 5: Cumulative mass (g) of Fe extracted at 10wt% and 1ml/min ligand flow rate
Temperature (°C)
Time
(min) 190 210 230 250
15 0.02 0.04 0.01 0.03
30 0.06 0.11 0.09 0.16
60 0.13 0.23 0.21 0.33
90 0.21 0.33 0.36 0.47
120 0.28 0.41 0.47 0.61
180 0.43 0.56 0.67 0.86
240 0.59 0.72 0.82 1.11

116
Table C 6: Percentage (wt%) extraction of Fe at 10wt% and 1ml/min ligand flow rate
Temperature (°C)
Time
(min) 190 210 230 250
15 0.51 1.11 0.30 0.89
30 1.62 2.96 2.41 4.37
60 3.58 6.26 6.08 8.90
90 5.53 8.88 9.58 12.74
120 7.61 10.98 12.67 16.46
180 12.30 15.00 17.94 23.07
240 15.79 19.41 22.08 29.74
Table C 7: Extraction of Fe at 250°C and 3ml/min
Time
(min) 3wt% 10wt%
Cum mass
(g)
%
extraction
Cum mass
(g)
%
extraction
15 0.20 15.71 0.26 7.01
30 0.35 27.14 0.55 14.76
60 0.52 41.12 0.93 25.00
90 0.67 52.85 1.21 32.58
120 0.83 65.35 1.43 38.42
180 0.83 - 1.75 47.11
240 0.83 - 2.18 58.68

117
Table C 8: Extraction of Cr at 210°C and 3ml/min from a mixture containing Fe & Cr oxides
Time
(min) 3wt% 5wt%
Cum mass
(g)
%
extraction
Cum mass
(g)
%
extraction
15 0.0067 0.65 0.01 0.39
30 0.014 1.35 0.01 0.81
60 0.026 2.56 0.03 1.54
90 0.036 3.49 0.04 2.10
120 0.047 4.60 0.05 2.76
180 0.066 6.40 0.07 3.84
240 0.085 8.30 0.09 4.98
Table C 9: Extraction of Fe at 210°C and 3ml/min from a mixture containing Fe & Cr oxides
Time
(min) 3wt% 5wt%
Cum mass
(g)
%
extraction
Cum mass
(g)
%
extraction
15 0.188 9.53 0.11 5.77
30 0.355 17.98 0.25 12.62
60 0.565 28.64 0.44 22.47
90 0.719 36.42 0.59 29.93
120 0.849 42.99 0.74 37.27
180 1.074 54.41 0.97 48.97
240 1.285 65.07 1.18 59.68

118
Table C 10: Extraction of Cr from a 3wt% mixture at 3ml/min ligand flow rate, no Fe2O3
Time
(min) 210°C 250°C
Cum mass
(g)
%
extraction
Cum mass
(g)
%
extraction
15 0.006 0.58 0.008 0.8
30 0.016 1.54 0.014 1.36
60 0.03 2.92 0.024 2.31
90 0.049 4.73 0.037 3.57
120 0.066 6.44 0.044 4.33
180 0.097 9.44 0.069 6.71
240 0.13 12.78 0.094 9.15
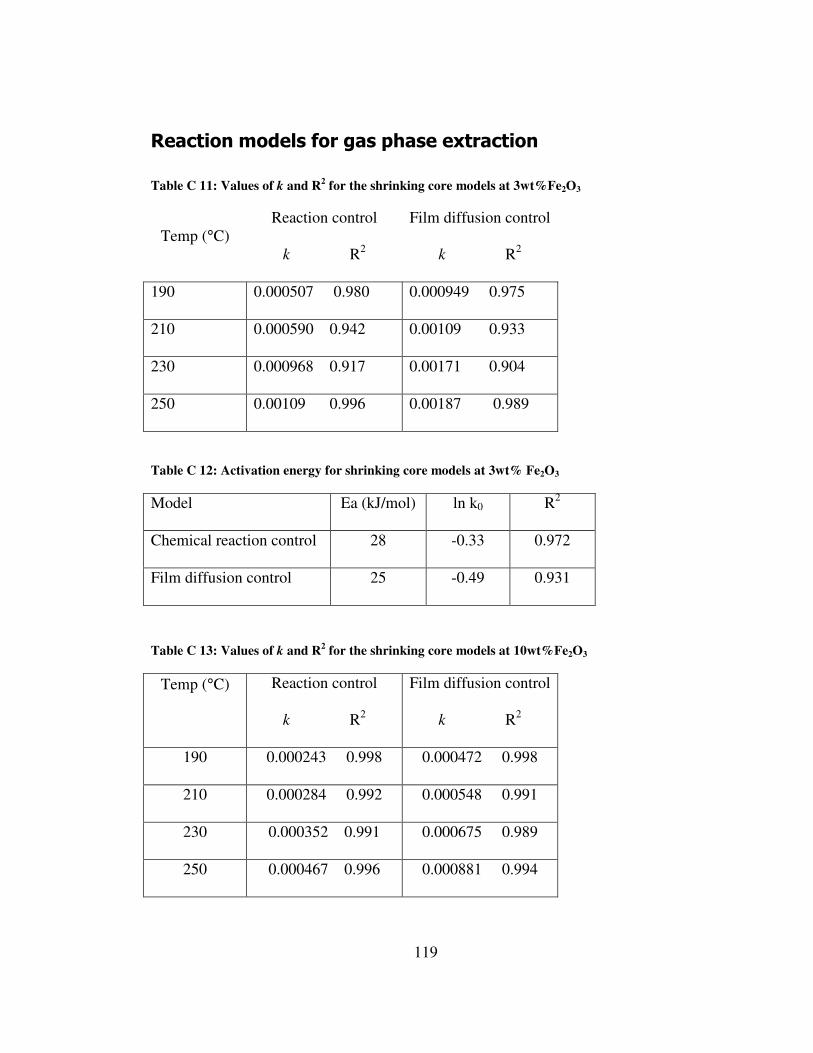
119
Reaction models for gas phase extraction
Table C 11: Values of k and R2 for the shrinking core models at 3wt%Fe2O3
Temp (°C) Reaction control
k R2
Film diffusion control
k R2
190 0.000507 0.980 0.000949 0.975
210 0.000590 0.942 0.00109 0.933
230 0.000968 0.917 0.00171 0.904
250 0.00109 0.996 0.00187 0.989
Table C 12: Activation energy for shrinking core models at 3wt% Fe2O3
Model Ea (kJ/mol) ln k0 R2
Chemical reaction control 28 -0.33 0.972
Film diffusion control 25 -0.49 0.931
Table C 13: Values of k and R2 for the shrinking core models at 10wt%Fe2O3
Temp (°C) Reaction control
k R2
Film diffusion control
k R2
190 0.000243 0.998 0.000472 0.998
210 0.000284 0.992 0.000548 0.991
230 0.000352 0.991 0.000675 0.989
250 0.000467 0.996 0.000881 0.994

120
Table C 14: Activation energy for shrinking core models at 10wt% Fe2O3
Model Ea (kJ/mol) ln k0 R2
Chemical reaction control 22 -2.70 0.973
Film diffusion control 20 -2.29 0.974
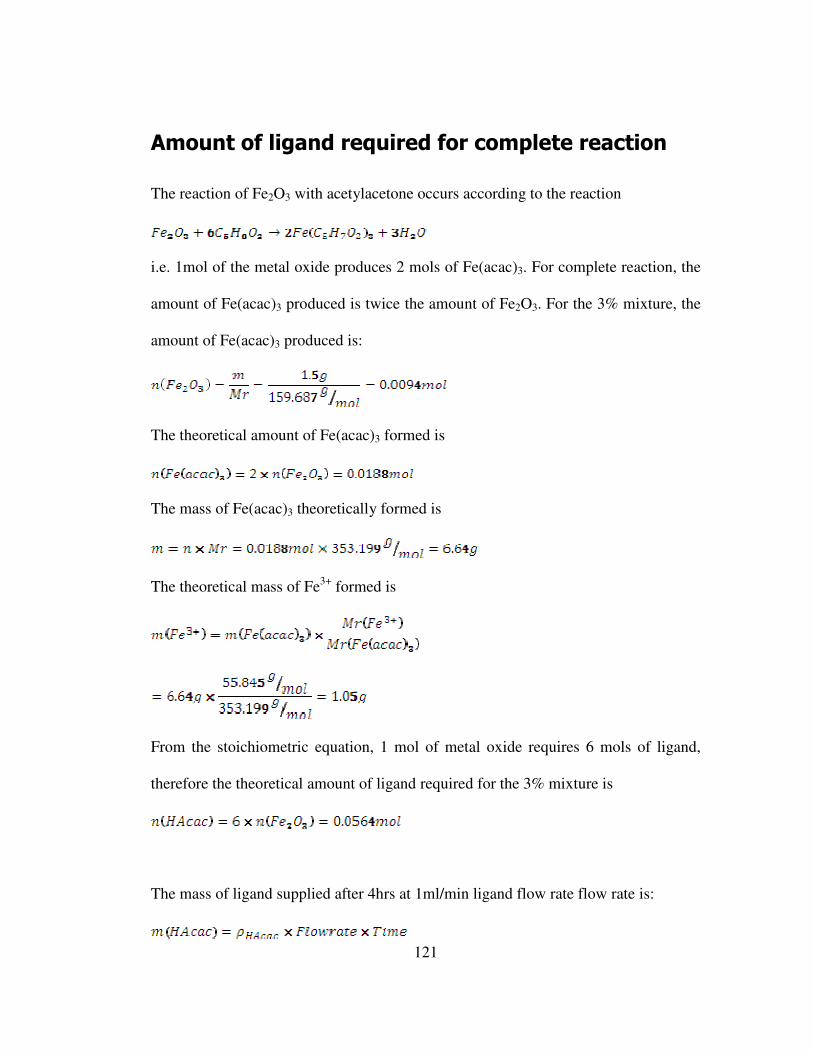
121
Amount of ligand required for complete reaction
The reaction of Fe2O3 with acetylacetone occurs according to the reaction
i.e. 1mol of the metal oxide produces 2 mols of Fe(acac)3. For complete reaction, the
amount of Fe(acac)3 produced is twice the amount of Fe2O3. For the 3% mixture, the
amount of Fe(acac)3 produced is:
The theoretical amount of Fe(acac)3 formed is
The mass of Fe(acac)3 theoretically formed is
The theoretical mass of Fe3+ formed is
From the stoichiometric equation, 1 mol of metal oxide requires 6 mols of ligand,
therefore the theoretical amount of ligand required for the 3% mixture is
The mass of ligand supplied after 4hrs at 1ml/min ligand flow rate flow rate is:
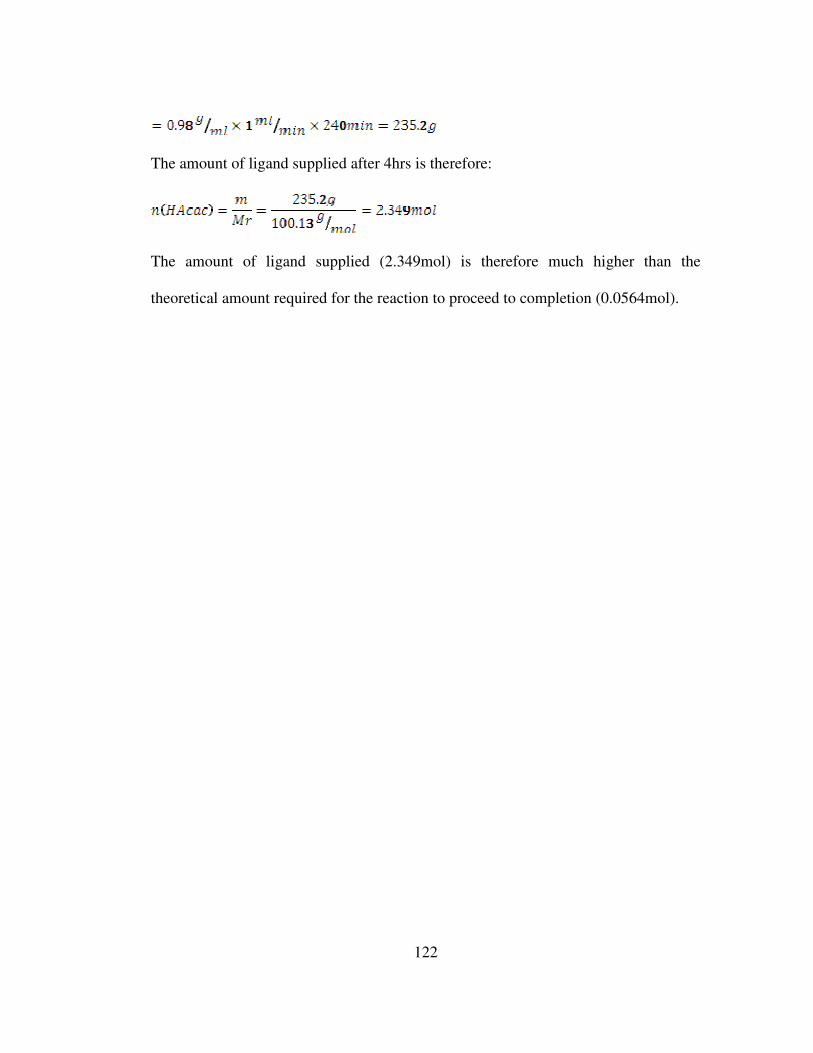
122
The amount of ligand supplied after 4hrs is therefore:
The amount of ligand supplied (2.349mol) is therefore much higher than the
theoretical amount required for the reaction to proceed to completion (0.0564mol).

123
APPENDIX D
Contributions
The following contributions to conferences and journals have originated from this
work:
VanDyk, L., Mariba, E. R. M., Chen, Y., & Potgieter, J. H. (2010) Gas Phase
Extraction of Iron from its Oxide in a Fluidized Bed Reactor. Minerals Engineering,
23, 58-60
Mariba, E. R. M., VanDyk, L. & Potgieter, J. H., (2009) Iron extraction from iron
(III) oxide using acetylacetone in the gas phase: Effect of reaction variables. Poster
presented at the School of Chemical and Metallurgical Engineering Poster day, Wits
University, Johannesburg, 6 Nov 2009

124