recent population decline of the marbled murrelet in the
TRANSCRIPT
Recent Population Decline of the Marbled Murrelet in the Pacific Northwest (DisminuciónReciente de la Población de Brachyramphus marmoratus en el Noroeste Pacífico de Norteamérica)Author(s): Sherri L. Miller, Martin G. Raphael, Gary A. Falxa, Craig Strong, Jim Baldwin,Thomas Bloxton, Beth M. Galleher, Monique Lance, Deanna Lynch, Scott F. Pearson, C. JohnRalph and Richard D. YoungReviewed work(s):Source: The Condor, Vol. 114, No. 4 (November 2012), pp. 771-781Published by: University of California Press on behalf of the Cooper Ornithological SocietyStable URL: http://www.jstor.org/stable/10.1525/cond.2012.110084 .
Accessed: 05/12/2012 08:36
Your use of the JSTOR archive indicates your acceptance of the Terms & Conditions of Use, available at .http://www.jstor.org/page/info/about/policies/terms.jsp
.JSTOR is a not-for-profit service that helps scholars, researchers, and students discover, use, and build upon a wide range ofcontent in a trusted digital archive. We use information technology and tools to increase productivity and facilitate new formsof scholarship. For more information about JSTOR, please contact [email protected].
.
University of California Press and Cooper Ornithological Society are collaborating with JSTOR to digitize,preserve and extend access to The Condor.
http://www.jstor.org
This content downloaded by the authorized user from 192.168.52.68 on Wed, 5 Dec 2012 08:36:58 AMAll use subject to JSTOR Terms and Conditions
771
The Condor 114(4):771–781 The Cooper Ornithological Society 2012
9E-mail: [email protected] Manuscript received 8 June 2011; accepted 18 April 2012.
The Condor, Vol. 114, Number 4, pages 771–781. ISSN 0010-5422, electronic ISSN 1938-5422. 2012 by The Cooper Ornithological Society. All rights reserved. Please direct all requests for permission to photocopy or reproduce article content through the University of California Press’s Rights and Permissions website, http://www.ucpressjournals.com/reprintInfo.asp. DOI: 10.1525/cond.2012.110084
RECENT POPUlATION DEClINE Of ThE MARblED MURRElET IN ThE PACIfIC NORThwEST
Sherri L. MiLLer1,9, Martin G. raphaeL2, Gary a. FaLxa3, CraiG StronG4, JiM BaLdwin5, thoMaS BLoxton2, Beth M. GaLLeher2, Monique LanCe6, deanna LynCh7, SCott F. pearSon6,
C. John raLph1, and riChard d. younG8 1USDA Forest Service, Pacific Southwest Research Station, Redwood Sciences Laboratory, 1700 Bayview Drive, Arcata CA 95521
2USDA Forest Service, Pacific Northwest Research Station, 3625 93rd Ave. SW, Olympia WA 985123U.S. Fish and Wildlife Service, Arcata Fish and Wildlife Office, 1655 Heindon Rd., Arcata, CA 95521
4Crescent Coastal Research, P. O. Box 2108, Crescent City, CA 95531 5USDA Forest Service, Pacific Southwest Research Station, 800 Buchanan Street, West Annex Building, Albany, CA 94710
6Washington Department of Fish and Wildlife, 1111 Washington St. SE, Olympia, WA 985017U.S. Fish and Wildlife Service, Washington Fish and Wildlife Office, Division of Listing and Recovery,
510 Desmond Dr., Suite 102, Lacey, WA 98503 8U.S. Fish and Wildlife Service, Pacific Regional Office, Ecological Services, 911 NE 11th Ave., Portland, OR 97232
Abstract. we document here a decline of nearly 30% in the Marbled Murrelet (Brachyramphus marmoratus) population of washington, Oregon, and northern California between 2000 and 2010. The Northwest forest Plan is an ecosystem-management plan for federal forest lands in the Pacific Northwest of the United States that incorpo-rates monitoring to determine if species’ conservation objectives are met. To evaluate the plan’s effectiveness in conserving populations of the murrelet, a species associated with older, late-successional forests, we estimated the murrelet’s density in near-shore marine waters of washington, Oregon, and northern California south to San fran-cisco bay. we sampled annually, using line transects and distance estimation. we divided the study area of about 8800 km2 into five geographic subareas corresponding to existing murrelet-conservation zones. Annual popula-tion estimates for the plan ranged from an estimated 23 700 (95% CI: 18 300 to 29 000) birds in 2002 to a low of 16 700 (95% CI: 13 100 to 20 300) in 2010, representing an average rate of decline of 3.7% annually (95% CI: –4.8 to –2.7%) from 2001 to 2010. This annual rate suggests a total decline of about 29% during this period. we docu-mented downward trends for washington (conservation zone 1) and for the outer coast of washington (conserva-tion zone 2). These declines coincide with reductions in the amount of nesting habitat. further research to evaluate the potential marine and terrestrial factors responsible for the declines is planned.
Key words: brachyramphus marmoratus, Marbled Murrelet, Northwest Forest Plan, old-growth forest, population decline, population trends, seabird.
Disminución Reciente de la Población de Brachyramphus marmoratus en el Noroeste Pacífico de Norteamérica
Resumen. Documentamos aquí una disminución de casi el 30% de la población de Brachyramphus marmoratus) de washington, Oregón y el norte de California entre 2000 y 2010. El Plan forestal del Noroeste es un plan de gestión de los ecosistemas boscosos federales del noroeste pacífico de los Estados Unidos que incorpora el monitoreo para de-terminar si los objetivos de conservación de especies se cumplen. Para evaluar la efectividad del Plan en la conserva-ción de las poblaciones de B. marmoratus, una especie asociada con bosques maduros de estadios sucesionales tardíos, se estimó la densidad anual de la especie cercana a la costa en las aguas marinas de washington, Oregón y el norte de California al sur a la bahía de San francisco. Se realizaron muestreos anuales a partir del 2000 hasta el 2010 utilizando transectas lineales y estimaciones de distancia. El área muestreada de aproximadamente 8800 km2 fue dividida en cinco subáreas geográficas correspondientes a las actuales zonas de conservación de la especie. las estimaciones anuales de la población para el Plan van desde un estimado de 23 700 aves (95% IC: 18 300 – 29 000) en 2002 a la estimación más baja, de 16 700 (95% IC: 13 100 – 20 300) en 2010. Se evaluaron las tendencias poblacionales de la zona del Plan (todas las cinco zonas combinadas) y para cada zona. Se encontró una disminución de la población para el área del Plan, con una tasa estimada promedio de disminución anual del 3.7% (95% IC: -4.8 a -2.7%) para el período del 2001 al 2010. Esta tasa anual indica una disminución total de alrededor de 29% durante este período. hemos documentado una tendencia descendente para el norte de washington (zona de conservación 1), que incluye el Estrecho de Puget, las Islas San Juan y el Estrecho de Juan de fuca, y para la costa exterior de washington (zona de conservación 2). Estos descensos obser-vados coinciden con las reducciones en la cantidad de hábitat de nidificación. Se planean realizar investigaciones futuras para evaluar los factores potenciales marinos y terrestres responsables de los descensos.
This content downloaded by the authorized user from 192.168.52.68 on Wed, 5 Dec 2012 08:36:58 AMAll use subject to JSTOR Terms and Conditions
772 ShERRI l. MIllER et aL.
INTRODUCTION
The Marbled Murrelet (Brachyramphus marmoratus) is a small seabird that spends most of its time foraging in coastal waters of the eastern Pacific Ocean, from central California to the Aleutian Islands. Unlike most seabirds, however, the murrelet flies up to 50 km inland to nest (Nelson 1997). In most of its range, it is strongly associated with late-successional and old-growth forests, nesting mostly on large branches or other suitable platforms in large trees (Ralph et al. 1995, McShane et al. 2004, Piatt et al. 2007). largely because of timber harvest-ing, only a small percentage (5 to 20%, depending on region) of original old-growth coastal forest remains in the Pacific North-west south of Canada (Morrison 1988, Norheim 1996, 1997, Strittholt et al 2006), mostly in relatively small, fragmented patches or in forest parks and reserves.
In 1992, the Marbled Murrelet was listed as threatened in washington, Oregon, and California under the federal En-dangered Species Act. Degradation of habitat from logging, exacerbated by catastrophes including fire and wind storms, were the primary factors contributing to its listing (USfwS 1992). In the three-state area, murrelet populations continued to decline after listing (McShane et al. 2004, Strong 2003, US-fwS 2009). The small isolated population at the southern end of the species’ range in central California appears to be at risk for further decline (Peery et al. 2006). In the northern por-tion of its range, where it is most numerous, the species ap-pears to have declined in Alaska by about 70% over a period of 25 years, with similar declines likely in british Columbia (burger 2002, Piatt et al. 2007).
Although declines of Marbled Murrelet populations have been predicted by demographic models (USfwS 1997, Mc-Shane et al. 2004) and suggested by field observations, ours is the first robust assessment of population size and trends for the species’ range south of Canada. This assessment is part of a program to monitor the effectiveness of a forest-management plan, the Northwest forest Plan (the Plan), to conserve mur-relet populations. Established in 1994, the Plan represented a major change in how federal forest lands are managed in west-ern washington, Oregon, and northwestern California, taking an ecosystem approach to the management of about 10 million hectares of federal lands. One objective of the Plan is to sup-port stable or increasing populations of the Marbled Murrelet by conserving nesting habitat.
Conservation of the Marbled Murrelet requires knowl-edge of the status and trends of both populations and nest-ing habitat and of interactions between the two (Ralph et al. 1995, USfwS 1997, Raphael 2006, Piatt et al. 2007); the Plan monitors both (Madsen et al. 1999). Nesting habitat is moni-tored by combining ground-based data with remote imagery to model habitat conditions and trends (Raphael et al. 2011). because murrelets are cryptic at their nests and individuals cannot be reliably counted in the forest, population size and trends are best estimated by monitoring at sea (Madsen et al.
1999, Miller et al. 2006, Raphael et al. 2007). Our paper pres-ents results of murrelet population monitoring from 2000 to 2010 in the coastal waters off the Northwest forest Plan area.
METhODS
SAMPlINg DESIgN
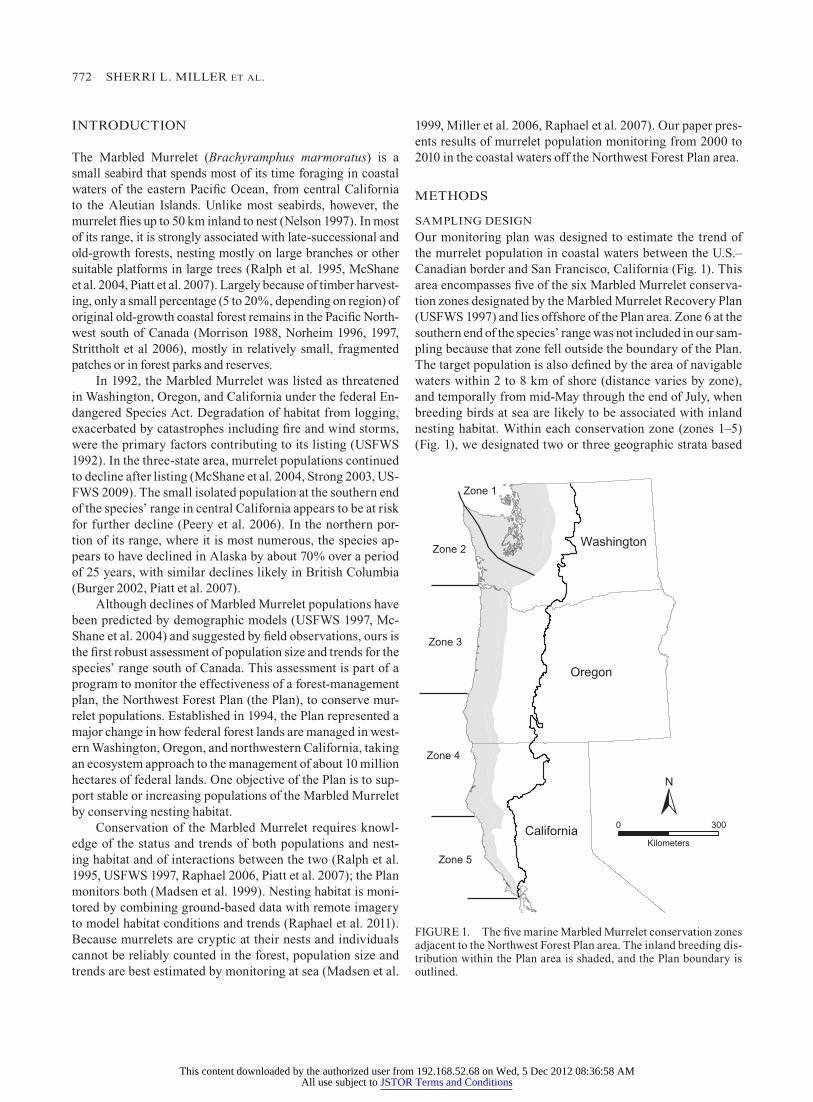
Our monitoring plan was designed to estimate the trend of the murrelet population in coastal waters between the U.S.–Canadian border and San francisco, California (fig. 1). This area encompasses five of the six Marbled Murrelet conserva-tion zones designated by the Marbled Murrelet Recovery Plan (USfwS 1997) and lies offshore of the Plan area. Zone 6 at the southern end of the species’ range was not included in our sam-pling because that zone fell outside the boundary of the Plan. The target population is also defined by the area of navigable waters within 2 to 8 km of shore (distance varies by zone), and temporally from mid-May through the end of July, when breeding birds at sea are likely to be associated with inland nesting habitat. within each conservation zone (zones 1–5) (fig. 1), we designated two or three geographic strata based
fIgURE 1. The five marine Marbled Murrelet conservation zones adjacent to the Northwest forest Plan area. The inland breeding dis-tribution within the Plan area is shaded, and the Plan boundary is outlined.
This content downloaded by the authorized user from 192.168.52.68 on Wed, 5 Dec 2012 08:36:58 AMAll use subject to JSTOR Terms and Conditions
POPUlATION TRENDS Of ThE MARblED MURRElET 773
on patterns of murrelet density (Miller et al. 2006, Raphael et al. 2007). The distance from shore of the offshore boundary for the target population varied by zone and stratum. by using available historic data on the murrelet’s relative abundance in relation to shore (Miller et al. 2006, Raphael et al. 2007), we selected offshore boundaries to include in each sample area at least 95% of the murrelets on the water. Sampling was de-signed to allocate more sampling effort to strata with higher densities (Raphael et al. 2007). The design accommodates augmented sampling in strata with particular conservation questions. for instance, Zone 4, Stratum 2 received additional sampling effort from 2000 through 2003, when a private tim-ber company required monitoring of murre lets offshore of the area of its habitat-conservation plan.
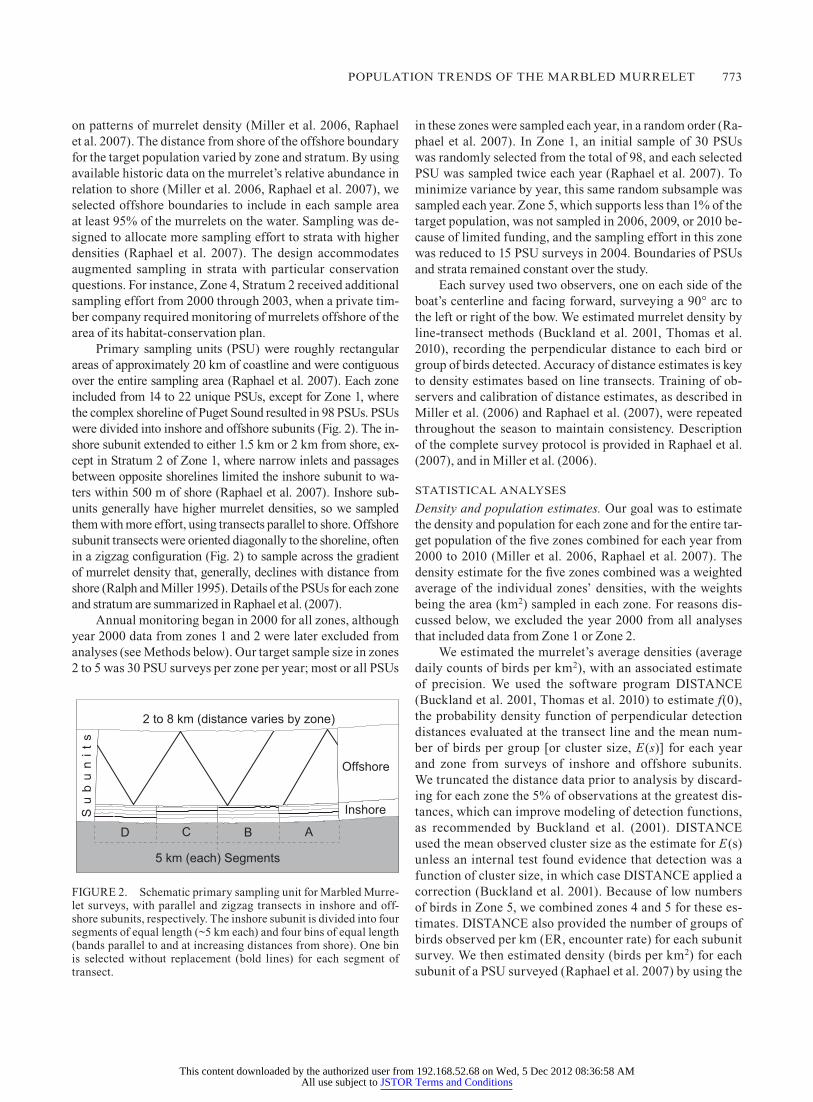
Primary sampling units (PSU) were roughly rectangular areas of approximately 20 km of coastline and were contiguous over the entire sampling area (Raphael et al. 2007). Each zone included from 14 to 22 unique PSUs, except for Zone 1, where the complex shoreline of Puget Sound resulted in 98 PSUs. PSUs were divided into inshore and offshore subunits (fig. 2). The in-shore subunit extended to either 1.5 km or 2 km from shore, ex-cept in Stratum 2 of Zone 1, where narrow inlets and passages between opposite shorelines limited the inshore subunit to wa-ters within 500 m of shore (Raphael et al. 2007). Inshore sub-units generally have higher murrelet densities, so we sampled them with more effort, using transects parallel to shore. Offshore subunit transects were oriented diagonally to the shoreline, often in a zigzag configuration (fig. 2) to sample across the gradient of murrelet density that, generally, declines with distance from shore (Ralph and Miller 1995). Details of the PSUs for each zone and stratum are summarized in Raphael et al. (2007).
Annual monitoring began in 2000 for all zones, although year 2000 data from zones 1 and 2 were later excluded from analyses (see Methods below). Our target sample size in zones 2 to 5 was 30 PSU surveys per zone per year; most or all PSUs
in these zones were sampled each year, in a random order (Ra-phael et al. 2007). In Zone 1, an initial sample of 30 PSUs was randomly selected from the total of 98, and each selected PSU was sampled twice each year (Raphael et al. 2007). To minimize variance by year, this same random subsample was sampled each year. Zone 5, which supports less than 1% of the target population, was not sampled in 2006, 2009, or 2010 be-cause of limited funding, and the sampling effort in this zone was reduced to 15 PSU surveys in 2004. boundaries of PSUs and strata remained constant over the study.
Each survey used two observers, one on each side of the boat’s centerline and facing forward, surveying a 90° arc to the left or right of the bow. we estimated murrelet density by line-transect methods (buckland et al. 2001, Thomas et al. 2010), recording the perpendicular distance to each bird or group of birds detected. Accuracy of distance estimates is key to density estimates based on line transects. Training of ob-servers and calibration of distance estimates, as described in Miller et al. (2006) and Raphael et al. (2007), were repeated throughout the season to maintain consistency. Description of the complete survey protocol is provided in Raphael et al. (2007), and in Miller et al. (2006).
STATISTICAl ANAlySES
Density and population estimates. Our goal was to estimate the density and population for each zone and for the entire tar-get population of the five zones combined for each year from 2000 to 2010 (Miller et al. 2006, Raphael et al. 2007). The density estimate for the five zones combined was a weighted average of the individual zones’ densities, with the weights being the area (km2) sampled in each zone. for reasons dis-cussed below, we excluded the year 2000 from all analyses that included data from Zone 1 or Zone 2.
we estimated the murrelet’s average densities (average daily counts of birds per km2), with an associated estimate of precision. we used the software program DISTANCE (buckland et al. 2001, Thomas et al. 2010) to estimate f(0), the probability density function of perpendicular detection distances evaluated at the transect line and the mean num-ber of birds per group [or cluster size, E(s)] for each year and zone from surveys of inshore and offshore subunits. we truncated the distance data prior to analysis by discard-ing for each zone the 5% of observations at the greatest dis-tances, which can improve modeling of detection functions, as recommended by buckland et al. (2001). DISTANCE used the mean observed cluster size as the estimate for E(s) unless an internal test found evidence that detection was a function of cluster size, in which case DISTANCE applied a correction (buckland et al. 2001). because of low numbers of birds in Zone 5, we combined zones 4 and 5 for these es-timates. DISTANCE also provided the number of groups of birds observed per km (ER, encounter rate) for each subunit survey. we then estimated density (birds per km2) for each subunit of a PSU surveyed (Raphael et al. 2007) by using the
fIgURE 2. Schematic primary sampling unit for Marbled Murre-let surveys, with parallel and zigzag transects in inshore and off-shore subunits, respectively. The inshore subunit is divided into four segments of equal length (~5 km each) and four bins of equal length (bands parallel to and at increasing distances from shore). One bin is selected without replacement (bold lines) for each segment of transect.
This content downloaded by the authorized user from 192.168.52.68 on Wed, 5 Dec 2012 08:36:58 AMAll use subject to JSTOR Terms and Conditions
774 ShERRI l. MIllER et aL.
estimates and encounter rate from DISTANCE with the fol-lowing formula:
= ⋅ ⋅ ⋅d f E sERˆ 1000 ˆ(0) ˆ ( )2
The “hats” over the letters designate estimates. we estimated densities for strata, zones, and all zones combined from av-erage densities weighted by the area of the respective geo-graphic scale.
we generated population estimates for each zone and for the five zones combined by standard methods for stratified sampling (Cochran 1977, Sokal and Rohlf 1981). we used the total area within each stratum, density estimates from DIS-TANCE, and associated estimates of precision to estimate the average total numbers of birds by zone and for the five zones combined for the target period. for estimates of precision we used bootstrap resampling methods with consideration of PSU samples that might be clustered in time or space (Miller et al. 2006, Raphael et al. 2007). because the total area (area sampled) and the sampling effort were constant over the study for all zones and years, density and population estimates are equivalent for purposes of trend detection, since population is simply density multiplied by area. Details of methods used to calculate population estimates and confidence intervals are in Raphael et al. (2007).
Estimating trends. we used annual density estimates to evaluate trends in the Plan area from 2000 to 2010 (see Miller et al. 2006 for details) for each zone and for all zones com-bined. Departures from the protocol in zones 1 and 2 in 2000 may have affected density estimates for those zones, so we used data from only 2001 through 2010 for trend estimates for all zones and for zones 1 and 2. for zones 3 and 4, we used data from 2000 through 2010. for Zone 5, we used data from 2000 through 2005, 2007, and 2008. for the years without Zone 5 estimates, the all-zone analyses used the 2008 Zone 5 estimate for 2009 and 2010 and an interpolation of 2005 and 2007 estimates for 2006. because Zone 5 supports less than 1% of the target population, missing data had minimal effect on population estimates and no measurable influence on the magnitude or significance of trend; we confirmed this empiri-cally by analyzing trends for the Plan area with and without Zone 5 included.
we used a regression model to estimate population trend. we fit a linear regression to the natural logarithm of annual density estimates to test for declines and to characterize the change over time as a constant percent change per year in zones 1 through 5 and in all zones. for our analysis, the natu-ral logarithm best fits and tests existing demographic models (USfwS 1997, McShane et al. 2004) that predict the murrelet population is declining by a constant percentage each year. we tested the null hypothesis that the slope equals zero or greater (no change or increase in murrelet numbers) against the alternative hypothesis of the slope being less than zero (i.e.,
a one-tailed test for a decrease). we tested the significance of the slope at the level of α = 0.05.
we used the 2001 to 2010 data for Zone 1 to evaluate po-tential effects of sea condition (beaufort sea state) and observer (crew) on our density and population-trend estimates. for each year, we estimated murrelet density with software DISTANCE (Thomas et al. 2010) for three models (sea condition, crew, and sea condition plus crew) as well as the default no-covari-ate model. we used AIC methods to identify the best model for each year (Johnson and Omland 2004). we evaluated the ef-fect of covariates on the population-trend estimate for Zone 1 by using the regression methods described above to compare the trend estimated from the no-covariate model with the trend based on density estimates from the best model for each year.
RESUlTS
beginning in 2000, we monitored the population in all five zones, except Zone 5, each year. The total area of ocean sur-veyed each year was about 8785 km2. Each year, we conducted 150 to 200 PSU surveys and recorded 4000 to 6000 murrelet observations along roughly 5500 to 6500 km of transect. In each year, we completed the largest number (~60) of PSU sur-veys in Zone 1 because of the greater length of coast in this zone. from 2000 to 2004, to meet the requirements of another project for more precise stratum-level population estimates, we conducted about 25 additional surveys per year in Stra-tum 2 of Zone 4. In 2005, the Zone 4 survey effort reverted to the target of 30 PSU surveys. because a PSU may be sampled more than once in a year, the number of unique PSUs sampled annually is less, about 90–95 for the five zones combined (Ra-phael et al. 2007).
POPUlATION ESTIMATES
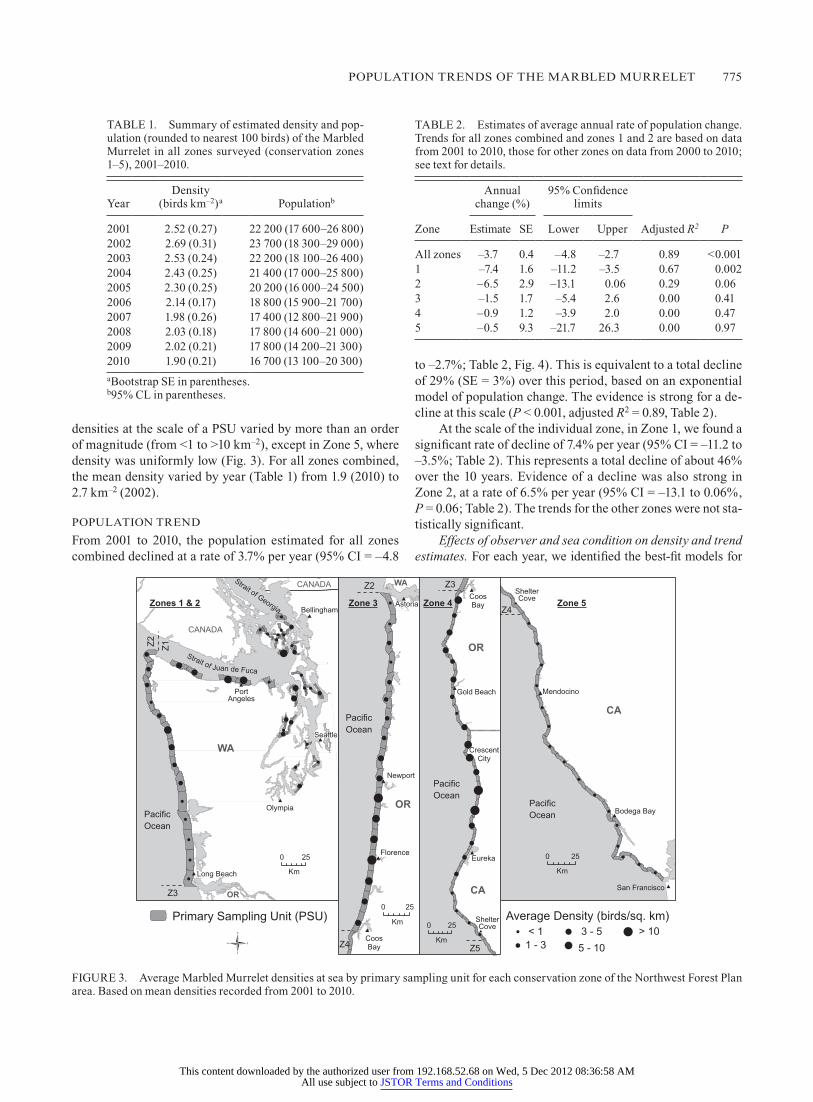
Estimates of density and population size by zone and for all zones combined are presented by year in Appendix 1, avail-able at http://dx.doi.org/10.1515/cond.2012.110084, and Ta-ble 1 respectively. The highest population estimated at the all-zone scale was about 23 700 in 2002 (95% Cl: 18 300– 29 000; Table 1). The estimate for 2010, the lowest annual es-timate for all zones, was 16 700 birds (95% Cl: 13 100–20 300; Table 1). Of the individual zones, 1 and 3 had the two highest estimated populations in all years except 2008, when they were larger for zones 3 and 4 (Appendix 1). The popu-lation estimated in zone 5 was far smaller than for any other zone, never exceeding 300 birds.
because population estimates are the product of both den-sity and area of coastal waters, density patterns by zone did not closely track population estimates. This is largely because the area sampled in Zone 1 (about 3500 km2) is more than double that of the next largest zone (about 1650 km2, Zone 2). Murrelet density varied from 0.05 km–2 in Zone 5 to >3 or 4 birds km–2 in zones 3 and 4 (Appendix 1). within a zone,
This content downloaded by the authorized user from 192.168.52.68 on Wed, 5 Dec 2012 08:36:58 AMAll use subject to JSTOR Terms and Conditions
POPUlATION TRENDS Of ThE MARblED MURRElET 775
densities at the scale of a PSU varied by more than an order of magnitude (from <1 to >10 km–2), except in Zone 5, where density was uniformly low (fig. 3). for all zones combined, the mean density varied by year (Table 1) from 1.9 (2010) to 2.7 km–2 (2002).
POPUlATION TREND
from 2001 to 2010, the population estimated for all zones combined declined at a rate of 3.7% per year (95% CI = –4.8
to –2.7%; Table 2, fig. 4). This is equivalent to a total decline of 29% (SE = 3%) over this period, based on an exponential model of population change. The evidence is strong for a de-cline at this scale (P < 0.001, adjusted R2 = 0.89, Table 2).
At the scale of the individual zone, in Zone 1, we found a significant rate of decline of 7.4% per year (95% CI = –11.2 to –3.5%; Table 2). This represents a total decline of about 46% over the 10 years. Evidence of a decline was also strong in Zone 2, at a rate of 6.5% per year (95% CI = –13.1 to 0.06%, P = 0.06; Table 2). The trends for the other zones were not sta-tistically significant.
Effects of observer and sea condition on density and trend estimates. for each year, we identified the best-fit models for
TAblE 1. Summary of estimated density and pop-ulation (rounded to nearest 100 birds) of the Marbled Murrelet in all zones surveyed (conservation zones 1–5), 2001–2010.
yearDensity
(birds km–2)a Populationb
2001 2.52 (0.27) 22 200 (17 600–26 800)2002 2.69 (0.31) 23 700 (18 300–29 000)2003 2.53 (0.24) 22 200 (18 100–26 400)2004 2.43 (0.25) 21 400 (17 000–25 800)2005 2.30 (0.25) 20 200 (16 000–24 500)2006 2.14 (0.17) 18 800 (15 900–21 700)2007 1.98 (0.26) 17 400 (12 800–21 900)2008 2.03 (0.18) 17 800 (14 600–21 000)2009 2.02 (0.21) 17 800 (14 200–21 300)2010 1.90 (0.21) 16 700 (13 100–20 300)abootstrap SE in parentheses.b95% Cl in parentheses.
fIgURE 3. Average Marbled Murrelet densities at sea by primary sampling unit for each conservation zone of the Northwest forest Plan area. based on mean densities recorded from 2001 to 2010.
TAblE 2. Estimates of average annual rate of population change. Trends for all zones combined and zones 1 and 2 are based on data from 2001 to 2010, those for other zones on data from 2000 to 2010; see text for details.
Zone
Annual change (%)
95% Confidence limits
Adjusted R2 PEstimate SE lower Upper
All zones –3.7 0.4 –4.8 –2.7 0.89 <0.0011 –7.4 1.6 –11.2 –3.5 0.67 0.0022 –6.5 2.9 –13.1 0.06 0.29 0.063 –1.5 1.7 –5.4 2.6 0.00 0.414 –0.9 1.2 –3.9 2.0 0.00 0.475 –0.5 9.3 –21.7 26.3 0.00 0.97
This content downloaded by the authorized user from 192.168.52.68 on Wed, 5 Dec 2012 08:36:58 AMAll use subject to JSTOR Terms and Conditions
776 ShERRI l. MIllER et aL.
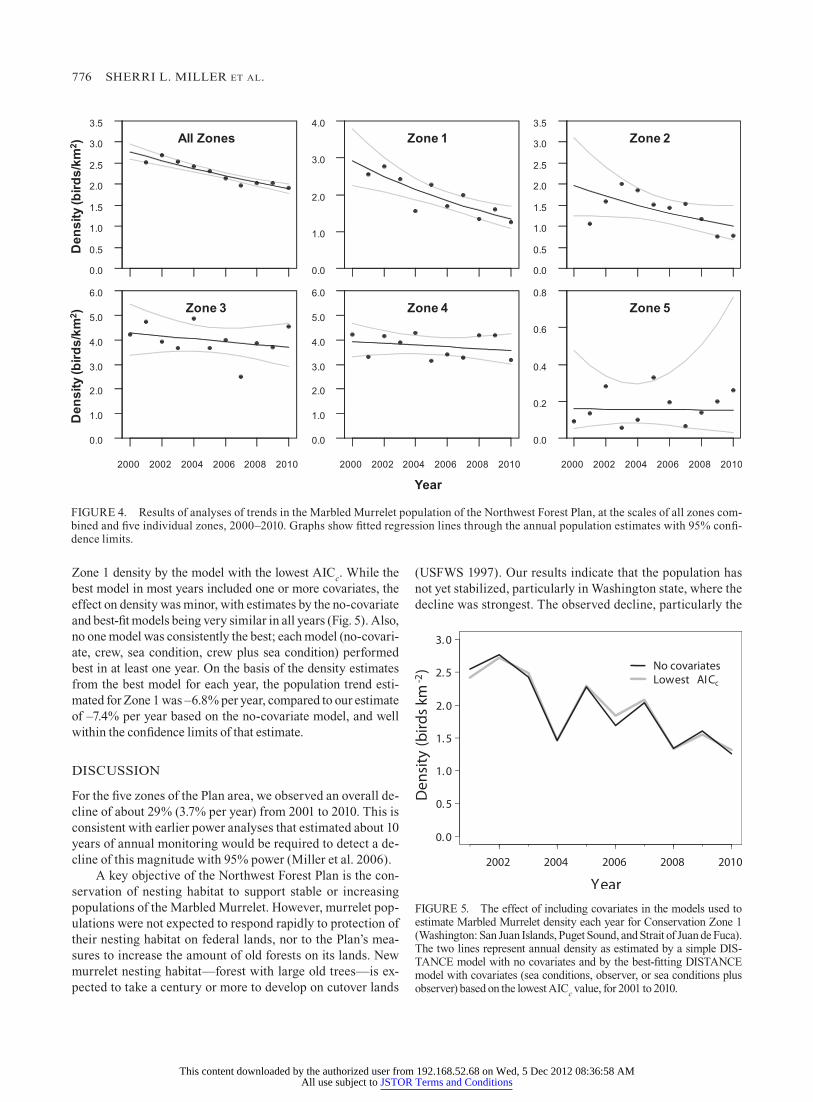
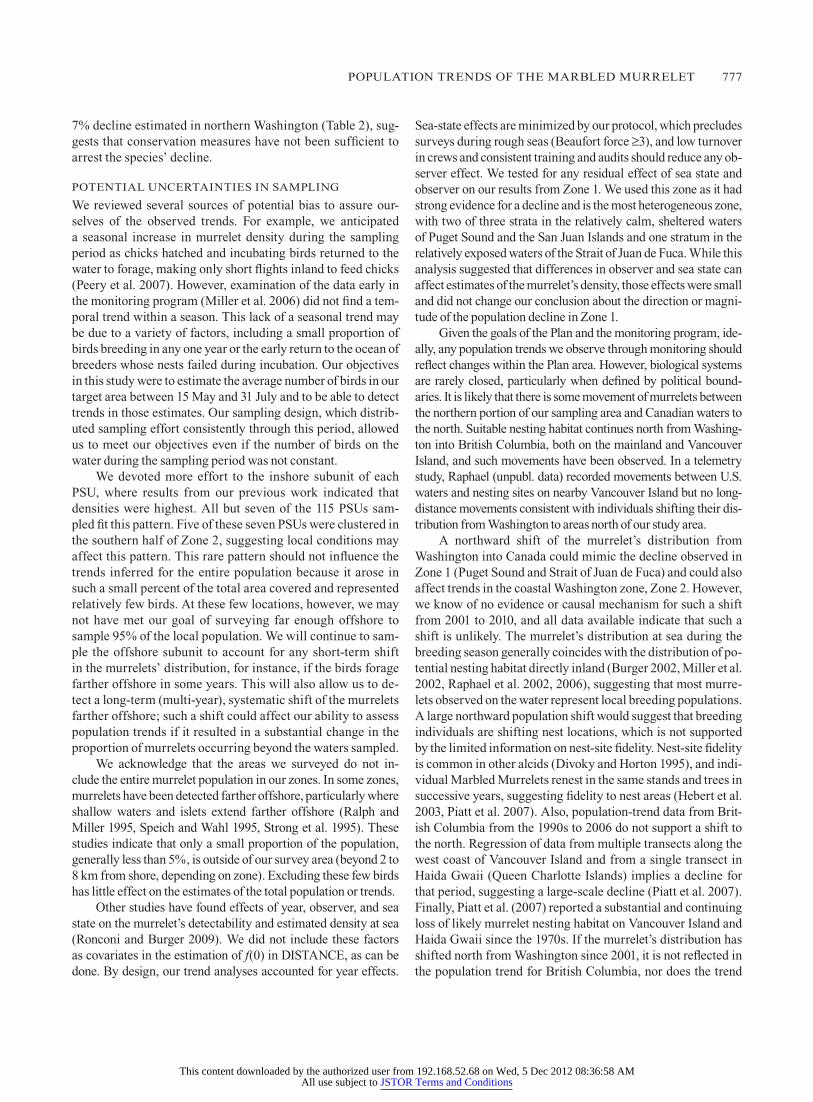
Zone 1 density by the model with the lowest AICc. while the best model in most years included one or more covariates, the effect on density was minor, with estimates by the no-covariate and best-fit models being very similar in all years (fig. 5). Also, no one model was consistently the best; each model (no-covari-ate, crew, sea condition, crew plus sea condition) performed best in at least one year. On the basis of the density estimates from the best model for each year, the population trend esti-mated for Zone 1 was –6.8% per year, compared to our estimate of –7.4% per year based on the no-covariate model, and well within the confidence limits of that estimate.
DISCUSSION
for the five zones of the Plan area, we observed an overall de-cline of about 29% (3.7% per year) from 2001 to 2010. This is consistent with earlier power analyses that estimated about 10 years of annual monitoring would be required to detect a de-cline of this magnitude with 95% power (Miller et al. 2006).
A key objective of the Northwest forest Plan is the con-servation of nesting habitat to support stable or increasing populations of the Marbled Murrelet. however, murrelet pop-ulations were not expected to respond rapidly to protection of their nesting habitat on federal lands, nor to the Plan’s mea-sures to increase the amount of old forests on its lands. New murrelet nesting habitat—forest with large old trees—is ex-pected to take a century or more to develop on cutover lands
(USfwS 1997). Our results indicate that the population has not yet stabilized, particularly in washington state, where the decline was strongest. The observed decline, particularly the
fIgURE 4. Results of analyses of trends in the Marbled Murrelet population of the Northwest forest Plan, at the scales of all zones com-bined and five individual zones, 2000–2010. graphs show fitted regression lines through the annual population estimates with 95% confi-dence limits.
fIgURE 5. The effect of including covariates in the models used to estimate Marbled Murrelet density each year for Conservation Zone 1 (washington: San Juan Islands, Puget Sound, and Strait of Juan de fuca). The two lines represent annual density as estimated by a simple DIS-TANCE model with no covariates and by the best-fitting DISTANCE model with covariates (sea conditions, observer, or sea conditions plus observer) based on the lowest AICc value, for 2001 to 2010.
This content downloaded by the authorized user from 192.168.52.68 on Wed, 5 Dec 2012 08:36:58 AMAll use subject to JSTOR Terms and Conditions
POPUlATION TRENDS Of ThE MARblED MURRElET 777
7% decline estimated in northern washington (Table 2), sug-gests that conservation measures have not been sufficient to arrest the species’ decline.
POTENTIAl UNCERTAINTIES IN SAMPlINg
we reviewed several sources of potential bias to assure our-selves of the observed trends. for example, we anticipated a seasonal increase in murrelet density during the sampling period as chicks hatched and incubating birds returned to the water to forage, making only short flights inland to feed chicks (Peery et al. 2007). however, examination of the data early in the monitoring program (Miller et al. 2006) did not find a tem-poral trend within a season. This lack of a seasonal trend may be due to a variety of factors, including a small proportion of birds breeding in any one year or the early return to the ocean of breeders whose nests failed during incubation. Our objectives in this study were to estimate the average number of birds in our target area between 15 May and 31 July and to be able to detect trends in those estimates. Our sampling design, which distrib-uted sampling effort consistently through this period, allowed us to meet our objectives even if the number of birds on the water during the sampling period was not constant.
we devoted more effort to the inshore subunit of each PSU, where results from our previous work indicated that densities were highest. All but seven of the 115 PSUs sam-pled fit this pattern. five of these seven PSUs were clustered in the southern half of Zone 2, suggesting local conditions may affect this pattern. This rare pattern should not influence the trends inferred for the entire population because it arose in such a small percent of the total area covered and represented relatively few birds. At these few locations, however, we may not have met our goal of surveying far enough offshore to sample 95% of the local population. we will continue to sam-ple the offshore subunit to account for any short-term shift in the murrelets’ distribution, for instance, if the birds forage farther offshore in some years. This will also allow us to de-tect a long-term (multi-year), systematic shift of the murrelets farther offshore; such a shift could affect our ability to assess population trends if it resulted in a substantial change in the proportion of murrelets occurring beyond the waters sampled.
we acknowledge that the areas we surveyed do not in-clude the entire murrelet population in our zones. In some zones, murre lets have been detected farther offshore, particularly where shallow waters and islets extend farther offshore (Ralph and Miller 1995, Speich and wahl 1995, Strong et al. 1995). These studies indicate that only a small proportion of the population, generally less than 5%, is outside of our survey area (beyond 2 to 8 km from shore, depending on zone). Excluding these few birds has little effect on the estimates of the total population or trends.
Other studies have found effects of year, observer, and sea state on the murrelet’s detectability and estimated density at sea (Ronconi and burger 2009). we did not include these factors as covariates in the estimation of f(0) in DISTANCE, as can be done. by design, our trend analyses accounted for year effects.
Sea-state effects are minimized by our protocol, which precludes surveys during rough seas (beaufort force ≥3), and low turnover in crews and consistent training and audits should reduce any ob-server effect. we tested for any residual effect of sea state and observer on our results from Zone 1. we used this zone as it had strong evidence for a decline and is the most heterogeneous zone, with two of three strata in the relatively calm, sheltered waters of Puget Sound and the San Juan Islands and one stratum in the relatively exposed waters of the Strait of Juan de fuca. while this analysis suggested that differences in observer and sea state can affect estimates of the murrelet’s density, those effects were small and did not change our conclusion about the direction or magni-tude of the population decline in Zone 1.
given the goals of the Plan and the monitoring program, ide-ally, any population trends we observe through monitoring should reflect changes within the Plan area. however, biological systems are rarely closed, particularly when defined by political bound-aries. It is likely that there is some movement of murrelets between the northern portion of our sampling area and Canadian waters to the north. Suitable nesting habitat continues north from washing-ton into british Columbia, both on the mainland and Vancouver Island, and such movements have been observed. In a telemetry study, Raphael (unpubl. data) recorded movements between U.S. waters and nesting sites on nearby Vancouver Island but no long-distance movements consistent with individuals shifting their dis-tribution from washington to areas north of our study area.
A northward shift of the murrelet’s distribution from washington into Canada could mimic the decline observed in Zone 1 (Puget Sound and Strait of Juan de fuca) and could also affect trends in the coastal washington zone, Zone 2. however, we know of no evidence or causal mechanism for such a shift from 2001 to 2010, and all data available indicate that such a shift is unlikely. The murrelet’s distribution at sea during the breeding season generally coincides with the distribution of po-tential nesting habitat directly inland (burger 2002, Miller et al. 2002, Raphael et al. 2002, 2006), suggesting that most murre-lets observed on the water represent local breeding populations. A large northward population shift would suggest that breeding individuals are shifting nest locations, which is not supported by the limited information on nest-site fidelity. Nest-site fidelity is common in other alcids (Divoky and horton 1995), and indi-vidual Marbled Murrelets renest in the same stands and trees in successive years, suggesting fidelity to nest areas (hebert et al. 2003, Piatt et al. 2007). Also, population-trend data from brit-ish Columbia from the 1990s to 2006 do not support a shift to the north. Regression of data from multiple transects along the west coast of Vancouver Island and from a single transect in haida gwaii (Queen Charlotte Islands) implies a decline for that period, suggesting a large-scale decline (Piatt et al. 2007). finally, Piatt et al. (2007) reported a substantial and continuing loss of likely murrelet nesting habitat on Vancouver Island and haida gwaii since the 1970s. If the murrelet’s distribution has shifted north from washington since 2001, it is not reflected in the population trend for british Columbia, nor does the trend
This content downloaded by the authorized user from 192.168.52.68 on Wed, 5 Dec 2012 08:36:58 AMAll use subject to JSTOR Terms and Conditions
778 ShERRI l. MIllER et aL.
in that province’s nesting habitat support the hypothesis of a northward shift.
POTENTIAl CAUSES fOR DEClINE
while the causes for the observed decline are unknown, po-tential proximal factors include the loss of nesting habitat, in-cluding cumulative and time-lag effects of habitat losses over the past 20 years (an individual’s potential lifespan), changes in the marine environment reducing the availability or quality of prey, increased densities of nest predators, and emigration. Ultimately, these factors can contribute to a decline by affect-ing the demographic processes of survival and fecundity.
The population decline we observed was within the range of 3 to 8% per year predicted by demographic models (beiss-inger and Nur 1997, McShane et al. 2004). Those models indi-cate that low fecundity, more than adult survivorship, may be responsible for the declines. On the basis of data from known nests and the ratio of juveniles to adults observed at sea dur-ing the fledging period, the murrelet’s fecundity appears to be low (USfwS 1997, McShane et al. 2004, hebert and golightly 2007, Peery et al. 2007, bloxton and Raphael 2008, Strong 2008, long et al. 2010). One factor contributing to low productivity is the high rate of predation by avian predators, particularly corvids (jays and ravens) (Nelson and Peck 1995, luginbuhl et al. 2001, Raphael et al. 2002, Peery et al. 2004, hebert and golightly 2007). Elevated predation rates may be the result of increased numbers of predators associated with anthropogenic food sources and habitat fragmentation. In parts of the Plan area, most of the murre let’s remaining nesting habitat lies in parks and other public lands. The parks and national forests generally provide recreational facilities such as hiking trails and camp-grounds where human activities tend to increase or concentrate corvid populations (Marzluff and Neatherlin 2006), likely in-creasing the risk of corvid predation on murrelet eggs and nest-lings. Experiments found that the rate of predation of artificial nests on the Olympic Peninsula is significantly correlated with corvid abundance and that increased abundance of the Amer-ican Crow (Corvus brachyrhynchos) and Common Raven (C. corax) is associated with human settlements and camp-grounds (Neatherlin and Marzluff 2004, Marzluff and Neather-lin 2006). Crows used campgrounds more frequently than other land-cover types, and crow abundance is positively correlated with campground size (Neatherlin and Marzluff 2004). Public education and consideration of moving campgrounds to outside of the murrelet’s nesting habitat are some of the current attempts to reduce nest predation by corvids within parks.
landscape characteristics of the remaining old-growth forests also may be contributing to these high preda-tion rates by reducing habitat quality for murrelets through fragmentation of the remaining forest patches. fragmented patches often have high ratios of edge to interior, and edge habitats tend to support more predators (e.g., DeSanto and willson 2001, Malt and lank 2007). Planning reserves with
larger forest patches, with more core area and less edge, could reduce numbers of avian predators (Marzluff et al. 2000) and, consequently, improve the murrelet’s nesting success.
The loss of nesting habitat was a major cause of the murre-let’s decline over the past century and may still be contribut-ing as nesting habitat continues to be lost to fires, logging, and wind storms (USfwS 2009, Raphael 2006). The Plan’s monitoring of the murrelet’s nesting habitat documented losses directly inland from the areas we sampled (Raphael et al. 2011). within the three-state area, losses were greatest in washington (9–11% from 1996 to 2006) and Oregon (5–17%, 1996 to 2006) and lower in California (2–6%, 1997 to 2007). This pattern of loss of older forest is independently supported by analyses of habitat for the Northern Spotted Owl (Strix oc-cidentalis caurina) (Davis et al. 2011). Thus both populations and nesting habitat have recently declined in the northern part of our study area, in washington and Oregon, suggesting a potential terrestrial mechanism for the population declines. This potential terrestrial mechanism of habitat loss warrants additional study because there is a strong positive correla-tion between the murrelet’s population size and area of high-quality nesting habitat (e.g., Miller et al. 2002, Raphael et al. 2011), suggesting that the murrelet’s numbers may be limited by the amount of high-quality nesting habitat, as suggested by burger and waterhouse (2009) and Raphael (2006).
In addition to the loss of quantity and quality of nesting habitat, factors in the marine environment may also be affect-ing the murrelet population. Oil spills have caused direct mor-tality throughout the murrelet’s range (Kuletz 1996, Piatt and ford 1996, McShane et al. 2004, USfwS 2009), although no oil spills killing murrelets have been recorded in waters off the Plan area since 1999 (USfwS 2009). The quality and composition of the murrelet’s prey could be linked to changes in the distribu-tion and abundance of that prey, which are, in turn, influenced by factors such as overfishing or oceanographic changes associ-ated with climate change (becker and beissinger 2006, becker et al. 2007, Norris et al. 2007). Changes in ocean conditions over the period of our monitoring could be affecting adults’ survival and reproductive success by reducing the availability of prey in the nearshore waters where murrelets forage. Although data on the availability of the murrelet’s prey over the period of our sam-pling are scarce, there is evidence of a warming of the coastal waters we surveyed (Sydeman and Elliott 2008, Ruckelshaus and McClure 2007) and for El Niño becoming more frequent, persistent, and intense during the last 20 to 30 years (Snyder et al. 2003), perhaps because of climate change. Much remains to be learned about potential effects of warming sea temperatures on the murre let’s prey, but northward shifts in the distribution of marine organisms can be expected as sea temperatures increase (harley et al. 2006). becker et al. (2007) suggested that in central California cooler water temperatures supported increased avail-ability of the murrelet’s prey and improvement in its reproductive success. In southern british Columbia, Norris et al. (2007) found
This content downloaded by the authorized user from 192.168.52.68 on Wed, 5 Dec 2012 08:36:58 AMAll use subject to JSTOR Terms and Conditions

POPUlATION TRENDS Of ThE MARblED MURRElET 779
a strong correlation between the quality of the murrelet’s diet and its abundance 3–4 years later, suggesting that diet could affect re-productive success. In southwestern british Columbia, Ronconi and burger (2008) found that the murrelet’s reproductive success was affected by annual variability in prey and oceanographic conditions, with increased foraging effort by parents ineffective at compensating for the effects of low prey availability during the poorest conditions.
One indication of marine rather than terrestrial causes of the observed decline would be a concurrent decline of seabirds that forage in the same marine environment as the murrelet but do not nest in the forest. During our murrelet surveys, we sam-pled other seabirds breeding locally by the same methods and tested for declines in these species from 2001 to 2009 in wash-ington, where the Marbled Murrelet declined in both zones 1 and 2. Among six species of alcids and three of cormorants, we found no species that had declined in both Puget Sound and along washington’s outer coast (zones 1 and 2; Pearson and Ra-phael, unpubl. data). In fact, two species appeared to be increas-ing in both regions and two demonstrated declines or increases in one region but not the other. These preliminary trends for other species do not support a hypothesis of systematically un-favorable marine conditions during the period of analysis.
The relationships between quantity and quality of inland forest, ocean conditions, and population densities at sea in the Plan area need further study. we plan to investigate these re-lationships, by integrating the results of this study with those of a complementary program that monitors the distribution and trend of nesting habitat (Raphael et al. 2011) and available oceanographic and prey data. A primary goal of this work will be to understand the causes of the population decline we ob-served and to provide information that may point to ways to better manage forests and other resources in the Plan area to conserve the Marbled Murrelet.
ACKNOwlEDgMENTS
This work would not have been possible without the assistance of a large number of people who contributed to the population-monitoring program. we particularly thank the many crew mem-bers who conducted the population surveys at sea over the years, often under difficult conditions. Naomi bentivoglio, Patrick Jodice, and Mark huff provided leadership for the Plan’s murrelet monitoring program in the earlier years. funding and other sup-port for this work was provided by several offices and programs of the U.S. fish and wildlife Service, by the U.S. forest Ser-vice’s Pacific Northwest Research Station and Pacific Northwest Region, the U.S. forest Services’ Pacific Southwest Research Station and Pacific Southwest Region, the bureau of land Man-agement’s Arcata field Office, the washington State Depart-ment of fish and wildlife, the California Department of fish and game, and the Pacific lumber Company. This paper benefited from comments by Robert Ronconi, M. Zachariah Peery, wil-liam Ritchie, and Ayn Shlisky. Ana bertoldi provided the Span-ish translation. The findings and conclusions in this article are those of the authors and do not necessarily represent the views of the U.S. fish and wildlife Service.
lITERATURE CITED
BeCker, B. h., and S. r. BeiSSinGer. 2006. Centennial decline in the trophic level of an endangered seabird after fisheries decline. Conservation biology 20:470–479.
BeCker, B. h., M. Z. peery, and S. r. BeiSSinGer. 2007. Ocean cli-mate and prey availability affect the trophic level and reproduc-tive success of the Marbled Murrelet, an endangered seabird. Marine Ecology Progress Series 329:267–279.
BeiSSinGer, S. r., and n. nur. 1997. Population trends of the Mar-bled Murrelet projected from demographic analysis, Appen-dix b. In U.S. fish and wildlife Service, Recovery plan for the threatened Marbled Murrelet (Brachyramphus marmoratus) in washington, Oregon, and California. U.S. fish and wildlife Ser-vice, Portland, OR.
BLoxton, t. d., and M. G. raphaeL. 2008. breeding ecology of the Marbled Murrelet in washington state, project update 2004–2007. USDA forest Service Pacific Northwest Research Station, Olympia, wA.
BuCkLand, S. t., d. r. anderSon, k. p. BurnhaM, J. L. Laake, d. L. BorCherS, and L. thoMaS. 2001. Introduction to dis-tance sampling: estimating abundance of biological populations. Oxford University Press, New york.
BurGer, a. e. 2002. Conservation assessment of Marbled Murrelets in british Columbia. Part A: review of the biology, populations, habitat associations, and conservation. Canadian wildlife Ser-vice, Pacific and yukon Region, Technical Report 387.
BurGer, a. e., and F. L. waterhouSe. 2009. Relationships between habitat area, habitat quality, and populations of nest-ing Marbled Murrelets. bC Journal of Ecosystems and Man-agement 10:101–112.
CoChran, w. G. 1977. Sampling techniques, 3rd edition. wiley, New york.
daviS, r. J., k. M. duGGer, S. MohoriC, L. everS, and w. C. aney. 2011. Northwest forest Plan—the first 15 years (1994–2008): sta-tus and trends of Northern Spotted Owl populations and habitats. USDA forest Service general Technical Report PNw-gTR-850.
deSanto, t. L., and M. F. wiLLSon. 2001. Predator abundance and predation of artificial nests in natural and anthropogenic conifer-ous forest edges in southeast Alaska. Journal of field Ornithol-ogy 72:136–149.
divoky, G. J., and M. horton. 1995. Nest habitat loss and implica-tions for Marbled Murrelet populations, p. 83–87. In C. J. Ralph, g. l. hunt, M. g. Raphael, and J. f. Piatt [edS.], Ecology and conservation of the Marbled Murrelet. USDA forest Service general Technical Report PSw-gTR-152.
harLey, C. d., a. r. huGheS, k. M. huLtGren, B. G. Miner, C. J. Sorte, C. S. thornBer, L. F. rodriGueZ, L. toManek, and S. L. wiLLiaMS. 2006. The impacts of climate change on coastal marine systems. Ecology letters 9:228–241.
heBert, p. n., r. t. GoLiGhtLy, and d. L. orthMeyer. 2003. Radio-telemetry evidence of renesting in the same season by the Mar-bled Murrelet. waterbirds 26:261–265.
heBert, p. n., and r. t. GoLiGhtLy. 2007. Observations of predation by corvids at a Marbled Murrelet nest. Journal of field Ornithol-ogy 78:221–224.
JohnSon, J. B., and k. S. oMLand. 2004. Model selection in ecol-ogy and evolution. Trends in Ecology and Evolution 19:101–108.
kuLetZ, k. J. 1996. Marbled Murrelet abundance and breeding activity at Naked Island, Prince william Sound, and Kachemak bay, Alaska, before and after the Exxon Valdez oil spill, p. 770–784. In S. D. Rice, R. b. Spies, D. A. wolfe, and b. A. wright [edS.], Proceedings of the Exxon Valdez oil spill symposium. American fisheries Society Symposium 18.
This content downloaded by the authorized user from 192.168.52.68 on Wed, 5 Dec 2012 08:36:58 AMAll use subject to JSTOR Terms and Conditions
780 ShERRI l. MIllER et aL.
LonG, L. L., S. L. MiLLer, C. J. raLph, and C. StronG. 2010. Marbled Murrelet abundance, distribution, and productivity along the coasts of northern California and southern Oregon, 2009. USDA forest Service Redwood Sciences laboratory, Arcata, CA.
LuGinBuhL, J. M., J. M. MarZLuFF, J. e. BradLey, M. G. raphaeL, and d. e. varLand. 2001. Corvid survey techniques and the relationship between corvid relative abundance and nest preda-tion. Journal of field Ornithology 72:556–572.
MadSen, S., d. evanS, t. haMer, p. henSon, S. MiLLer, S. k. neLSon, d. roBy, and M. Stapanian. 1999. Marbled Murrelet effec-tiveness monitoring plan for the Northwest forest Plan. USDA forest Service general Technical Report PNw-gTR-439.
MaLt, J., and d. Lank. 2007. Temporal dynamics of edge effects on nest predation risk for the Marbled Murrelet. biological Conser-vation 124:160–173.
MarZLuFF, J. M., and e. a. neatherLin. 2006. Corvid response to human settlements and campgrounds: causes, consequences, and challenges for conservation. biological Conservation 130:301–314.
MarZLuFF, J. M., M. G. raphaeL, and r. SaLLaBankS. 2000. Understanding the effects of forest management on avian popu-lations. wildlife Society bulletin 28:1132–1143.
MCShane, C., t. haMer, h. Carter, G. SwartZMan, v. FrieSen, d. ainLey, r. treSSLer, k. neLSon, a. BurGer, L. Spear, t. MohaGen, r. Martin, L. henkeL, k. prindLe, C. StronG, and J. keany. 2004. Evaluation report for the 5-year status review of the Marbled Murrelet in washington, Oregon, and California. EDAw, Inc., Seattle, wA. Report to the U.S. fish and wildlife Service, Region 1, Portland, OR.
MiLLer, S. L., C. B. Meyer, and C. J. raLph. 2002. land and sea-scape patterns associated with Marbled Murrelet abundance off-shore. waterbirds 25:100–108.
MiLLer, S. L, C. J. raLph, M. G. raphaeL, C. StronG, C. w. thoMpSon, J. BaLdwin, M. h. huFF, and G. a. FaLxa. 2006. At-sea monitoring of Marbled Murrelet population status and trend in the Northwest forest Plan area, p. 31–60. In M. h. huff, M. g. Raphael, S. l. Miller, S. K. Nelson, and J. baldwin [teCh. CoordS.], Northwest forest Plan—the first 10 years (1994–2003): status and trends of populations and nesting habitat for the Marbled Murrelet. USDA forest Service general Technical Report PNw-gTR-650.
MorriSon, p. h. 1988. Old growth in the Pacific Northwest: a status report. wilderness Society, washington, DC.
neLSon, S. k. 1997. Marbled Murrelet (Brachyramphus marmora-tus), no. 276. In A. Poole and f. gill [edS.], The birds of North America. Academy of Natural Sciences, Philadelphia.
neLSon, S. k., and r. w. peCk. 1995. behavior of Marbled Murrelets at nine nest sites in Oregon. Northwestern Naturalist 76: 43–53.
neatherLin, e. a., and J. M. MarZLuFF. 2004. Responses of Amer-ican Crow populations to campgrounds in remote native forest landscapes. Journal of wildlife Management 68: 708–718.
norheiM, r. a. 1996. Is there an answer to mapping old growth? An examination of two projects conducted with remote sensing and gIS. M.Sc. thesis, University of washington, Seattle, wA.
norheiM, r. a. [onLine]. 1997. Dueling databases: examin-ing the differences between two old growth mapping projects. 13th International Symposium on Computer-assisted Cartog-raphy (Auto-Carto 13), Seattle, 1997. <http://purl.oclc.org/net/norheim/oldgrowth/dueling-db.html> (2 June 2011).
norriS, d. r., p. arCeSe, d. preikShot, d. F. BertraM, and t. k. kySer. 2007. Diet reconstruction and historic population dynamics in a threatened seabird. Journal of Applied Ecology 44:875–884.
peery, M. Z., S. r. BeiSSinGer, S. h. newMan, e. B. Burkett, and t. d. wiLLiaMS. 2004. Applying the declining populations par-adigm: diagnosing causes of poor reproduction in the Marbled Murrelet. Conservation biology 18:1088–1098.
peery, M. Z., B. h. BeCker, and S. r. BeiSSinGer. 2006. Combining demographics and count-based approaches to identify source–sink dynamics of a threatened seabird. Ecological Applications 16:1516–1528.
peery, M. Z., B. h. BeCker, and S. r. BeiSSinGer. 2007. Age ratios as estimators of productivity: testing assumptions on a threat-ened seabird, the Marbled Murrelet. Auk 124:224–240.
piatt, J. F., k. J. kuLetZ, a. e. BurGer, S. a. hatCh, v. L. FrieSen, t. p. Birt, M. L. ariMitSu, G. S. drew, a. M. a. hardinG, and k. S. BixLer. 2007. Status review of the Marbled Murrelet (Brachyramphus marmoratus) in Alaska and british Columbia. U.S. geological Survey Open-file Report 2006-1387.
piatt, J. F., and r. G. Ford. 1996. how many seabirds were killed by the Exxon Valdez oil spill?, p. 712–719. In S. D. Rice, R. b. Spies, D. A. wolfe, and b. A. wright [edS.], Proceedings of the Exxon Valdez oil spill symposium. American fisheries Society Symposium 18.
raLph, C. J., and S. L. MiLLer. 1995. Offshore population estimates of Marbled Murrelets in California, p. 353–360. In C. J. Ralph, g. l. hunt Jr., M. g. Raphael, and J. f. Piatt [edS.], Ecology and conservation of the Marbled Murrelet. USDA forest Service general Technical Report PSw-gTR-152.
raLph, C. J., G. L. hunt Jr., M. G. raphaeL, and J. F. piatt [edS.]. 1995. Ecology and conservation of the Marbled Murrelet. USDA forest Service general Technical Report PSw-gTR-152.
raphaeL, M. G. 2006. Conservation of the Marbled Murrelet under the Northwest forest Plan. Conservation biology 20:297–305.
raphaeL, M. G., d. evanSMaCk, and B. a. Cooper. 2002. land-scape-scale relationships between abundance of Marbled Murre-lets and distribution of nesting habitat. Condor 104:331–342.
raphaeL, M. G., B. M. GaLLeher, M. h. huFF, S. L. MiLLer, S. k. neLSon, and r. d. younG. 2006. Spatially-explicit esti-mates of potential nesting habitat for the Marbled Murrelet, p. 97–146. In M. h. huff, M. g., Raphael, S. l. Miller, S. K. Nelson, and J. baldwin [tech. coords.], Northwest forest Plan—the first 10 years (1994–2003): status and trends of populations and nest-ing habitat for the Marbled Murrelet. USDA forest Service gen-eral Technical Report PNw-gTR-650.
raphaeL, M. G., J. BaLdwin, G. a. FaLxa, M. h. huFF, M. LanCe, S. L. MiLLer, S. F. pearSon, C. J. raLph, C. StronG, and C. thoMpSon. 2007. Regional population monitoring of the Marbled Murrelet: field and analytical methods. USDA forest Service general Technical Report PNw-gTR-716.
raphaeL, M. G., G. a. FaLxa, k. M. duGGer, B. M. GaLLeher, d. LynCh, S. L. MiLLer, S. k. neLSon, and r. d. younG. 2011. Northwest forest Plan—the first 15 years (1994–2008): status and trend of nesting habitat for the Marbled Murrelet. USDA for-est Service general Technical Report PNw-gTR-848.
ronConi, r. a., and a. e. BurGer. 2008. limited foraging flex-ibility: increased foraging effort by a marine predator does not buffer against scarce prey. Marine Ecology Progress Series 366:245–258.
ronConi, r. a., and a. e. BurGer. 2009. Estimating seabird densi-ties from vessel transects: distance sampling and implications for strip transects. Aquatic biology 4:297–309.
ruCkeLShauS, M. h., and M. M. MCCLure [CoordS.]. 2007. Sound science: synthesizing ecological and socioeconomic infor-mation about the Puget Sound ecosystem. U.S. Department of Commerce, National Oceanic & Atmospheric Administration, Northwest fisheries Science Center, Seattle.
This content downloaded by the authorized user from 192.168.52.68 on Wed, 5 Dec 2012 08:36:58 AMAll use subject to JSTOR Terms and Conditions
POPUlATION TRENDS Of ThE MARblED MURRElET 781
Snyder, M. a., L. C. SLoan, n. S. diFFenBauGh, and J. L. BeLL. 2003. future climate change and upwelling in the Califor-nia Current. geophysical Research letters 30(15), 1823, doi: 10.1029/2003gl017647.
SokaL, r. r., and F. J. rohLF. 1981. biometry: the principles and practice of statistics in biological research, 2nd ed. w. h. free-man, San francisco.
SpeiCh, S. M., and t. r. wahL. 1995. Marbled Murrelet popula-tions of washington—marine habitat preferences and vari-ability of occurrence, p. 313–325. In C. J. Ralph, g. l. hunt Jr., M. g. Raphael, and J. f. Piatt [edS.], Ecology and conservation of the Marbled Murrelet. USDA forest Service general Technical Report PSw-gTR-152.
StritthoLt, J. r., d. a. deLLaSaLLa, and h. JianG. 2006. Status of mature and old-growth forests in the Pacific Northwest. Conser-vation biology 20:363–374.
StronG, C. S. 2003. Decline of the Marbled Murrelet population on the central Oregon coast during the 1990’s. Northwestern Natu-ralist 84:31–37.
StronG, C. S. 2008. Population and productivity monitoring of Marbled Murrelets in Oregon during 2008. Crescent Coastal Research, Crescent City, CA.
StronG, C. S., B. S. keitt, w. r. MCiver, C. J. paLMer, and i. GaFFney. 1995. Distribution and population estimates of Mar-bled Murrelets at sea in Oregon during the summers of 1992 and
1993, p. 339–353. In C. J. Ralph, g. l. hunt Jr., M. g. Raphael, and J. f. Piatt [edS.], Ecology and conservation of the Marbled Murrelet. USDA forest Service general Technical Report PSw-gTR-152.
SydeMan, w. J., and M. L. eLLiott [onLine]. 2008. Developing the California Current Integrated Ecosystem Assessment, Mod-ule I: select time-series of ecosystem state. PRbO Conserva-tion Science, Petaluma, CA. <http://www.faralloninstitute.org/Publications/IEA Step 1 Rpt final.pdf> (9 April 2012).
thoMaS, L., S. t. BuCkLand, e. a. rexStad, J. L. Laake, S. StrindBerG, S. L. hedLey, J. r. B. BiShop, t. a. MarqueS, and k. p. BurnhaM. 2010. Distance software: design and analysis of distance sampling surveys for estimating population size. Jour-nal of Applied Ecology 47: 5–14.
u.S. FiSh and wiLdLiFe ServiCe (uSFwS). 1992. Determination of threatened status for the washington, Oregon, and California population of the Marbled Murrelet. federal Register 57:45328–45337.
u.S. FiSh and wiLdLiFe ServiCe (uSFwS). 1997. Recovery plan for the threatened Marbled Murrelet (Brachyramphus marmoratus) in washington, Oregon, and California. U.S. fish and wildlife Service, Portland, OR.
u.S. FiSh and wiLdLiFe ServiCe (uSFwS). 2009. Marbled Murrelet (Brachyramphus marmoratus): 5year review. washington fish and wildlife Office, lacey, wA.
This content downloaded by the authorized user from 192.168.52.68 on Wed, 5 Dec 2012 08:36:58 AMAll use subject to JSTOR Terms and Conditions