final report orangutan population
TRANSCRIPT
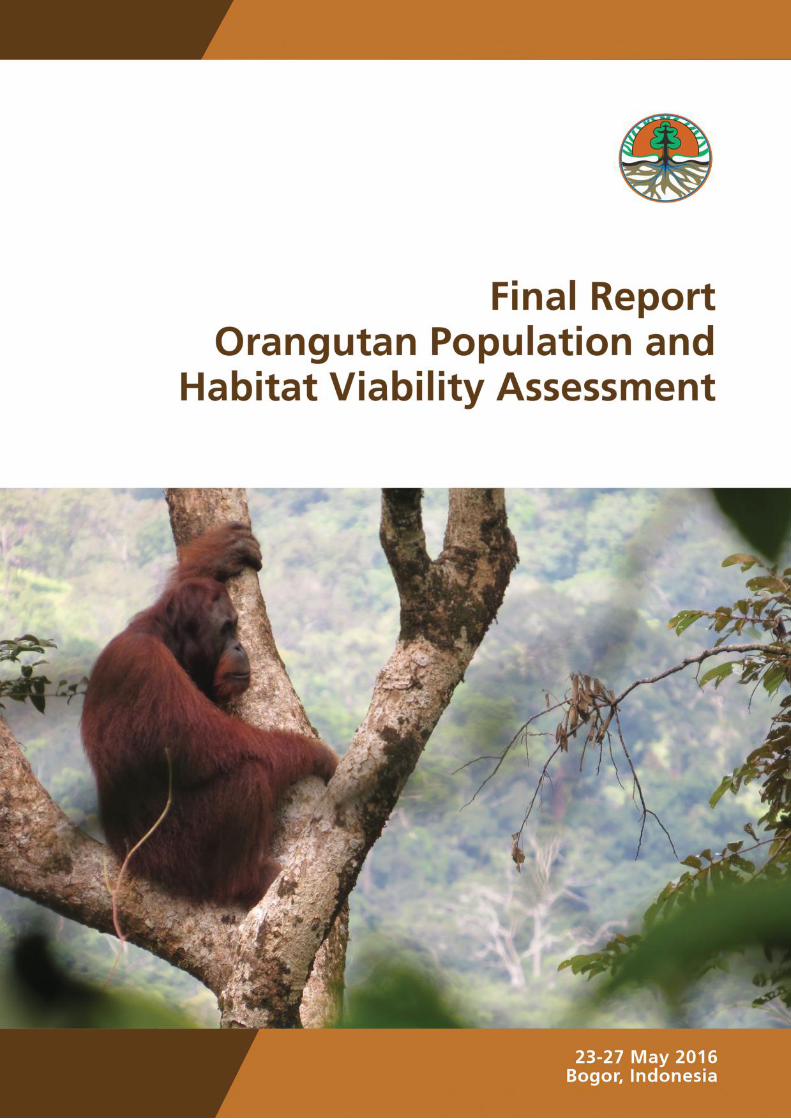
Final ReportOrangutan Population
and Habitat Viability Assessment
23-27 May 2016Bogor, Indonesia

Map credits: Forum Orangutan Indonesia© Photo Credit : FS Ngindang (Mensiau Community, Kapuas Hulu, West Kalimantan)© Copyright Ministry of Environment and Forestry of Indonesia 2017
A contribution of the IUCN SSC Conservation Breeding Specialist Group
Utami-Atmoko, S. Traylor-Holzer, K. Rifqi, M.A., Siregar, P.G., Achmad, B., Priadjati, A., Husson, S., Wich, S., Hadisiswoyo, P., Saputra, F., Campbell-Smith, G., Kuncoro, P., Russon, A., Voigt, M., Santika, T., Nowak, M., Singleton, I., Sapari, I., Meididit, A., Chandradewi, D.S., Ripoll Capilla, B., Ermayanti, Lees, C.M. (eds.) (2017) Orangutan Population and Habitat Viability Assessment: Final Report. IUCN/SSC Conservation Breeding Specialist Group, Apple Valley, MN.
IUCN encourages meetings, workshops and other fora for the consideration and analysis of issues related to conservation, and believes that reports of these meetings are most useful when broadly disseminated. The opinions and views expressed by the authors may not necessarily reflect the formal policies of IUCN, its Commissions, its Secretariat or its members. The designation of geographical entities in this book, and the presentation of the material, do not imply the expression of any opinion whatsoever on the part of IUCN concerning the legal status of any country, territory, or area, or of its authorities, or concerning the delimitation of its frontiers or boundaries.
Copies of the Orangutan Population and Habitat Viability Assessment 2017 can be downloaded from: www.cbsg.org and forina.or.id
Final ReportOrangutan Population and
Habitat Viability Assessment
23-27 May, 2016Bogor, Indonesia
Final Repor Orangutan Population and H
abitat Viability A
ssessment 2016
Population and Habitat Viability Assessment
23-27 May, 2016
Bogor Indonesia
The Directorate General of Natural Resources and Ecosystem
Conservation, Ministry of Environment and Forestry of Indonesia
In collaboration with:
Forum Orangutan Indonesia – FORINA
Orangutan Foundation-United Kingdom
IUCN SSC Primate Specialist Group
IUCN SSC Conservation Breeding Specialist Group

Content 5Acronyms And Abbreviations 6Executive Summary 9 The 2016 PHVA Workshop 11 GIS And PVA Models 14 Results 14 Recommendations And Next Steps 21Steering Committee Notes 23Threats To The Conservation Of Orangutans 27 Habitat Loss And Degradation 27 Hunting,IllegalCaptureAndConflict 30 Fire 31 Small Population Size, Reintroduction And Disease 32 Potential Mitigation Strategies 33Working Group 37 Pongo abelii 37 Pongo pygmaeus morio 40 Pongo pygmaeus pygmaeus 43 Pongo pygmaeus wurmbii 47Orangutan Population Viability Analysis Modelling Report 51 Introduction 51 Model Parameters And Input Values 53 Sensitivity Testing 56 ImpactsofPopulationSize:DefiningMinimumViablePopulationSize 59 MVP Under Alternative Conditions 62 Viability of Sumatran Orangutan Populations 66 Viability of Bornean Orangutan Populations 76 Summary of PVA Modelling Results 86Summary 89Orangutan GIS Models 91 Introduction 91 Approach 91 Current Orangutan Numbers For Borneo 92 Insights 92 Estimated Yearly Deforestation Rates For Use As Threat Estimates For The Pva Models 93References 94Appendix I Gathering Information 97Appendix II. PHVA Collaborators 99Appendix III. Data For Pongo abelii 103Appendix IV. Data For Pongo pygmaeus morio 109Appendix V. Data For Pongo pygmaeus pygmaeus 118Appendix VI. Data For Pongo pygmaeus wurmbii 121
Content
5Orangutan Population and Habitat Viability Assessment
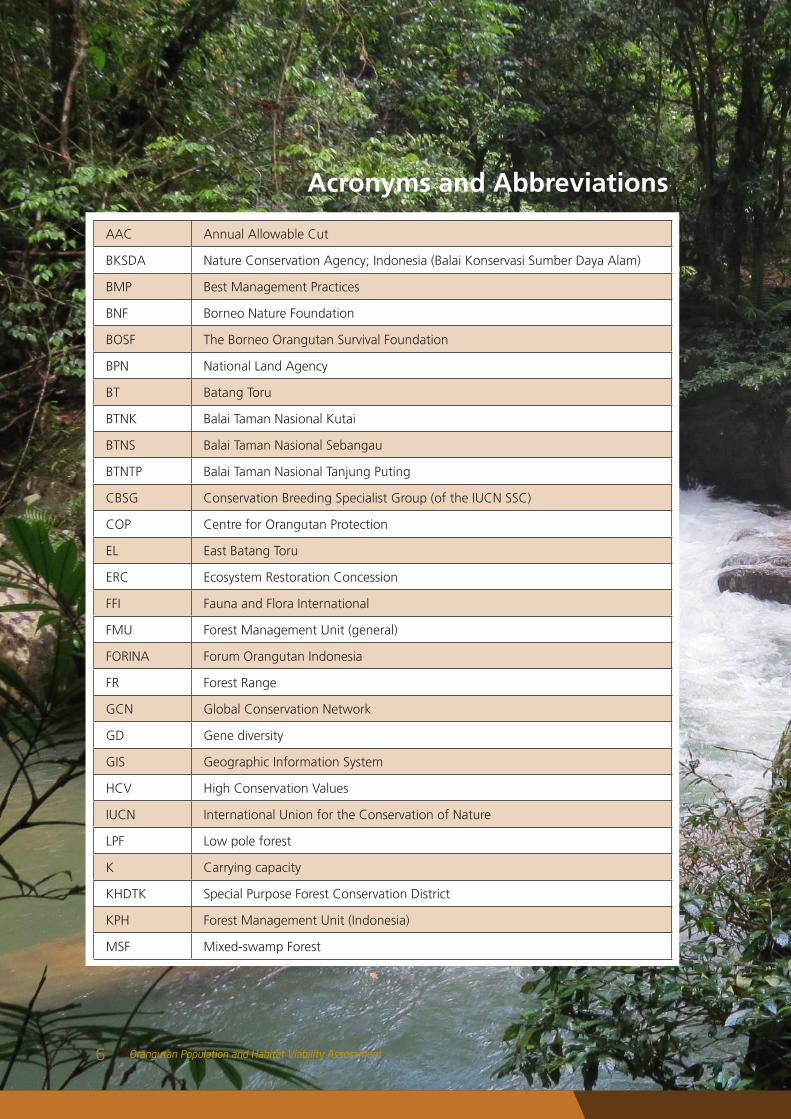
AAC Annual Allowable Cut
BKSDA Nature Conservation Agency; Indonesia (Balai Konservasi Sumber Daya Alam)
BMP Best Management Practices
BNF Borneo Nature Foundation
BOSF The Borneo Orangutan Survival Foundation
BPN National Land Agency
BT Batang Toru
BTNK Balai Taman Nasional Kutai
BTNS Balai Taman Nasional Sebangau
BTNTP Balai Taman Nasional Tanjung Puting
CBSG Conservation Breeding Specialist Group (of the IUCN SSC)
COP Centre for Orangutan Protection
EL East Batang Toru
ERC Ecosystem Restoration Concession
FFI Fauna and Flora International
FMU Forest Management Unit (general)
FORINA Forum Orangutan Indonesia
FR Forest Range
GCN Global Conservation Network
GD Gene diversity
GIS Geographic Information System
HCV High Conservation Values
IUCN International Union for the Conservation of Nature
LPF Low pole forest
K Carrying capacity
KHDTK Special Purpose Forest Conservation District
KPH Forest Management Unit (Indonesia)
MSF Mixed-swamp Forest
Acronyms and Abbreviations
6 Orangutan Population and Habitat Viability Assessment
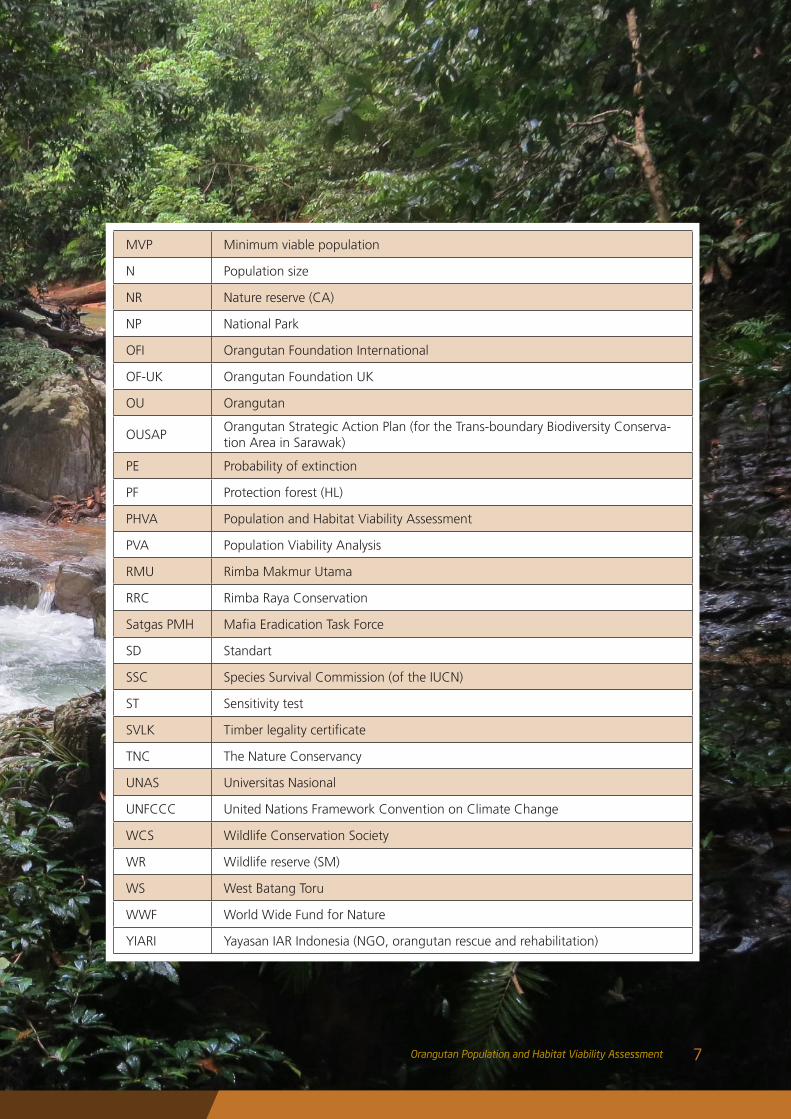
MVP Minimum viable population
N Population size
NR Nature reserve (CA)
NP National Park
OFI Orangutan Foundation International
OF-UK Orangutan Foundation UK
OU Orangutan
OUSAPOrangutan Strategic Action Plan (for the Trans-boundary Biodiversity Conserva-tion Area in Sarawak)
PE Probability of extinction
PF Protection forest (HL)
PHVA Population and Habitat Viability Assessment
PVA Population Viability Analysis
RMU Rimba Makmur Utama
RRC Rimba Raya Conservation
Satgas PMH MafiaEradicationTaskForce
SD Standart
SSC Species Survival Commission (of the IUCN)
ST Sensitivity test
SVLK Timberlegalitycertificate
TNC The Nature Conservancy
UNAS Universitas Nasional
UNFCCC United Nations Framework Convention on Climate Change
WCS Wildlife Conservation Society
WR Wildlife reserve (SM)
WS West Batang Toru
WWF World Wide Fund for Nature
YIARI Yayasan IAR Indonesia (NGO, orangutan rescue and rehabilitation)
7Orangutan Population and Habitat Viability Assessment

8 Orangutan Population and Habitat Viability Assessment
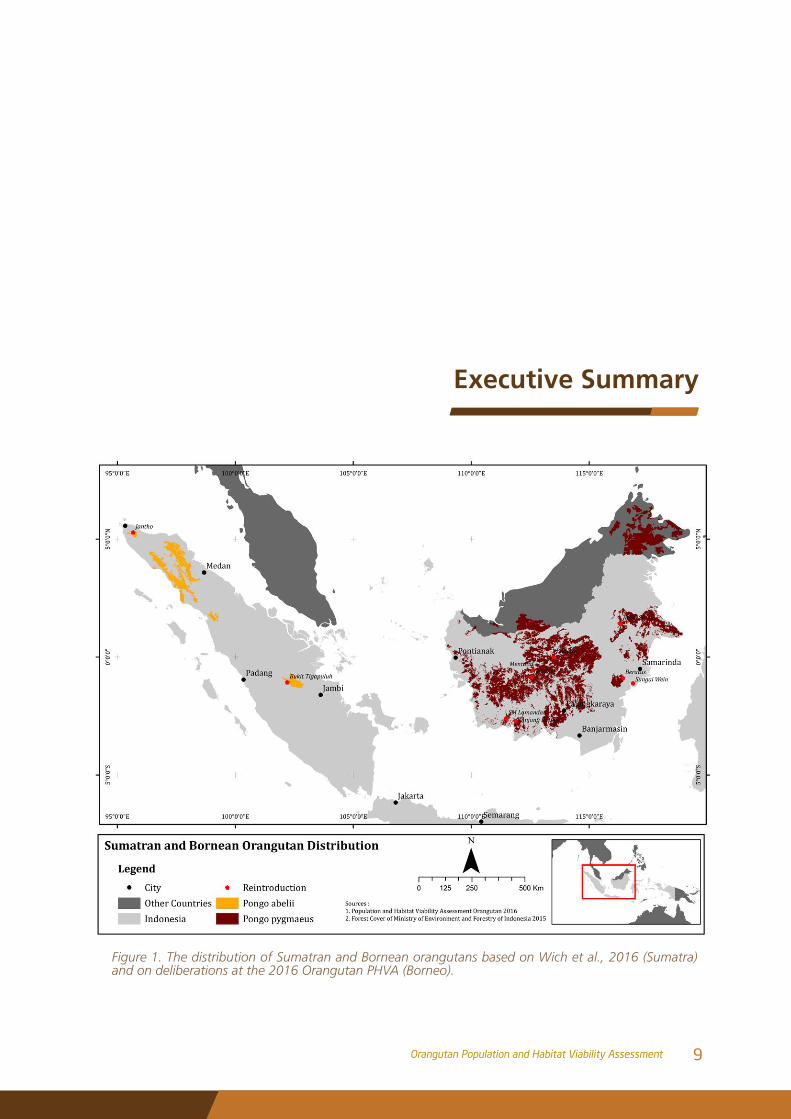
Figure 1. The distribution of Sumatran and Bornean orangutans based on Wich et al., 2016 (Sumatra) and on deliberations at the 2016 Orangutan PHVA (Borneo).
Executive Summary
9Orangutan Population and Habitat Viability Assessment
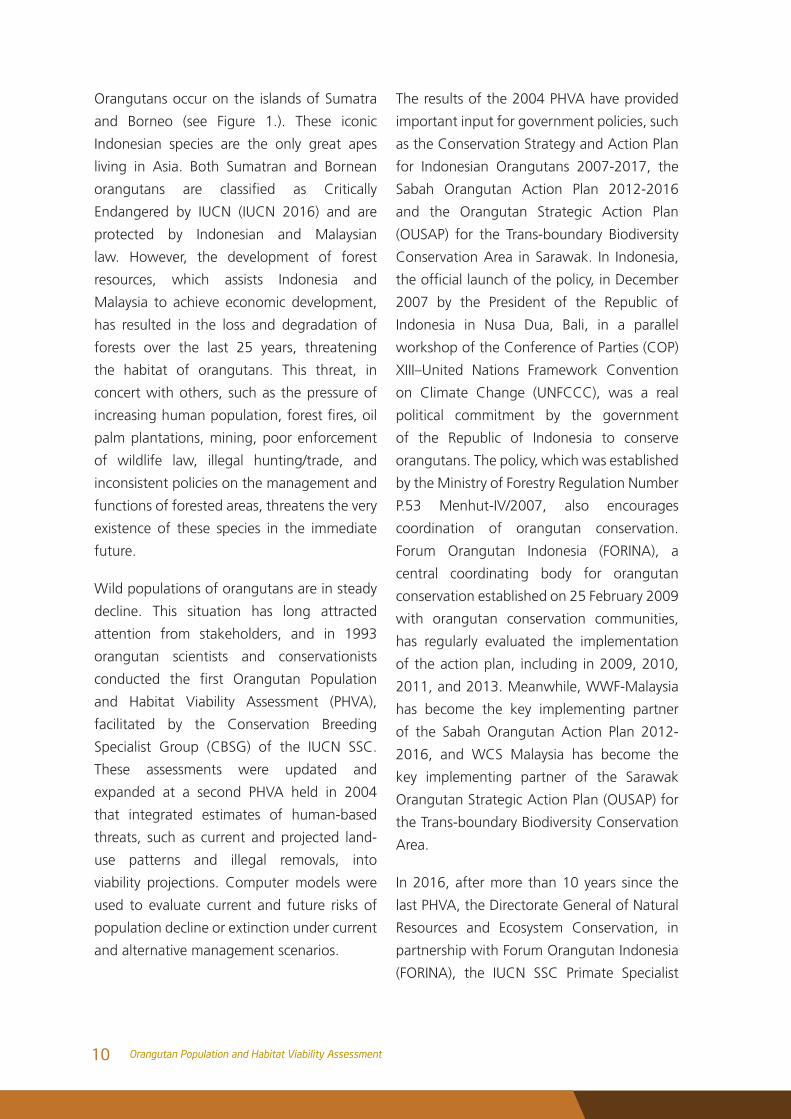
Orangutans occur on the islands of Sumatra
and Borneo (see Figure 1.). These iconic
Indonesian species are the only great apes
living in Asia. Both Sumatran and Bornean
orangutans are classified as Critically
Endangered by IUCN (IUCN 2016) and are
protected by Indonesian and Malaysian
law. However, the development of forest
resources, which assists Indonesia and
Malaysia to achieve economic development,
has resulted in the loss and degradation of
forests over the last 25 years, threatening
the habitat of orangutans. This threat, in
concert with others, such as the pressure of
increasinghumanpopulation,forestfires,oil
palm plantations, mining, poor enforcement
of wildlife law, illegal hunting/trade, and
inconsistent policies on the management and
functions of forested areas, threatens the very
existence of these species in the immediate
future.
Wild populations of orangutans are in steady
decline. This situation has long attracted
attention from stakeholders, and in 1993
orangutan scientists and conservationists
conducted the first Orangutan Population
and Habitat Viability Assessment (PHVA),
facilitated by the Conservation Breeding
Specialist Group (CBSG) of the IUCN SSC.
These assessments were updated and
expanded at a second PHVA held in 2004
that integrated estimates of human-based
threats, such as current and projected land-
use patterns and illegal removals, into
viability projections. Computer models were
used to evaluate current and future risks of
population decline or extinction under current
and alternative management scenarios.
The results of the 2004 PHVA have provided
important input for government policies, such
as the Conservation Strategy and Action Plan
for Indonesian Orangutans 2007-2017, the
Sabah Orangutan Action Plan 2012-2016
and the Orangutan Strategic Action Plan
(OUSAP) for the Trans-boundary Biodiversity
Conservation Area in Sarawak. In Indonesia,
theofficiallaunchofthepolicy,inDecember
2007 by the President of the Republic of
Indonesia in Nusa Dua, Bali, in a parallel
workshop of the Conference of Parties (COP)
XIII–United Nations Framework Convention
on Climate Change (UNFCCC), was a real
political commitment by the government
of the Republic of Indonesia to conserve
orangutans. The policy, which was established
by the Ministry of Forestry Regulation Number
P.53 Menhut-IV/2007, also encourages
coordination of orangutan conservation.
Forum Orangutan Indonesia (FORINA), a
central coordinating body for orangutan
conservation established on 25 February 2009
with orangutan conservation communities,
has regularly evaluated the implementation
of the action plan, including in 2009, 2010,
2011, and 2013. Meanwhile, WWF-Malaysia
has become the key implementing partner
of the Sabah Orangutan Action Plan 2012-
2016, and WCS Malaysia has become the
key implementing partner of the Sarawak
Orangutan Strategic Action Plan (OUSAP) for
the Trans-boundary Biodiversity Conservation
Area.
In 2016, after more than 10 years since the
last PHVA, the Directorate General of Natural
Resources and Ecosystem Conservation, in
partnership with Forum Orangutan Indonesia
(FORINA), the IUCN SSC Primate Specialist
10 Orangutan Population and Habitat Viability Assessment
Group and the Orangutan Foundation-United
Kingdom (OF-UK), conducted the third PHVA
for orangutans. The IUCN SSC Conservation
Breeding Specialist Group provided neutral
facilitation and population viability analyses,
and the workshop was made possible by a
From 24-27 May 2016, 84 experts from 50
organisations gathered in Bogor, Indonesia, to
share information on orangutan distribution,
abundance, threats and conservation
activities. On Day 1, the opening address was
given by Ir. Bambang Dahono Adjie, MM,
MSi (Director of Biodiversity Conservation of
the Ministry of Environment and Forestry),
grant from Arcus Foundation. The resulting
assessment, which is documented in this
report, will provide important input for the
revision of the national conservation strategy
and action plan, the planning period for
which ends in 2017.
The 2016 PHVA Workshop
setting the scene for workshop discussions.
A series of brief presentations aimed to bring
participants to a common understanding
of the current situation for orangutans, the
challenges ahead, and to some of the tools
available to help plan conservation action for
the species.
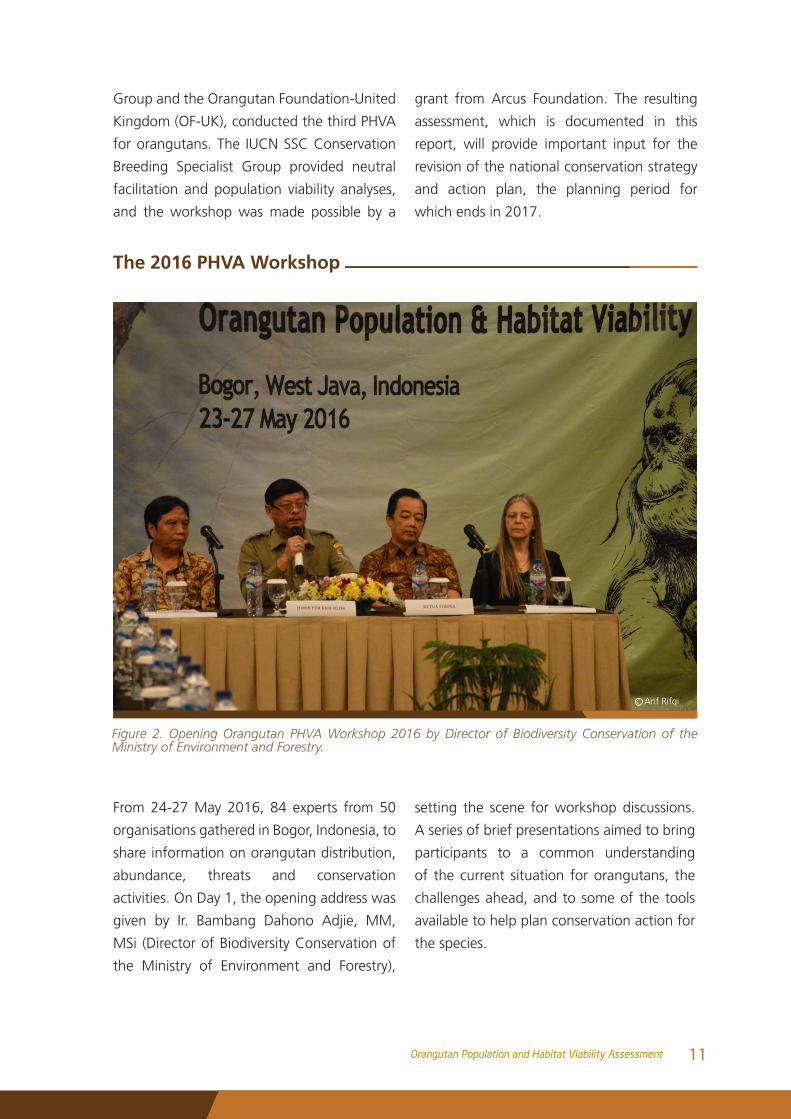
Figure 2. Opening Orangutan PHVA Workshop 2016 by Director of Biodiversity Conservation of the Ministry of Environment and Forestry.
Arif Rifqic
11Orangutan Population and Habitat Viability Assessment
List of presentations:
• Introduction to IUCN SSC CBSG workshop processes (CBSG, Caroline Lees)
• Status review: a summary of the range-wide status of orangutans (FORINA-UNAS,
Sri Suci Utami Atmoko)
• Progress report on the implementation of the Indonesian Orangutan Conservation
Strategies and Action Plan 2007-2017 (Ministry of Environment and Forestry
representative, Puja Utama.)
• Mixed survey analysis revealed declines in abundance of Bornean orangutans
(Pongo pygmaeus) (Queensland University, Truly Santika)
• Modeling the density distribution of Bornean orangutans (Max Planck Institute,
Maria Voigt)
• Overview of past and current orangutan Vortex models (IUCN SSC CBSG, Kathy
Traylor-Holzer)
• Following the presentations, participants began work to:
• Update the collective estimate of the distribution and status of orangutans.
• Review and revise what is known about the issues threatening orangutans.
• Review and revise recommendations for priority conservation strategies for the
four taxa.
Working groups were formed around each
of the four taxa. Orangutans are currently
distributed across a large geographic area.
Within this area there is considerable variation
in orangutan numbers, densities, degree of
population fragmentation, and nature and
severity of human-mediated risks. To explore
species viability across this varied landscape
itwasfirstnecessarytodivideitintosmaller
population units, using the maps and
information available. Each working group
began by breaking down the geographic
range of their taxon into a number of
discrete, area-based population units, using
the following hierarchy:
a. Regional units: large, relatively well-
defined regions within the range of
each taxon.
b. Meta-population units: areas within
regional units bounded by rivers, roads
andindustryorothersignificantbarriers
to orangutan movement.
c. Habitat blocks: areas of roughly
contiguous habitat within meta-
population units.
d. Sub-blocks:specificsitesofinterestor
within habitat blocks, such as national
parks.
12 Orangutan Population and Habitat Viability Assessment
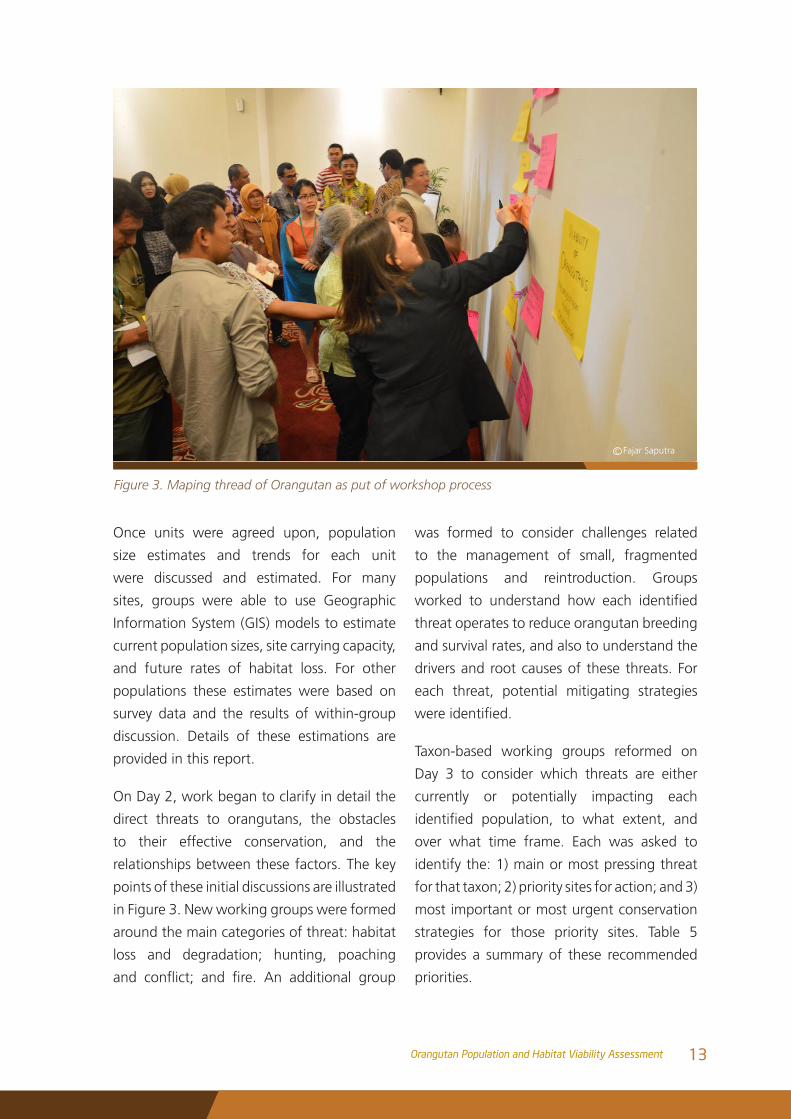
Once units were agreed upon, population
size estimates and trends for each unit
were discussed and estimated. For many
sites, groups were able to use Geographic
Information System (GIS) models to estimate
current population sizes, site carrying capacity,
and future rates of habitat loss. For other
populations these estimates were based on
survey data and the results of within-group
discussion. Details of these estimations are
provided in this report.
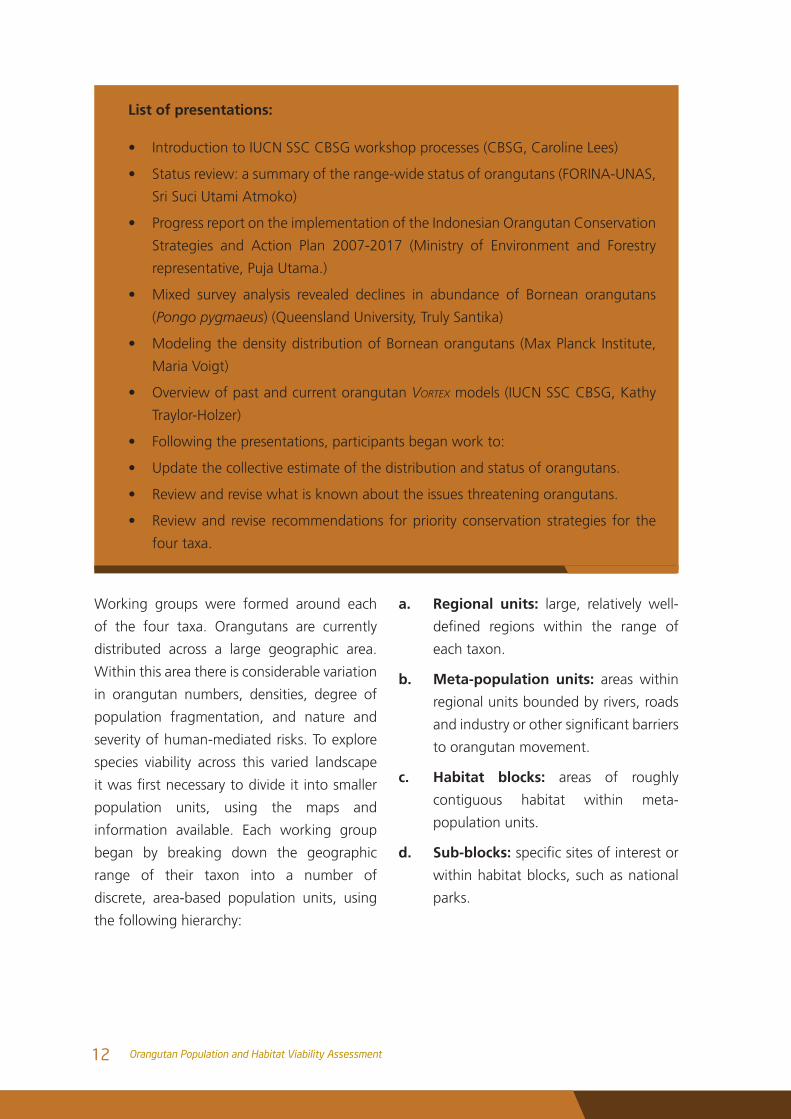
On Day 2, work began to clarify in detail the
direct threats to orangutans, the obstacles
to their effective conservation, and the
relationships between these factors. The key
points of these initial discussions are illustrated
in Figure 3. New working groups were formed
around the main categories of threat: habitat
loss and degradation; hunting, poaching
and conflict; and fire. An additional group
was formed to consider challenges related
to the management of small, fragmented
populations and reintroduction. Groups
worked to understand how each identified
threat operates to reduce orangutan breeding
and survival rates, and also to understand the
drivers and root causes of these threats. For
each threat, potential mitigating strategies
wereidentified.
Taxon-based working groups reformed on
Day 3 to consider which threats are either
currently or potentially impacting each
identified population, to what extent, and
over what time frame. Each was asked to
identify the: 1) main or most pressing threat
for that taxon; 2) priority sites for action; and 3)
most important or most urgent conservation
strategies for those priority sites. Table 5
provides a summary of these recommended
priorities.
Figure 3. Maping thread of Orangutan as put of workshop process
Fajar Saputrac
13Orangutan Population and Habitat Viability Assessment
GIS and PVA modelsPreliminary GIS models were built for
Sumatran and Bornean orangutans prior
to the workshop and were refined during
the PHVA. For sites where sufficient data
exist, modellers were able to relate forest
characteristics and patterns of human-use to
observed orangutan density. These general
rules were applied to areas for which survey
data are absent or highly uncertain, to create
systematic estimates of range-wide orangutan
distribution and abundance.
Throughout the workshop and in the months
following, population viability analysis (PVA)
models were developed by revising previous
PVA models based on information provided
by the working groups. The models were
built to consider the specific circumstances
of individual populations and the expected
impact of these circumstances on future
viability. Wherever possible, to provide
transparency and consistency, GIS-derived
estimates were used in the PVA models for
starting population size, site carry capacity,
and expected future rates of habitat loss to
orangutans. This was not always possible.
At some smaller sites, survey data were
considered more reliable than GIS estimates
and in others it was not possible, in the time
available, to align the GIS spatial designations
withthecomplexsiteboundariesdefinedby
working groups. This is an area for future
work.
Results
In total, the working groups identified 55
population and metapopulation units for PVA
analysis across Sumatra and Borneo, with
population size estimates ranging from as few
as 10 to as many as 10,450 individuals. As
far as possible, threats to orangutans at each
site were identified, the estimated impact
quantified,andtheseeffects included inthe
models.Abreakdownofthemainfindingsis
provided below, by taxon.
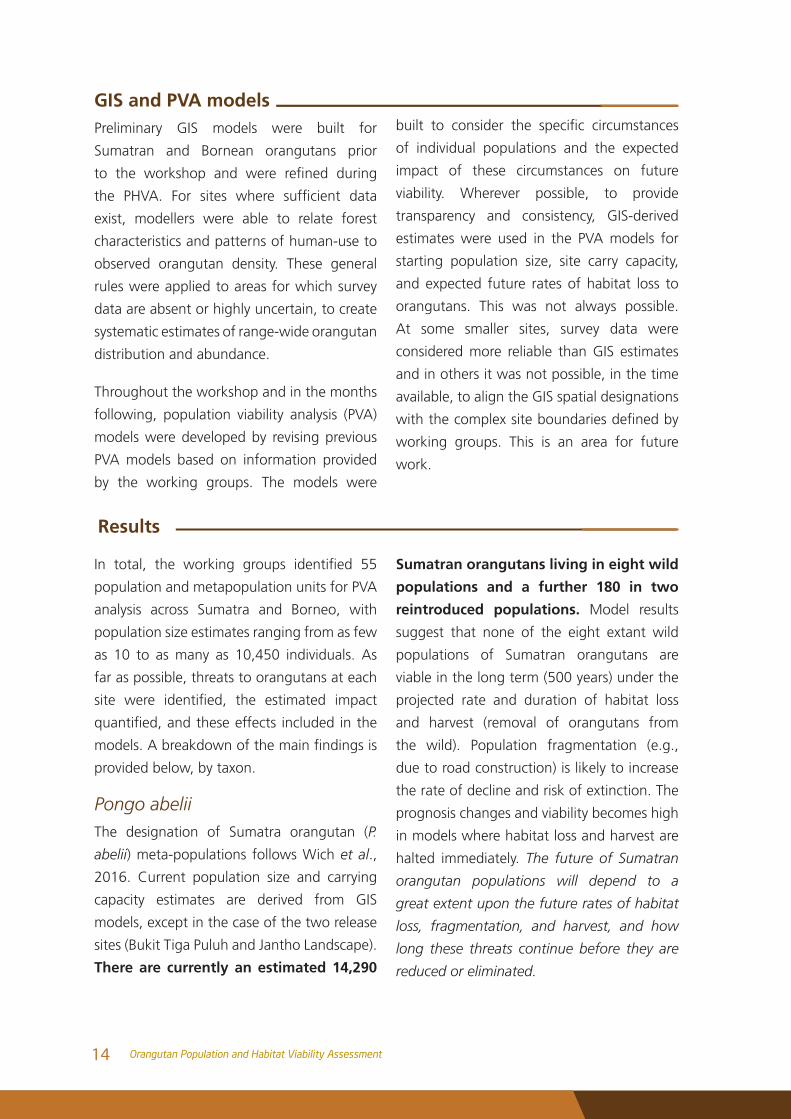
Pongo abeliiThe designation of Sumatra orangutan (P.
abelii) meta-populations follows Wich et al.,
2016. Current population size and carrying
capacity estimates are derived from GIS
models, except in the case of the two release
sites (Bukit Tiga Puluh and Jantho Landscape).
There are currently an estimated 14,290
Sumatran orangutans living in eight wild
populations and a further 180 in two
reintroduced populations. Model results
suggest that none of the eight extant wild
populations of Sumatran orangutans are
viable in the long term (500 years) under the
projected rate and duration of habitat loss
and harvest (removal of orangutans from
the wild). Population fragmentation (e.g.,
due to road construction) is likely to increase
the rate of decline and risk of extinction. The
prognosis changes and viability becomes high
in models where habitat loss and harvest are
halted immediately. The future of Sumatran
orangutan populations will depend to a
great extent upon the future rates of habitat
loss, fragmentation, and harvest, and how
long these threats continue before they are
reduced or eliminated.
14 Orangutan Population and Habitat Viability Assessment
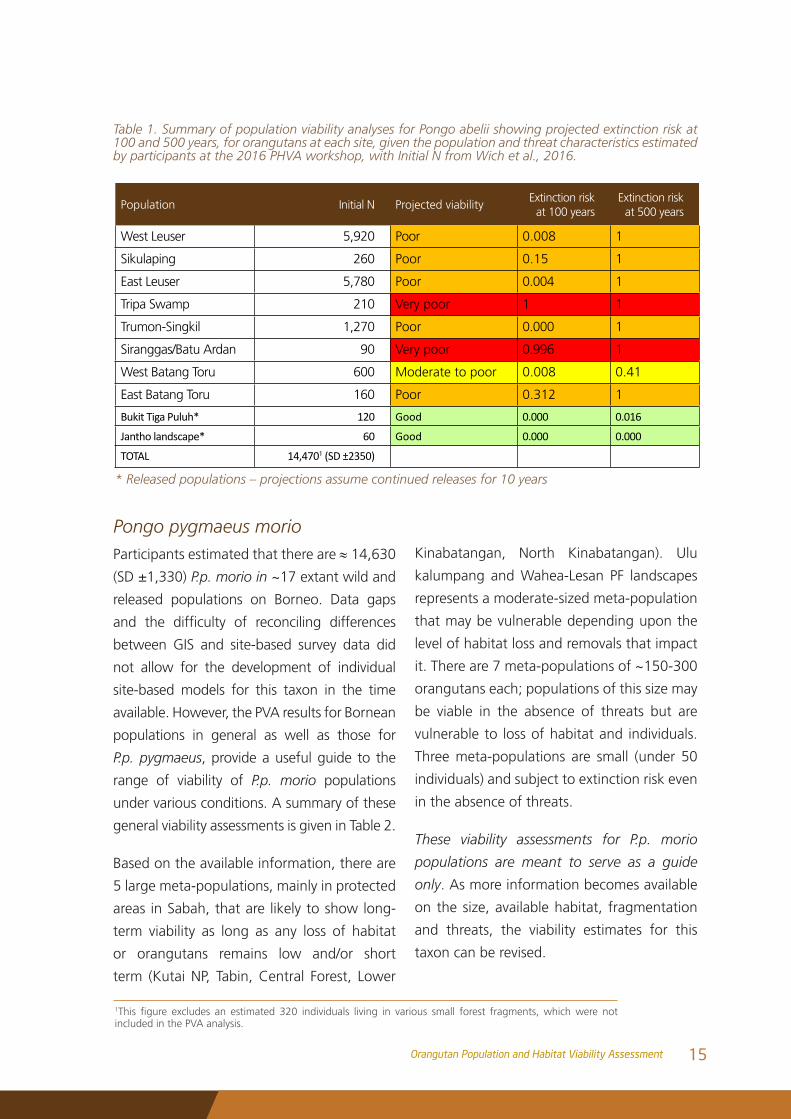
Table 1. Summary of population viability analyses for Pongo abelii showing projected extinction risk at 100 and 500 years, for orangutans at each site, given the population and threat characteristics estimated by participants at the 2016 PHVA workshop, with Initial N from Wich et al., 2016.
Population Initial N Projected viabilityExtinction risk
at 100 yearsExtinction risk
at 500 years
West Leuser 5,920 Poor 0.008 1
Sikulaping 260 Poor 0.15 1
East Leuser 5,780 Poor 0.004 1
Tripa Swamp 210 Very poor 1 1
Trumon-Singkil 1,270 Poor 0.000 1
Siranggas/Batu Ardan 90 Very poor 0.996 1
West Batang Toru 600 Moderate to poor 0.008 0.41
East Batang Toru 160 Poor 0.312 1
Bukit Tiga Puluh* 120 Good 0.000 0.016
Jantho landscape* 60 Good 0.000 0.000
TOTAL 14,4701 (SD ±2350)
* Released populations – projections assume continued releases for 10 years
Pongo pygmaeus morioParticipants estimated that there are ≈ 14,630
(SD ±1,330) P.p. morio in ~17 extant wild and
released populations on Borneo. Data gaps
and the difficulty of reconciling differences
between GIS and site-based survey data did
not allow for the development of individual
site-based models for this taxon in the time
available. However, the PVA results for Bornean
populations in general as well as those for
P.p. pygmaeus, provide a useful guide to the
range of viability of P.p. morio populations
under various conditions. A summary of these
general viability assessments is given in Table 2.
Based on the available information, there are
5 large meta-populations, mainly in protected
areas in Sabah, that are likely to show long-
term viability as long as any loss of habitat
or orangutans remains low and/or short
term (Kutai NP, Tabin, Central Forest, Lower
Kinabatangan, North Kinabatangan). Ulu
kalumpang and Wahea-Lesan PF landscapes
represents a moderate-sized meta-population
that may be vulnerable depending upon the
level of habitat loss and removals that impact
it. There are 7 meta-populations of ~150-300
orangutans each; populations of this size may
be viable in the absence of threats but are
vulnerable to loss of habitat and individuals.
Three meta-populations are small (under 50
individuals) and subject to extinction risk even
in the absence of threats.
These viability assessments for P.p. morio
populations are meant to serve as a guide
only. As more information becomes available
on the size, available habitat, fragmentation
and threats, the viability estimates for this
taxon can be revised.
1This figure excludes an estimated 320 individuals living in various small forest fragments,whichwere notincluded in the PVA analysis.
15Orangutan Population and Habitat Viability Assessment
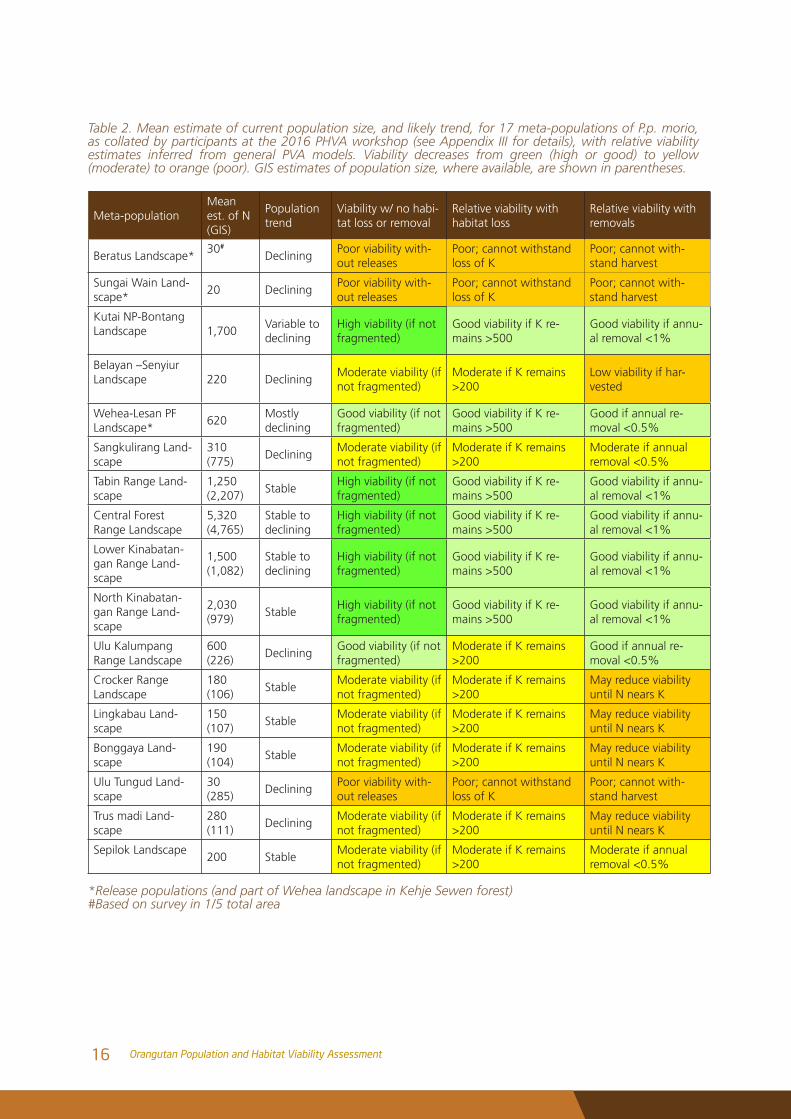
Table 2. Mean estimate of current population size, and likely trend, for 17 meta-populations of P.p. morio, as collated by participants at the 2016 PHVA workshop (see Appendix III for details), with relative viability estimates inferred from general PVA models. Viability decreases from green (high or good) to yellow (moderate) to orange (poor). GIS estimates of population size, where available, are shown in parentheses.
Meta-populationMean est. of N (GIS)
Population trend
Viability w/ no habi-tat loss or removal
Relative viability with habitat loss
Relative viability with removals
Beratus Landscape*30#
DecliningPoor viability with-out releases
Poor; cannot withstand loss of K
Poor; cannot with-stand harvest
Sungai Wain Land-scape*
20 DecliningPoor viability with-out releases
Poor; cannot withstand loss of K
Poor; cannot with-stand harvest
Kutai NP-Bontang Landscape 1,700
Variable to declining
High viability (if not fragmented)
Good viability if K re-mains >500
Good viability if annu-al removal <1%
Belayan –Senyiur Landscape 220 Declining
Moderate viability (if not fragmented)
Moderate if K remains >200
Low viability if har-vested
Wehea-Lesan PF Landscape*
620Mostly declining
Good viability (if not fragmented)
Good viability if K re-mains >500
Good if annual re-moval <0.5%
Sangkulirang Land-scape
310(775)
DecliningModerate viability (if not fragmented)
Moderate if K remains >200
Moderate if annual removal <0.5%
Tabin Range Land-scape
1,250(2,207)
StableHigh viability (if not fragmented)
Good viability if K re-mains >500
Good viability if annu-al removal <1%
Central Forest Range Landscape
5,320(4,765)
Stable to declining
High viability (if not fragmented)
Good viability if K re-mains >500
Good viability if annu-al removal <1%
Lower Kinabatan-gan Range Land-scape
1,500(1,082)
Stable to declining
High viability (if not fragmented)
Good viability if K re-mains >500
Good viability if annu-al removal <1%
North Kinabatan-gan Range Land-scape
2,030(979)
StableHigh viability (if not fragmented)
Good viability if K re-mains >500
Good viability if annu-al removal <1%
Ulu Kalumpang Range Landscape
600(226)
DecliningGood viability (if not fragmented)
Moderate if K remains >200
Good if annual re-moval <0.5%
Crocker Range Landscape
180(106)
StableModerate viability (if not fragmented)
Moderate if K remains >200
May reduce viability until N nears K
Lingkabau Land-scape
150 (107)
StableModerate viability (if not fragmented)
Moderate if K remains >200
May reduce viability until N nears K
Bonggaya Land-scape
190 (104)
StableModerate viability (if not fragmented)
Moderate if K remains >200
May reduce viability until N nears K
Ulu Tungud Land-scape
30(285)
DecliningPoor viability with-out releases
Poor; cannot withstand loss of K
Poor; cannot with-stand harvest
Trus madi Land-scape
280(111)
DecliningModerate viability (if not fragmented)
Moderate if K remains >200
May reduce viability until N nears K
Sepilok Landscape 200 Stable
Moderate viability (if not fragmented)
Moderate if K remains >200
Moderate if annual removal <0.5%
*Release populations (and part of Wehea landscape in Kehje Sewen forest)#Based on survey in 1/5 total area
16 Orangutan Population and Habitat Viability Assessment
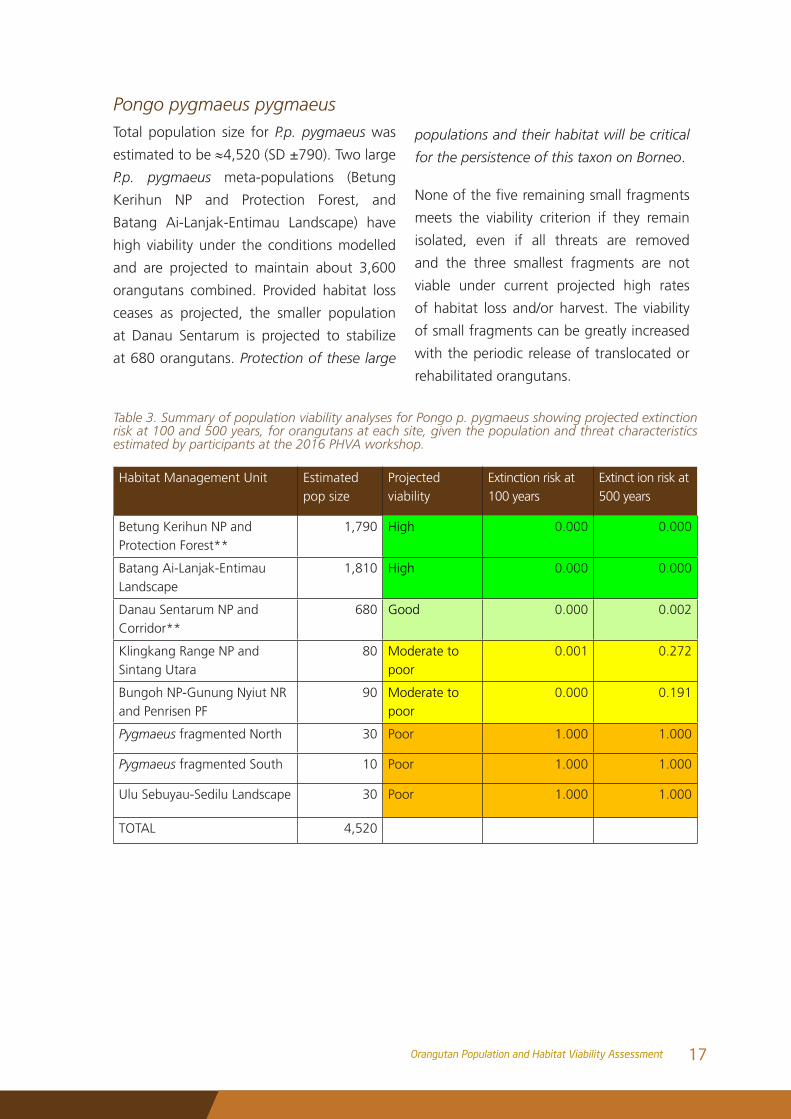
Pongo pygmaeus pygmaeusTotal population size for P.p. pygmaeus was
estimated to be ≈4,520 (SD ±790). Two large
P.p. pygmaeus meta-populations (Betung
Kerihun NP and Protection Forest, and
Batang Ai-Lanjak-Entimau Landscape) have
high viability under the conditions modelled
and are projected to maintain about 3,600
orangutans combined. Provided habitat loss
ceases as projected, the smaller population
at Danau Sentarum is projected to stabilize
at 680 orangutans. Protection of these large
populations and their habitat will be critical
for the persistence of this taxon on Borneo.
Noneofthefiveremainingsmallfragments
meets the viability criterion if they remain
isolated, even if all threats are removed
and the three smallest fragments are not
viable under current projected high rates
of habitat loss and/or harvest. The viability
of small fragments can be greatly increased
with the periodic release of translocated or
rehabilitated orangutans.
Table 3. Summary of population viability analyses for Pongo p. pygmaeus showing projected extinction risk at 100 and 500 years, for orangutans at each site, given the population and threat characteristics estimated by participants at the 2016 PHVA workshop.
Habitat Management Unit Estimated pop size
Projected viability
Extinction risk at 100 years
Extinct ion risk at 500 years
Betung Kerihun NP and Protection Forest**
1,790 High 0.000 0.000
Batang Ai-Lanjak-Entimau Landscape
1,810 High 0.000 0.000
Danau Sentarum NP and Corridor**
680 Good 0.000 0.002
Klingkang Range NP and Sintang Utara
80 Moderate to poor
0.001 0.272
Bungoh NP-Gunung Nyiut NR and Penrisen PF
90 Moderate to poor
0.000 0.191
Pygmaeus fragmented North 30 Poor 1.000 1.000
Pygmaeus fragmented South 10 Poor 1.000 1.000
Ulu Sebuyau-Sedilu Landscape 30 Poor 1.000 1.000
TOTAL 4,520
17Orangutan Population and Habitat Viability Assessment
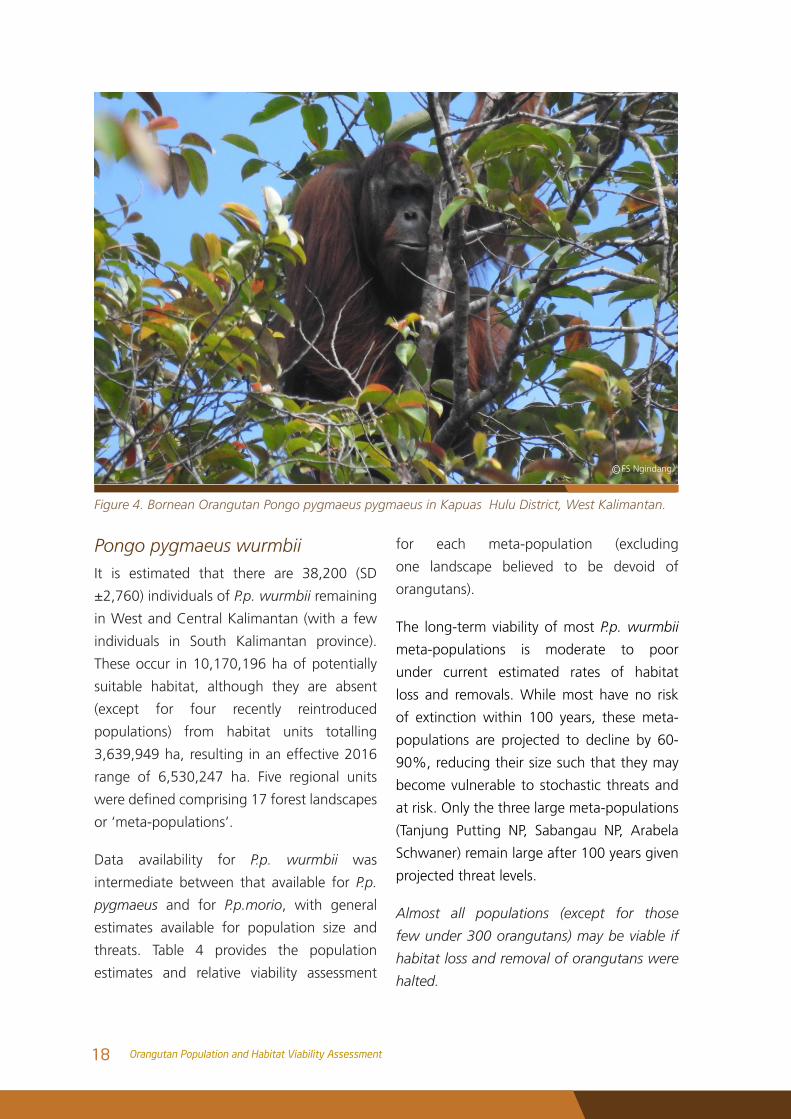
Pongo pygmaeus wurmbiiIt is estimated that there are 38,200 (SD
±2,760) individuals of P.p. wurmbii remaining
in West and Central Kalimantan (with a few
individuals in South Kalimantan province).
These occur in 10,170,196 ha of potentially
suitable habitat, although they are absent
(except for four recently reintroduced
populations) from habitat units totalling
3,639,949 ha, resulting in an effective 2016
range of 6,530,247 ha. Five regional units
weredefinedcomprising17forestlandscapes
or ‘meta-populations’.
Data availability for P.p. wurmbii was
intermediate between that available for P.p.
pygmaeus and for P.p.morio, with general
estimates available for population size and
threats. Table 4 provides the population
estimates and relative viability assessment
for each meta-population (excluding
one landscape believed to be devoid of
orangutans).
The long-term viability of most P.p. wurmbii
meta-populations is moderate to poor
under current estimated rates of habitat
loss and removals. While most have no risk
of extinction within 100 years, these meta-
populations are projected to decline by 60-
90%, reducing their size such that they may
become vulnerable to stochastic threats and
at risk. Only the three large meta-populations
(Tanjung Putting NP, Sabangau NP, Arabela
Schwaner) remain large after 100 years given
projected threat levels.
Almost all populations (except for those
few under 300 orangutans) may be viable if
habitat loss and removal of orangutans were
halted.
Figure 4. Bornean Orangutan Pongo pygmaeus pygmaeus in Kapuas Hulu District, West Kalimantan.
FS Ngindangc
18 Orangutan Population and Habitat Viability Assessment
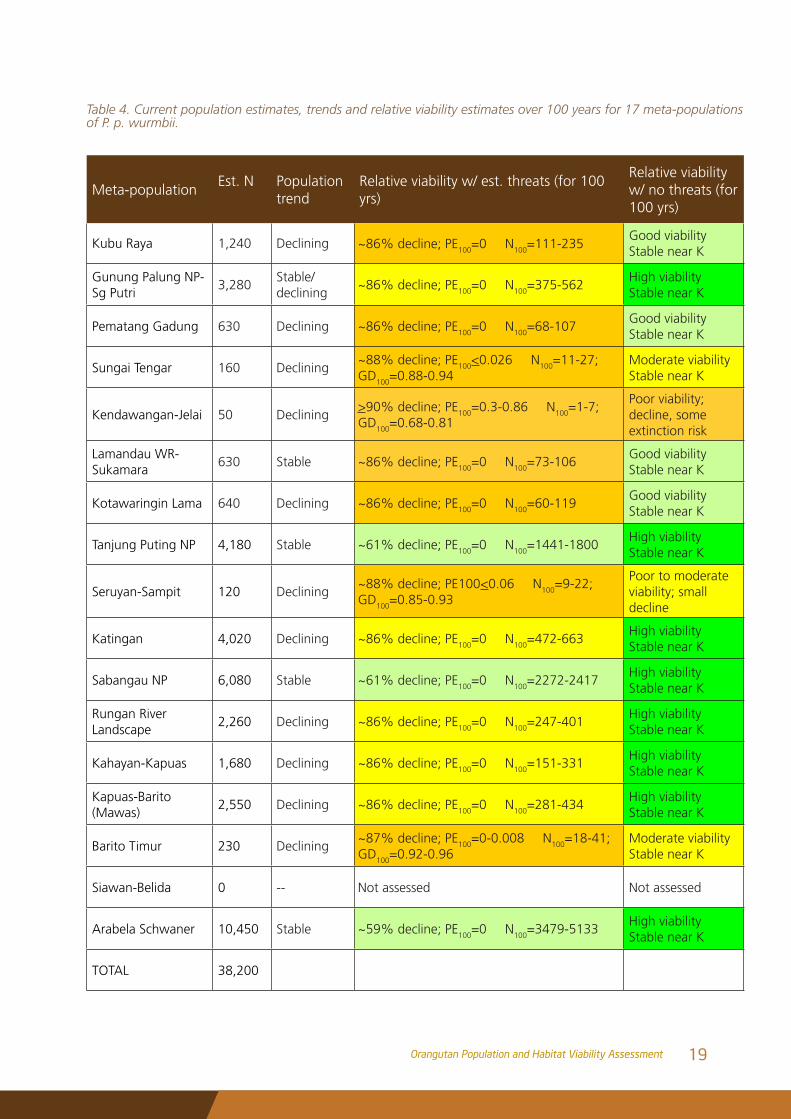
Table 4. Current population estimates, trends and relative viability estimates over 100 years for 17 meta-populations of P. p. wurmbii.
Meta-populationEst. N Population
trend Relative viability w/ est. threats (for 100 yrs)
Relative viability w/ no threats (for 100 yrs)
Kubu Raya 1,240 Declining ~86% decline; PE100=0 N100=111-235Good viability Stable near K
Gunung Palung NP- Sg Putri
3,280Stable/ declining
~86% decline; PE100=0 N100=375-562High viability Stable near K
Pematang Gadung 630 Declining ~86% decline; PE100=0 N100=68-107Good viability Stable near K
Sungai Tengar 160 Declining~88% decline; PE100<0.026 N100=11-27; GD100=0.88-0.94
Moderate viability Stable near K
Kendawangan-Jelai 50 Declining>90% decline; PE100=0.3-0.86 N100=1-7; GD100=0.68-0.81
Poor viability; decline, some extinction risk
Lamandau WR-Sukamara
630 Stable ~86% decline; PE100=0 N100=73-106Good viability Stable near K
Kotawaringin Lama 640 Declining ~86% decline; PE100=0 N100=60-119Good viability Stable near K
Tanjung Puting NP 4,180 Stable ~61% decline; PE100=0 N100=1441-1800High viability Stable near K
Seruyan-Sampit 120 Declining~88% decline; PE100<0.06 N100=9-22; GD100=0.85-0.93
Poor to moderate viability; small decline
Katingan 4,020 Declining ~86% decline; PE100=0 N100=472-663High viability Stable near K
Sabangau NP 6,080 Stable ~61% decline; PE100=0 N100=2272-2417High viabilityStable near K
Rungan River Landscape
2,260 Declining ~86% decline; PE100=0 N100=247-401High viability Stable near K
Kahayan-Kapuas 1,680 Declining ~86% decline; PE100=0 N100=151-331High viability Stable near K
Kapuas-Barito (Mawas)
2,550 Declining ~86% decline; PE100=0 N100=281-434High viability Stable near K
Barito Timur 230 Declining~87% decline; PE100=0-0.008 N100=18-41; GD100=0.92-0.96
Moderate viability Stable near K
Siawan-Belida 0 -- Not assessed Not assessed
Arabela Schwaner 10,450 Stable ~59% decline; PE100=0 N100=3479-5133High viability Stable near K
TOTAL 38,200
19Orangutan Population and Habitat Viability Assessment
Additional AnalysesIn addition to questions about the viability of
individual populations, workshop participants
posed additional questions for the PVA models,
the answers to which can be summarised as
follows:
What is the projected impact on orangutans of
the construction of roads through orangutan
habitat (e.g., in West and East Leuser, in West
and East Batang Toru)?
PVA results for road fragmentation scenarios
in this report are conservative, as they do not
consider potential impacts of roads such as
additional mortality or increased accessibility.
Fragmentation alone did not greatly impact
viability for large populations with no threat
of habitat loss or removals. In the presence
of such threats, fragmentation due to roads
hastens decline and time to extinction and
in most scenarios led to eventual extinction
under current projected threats.
What is the smallest population size that can
meet the agreed standards for a Minimum
Viable Population (MVP)? How does this size
change with different conditions or threat
levels?
For this purpose, workshop participants
definedaviablepopulationasonewith<1%
probability of extinction in 100 years and <
10% probability of extinction in 500 years.
Given this definition, the MVP fis 150 for
Sumatran orangutans and 100 for Bornean
orangutans. However, populations of 100-
150 demonstrate a slow declining trend
and reduced gene diversity (i.e., inbreeding
accumulation). A minimum population of
200 orangutans is needed for both species to
retain 90% GD for 500 years, and at least 500
orangutans are needed to stabilize population
size and avoid decline. All of these thresholds
are higher if the initial animals are related or
subject to increased threats.
What is the smallest current population that
could meet the MVP standard if allowed
space to grow larger (e.g., reintroductions
into a new area, additional habitat added to
an existing area)?
Populations of at least 50 orangutans are
able to meet the MVP standard if they have
sufficientspacetogrow,providedtheyarenot
under threat of habitat loss, fragmentation
or harvest. These results are based on the
current PVA model, which incorporates
density-dependent reproduction and thus
allows populations to grow at a faster rate at
low density.
What level of periodic supplementation
would be needed to maintain the viability of
small populations below the MVP?
The supplementation rate required will
depend upon the population size and threat
levels. PVA results suggest that the addition of
one young adult female every ~35 years can
provide viability to a population of 50, while a
population of 20 may need supplementation
with one adult female every 13 years. Very
small fragments may be at risk of losing their
only breeding male and may require addition
of an adult male in some cases.
20 Orangutan Population and Habitat Viability Assessment
What is the viability of populations established
using a specified reintroduction scheme?
Release strategies may vary the age, sex and
number of orangutans released as well as the
length and schedule of release. A thorough
assessment of reintroduction schemes is
beyond the scope of this PVA. However, a
specific schemewasmodelled that involved
four consecutive years of a large number
of releases into a large area of unoccupied
habitat. Releases were of sub-adult and
young adults and were female biased. The
combination of a young, female-biased
population at low density promotes faster
growth and overall population viability.
Full details of the PVA analyses are provided
in this report.
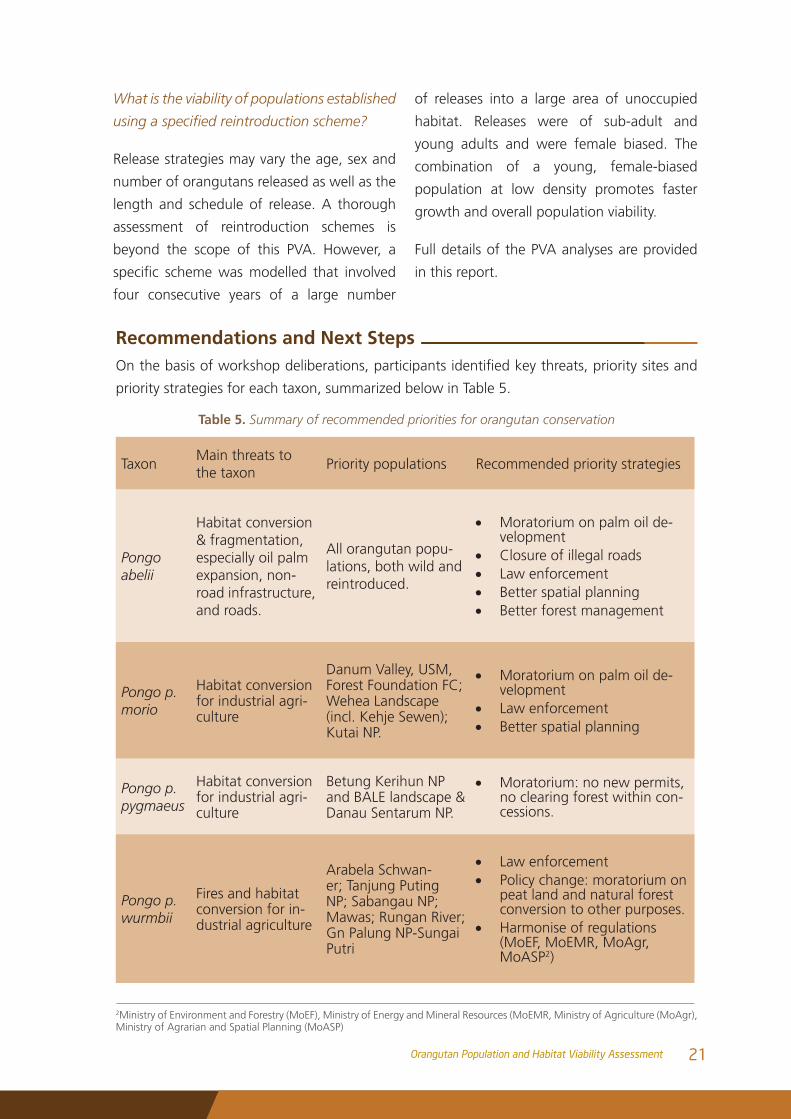
Recommendations and Next StepsOnthebasisofworkshopdeliberations,participantsidentifiedkeythreats,prioritysitesand
priority strategies for each taxon, summarized below in Table 5.
Table 5. Summary of recommended priorities for orangutan conservation
TaxonMain threats to the taxon
Priority populations Recommended priority strategies
Pongo abelii
Habitat conversion & fragmentation, especially oil palm expansion, non-road infrastructure, and roads.
All orangutan popu-lations, both wild and reintroduced.
• Moratorium on palm oil de-velopment
• Closure of illegal roads• Law enforcement • Better spatial planning• Better forest management
Pongo p. morio
Habitat conversion for industrial agri-culture
Danum Valley, USM, Forest Foundation FC; Wehea Landscape (incl. Kehje Sewen); Kutai NP.
• Moratorium on palm oil de-velopment
• Law enforcement• Better spatial planning
Pongo p. pygmaeus
Habitat conversion for industrial agri-culture
Betung Kerihun NP and BALE landscape & Danau Sentarum NP.
• Moratorium: no new permits, no clearing forest within con-cessions.
Pongo p. wurmbii
Fires and habitat conversion for in-dustrial agriculture
Arabela Schwan-er; Tanjung Puting NP; Sabangau NP; Mawas; Rungan River; Gn Palung NP-Sungai Putri
• Law enforcement • Policy change: moratorium on
peat land and natural forest conversion to other purposes.
• Harmonise of regulations (MoEF, MoEMR, MoAgr, MoASP2)
2Ministry of Environment and Forestry (MoEF), Ministry of Energy and Mineral Resources (MoEMR, Ministry of Agriculture (MoAgr), Ministry of Agrarian and Spatial Planning (MoASP)
21Orangutan Population and Habitat Viability Assessment
The next steps in pursuing these identified
priorities are as follows:
• Developing a new National Orangutan
Strategy and Action Plan for 2017-2027,
including key elements such as law
enforcement;
• Revising island, provincial, and district
level spatial planning to mainstream
orangutan conservation and synchronize
policy and regulation among ministries;
• Responding to the recent change
in conservation status of Bornean
orangutans, released by the IUCN in
2016; and
• Using the orangutan as a benchmark
for the monitoring and evaluation of
25 species conservation priorities in
Indonesia.
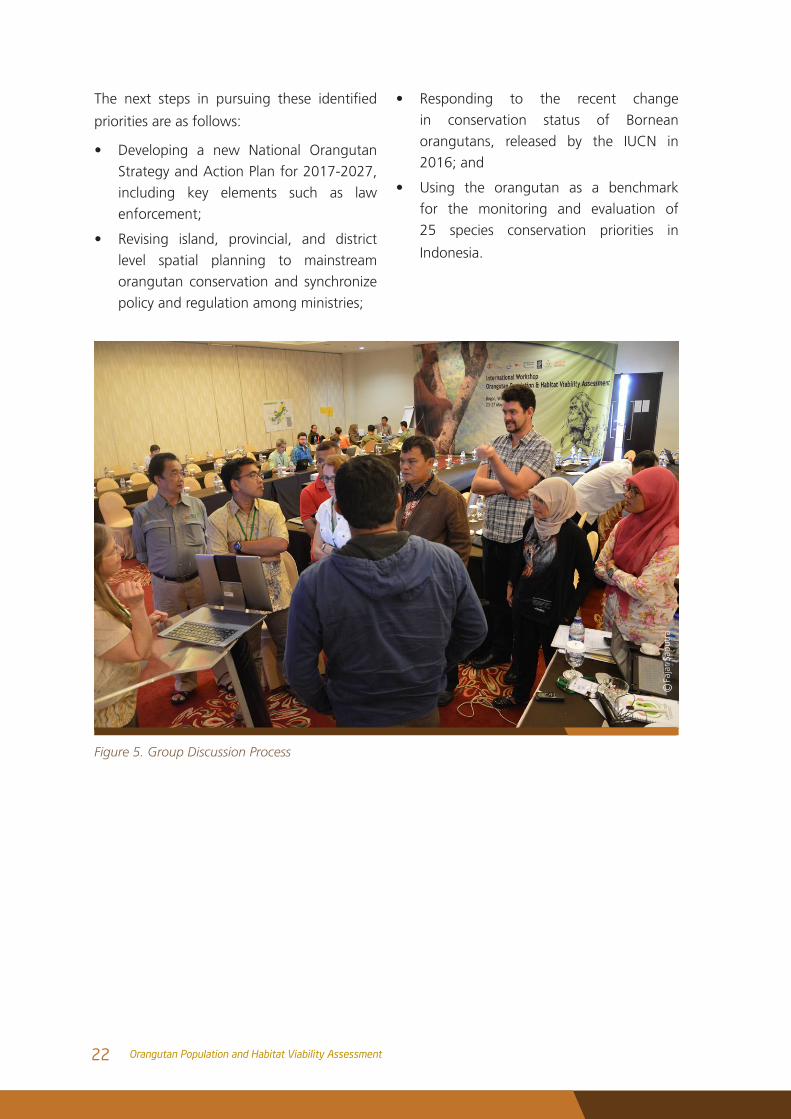
Figure 5. Group Discussion Process
Faja
r Sa
putr
ac
22 Orangutan Population and Habitat Viability Assessment
Steering Committee Notes
Orangutan (Pongo spp) is currently only found
on the islands of Sumatra and Kalimantan.
This Indonesian iconic species is the only
greatapethatlivesinAsiaandisclassifiedas
a critically endangered species by IUCN 2016,
and is a species protected by Indonesian law.
Orangutan threat is caused by several factors
such as habitat depletion due to uncontrolled
forest conversions, poaching and trafficking
of orangutans. Uncontrolled resource
utilization for economic development, as well
as other illegal activities, has resulted in the
destruction and depletion of forest areas as
orangutan habitats that ultimately have an
impact on the declining number of orangutan
populations.Tofindoutthecurrentcondition
of orangutans and to project future conditions,
Orangutan Population and Habitat Viability
Assessment (PHVA) has been conducted. The
study of habitat and orangutan population is
of great importance to all parties, especially
those involved in saving efforts of this species,
in relation to the end of the Indonesian
Orangutan Indonesia Conservation Strategy
and Action Plan 2007-2017.
The Ministry of Environment and Forestry
(Kementerian Lingkungan Hidup dan
Kehutanan) has established a steering
committee to assist in the implementation
of the 2016 Orangutan PHVA. The steering
committee is established through a Decree of
the Director General of Natural Resources and
Ecosystem Conservation (Surat Keputusan
Direktur Jenderal Koservasi Sumber Daya
Alam dan Ekosistem/KSDAE) No. SK.229 /
KSDAE-Set / 2015 with the aim of providing
direction in coordinating data collection
and updating of data on the assessment of
the sustainability of Indonesian orangutan
population and habitat from species
conservation activists, providing guidance
in the assessment and determination of
population counting/census methods used
in the assessment of population sustainability
and Orangutan habitat in accordance with
thescientificprinciplesthatcanbeaccounted
for. The team is also mandated to evaluate the
Indonesian Orangutan Conservation Strategy
and Action Plan (Strategi dan Rencana Aksi
Konservasi/SRAK) 2007-2017, based on
Muh
amm
ad K
hoir
c
23Orangutan Population and Habitat Viability Assessment
the assessment of the sustainability of the
population and its habitat and the periodic
evaluations that have been conducted,
and direct the drafting of the Indonesian
Orangutan SRAK 2017-2027. The team
consists of Indonesian Academy of Sciences,
Research Development and Innovation
Agency of the Ministry of Environment and
Forestry, Indonesian Institute of Sciences,
University of Indonesia, National University,
Indonesian Orangutan Forum (FORINA) and
Conservation organizations (The Nature
Conservancy, Wildlife Conservation Society,
and Kehati Foundation).
After a long process, the executing
team, editing team and the Conservation
Breeding Species Group (CBSG) team of
the International Union for Conservation of
Nature (IUCN) succeeded in preparing the
2016 Orangutan PHVA Report. Based on the
received 2016 PHVA Orangutan report, the
Steering Committee notes some important
things, namely:
a. The survey data that became information
in 2016 Orangutan PHVA had coverage
area twice as wide as compared to
previous orangutan PHVA (88,981 km2
vs 181,694,62 km2). The expansion
area of this survey occurred in Sumatra
and in Kalimantan, horizontally and
vertically (reaching an altitude of 1,500
meters above sea level). Surveys are
conducted in conservation areas and
outside Conservation Areas (especially
in Kalimantan). The distribution of
orangutans in Kalimantan is almost
80% outside the Conservation Area,
including in plantation concessions,
forestry concessions, and mining
concessions. Prior to conducting
the survey, most of the surveyors
have been trained by FORINA and /
or the Directorate General of Natural
Resources and Ecosystem Conservation
(KSDAE), Ministry of Environment and
Forestry. This training is intended for the
equation of methods. The method used
is systematic design for line transect
with randomly sampling. To consolidate
the information from the parties, prior
to the implementation of PHVA has also
conducted Pre-PHVA activity in each
region(Formoredetailinformationfind
in Appendix I). Data input for viability
analysis on 2016 Orangutan PHVA
is more comprehensive compared to
previous Orang PHVA. This is possible
because data are collected from more
location points, and derive from long-
term research observations involving
more stakeholders.
b. The forecasts of density of Sumatran
orangutans and Borneo has decreased
compared to previous forecasts in
PHVA. This illustrates that threats to the
sustainability of orangutans and habitats
are increasing, due to increased forest
conversions, and the high frequency
of orangutan rescue and confiscation
activities. Therefore, it is necessary to
safeguard the Conservation Area and the
application of BMP (Better Management
Practices) in the concession. In addition,
orangutan conservation efforts should
be comprehensive by integrating
the ecological, social and economic
interests (conservation by design).
c. The high estimated population of
Sumatran orangutans (Pongo abelii)
compared to previous forecasts in
Orangutan PHVA does not mean an
increase in population in the previous
24 Orangutan Population and Habitat Viability Assessment
orangutan PHVA survey area, but is
caused by a wider coverage of survey
areas (horizontal and vertical) that
had not previously been done. Thus it
can change the previous assumptions
and estimates. The results of the
most actual survey were: (1) previous
assumptions of orangutans are only
found at altitudes below 800 m-above
sea level, but in the most actual
surveys orangutans are also found in
higher forests, so that former forest
habitats which were not categorized as
orangutan habitat, currently included
into the orangutan habitat category; (2)
themostrecentsurveyandresearchfind
that orangutans can survive in logged-
over forest areas that are managed
sustainably; (3) the most actual surveys
also found the orangutan population in
the area west of Lake Toba. It should
also be noted that the threat to the
sustainability of Sumatran orangutan
habitat and population is increasing.
d. The forecast of the Kalimantan
orangutan population in the 2016
orangutan PHVA declines from the
previous forecast on PHVA. If the
report is further scrutinized, the
steering team finds some interesting
information, among others: (1) The
2016 population forecast is based on
information derived from the broader
survey coverage, while earlier forecasts
are based on a limited survey; (2) Based
on the results of viability analysis, the
minimum population to maintain
viability population in Kalimantan is in
200 orangutans for <1% probability
of extinction in 100 years and <10%
probability of extinction in 500 years,
and 500 orangutans to maintain
variation Genetic. If this is used as a
reference, then quite a lot of meta
populations which are at the low level
of viability in three sub-species of
Kalimantan orangutans, mainly due
to the large number of fragmented
metapopulasi. Therefore, it is necessary
to add orangutan habitat in the form of
Conservation Area and the formation
of corridors for fragmented habitats.
e. The two sub-species of Borneo
orangutans, Pongo pygmeaus
pygmaeus and Pongo pygmaeus
morio, are species that can be found
on Borneo island of Indonesia and
Malaysia. Although Pongo pygmaeus
morio is in Indonesia and Malaysia, it is
located in a different meta population.
In 2016 Orangutan PHVA it was
identifiedthatseveralmetapopulations
exist in Indonesia and Malaysia border
areas i.e (1) Betung Kerihun National
Park (Indonesia) and Batang Ai-
Lanjak-Entimau (Malaysia) landscape,
(2) Klingkang Range National Park
(Malaysia) and forests in North Sintang
(Indonesia), (3) Bungoh National Park
(Malaysia) and Penrisen protected forest
(Indonesia). Betung Kerihun National
Park and Batang Ai-Lanjak-Entimau
are priority areas that have the largest
population of Pongo pygmeus pygmeus
sub-species with high population
viability projection. Meanwhile,
two other meta-populations, have
medium to low viability projections.
To sustain populations in these three
meta-populations, the steering team
encouraged the need for synergicity
of conservation plans and actions
undertaken by Indonesia and Malaysia.
25Orangutan Population and Habitat Viability Assessment
Based on important notes from the 2016
PHVA Orangutan Report, the Steering team
recommend several things to follow up on:
1. The result of PHVA Orangutan 2016 can
be used as a reference in the preparation
of SRAK Orangutan Indonesia 2017-2027
together with the SRAK evaluation that
has been conducted periodically, so that
the SRAK Orangutan 2017-2027 which
is compiled will be more comprehensive
andhavespecific,measurableandrational
targets within the stipulated evaluation
period.
2. After the formation of SRAK Orangutan
Indonesia 2017-2027, because of the
importance of managing the orangutan
population in the trans-boundary areas
of Indonesia and Malaysia, it is necessary
to synchronize the SRAK between the
two countries, in the form of information
sharing in order to have integrated
collaborative action.
3. Based on the 2016 PHVA Orangutan
Report and the results of the review,
indicate that the population of the
Kalimantan orangutan is declining, but
this decline has not been at a pace that
causes the need to change the status of
the IUCN conservation. Quite a lot of meta
populations are at a fairly high level of
viability in three sub-species of the Borneo
orangutan, although many of the meta
populations are fragmented.
4. This review suggests that the decline in
the conservation status of the Borneo
Orangutan undertaken by IUCN primate
experts in 2016, from endangered species
status to critically endangered species, is
inappropriate with current circumstances
and needs to be revised.
26 Orangutan Population and Habitat Viability Assessment
Habitat loss and degradation
Encroachment
In both Sumatra and Borneo, a lack of
enforcement allows forest encroachment by
local communities. Two types of effect were
described:
1. Small scale agriculture
Limited and temporary but illegal clearance
Threats To The Conservation Of Orangutans
Threats to orangutan viability and conservation across the range were discussed by
workshop participants, and the outputs are illustrated in Figure 2. To assist discussions, the
threats described were grouped as follows: 1) Habitat loss and degradation; 2) Hunting,
illegalcaptureandconflict;and3)Fire.Workinggroupswereformedaroundeachofthese
categories. For the threats assigned, each group discussed and developed: a description
ofthethreatorthreats;theirregionalspecificityandprimarycausesordrivers;specifically,
how the threats affect orangutans; what is known about the threats, what is assumed,
and what are the key data gaps in regard to achieving effective conservation; and what are
the options for mitigation. A fourth group was formed to consider issues related to small
population size, orangutan reintroduction projects, and disease. This group followed a
different format than that of other groups as its deliberations were designed to be informed
by population viability analysis models.
of forests by local communities reduces
habitat for orangutans (by 100% in the
area cleared), and may increase mortality
through a small increase in human-
orangutan conflict. This activitymay lead
to more extensive small-scale agriculture
(see below).
27Orangutan Population and Habitat Viability Assessment
2. Extensive small scale agriculture
Extensive and long-term or permanent
illegal clearance of forest by local
communities leads to orangutan
population fragmentation in addition to
habitat loss and increased mortality from
conflictevents.
Forest conversion
1. Industrial agriculture
In both Sumatra and Borneo, market
demand, speculation, corruption, and
the potential for government income and
employment are drivers of large-scale forest
clearance for palm oil, rubber and other
industrial-scale crops. Benefits aremostly
accrued by big corporations and local elites.
It results in direct habitat loss (in which
100% of the area is lost to orangutans),
habitat fragmentation, greater access and,
asaresult,moreincidencesofconflictand
associated mortality. In peat areas, laying
canals removes all available habitat for
orangutans in the immediate area reduces
the carrying capacity of surrounding areas.
2. Mining
This occurs in Sumatra and in Borneo
outside Sabah. Forest clearance for mining
is mostly conducted by big corporations
but also includes illegal mining by local
communities. Mining increases forest
access and encroachment of settlements,
which leads to habitat loss, increasing
fragmentation and a small increase in
mortality through human-orangutan
conflict.Driversforthisareeconomicgain
and market demand.
3. Infrastructure
In both Sumatra and Borneo, legal and
illegal forest clearance for infrastructure,
including geothermal, electricity,
hydroelectric, and military infrastructure
occurs. This may be initiated by government
or the private sector as part of development
programmes and is driven by poor
governance, inappropriate government
policy, lack of law enforcement, poor
spatial planning, and the priorities of local
elite. In areas where it occurs 100% of
habitat is lost to orangutans and incidences
ofconflictincrease.
Road construction
In both Sumatra and Borneo, road construction
fragments orangutan populations, increases
forest access and leads to encroachment
and settlement expansion. Where habitat
loss occurs it reduces carrying capacity by
100%. Drivers of this are government policy,
poor spatial planning, corruption, economic
development, the needs of the local elite,
and the drive for better human access to
areas, particularly where there are industrial
concessions and for tourism.
Settlement
In Sumatra, and in Borneo outside Sabah and
Sarawak, legal and illegal forest clearance
for housing and agriculture occur to fulfil
the demands of expanding local human
populations, which include relocated disaster
victims and those moved as a result of the
government’s transmigration program.
Impacts on orangutans include reduced
habitat and increased conflict leading to
mortality. Drivers of these impacts are poor
governance, inappropriate government policy,
28 Orangutan Population and Habitat Viability Assessment
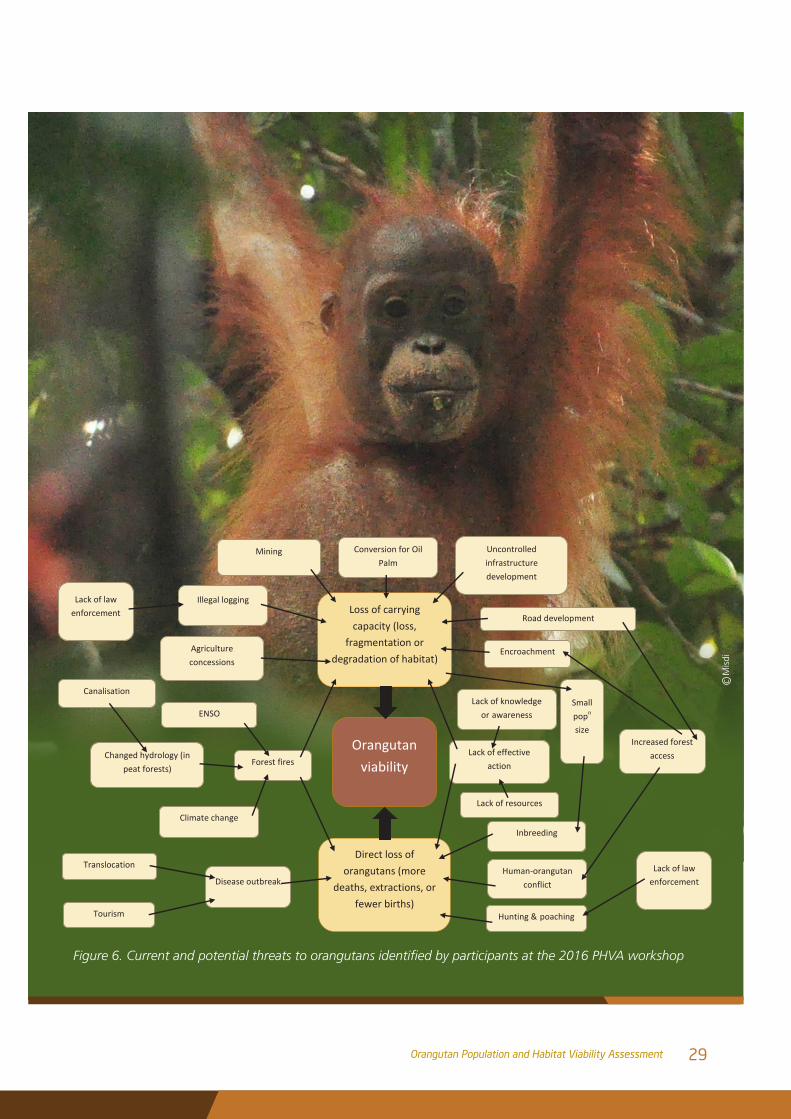
Figure 6. Current and potential threats to orangutans identified by participants at the 2016 PHVA workshop24
Orangutan viability
Direct loss of orangutans (more
deaths, extractions, or fewer births)
Loss of carrying capacity (loss,
fragmentation or degradation of habitat)
Lack of knowledge or awareness
Lack of effective action
Translocation
Tourism
Mining
Agriculture concessions
Road development
Illegal logging
Climate change
ENSO
Encroachment
Conversion for Oil Palm
Inbreeding
Uncontrolled infrastructure development
Disease outbreak
Changed hydrology (in peat forests)
Canalisation
Hunting & poaching
Increased forest access
Human-orangutan conflict
Forest fires
Lack of law enforcement
Lack of resources
Lack of law enforcement
Small popn size
Mis
dic
29Orangutan Population and Habitat Viability Assessment
humanconflictandnaturaldisastersoccurring
in other areas, and poor law enforcement.
Logging
Logging can be carried out in a variety of
ways and these can differ in their impact on
orangutans.
Illegal logging
In both Sumatra and Borneo, illegal timber
extraction within forest cover can temporarily
reduce carrying capacity for orangutans and
increase mortality due to orangutan–human
conflict. Drivers or causes are considered
to be poor governance and inappropriate
government policy, lack of law enforcement,
local timber demand, and the opportunities
created through greater access for agriculture.
Low impact logging
In Borneo, logging activity that follows a
“reduced-impact logging method” either
fully or partially, does not reduce the carrying
capacity of the affected habitat.
High impact logging
Also in both Sumatra and Borneo, logging
activity that does not follow a “reduced-
impact logging method” can significantly
reduce carrying capacity for orangutans and
increase human-orangutan conflict. The
incidence of high impact logging is increased
by poor controls and weak forest governance.
Timber plantation
In Sumatra and in Borneo outside Sabah and
Sarawak, forest clearance for industrial timber
crops, mostly carried out by big corporations
and local elites, increases forest fragmentation
and access, resulting in the loss of these
areas to orangutans and increasing mortality
considerably. Drivers are market demand,
speculation, corruption, and the potential for
government income and employment.
Absence of forest management units
In Sumatra and in Borneo (excluding Aceh,
Central Kalimantan, Sabah and Sarawak),
insufficientbudgetresourcesandcoordination
among related parties result in the absence
of forest management units (KPH) to enforce
regulation and protection, which leads to
open access to forest resources and results in
loss, fragmentation, further settlement and
degradation.
Hunting, Illegal Capture And Conflict
This category included those threats that are
expected to result directly in orangutan deaths
orextraction(otherthanfire,whichwasdealt
with separately).
Poaching (illegal capture)
In both Sumatra and Borneo, poaching
or illegally capturing orangutans for
domestication or trade could reduce the
viability of wild populations directly. Where
individuals are re-released there could be
disease implications. In addition to the
conservation implications there are negative
welfare consequences for the animals
taken. This activity is driven by lack of law
enforcement, demand from the pet trade, lack
of awareness of the law and misperceptions
about orangutans, low income and the
resulting incentive of potential economic
gain, and opportunities created by increased
forest access.
30 Orangutan Population and Habitat Viability Assessment
Hunting
Orangutans are killed as a source of food for
subsistence; often this killing is opportunistic
but not always. This occurs throughout the
range but is more prevalent in Borneo. This
additional mortality may increase the risk of
local extinctions. It is thought that hunting
played a role in some of the areas where
orangutans do not occur anymore. Also it may
have reduced overall density in many areas.
Causes are low income and the opportunities
created by increased forest access due to
agricultural expansion and habitat alteration,
hunting traditions in local culture and lack of
Law enforcement.
Human-orangutanconflict
In cases of human-orangutan conflict, both
parties may be impacted negatively and
orangutans are often killed. Two main areas
whereconflictoccurswereidentifiedas:
1. Crop raiding
Orangutans that raid crops may be killed
or wounded either as retribution for losses
or defensively, out of fear.
2. Opportunistic hunting
Orangutans encountered opportunistically
in the forests by hunters may be killed for
food or poached for trade.
Agriculture expansion, habitat loss, and
increased forest access increase the rate
of human-orangutan encounters. Lack
of knowledge of the protected status
of orangutans, lack of awareness of the
nature of orangutans, fear of economic
loss, and poor law enforcement may all
contribute to negative outcomes from
these interactions.
In Sumatra there are more instances of
smallholder-basedconflict.InBorneothe
conflict ismoreoften related toactivities
by timber and oil palm companies.
Fire
Impact on orangutan viability
There are a number of potential mechanisms
through which fire events can impact
orangutan population viability, such as direct
killing, destroying and fragmenting the
habitat, and reducing the carrying capacity
(i.e., reduction of population size).
1. Habitat loss and fragmentation
Loss and fragmentation of habitat reduces
the ability of orangutans to travel between
trees and make nests. Access to food
is reduced and vulnerability increases.
Population density in remaining habitat
increased, which may trigger conflict
between orangutans, increasing mortality
and facilitating disease outbreak. These
conditions can also lead to reduced
reproduction. The increased isolation of
remaining fragments may in the long-term
increase the likelihood of inbreeding.
2. Direct mortality and injury
Fire can kill orangutans directly, or indirectly
as a result of haze. Others can be left with
debilitating injuries.
31Orangutan Population and Habitat Viability Assessment
3. Regionalspecificity
Peat swamp forest is particularly vulnerable
to forest fires. The dried-out peat ignites
easily and also burns underground,
travelling unseen beneath the surface to
break out in unexpected locations. Fire
susceptibility in these areas is exacerbated
by drainage and irrigation canals that alter
the hydrology. Lowland Dipterocarp and
heath forest are also at risk. All Kalimantan
is dry, especially in the centre.
Causes
1. Climate Change
Forest fires occur during dry season and
worsen during El Niño events. Climate
change is expected to increase the
frequency and severity.
2. Land use conversion
Uncontrolled fires set as part of land
clearing strategies have increased the
incidenceoflargefires.Insomepeatland
areas, canalization due to drainage of the
land has also affected the water table and
makethepeatlandmorevulnerabletofire.
Small Population Size, Reintroduction And Disease
The threats described above lead directly or
indirectly to orangutan population declines.
As populations decline to small numbers
theirdynamicsareincreasinglyinfluencedby
chance or “stochastic” effects. These effects
are typically characterised as: environmental
(random, unpredictable variation in factors
such as temperature or food supply);
demographic (chance-driven fluctuations in
birth or death rates or sex ratio); catastrophic
(extreme natural or human-caused events
suchasfireorenvironmentaldisasters);and
genetic (the negative effects of inbreeding
accumulation and gene diversity loss on
population fitness and adaptive potential)
(Shaffer 1987). Where populations remain
small,theseeffectscanbesufficienttodrive
populations to extinction even after the
threats that caused the initial declines have
been removed (Gilpin and Soulé 1986). These
effects are relevant to orangutans in the
following contexts.
Population fragments
A number of the orangutan populations
considered at the 2016 PHVA workshop have
been driven to small numbers as a result of
habitat loss, fragmentation and extraction,
resulting from the threatening process
described in this report. Understanding
which population fragments are likely to be
experiencing the negative effects of small
size can be helpful in considering where
supportive management might be needed.
Reintroduction
The reintroduction of orangutans into areas
where they do not currently exist involves an
initial phase where the population is small in
size and as a result disproportionately impacted
by random events. Planning reintroduction
programscanbenefitfromanunderstanding
of what combinations of founder number,
age, sex ratio, and ongoing supplementation
rate might be expected to lead to successful
establishment of orangutans at a given site.
32 Orangutan Population and Habitat Viability Assessment
Disease
Disease may contribute to fluctuating size
in large populations but is rarely cited as a
primary agent of extinction at the species
level (Callum, 2012; McPhee & Greenwood,
2012). Though not expected to be a risk at
the species level, for orangutans, disease
may pose a risk at the individual population
level, and this risk may be increased where
populations are small and isolated, where
thereisovercrowding(e.g.afterfires),where
inbreeding has accumulated and general
fitness levels are already compromised, or
where regular disturbance from human-
mediated activity (e.g. tourism, orangutan
reintroduction or translocation) may increases
exposure to potential disease agents.
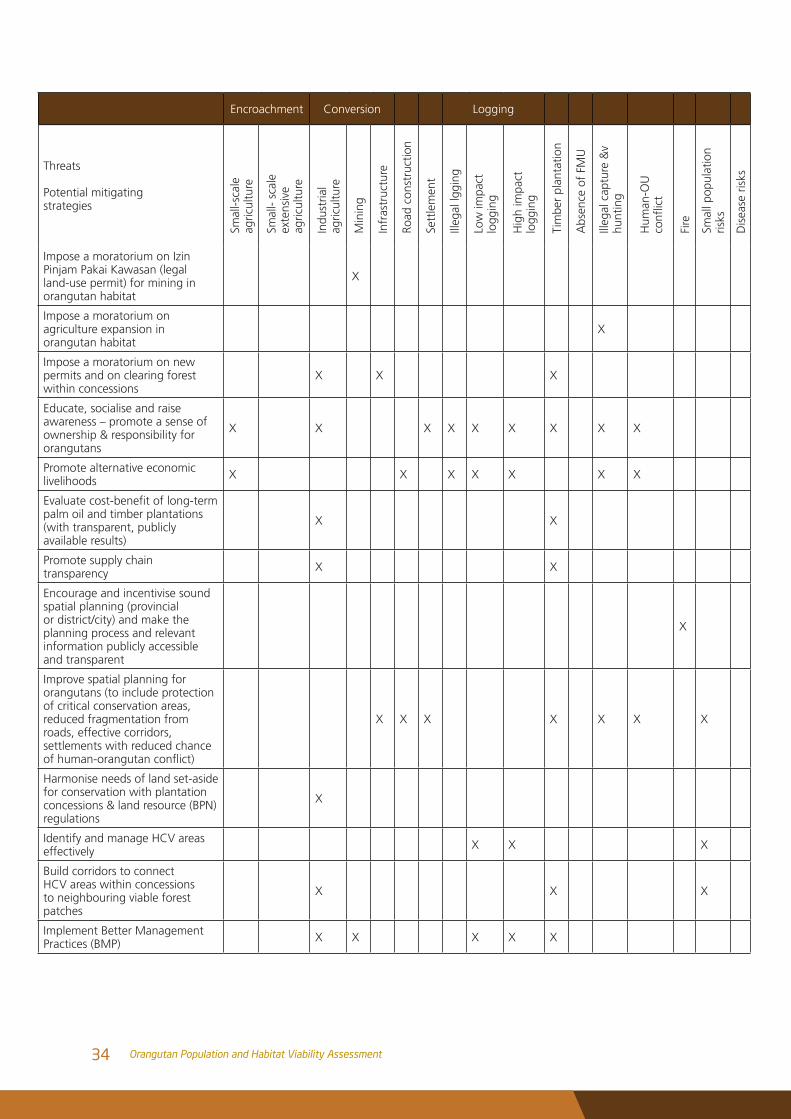
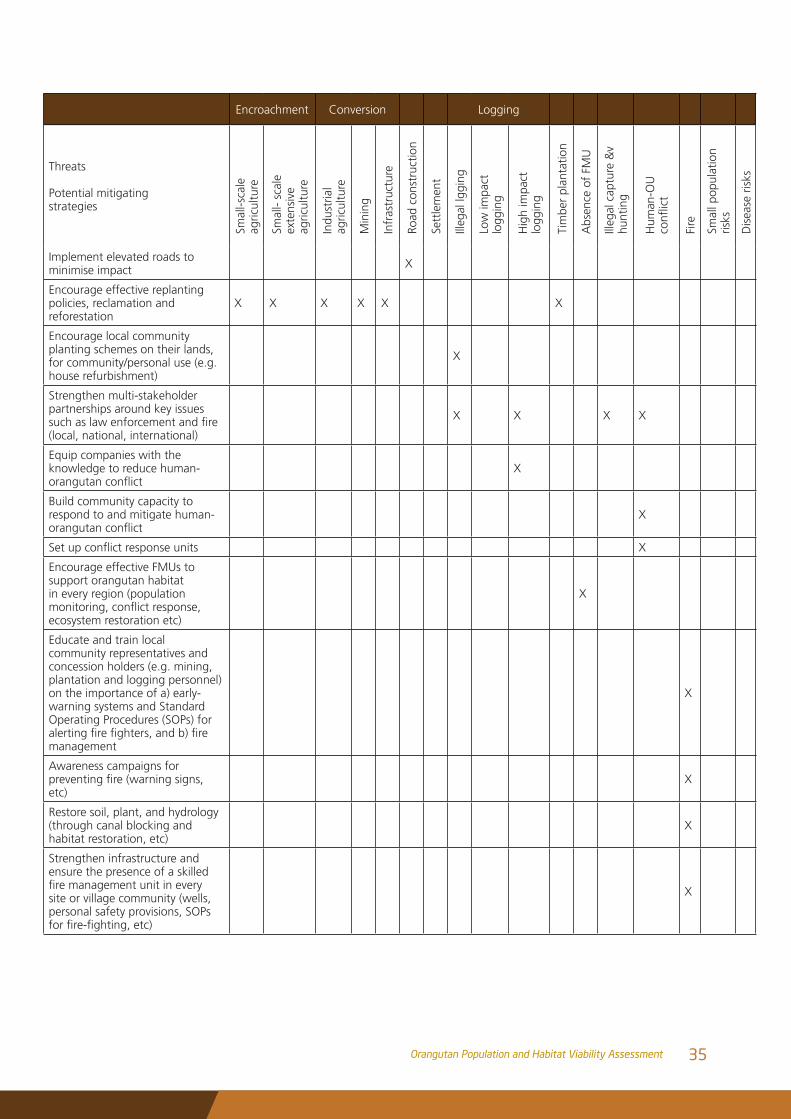
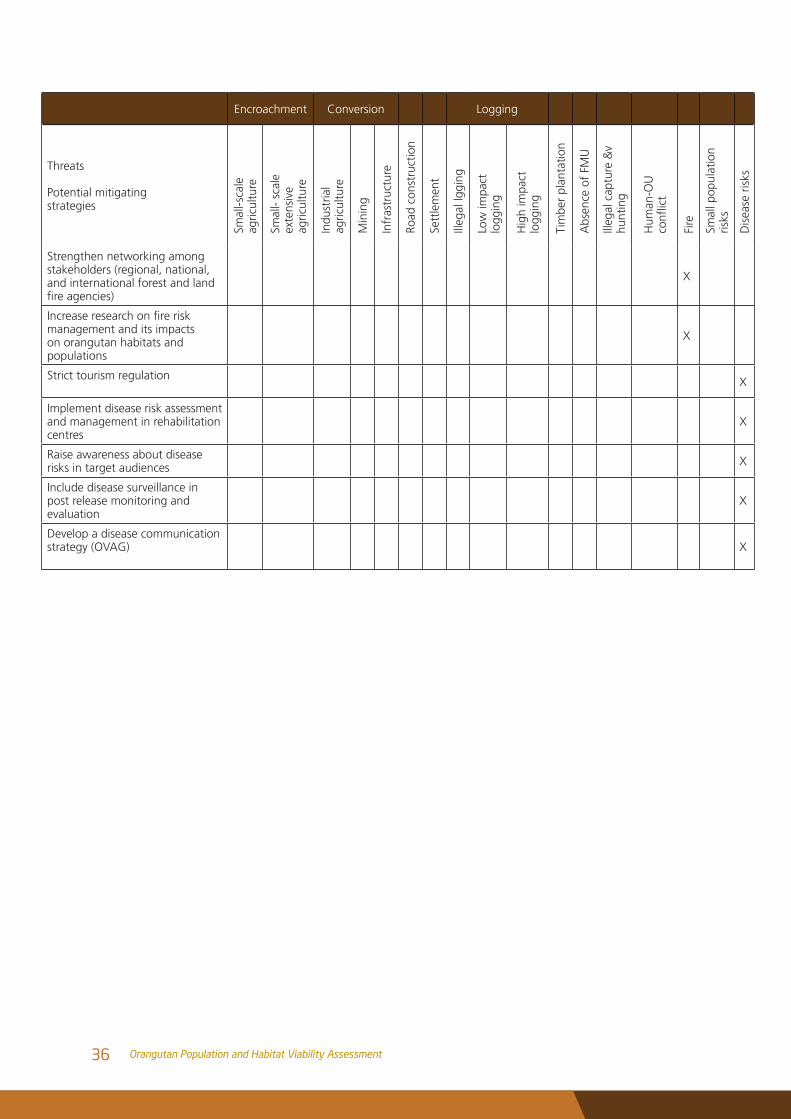
Potential mitigation strategies
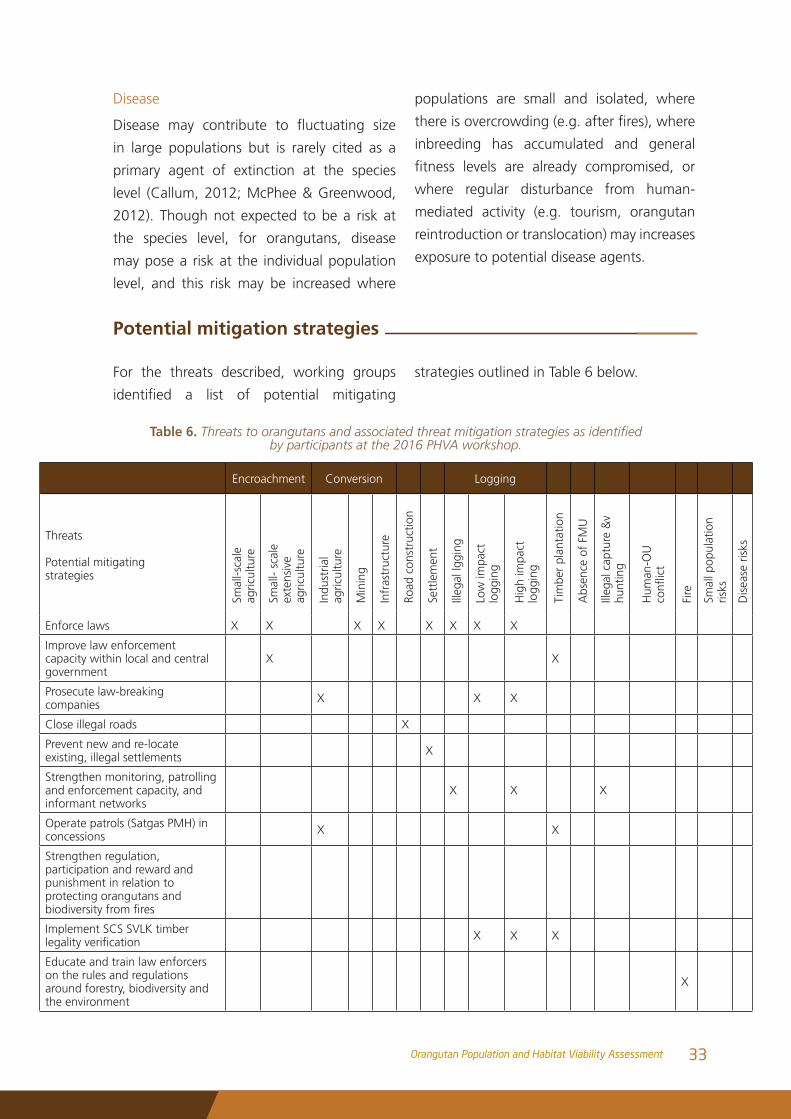
Table 6. Threats to orangutans and associated threat mitigation strategies as identified by participants at the 2016 PHVA workshop.
Encroachment Conversion Logging
Threats
Potential mitigating strategies
Smal
l-sca
le
agric
ultu
re
Smal
l- sc
ale
exte
nsiv
e ag
ricul
ture
Indu
stria
l ag
ricul
ture
Min
ing
Infr
astr
uctu
re
Road
con
stru
ctio
n
Sett
lem
ent
Illeg
al lg
ging
Low
impa
ct
logg
ing
Hig
h im
pact
lo
ggin
g
Tim
ber
plan
tatio
n
Abs
ence
of
FMU
Illeg
al c
aptu
re &
v hu
ntin
g
Hum
an-O
U
conflict
Fire
Smal
l pop
ulat
ion
risks
Dis
ease
ris
ks
Enforce laws X X X X X X X X
Improve law enforcement capacity within local and central government
X X
Prosecute law-breaking companies X X X
Close illegal roads X
Prevent new and re-locate existing, illegal settlements X
Strengthen monitoring, patrolling and enforcement capacity, and informant networks
X X X
Operate patrols (Satgas PMH) in concessions X X
Strengthen regulation, participation and reward and punishment in relation to protecting orangutans and biodiversityfromfires
Implement SCS SVLK timber legalityverification X X X
Educate and train law enforcers on the rules and regulations around forestry, biodiversity and the environment
X
For the threats described, working groups
identified a list of potential mitigating
strategies outlined in Table 6 below.
33Orangutan Population and Habitat Viability Assessment
Encroachment Conversion Logging
Threats
Potential mitigating strategies
Smal
l-sca
le
agric
ultu
re
Smal
l- sc
ale
exte
nsiv
e ag
ricul
ture
Indu
stria
l ag
ricul
ture
Min
ing
Infr
astr
uctu
re
Road
con
stru
ctio
n
Sett
lem
ent
Illeg
al lg
ging
Low
impa
ct
logg
ing
Hig
h im
pact
lo
ggin
g
Tim
ber
plan
tatio
n
Abs
ence
of
FMU
Illeg
al c
aptu
re &
v hu
ntin
g
Hum
an-O
U
conflict
Fire
Smal
l pop
ulat
ion
risks
Dis
ease
ris
ks
Impose a moratorium on Izin Pinjam Pakai Kawasan (legal land-use permit) for mining in orangutan habitat
X
Impose a moratorium on agriculture expansion in orangutan habitat
X
Impose a moratorium on new permits and on clearing forest within concessions
X X X
Educate, socialise and raise awareness – promote a sense of ownership & responsibility for orangutans
X X X X X X X X X
Promote alternative economic livelihoods X X X X X X X
Evaluatecost-benefitoflong-termpalm oil and timber plantations (with transparent, publicly available results)
X X
Promote supply chain transparency X X
Encourage and incentivise sound spatial planning (provincial or district/city) and make the planning process and relevant information publicly accessible and transparent
X
Improve spatial planning for orangutans (to include protection of critical conservation areas, reduced fragmentation from roads, effective corridors, settlements with reduced chance ofhuman-orangutanconflict)
X X X X X X X
Harmonise needs of land set-aside for conservation with plantation concessions & land resource (BPN) regulations
X
Identify and manage HCV areas effectively X X X
Build corridors to connect HCV areas within concessions to neighbouring viable forest patches
X X X
Implement Better Management Practices (BMP) X X X X X
34 Orangutan Population and Habitat Viability Assessment
Encroachment Conversion Logging
Threats
Potential mitigating strategies
Smal
l-sca
le
agric
ultu
re
Smal
l- sc
ale
exte
nsiv
e ag
ricul
ture
Indu
stria
l ag
ricul
ture
Min
ing
Infr
astr
uctu
re
Road
con
stru
ctio
n
Sett
lem
ent
Illeg
al lg
ging
Low
impa
ct
logg
ing
Hig
h im
pact
lo
ggin
g
Tim
ber
plan
tatio
n
Abs
ence
of
FMU
Illeg
al c
aptu
re &
v hu
ntin
g
Hum
an-O
U
conflict
Fire
Smal
l pop
ulat
ion
risks
Dis
ease
ris
ks
Implement elevated roads to minimise impact X
Encourage effective replanting policies, reclamation and reforestation
X X X X X X
Encourage local community planting schemes on their lands, for community/personal use (e.g. house refurbishment)
X
Strengthen multi-stakeholder partnerships around key issues suchaslawenforcementandfire(local, national, international)
X X X X
Equip companies with the knowledge to reduce human-orangutanconflict
X
Build community capacity to respond to and mitigate human-orangutanconflict
X
Setupconflictresponseunits X
Encourage effective FMUs to support orangutan habitat in every region (population monitoring,conflictresponse,ecosystem restoration etc)
X
Educate and train local community representatives and concession holders (e.g. mining, plantation and logging personnel) on the importance of a) early-warning systems and Standard Operating Procedures (SOPs) for alertingfirefighters,andb)firemanagement
X
Awareness campaigns for preventingfire(warningsigns,etc)
X
Restore soil, plant, and hydrology (through canal blocking and habitat restoration, etc)
X
Strengthen infrastructure and ensure the presence of a skilled firemanagementunitineverysite or village community (wells, personal safety provisions, SOPs forfire-fighting,etc)
X
35Orangutan Population and Habitat Viability Assessment
Encroachment Conversion Logging
Threats
Potential mitigating strategies
Smal
l-sca
le
agric
ultu
re
Smal
l- sc
ale
exte
nsiv
e ag
ricul
ture
Indu
stria
l ag
ricul
ture
Min
ing
Infr
astr
uctu
re
Road
con
stru
ctio
n
Sett
lem
ent
Illeg
al lg
ging
Low
impa
ct
logg
ing
Hig
h im
pact
lo
ggin
g
Tim
ber
plan
tatio
n
Abs
ence
of
FMU
Illeg
al c
aptu
re &
v hu
ntin
g
Hum
an-O
U
conflict
Fire
Smal
l pop
ulat
ion
risks
Dis
ease
ris
ks
Strengthen networking among stakeholders (regional, national, and international forest and land fireagencies)
X
Increaseresearchonfireriskmanagement and its impacts on orangutan habitats and populations
X
Strict tourism regulation X
Implement disease risk assessment and management in rehabilitation centres
X
Raise awareness about disease risks in target audiences X
Include disease surveillance in post release monitoring and evaluation
X
Develop a disease communication strategy (OVAG) X
36 Orangutan Population and Habitat Viability Assessment
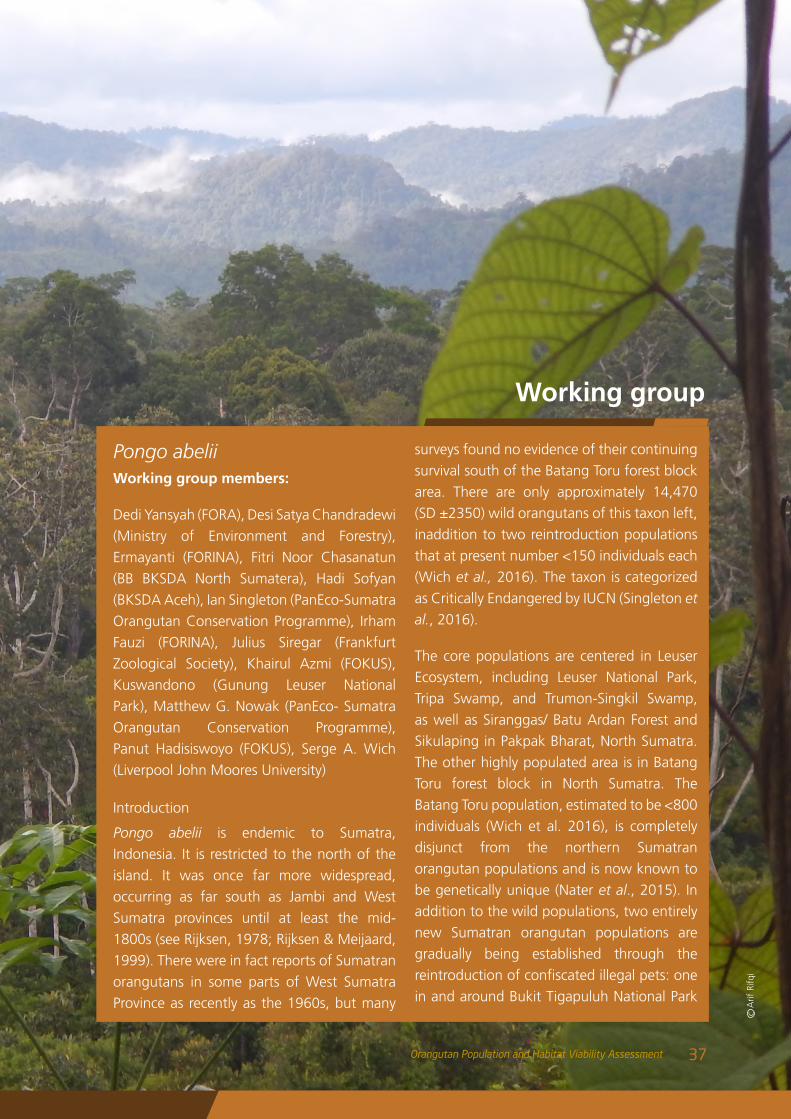
Pongo abeliiWorking group members:
Dedi Yansyah (FORA), Desi Satya Chandradewi
(Ministry of Environment and Forestry),
Ermayanti (FORINA), Fitri Noor Chasanatun
(BB BKSDA North Sumatera), Hadi Sofyan
(BKSDA Aceh), Ian Singleton (PanEco-Sumatra
Orangutan Conservation Programme), Irham
Fauzi (FORINA), Julius Siregar (Frankfurt
Zoological Society), Khairul Azmi (FOKUS),
Kuswandono (Gunung Leuser National
Park), Matthew G. Nowak (PanEco- Sumatra
Orangutan Conservation Programme),
Panut Hadisiswoyo (FOKUS), Serge A. Wich
(Liverpool John Moores University)
Introduction
Pongo abelii is endemic to Sumatra,
Indonesia. It is restricted to the north of the
island. It was once far more widespread,
occurring as far south as Jambi and West
Sumatra provinces until at least the mid-
1800s (see Rijksen, 1978; Rijksen & Meijaard,
1999). There were in fact reports of Sumatran
orangutans in some parts of West Sumatra
Province as recently as the 1960s, but many
surveys found no evidence of their continuing
survival south of the Batang Toru forest block
area. There are only approximately 14,470
(SD ±2350) wild orangutans of this taxon left,
inaddition to two reintroduction populations
that at present number <150 individuals each
(Wich et al., 2016). The taxon is categorized
as Critically Endangered by IUCN (Singleton et
al., 2016).
The core populations are centered in Leuser
Ecosystem, including Leuser National Park,
Tripa Swamp, and Trumon-Singkil Swamp,
as well as Siranggas/ Batu Ardan Forest and
Sikulaping in Pakpak Bharat, North Sumatra.
The other highly populated area is in Batang
Toru forest block in North Sumatra. The
Batang Toru population, estimated to be <800
individuals (Wich et al. 2016), is completely
disjunct from the northern Sumatran
orangutan populations and is now known to
be genetically unique (Nater et al., 2015). In
addition to the wild populations, two entirely
new Sumatran orangutan populations are
gradually being established through the
reintroductionofconfiscatedillegalpets:one
in and around Bukit Tigapuluh National Park
Working group
Arif
Rifq
ic
37Orangutan Population and Habitat Viability Assessment
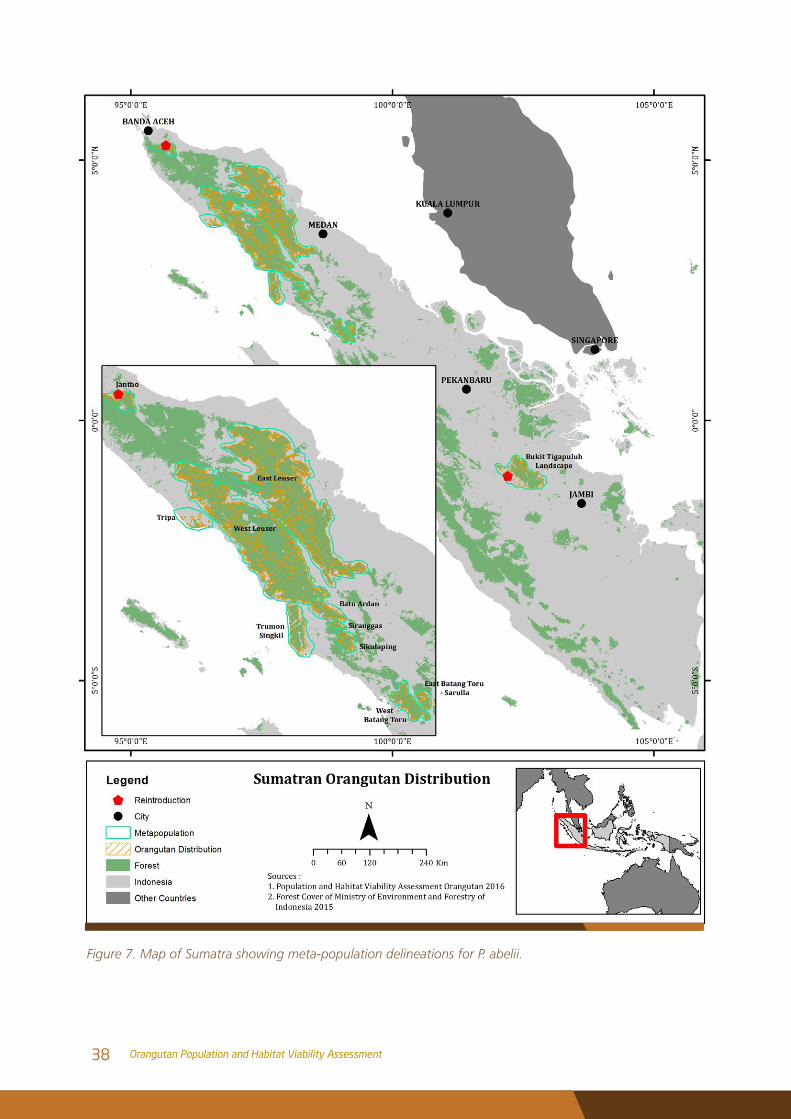
Figure 7. Map of Sumatra showing meta-population delineations for P. abelii.
38 Orangutan Population and Habitat Viability Assessment
(Jambi and Riau provinces), and one in and
around the Jantho Pine Forest Nature Reserve
in the far north of Aceh. All populations,
including the two reintroduced ones, are
shown in Figure 3. All current populations,
bothwildandreintroduced,areidentifiedas
a priority for P. abelii conservation, because
the associated habitats have high potential
to support viable populations and require
intense protection.
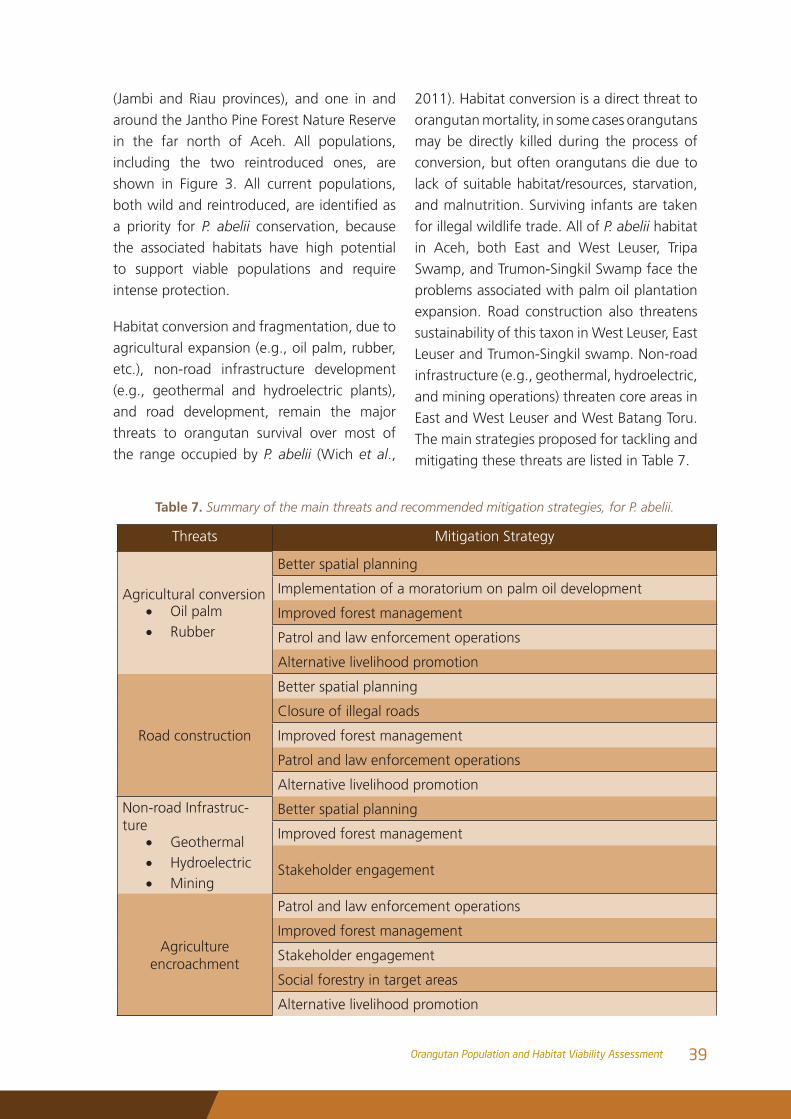
Habitat conversion and fragmentation, due to
agricultural expansion (e.g., oil palm, rubber,
etc.), non-road infrastructure development
(e.g., geothermal and hydroelectric plants),
and road development, remain the major
threats to orangutan survival over most of
the range occupied by P. abelii (Wich et al.,
2011). Habitat conversion is a direct threat to
orangutan mortality, in some cases orangutans
may be directly killed during the process of
conversion, but often orangutans die due to
lack of suitable habitat/resources, starvation,
and malnutrition. Surviving infants are taken
for illegal wildlife trade. All of P. abelii habitat
in Aceh, both East and West Leuser, Tripa
Swamp, and Trumon-Singkil Swamp face the
problems associated with palm oil plantation
expansion. Road construction also threatens
sustainability of this taxon in West Leuser, East
Leuser and Trumon-Singkil swamp. Non-road
infrastructure (e.g., geothermal, hydroelectric,
and mining operations) threaten core areas in
East and West Leuser and West Batang Toru.
The main strategies proposed for tackling and
mitigating these threats are listed in Table 7.
Table 7. Summary of the main threats and recommended mitigation strategies, for P. abelii.
Threats Mitigation Strategy
Agricultural conversion• Oil palm• Rubber
Better spatial planning
Implementation of a moratorium on palm oil development
Improved forest management
Patrol and law enforcement operations
Alternative livelihood promotion
Road construction
Better spatial planning
Closure of illegal roads
Improved forest management
Patrol and law enforcement operations
Alternative livelihood promotion
Non-road Infrastruc-ture
• Geothermal• Hydroelectric• Mining
Better spatial planning
Improved forest management
Stakeholder engagement
Agriculture encroachment
Patrol and law enforcement operations
Improved forest management
Stakeholder engagement
Social forestry in target areas
Alternative livelihood promotion
39Orangutan Population and Habitat Viability Assessment
Pongo pygmaeus morioWorking group members:
Aldrianto Priadjati (FORINA), Donna Simon
(WWF Sabah), Eko Prasetyo (Borneo
Orangutan Survival Foundation), Fajar
Saputra (FORINA), Hardi Baktiantoro (Centre
for Orangutan Protection), Purwo Kuncoro
(Kutai Orangutan Project), Anne Russon
(Kutai Orangutan Project), Rizal Buchari (The
Nature Conservancy), Sendi Yusandi (Ministry
of Environment and Forestry), Yaya Rayadin
(East Kalimantan Forum/ KORAN), Yulita
Kabangnga (Kutai National Park Authority)
Introduction
Pongo pygmaeus morio is one of the
three currently recognized subspecies of
the Bornean orangutan (Goossens et al.
2009). This subspecies is found in the State
of Sabah (Malaysia) and the Province of
East Kalimantan (Indonesia). It is assumed
that it no longer persists in the Province of
North Kalimantan. There are 11 landscapes
in Sabah recognized as this taxon’s major
habitat, with a total population size are
11,730 (SD ±1,560) orangutans. Overall,
P.p. morio’s populations in Sabah are in a
stable situation because most of the habitats
are in the Protection Forest. It is estimated
that 4 of the 11 landscape habitats host
more than 1,000 orangutans each, i.e: Tabin
Range landscape (1,250 orangutans), Central
Forest Range landscape (5,320 orangutans),
Lower Kinabatangan Range landscape (1,500
orangutans) and North Kinabatangan range
(2,030 orangutans). The three population units
within the Central Forest Range Landscape,
i.e: Danum Valley, USM, Forest Foundation
FC,werealsoidentifiedasprioritypopulations
in Sabah. Meanwhile in Kalimantan, most
populations of P.p. morio are found outside
protected areas in forests that are earmarked
for conversion to other land uses. There are 6
landscapes in Kalimantan recognized as major
habitat with a total population are 2,900 (SD
±750) orangutans. The core population of
P.p. morio in Kalimantan is centered in Kutai
National Park-Bontang landscape, which
is estimated to support more than 1,000
orangutans (1,700 orangutans).
Some populations in Kalimantan are
reintroduced: Beratus in Landscape Beratus,
Sungai Wain in Landscape Sungai Wain and
Kehje Sewen in Landscape Wehea-Lesan. The
number of orangutans in Beratus landscape
is estimated to be 30 (in 40,000 ha), from a
total of 349 orangutans released between
1997 and 2002. The total area of Beratus
landscape exceeds 200,000 ha and consists
of Beratus Protection Forest, PT. ITCI and PT.
BFI logging concessions. A through survey
over a larger area is needed to provide better
information about orangutans. The Sungai
Wain landscape is in a critical situation since
the Sungai Wain Protection Forest was reduced
asaresultofforestfire,encroachment,road
construction (highway) in some locations, as
well as Balikpapan botanical garden. A study
on Sungai Wain is urgently needed to update
information about the area and to identify
appropriate next steps for supporting the
remaining orangutans. It is estimated that the
Kehje Sewen forest can support around 150
orangutans. The number in the rehabilitation
center exceeds 200 and additional forest will
be needed to house these animals.
40 Orangutan Population and Habitat Viability Assessment
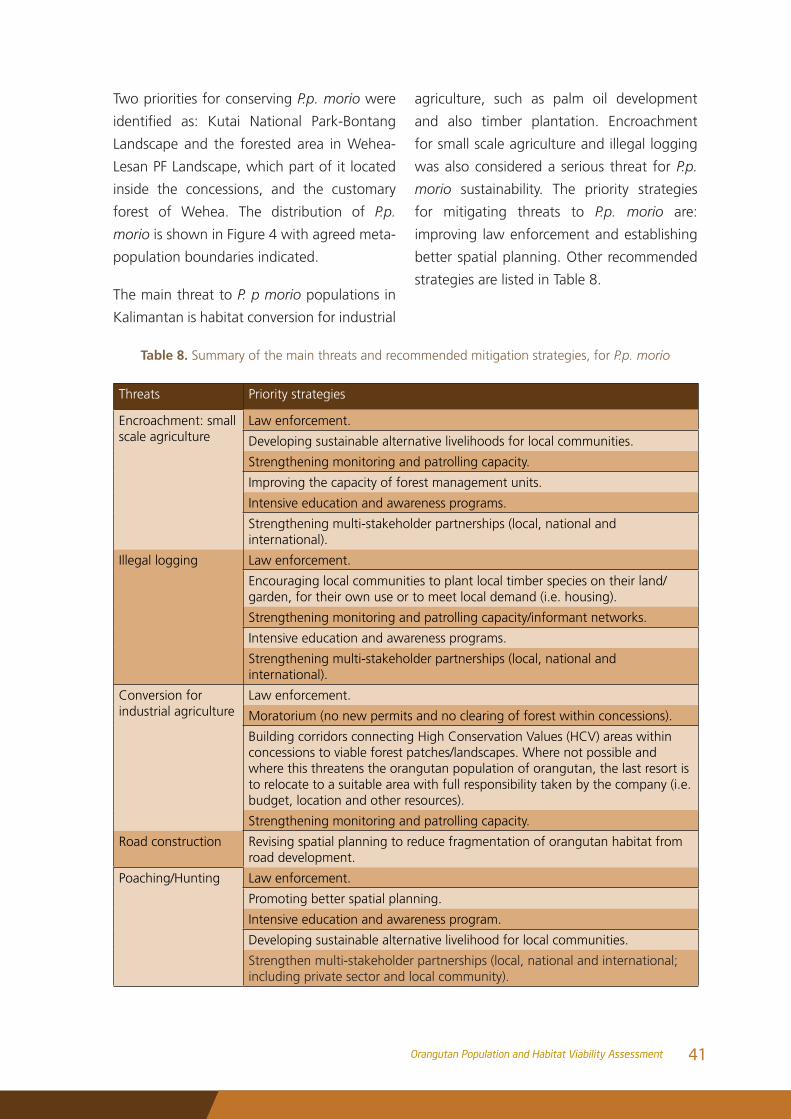
Two priorities for conserving P.p. morio were
identified as: Kutai National Park-Bontang
Landscape and the forested area in Wehea-
Lesan PF Landscape, which part of it located
inside the concessions, and the customary
forest of Wehea. The distribution of P.p.
morio is shown in Figure 4 with agreed meta-
population boundaries indicated.
The main threat to P. p morio populations in
Kalimantan is habitat conversion for industrial
agriculture, such as palm oil development
and also timber plantation. Encroachment
for small scale agriculture and illegal logging
was also considered a serious threat for P.p.
morio sustainability. The priority strategies
for mitigating threats to P.p. morio are:
improving law enforcement and establishing
better spatial planning. Other recommended
strategies are listed in Table 8.
Table 8. Summary of the main threats and recommended mitigation strategies, for P.p. morio
Threats Priority strategies
Encroachment: small scale agriculture
Law enforcement.
Developing sustainable alternative livelihoods for local communities.
Strengthening monitoring and patrolling capacity.
Improving the capacity of forest management units.
Intensive education and awareness programs.
Strengthening multi-stakeholder partnerships (local, national and international).
Illegal logging Law enforcement.
Encouraging local communities to plant local timber species on their land/garden, for their own use or to meet local demand (i.e. housing).
Strengthening monitoring and patrolling capacity/informant networks.
Intensive education and awareness programs.
Strengthening multi-stakeholder partnerships (local, national and international).
Conversion for industrial agriculture
Law enforcement.
Moratorium (no new permits and no clearing of forest within concessions).
Building corridors connecting High Conservation Values (HCV) areas within concessions to viable forest patches/landscapes. Where not possible and where this threatens the orangutan population of orangutan, the last resort is to relocate to a suitable area with full responsibility taken by the company (i.e. budget, location and other resources).
Strengthening monitoring and patrolling capacity.
Road construction Revising spatial planning to reduce fragmentation of orangutan habitat from road development.
Poaching/Hunting Law enforcement.
Promoting better spatial planning.
Intensive education and awareness program.
Developing sustainable alternative livelihood for local communities.
Strengthen multi-stakeholder partnerships (local, national and international; including private sector and local community).
41Orangutan Population and Habitat Viability Assessment
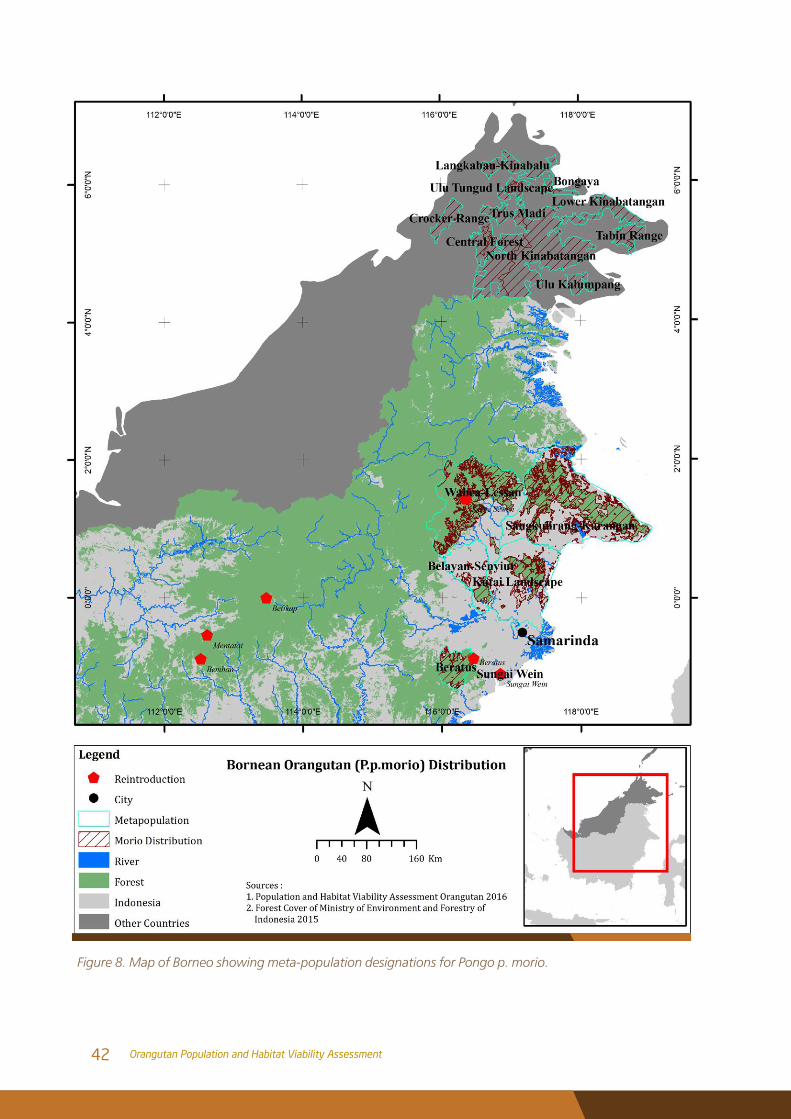
Figure 8. Map of Borneo showing meta-population designations for Pongo p. morio.
42 Orangutan Population and Habitat Viability Assessment
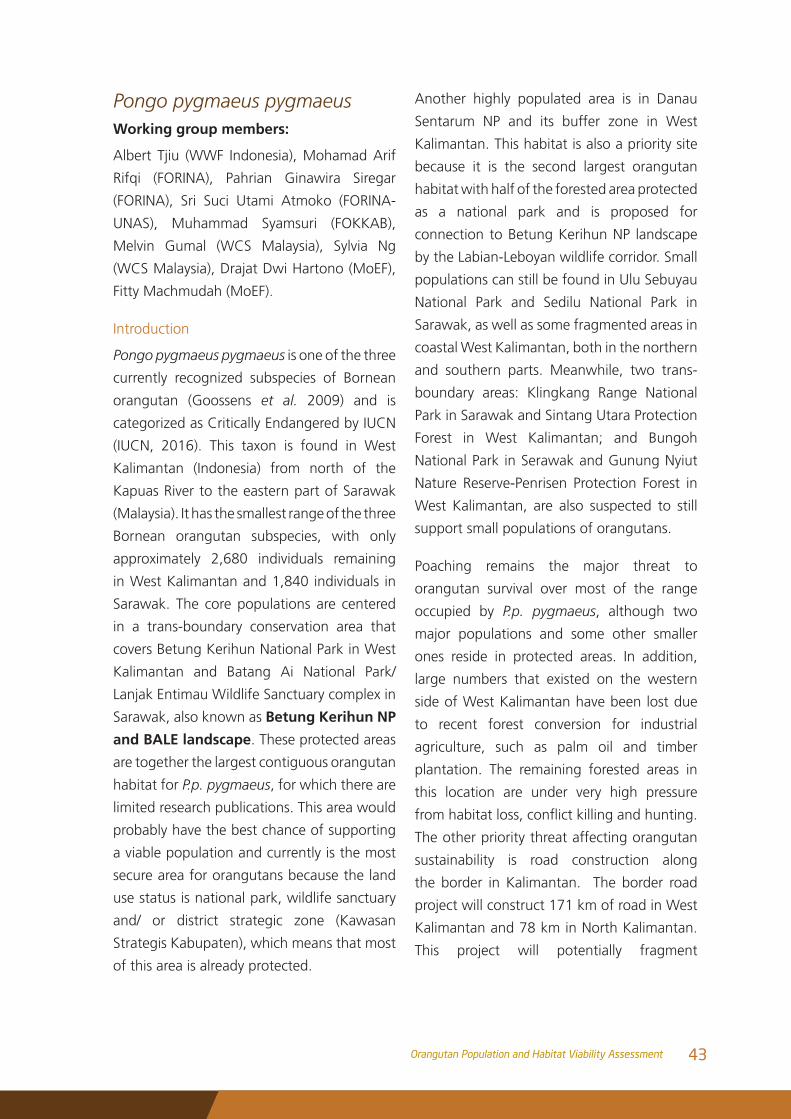
Pongo pygmaeus pygmaeusWorking group members:
Albert Tjiu (WWF Indonesia), Mohamad Arif
Rifqi (FORINA), Pahrian Ginawira Siregar
(FORINA), Sri Suci Utami Atmoko (FORINA-
UNAS), Muhammad Syamsuri (FOKKAB),
Melvin Gumal (WCS Malaysia), Sylvia Ng
(WCS Malaysia), Drajat Dwi Hartono (MoEF),
Fitty Machmudah (MoEF).
Introduction
Pongo pygmaeus pygmaeus is one of the three
currently recognized subspecies of Bornean
orangutan (Goossens et al. 2009) and is
categorized as Critically Endangered by IUCN
(IUCN, 2016). This taxon is found in West
Kalimantan (Indonesia) from north of the
Kapuas River to the eastern part of Sarawak
(Malaysia). It has the smallest range of the three
Bornean orangutan subspecies, with only
approximately 2,680 individuals remaining
in West Kalimantan and 1,840 individuals in
Sarawak. The core populations are centered
in a trans-boundary conservation area that
covers Betung Kerihun National Park in West
Kalimantan and Batang Ai National Park/
Lanjak Entimau Wildlife Sanctuary complex in
Sarawak, also known as Betung Kerihun NP
and BALE landscape. These protected areas
are together the largest contiguous orangutan
habitat for P.p. pygmaeus, for which there are
limited research publications. This area would
probably have the best chance of supporting
a viable population and currently is the most
secure area for orangutans because the land
use status is national park, wildlife sanctuary
and/ or district strategic zone (Kawasan
Strategis Kabupaten), which means that most
of this area is already protected.
Another highly populated area is in Danau
Sentarum NP and its buffer zone in West
Kalimantan. This habitat is also a priority site
because it is the second largest orangutan
habitat with half of the forested area protected
as a national park and is proposed for
connection to Betung Kerihun NP landscape
by the Labian-Leboyan wildlife corridor. Small
populations can still be found in Ulu Sebuyau
National Park and Sedilu National Park in
Sarawak, as well as some fragmented areas in
coastal West Kalimantan, both in the northern
and southern parts. Meanwhile, two trans-
boundary areas: Klingkang Range National
Park in Sarawak and Sintang Utara Protection
Forest in West Kalimantan; and Bungoh
National Park in Serawak and Gunung Nyiut
Nature Reserve-Penrisen Protection Forest in
West Kalimantan, are also suspected to still
support small populations of orangutans.
Poaching remains the major threat to
orangutan survival over most of the range
occupied by P.p. pygmaeus, although two
major populations and some other smaller
ones reside in protected areas. In addition,
large numbers that existed on the western
side of West Kalimantan have been lost due
to recent forest conversion for industrial
agriculture, such as palm oil and timber
plantation. The remaining forested areas in
this location are under very high pressure
fromhabitatloss,conflictkillingandhunting.
The other priority threat affecting orangutan
sustainability is road construction along
the border in Kalimantan. The border road
project will construct 171 km of road in West
Kalimantan and 78 km in North Kalimantan.
This project will potentially fragment
43Orangutan Population and Habitat Viability Assessment
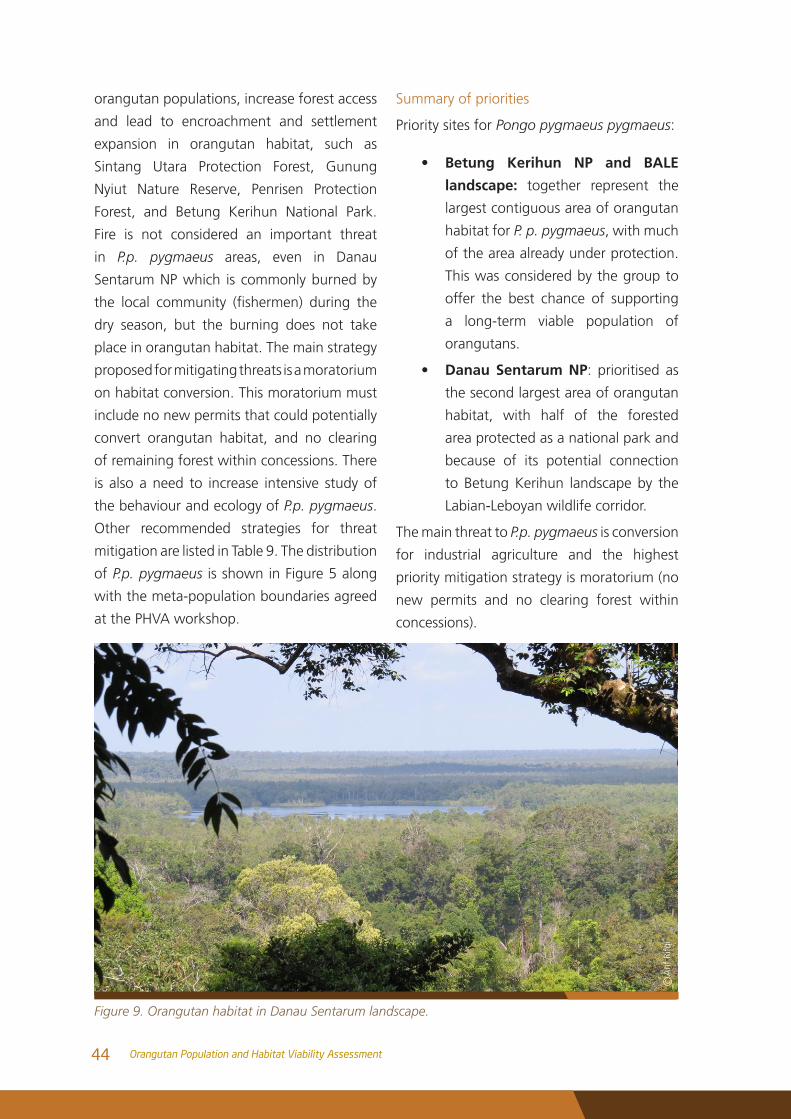
orangutan populations, increase forest access
and lead to encroachment and settlement
expansion in orangutan habitat, such as
Sintang Utara Protection Forest, Gunung
Nyiut Nature Reserve, Penrisen Protection
Forest, and Betung Kerihun National Park.
Fire is not considered an important threat
in P.p. pygmaeus areas, even in Danau
Sentarum NP which is commonly burned by
the local community (fishermen) during the
dry season, but the burning does not take
place in orangutan habitat. The main strategy
proposed for mitigating threats is a moratorium
on habitat conversion. This moratorium must
include no new permits that could potentially
convert orangutan habitat, and no clearing
of remaining forest within concessions. There
is also a need to increase intensive study of
the behaviour and ecology of P.p. pygmaeus.
Other recommended strategies for threat
mitigation are listed in Table 9. The distribution
of P.p. pygmaeus is shown in Figure 5 along
with the meta-population boundaries agreed
at the PHVA workshop.
Summary of priorities
Priority sites for Pongo pygmaeus pygmaeus:
• Betung Kerihun NP and BALE
landscape: together represent the
largest contiguous area of orangutan
habitat for P. p. pygmaeus, with much
of the area already under protection.
This was considered by the group to
offer the best chance of supporting
a long-term viable population of
orangutans.
• Danau Sentarum NP: prioritised as
the second largest area of orangutan
habitat, with half of the forested
area protected as a national park and
because of its potential connection
to Betung Kerihun landscape by the
Labian-Leboyan wildlife corridor.
The main threat to P.p. pygmaeus is conversion
for industrial agriculture and the highest
priority mitigation strategy is moratorium (no
new permits and no clearing forest within
concessions).
Figure 9. Orangutan habitat in Danau Sentarum landscape.
Arif
Rifq
ic
44 Orangutan Population and Habitat Viability Assessment
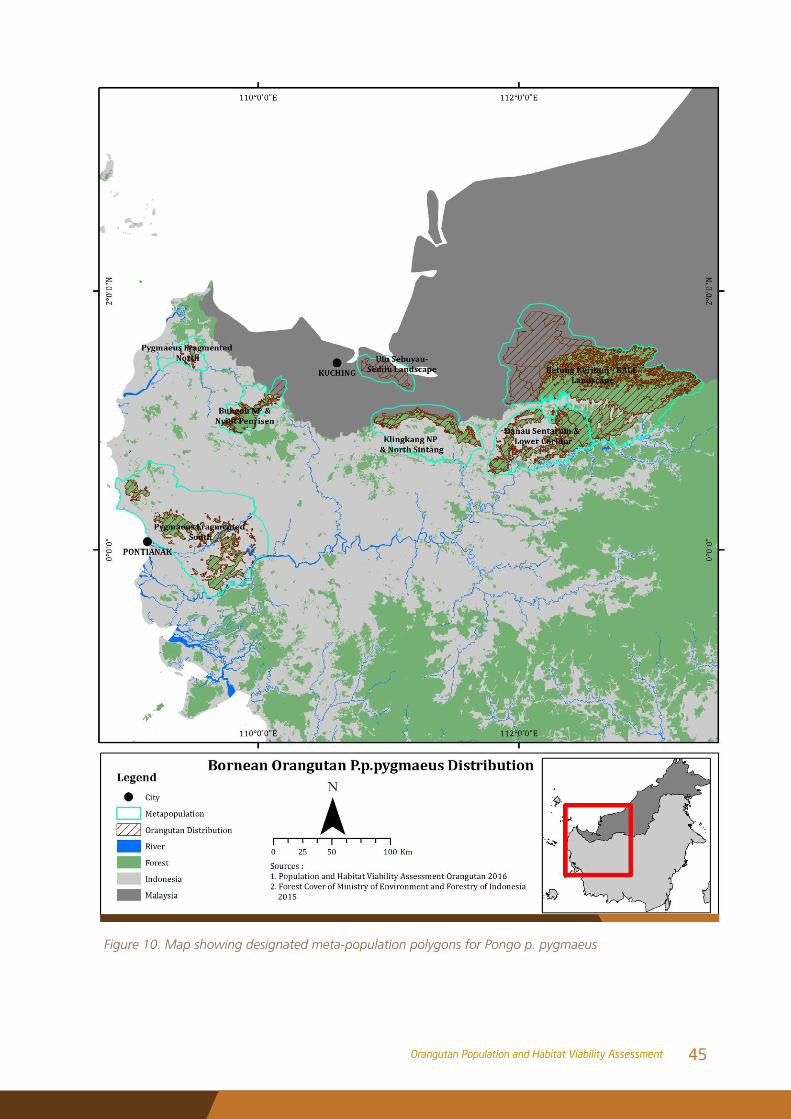
Figure 10. Map showing designated meta-population polygons for Pongo p. pygmaeus
45Orangutan Population and Habitat Viability Assessment
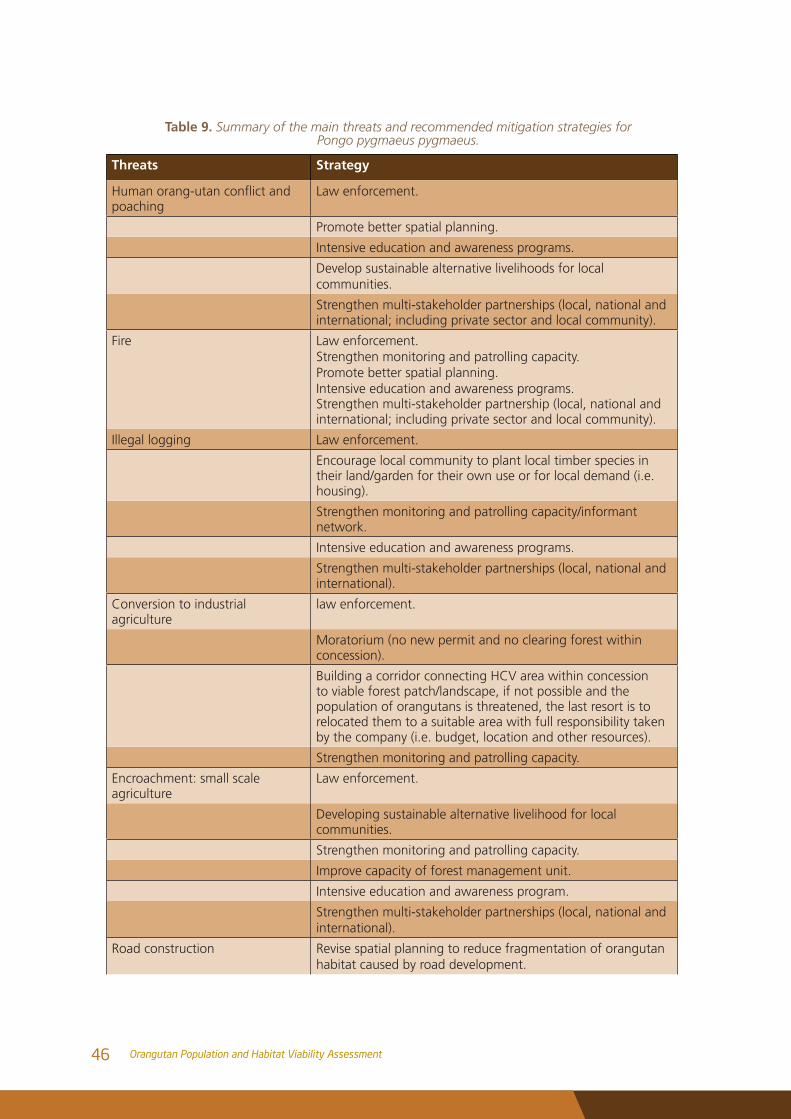
Table 9. Summary of the main threats and recommended mitigation strategies for Pongo pygmaeus pygmaeus.
Threats Strategy
Humanorang-utanconflictandpoaching
Law enforcement.
Promote better spatial planning.
Intensive education and awareness programs.
Develop sustainable alternative livelihoods for local communities.
Strengthen multi-stakeholder partnerships (local, national and international; including private sector and local community).
Fire Law enforcement.Strengthen monitoring and patrolling capacity.Promote better spatial planning.Intensive education and awareness programs.Strengthen multi-stakeholder partnership (local, national and international; including private sector and local community).
Illegal logging Law enforcement.
Encourage local community to plant local timber species in their land/garden for their own use or for local demand (i.e. housing).
Strengthen monitoring and patrolling capacity/informant network.
Intensive education and awareness programs.
Strengthen multi-stakeholder partnerships (local, national and international).
Conversion to industrial agriculture
law enforcement.
Moratorium (no new permit and no clearing forest within concession).
Building a corridor connecting HCV area within concession to viable forest patch/landscape, if not possible and the population of orangutans is threatened, the last resort is to relocated them to a suitable area with full responsibility taken by the company (i.e. budget, location and other resources).
Strengthen monitoring and patrolling capacity.
Encroachment: small scale agriculture
Law enforcement.
Developing sustainable alternative livelihood for local communities.
Strengthen monitoring and patrolling capacity.
Improve capacity of forest management unit.
Intensive education and awareness program.
Strengthen multi-stakeholder partnerships (local, national and international).
Road construction Revise spatial planning to reduce fragmentation of orangutan habitat caused by road development.
46 Orangutan Population and Habitat Viability Assessment
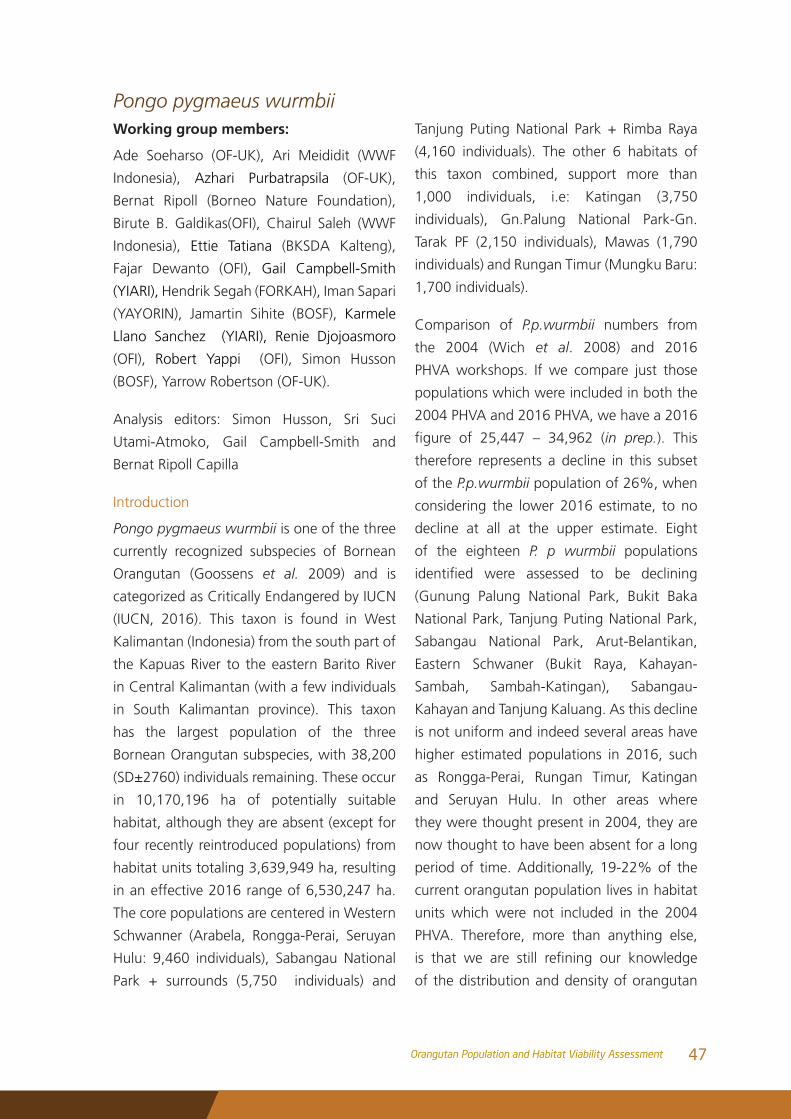
Pongo pygmaeus wurmbiiWorking group members:
Ade Soeharso (OF-UK), Ari Meididit (WWF
Indonesia), Azhari Purbatrapsila (OF-UK),
Bernat Ripoll (Borneo Nature Foundation),
Birute B. Galdikas(OFI), Chairul Saleh (WWF
Indonesia), Ettie Tatiana (BKSDA Kalteng),
Fajar Dewanto (OFI), Gail Campbell-Smith
(YIARI), Hendrik Segah (FORKAH), Iman Sapari
(YAYORIN), Jamartin Sihite (BOSF), Karmele
Llano Sanchez (YIARI), Renie Djojoasmoro
(OFI), Robert Yappi (OFI), Simon Husson
(BOSF), Yarrow Robertson (OF-UK).
Analysis editors: Simon Husson, Sri Suci
Utami-Atmoko, Gail Campbell-Smith and
Bernat Ripoll Capilla
Introduction
Pongo pygmaeus wurmbii is one of the three
currently recognized subspecies of Bornean
Orangutan (Goossens et al. 2009) and is
categorized as Critically Endangered by IUCN
(IUCN, 2016). This taxon is found in West
Kalimantan (Indonesia) from the south part of
the Kapuas River to the eastern Barito River
in Central Kalimantan (with a few individuals
in South Kalimantan province). This taxon
has the largest population of the three
Bornean Orangutan subspecies, with 38,200
(SD±2760) individuals remaining. These occur
in 10,170,196 ha of potentially suitable
habitat, although they are absent (except for
four recently reintroduced populations) from
habitat units totaling 3,639,949 ha, resulting
in an effective 2016 range of 6,530,247 ha.
The core populations are centered in Western
Schwanner (Arabela, Rongga-Perai, Seruyan
Hulu: 9,460 individuals), Sabangau National
Park + surrounds (5,750 individuals) and
Tanjung Puting National Park + Rimba Raya
(4,160 individuals). The other 6 habitats of
this taxon combined, support more than
1,000 individuals, i.e: Katingan (3,750
individuals), Gn.Palung National Park-Gn.
Tarak PF (2,150 individuals), Mawas (1,790
individuals) and Rungan Timur (Mungku Baru:
1,700 individuals).
Comparison of P.p.wurmbii numbers from
the 2004 (Wich et al. 2008) and 2016
PHVA workshops. If we compare just those
populations which were included in both the
2004 PHVA and 2016 PHVA, we have a 2016
figure of 25,447 – 34,962 (in prep.). This
therefore represents a decline in this subset
of the P.p.wurmbii population of 26%, when
considering the lower 2016 estimate, to no
decline at all at the upper estimate. Eight
of the eighteen P. p wurmbii populations
identified were assessed to be declining
(Gunung Palung National Park, Bukit Baka
National Park, Tanjung Puting National Park,
Sabangau National Park, Arut-Belantikan,
Eastern Schwaner (Bukit Raya, Kahayan-
Sambah, Sambah-Katingan), Sabangau-
Kahayan and Tanjung Kaluang. As this decline
is not uniform and indeed several areas have
higher estimated populations in 2016, such
as Rongga-Perai, Rungan Timur, Katingan
and Seruyan Hulu. In other areas where
they were thought present in 2004, they are
now thought to have been absent for a long
period of time. Additionally, 19-22% of the
current orangutan population lives in habitat
units which were not included in the 2004
PHVA. Therefore, more than anything else,
is that we are still refining our knowledge
of the distribution and density of orangutan
47Orangutan Population and Habitat Viability Assessment
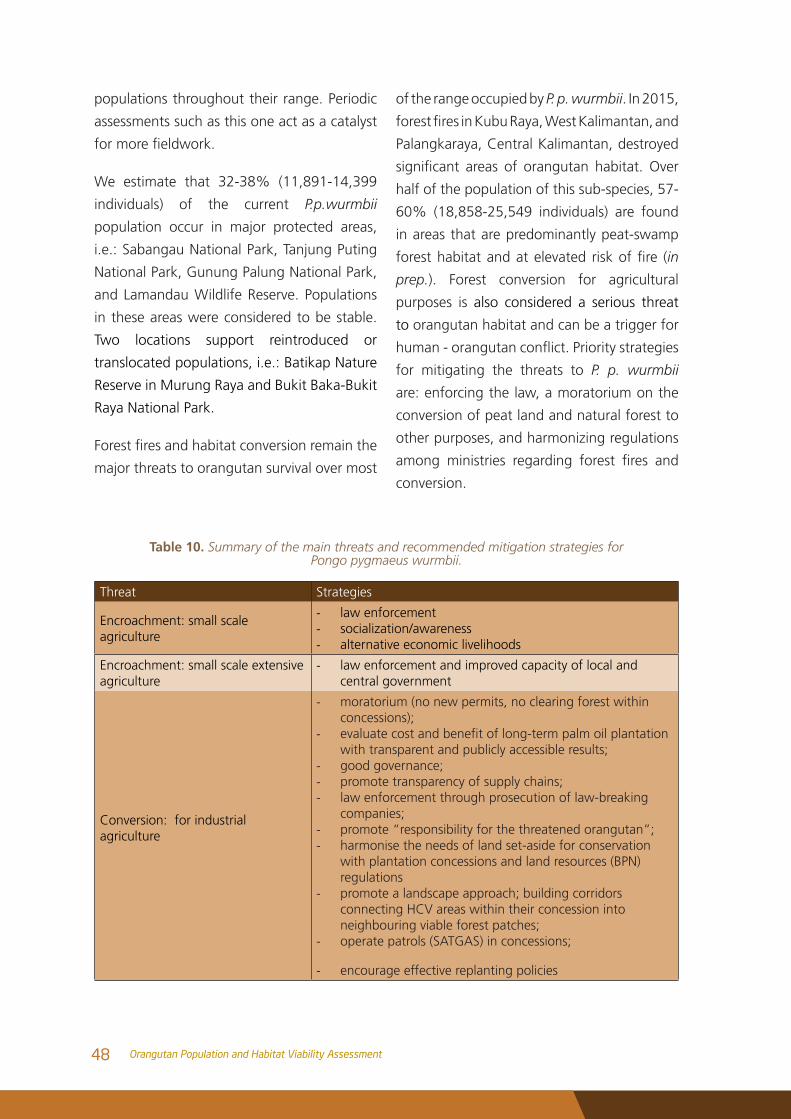
populations throughout their range. Periodic
assessments such as this one act as a catalyst
formorefieldwork.
We estimate that 32-38% (11,891-14,399
individuals) of the current P.p.wurmbii
population occur in major protected areas,
i.e.: Sabangau National Park, Tanjung Puting
National Park, Gunung Palung National Park,
and Lamandau Wildlife Reserve. Populations
in these areas were considered to be stable.
Two locations support reintroduced or
translocated populations, i.e.: Batikap Nature
Reserve in Murung Raya and Bukit Baka-Bukit
Raya National Park.
Forestfiresandhabitatconversionremainthe
major threats to orangutan survival over most
of the range occupied by P. p. wurmbii. In 2015,
forestfiresinKubuRaya,WestKalimantan,and
Palangkaraya, Central Kalimantan, destroyed
significant areas of orangutan habitat. Over
half of the population of this sub-species, 57-
60% (18,858-25,549 individuals) are found
in areas that are predominantly peat-swamp
foresthabitatandatelevated riskoffire (in
prep.). Forest conversion for agricultural
purposes is also considered a serious threat
to orangutan habitat and can be a trigger for
human-orangutanconflict.Prioritystrategies
for mitigating the threats to P. p. wurmbii
are: enforcing the law, a moratorium on the
conversion of peat land and natural forest to
other purposes, and harmonizing regulations
among ministries regarding forest fires and
conversion.
Threat Strategies
Encroachment: small scale agriculture
- law enforcement- socialization/awareness- alternative economic livelihoods
Encroachment: small scale extensive agriculture
- law enforcement and improved capacity of local and central government
Conversion: for industrial agriculture
- moratorium (no new permits, no clearing forest within concessions);
- evaluatecostandbenefitoflong-termpalmoilplantationwith transparent and publicly accessible results;
- good governance; - promote transparency of supply chains;- law enforcement through prosecution of law-breaking
companies; - promote “responsibility for the threatened orangutan”;- harmonise the needs of land set-aside for conservation
with plantation concessions and land resources (BPN) regulations
- promote a landscape approach; building corridors connecting HCV areas within their concession into neighbouring viable forest patches;
- operate patrols (SATGAS) in concessions;
- encourage effective replanting policies
Table 10. Summary of the main threats and recommended mitigation strategies for Pongo pygmaeus wurmbii.
48 Orangutan Population and Habitat Viability Assessment
Road construction
- closure of illegal roads
- revise spatial planning to reduce fragmentation of orangutan habitat from road development
- patrol and law enforcement operation
- alternative economic livelihoods
Settlement - socialization/awareness efforts
Logging: illegal
- law enforcement
- socialization/awareness
- alternative economic livelihoods
- encourage local community replanting schemes on their lands for community/personal use (i.e. house refurbishment)
- strengthen monitoring and patrolling capacity/informant networks (community patrol teams for example)
- strengthen multi-stakeholder partnership (local, national and international)
Logging: low impact
- law enforcement
- socialization/awareness
- alternative economic livelihoods
Logging: high impact
- law enforcement
- socialization/awareness
- alternative economic livelihoods
- strengthen monitoring and patrolling capacity/informant networks (community patrol teams)
- strengthen multi-stakeholder partnership (local, national and international)
Timber plantation
- moratorium (no new permits, no clearing forest within concessions);
- evaluatecostandbenefitoflong-termtimber(alltypes)with transparent and publicly accessible results;
- good governance; - promote transparency of supply chains;- law enforcement through prosecution of law-breaking
companies; - promote “responsibility for the threatened orangutan”;- promote a landscape approach; building corridors
connecting HCV areas within their concession into neighbouring viable forest patches
- operate patrols (SATGAS) in concessions
- encourage effective replanting policies
Absence of forest management unit - West Kalimantan
49Orangutan Population and Habitat Viability Assessment
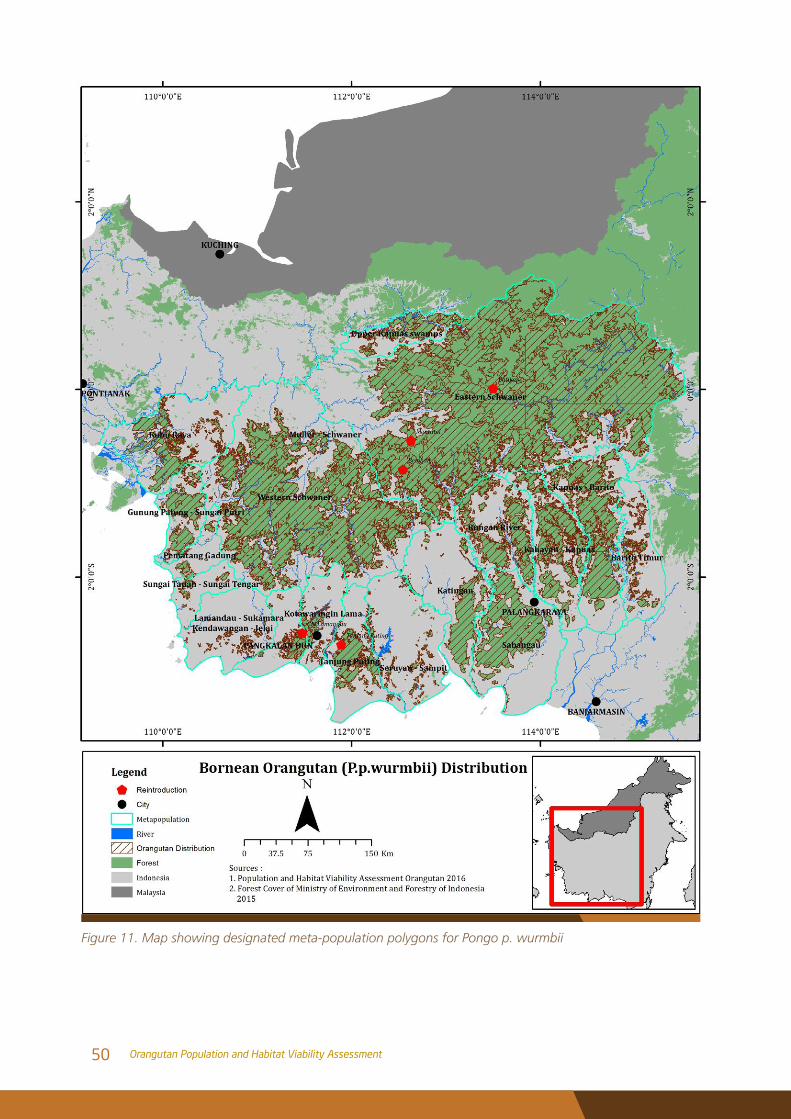
Figure 11. Map showing designated meta-population polygons for Pongo p. wurmbii
50 Orangutan Population and Habitat Viability Assessment
Orangutan Population Viability Analysis Modelling Report
Modeler: Kathy Traylor-Holzer, IUCN SSC CBSG
IntroductionThe purpose of this Population Viability
Analysis (PVA) is to provide an assessment
of the relative viability of wild orangutan
populations living on Sumatra and Borneo
through the development of a population
simulation model based on the best available
information. This assessment identifies
those factors thatmost influenceorangutan
population viability and explores the impacts
of increases or reduction of threats. This PVA
provides an update to previous orangutan
PVAs conducted by CBSG in 1993, 2004
and 2005 in connection with orangutan
conservation planning efforts (Tilson et al.
1993; Singleton et al. 2004; Ellis et al. 2006),
and is designed to inform the next Orangutan
Conservation Strategy and Action Plan.
PVA objectives
Participants at the 2016 PHVA workshop
identified the following questions to be
addressed by this PVA:
1. What is the projected viability of current
orangutan populations given the best
estimates of population size, threats and
management?
2. What is the projected impact on orangutans
of the construction of roads through
orangutan habitat (e.g., in West and East
Leuser, in West and East Batang Toru)?
3. What is the smallest population size
that can meet the agreed standards for
a Minimum Viable Population (MVP)?
How does this size change with different
conditions or threat levels?
51Orangutan Population and Habitat Viability Assessment
4. What is the smallest current population that
could meet the MVP standard if allowed
space to grow larger (e.g., reintroductions
into a new area, additional habitat added
to an existing area)?
5. What level of periodic supplementation
would be needed to maintain the viability
of small populations below the MVP?
6. What is the viability of populations
establishedusingaspecifiedreintroduction
scheme?
For the purposes of this PVA, the participants
agreedtothefollowingdefinitionofa‘viable
population’:
A viable population is one with less than
1% probability of extinction in 100 years
(PE100y < 1%) and less than 10% risk of
extinction in 500 years (PE500y < 10%).
Additional measures such as population trend
and genetic diversity also are pertinent to
assessing viability. Due to the long generation
time (~30 years) of this species, it is appropriate
to consider population status over multiple
generations to detect impacts of threats and
stochastic processes on long-term viability.
Introduction to PVA and Vortex
Computer modelling is a valuable and versatile
tool for quantitatively assessing risk of decline
and extinction of wildlife populations, both
free ranging and managed. Complex and
interacting factors that influencepopulation
persistence and health can be explored,
including natural and anthropogenic causes.
Models can also be used to evaluate the
effects of alternative management strategies
to identify the most effective conservation
actions for a population or species and to
identify research needs. Such an evaluation
of population persistence under current and
varying conditions is commonly referred to as
a population viability analysis (PVA).
The simulation software program Vortex
(v10.2.6) (Lacy and Pollak 2017) was used
to examine the viability of orangutan
populations on Sumatra and Borneo based
on previous PVA models and using updated
population and threat information. Vortex is
a Monte Carlo simulation of the effects of
deterministic forces as well as demographic,
environmental, and genetic stochastic events
on wild populations. Vortex models population
dynamics as discrete sequential events that
occuraccordingtodefinedprobabilities.The
program begins by creating individuals to
form the starting population and then steps
through life cycle events (e.g., births, deaths,
dispersal, catastrophic events), typically on an
annual basis. Events such as breeding success,
sex at birth, and survival are determined based
upon designated probabilities. Consequently,
each run (iteration) of the model gives
a different result. By running the model
hundreds of times, it is possible to examine the
probable outcome and range of possibilities.
For a more detailed explanation of Vortex and
its use in population viability analysis, see Lacy
(2000) and Lacy et al. (2017).
Model development and data sources
A Vortex population model for orangutans was
developed at the 2004 Orangutan PHVA and
modified to reflect differences in orangutan
life history in Sumatra and Borneo (Singleton
et al. 2004). Data for age- and sex-specific
mortality rates, reproductive lifespan, and
52 Orangutan Population and Habitat Viability Assessment
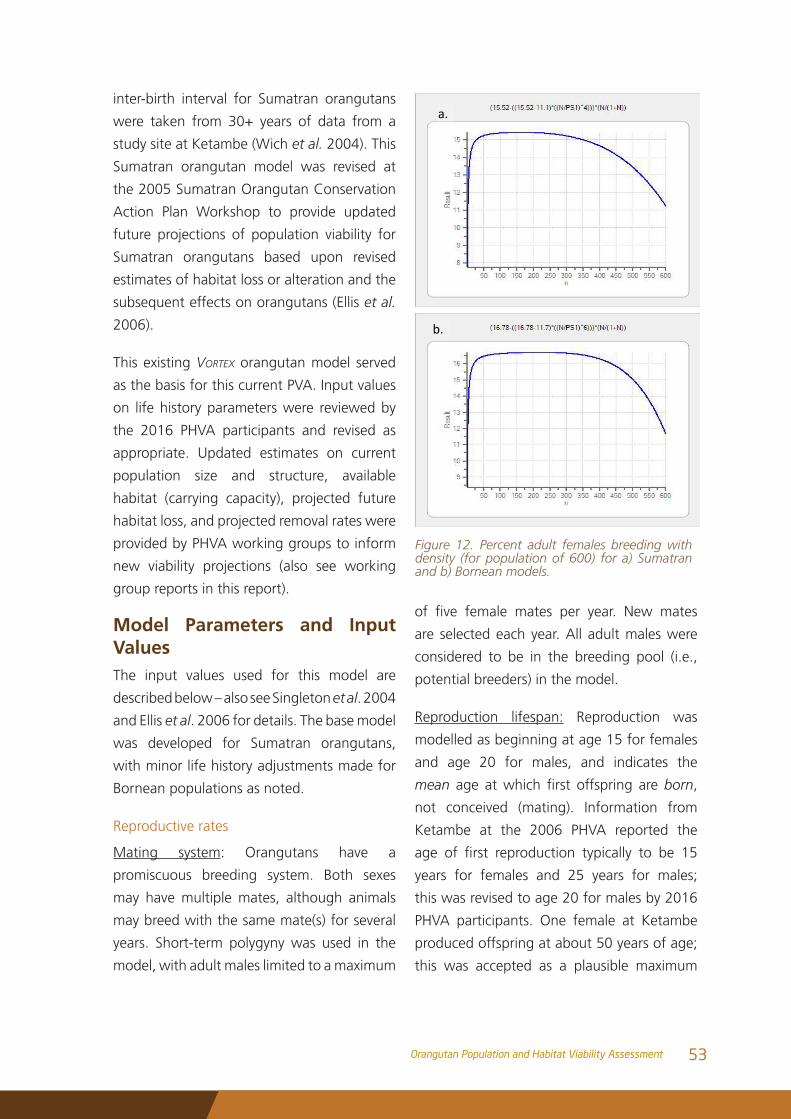
inter-birth interval for Sumatran orangutans
were taken from 30+ years of data from a
study site at Ketambe (Wich et al. 2004). This
Sumatran orangutan model was revised at
the 2005 Sumatran Orangutan Conservation
Action Plan Workshop to provide updated
future projections of population viability for
Sumatran orangutans based upon revised
estimates of habitat loss or alteration and the
subsequent effects on orangutans (Ellis et al.
2006).
This existing Vortex orangutan model served
as the basis for this current PVA. Input values
on life history parameters were reviewed by
the 2016 PHVA participants and revised as
appropriate. Updated estimates on current
population size and structure, available
habitat (carrying capacity), projected future
habitat loss, and projected removal rates were
provided by PHVA working groups to inform
new viability projections (also see working
group reports in this report).
Model Parameters and Input ValuesThe input values used for this model are
described below – also see Singleton et al. 2004
and Ellis et al. 2006 for details. The base model
was developed for Sumatran orangutans,
with minor life history adjustments made for
Bornean populations as noted.
Reproductive rates
Mating system: Orangutans have a
promiscuous breeding system. Both sexes
may have multiple mates, although animals
may breed with the same mate(s) for several
years. Short-term polygyny was used in the
model, with adult males limited to a maximum
of five female mates per year. New mates
are selected each year. All adult males were
considered to be in the breeding pool (i.e.,
potential breeders) in the model.
Reproduction lifespan: Reproduction was
modelled as beginning at age 15 for females
and age 20 for males, and indicates the
mean age atwhich first offspring areborn,
not conceived (mating). Information from
Ketambe at the 2006 PHVA reported the
age of first reproduction typically to be 15
years for females and 25 years for males;
this was revised to age 20 for males by 2016
PHVA participants. One female at Ketambe
produced offspring at about 50 years of age;
this was accepted as a plausible maximum
a.
b.
Figure 12. Percent adult females breeding with density (for population of 600) for a) Sumatran and b) Bornean models.
53Orangutan Population and Habitat Viability Assessment
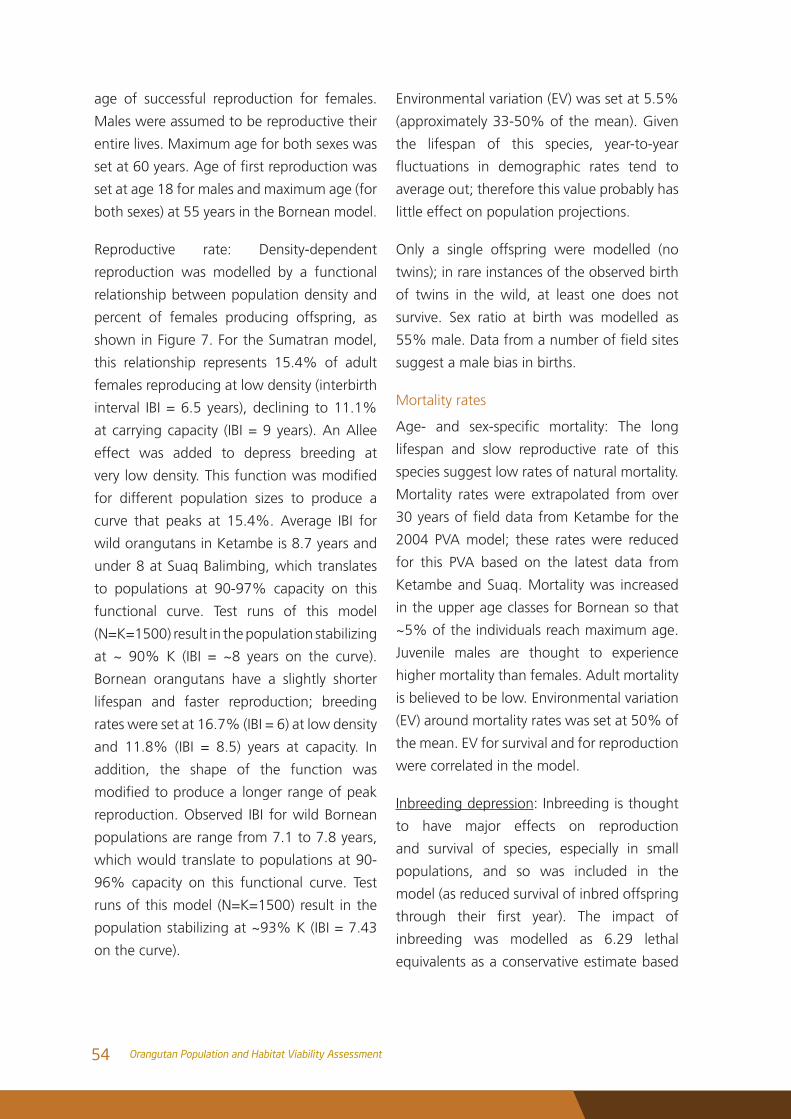
Threats Priority strategies
Encroachment: small scale agriculture
Law enforcement.
Developing sustainable alternative livelihoods for local communities.
Strengthening monitoring and patrolling capacity.
Improving the capacity of forest management units.
Intensive education and awareness programs.
Strengthening multi-stakeholder partnerships (local, national and international).
Illegal logging Law enforcement.
Encouraging local communities to plant local timber species on their land/garden, for their own use or to meet local demand (i.e. housing).
Strengthening monitoring and patrolling capacity/informant networks.
Intensive education and awareness programs.
Strengthening multi-stakeholder partnerships (local, national and international).
Conversion for industrial agriculture
Law enforcement.
Moratorium (no new permits and no clearing of forest within concessions).
Building corridors connecting High Conservation Values (HCV) areas within concessions to viable forest patches/landscapes. Where not possible and where this threatens the orangutan population of orangutan, the last resort is to relocate to a suitable area with full responsibility taken by the company (i.e. budget, location and other resources).
Strengthening monitoring and patrolling capacity.
Road construction Revising spatial planning to reduce fragmentation of orangutan habitat from road development.
Poaching/Hunting Law enforcement.
Promoting better spatial planning.
Intensive education and awareness program.
Developing sustainable alternative livelihood for local communities.
Strengthen multi-stakeholder partnerships (local, national and international; including private sector and local community).
age of successful reproduction for females.
Males were assumed to be reproductive their
entire lives. Maximum age for both sexes was
setat60years.Ageoffirstreproductionwas
set at age 18 for males and maximum age (for
both sexes) at 55 years in the Bornean model.
Reproductive rate: Density-dependent
reproduction was modelled by a functional
relationship between population density and
percent of females producing offspring, as
shown in Figure 7. For the Sumatran model,
this relationship represents 15.4% of adult
females reproducing at low density (interbirth
interval IBI = 6.5 years), declining to 11.1%
at carrying capacity (IBI = 9 years). An Allee
effect was added to depress breeding at
very lowdensity.Thisfunctionwasmodified
for different population sizes to produce a
curve that peaks at 15.4%. Average IBI for
wild orangutans in Ketambe is 8.7 years and
under 8 at Suaq Balimbing, which translates
to populations at 90-97% capacity on this
functional curve. Test runs of this model
(N=K=1500) result in the population stabilizing
at ~ 90% K (IBI = ~8 years on the curve).
Bornean orangutans have a slightly shorter
lifespan and faster reproduction; breeding
rates were set at 16.7% (IBI = 6) at low density
and 11.8% (IBI = 8.5) years at capacity. In
addition, the shape of the function was
modifiedtoproducea longerrangeofpeak
reproduction. Observed IBI for wild Bornean
populations are range from 7.1 to 7.8 years,
which would translate to populations at 90-
96% capacity on this functional curve. Test
runs of this model (N=K=1500) result in the
population stabilizing at ~93% K (IBI = 7.43
on the curve).
b.
Environmental variation (EV) was set at 5.5%
(approximately 33-50% of the mean). Given
the lifespan of this species, year-to-year
fluctuations in demographic rates tend to
average out; therefore this value probably has
little effect on population projections.
Only a single offspring were modelled (no
twins); in rare instances of the observed birth
of twins in the wild, at least one does not
survive. Sex ratio at birth was modelled as
55%male.Datafromanumberoffieldsites
suggest a male bias in births.
Mortality rates
Age- and sex-specific mortality: The long
lifespan and slow reproductive rate of this
species suggest low rates of natural mortality.
Mortality rates were extrapolated from over
30yearsoffielddatafromKetambeforthe
2004 PVA model; these rates were reduced
for this PVA based on the latest data from
Ketambe and Suaq. Mortality was increased
in the upper age classes for Bornean so that
~5% of the individuals reach maximum age.
Juvenile males are thought to experience
higher mortality than females. Adult mortality
is believed to be low. Environmental variation
(EV) around mortality rates was set at 50% of
the mean. EV for survival and for reproduction
were correlated in the model.
Inbreeding depression: Inbreeding is thought
to have major effects on reproduction
and survival of species, especially in small
populations, and so was included in the
model (as reduced survival of inbred offspring
through their first year). The impact of
inbreeding was modelled as 6.29 lethal
equivalents as a conservative estimate based
54 Orangutan Population and Habitat Viability Assessment
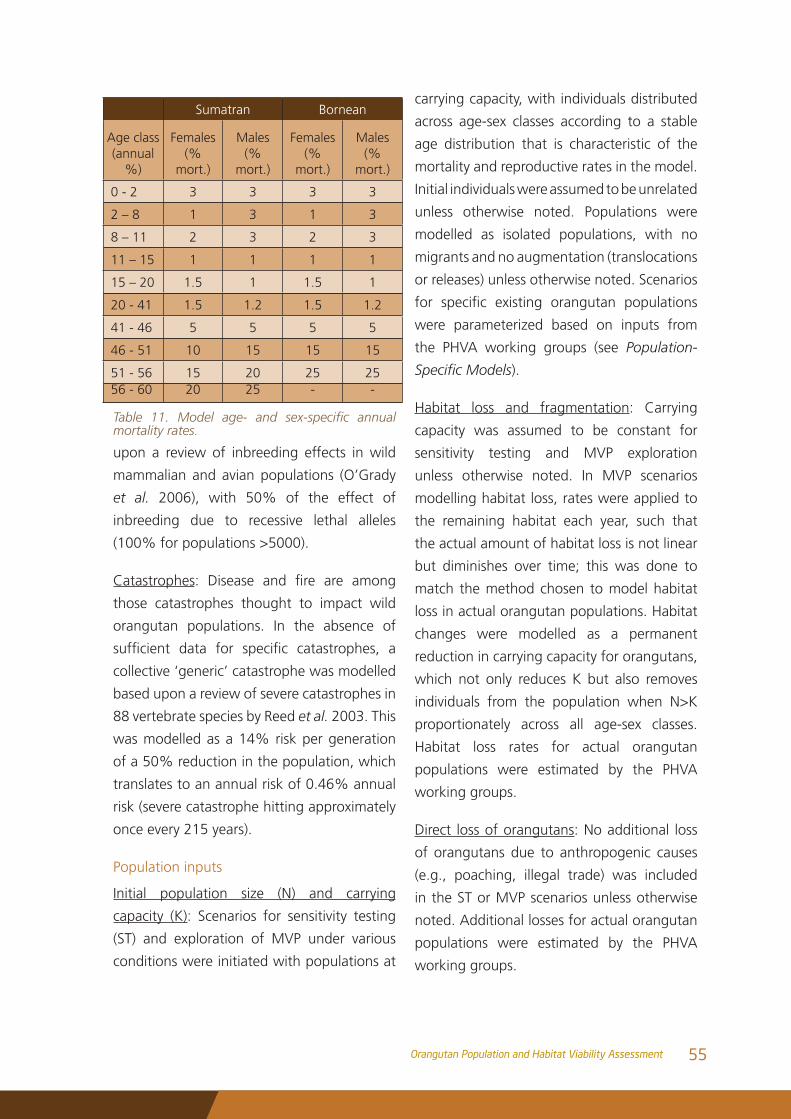
age of successful reproduction for females.
Males were assumed to be reproductive their
entire lives. Maximum age for both sexes was
setat60years.Ageoffirstreproductionwas
set at age 18 for males and maximum age (for
both sexes) at 55 years in the Bornean model.
Reproductive rate: Density-dependent
reproduction was modelled by a functional
relationship between population density and
percent of females producing offspring, as
shown in Figure 7. For the Sumatran model,
this relationship represents 15.4% of adult
females reproducing at low density (interbirth
interval IBI = 6.5 years), declining to 11.1%
at carrying capacity (IBI = 9 years). An Allee
effect was added to depress breeding at
very lowdensity.Thisfunctionwasmodified
for different population sizes to produce a
curve that peaks at 15.4%. Average IBI for
wild orangutans in Ketambe is 8.7 years and
under 8 at Suaq Balimbing, which translates
to populations at 90-97% capacity on this
functional curve. Test runs of this model
(N=K=1500) result in the population stabilizing
at ~ 90% K (IBI = ~8 years on the curve).
Bornean orangutans have a slightly shorter
lifespan and faster reproduction; breeding
rates were set at 16.7% (IBI = 6) at low density
and 11.8% (IBI = 8.5) years at capacity. In
addition, the shape of the function was
modifiedtoproducea longerrangeofpeak
reproduction. Observed IBI for wild Bornean
populations are range from 7.1 to 7.8 years,
which would translate to populations at 90-
96% capacity on this functional curve. Test
runs of this model (N=K=1500) result in the
population stabilizing at ~93% K (IBI = 7.43
on the curve).
b.
upon a review of inbreeding effects in wild
mammalian and avian populations (O’Grady
et al. 2006), with 50% of the effect of
inbreeding due to recessive lethal alleles
(100% for populations >5000).
Catastrophes: Disease and fire are among
those catastrophes thought to impact wild
orangutan populations. In the absence of
sufficient data for specific catastrophes, a
collective ‘generic’ catastrophe was modelled
based upon a review of severe catastrophes in
88 vertebrate species by Reed et al. 2003. This
was modelled as a 14% risk per generation
of a 50% reduction in the population, which
translates to an annual risk of 0.46% annual
risk (severe catastrophe hitting approximately
once every 215 years).
Population inputs
Initial population size (N) and carrying
capacity (K): Scenarios for sensitivity testing
(ST) and exploration of MVP under various
conditions were initiated with populations at
carrying capacity, with individuals distributed
across age-sex classes according to a stable
age distribution that is characteristic of the
mortality and reproductive rates in the model.
Initial individuals were assumed to be unrelated
unless otherwise noted. Populations were
modelled as isolated populations, with no
migrants and no augmentation (translocations
or releases) unless otherwise noted. Scenarios
for specific existing orangutan populations
were parameterized based on inputs from
the PHVA working groups (see Population-
Specific Models).
Habitat loss and fragmentation: Carrying
capacity was assumed to be constant for
sensitivity testing and MVP exploration
unless otherwise noted. In MVP scenarios
modelling habitat loss, rates were applied to
the remaining habitat each year, such that
the actual amount of habitat loss is not linear
but diminishes over time; this was done to
match the method chosen to model habitat
loss in actual orangutan populations. Habitat
changes were modelled as a permanent
reduction in carrying capacity for orangutans,
which not only reduces K but also removes
individuals from the population when N>K
proportionately across all age-sex classes.
Habitat loss rates for actual orangutan
populations were estimated by the PHVA
working groups.
Direct loss of orangutans: No additional loss
of orangutans due to anthropogenic causes
(e.g., poaching, illegal trade) was included
in the ST or MVP scenarios unless otherwise
noted. Additional losses for actual orangutan
populations were estimated by the PHVA
working groups.
Sumatran Bornean
Age class (annual
%)
Females (%
mort.)
Males(%
mort.)
Females (%
mort.)
Males(%
mort.)
0 - 2 3 3 3 3
2 – 8 1 3 1 3
8 – 11 2 3 2 3
11 – 15 1 1 1 1
15 – 20 1.5 1 1.5 1
20 - 41 1.5 1.2 1.5 1.2
41 - 46 5 5 5 5
46 - 51 10 15 15 15
51 - 56 15 20 25 2556 - 60 20 25 - -
Table 11. Model age- and sex-specific annual mortality rates.
55Orangutan Population and Habitat Viability Assessment
Model runs and timeline
Due to the long-lived and slowly reproducing
nature of this species, orangutan populations
were modelled for 500 years (~16 generations)
so that long-term population trends could be
observed and results compared to population
viability goals. Results are presented for
both 100 years and 500 years. Note that
uncertainty in projection results increases over
time due to stochastic processes. In addition,
it is unlikely that conditions are adequately
understood or will remain constant to allow
us to accurately predict population status so
far into the future. All scenarios were run for
a minimum of 500 iterations.
Deterministic results
The baseline model for orangutans describes a
population that shows positive deterministic
growth (r = 0.014 for Sumatran, r = 0.016
for Bornean) in low density conditions. This
is the average population growth expected
based on mean fecundity and mortality rates
in the absence of inbreeding, human-related
mortality, and stochastic processes (e.g.,
shortage of mates, skewed sex ratio). This
is a plausible growth rate for a large, long-
lived and slowly reproducing species such as
the orangutan. Population growth is reduced
under crowded conditions where resources
are limited and the carrying capacity of the
habitat is reached. In these conditions, the
percent of breeding females drops to 11.1%
(Sumatran) or 11.8% (Bornean), resulting
in almost zero growth rate (rSumatran = 0.002;
rBornean = 0.004). Thus in the model, populations
living in saturated conditions regulate their
population size by breeding just enough to
balance the population around the habitat’s
carrying capacity. This negates the need for the
model to artificially truncate populations that
exceed K except in instances of habitat loss.
Sensitivity TestingRecognizing that there is some uncertainty
around model input parameters, sensitivity
testing (ST) was conducted by varying a
single parameter at a time to assess the
sensitivity of the model results to different
input values. All ST scenarios were run for
500 years with 500 iterations with an initial
population of 500 Sumatran orangutans at
capacity (K=500) with no future reduction in
K. While stochastic r is often used to assess ST
results, this metric is of less value here given
that these populations are near K and r is
small; thusothermetricssuchasmeanfinal
population size and probability of extinction
(PE) were used. Detailed results can be found
at the end of this section.
Demographic Sensitivity
Mortality: Juvenile, sub-adult and adult
mortality rates were varied independent by
+10% and +20%, for males and females.
Male mortality rates and female juvenile
mortality have little impact on model results.
As might be expected in a long-lived, slow
reproducing polygynous species, adult female
mortality (and, to a lesser extent, female
sub-adult mortality) does affect population
growth and the ability of the population to
recover from stochastic declines, resulting in
a slow decline in mean population size over
time (Figures 8 & 9). Overall viability remains
high, with high gene diversity and almost no
risk of extinction. Final mean population sizes
range from 442 (20% lower mortality) to 394
(20% higher mortality).
56 Orangutan Population and Habitat Viability Assessment
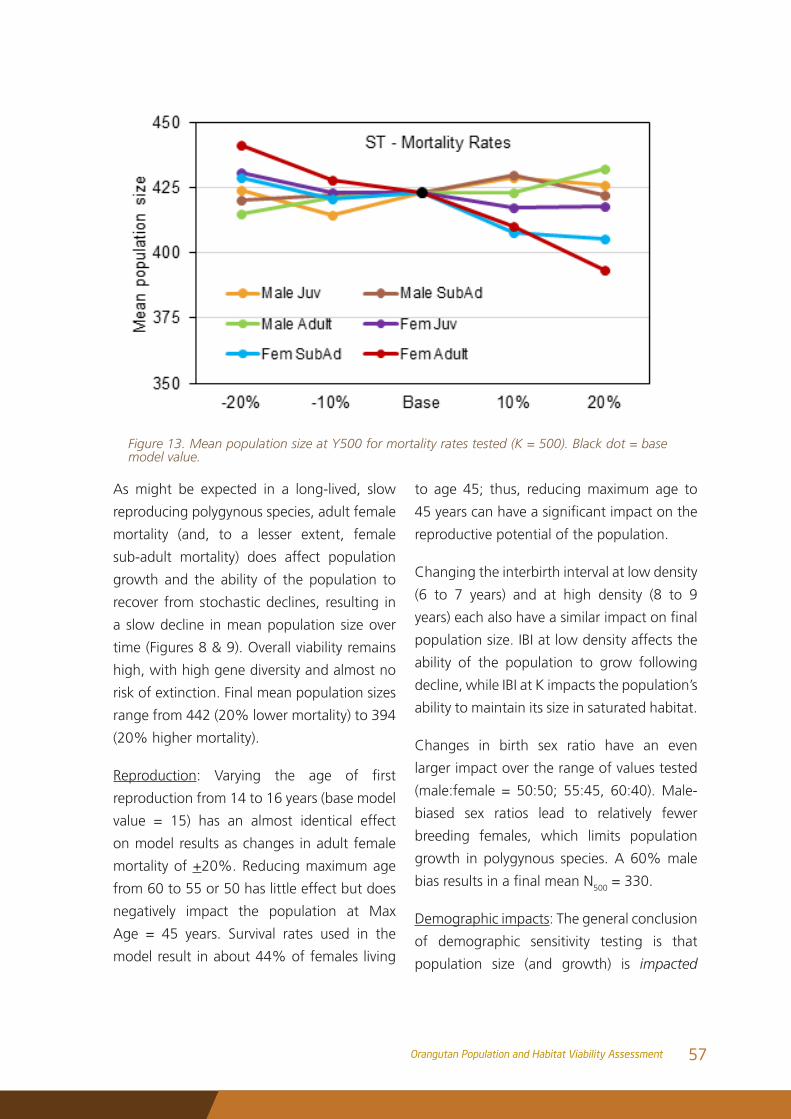
As might be expected in a long-lived, slow
reproducing polygynous species, adult female
mortality (and, to a lesser extent, female
sub-adult mortality) does affect population
growth and the ability of the population to
recover from stochastic declines, resulting in
a slow decline in mean population size over
time (Figures 8 & 9). Overall viability remains
high, with high gene diversity and almost no
risk of extinction. Final mean population sizes
range from 442 (20% lower mortality) to 394
(20% higher mortality).
Reproduction: Varying the age of first
reproduction from 14 to 16 years (base model
value = 15) has an almost identical effect
on model results as changes in adult female
mortality of +20%. Reducing maximum age
from 60 to 55 or 50 has little effect but does
negatively impact the population at Max
Age = 45 years. Survival rates used in the
model result in about 44% of females living
to age 45; thus, reducing maximum age to
45yearscanhaveasignificantimpactonthe
reproductive potential of the population.
Changing the interbirth interval at low density
(6 to 7 years) and at high density (8 to 9
years)eachalsohaveasimilarimpactonfinal
population size. IBI at low density affects the
ability of the population to grow following
decline, while IBI at K impacts the population’s
ability to maintain its size in saturated habitat.
Changes in birth sex ratio have an even
larger impact over the range of values tested
(male:female = 50:50; 55:45, 60:40). Male-
biased sex ratios lead to relatively fewer
breeding females, which limits population
growth in polygynous species. A 60% male
biasresultsinafinalmeanN500 = 330.
Demographic impacts: The general conclusion
of demographic sensitivity testing is that
population size (and growth) is impacted
Figure 13. Mean population size at Y500 for mortality rates tested (K = 500). Black dot = base model value.
57Orangutan Population and Habitat Viability Assessment
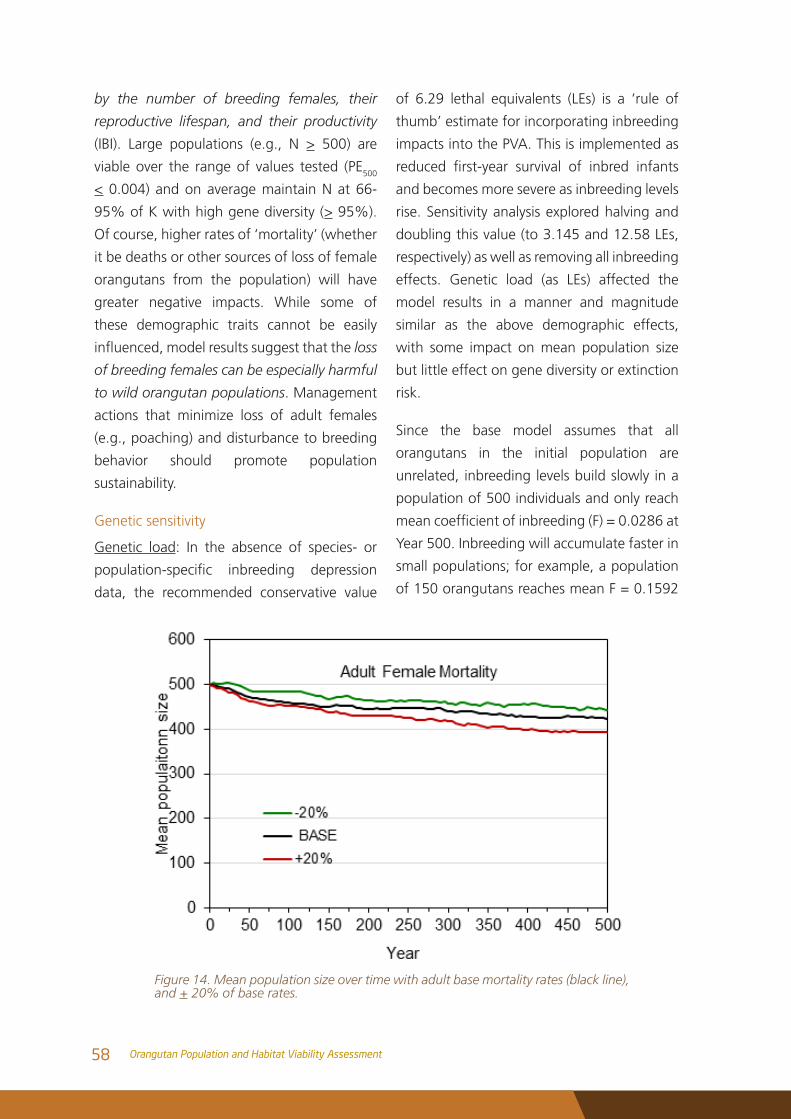
by the number of breeding females, their
reproductive lifespan, and their productivity
(IBI). Large populations (e.g., N > 500) are
viable over the range of values tested (PE500
< 0.004) and on average maintain N at 66-
95% of K with high gene diversity (> 95%).
Of course, higher rates of ‘mortality’ (whether
it be deaths or other sources of loss of female
orangutans from the population) will have
greater negative impacts. While some of
these demographic traits cannot be easily
influenced,modelresultssuggestthattheloss
of breeding females can be especially harmful
to wild orangutan populations. Management
actions that minimize loss of adult females
(e.g., poaching) and disturbance to breeding
behavior should promote population
sustainability.
Genetic sensitivity
Genetic load: In the absence of species- or
population-specific inbreeding depression
data, the recommended conservative value
of 6.29 lethal equivalents (LEs) is a ‘rule of
thumb’ estimate for incorporating inbreeding
impacts into the PVA. This is implemented as
reduced first-year survival of inbred infants
and becomes more severe as inbreeding levels
rise. Sensitivity analysis explored halving and
doubling this value (to 3.145 and 12.58 LEs,
respectively) as well as removing all inbreeding
effects. Genetic load (as LEs) affected the
model results in a manner and magnitude
similar as the above demographic effects,
with some impact on mean population size
but little effect on gene diversity or extinction
risk.
Since the base model assumes that all
orangutans in the initial population are
unrelated, inbreeding levels build slowly in a
population of 500 individuals and only reach
meancoefficientofinbreeding(F)=0.0286at
Year 500. Inbreeding will accumulate faster in
small populations; for example, a population
of 150 orangutans reaches mean F = 0.1592
Figure 14. Mean population size over time with adult base mortality rates (black line), and + 20% of base rates.
58 Orangutan Population and Habitat Viability Assessment
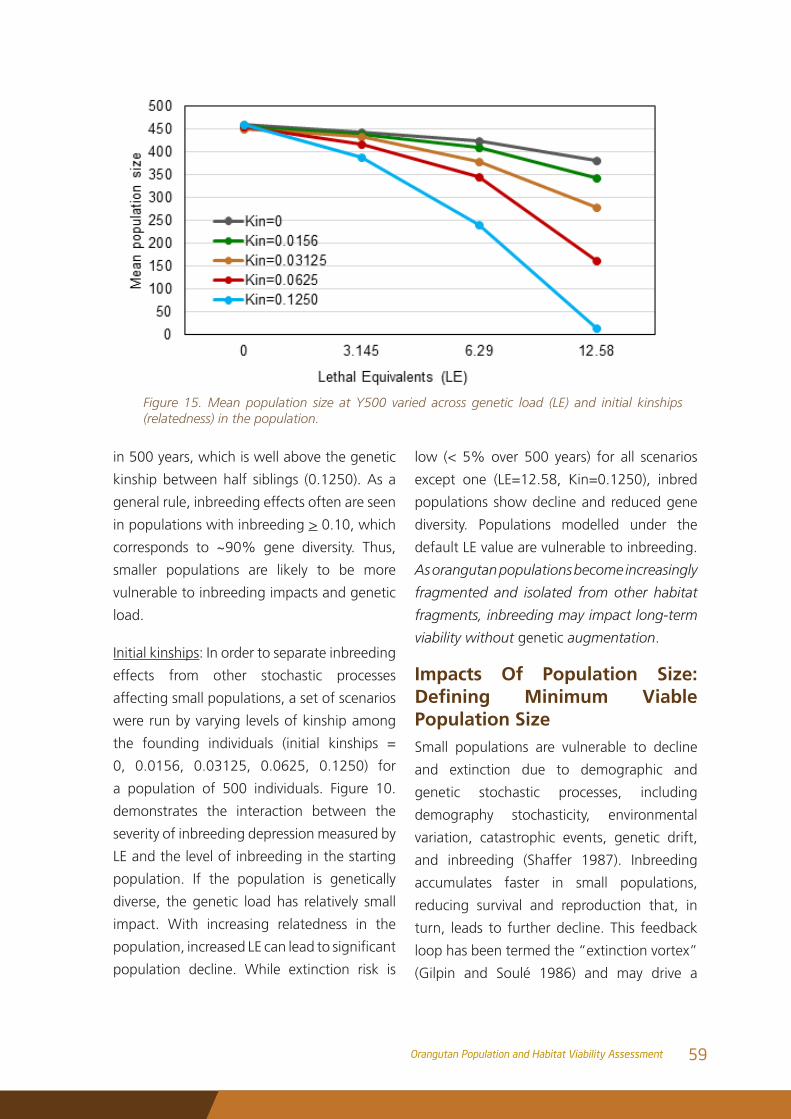
in 500 years, which is well above the genetic
kinship between half siblings (0.1250). As a
general rule, inbreeding effects often are seen
in populations with inbreeding > 0.10, which
corresponds to ~90% gene diversity. Thus,
smaller populations are likely to be more
vulnerable to inbreeding impacts and genetic
load.
Initial kinships: In order to separate inbreeding
effects from other stochastic processes
affecting small populations, a set of scenarios
were run by varying levels of kinship among
the founding individuals (initial kinships =
0, 0.0156, 0.03125, 0.0625, 0.1250) for
a population of 500 individuals. Figure 10.
demonstrates the interaction between the
severity of inbreeding depression measured by
LE and the level of inbreeding in the starting
population. If the population is genetically
diverse, the genetic load has relatively small
impact. With increasing relatedness in the
population,increasedLEcanleadtosignificant
population decline. While extinction risk is
low (< 5% over 500 years) for all scenarios
except one (LE=12.58, Kin=0.1250), inbred
populations show decline and reduced gene
diversity. Populations modelled under the
default LE value are vulnerable to inbreeding.
As orangutan populations become increasingly
fragmented and isolated from other habitat
fragments, inbreeding may impact long-term
viability without genetic augmentation.
Impacts Of Population Size: Defining Minimum Viable Population SizeSmall populations are vulnerable to decline
and extinction due to demographic and
genetic stochastic processes, including
demography stochasticity, environmental
variation, catastrophic events, genetic drift,
and inbreeding (Shaffer 1987). Inbreeding
accumulates faster in small populations,
reducing survival and reproduction that, in
turn, leads to further decline. This feedback
loop has been termed the “extinction vortex”
(Gilpin and Soulé 1986) and may drive a
Figure 15. Mean population size at Y500 varied across genetic load (LE) and initial kinships (relatedness) in the population.
59Orangutan Population and Habitat Viability Assessment
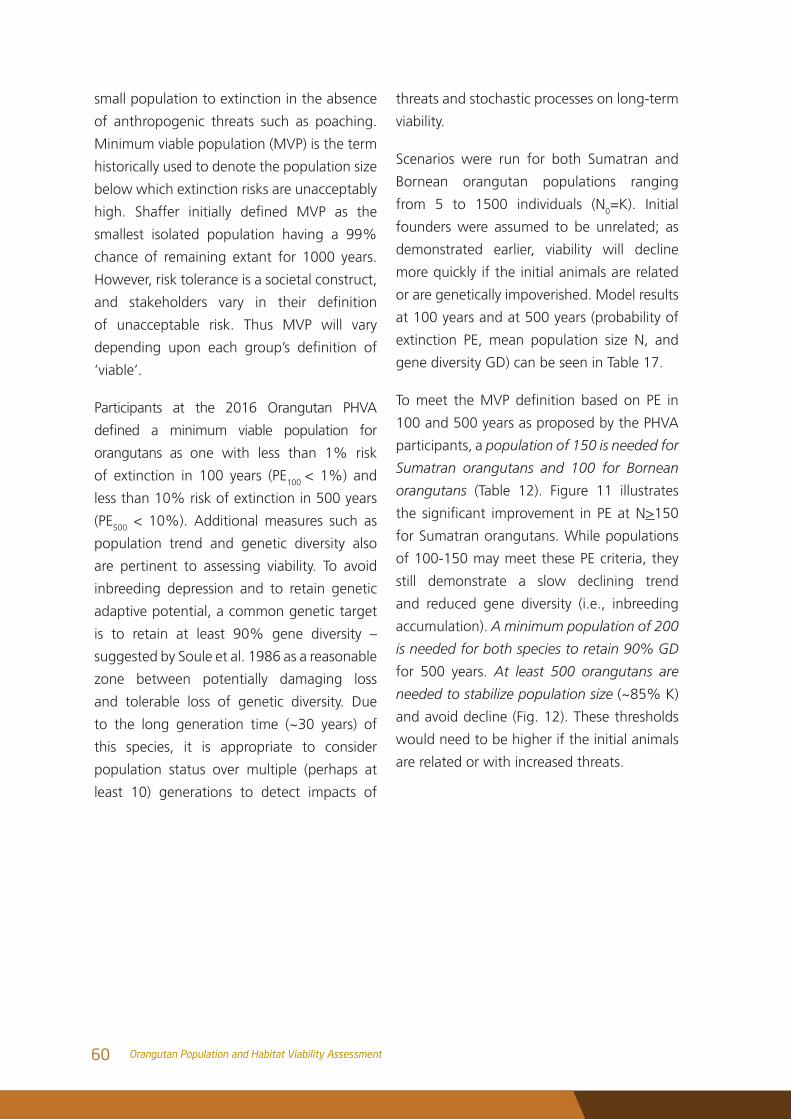
small population to extinction in the absence
of anthropogenic threats such as poaching.
Minimum viable population (MVP) is the term
historically used to denote the population size
below which extinction risks are unacceptably
high. Shaffer initially defined MVP as the
smallest isolated population having a 99%
chance of remaining extant for 1000 years.
However, risk tolerance is a societal construct,
and stakeholders vary in their definition
of unacceptable risk. Thus MVP will vary
depending upon each group’s definition of
‘viable’.
Participants at the 2016 Orangutan PHVA
defined a minimum viable population for
orangutans as one with less than 1% risk
of extinction in 100 years (PE100 < 1%) and
less than 10% risk of extinction in 500 years
(PE500 < 10%). Additional measures such as
population trend and genetic diversity also
are pertinent to assessing viability. To avoid
inbreeding depression and to retain genetic
adaptive potential, a common genetic target
is to retain at least 90% gene diversity –
suggested by Soule et al. 1986 as a reasonable
zone between potentially damaging loss
and tolerable loss of genetic diversity. Due
to the long generation time (~30 years) of
this species, it is appropriate to consider
population status over multiple (perhaps at
least 10) generations to detect impacts of
threats and stochastic processes on long-term
viability.
Scenarios were run for both Sumatran and
Bornean orangutan populations ranging
from 5 to 1500 individuals (N0=K). Initial
founders were assumed to be unrelated; as
demonstrated earlier, viability will decline
more quickly if the initial animals are related
or are genetically impoverished. Model results
at 100 years and at 500 years (probability of
extinction PE, mean population size N, and
gene diversity GD) can be seen in Table 17.
Tomeet theMVPdefinition based on PE in
100 and 500 years as proposed by the PHVA
participants, a population of 150 is needed for
Sumatran orangutans and 100 for Bornean
orangutans (Table 12). Figure 11 illustrates
the significant improvement inPEatN>150
for Sumatran orangutans. While populations
of 100-150 may meet these PE criteria, they
still demonstrate a slow declining trend
and reduced gene diversity (i.e., inbreeding
accumulation). A minimum population of 200
is needed for both species to retain 90% GD
for 500 years. At least 500 orangutans are
needed to stabilize population size (~85% K)
and avoid decline (Fig. 12). These thresholds
would need to be higher if the initial animals
are related or with increased threats.
60 Orangutan Population and Habitat Viability Assessment
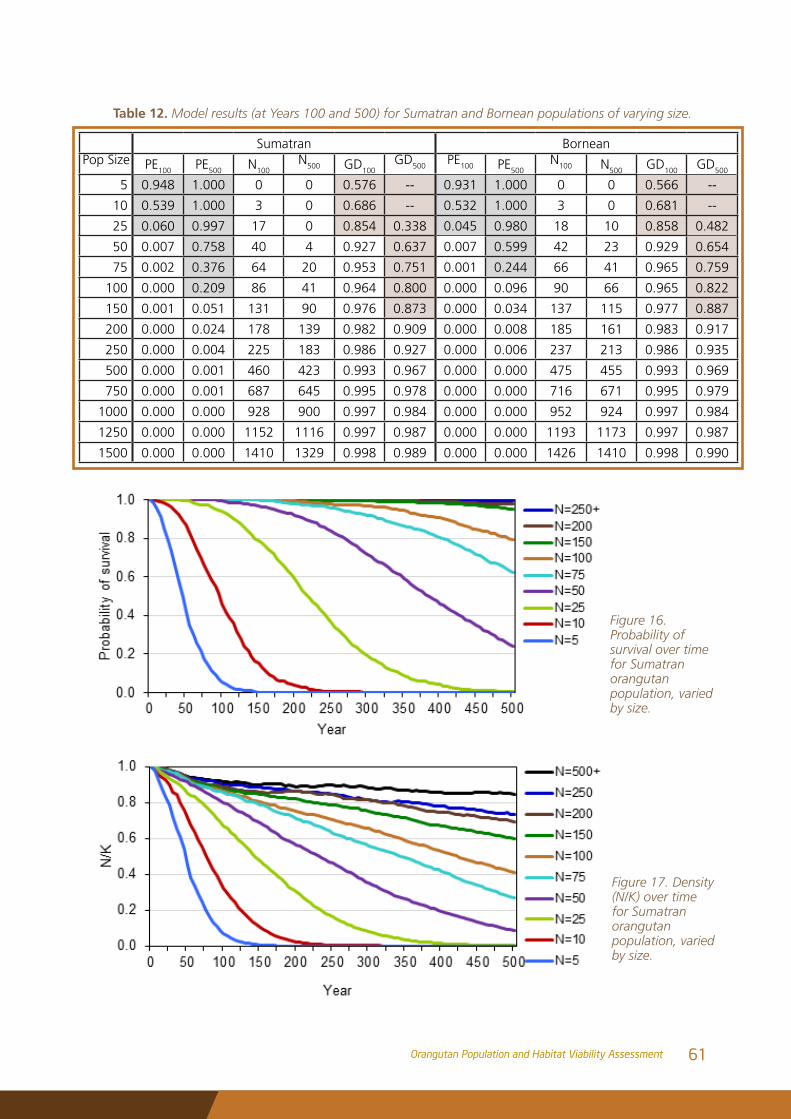
Table 12. Model results (at Years 100 and 500) for Sumatran and Bornean populations of varying size.
Sumatran BorneanPop Size PE100 PE500 N100
N500 GD100GD500 PE100 PE500
N100 N500 GD100 GD500
5 0.948 1.000 0 0 0.576 -- 0.931 1.000 0 0 0.566 --
10 0.539 1.000 3 0 0.686 -- 0.532 1.000 3 0 0.681 --
25 0.060 0.997 17 0 0.854 0.338 0.045 0.980 18 10 0.858 0.482
50 0.007 0.758 40 4 0.927 0.637 0.007 0.599 42 23 0.929 0.654
75 0.002 0.376 64 20 0.953 0.751 0.001 0.244 66 41 0.965 0.759
100 0.000 0.209 86 41 0.964 0.800 0.000 0.096 90 66 0.965 0.822
150 0.001 0.051 131 90 0.976 0.873 0.000 0.034 137 115 0.977 0.887
200 0.000 0.024 178 139 0.982 0.909 0.000 0.008 185 161 0.983 0.917
250 0.000 0.004 225 183 0.986 0.927 0.000 0.006 237 213 0.986 0.935
500 0.000 0.001 460 423 0.993 0.967 0.000 0.000 475 455 0.993 0.969
750 0.000 0.001 687 645 0.995 0.978 0.000 0.000 716 671 0.995 0.979
1000 0.000 0.000 928 900 0.997 0.984 0.000 0.000 952 924 0.997 0.984
1250 0.000 0.000 1152 1116 0.997 0.987 0.000 0.000 1193 1173 0.997 0.987
1500 0.000 0.000 1410 1329 0.998 0.989 0.000 0.000 1426 1410 0.998 0.990
Figure 16. Probability of survival over time for Sumatran orangutan population, varied by size.
Figure 17. Density (N/K) over time for Sumatran orangutan population, varied by size.
61Orangutan Population and Habitat Viability Assessment
MVP Under Alternative ConditionsInitial relatedness
Populations with diminished genetic variation
may have lower demographic rates due to
inbreeding depression, which can reduce
viability. If these populations are small, further
inbreeding will accumulate faster. Thus, small
inbred populations have a higher extinction
risk than small genetically diverse populations.
The result is that MVP may be higher for
inbred populations. A set of models was run
for populations of different sizes (N=K from
5 to 1500) and at different starting levels
of kinship between orangutans. Results in
Table 18 illustrate that MVP (based on PE as
defined by the PHVA participants) increases
to 200 for Sumatran orangutans and 150 for
Bornean orangutans for moderately inbred
populations. Larger populations are needed
to maintain at least 90% gene diversity and
relatively stable population size over time.
As with the MVP results presented above for
unrelated populations, these results assume
no additional loss of orangutans due to
removals (e.g., poaching) or habitat loss.
Loss of orangutans
Populations under threat that result in the
additional loss of orangutans beyond ‘normal’
mortality have reduced viability. Such losses
could be the result of poaching for trade,
conflict killing for crop raiding, death or
removal due to habitat loss, or any other threat
that results in the animal no longer being in
the population. Referring back to the model
input values, the maximum deterministic
growth rate (at relatively low density with
abundant resources) is 1.4% per year for
Sumatran and 1.6% for Bornean orangutans,
with slower growth rates for populations
near K. Observed growth will be slower yet
due to the effects of stochastic processes not
included in the deterministic rate. Therefore,
it is not possible for orangutan populations to
reproduce fast enough to overcome additional
annual loss of much more than 1%.
A set of models was run for populations of
different sizes (N=K from 5 to 1500) and at
different rates of annual loss of orangutans
(across all age and sex classes) of 0.5%,
0.75% and 1%. Results in Table 13 illustrate
that MVP (based on PE as defined by the
PHVA participants) increases significantly
with continued additional loss, for example,
to 750 for Sumatran orangutans and 400
for Bornean orangutans. While these MVPs
meet the PE criteria, they result in an average
population size in 500 years of 192 (26%
of K) and 155 (39% of K), respectively. It is
indicative of these populations’ inability to fully
recover from stochastic declines. These model
results assume initial unrelated populations;
the viability of inbred populations under
continuous threat may be lower.
62 Orangutan Population and Habitat Viability Assessment
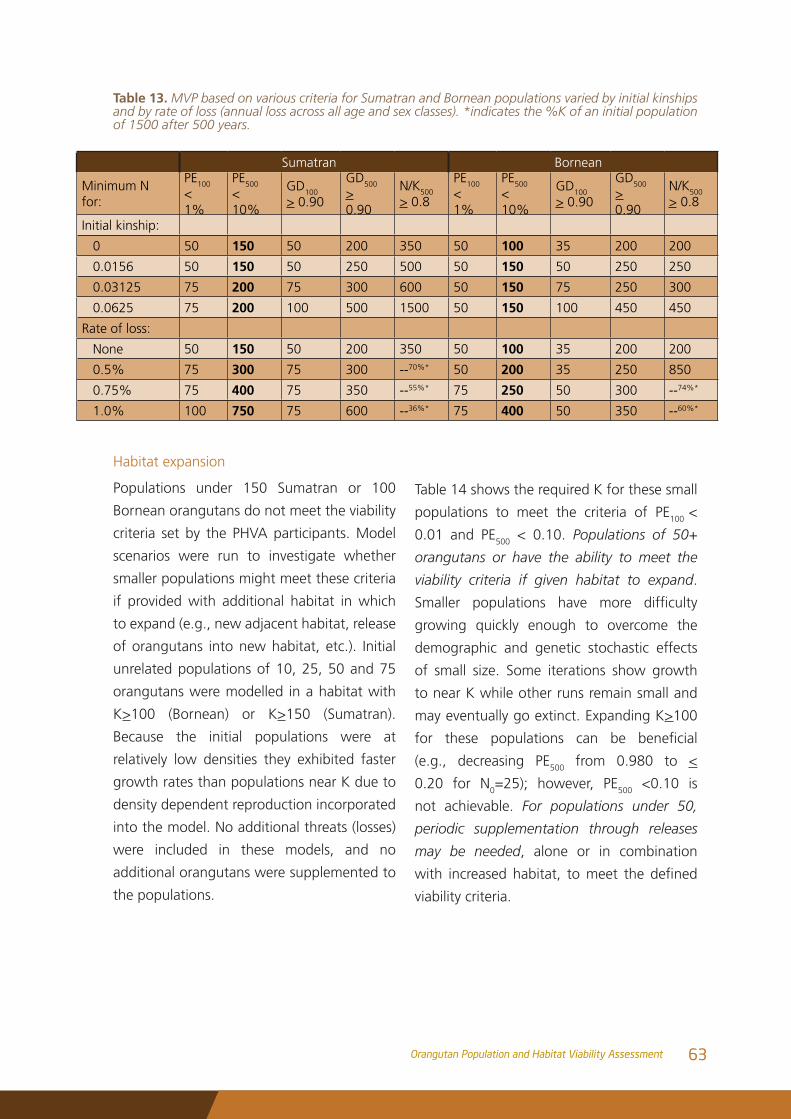
Table 13. MVP based on various criteria for Sumatran and Bornean populations varied by initial kinships and by rate of loss (annual loss across all age and sex classes). *indicates the %K of an initial population of 1500 after 500 years.
Sumatran Bornean
Minimum N for:
PE100 < 1%
PE500 < 10%
GD100 > 0.90
GD500 > 0.90
N/K500 > 0.8
PE100 < 1%
PE500 < 10%
GD100 > 0.90
GD500 > 0.90
N/K500 > 0.8
Initial kinship:
0 50 150 50 200 350 50 100 35 200 200
0.0156 50 150 50 250 500 50 150 50 250 250
0.03125 75 200 75 300 600 50 150 75 250 300
0.0625 75 200 100 500 1500 50 150 100 450 450
Rate of loss:
None 50 150 50 200 350 50 100 35 200 200
0.5% 75 300 75 300 --70%* 50 200 35 250 850
0.75% 75 400 75 350 --55%* 75 250 50 300 --74%*
1.0% 100 750 75 600 --36%* 75 400 50 350 --60%*
Habitat expansion
Populations under 150 Sumatran or 100
Bornean orangutans do not meet the viability
criteria set by the PHVA participants. Model
scenarios were run to investigate whether
smaller populations might meet these criteria
if provided with additional habitat in which
to expand (e.g., new adjacent habitat, release
of orangutans into new habitat, etc.). Initial
unrelated populations of 10, 25, 50 and 75
orangutans were modelled in a habitat with
K>100 (Bornean) or K>150 (Sumatran).
Because the initial populations were at
relatively low densities they exhibited faster
growth rates than populations near K due to
density dependent reproduction incorporated
into the model. No additional threats (losses)
were included in these models, and no
additional orangutans were supplemented to
the populations.
Table 14 shows the required K for these small
populations to meet the criteria of PE100 <
0.01 and PE500 < 0.10. Populations of 50+
orangutans or have the ability to meet the
viability criteria if given habitat to expand.
Smaller populations have more difficulty
growing quickly enough to overcome the
demographic and genetic stochastic effects
of small size. Some iterations show growth
to near K while other runs remain small and
may eventually go extinct. Expanding K>100
for these populations can be beneficial
(e.g., decreasing PE500 from 0.980 to <
0.20 for N0=25); however, PE500 <0.10 is
not achievable. For populations under 50,
periodic supplementation through releases
may be needed, alone or in combination
with increasedhabitat, tomeet the defined
viability criteria.
63Orangutan Population and Habitat Viability Assessment
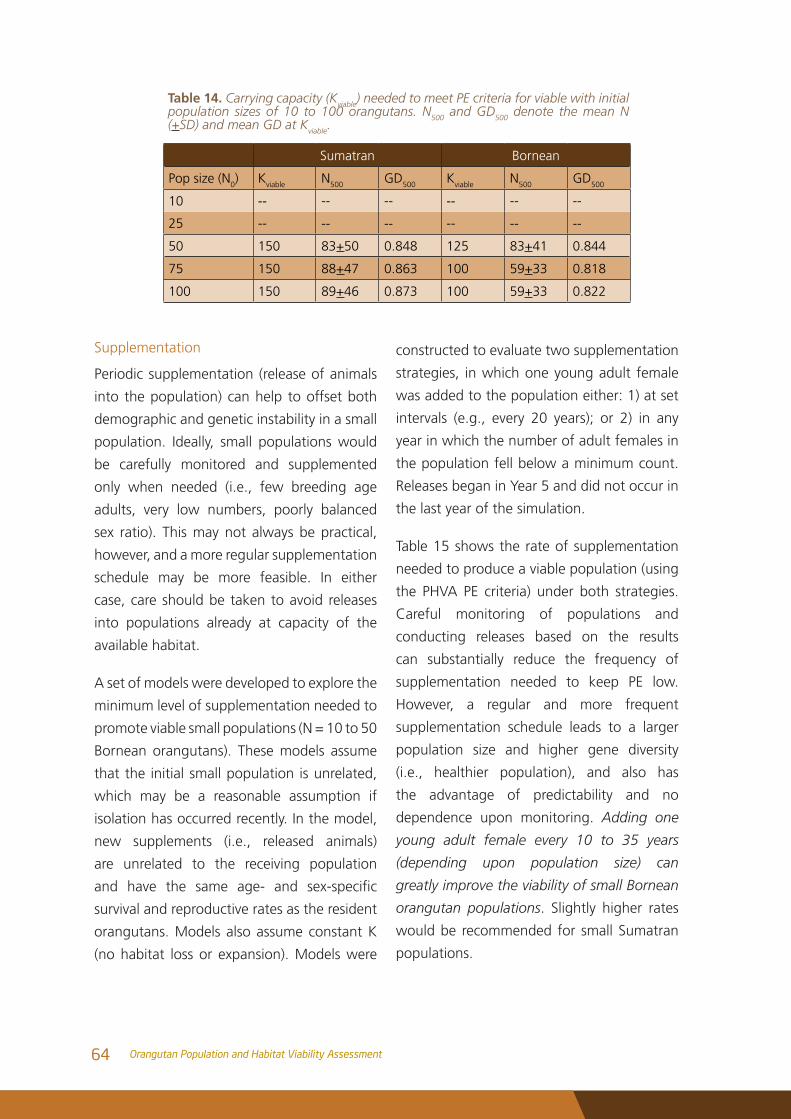
Table 14. Carrying capacity (Kviable) needed to meet PE criteria for viable with initial population sizes of 10 to 100 orangutans. N500 and GD500 denote the mean N (+SD) and mean GD at Kviable.
Sumatran Bornean
Pop size (N0) Kviable N500 GD500 Kviable N500 GD500
10 -- -- -- -- -- --
25 -- -- -- -- -- --
50 150 83+50 0.848 125 83+41 0.844
75 150 88+47 0.863 100 59+33 0.818
100 150 89+46 0.873 100 59+33 0.822
Supplementation
Periodic supplementation (release of animals
into the population) can help to offset both
demographic and genetic instability in a small
population. Ideally, small populations would
be carefully monitored and supplemented
only when needed (i.e., few breeding age
adults, very low numbers, poorly balanced
sex ratio). This may not always be practical,
however, and a more regular supplementation
schedule may be more feasible. In either
case, care should be taken to avoid releases
into populations already at capacity of the
available habitat.
A set of models were developed to explore the
minimum level of supplementation needed to
promote viable small populations (N = 10 to 50
Bornean orangutans). These models assume
that the initial small population is unrelated,
which may be a reasonable assumption if
isolation has occurred recently. In the model,
new supplements (i.e., released animals)
are unrelated to the receiving population
and have the same age- and sex-specific
survival and reproductive rates as the resident
orangutans. Models also assume constant K
(no habitat loss or expansion). Models were
constructed to evaluate two supplementation
strategies, in which one young adult female
was added to the population either: 1) at set
intervals (e.g., every 20 years); or 2) in any
year in which the number of adult females in
the population fell below a minimum count.
Releases began in Year 5 and did not occur in
the last year of the simulation.
Table 15 shows the rate of supplementation
needed to produce a viable population (using
the PHVA PE criteria) under both strategies.
Careful monitoring of populations and
conducting releases based on the results
can substantially reduce the frequency of
supplementation needed to keep PE low.
However, a regular and more frequent
supplementation schedule leads to a larger
population size and higher gene diversity
(i.e., healthier population), and also has
the advantage of predictability and no
dependence upon monitoring. Adding one
young adult female every 10 to 35 years
(depending upon population size) can
greatly improve the viability of small Bornean
orangutan populations. Slightly higher rates
would be recommended for small Sumatran
populations.
64 Orangutan Population and Habitat Viability Assessment
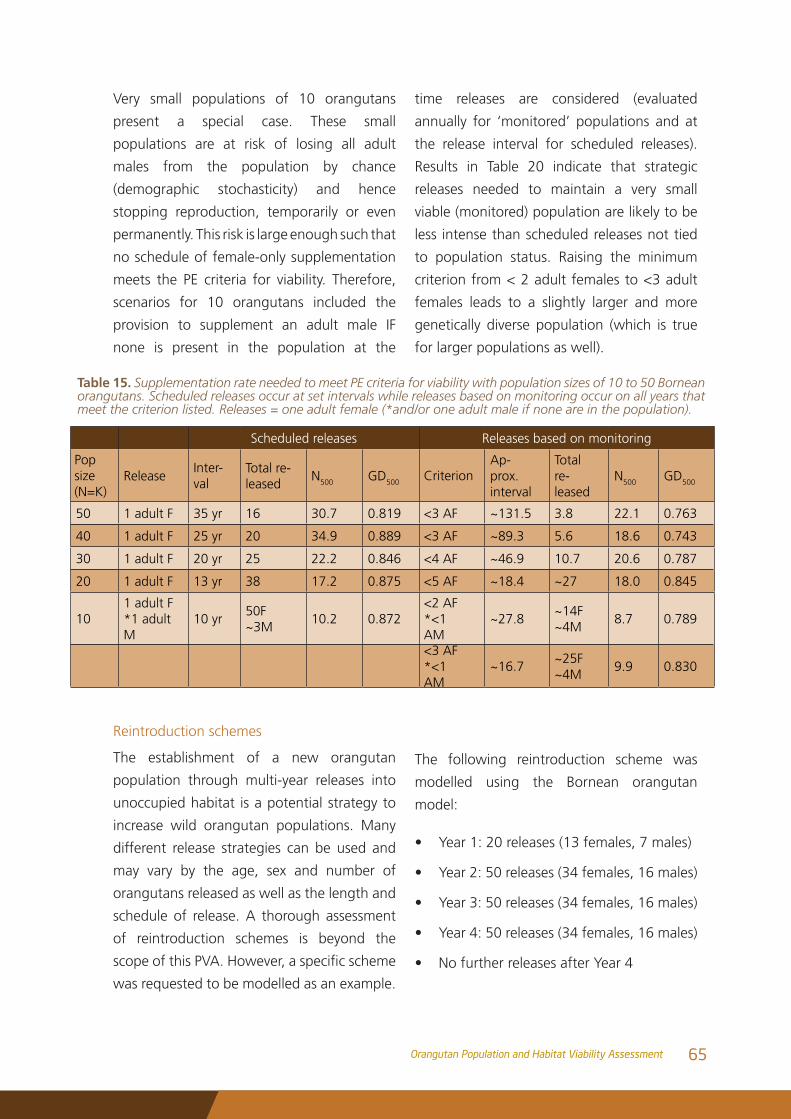
Very small populations of 10 orangutans
present a special case. These small
populations are at risk of losing all adult
males from the population by chance
(demographic stochasticity) and hence
stopping reproduction, temporarily or even
permanently. This risk is large enough such that
no schedule of female-only supplementation
meets the PE criteria for viability. Therefore,
scenarios for 10 orangutans included the
provision to supplement an adult male IF
none is present in the population at the
time releases are considered (evaluated
annually for ‘monitored’ populations and at
the release interval for scheduled releases).
Results in Table 20 indicate that strategic
releases needed to maintain a very small
viable (monitored) population are likely to be
less intense than scheduled releases not tied
to population status. Raising the minimum
criterion from < 2 adult females to <3 adult
females leads to a slightly larger and more
genetically diverse population (which is true
for larger populations as well).
Table 15. Supplementation rate needed to meet PE criteria for viability with population sizes of 10 to 50 Bornean orangutans. Scheduled releases occur at set intervals while releases based on monitoring occur on all years that meet the criterion listed. Releases = one adult female (*and/or one adult male if none are in the population).
Scheduled releases Releases based on monitoring
Pop size (N=K)
ReleaseInter-val
Total re-leased
N500 GD500Criterion
Ap-prox. interval
Total re-leased
N500 GD500
50 1 adult F 35 yr 16 30.7 0.819 <3 AF ~131.5 3.8 22.1 0.763
40 1 adult F 25 yr 20 34.9 0.889 <3 AF ~89.3 5.6 18.6 0.743
30 1 adult F 20 yr 25 22.2 0.846 <4 AF ~46.9 10.7 20.6 0.787
20 1 adult F 13 yr 38 17.2 0.875 <5 AF ~18.4 ~27 18.0 0.845
101 adult F*1 adult M
10 yr50F ~3M
10.2 0.872<2 AF*<1 AM
~27.8~14F~4M
8.7 0.789
<3 AF*<1 AM
~16.7~25F~4M
9.9 0.830
Reintroduction schemes
The establishment of a new orangutan
population through multi-year releases into
unoccupied habitat is a potential strategy to
increase wild orangutan populations. Many
different release strategies can be used and
may vary by the age, sex and number of
orangutans released as well as the length and
schedule of release. A thorough assessment
of reintroduction schemes is beyond the
scopeofthisPVA.However,aspecificscheme
was requested to be modelled as an example.
The following reintroduction scheme was
modelled using the Bornean orangutan
model:
• Year 1: 20 releases (13 females, 7 males)
• Year 2: 50 releases (34 females, 16 males)
• Year 3: 50 releases (34 females, 16 males)
• Year 4: 50 releases (34 females, 16 males)
• No further releases after Year 4
65Orangutan Population and Habitat Viability Assessment
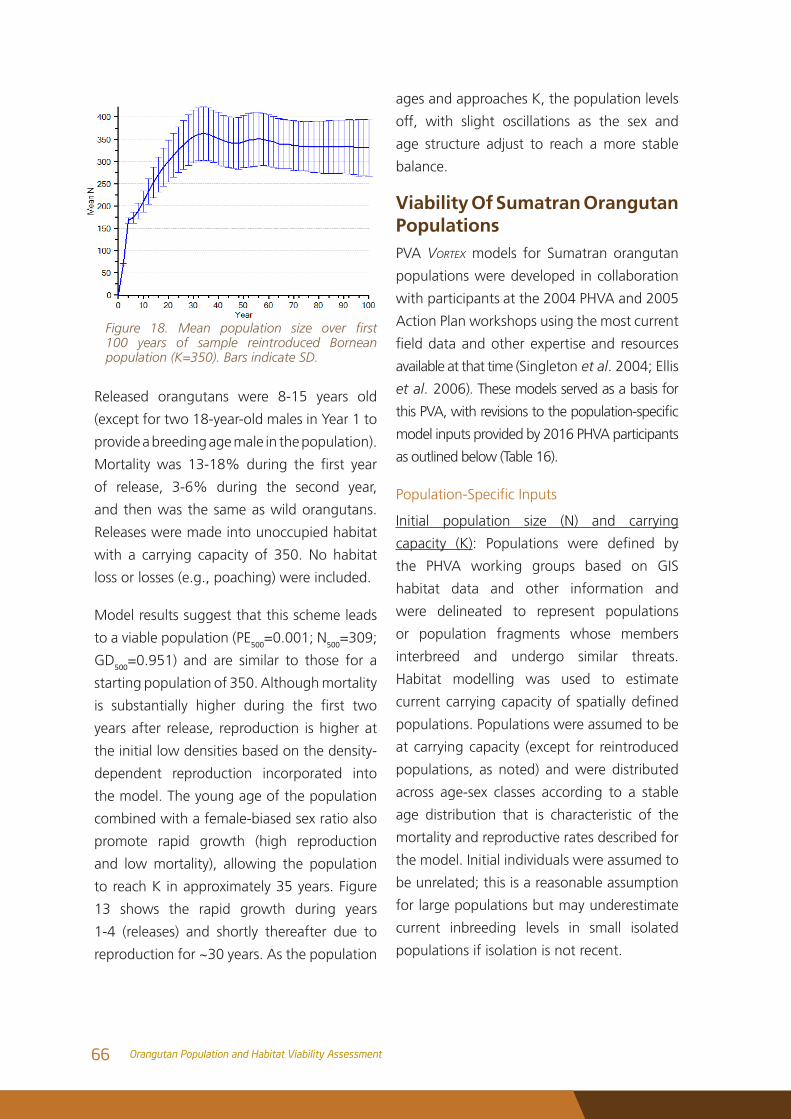
Released orangutans were 8-15 years old
(except for two 18-year-old males in Year 1 to
provide a breeding age male in the population).
Mortality was 13-18% during the first year
of release, 3-6% during the second year,
and then was the same as wild orangutans.
Releases were made into unoccupied habitat
with a carrying capacity of 350. No habitat
loss or losses (e.g., poaching) were included.
Model results suggest that this scheme leads
to a viable population (PE500=0.001; N500=309;
GD500=0.951) and are similar to those for a
starting population of 350. Although mortality
is substantially higher during the first two
years after release, reproduction is higher at
the initial low densities based on the density-
dependent reproduction incorporated into
the model. The young age of the population
combined with a female-biased sex ratio also
promote rapid growth (high reproduction
and low mortality), allowing the population
to reach K in approximately 35 years. Figure
13 shows the rapid growth during years
1-4 (releases) and shortly thereafter due to
reproduction for ~30 years. As the population
ages and approaches K, the population levels
off, with slight oscillations as the sex and
age structure adjust to reach a more stable
balance.
Viability Of Sumatran Orangutan PopulationsPVA Vortex models for Sumatran orangutan
populations were developed in collaboration
with participants at the 2004 PHVA and 2005
Action Plan workshops using the most current
fielddataandotherexpertiseand resources
available at that time (Singleton et al. 2004; Ellis
et al. 2006). These models served as a basis for
thisPVA,withrevisionstothepopulation-specific
model inputs provided by 2016 PHVA participants
as outlined below (Table 16).
Population-SpecificInputs
Initial population size (N) and carrying
capacity (K): Populations were defined by
the PHVA working groups based on GIS
habitat data and other information and
were delineated to represent populations
or population fragments whose members
interbreed and undergo similar threats.
Habitat modelling was used to estimate
currentcarryingcapacityof spatiallydefined
populations. Populations were assumed to be
at carrying capacity (except for reintroduced
populations, as noted) and were distributed
across age-sex classes according to a stable
age distribution that is characteristic of the
mortality and reproductive rates described for
the model. Initial individuals were assumed to
be unrelated; this is a reasonable assumption
for large populations but may underestimate
current inbreeding levels in small isolated
populations if isolation is not recent.
Figure 18. Mean population size over first 100 years of sample reintroduced Bornean population (K=350). Bars indicate SD.
66 Orangutan Population and Habitat Viability Assessment
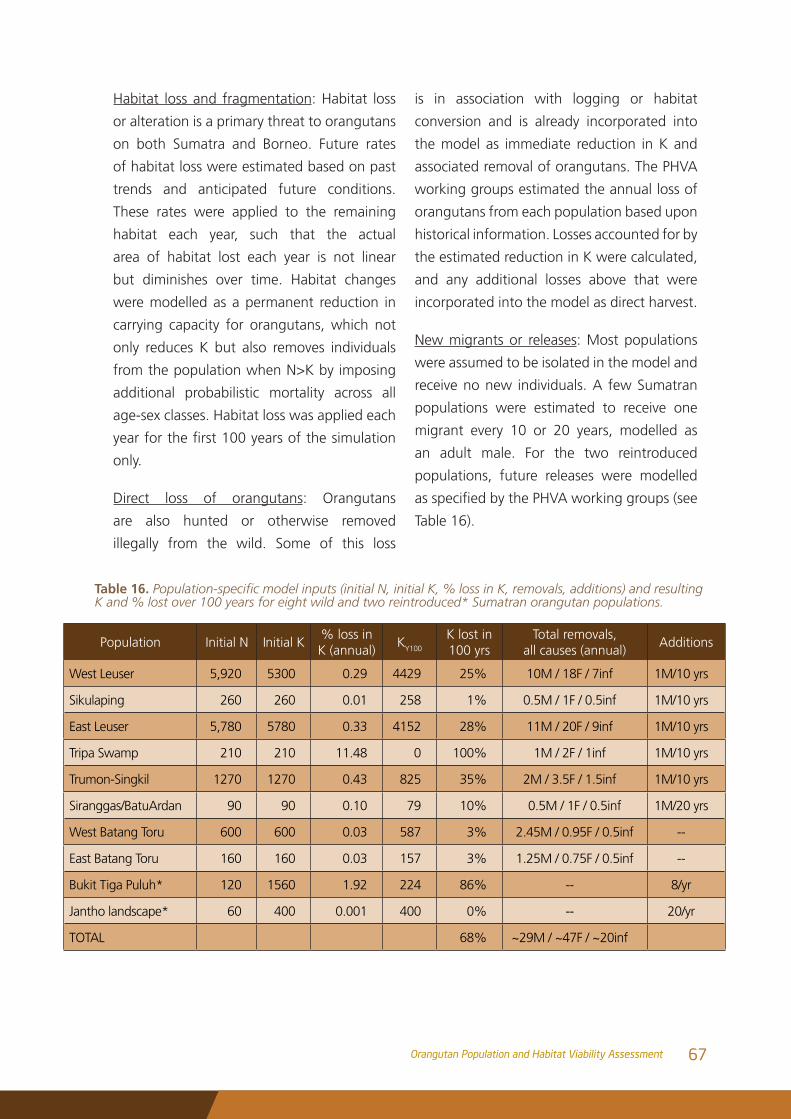
Habitat loss and fragmentation: Habitat loss
or alteration is a primary threat to orangutans
on both Sumatra and Borneo. Future rates
of habitat loss were estimated based on past
trends and anticipated future conditions.
These rates were applied to the remaining
habitat each year, such that the actual
area of habitat lost each year is not linear
but diminishes over time. Habitat changes
were modelled as a permanent reduction in
carrying capacity for orangutans, which not
only reduces K but also removes individuals
from the population when N>K by imposing
additional probabilistic mortality across all
age-sex classes. Habitat loss was applied each
yearforthefirst100yearsofthesimulation
only.
Direct loss of orangutans: Orangutans
are also hunted or otherwise removed
illegally from the wild. Some of this loss
is in association with logging or habitat
conversion and is already incorporated into
the model as immediate reduction in K and
associated removal of orangutans. The PHVA
working groups estimated the annual loss of
orangutans from each population based upon
historical information. Losses accounted for by
the estimated reduction in K were calculated,
and any additional losses above that were
incorporated into the model as direct harvest.
New migrants or releases: Most populations
were assumed to be isolated in the model and
receive no new individuals. A few Sumatran
populations were estimated to receive one
migrant every 10 or 20 years, modelled as
an adult male. For the two reintroduced
populations, future releases were modelled
asspecifiedbythePHVAworkinggroups(see
Table 16).
Table 16. Population-specific model inputs (initial N, initial K, % loss in K, removals, additions) and resulting K and % lost over 100 years for eight wild and two reintroduced* Sumatran orangutan populations.
Population Initial N Initial K% loss in K (annual)
KY100
K lost in 100 yrs
Total removals, all causes (annual)
Additions
West Leuser 5,920 5300 0.29 4429 25% 10M / 18F / 7inf 1M/10 yrs
Sikulaping 260 260 0.01 258 1% 0.5M / 1F / 0.5inf 1M/10 yrs
East Leuser 5,780 5780 0.33 4152 28% 11M / 20F / 9inf 1M/10 yrs
Tripa Swamp 210 210 11.48 0 100% 1M / 2F / 1inf 1M/10 yrs
Trumon-Singkil 1270 1270 0.43 825 35% 2M / 3.5F / 1.5inf 1M/10 yrs
Siranggas/BatuArdan 90 90 0.10 79 10% 0.5M / 1F / 0.5inf 1M/20 yrs
West Batang Toru 600 600 0.03 587 3% 2.45M / 0.95F / 0.5inf --
East Batang Toru 160 160 0.03 157 3% 1.25M / 0.75F / 0.5inf --
Bukit Tiga Puluh* 120 1560 1.92 224 86% -- 8/yr
Jantho landscape* 60 400 0.001 400 0% -- 20/yr
TOTAL 68% ~29M / ~47F / ~20inf
67Orangutan Population and Habitat Viability Assessment
Population ScenariosFive scenarios were run for each of the eight extant orangutan populations:
•Best Estimate: projected habitat loss and/or removals (habitat loss for 100 yrs; harvest for
500 yrs)
•HarvOnly: Additional removals only (i.e., those not due to habitat loss), for 500 yrs; no
habitat loss
•HarvOnly100Y: Additional removals only, for 100 yrs and then stopped; no habitat loss
•HabitatLossOnly: Habitat loss (i.e., loss of K) for 100 yrs; no additional removals
•NoLoss: No projected loss of habitat (K) and no removals (e.g., hunting)
Comparison of these scenarios provides
insight into the relative impacts of habitat
loss and direct removals as well as the ability
of the population to recover and persist if
these threats were to be removed. Graphs are
presented with results of mean population
sizeovertimeforallfivescenarios.Variation
around these means is quite large, but these
mean trends are informative in determining
the drivers of population size and persistence
under the rates tested.
For the two reintroduced populations (Bukit
Tiga Puluh and Jantho landscape), these
populations were supplemented with 8 (5
female, 3 male) or 20 (13 female, 7 male)
orangutans, respectively, per year (Table 16).
Animals were 9-15 years old at time of release,
andhadhighermortalityratesduringthefirst
year (13-18%) and second year (3-6%) after
release, then assumed ‘normal’ mortality risk.
These ages and mortality rates were based
upon those from the Reintroduction Scheme
discussed above. Releases started in Year 2 of
the model and were tested for 10, 20 or 50
years of releases.
West Leuser
Projected viability: Poor
PE100=0.008; PE500=1; N500=0; GD500=0
At projected rates of habitat loss and removals,
the West Leuser population is projected to
decline to extinction, with median time to
extinction = 235 years. Much of this decline
is driven by the estimated harvest. If harvest
is stopped, the population is able to recover
as long as it is not fragmented. If habitat
loss is not too severe or does not cause
fragmentation, the population may stabilize
around the new K. Eliminating all habitat loss
and other removals immediately results in a
large, genetically diversity population with
no risk of extinction in 500 years (PE100=0;
PE500=0; N500=5420; GD500=0.997).
68 Orangutan Population and Habitat Viability Assessment
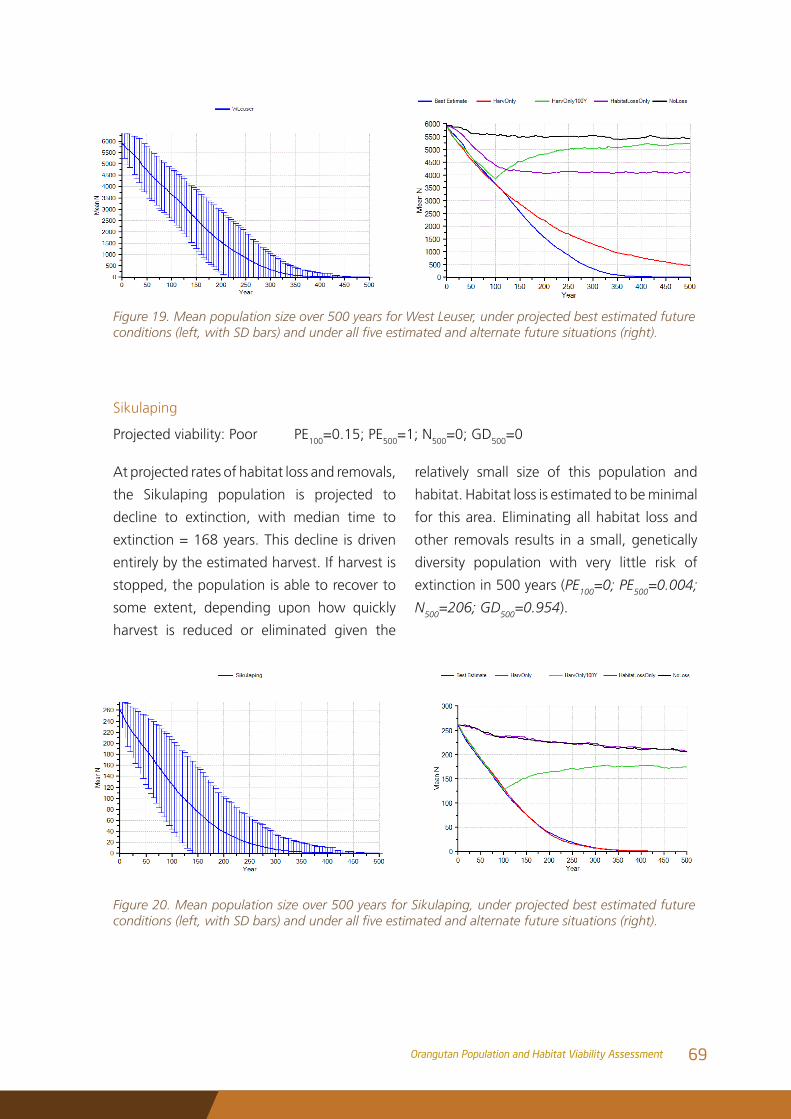
Sikulaping
Projected viability: Poor PE100=0.15; PE500=1; N500=0; GD500=0
Figure 20. Mean population size over 500 years for Sikulaping, under projected best estimated future conditions (left, with SD bars) and under all five estimated and alternate future situations (right).
Figure 19. Mean population size over 500 years for West Leuser, under projected best estimated future conditions (left, with SD bars) and under all five estimated and alternate future situations (right).
At projected rates of habitat loss and removals,
the Sikulaping population is projected to
decline to extinction, with median time to
extinction = 168 years. This decline is driven
entirely by the estimated harvest. If harvest is
stopped, the population is able to recover to
some extent, depending upon how quickly
harvest is reduced or eliminated given the
relatively small size of this population and
habitat. Habitat loss is estimated to be minimal
for this area. Eliminating all habitat loss and
other removals results in a small, genetically
diversity population with very little risk of
extinction in 500 years (PE100=0; PE500=0.004;
N500=206; GD500=0.954).
69Orangutan Population and Habitat Viability Assessment
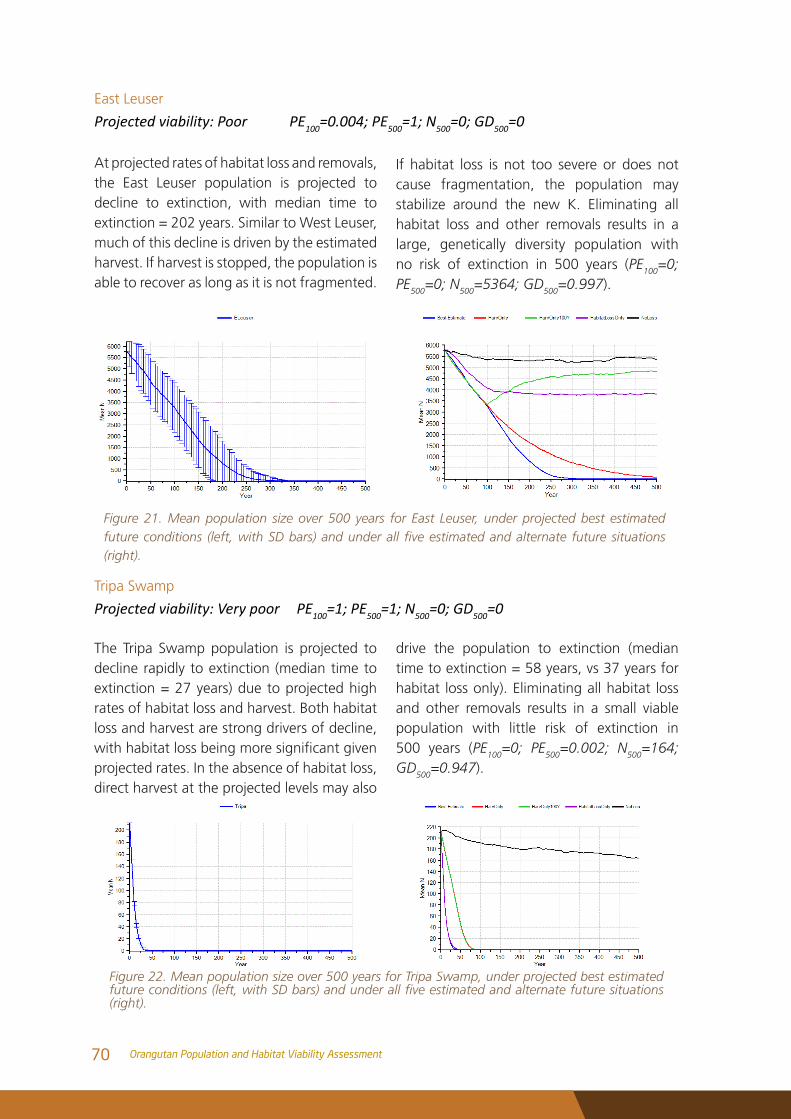
East Leuser
Projected viability: Poor PE100=0.004; PE500=1; N500=0; GD500=0
At projected rates of habitat loss and removals, the East Leuser population is projected to decline to extinction, with median time to extinction = 202 years. Similar to West Leuser, much of this decline is driven by the estimated harvest. If harvest is stopped, the population is able to recover as long as it is not fragmented.
If habitat loss is not too severe or does not cause fragmentation, the population may stabilize around the new K. Eliminating all habitat loss and other removals results in a large, genetically diversity population with no risk of extinction in 500 years (PE100=0; PE500=0; N500=5364; GD500=0.997).
Figure 22. Mean population size over 500 years for Tripa Swamp, under projected best estimated future conditions (left, with SD bars) and under all five estimated and alternate future situations (right).
Tripa Swamp
Projected viability: Very poor PE100=1; PE500=1; N500=0; GD500=0
The Tripa Swamp population is projected to decline rapidly to extinction (median time to extinction = 27 years) due to projected high rates of habitat loss and harvest. Both habitat loss and harvest are strong drivers of decline, withhabitatlossbeingmoresignificantgivenprojected rates. In the absence of habitat loss, direct harvest at the projected levels may also
drive the population to extinction (median time to extinction = 58 years, vs 37 years for habitat loss only). Eliminating all habitat loss and other removals results in a small viable population with little risk of extinction in 500 years (PE100=0; PE500=0.002; N500=164; GD500=0.947).
Figure 21. Mean population size over 500 years for East Leuser, under projected best estimated future conditions (left, with SD bars) and under all five estimated and alternate future situations (right).
70 Orangutan Population and Habitat Viability Assessment
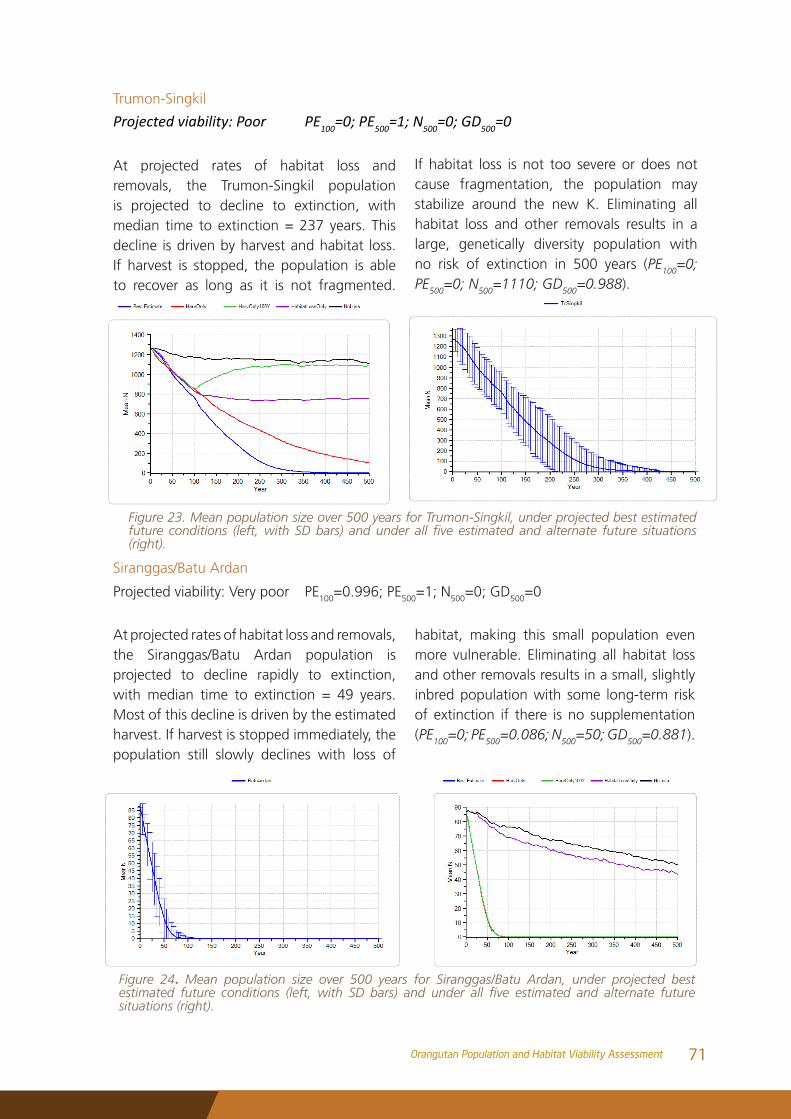
Trumon-Singkil
Projected viability: Poor PE100=0; PE500=1; N500=0; GD500=0
At projected rates of habitat loss and removals, the Trumon-Singkil population is projected to decline to extinction, with median time to extinction = 237 years. This decline is driven by harvest and habitat loss. If harvest is stopped, the population is able to recover as long as it is not fragmented.
If habitat loss is not too severe or does not cause fragmentation, the population may stabilize around the new K. Eliminating all habitat loss and other removals results in a large, genetically diversity population with no risk of extinction in 500 years (PE100=0; PE500=0; N500=1110; GD500=0.988).
Siranggas/Batu Ardan
Projected viability: Very poor PE100=0.996; PE500=1; N500=0; GD500=0
At projected rates of habitat loss and removals, the Siranggas/Batu Ardan population is projected to decline rapidly to extinction, with median time to extinction = 49 years. Most of this decline is driven by the estimated harvest. If harvest is stopped immediately, the population still slowly declines with loss of
habitat, making this small population even more vulnerable. Eliminating all habitat loss and other removals results in a small, slightly inbred population with some long-term risk of extinction if there is no supplementation (PE100=0; PE500=0.086; N500=50; GD500=0.881).
Figure 24. Mean population size over 500 years for Siranggas/Batu Ardan, under projected best estimated future conditions (left, with SD bars) and under all five estimated and alternate future situations (right).
Figure 23. Mean population size over 500 years for Trumon-Singkil, under projected best estimated future conditions (left, with SD bars) and under all five estimated and alternate future situations (right).
71Orangutan Population and Habitat Viability Assessment
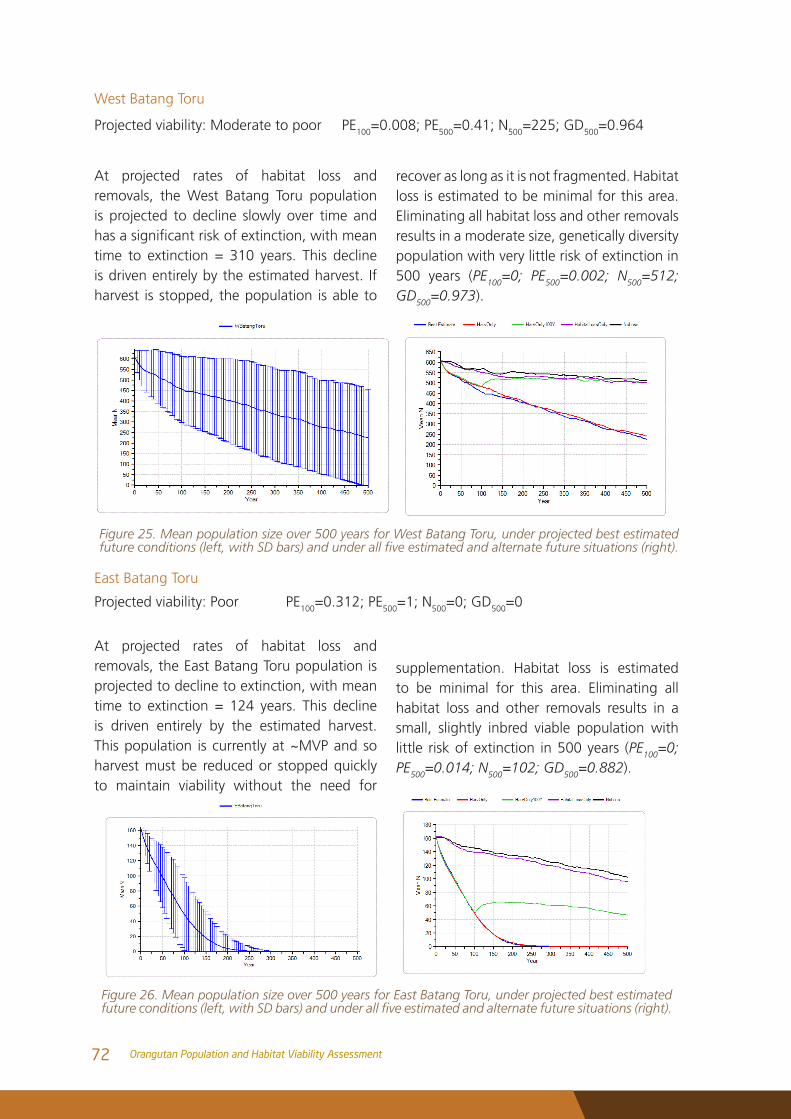
West Batang Toru
Projected viability: Moderate to poor PE100=0.008; PE500=0.41; N500=225; GD500=0.964
At projected rates of habitat loss and removals, the West Batang Toru population is projected to decline slowly over time and hasasignificantriskofextinction,withmeantime to extinction = 310 years. This decline is driven entirely by the estimated harvest. If harvest is stopped, the population is able to
recover as long as it is not fragmented. Habitat loss is estimated to be minimal for this area. Eliminating all habitat loss and other removals results in a moderate size, genetically diversity population with very little risk of extinction in 500 years (PE100=0; PE500=0.002; N500=512; GD500=0.973).
Figure 25. Mean population size over 500 years for West Batang Toru, under projected best estimated future conditions (left, with SD bars) and under all five estimated and alternate future situations (right).
East Batang Toru
Projected viability: Poor PE100=0.312; PE500=1; N500=0; GD500=0
At projected rates of habitat loss and removals, the East Batang Toru population is projected to decline to extinction, with mean time to extinction = 124 years. This decline is driven entirely by the estimated harvest. This population is currently at ~MVP and so harvest must be reduced or stopped quickly to maintain viability without the need for
supplementation. Habitat loss is estimated to be minimal for this area. Eliminating all habitat loss and other removals results in a small, slightly inbred viable population with little risk of extinction in 500 years (PE100=0; PE500=0.014; N500=102; GD500=0.882).
Figure 26. Mean population size over 500 years for East Batang Toru, under projected best estimated future conditions (left, with SD bars) and under all five estimated and alternate future situations (right).
72 Orangutan Population and Habitat Viability Assessment
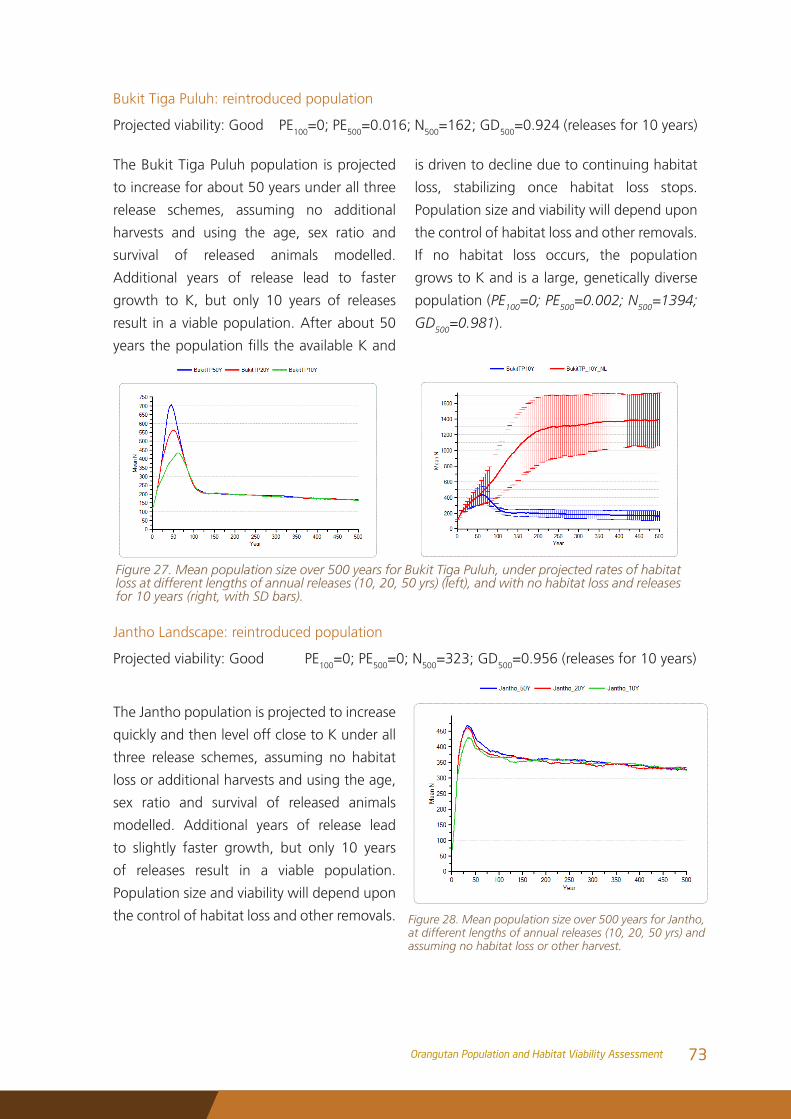
Bukit Tiga Puluh: reintroduced population
Projected viability: Good PE100=0; PE500=0.016; N500=162; GD500=0.924 (releases for 10 years)
The Bukit Tiga Puluh population is projected
to increase for about 50 years under all three
release schemes, assuming no additional
harvests and using the age, sex ratio and
survival of released animals modelled.
Additional years of release lead to faster
growth to K, but only 10 years of releases
result in a viable population. After about 50
yearsthepopulationfillstheavailableKand
Figure 27. Mean population size over 500 years for Bukit Tiga Puluh, under projected rates of habitat loss at different lengths of annual releases (10, 20, 50 yrs) (left), and with no habitat loss and releases for 10 years (right, with SD bars).
is driven to decline due to continuing habitat
loss, stabilizing once habitat loss stops.
Population size and viability will depend upon
the control of habitat loss and other removals.
If no habitat loss occurs, the population
grows to K and is a large, genetically diverse
population (PE100=0; PE500=0.002; N500=1394;
GD500=0.981).
Jantho Landscape: reintroduced population
Projected viability: Good PE100=0; PE500=0; N500=323; GD500=0.956 (releases for 10 years)
The Jantho population is projected to increase
quickly and then level off close to K under all
three release schemes, assuming no habitat
loss or additional harvests and using the age,
sex ratio and survival of released animals
modelled. Additional years of release lead
to slightly faster growth, but only 10 years
of releases result in a viable population.
Population size and viability will depend upon
the control of habitat loss and other removals. Figure 28. Mean population size over 500 years for Jantho, at different lengths of annual releases (10, 20, 50 yrs) and assuming no habitat loss or other harvest.
73Orangutan Population and Habitat Viability Assessment
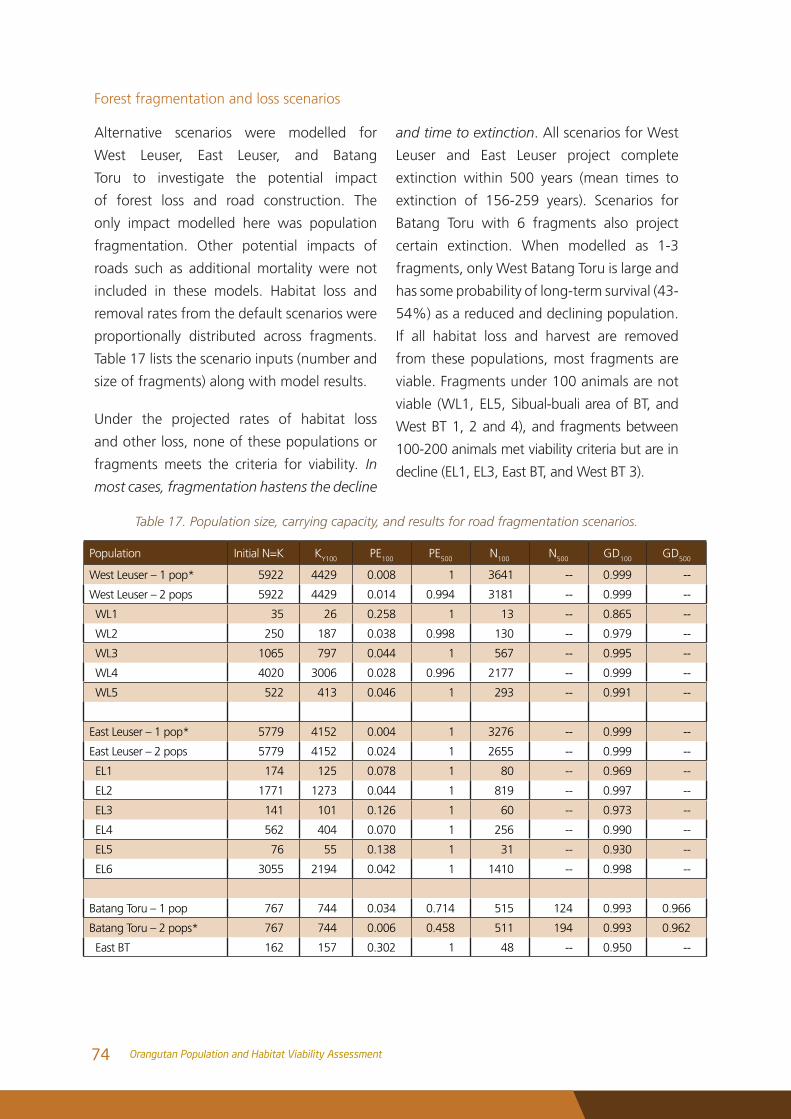
Forest fragmentation and loss scenarios
Alternative scenarios were modelled for
West Leuser, East Leuser, and Batang
Toru to investigate the potential impact
of forest loss and road construction. The
only impact modelled here was population
fragmentation. Other potential impacts of
roads such as additional mortality were not
included in these models. Habitat loss and
removal rates from the default scenarios were
proportionally distributed across fragments.
Table 17 lists the scenario inputs (number and
size of fragments) along with model results.
Under the projected rates of habitat loss
and other loss, none of these populations or
fragments meets the criteria for viability. In
most cases, fragmentation hastens the decline
and time to extinction. All scenarios for West
Leuser and East Leuser project complete
extinction within 500 years (mean times to
extinction of 156-259 years). Scenarios for
Batang Toru with 6 fragments also project
certain extinction. When modelled as 1-3
fragments, only West Batang Toru is large and
has some probability of long-term survival (43-
54%) as a reduced and declining population.
If all habitat loss and harvest are removed
from these populations, most fragments are
viable. Fragments under 100 animals are not
viable (WL1, EL5, Sibual-buali area of BT, and
West BT 1, 2 and 4), and fragments between
100-200 animals met viability criteria but are in
decline (EL1, EL3, East BT, and West BT 3).
Population Initial N=K KY100 PE100 PE500 N100 N500 GD100 GD500
West Leuser – 1 pop* 5922 4429 0.008 1 3641 -- 0.999 --
West Leuser – 2 pops 5922 4429 0.014 0.994 3181 -- 0.999 --
WL1 35 26 0.258 1 13 -- 0.865 --
WL2 250 187 0.038 0.998 130 -- 0.979 --
WL3 1065 797 0.044 1 567 -- 0.995 --
WL4 4020 3006 0.028 0.996 2177 -- 0.999 --
WL5 522 413 0.046 1 293 -- 0.991 --
East Leuser – 1 pop* 5779 4152 0.004 1 3276 -- 0.999 --
East Leuser – 2 pops 5779 4152 0.024 1 2655 -- 0.999 --
EL1 174 125 0.078 1 80 -- 0.969 --
EL2 1771 1273 0.044 1 819 -- 0.997 --
EL3 141 101 0.126 1 60 -- 0.973 --
EL4 562 404 0.070 1 256 -- 0.990 --
EL5 76 55 0.138 1 31 -- 0.930 --
EL6 3055 2194 0.042 1 1410 -- 0.998 --
Batang Toru – 1 pop 767 744 0.034 0.714 515 124 0.993 0.966
Batang Toru – 2 pops* 767 744 0.006 0.458 511 194 0.993 0.962
East BT 162 157 0.302 1 48 -- 0.950 --
Table 17. Population size, carrying capacity, and results for road fragmentation scenarios.
74 Orangutan Population and Habitat Viability Assessment
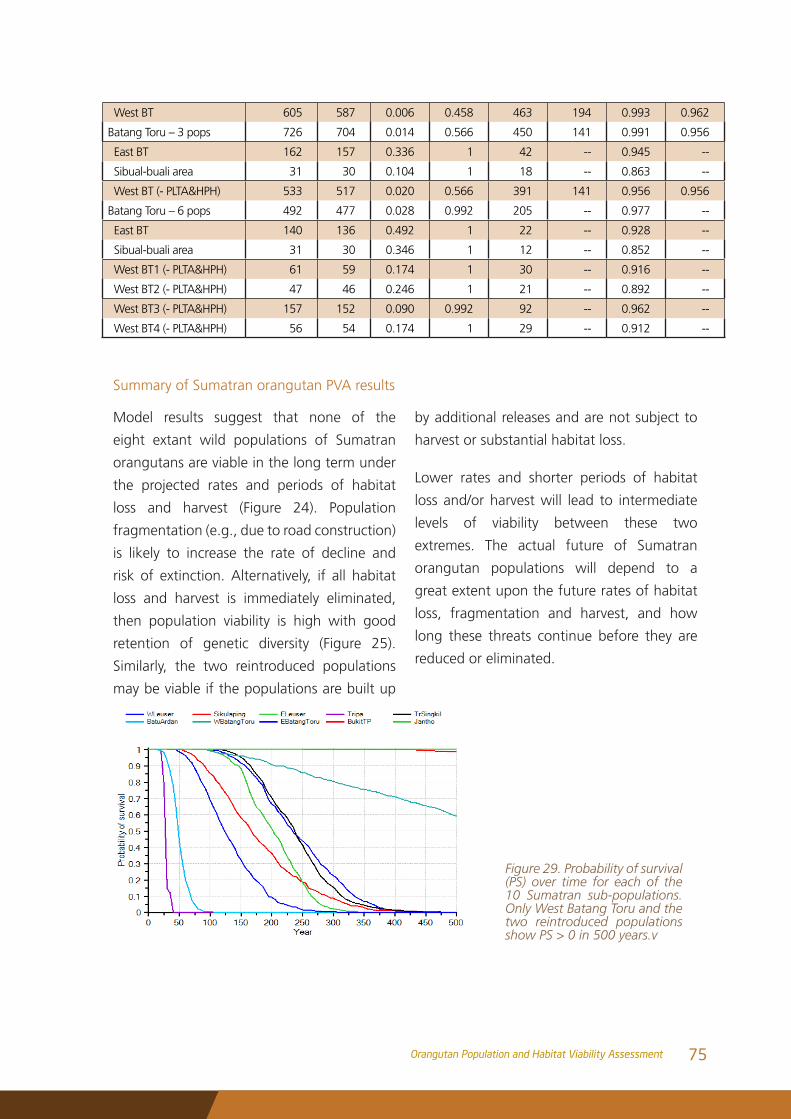
West BT 605 587 0.006 0.458 463 194 0.993 0.962
Batang Toru – 3 pops 726 704 0.014 0.566 450 141 0.991 0.956
East BT 162 157 0.336 1 42 -- 0.945 --
Sibual-buali area 31 30 0.104 1 18 -- 0.863 --
West BT (- PLTA&HPH) 533 517 0.020 0.566 391 141 0.956 0.956
Batang Toru – 6 pops 492 477 0.028 0.992 205 -- 0.977 --
East BT 140 136 0.492 1 22 -- 0.928 --
Sibual-buali area 31 30 0.346 1 12 -- 0.852 --
West BT1 (- PLTA&HPH) 61 59 0.174 1 30 -- 0.916 --
West BT2 (- PLTA&HPH) 47 46 0.246 1 21 -- 0.892 --
West BT3 (- PLTA&HPH) 157 152 0.090 0.992 92 -- 0.962 --
West BT4 (- PLTA&HPH) 56 54 0.174 1 29 -- 0.912 --
Summary of Sumatran orangutan PVA results
Model results suggest that none of the
eight extant wild populations of Sumatran
orangutans are viable in the long term under
the projected rates and periods of habitat
loss and harvest (Figure 24). Population
fragmentation (e.g., due to road construction)
is likely to increase the rate of decline and
risk of extinction. Alternatively, if all habitat
loss and harvest is immediately eliminated,
then population viability is high with good
retention of genetic diversity (Figure 25).
Similarly, the two reintroduced populations
may be viable if the populations are built up
by additional releases and are not subject to
harvest or substantial habitat loss.
Lower rates and shorter periods of habitat
loss and/or harvest will lead to intermediate
levels of viability between these two
extremes. The actual future of Sumatran
orangutan populations will depend to a
great extent upon the future rates of habitat
loss, fragmentation and harvest, and how
long these threats continue before they are
reduced or eliminated.
Figure 29. Probability of survival (PS) over time for each of the 10 Sumatran sub-populations. Only West Batang Toru and the two reintroduced populations show PS > 0 in 500 years.v
75Orangutan Population and Habitat Viability Assessment
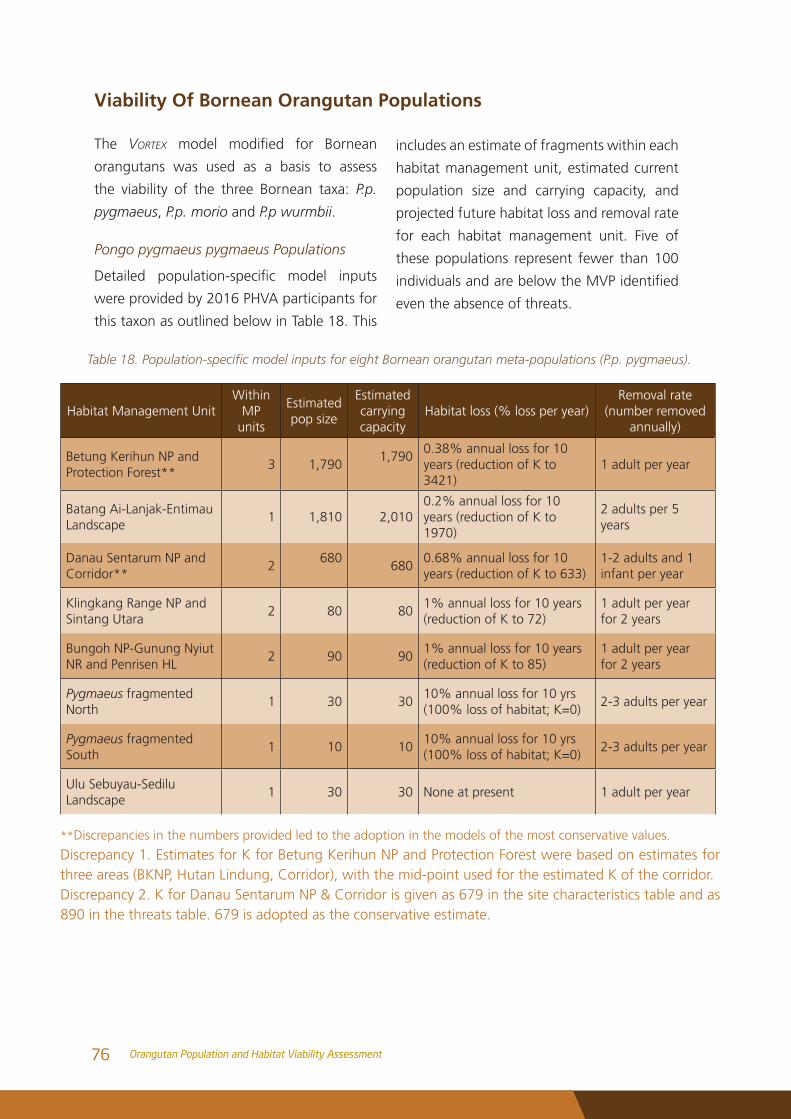
Viability Of Bornean Orangutan Populations
The Vortex model modified for Bornean
orangutans was used as a basis to assess
the viability of the three Bornean taxa: P.p.
pygmaeus, P.p. morio and P.p wurmbii.
Pongo pygmaeus pygmaeus Populations
Detailed population-specific model inputs
were provided by 2016 PHVA participants for
this taxon as outlined below in Table 18. This
Table 18. Population-specific model inputs for eight Bornean orangutan meta-populations (P.p. pygmaeus).
Habitat Management UnitWithin
MP units
Estimated pop size
Estimated carrying capacity
Habitat loss (% loss per year)Removal rate
(number removed annually)
Betung Kerihun NP and Protection Forest**
3 1,7901,790
0.38% annual loss for 10 years (reduction of K to 3421)
1 adult per year
Batang Ai-Lanjak-Entimau Landscape
1 1,810 2,010 0.2% annual loss for 10 years (reduction of K to 1970)
2 adults per 5 years
Danau Sentarum NP and Corridor**
2680
680
0.68% annual loss for 10 years (reduction of K to 633)
1-2 adults and 1 infant per year
Klingkang Range NP and Sintang Utara
2 80 801% annual loss for 10 years (reduction of K to 72)
1 adult per year for 2 years
Bungoh NP-Gunung Nyiut NR and Penrisen HL
2 90 901% annual loss for 10 years (reduction of K to 85)
1 adult per year for 2 years
Pygmaeus fragmented North
1 30 3010% annual loss for 10 yrs (100% loss of habitat; K=0)
2-3 adults per year
Pygmaeus fragmented South
1 10 1010% annual loss for 10 yrs (100% loss of habitat; K=0)
2-3 adults per year
Ulu Sebuyau-Sedilu Landscape
1 30 30 None at present 1 adult per year
includes an estimate of fragments within each
habitat management unit, estimated current
population size and carrying capacity, and
projected future habitat loss and removal rate
for each habitat management unit. Five of
these populations represent fewer than 100
individualsandarebelowtheMVPidentified
even the absence of threats.
**Discrepancies in the numbers provided led to the adoption in the models of the most conservative values.
Discrepancy 1. Estimates for K for Betung Kerihun NP and Protection Forest were based on estimates for three areas (BKNP, Hutan Lindung, Corridor), with the mid-point used for the estimated K of the corridor.Discrepancy 2. K for Danau Sentarum NP & Corridor is given as 679 in the site characteristics table and as 890 in the threats table. 679 is adopted as the conservative estimate.
76 Orangutan Population and Habitat Viability Assessment
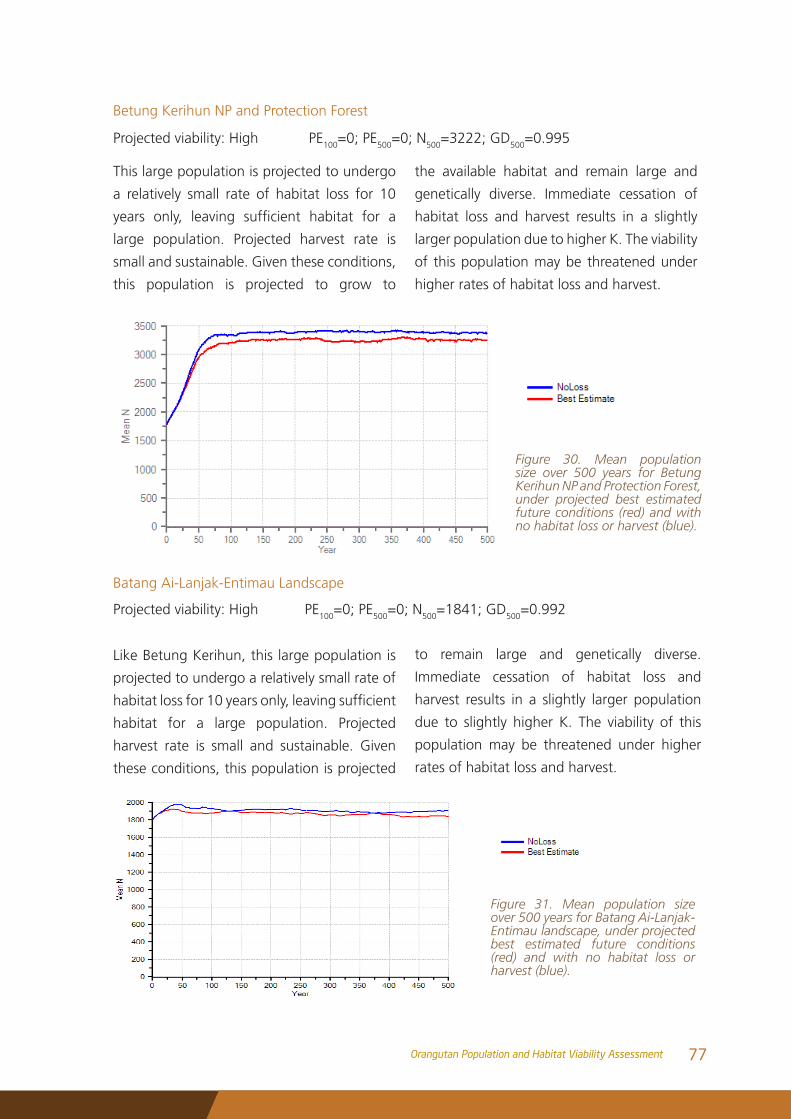
Betung Kerihun NP and Protection Forest
This large population is projected to undergo
a relatively small rate of habitat loss for 10
years only, leaving sufficient habitat for a
large population. Projected harvest rate is
small and sustainable. Given these conditions,
this population is projected to grow to
Projected viability: High PE100=0; PE500=0; N500=3222; GD500=0.995
Figure 30. Mean population size over 500 years for Betung Kerihun NP and Protection Forest, under projected best estimated future conditions (red) and with no habitat loss or harvest (blue).
the available habitat and remain large and
genetically diverse. Immediate cessation of
habitat loss and harvest results in a slightly
larger population due to higher K. The viability
of this population may be threatened under
higher rates of habitat loss and harvest.
Batang Ai-Lanjak-Entimau Landscape
Projected viability: High PE100=0; PE500=0; N500=1841; GD500=0.992
Like Betung Kerihun, this large population is
projected to undergo a relatively small rate of
habitatlossfor10yearsonly,leavingsufficient
habitat for a large population. Projected
harvest rate is small and sustainable. Given
these conditions, this population is projected
to remain large and genetically diverse.
Immediate cessation of habitat loss and
harvest results in a slightly larger population
due to slightly higher K. The viability of this
population may be threatened under higher
rates of habitat loss and harvest.
Figure 31. Mean population size over 500 years for Batang Ai-Lanjak-Entimau landscape, under projected best estimated future conditions (red) and with no habitat loss or harvest (blue).
77Orangutan Population and Habitat Viability Assessment
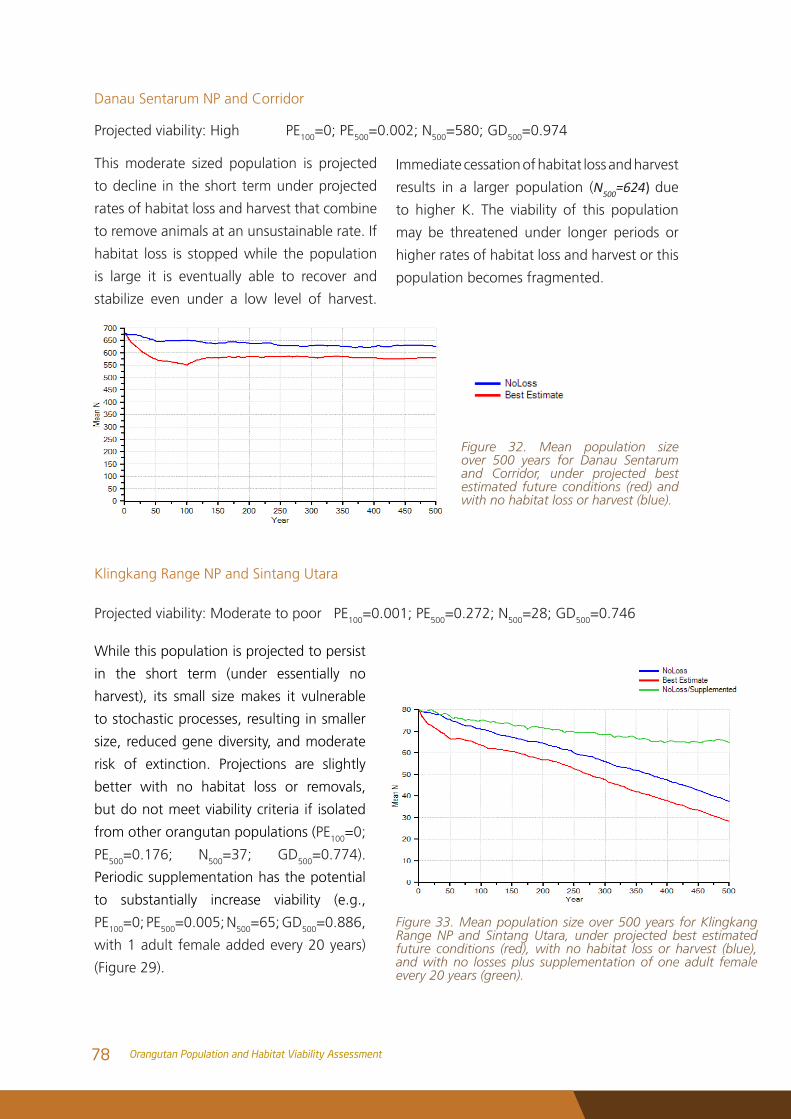
Danau Sentarum NP and Corridor
Projected viability: High PE100=0; PE500=0.002; N500=580; GD500=0.974
Figure 32. Mean population size over 500 years for Danau Sentarum and Corridor, under projected best estimated future conditions (red) and with no habitat loss or harvest (blue).
Figure 33. Mean population size over 500 years for Klingkang Range NP and Sintang Utara, under projected best estimated future conditions (red), with no habitat loss or harvest (blue), and with no losses plus supplementation of one adult female every 20 years (green).
This moderate sized population is projected
to decline in the short term under projected
rates of habitat loss and harvest that combine
to remove animals at an unsustainable rate. If
habitat loss is stopped while the population
is large it is eventually able to recover and
stabilize even under a low level of harvest.
Immediate cessation of habitat loss and harvest
results in a larger population (N500=624) due
to higher K. The viability of this population
may be threatened under longer periods or
higher rates of habitat loss and harvest or this
population becomes fragmented.
Klingkang Range NP and Sintang Utara
Projected viability: Moderate to poor PE100=0.001; PE500=0.272; N500=28; GD500=0.746
While this population is projected to persist
in the short term (under essentially no
harvest), its small size makes it vulnerable
to stochastic processes, resulting in smaller
size, reduced gene diversity, and moderate
risk of extinction. Projections are slightly
better with no habitat loss or removals,
but do not meet viability criteria if isolated
from other orangutan populations (PE100=0;
PE500=0.176; N500=37; GD500=0.774).
Periodic supplementation has the potential
to substantially increase viability (e.g.,
PE100=0; PE500=0.005; N500=65; GD500=0.886,
with 1 adult female added every 20 years)
(Figure 29).
78 Orangutan Population and Habitat Viability Assessment
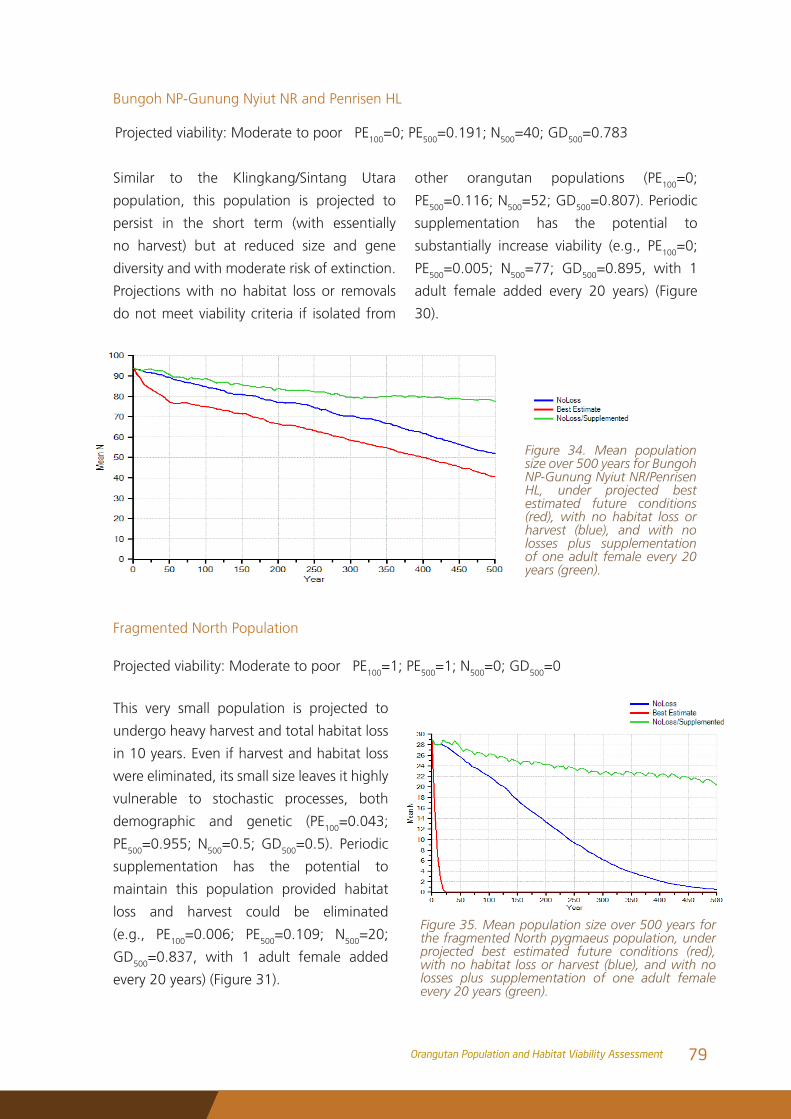
Bungoh NP-Gunung Nyiut NR and Penrisen HL
Figure 34. Mean population size over 500 years for Bungoh NP-Gunung Nyiut NR/Penrisen HL, under projected best estimated future conditions (red), with no habitat loss or harvest (blue), and with no losses plus supplementation of one adult female every 20 years (green).
Projected viability: Moderate to poor PE100=0; PE500=0.191; N500=40; GD500=0.783
Similar to the Klingkang/Sintang Utara
population, this population is projected to
persist in the short term (with essentially
no harvest) but at reduced size and gene
diversity and with moderate risk of extinction.
Projections with no habitat loss or removals
do not meet viability criteria if isolated from
other orangutan populations (PE100=0;
PE500=0.116; N500=52; GD500=0.807). Periodic
supplementation has the potential to
substantially increase viability (e.g., PE100=0;
PE500=0.005; N500=77; GD500=0.895, with 1
adult female added every 20 years) (Figure
30).
Fragmented North Population
Projected viability: Moderate to poor PE100=1; PE500=1; N500=0; GD500=0
This very small population is projected to
undergo heavy harvest and total habitat loss
in 10 years. Even if harvest and habitat loss
were eliminated, its small size leaves it highly
vulnerable to stochastic processes, both
demographic and genetic (PE100=0.043;
PE500=0.955; N500=0.5; GD500=0.5). Periodic
supplementation has the potential to
maintain this population provided habitat
loss and harvest could be eliminated
(e.g., PE100=0.006; PE500=0.109; N500=20;
GD500=0.837, with 1 adult female added
every 20 years) (Figure 31).
Figure 35. Mean population size over 500 years for the fragmented North pygmaeus population, under projected best estimated future conditions (red), with no habitat loss or harvest (blue), and with no losses plus supplementation of one adult female every 20 years (green).
79Orangutan Population and Habitat Viability Assessment
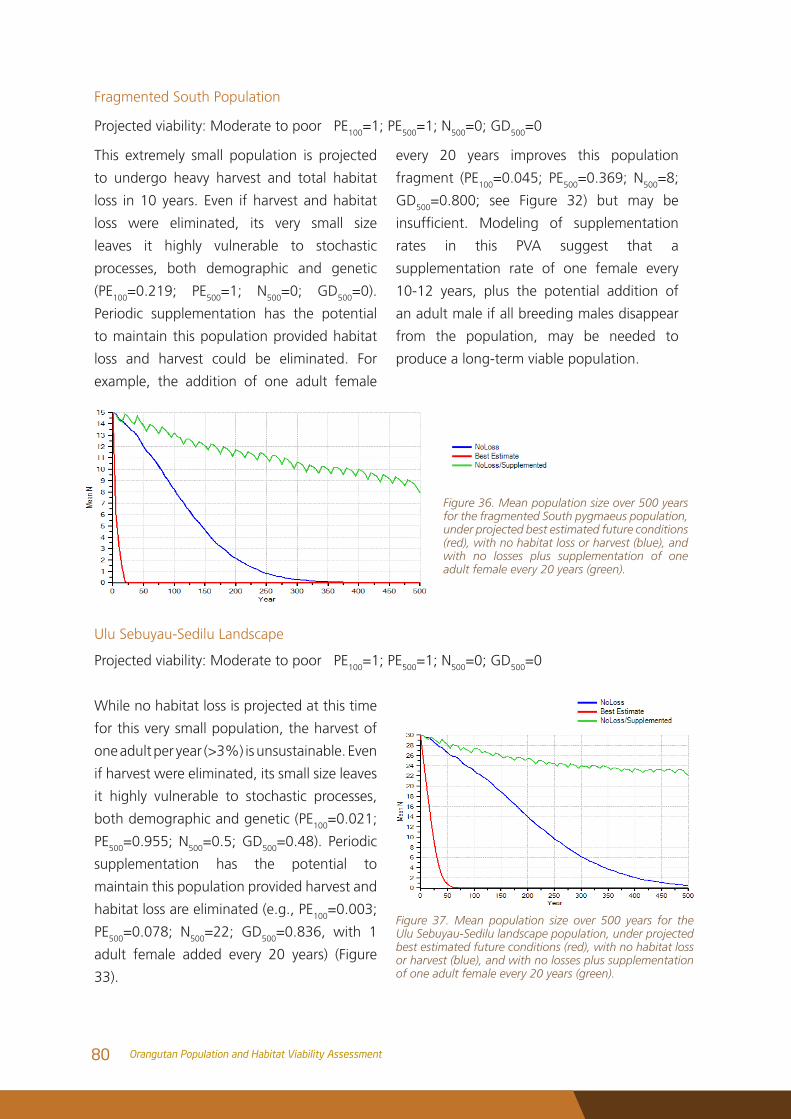
Fragmented South Population
Projected viability: Moderate to poor PE100=1; PE500=1; N500=0; GD500=0
Figure 36. Mean population size over 500 years for the fragmented South pygmaeus population, under projected best estimated future conditions (red), with no habitat loss or harvest (blue), and with no losses plus supplementation of one adult female every 20 years (green).
This extremely small population is projected
to undergo heavy harvest and total habitat
loss in 10 years. Even if harvest and habitat
loss were eliminated, its very small size
leaves it highly vulnerable to stochastic
processes, both demographic and genetic
(PE100=0.219; PE500=1; N500=0; GD500=0).
Periodic supplementation has the potential
to maintain this population provided habitat
loss and harvest could be eliminated. For
example, the addition of one adult female
every 20 years improves this population
fragment (PE100=0.045; PE500=0.369; N500=8;
GD500=0.800; see Figure 32) but may be
insufficient. Modeling of supplementation
rates in this PVA suggest that a
supplementation rate of one female every
10-12 years, plus the potential addition of
an adult male if all breeding males disappear
from the population, may be needed to
produce a long-term viable population.
Ulu Sebuyau-Sedilu Landscape
Projected viability: Moderate to poor PE100=1; PE500=1; N500=0; GD500=0
While no habitat loss is projected at this time
for this very small population, the harvest of
one adult per year (>3%) is unsustainable. Even
if harvest were eliminated, its small size leaves
it highly vulnerable to stochastic processes,
both demographic and genetic (PE100=0.021;
PE500=0.955; N500=0.5; GD500=0.48). Periodic
supplementation has the potential to
maintain this population provided harvest and
habitat loss are eliminated (e.g., PE100=0.003;
PE500=0.078; N500=22; GD500=0.836, with 1
adult female added every 20 years) (Figure
33).
Figure 37. Mean population size over 500 years for the Ulu Sebuyau-Sedilu landscape population, under projected best estimated future conditions (red), with no habitat loss or harvest (blue), and with no losses plus supplementation of one adult female every 20 years (green).
80 Orangutan Population and Habitat Viability Assessment
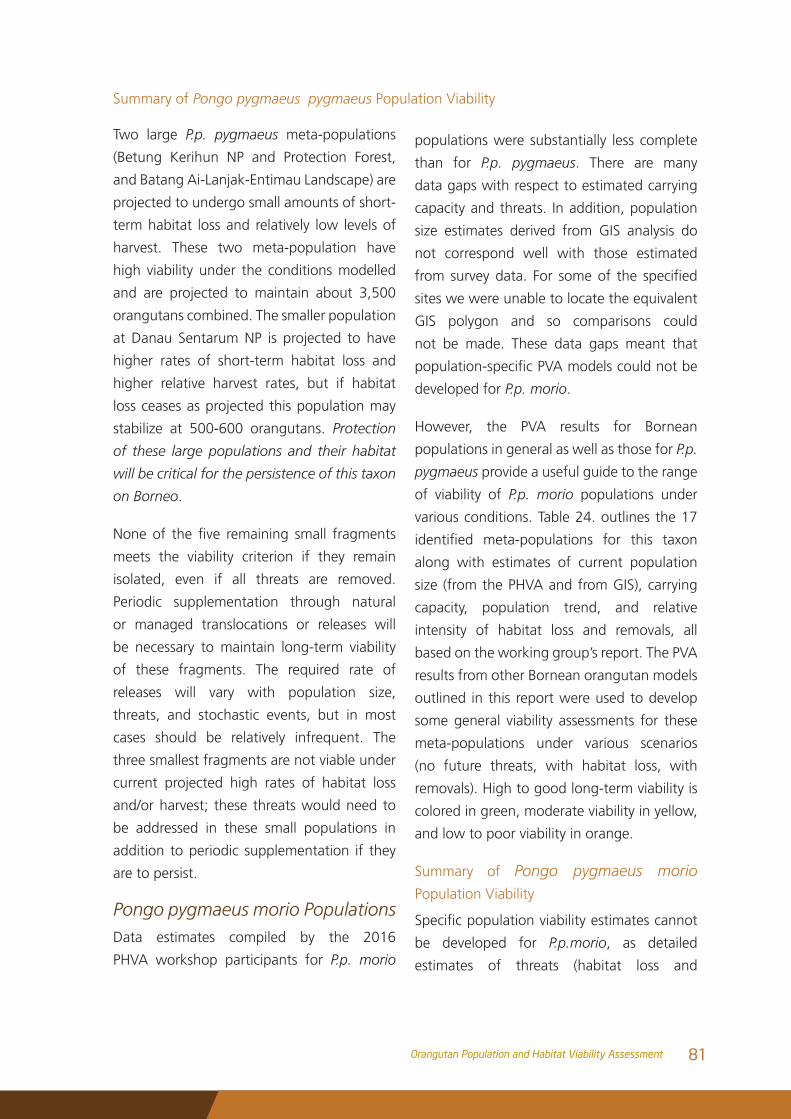
Summary of Pongo pygmaeus pygmaeus Population Viability
Two large P.p. pygmaeus meta-populations
(Betung Kerihun NP and Protection Forest,
and Batang Ai-Lanjak-Entimau Landscape) are
projected to undergo small amounts of short-
term habitat loss and relatively low levels of
harvest. These two meta-population have
high viability under the conditions modelled
and are projected to maintain about 3,500
orangutans combined. The smaller population
at Danau Sentarum NP is projected to have
higher rates of short-term habitat loss and
higher relative harvest rates, but if habitat
loss ceases as projected this population may
stabilize at 500-600 orangutans. Protection
of these large populations and their habitat
will be critical for the persistence of this taxon
on Borneo.
Noneof the five remaining small fragments
meets the viability criterion if they remain
isolated, even if all threats are removed.
Periodic supplementation through natural
or managed translocations or releases will
be necessary to maintain long-term viability
of these fragments. The required rate of
releases will vary with population size,
threats, and stochastic events, but in most
cases should be relatively infrequent. The
three smallest fragments are not viable under
current projected high rates of habitat loss
and/or harvest; these threats would need to
be addressed in these small populations in
addition to periodic supplementation if they
are to persist.
Pongo pygmaeus morio PopulationsData estimates compiled by the 2016
PHVA workshop participants for P.p. morio
populations were substantially less complete
than for P.p. pygmaeus. There are many
data gaps with respect to estimated carrying
capacity and threats. In addition, population
size estimates derived from GIS analysis do
not correspond well with those estimated
from surveydata. For someof the specified
sites we were unable to locate the equivalent
GIS polygon and so comparisons could
not be made. These data gaps meant that
population-specificPVAmodelscouldnotbe
developed for P.p. morio.
However, the PVA results for Bornean
populations in general as well as those for P.p.
pygmaeus provide a useful guide to the range
of viability of P.p. morio populations under
various conditions. Table 24. outlines the 17
identified meta-populations for this taxon
along with estimates of current population
size (from the PHVA and from GIS), carrying
capacity, population trend, and relative
intensity of habitat loss and removals, all
based on the working group’s report. The PVA
results from other Bornean orangutan models
outlined in this report were used to develop
some general viability assessments for these
meta-populations under various scenarios
(no future threats, with habitat loss, with
removals). High to good long-term viability is
colored in green, moderate viability in yellow,
and low to poor viability in orange.
Summary of Pongo pygmaeus morio
Population Viability
Specificpopulationviabilityestimatescannot
be developed for P.p.morio, as detailed
estimates of threats (habitat loss and
81Orangutan Population and Habitat Viability Assessment
fragmentation, removal of orangutans) are not
available. Based on the available information,
there are 6 large meta-populations that are
likely to show long-term viability as long as
any loss of habitat or orangutans remains low
and/or short term (Kutai, Tabin, Central Forest,
Lower Kinabatangan, North Kinabatangan,
Ulu Kalumpang). These meta-populations,
many of which are in Sabah in protected
areas, represent the core populations for
this taxon and could potentially combine to
total ~11,730 (SD ±1,560) orangutans (see
Appendix IV for details). Wehea landscape
represents a moderate-sized meta-population
that may be vulnerable depending upon the
level of habitat loss and removals that impact
it.
There are 7 meta-populations of ~300
orangutans each; populations of this size may
be viable in the absence of threats but are
vulnerable to loss of habitat and individuals.
Four of these (Crocker Range, Lingkabau,
Bonggaya, Sepilok) appear to be stable and not
under threat, possibly representing another
~1,000 orangutans. Trus Madi landscape may
be at risk depending upon the level of habitat
conversion, while Sangkulirang appears to be
at risk due to both habitat loss and harvest.
Seven meta-populations are small (most
under 100 individuals) and subject to some
extinction risk even in the absence of threats.
All of these populations appear to be under
risk of continued threat, resulting in poor
long-term viability. Depending upon their
specific situation, these small populations
may be able to maintain good viability with
periodic supplementation if current threats
canbesignificantlyreducedoreliminated.
These viability assessments for P.p. morio
populations are meant to serve as a guide
only. As more information becomes available
on the size, available habitat, fragmentation
and threats of P.p. morio populations, the
viability estimates for this taxon can be revised.
82 Orangutan Population and Habitat Viability Assessment
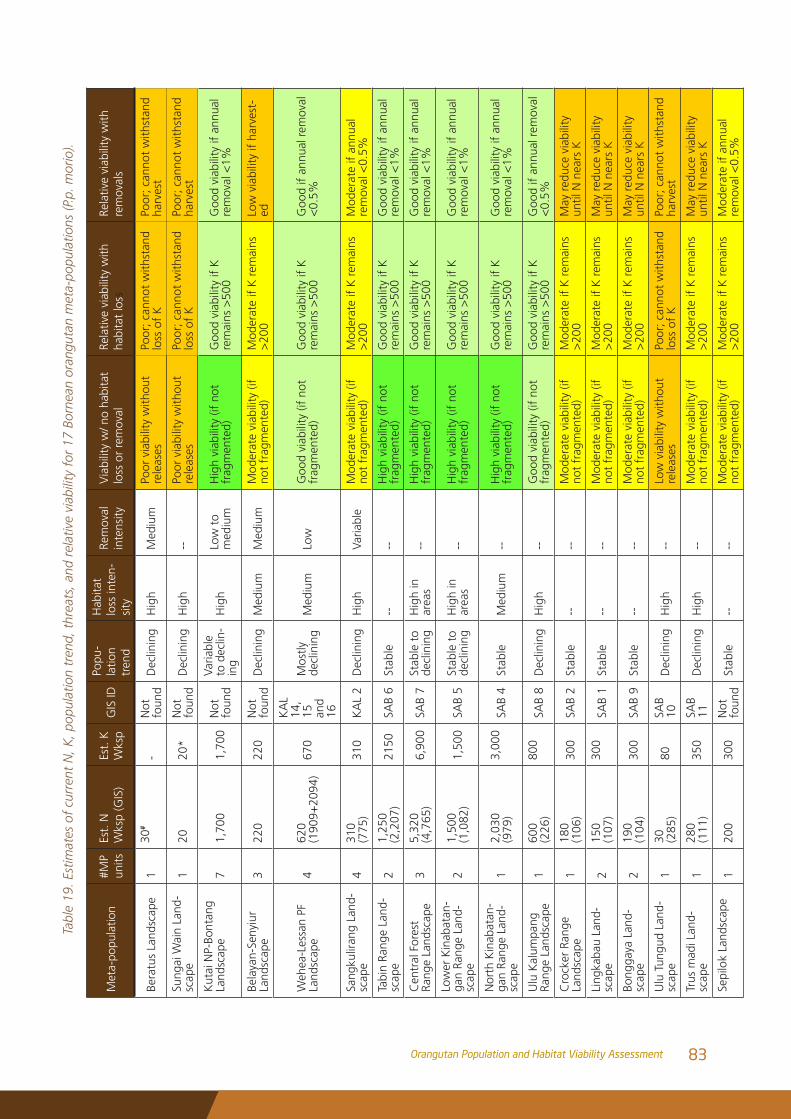
Tabl
e 19
. Est
imat
es o
f cu
rren
t N
, K, p
opul
atio
n tr
end,
thr
eats
, and
rel
ativ
e vi
abili
ty f
or 1
7 Bo
rnea
n or
angu
tan
met
a-po
pula
tions
(P.p
. mor
io).
Met
a-po
pula
tion
#MP
units
Est.
N
Wks
p (G
IS)
Est.
K
Wks
p G
IS ID
Popu
-la
tion
tren
d
Hab
itat
loss
inte
n-si
ty
Rem
oval
in
tens
ityV
iabi
lity
w/ n
o ha
bita
t lo
ss o
r re
mov
alRe
lativ
e vi
abili
ty w
ith
habi
tat
loss
Re
lativ
e vi
abili
ty w
ith
rem
oval
s
Bera
tus
Land
scap
e1
30#
-N
ot
foun
dD
eclin
ing
Hig
hM
ediu
mPo
or v
iabi
lity
with
out
rele
ases
Poor
; can
not
with
stan
d lo
ss o
f K
Poor
; can
not
with
stan
d ha
rves
t
Sung
ai W
ain
Land
-sc
ape
120
20
*N
ot
foun
dD
eclin
ing
Hig
h--
Poor
via
bilit
y w
ithou
t re
leas
esPo
or; c
anno
t w
ithst
and
loss
of
KPo
or; c
anno
t w
ithst
and
harv
est
Kut
ai N
P-Bo
ntan
g La
ndsc
ape
71,
700
1,70
0N
ot
foun
d
Varia
ble
to d
eclin
-in
gH
igh
Low
to
med
ium
Hig
h vi
abili
ty (i
f no
t fr
agm
ente
d)G
ood
viab
ility
if K
re
mai
ns >
500
Goo
d vi
abili
ty if
ann
ual
rem
oval
<1%
Bela
yan-
Seny
iur
Land
scap
e3
220
220
Not
fo
und
Dec
linin
gM
ediu
mM
ediu
mM
oder
ate
viab
ility
(if
not
frag
men
ted)
Mod
erat
e if
K r
emai
ns
>20
0Lo
w v
iabi
lity
if ha
rves
t-ed
Weh
ea-L
essa
n PF
La
ndsc
ape
462
0(1
909+
2094
)67
0
KA
L 14
, 15
an
d 16
Mos
tly
decl
inin
gM
ediu
mLo
wG
ood
viab
ility
(if
not
frag
men
ted)
Goo
d vi
abili
ty if
K
rem
ains
>50
0G
ood
if an
nual
rem
oval
<
0.5%
Sang
kulir
ang
Land
-sc
ape
431
0(7
75)
310
KA
L 2
Dec
linin
gH
igh
Varia
ble
Mod
erat
e vi
abili
ty (i
f no
t fr
agm
ente
d)M
oder
ate
if K
rem
ains
>
200
Mod
erat
e if
annu
al
rem
oval
<0.
5%
Tabi
n Ra
nge
Land
-sc
ape
21,
250
(2,2
07)
2150
SAB
6St
able
----
Hig
h vi
abili
ty (i
f no
t fr
agm
ente
d)G
ood
viab
ility
if K
re
mai
ns >
500
Goo
d vi
abili
ty if
ann
ual
rem
oval
<1%
Cen
tral
For
est
Rang
e La
ndsc
ape
35,
320
(4,7
65)
6,90
0SA
B 7
Stab
le t
o de
clin
ing
Hig
h in
ar
eas
--H
igh
viab
ility
(if
not
frag
men
ted)
Goo
d vi
abili
ty if
K
rem
ains
>50
0G
ood
viab
ility
if a
nnua
l re
mov
al <
1%
Low
er K
inab
atan
-ga
n Ra
nge
Land
-sc
ape
21,
500
(1,0
82)
1,50
0SA
B 5
Stab
le t
o de
clin
ing
Hig
h in
ar
eas
--H
igh
viab
ility
(if
not
frag
men
ted)
Goo
d vi
abili
ty if
K
rem
ains
>50
0G
ood
viab
ility
if a
nnua
l re
mov
al <
1%
Nor
th K
inab
atan
-ga
n Ra
nge
Land
-sc
ape
12,
030
(979
)3,
000
SAB
4St
able
Med
ium
--H
igh
viab
ility
(if
not
frag
men
ted)
Goo
d vi
abili
ty if
K
rem
ains
>50
0G
ood
viab
ility
if a
nnua
l re
mov
al <
1%
Ulu
Kal
umpa
ng
Rang
e La
ndsc
ape
160
0(2
26)
800
SAB
8D
eclin
ing
Hig
h--
Goo
d vi
abili
ty (i
f no
t fr
agm
ente
d)G
ood
viab
ility
if K
re
mai
ns >
500
Goo
d if
annu
al r
emov
al
<0.
5%
Cro
cker
Ran
ge
Land
scap
e1
180
(106
) 30
0 SA
B 2
Stab
le--
--M
oder
ate
viab
ility
(if
not
frag
men
ted)
Mod
erat
e if
K r
emai
ns
>20
0M
ay r
educ
e vi
abili
ty
until
N n
ears
K
Ling
kaba
u La
nd-
scap
e2
150
(107
)30
0SA
B 1
Stab
le--
--M
oder
ate
viab
ility
(if
not
frag
men
ted)
Mod
erat
e if
K r
emai
ns
>20
0M
ay r
educ
e vi
abili
ty
until
N n
ears
K
Bong
gaya
Lan
d-sc
ape
219
0 (1
04)
300
SAB
9St
able
----
Mod
erat
e vi
abili
ty (i
f no
t fr
agm
ente
d)M
oder
ate
if K
rem
ains
>
200
May
red
uce
viab
ility
un
til N
nea
rs K
Ulu
Tun
gud
Land
-sc
ape
130 (2
85)
80
SAB
10D
eclin
ing
Hig
h--
Low
via
bilit
y w
ithou
t re
leas
esPo
or; c
anno
t w
ithst
and
loss
of
KPo
or; c
anno
t w
ithst
and
harv
est
Trus
mad
i Lan
d-sc
ape
128
0(1
11)
350
SAB
11D
eclin
ing
Hig
h--
Mod
erat
e vi
abili
ty (i
f no
t fr
agm
ente
d)M
oder
ate
if K
rem
ains
>
200
May
red
uce
viab
ility
un
til N
nea
rs K
Sepi
lok
Land
scap
e 1
200
300
Not
fo
und
Stab
le--
--M
oder
ate
viab
ility
(if
not
frag
men
ted)
Mod
erat
e if
K r
emai
ns
>20
0M
oder
ate
if an
nual
re
mov
al <
0.5%
83Orangutan Population and Habitat Viability Assessment
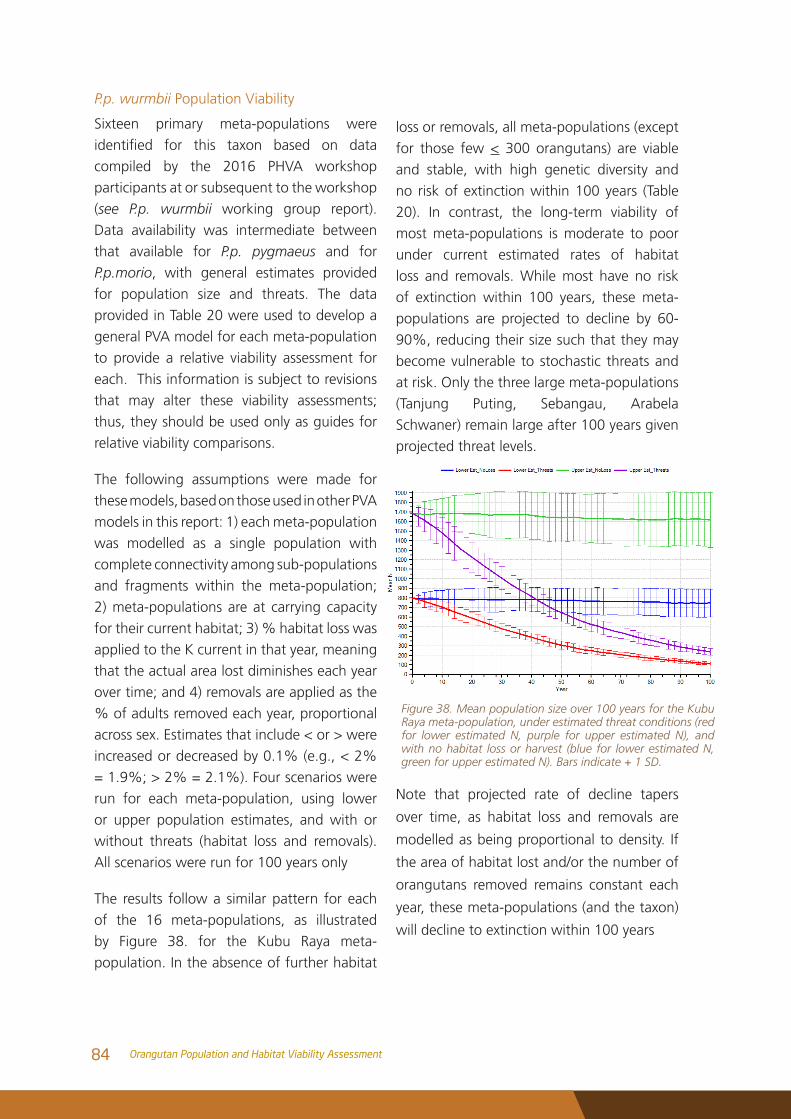
P.p. wurmbii Population Viability
Sixteen primary meta-populations were
identified for this taxon based on data
compiled by the 2016 PHVA workshop
participants at or subsequent to the workshop
(see P.p. wurmbii working group report).
Data availability was intermediate between
that available for P.p. pygmaeus and for
P.p.morio, with general estimates provided
for population size and threats. The data
provided in Table 20 were used to develop a
general PVA model for each meta-population
to provide a relative viability assessment for
each. This information is subject to revisions
that may alter these viability assessments;
thus, they should be used only as guides for
relative viability comparisons.
The following assumptions were made for
these models, based on those used in other PVA
models in this report: 1) each meta-population
was modelled as a single population with
complete connectivity among sub-populations
and fragments within the meta-population;
2) meta-populations are at carrying capacity
for their current habitat; 3) % habitat loss was
applied to the K current in that year, meaning
that the actual area lost diminishes each year
over time; and 4) removals are applied as the
% of adults removed each year, proportional
across sex. Estimates that include < or > were
increased or decreased by 0.1% (e.g., < 2%
= 1.9%; > 2% = 2.1%). Four scenarios were
run for each meta-population, using lower
or upper population estimates, and with or
without threats (habitat loss and removals).
All scenarios were run for 100 years only
The results follow a similar pattern for each
of the 16 meta-populations, as illustrated
by Figure 38. for the Kubu Raya meta-
population. In the absence of further habitat
loss or removals, all meta-populations (except
for those few < 300 orangutans) are viable
and stable, with high genetic diversity and
no risk of extinction within 100 years (Table
20). In contrast, the long-term viability of
most meta-populations is moderate to poor
under current estimated rates of habitat
loss and removals. While most have no risk
of extinction within 100 years, these meta-
populations are projected to decline by 60-
90%, reducing their size such that they may
become vulnerable to stochastic threats and
at risk. Only the three large meta-populations
(Tanjung Puting, Sebangau, Arabela
Schwaner) remain large after 100 years given
projected threat levels.
Figure 38. Mean population size over 100 years for the Kubu Raya meta-population, under estimated threat conditions (red for lower estimated N, purple for upper estimated N), and with no habitat loss or harvest (blue for lower estimated N, green for upper estimated N). Bars indicate + 1 SD.
Note that projected rate of decline tapers
over time, as habitat loss and removals are
modelled as being proportional to density. If
the area of habitat lost and/or the number of
orangutans removed remains constant each
year, these meta-populations (and the taxon)
will decline to extinction within 100 years
84 Orangutan Population and Habitat Viability Assessment
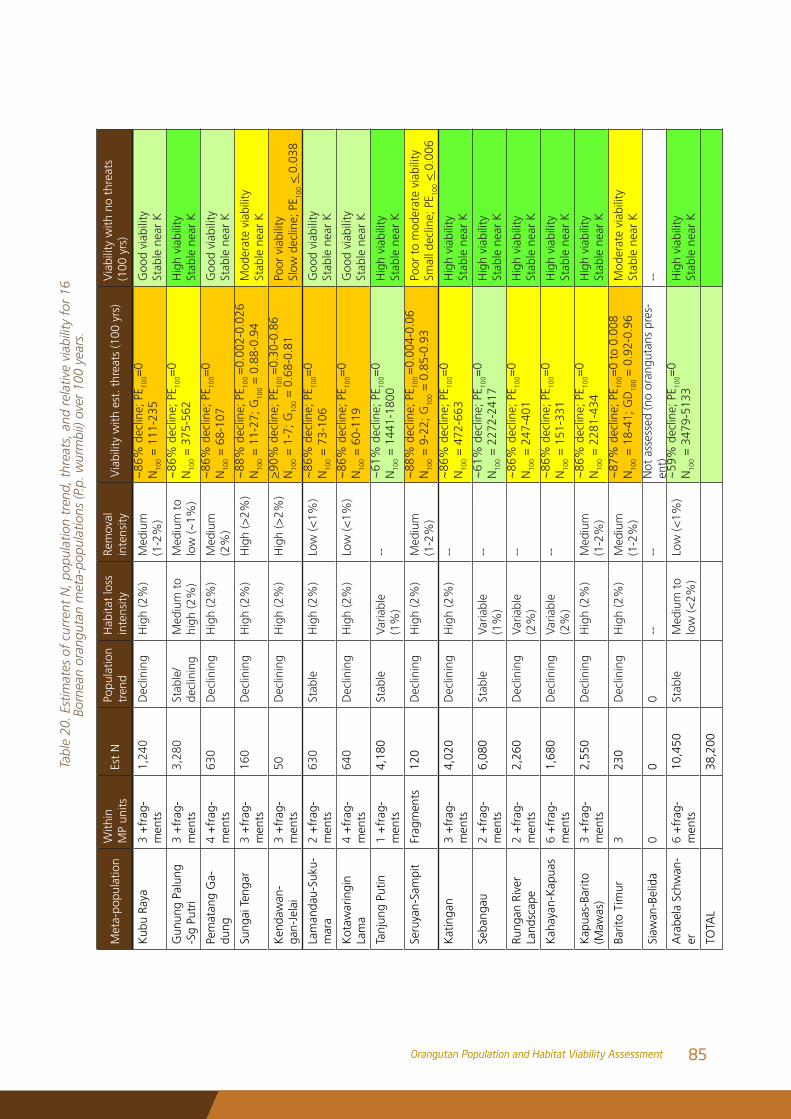
Met
a-po
pula
tion
With
in
MP
units
Est
NPo
pula
tion
tren
d H
abita
t lo
ss
inte
nsity
Rem
oval
in
tens
ityV
iabi
lity
with
est
. thr
eats
(100
yrs
)V
iabi
lity
with
no
thre
ats
(100
yrs
)
Kub
u Ra
ya3
+fr
ag-
men
ts1,
240
Dec
linin
gH
igh
(2%
)M
ediu
m
(1
-2%
)
~86
% d
eclin
e; P
E 100=
0 N
100
= 1
11-2
35G
ood
viab
ility
Stab
le n
ear
K
Gun
ung
Palu
ng
-Sg
Putr
i3
+fr
ag-
men
ts3,
280
Stab
le/
decl
inin
gM
ediu
m t
o hi
gh (2
%)
Med
ium
to
low
(~1%
)
~86
% d
eclin
e; P
E 100=
0 N
100
= 3
75-5
62H
igh
viab
ility
Stab
le n
ear
K
Pem
atan
g G
a-du
ng4
+fr
ag-
men
ts63
0D
eclin
ing
Hig
h (2
%)
Med
ium
(2
%)
~86
% d
eclin
e; P
E 100=
0 N
100
= 6
8-10
7G
ood
viab
ility
Stab
le n
ear
K
Sung
ai T
enga
r3
+fr
ag-
men
ts16
0D
eclin
ing
Hig
h (2
%)
Hig
h (>
2%)
~88
% d
eclin
e; P
E 100 =
0.00
2-0.
026
N10
0 =
11-
27; G
100
= 0
.88-
0.94
Mod
erat
e vi
abili
tySt
able
nea
r K
Ken
daw
an-
gan-
Jela
i3
+fr
ag-
men
ts50
Dec
linin
gH
igh
(2%
)H
igh
(>2%
)>
90%
dec
line;
PE 10
0 =
0.30
-0.8
6N
100
= 1
-7; G
100
= 0
.68-
0.81
Poor
via
bilit
ySl
ow d
eclin
e; P
E 100
< 0
.038
Lam
anda
u-Su
ku-
mar
a2
+fr
ag-
men
ts63
0St
able
Hig
h (2
%)
Low
(<1%
)~
86%
dec
line;
PE 10
0=0
N10
0 =
73-
106
Goo
d vi
abili
tySt
able
nea
r K
Kot
awar
ingi
n La
ma
4 +
frag
-m
ents
640
Dec
linin
gH
igh
(2%
)Lo
w (<
1%)
~86
% d
eclin
e; P
E 100=
0 N
100
= 6
0-11
9G
ood
viab
ility
Stab
le n
ear
K
Tanj
ung
Putin
1 +
frag
-m
ents
4,18
0St
able
Varia
ble
(1%
)--
~61
% d
eclin
e; P
E 100=
0 N
100
= 1
441-
1800
Hig
h vi
abili
tySt
able
nea
r K
Seru
yan-
Sam
pit
Frag
men
ts12
0D
eclin
ing
Hig
h (2
%)
Med
ium
(1-2
%)
~88
% d
eclin
e; P
E 100 =
0.00
4-0.
06N
100
= 9
-22;
G10
0 =
0.8
5-0.
93Po
or t
o m
oder
ate
viab
ility
Smal
l dec
line;
PE 10
0 <
0.0
06
Kat
inga
n3
+fr
ag-
men
ts4,
020
Dec
linin
gH
igh
(2%
)--
~86
% d
eclin
e; P
E 100=
0 N
100
= 4
72-6
63H
igh
viab
ility
Stab
le n
ear
K
Seba
ngau
2 +
frag
-m
ents
6,08
0St
able
Varia
ble
(1%
)--
~61
% d
eclin
e; P
E 100=
0 N
100
= 2
272-
2417
Hig
h vi
abili
tySt
able
nea
r K
Rung
an R
iver
La
ndsc
ape
2 +
frag
-m
ents
2,26
0D
eclin
ing
Varia
ble
(2%
)--
~86
% d
eclin
e; P
E 100=
0 N
100
= 2
47-4
01H
igh
viab
ility
Stab
le n
ear
K
Kah
ayan
-Kap
uas
6 +
frag
-m
ents
1,68
0D
eclin
ing
Varia
ble
(2%
)--
~86
% d
eclin
e; P
E 100=
0 N
100
= 1
51-3
31H
igh
viab
ility
Stab
le n
ear
K
Kap
uas-
Barit
o (M
awas
)3
+fr
ag-
men
ts2,
550
Dec
linin
gH
igh
(2%
)M
ediu
m
(1
-2%
)
~86
% d
eclin
e; P
E 100=
0 N
100
= 2
281-
434
Hig
h vi
abili
tySt
able
nea
r K
Barit
o Ti
mur
323
0D
eclin
ing
Hig
h (2
%)
Med
ium
(1-2
%)
~87
% d
eclin
e; P
E 100=
0 to
0.0
08N
100
= 1
8-41
; GD
100
= 0
.92-
0.96
Mod
erat
e vi
abili
tySt
able
nea
r K
Siaw
an-B
elid
a0
00
----
Not
ass
esse
d (n
o or
angu
tans
pre
s-en
t)--
Ara
bela
Sch
wan
-er
6 +
frag
-m
ents
10,4
50St
able
Med
ium
to
low
(<2%
)Lo
w (<
1%)
~59
% d
eclin
e; P
E 100=
0 N
100
= 3
479-
5133
Hig
h vi
abili
tySt
able
nea
r K
TOTA
L38
,200
Tabl
e 20
. Est
imat
es o
f cu
rren
t N
, pop
ulat
ion
tren
d, t
hrea
ts, a
nd r
elat
ive
viab
ility
for
16
Born
ean
oran
guta
n m
eta-
popu
latio
ns (P
.p. w
urm
bii)
over
100
yea
rs.
85Orangutan Population and Habitat Viability Assessment
Summary of P.p. wurmbii Population Viability
The three large, stable meta-populations
(Tanjung Puting, Sebangau, Arabela Schwaner)
are likely to be viable over time, provided that
habitatlossdoesnotsignificantlyreduceKor
fragment the population and that removals
are low. These meta-populations could total
~17,000 to 22,000 orangutans if carrying
capacity (habitat) is not lost and orangutans
are not extracted or killed. Estimated current
habitat loss and removal rates for these meta-
populations, while low, would result in ~60%
reduction in orangutan numbers in these
areas over 100 years. Several moderately large
populations have combined threat levels that
lead to severe decline (~86%) if allowed to
continue; while declining, these populations
may exhibit good viability IF habitat loss and
removals can be slowed or halted while the
populations are still large and not fragmented.
Almost all meta-populations may be viable if
habitat loss and removal of orangutans were
halted immediately.
Summary Of PVA Modelling ResultsThis PVA was developed in concert with the
2016 PHVA workshop for orangutans and is
based upon the best available information
at that time. The following questions were
addressed by this PVA; brief conclusions are
given below.
What is the projected viability of current
orangutan populations given the best
estimates of population size, threats and
management?
None of the eight extant wild populations
of Sumatran orangutans are projected to be
viable in the long term under the projected
rates and periods of habitat loss and harvest.
The two reintroduced populations may be
viable with additional releases provided they
are not subject to harvest or substantial habitat
loss. If all habitat loss and harvest were to
be immediately eliminated, then population
viability would be high for Sumatran
orangutans. Lower rates and shorter periods
of habitat loss and/or harvest will lead to
intermediate levels of viability between these
two extremes.
Bornean populations are divided into three
taxa; all three have large, potentially viable
meta-populations, moderate-sized meta-
populations at various degrees of risk, and small
populations under threat with low viability
without threat abatement and/or periodic
supplementation. The least numerous of the
three is P.p. pygmaeus, with two large meta-
populations totalling ~5000 orangutans that
have good long-term viability under projected
conditions, while other meta-populations are
at risk due to threats and/or small population
size. P.p. morio has six large meta-populations
totaling ~16,000 orangutans that have good
viability provided habitat loss and removals
remain low and/or are eliminated. Several
moderate-size meta-populations also may
be viable if losses remain negligible, while
small populations under threat are at risk of
extinction. The three large P.p. wurmbii meta-
populations totaling ~20,000 orangutans,
plus several moderate-size meta-populations,
have good viability if habitat loss can be
controlled. Several smaller meta-populations
are at risk due to high removal rates as well as
habitat loss and small size.
86 Orangutan Population and Habitat Viability Assessment
What is the projected impact on orangutans of
the construction of roads through orangutan
habitat (e.g., in West and East Leuser, in West
and East Batang Toru)?
PVA results for road fragmentation scenarios
are conservative estimates of road impacts, as
they do not consider additional mortality or
increased accessibility. Fragmentation hastens
decline and time to extinction and in most
scenarios led to eventual extinction under
current projected threats. In the absence of
habitat loss, removals or additional mortality,
fragmentation alone did not greatly impact
viability.
What is the smallest population size that can
meet the agreed standards for a Minimum
Viable Population (MVP)? How does this size
change with different conditions or threat
levels?
The PHVA participants defined a viable
population as one with < 1% probability of
extinction in 100 years and < 10% risk of
extinctionin500years.Usingthisdefinition,
the MVP for Sumatran orangutans is 150 and
MVP=100 for Bornean orangutans. Although
defined as ‘viable’, these populations of
100-150 demonstrate a slow declining trend
and reduced gene diversity (i.e., inbreeding
accumulation). A minimum population of
200 orangutans is needed for both species to
retain 90% GD for 500 years, and at least 500
orangutans are needed to stabilize population
size and avoid decline. All of these thresholds
are higher if the initial animals are related or
subject to increased threats.
What is the smallest current population that
could meet the MVP standard if allowed
space to grow larger (e.g., reintroductions
into a new area, additional habitat added to
an existing area)?
Populations of at least 50 orangutans are
able to meet the MVP standard if they have
sufficientspacetogrow,providedtheyarenot
under threat of habitat loss, fragmentation
or harvest. These results are based on the
current PVA model, which incorporates
density-dependent reproduction and thus
allows populations to grow at a faster rate at
low density.
What level of periodic supplementation
would be needed to maintain the viability of
small populations below the MVP?
Orangutan populations of 50 or fewer
animals can be maintained through
periodic supplementation. The required
supplementation rate will depend upon the
population size and potentially other factors
such as threat levels. PVA results suggest that
the addition of one young adult female every
~35 years can provide viability to a population
of 50, while a population of 20 may need
supplementation with one adult female every
13 years. Very small fragments may be at risk
of losing their sole breeding male and may
require addition of an adult male in some
cases.
87Orangutan Population and Habitat Viability Assessment
What is the viability of populations established
using a specified reintroduction scheme?
Release strategies may vary by the age, sex
and number of orangutans released as
well as the length and schedule of release.
A thorough assessment of reintroduction
schemes is beyond the scope of this PVA.
However, a specific scheme was modelled
that involved four consecutive years of a
large number of releases into a large area of
unoccupied habitat. Releases were of sub-
adult and young adults and were female
biased. The combination of a young, female-
biased population at low density promotes
faster growth and overall population viability.
88 Orangutan Population and Habitat Viability Assessment
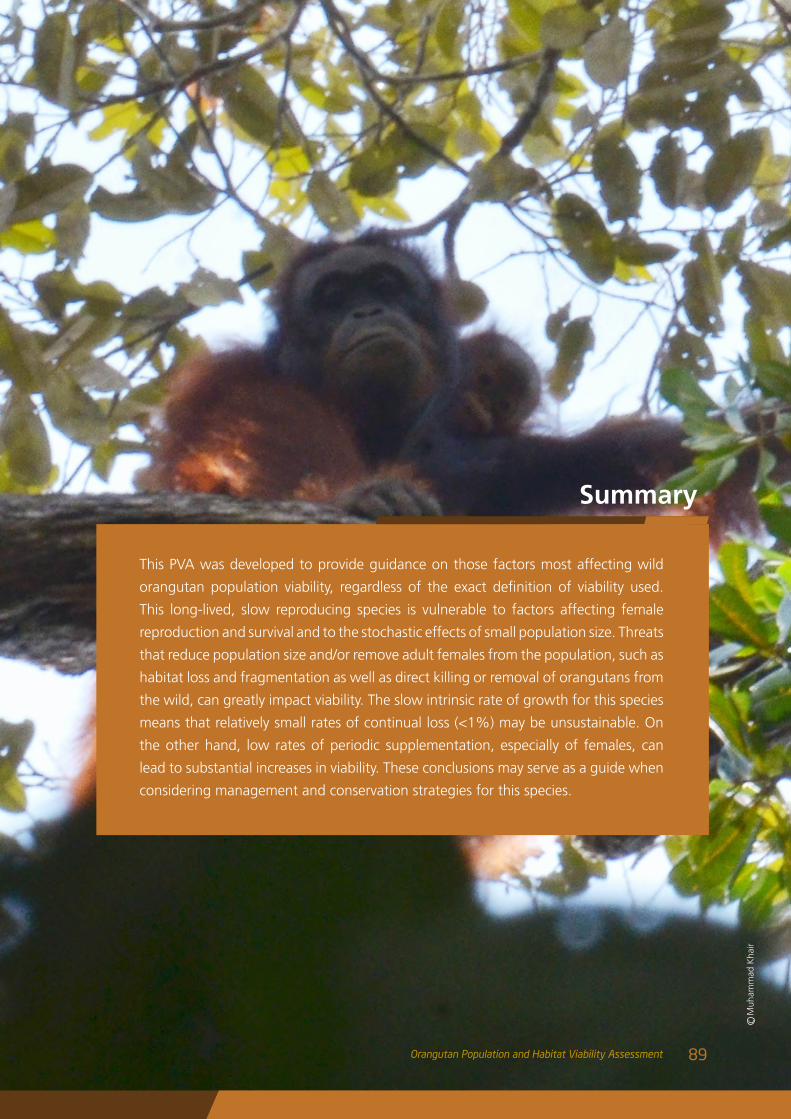
This PVA was developed to provide guidance on those factors most affecting wild
orangutan population viability, regardless of the exact definition of viability used.
This long-lived, slow reproducing species is vulnerable to factors affecting female
reproduction and survival and to the stochastic effects of small population size. Threats
that reduce population size and/or remove adult females from the population, such as
habitat loss and fragmentation as well as direct killing or removal of orangutans from
the wild, can greatly impact viability. The slow intrinsic rate of growth for this species
means that relatively small rates of continual loss (<1%) may be unsustainable. On
the other hand, low rates of periodic supplementation, especially of females, can
lead to substantial increases in viability. These conclusions may serve as a guide when
considering management and conservation strategies for this species.
Summary
Muh
amm
ad K
hair
c
89Orangutan Population and Habitat Viability Assessment

90 Orangutan Population and Habitat Viability Assessment
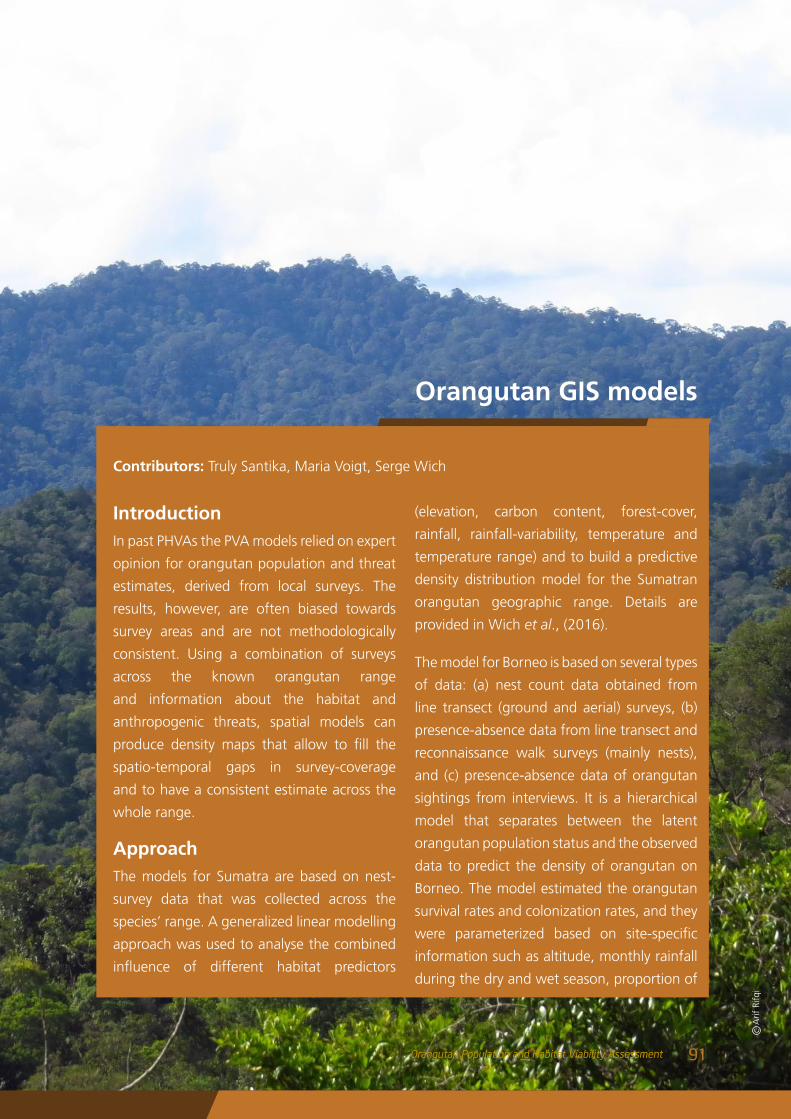
Orangutan GIS models
IntroductionIn past PHVAs the PVA models relied on expert
opinion for orangutan population and threat
estimates, derived from local surveys. The
results, however, are often biased towards
survey areas and are not methodologically
consistent. Using a combination of surveys
across the known orangutan range
and information about the habitat and
anthropogenic threats, spatial models can
produce density maps that allow to fill the
spatio-temporal gaps in survey-coverage
and to have a consistent estimate across the
whole range.
ApproachThe models for Sumatra are based on nest-
survey data that was collected across the
species’ range. A generalized linear modelling
approach was used to analyse the combined
influence of different habitat predictors
(elevation, carbon content, forest-cover,
rainfall, rainfall-variability, temperature and
temperature range) and to build a predictive
density distribution model for the Sumatran
orangutan geographic range. Details are
provided in Wich et al., (2016).
The model for Borneo is based on several types
of data: (a) nest count data obtained from
line transect (ground and aerial) surveys, (b)
presence-absence data from line transect and
reconnaissance walk surveys (mainly nests),
and (c) presence-absence data of orangutan
sightings from interviews. It is a hierarchical
model that separates between the latent
orangutan population status and the observed
data to predict the density of orangutan on
Borneo. The model estimated the orangutan
survival rates and colonization rates, and they
were parameterized based on site-specific
information such as altitude, monthly rainfall
during the dry and wet season, proportion of
Contributors: Truly Santika, Maria Voigt, Serge Wich
Arif
Rifq
ic
91Orangutan Population and Habitat Viability Assessment
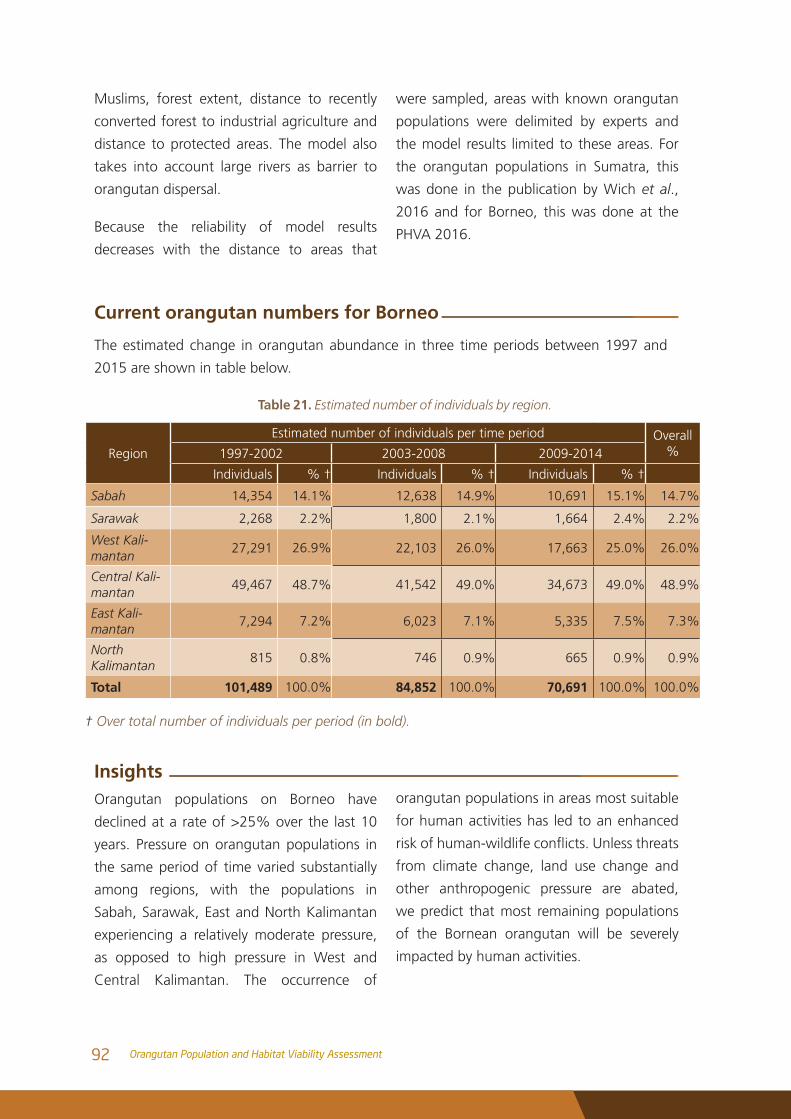
Muslims, forest extent, distance to recently
converted forest to industrial agriculture and
distance to protected areas. The model also
takes into account large rivers as barrier to
orangutan dispersal.
Because the reliability of model results
decreases with the distance to areas that
Region
Estimated number of individuals per time period Overall%1997-2002 2003-2008 2009-2014
Individuals % † Individuals % † Individuals % †
Sabah 14,354 14.1% 12,638 14.9% 10,691 15.1% 14.7%
Sarawak 2,268 2.2% 1,800 2.1% 1,664 2.4% 2.2%
West Kali-mantan
27,291 26.9% 22,103 26.0% 17,663 25.0% 26.0%
Central Kali-mantan
49,467 48.7% 41,542 49.0% 34,673 49.0% 48.9%
East Kali-mantan
7,294 7.2% 6,023 7.1% 5,335 7.5% 7.3%
NorthKalimantan
815 0.8% 746 0.9% 665 0.9% 0.9%
Total 101,489 100.0% 84,852 100.0% 70,691 100.0% 100.0%
† Over total number of individuals per period (in bold).
Table 21. Estimated number of individuals by region.
were sampled, areas with known orangutan
populations were delimited by experts and
the model results limited to these areas. For
the orangutan populations in Sumatra, this
was done in the publication by Wich et al.,
2016 and for Borneo, this was done at the
PHVA 2016.
Current orangutan numbers for Borneo
The estimated change in orangutan abundance in three time periods between 1997 and
2015 are shown in table below.
InsightsOrangutan populations on Borneo have
declined at a rate of >25% over the last 10
years. Pressure on orangutan populations in
the same period of time varied substantially
among regions, with the populations in
Sabah, Sarawak, East and North Kalimantan
experiencing a relatively moderate pressure,
as opposed to high pressure in West and
Central Kalimantan. The occurrence of
orangutan populations in areas most suitable
for human activities has led to an enhanced
riskofhuman-wildlifeconflicts.Unlessthreats
from climate change, land use change and
other anthropogenic pressure are abated,
we predict that most remaining populations
of the Bornean orangutan will be severely
impacted by human activities.
92 Orangutan Population and Habitat Viability Assessment
Poor connectivity among orangutan habitats
within the boundaries of PAs is currently
the predominant threat to orangutan
populations in Sabah. In Sarawak, East and
North Kalimantan, habitat loss from forest
conversion to industrial agriculture and
human-orangutan conflicts are the main
threats. Orangutan populations in West and
Central Kalimantan, are mainly endangered by
habitat loss from continuing forest conversion
to industrial agriculture, human-orangutan
conflicts,andanthropogenicactivities.
As the populations in different regions
face different threats, specific abatement
plans should be implemented to ensure the
long-term persistence of the species. This
includes (1) maintaining high forest cover
in orangutan habitats and improving the
connectivity among the remaining habitat
patches through better spatial planning for
all regions of Borneo, (2) close cooperation
with plantation companies, smallholder
farmers and wider communities in managing
conflictswithorangutansinKalimantan,and
specifically inWest andCentralKalimantan.
This includes (3) improving the effectiveness
of anti-hunting efforts and education and
(4) developing a better understanding of the
underlying socio-economic motivations of
hunting.
Estimated yearly deforestation rates for use as threat estimates for the PVA models
The forest area available for each population
in the year 2000 was extracted from a land
cover layer (Miettinen et al., 2012), using the
expert-delineated population polygons and a 2
km buffer around them. From the land cover-
classes only mangrove forest, peat swamp
forest, lowland forest and lower montane
forest were considered suitable orangutan
habitat. The yearly deforestation in 2000 until
2014 was obtained from the tree-loss layer
by Hansen et al., 2013. The deforestation
that occurred outside of primary forest was
excluded and for each year the amount of
remaining forest was used to calculate the
percent of habitat available lost annually, for
each population.
93Orangutan Population and Habitat Viability Assessment
Alkema, S. W. T. An Orangutan (Pongo pygmae-us) Population Survey in Lesan River Pro-tection Forest, East Kalimantan, Indonesia. Operasi Wallacea Terpadu (2015).
Ancrenaz, M., Gumal, M., Marshall, A.J., Mei-jaard, E., Wich, S.A. & Husson, S. (2016). Pongo pygmaeus. The IUCN Red List of Threatened Species 2016: e.T17975A17966347. http://dx.doi.org/10.2305/IUCN.UK.2016 1.RLTS.T17975A17966347.en. Downloaded on 25 February 2017.
Cattau, M., Husson, S., and S. Cheyne 2015. Population status of the Bornean orang-utan Pongo pygmaeus in a vanishing forest in Indonesia: The former Mega Rice Project. Oryx, 49(3), 473-480.
Ellis, S., I. Singleton, N. Andayani, K. Traylor-Hol-zer, and J. Supriatna (eds.). 2006. Suma-tran Orangutan Conservation Action Plan. Washington, DC and Jakarta, Indonesia: Conservation International.
Frankham, R., Ballou, J.D. and D.A. Briscoe (2002). Introduction to Conservation Genetics. Cambridge Univ. Press.
Gaveau, D.L.A., S. Sloan, E. Molidena, H. Yaen, D. Sheil, N.K. Abram, M. Ancrenaz, R. Nasi, M. Quinones, N. Wielaard, and E. Meijaard. 2014. Four decades of forest persistence, loss and logging on Borneo. Plos One 9 (7): e 101654.
Gilpin, M.E. and M.E. Soulé. 1986. Minimum viable populations: processes of species extinction. Pp. 19-34 in M. Soule (ed.). Conservation Biology: The Science of Scarcity and Diversity. Sinauer Associates: Sunderland, MA.
Hansen, M. C., P. V. Potapov, R. Moore, M. Hancher, S. A. Turubanova, A. Tyukavina, D. Thau, S. V. Stehman, S. J. Goetz, T. R. Loveland, A. Kommareddy, A. Egorov, L. Chini, C. O. Justice, and J. R. G. Town-shend. 2013. “High-Resolution Global Maps of 21st-Century Forest Cover Change.” Science 342 (15 November):
850–53. Data available on-line from: http://earthenginepartners.appspot.com/science-2013-global-forest.
Husson, S. J., Wich, S. A., Marshall, A. J., Dennis, R.D., Ancrenaz, M. et al. 2009. Orang-utan distribution, density, abundance and impacts of disturbance. In Orang-utans: Geographic Variation in Behavioral Ecology and Conservation, eds. S. A. Wich, S. S. Utami Atmoko, T. Mitra Setia and C. P. van Schaik. Oxford, UK: Oxford University Press, pp. 77-96.
Husson, S.J., Morrogh-Bernard, H.Santiano, Purwanto, A., Harsanto, F., McLardy, C., and L D’Arcy. 2015. Status of apes: Long-term temporal trends in ape populations in 4 case studies: Bornean orangutans in the Sabangau peat-swamp forest. In: State of the Apes: Industrial Agriculture and Ape Conservation, Arcus Founda-tion.
Johnson A.E., Knott C.D., Pamungkas B., Pasari-bu M., and Marshall A.J. 2005 A survey of the orangutan (Pongo pygmaeus pygmaeus) population in and around Gunung Palung National Park, West Kali-mantan, Indonesia based on nest counts. Biological Conservation.
Lacy, R.C. 2000. Structure of the VORTEX simula-tion model for population viability analy-sis. Ecological Bulletins 48:191-203.
Lacy, R.C., P.S. Miller, and K. Traylor-Holzer. 2017. VORTEX: A Stochastic Simulation of the Extinction Process. Version 10 User’s Manual. Apple Valley, MN: IUCN SSC Conservation Breeding Specialist Group and Chicago Zoological Society.
Lacy, R.C. and J.P. Pollak. 2017. VORTEX: A Stochastic Simulation of the Extinction Process. Version 10.2.6. Chicago Zoologi-calSociety,Brookfield,IL.
MacPhee, R. D. E. and A. D. Greenwood 2013. “Infectious Disease, Endangerment, and Extinction,” International Journal of Evolutionary Biology, vol. 2013, Article ID 571939. doi:10.1155/2013/571939
References
94 Orangutan Population and Habitat Viability Assessment
Marshal AJ, LA Salas, S Stephens, Nardiyono,L Engstrom, E Meijard and SA Stanley. Use Limestone Forests by Bornean Orang-utans(Pongo pygmaeus morio) in the Sangkulirang Peninsula, East Kalimantan, Indonesia. American Journal of Primatol-ogy 69:1–8 (2007)
Mathewson PD, SN Spehar, E Meijaard, Nardiy-ono, Purnomo, A Sasmirul, Sudiyanto, Oman, Sulhnudin, Jasary, Jumali and AJ Marshall. Evaluating Orangutan Cesus Techniques Using Nest Decay Rates: Implication for Population Estimates. Ecological Applications, 18(1), 2008, pp. 208–221
McCallum H. Disease and the dynamics of ex-tinction 2012. Philosophical Transactions of the Royal Society B: Biological Scienc-es.367(1604):2828-2839. doi:10.1098/rstb.2012.0224.
Meijaard, E., Welsh, A., Ancrenaz, M., Wich, S., Nijman, V., and A.J. Marshall. 2010. Declining orangutan encounter rates from Wallace to the present suggest the species was once more abundant. PloS ONE, 5(8).
Meijaard E., Buchori D., Hadiprakarsa Y., Ancren-az. M., et al. 2011. Quantifying Killing of Orangutans and Human-Orangutan ConflictinKalimantan,Indonesia.PLoSONE, 6 (11)
Miettinen, J., Shi C., Tan W.J. and Liew S.C. 2012. 2010 land cover map of insular South-east Asia in 250m spatial resolution. Remote Sensing Letters 3: 11-20. DOI: 10.1080/01431161.2010.526971
Morrogh-Bernard H., Husson S., Page S.E., and Rieley J.O. 2003 Population status of the Bornean orang-utan (Pongo pygmaeus) in the Sebangau peat swamp forest, Central Kalimantan, Indonesia. Biol Cons 110:141-152.
Nater A, Greminger MP, Arora N, van Schaik CP, Goossens B, Singleton I, Verschoor EJ, Warren KS, Krützen M (2015) Recon-
structing the demographic history of orang-utans using Approximate Bayesian Computation. Mol Ecol 24, 310-327.
O’Grady, J.J., B.W. Brook, D.H. Reed, J.D. Ballou, D.W. Tonkyn, and R. Frankham. 2006. Realistic levels of inbreeding depression strongly affect extinction risk in wild populations. Biological Conservation 133:42-51.
Rijksen, H. D., and E. Meijaard. 1999. Our vanishing relative. The status of wild orang-utans at the close of the twentieth century. Kluwer Academic Publishers, Dordrecht, The Netherlands.
Shaffer, M. 1987. Minimum viable populations: coping with uncertainty. Pp. 69-86 in M. Soule (ed.). Viable Populations for Con-servation. Cambridge University Press: Cambridge.
Soule, M., M. Gilpin, W. Conway, and T. Foose. 1986. The millenium ark: how long a voyage, how many staterooms, how many passengers? Zoo Biology 5: 101-113.
Singleton, I., S. Wich, S. Husson, S. Stephens, S. Utami Atmoko, M. Leighton, N. Rosen, K. Traylor- Holzer, R. Lacy and O. Byers (eds.). 2004. Orangutan Population and Habitat Viability Assessment: Final Report. IUCN/SSC Conservation Breeding Specialist Group, Apple Valley, MN.
Singleton, I., Wich, S.A., Nowak, M. & Ush-er, G. (2016). Pongo abelii. (errata version published in 2016) The IUCN Red List of Threatened Species 2016: e.T39780A102329901. Downloaded on 25 February 2017.
Spehar, S. N., Loken, B., Rayadin, Y. & Royle, J. A. Comparing spatial capture–recapture modeling and nest count methods to es-timate orangutan densities in the Wehea Forest, East Kalimantan, Indonesia. Biol. Conserv. 191, 185–193 (2015).
95Orangutan Population and Habitat Viability Assessment
Tilson, R., U.S. Seal, K. Soemarna, W. Ramono, E. Sumarjda, S. Poniran, C. van Schaik, M. Leighton, H. Rijksen, A. Eudey (eds). 1993. Orangutan Population and Habitat Viability Analysis Report. IUCN/SSC Captive Breeding Specialist Group, Apple Valley, MN.
Wich, S.A., S.S. Utami-Atmoko, T.M. Setia, H.D. Rijksen, C. Schürmann, J.A. van Hooff, and C.P. van Schaik. 2004. Life history of wild Sumatran orangutans (Pongo abelii). J. Hum. Evol. 47(6): 385-398.
Wich, S.A., Meijaard, E., Marshall A.E., Husson, S., Ancrenaz, M. et al. 2008. Distribution and conservation status of the orangutan (Pongo spp.) on Borneo and Sumatra: how many remain? Oryx, 42 (3): 1-11.
Wich,S.A.,Riswan,Jenson,J.,Refisch,J.,Nelle-mann, C. (2011). Orangutans and the economics of sustainable forest man-agement in Sumatra. Indonesia: UNEP/GRASP/PanEco/YEL/ICRAF/GRID-Arendal.
Wich, S.A., Gaveau, D., Abram, N., Ancrenaz, M., Baccini, A., et al. 2012. Understanding the Impacts of Land-Use Policies on a Threatened Species: Is There a Future for the Bornean Orangutan? PLoS ONE 7(11)
Wich, S. A., Singleton, I., Nowak, M. G., Atmoko, S. S. U., Nisam, G., Arif, S. M. and Gaveau, D. L. 2016. Land-cover changes predict steep declines for the Sumatran orangutan (Pongo abelii). Science ad-vances, 2(3), e1500789.
96 Orangutan Population and Habitat Viability Assessment
Considering the limited data collection for Kalimantan in PHVA 2004, FORINA, as an institution mandated by Indonesia Orangutan Action Plan 2007-2017, conducted several activities in Kalimantan prior to PHVA 2017, namely:
1. Training for Standardizing Survey and Observation Method
FORINA conducted several capacity
building trainings related on enhancing
capacity of Indonesia human resources
on orangutan conservation program and
biodiversity protection, such as training
for standardizing survey and observation
method. FORINA recommended a
systematic design of line transects with
randomly sampling as standard method for
orangutan survey. In total 95 participants
were trained by FORINA on introduction
of orangutan ecology, theory and
technique of nest survey for orangutan,
tools practice, organizing field survey
and data analysis. The series of trainings
were supported by Ministry of Forestry
and IFACS-USAID program, i.e.: West
Kalimantan on 16-17 September 2011,
East Kalimantan on 19-20 September
2011, and Central Kalimantan on 23-24
September 2011. Supported by FOKKAB-
WWF Indonesia, FORINA conducted a
similar training in West Kalimantan early
2011. FORINA personnel also were invited
as resource person and/or trainer on the
Ministry of Forestry’s unit capacity building
Appendix I
Gathering Information
trainings to present on orangutan survey
method, such as: Biodiversity Conservation
Technical Assistance in 2012, 2015, 2017;
West Kalimantan BKSDA in 2012; Central
Kalimantan BKSDA in 2013; Bukit Baka-
Bukit Raya National Park Management
Unit in 2012, 2013; and Betung Kerihun
National Park Management Unit in 2013.
Two guideline books were released
by FORINA and partners to support
standardize of survey method in 2012, i.e.:
Buku Panduan Survei Sarang Orangutan
(written by S. S. Utami-Atmoko and M. A.
Rifqi) and Panduan Lapangan Pengenalan
Jenis Mamalia dan Burung Dilindungi
di Sumatera dan Kalimantan (written
by S. S. Utami-Atmoko, M. A. Rifqi and
Gondanisam).
2. Kalimantan Wide Survey 2
Kalimantan Wide Survey 2 (KWS 2) was conducted during May-November 2012 in West Kalimantan, Central Kalimantan and East Kalimantan and funded by The Nature Conservancy Indonesia. This survey was conducted by FORINA and collaborated with 12 conservation organizations (FOKKAB, WWF Indonesia, Riak Bumi, Titian Foundation, Palung Foundation, PRCF Indonesia, Diantama Foundation, AKAR, FK3I, Indonesian Orangutan Foundation, Orangutan Foundation-UK, Ecositrop), 2 universities (University of Tanjungpura and University of Mulawarman) and Ministry of Forestry units (BKSDA and Taman Nasional). The survey started with 3 preparation training
97Orangutan Population and Habitat Viability Assessment
workshops was held to standardize the survey method in Samarinda on 6th of May 2012, Pontianak on 9th of June 2012 and Pangkalan Bun on 16th June 2012. Team survey conducted ground check to 36 locationsidentifiedaspredictedorangutanhabitat based on Kalimantan Wide Survey 1 result. All of locations were located outside the conservation area. Team identifiedorangutan presence through nest or direct encounter, current habitat condition as well as potential and existing threats. The orangutan distribution map was updated base on the results of KWS 2 result that removed 6 locations in Central Kalimantan and 5 locations in West Kalimantan.
3. Database Development Collect
FORINA started to collect related data in 2013 as a preparation activity for 2013 Orangutan Action Plan Evaluation. During the regional meeting in North Sumatera and Aceh on 19-21 of August 2013, West Kalimantan on 5-6 of September 2013 and Central Kalimantan on 2-3 of September 2013, FORINA were collected various tabular and spatial data from Ministry of Forestry’s units, regional Orangutan Forum (such as: FOKUS, FORA, FOKKAB, FORKAH and KORAN), local governments and conservation organizations, academia and private sectors. In total 222 organizations were participated in the evaluation process events that funded by IFACS-USAID. Based on these inputs, FORINA established online database and spatial database on website (Web-GIS) of orangutan (can be access at webgis.forina.or.id). The online database system was collected orangutan in rehabilitation center information, human-orangutan conflict data, andsurvey information conducted by the entire FORINA network, such as: transect location, transect observations, nest decay, and other related orangutan survey site
information. Meanwhile, the Web-GIS was consisting of: latest orangutan distribution and other supporting data, such as: forest cover, concessions, peat areas and land use maps.
4. Pre-PHVA Workshop
FORINA facilitated regional Pre-PHVA workshop to gather additional information relate on latest Orangutan distribution and threats in West Kalimantan on 15-16 of June 2015, Central Kalimantan on 24-25 of June 2015, North Sumatera and Aceh on 29-30 of September 2015 with in total 176 people were participated. Meanwhile, the national Pre-PHVA workshop was conducted in Bogor on 23-27 of May 2016 and participated by 85 people. In the workshops, the participants discussed relevant data or information in each population, source of information and method to verify the information. The Pre-PHVA workshops resulted confirmationand completed maps on orangutan distribution in Sumatera and Kalimantan aswellasidentifiedthreatsforOrangutansustainability in each population.
98 Orangutan Population and Habitat Viability Assessment

Steering Committee
NO POSITION NAME INSTITUTION
1 Patron Tachrir Fathoni, Ph.D.Director General of Ecosystems and Nature Resources Conservation, Ministry of Environment and Forestry
2 Chief Bambang Dahono Adji Director of Biodiversity Conservation, Ministry of Environment and Forestry
3
Member
Hari Sutrisno, Ph.D. Biological Research Center, Indonesian Institute of Sciences
4 Prof. Jatna Supriatna, Ph.D. Indonesian Academy of Sciences
5 Jito Sugardjito, Ph.D. Universitas Nasional
6 Prof. Ris. Dr. M. BismarkResearch, Development and Inno-vation, Ministry of Environment and Forestry
7 Noviar Andayani, Ph.D. University of Indonesia
8 Puja Utama Directorate of Biodiversity Conservation, Ministry of Environment and Forestry
9 Samedi, Ph.D. KEHATI Foundation
10 Sri Suci Utami Atmoko, Ph.D. FORINA-UNAS
11 Wahjudi Wardojo The Nature Conservancy
Organizing Committee
NO POSITION NAME INSTITUTION
1 Patron Tachrir Fathoni, Ph.D.Director General of Ecosystems and Nature Resources Conservation, Ministry of Environment and Forestry
2
Supervisor
Bambang Dahono AdjiDirector of Biodiversity Conservation, Ministry of Environment and Forestry
3 Puja Utama Ministry of Environment and Forestry
4 Herry Djoko Susilo FORINA
5 Chief I Aldrianto Priadjati, Ph.D. FORINA
6 Chief II Badiah Achmad Ministry of Environment and Forestry
7 Secretariat Coordinator Ermayanti. FORINA
8Secretariat Members
Febriany Iskandar Ministry of Environment and Forestry
9 Drajat Dwi Hartono Ministry of Environment and Forestry
10Treasurers
Frida Mindasari Saanin FORINA
11 Rini Aryani Ministry of Environment and Forestry
12 Plenary Coordinator Dr. Pahrian Siregar FORINA
Appendix IIPHVA collaborators
99Orangutan Population and Habitat Viability Assessment
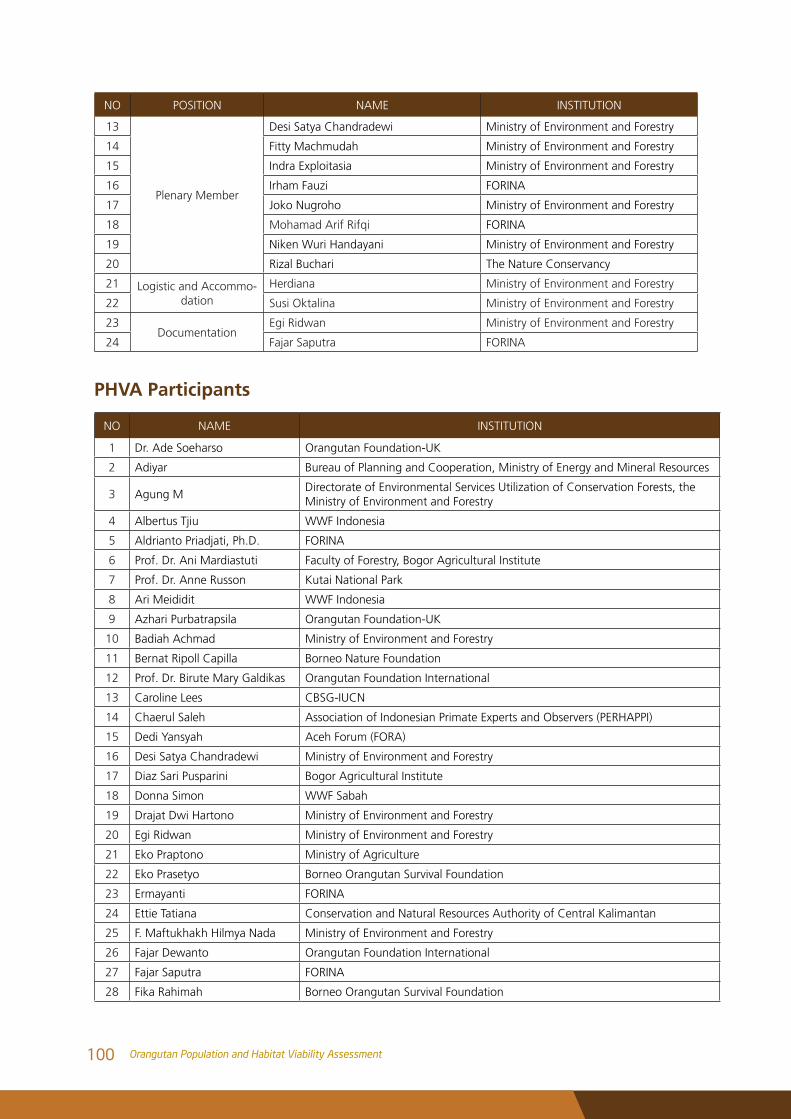
NO POSITION NAME INSTITUTION
13
Plenary Member
Desi Satya Chandradewi Ministry of Environment and Forestry
14 Fitty Machmudah Ministry of Environment and Forestry
15 Indra Exploitasia Ministry of Environment and Forestry
16 Irham Fauzi FORINA
17 Joko Nugroho Ministry of Environment and Forestry
18 Mohamad Arif Rifqi FORINA
19 Niken Wuri Handayani Ministry of Environment and Forestry
20 Rizal Buchari The Nature Conservancy
21 Logistic and Accommo-dation
Herdiana Ministry of Environment and Forestry
22 Susi Oktalina Ministry of Environment and Forestry
23Documentation
Egi Ridwan Ministry of Environment and Forestry
24 Fajar Saputra FORINA
PHVA Participants
NO NAME INSTITUTION
1 Dr. Ade Soeharso Orangutan Foundation-UK
2 Adiyar Bureau of Planning and Cooperation, Ministry of Energy and Mineral Resources
3 Agung MDirectorate of Environmental Services Utilization of Conservation Forests, the Ministry of Environment and Forestry
4 Albertus Tjiu WWF Indonesia
5 Aldrianto Priadjati, Ph.D. FORINA
6 Prof. Dr. Ani Mardiastuti Faculty of Forestry, Bogor Agricultural Institute
7 Prof. Dr. Anne Russon Kutai National Park
8 Ari Meididit WWF Indonesia
9 Azhari Purbatrapsila Orangutan Foundation-UK
10 Badiah Achmad Ministry of Environment and Forestry
11 Bernat Ripoll Capilla Borneo Nature Foundation
12 Prof. Dr. Birute Mary Galdikas Orangutan Foundation International
13 Caroline Lees CBSG-IUCN
14 Chaerul Saleh Association of Indonesian Primate Experts and Observers (PERHAPPI)
15 Dedi Yansyah Aceh Forum (FORA)
16 Desi Satya Chandradewi Ministry of Environment and Forestry
17 Diaz Sari Pusparini Bogor Agricultural Institute
18 Donna Simon WWF Sabah
19 Drajat Dwi Hartono Ministry of Environment and Forestry
20 Egi Ridwan Ministry of Environment and Forestry
21 Eko Praptono Ministry of Agriculture
22 Eko Prasetyo Borneo Orangutan Survival Foundation
23 Ermayanti FORINA
24 Ettie Tatiana Conservation and Natural Resources Authority of Central Kalimantan
25 F. Maftukhakh Hilmya Nada Ministry of Environment and Forestry
26 Fajar Dewanto Orangutan Foundation International
27 Fajar Saputra FORINA
28 Fika Rahimah Borneo Orangutan Survival Foundation
100 Orangutan Population and Habitat Viability Assessment
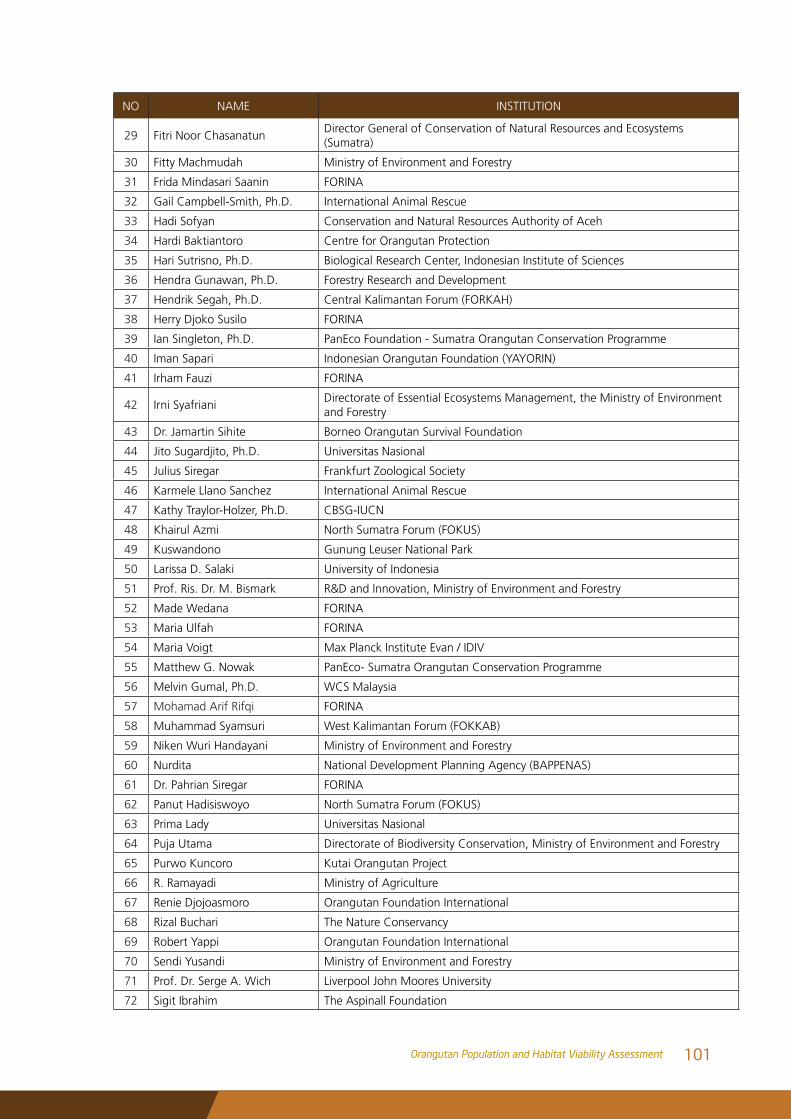
NO NAME INSTITUTION
29 Fitri Noor ChasanatunDirector General of Conservation of Natural Resources and Ecosystems (Sumatra)
30 Fitty Machmudah Ministry of Environment and Forestry
31 Frida Mindasari Saanin FORINA
32 Gail Campbell-Smith, Ph.D. International Animal Rescue
33 Hadi Sofyan Conservation and Natural Resources Authority of Aceh
34 Hardi Baktiantoro Centre for Orangutan Protection
35 Hari Sutrisno, Ph.D. Biological Research Center, Indonesian Institute of Sciences
36 Hendra Gunawan, Ph.D. Forestry Research and Development
37 Hendrik Segah, Ph.D. Central Kalimantan Forum (FORKAH)
38 Herry Djoko Susilo FORINA
39 Ian Singleton, Ph.D. PanEco Foundation - Sumatra Orangutan Conservation Programme
40 Iman Sapari Indonesian Orangutan Foundation (YAYORIN)
41 Irham Fauzi FORINA
42 Irni SyafrianiDirectorate of Essential Ecosystems Management, the Ministry of Environment and Forestry
43 Dr. Jamartin Sihite Borneo Orangutan Survival Foundation
44 Jito Sugardjito, Ph.D. Universitas Nasional
45 Julius Siregar Frankfurt Zoological Society
46 Karmele Llano Sanchez International Animal Rescue
47 Kathy Traylor-Holzer, Ph.D. CBSG-IUCN
48 Khairul Azmi North Sumatra Forum (FOKUS)
49 Kuswandono Gunung Leuser National Park
50 Larissa D. Salaki University of Indonesia
51 Prof. Ris. Dr. M. Bismark R&D and Innovation, Ministry of Environment and Forestry
52 Made Wedana FORINA
53 Maria Ulfah FORINA
54 Maria Voigt Max Planck Institute Evan / IDIV
55 Matthew G. Nowak PanEco- Sumatra Orangutan Conservation Programme
56 Melvin Gumal, Ph.D. WCS Malaysia
57 Mohamad Arif Rifqi FORINA
58 Muhammad Syamsuri West Kalimantan Forum (FOKKAB)
59 Niken Wuri Handayani Ministry of Environment and Forestry
60 Nurdita National Development Planning Agency (BAPPENAS)
61 Dr. Pahrian Siregar FORINA
62 Panut Hadisiswoyo North Sumatra Forum (FOKUS)
63 Prima Lady Universitas Nasional
64 Puja Utama Directorate of Biodiversity Conservation, Ministry of Environment and Forestry
65 Purwo Kuncoro Kutai Orangutan Project
66 R. Ramayadi Ministry of Agriculture
67 Renie Djojoasmoro Orangutan Foundation International
68 Rizal Buchari The Nature Conservancy
69 Robert Yappi Orangutan Foundation International
70 Sendi Yusandi Ministry of Environment and Forestry
71 Prof. Dr. Serge A. Wich Liverpool John Moores University
72 Sigit Ibrahim The Aspinall Foundation
101Orangutan Population and Habitat Viability Assessment
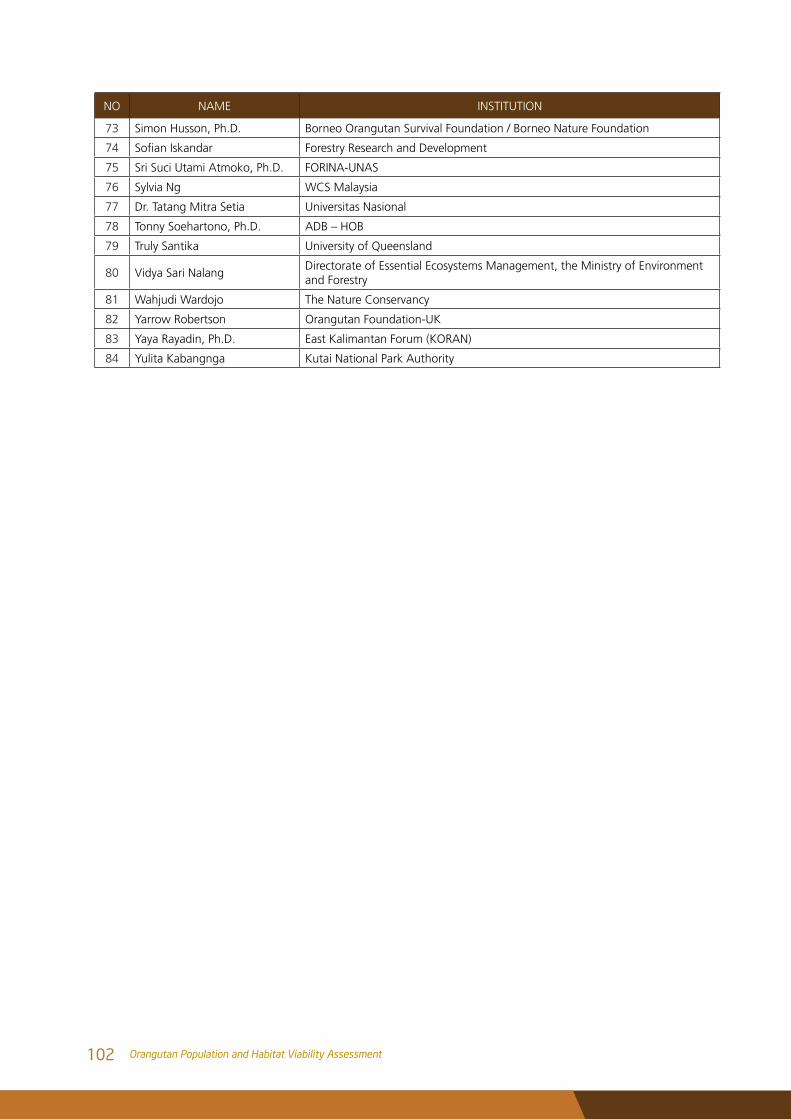
NO NAME INSTITUTION
73 Simon Husson, Ph.D. Borneo Orangutan Survival Foundation / Borneo Nature Foundation
74 SofianIskandar Forestry Research and Development
75 Sri Suci Utami Atmoko, Ph.D. FORINA-UNAS
76 Sylvia Ng WCS Malaysia
77 Dr. Tatang Mitra Setia Universitas Nasional
78 Tonny Soehartono, Ph.D. ADB – HOB
79 Truly Santika University of Queensland
80 Vidya Sari NalangDirectorate of Essential Ecosystems Management, the Ministry of Environment and Forestry
81 Wahjudi Wardojo The Nature Conservancy
82 Yarrow Robertson Orangutan Foundation-UK
83 Yaya Rayadin, Ph.D. East Kalimantan Forum (KORAN)
84 Yulita Kabangnga Kutai National Park Authority
102 Orangutan Population and Habitat Viability Assessment
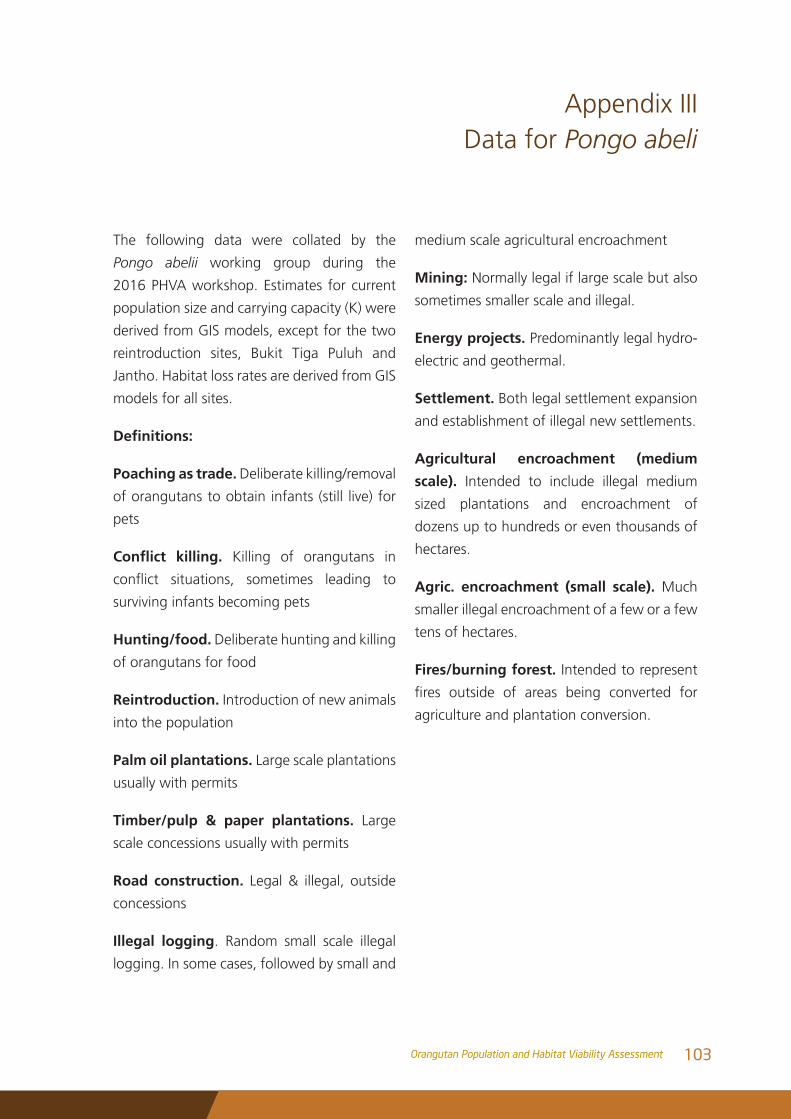
The following data were collated by the
Pongo abelii working group during the
2016 PHVA workshop. Estimates for current
population size and carrying capacity (K) were
derived from GIS models, except for the two
reintroduction sites, Bukit Tiga Puluh and
Jantho. Habitat loss rates are derived from GIS
models for all sites.
Definitions:
Poaching as trade. Deliberate killing/removal
of orangutans to obtain infants (still live) for
pets
Conflict killing. Killing of orangutans in
conflict situations, sometimes leading to
surviving infants becoming pets
Hunting/food. Deliberate hunting and killing
of orangutans for food
Reintroduction. Introduction of new animals
into the population
Palm oil plantations. Large scale plantations
usually with permits
Timber/pulp & paper plantations. Large
scale concessions usually with permits
Road construction. Legal & illegal, outside
concessions
Illegal logging. Random small scale illegal
logging. In some cases, followed by small and
medium scale agricultural encroachment
Mining: Normally legal if large scale but also
sometimes smaller scale and illegal.
Energy projects. Predominantly legal hydro-
electric and geothermal.
Settlement. Both legal settlement expansion
and establishment of illegal new settlements.
Agricultural encroachment (medium
scale). Intended to include illegal medium
sized plantations and encroachment of
dozens up to hundreds or even thousands of
hectares.
Agric. encroachment (small scale). Much
smaller illegal encroachment of a few or a few
tens of hectares.
Fires/burning forest. Intended to represent
fires outside of areas being converted for
agriculture and plantation conversion.
Appendix IIIData for Pongo abeli
103Orangutan Population and Habitat Viability Assessment
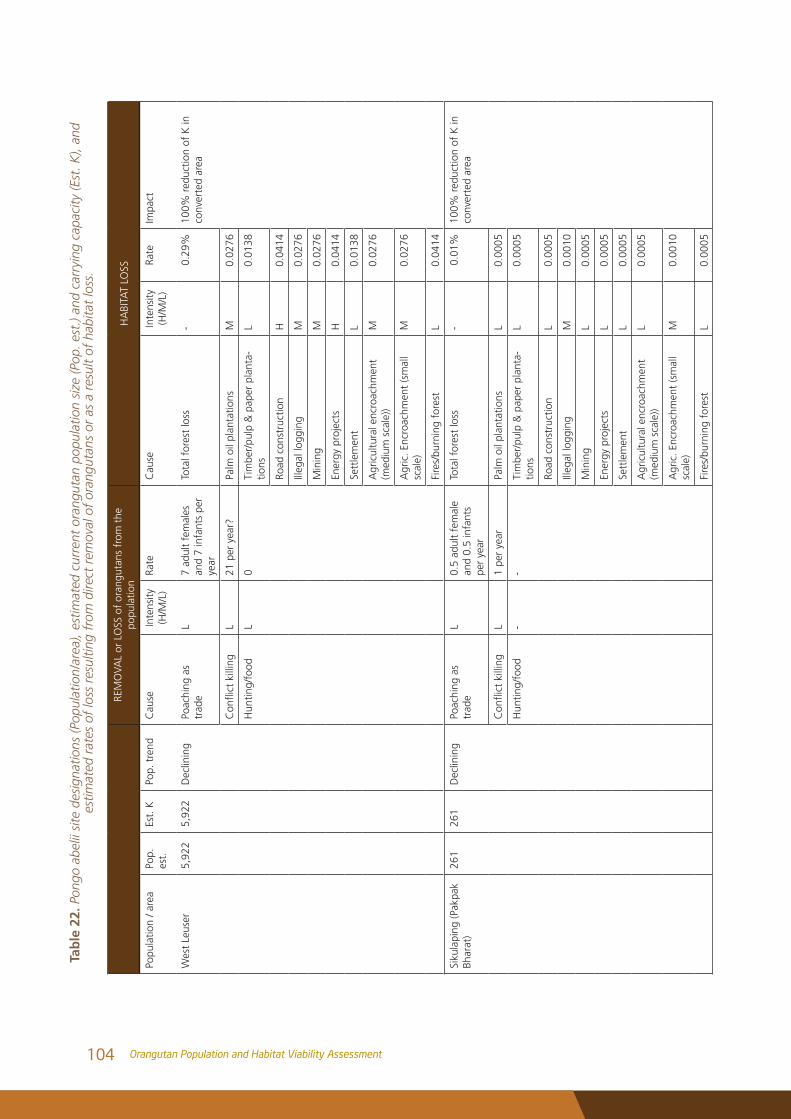
RE
MO
VAL
or L
OSS
of
oran
guta
ns f
rom
the
popu
latio
nH
ABI
TAT
LOSS
Popu
latio
n / a
rea
Pop.
es
t.
Est.
KPo
p. t
rend
Cau
seIn
tens
ity
(H/M
/L)
Rate
Cau
seIn
tens
ity
(H/M
/L)
Rate
Impa
ct
Wes
t Le
user
5,92
2
5,92
2
Dec
linin
g
Poac
hing
as
trad
eL
7 ad
ult
fem
ales
an
d 7
infa
nts
per
year
Tota
l for
est
loss
-0.
29%
100%
red
uctio
n of
K in
co
nver
ted
area
Conflictkilling
L21
per
yea
r?Pa
lm o
il pl
anta
tions
M0.
0276
Hun
ting/
food
L
0 Ti
mbe
r/pu
lp &
pap
er p
lant
a-tio
nsL
0.01
38
Road
con
stru
ctio
nH
0.04
14
Illeg
al lo
ggin
gM
0.02
76
Min
ing
M0.
0276
Ener
gy p
roje
cts
H0.
0414
Sett
lem
ent
L0.
0138
Agr
icul
tura
l enc
roac
hmen
t (m
ediu
m s
cale
))M
0.02
76
Agr
ic. E
ncro
achm
ent
(sm
all
scal
e)M
0.02
76
Fire
s/bu
rnin
g fo
rest
L0.
0414
Siku
lapi
ng (P
akpa
k Bh
arat
)26
1
261
D
eclin
ing
Po
achi
ng a
s tr
ade
L0.
5 ad
ult
fem
ale
and
0.5
infa
nts
per
year
Tota
l for
est
loss
-0.
01%
100%
red
uctio
n of
K in
co
nver
ted
area
Conflictkilling
L1
per
year
Palm
oil
plan
tatio
nsL
0.00
05
Hun
ting/
food
-
- Ti
mbe
r/pu
lp &
pap
er p
lant
a-tio
nsL
0.00
05
Road
con
stru
ctio
nL
0.00
05
Illeg
al lo
ggin
gM
0.00
10
Min
ing
L0.
0005
Ener
gy p
roje
cts
L0.
0005
Sett
lem
ent
L0.
0005
Agr
icul
tura
l enc
roac
hmen
t (m
ediu
m s
cale
))L
0.00
05
Agr
ic. E
ncro
achm
ent
(sm
all
scal
e)M
0.00
10
Fire
s/bu
rnin
g fo
rest
L0.
0005
Tab
le 2
2. P
ongo
abe
lii s
ite d
esig
natio
ns (P
opul
atio
n/ar
ea),
estim
ated
cur
rent
ora
ngut
an p
opul
atio
n si
ze (P
op. e
st.)
and
carr
ying
cap
acity
(Est
. K),
and
estim
ated
rat
es o
f lo
ss r
esul
ting
from
dire
ct r
emov
al o
f or
angu
tans
or
as a
res
ult
of h
abita
t lo
ss.
104 Orangutan Population and Habitat Viability Assessment
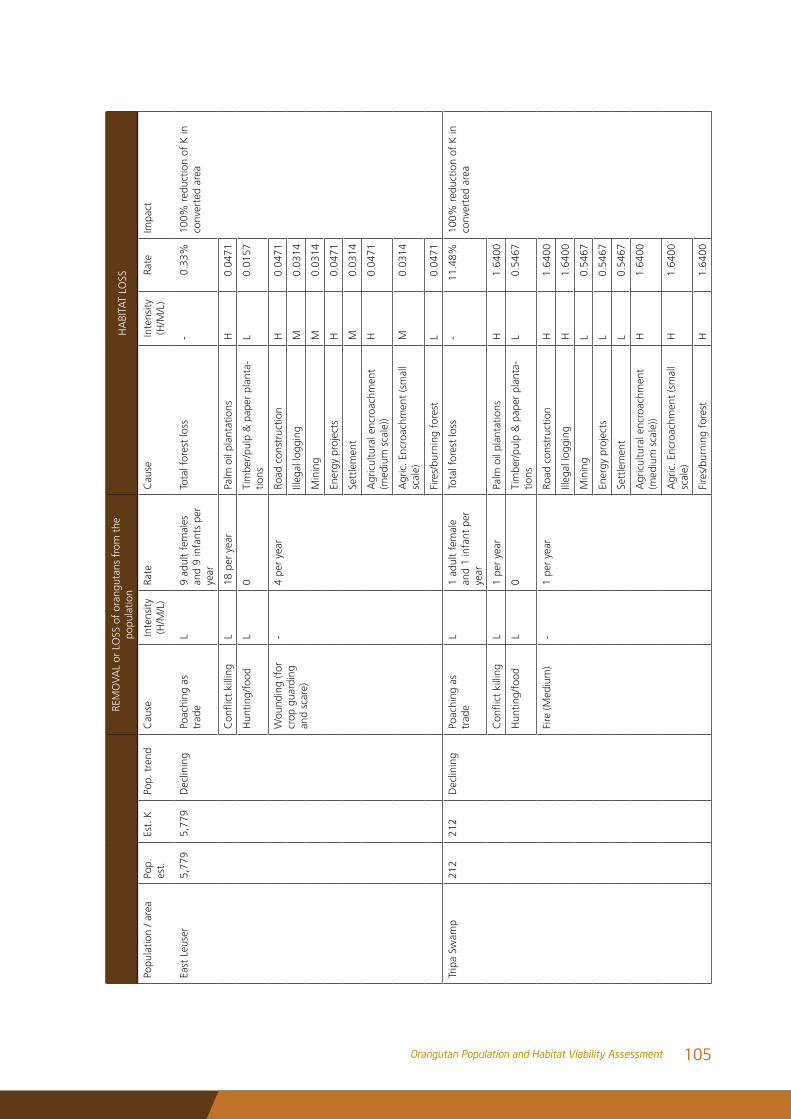
RE
MO
VAL
or L
OSS
of
oran
guta
ns f
rom
the
popu
latio
nH
ABI
TAT
LOSS
Popu
latio
n / a
rea
Pop.
es
t.
Est.
KPo
p. t
rend
Cau
seIn
tens
ity
(H/M
/L)
Rate
Cau
seIn
tens
ity
(H/M
/L)
Rate
Impa
ct
East
Leu
ser
5,77
9
5,77
9
Dec
linin
g
Poac
hing
as
trad
eL
9 ad
ult
fem
ales
an
d 9
infa
nts
per
year
Tota
l for
est
loss
-0.
33%
100%
red
uctio
n of
K in
co
nver
ted
area
Conflictkilling
L18
per
yea
rPa
lm o
il pl
anta
tions
H0.
0471
Hun
ting/
food
L0
Tim
ber/
pulp
& p
aper
pla
nta-
tions
L0.
0157
Wou
ndin
g (f
or
crop
gua
rdin
g an
d sc
are)
-
4 pe
r ye
ar
Road
con
stru
ctio
nH
0.04
71
Illeg
al lo
ggin
gM
0.03
14
Min
ing
M0.
0314
Ener
gy p
roje
cts
H0.
0471
Sett
lem
ent
M0.
0314
Agr
icul
tura
l enc
roac
hmen
t (m
ediu
m s
cale
))H
0.04
71
Agr
ic. E
ncro
achm
ent
(sm
all
scal
e)M
0.03
14
Fire
s/bu
rnin
g fo
rest
L0.
0471
Trip
a Sw
amp
212
21
2
Dec
linin
g
Poac
hing
as
trad
eL
1 ad
ult
fem
ale
and
1 in
fant
per
ye
ar
Tota
l for
est
loss
-11
.48%
100%
red
uctio
n of
K in
co
nver
ted
area
Conflictkilling
L1
per
year
Palm
oil
plan
tatio
nsH
1.64
00
Hun
ting/
food
L0
Tim
ber/
pulp
& p
aper
pla
nta-
tions
L0.
5467
Fire
(Med
ium
)
-
1 pe
r ye
ar
Road
con
stru
ctio
nH
1.64
00
Illeg
al lo
ggin
gH
1.64
00
Min
ing
L0.
5467
Ener
gy p
roje
cts
L0.
5467
Sett
lem
ent
L0.
5467
Agr
icul
tura
l enc
roac
hmen
t (m
ediu
m s
cale
))H
1.64
00
Agr
ic. E
ncro
achm
ent
(sm
all
scal
e)H
1.64
00
Fire
s/bu
rnin
g fo
rest
H1.
6400
105Orangutan Population and Habitat Viability Assessment
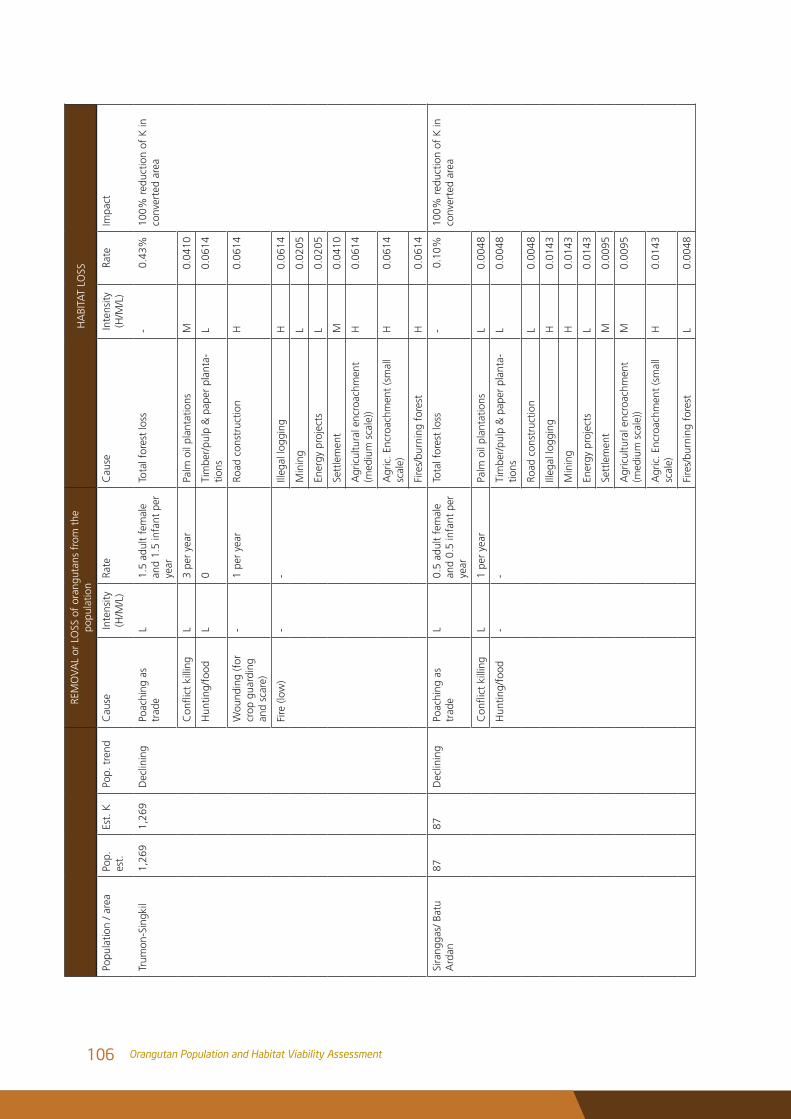
RE
MO
VAL
or L
OSS
of
oran
guta
ns f
rom
the
popu
latio
nH
ABI
TAT
LOSS
Popu
latio
n / a
rea
Pop.
es
t.
Est.
KPo
p. t
rend
Cau
seIn
tens
ity
(H/M
/L)
Rate
Cau
seIn
tens
ity
(H/M
/L)
Rate
Impa
ct
Trum
on-S
ingk
il1,
269
1,
269
D
eclin
ing
Po
achi
ng a
s tr
ade
L1.
5 ad
ult
fem
ale
and
1.5
infa
nt p
er
year
Tota
l for
est
loss
-0.
43%
100%
red
uctio
n of
K in
co
nver
ted
area
Conflictkilling
L3
per
year
Palm
oil
plan
tatio
nsM
0.04
10
Hun
ting/
food
L0
Tim
ber/
pulp
& p
aper
pla
nta-
tions
L0.
0614
Wou
ndin
g (f
or
crop
gua
rdin
g an
d sc
are)
-1
per
year
Road
con
stru
ctio
nH
0.06
14
Fire
(low
)
- -
Illeg
al lo
ggin
gH
0.06
14
Min
ing
L0.
0205
Ener
gy p
roje
cts
L0.
0205
Sett
lem
ent
M0.
0410
Agr
icul
tura
l enc
roac
hmen
t (m
ediu
m s
cale
))H
0.06
14
Agr
ic. E
ncro
achm
ent
(sm
all
scal
e)H
0.06
14
Fire
s/bu
rnin
g fo
rest
H0.
0614
Sira
ngga
s/ B
atu
Ard
an87
87 D
eclin
ing
Po
achi
ng a
s tr
ade
L0.
5 ad
ult
fem
ale
and
0.5
infa
nt p
er
year
Tota
l for
est
loss
-0.
10%
100%
red
uctio
n of
K in
co
nver
ted
area
Conflictkilling
L1
per
year
Palm
oil
plan
tatio
nsL
0.00
48
Hun
ting/
food
-
- Ti
mbe
r/pu
lp &
pap
er p
lant
a-tio
nsL
0.00
48
Road
con
stru
ctio
nL
0.00
48
Illeg
al lo
ggin
gH
0.01
43
Min
ing
H0.
0143
Ener
gy p
roje
cts
L0.
0143
Sett
lem
ent
M0.
0095
Agr
icul
tura
l enc
roac
hmen
t (m
ediu
m s
cale
))M
0.00
95
Agr
ic. E
ncro
achm
ent
(sm
all
scal
e)H
0.01
43
Fire
s/bu
rnin
g fo
rest
L0.
0048
106 Orangutan Population and Habitat Viability Assessment
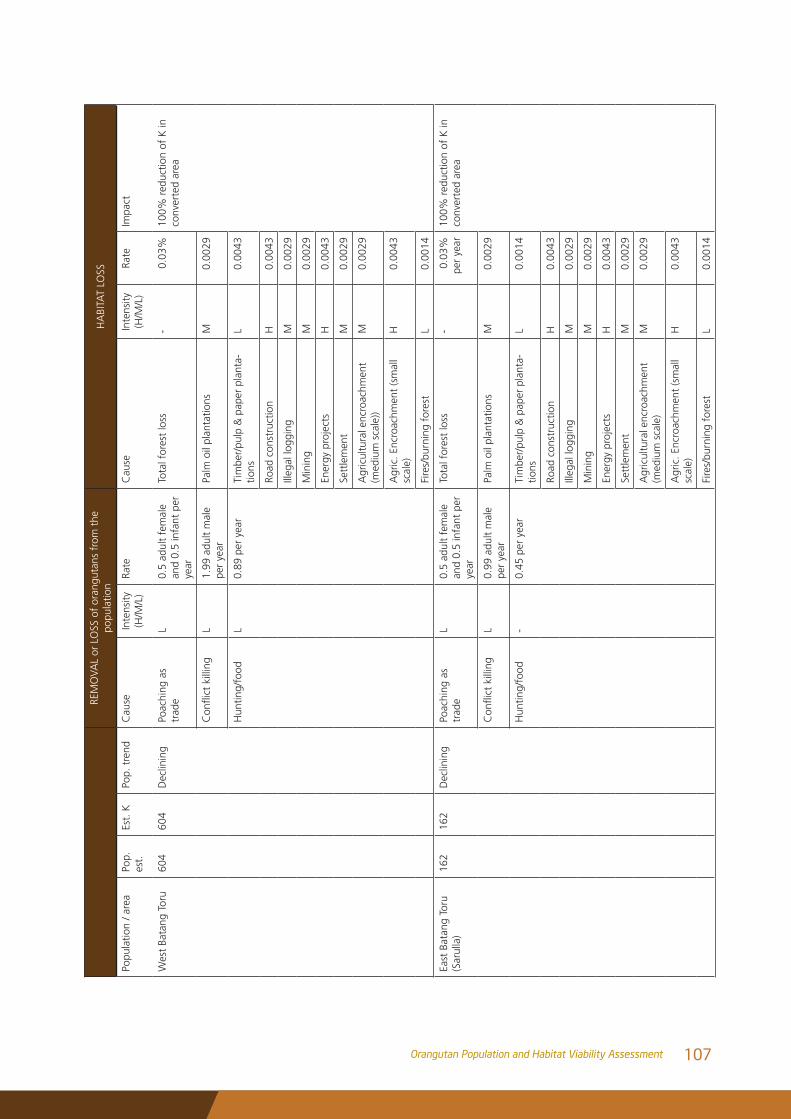
RE
MO
VAL
or L
OSS
of
oran
guta
ns f
rom
the
popu
latio
nH
ABI
TAT
LOSS
Popu
latio
n / a
rea
Pop.
es
t.
Est.
KPo
p. t
rend
Cau
seIn
tens
ity
(H/M
/L)
Rate
Cau
seIn
tens
ity
(H/M
/L)
Rate
Impa
ct
Wes
t Ba
tang
Tor
u60
4
604
D
eclin
ing
Po
achi
ng a
s tr
ade
L0.
5 ad
ult
fem
ale
and
0.5
infa
nt p
er
year
Tota
l for
est
loss
-0.
03%
100%
red
uctio
n of
K in
co
nver
ted
area
Conflictkilling
L1.
99 a
dult
mal
e pe
r ye
arPa
lm o
il pl
anta
tions
M0.
0029
Hun
ting/
food
L
0.89
per
yea
r
Tim
ber/
pulp
& p
aper
pla
nta-
tions
L0.
0043
Road
con
stru
ctio
nH
0.00
43
Illeg
al lo
ggin
gM
0.00
29
Min
ing
M0.
0029
Ener
gy p
roje
cts
H0.
0043
Sett
lem
ent
M0.
0029
Agr
icul
tura
l enc
roac
hmen
t (m
ediu
m s
cale
))M
0.00
29
Agr
ic. E
ncro
achm
ent
(sm
all
scal
e)H
0.00
43
Fire
s/bu
rnin
g fo
rest
L0.
0014
East
Bat
ang
Toru
(S
arul
la)
162
16
2
Dec
linin
g
Poac
hing
as
trad
eL
0.5
adul
t fe
mal
e an
d 0.
5 in
fant
per
ye
ar
Tota
l for
est
loss
-0.
03%
pe
r ye
ar10
0% r
educ
tion
of K
in
conv
erte
d ar
ea
Conflictkilling
L0.
99 a
dult
mal
e pe
r ye
arPa
lm o
il pl
anta
tions
M0.
0029
Hun
ting/
food
-
0.45
per
yea
r
Tim
ber/
pulp
& p
aper
pla
nta-
tions
L0.
0014
Road
con
stru
ctio
nH
0.00
43
Illeg
al lo
ggin
gM
0.00
29
Min
ing
M0.
0029
Ener
gy p
roje
cts
H0.
0043
Sett
lem
ent
M0.
0029
Agr
icul
tura
l enc
roac
hmen
t (m
ediu
m s
cale
)M
0.00
29
Agr
ic. E
ncro
achm
ent
(sm
all
scal
e)H
0.00
43
Fire
s/bu
rnin
g fo
rest
L0.
0014
107Orangutan Population and Habitat Viability Assessment
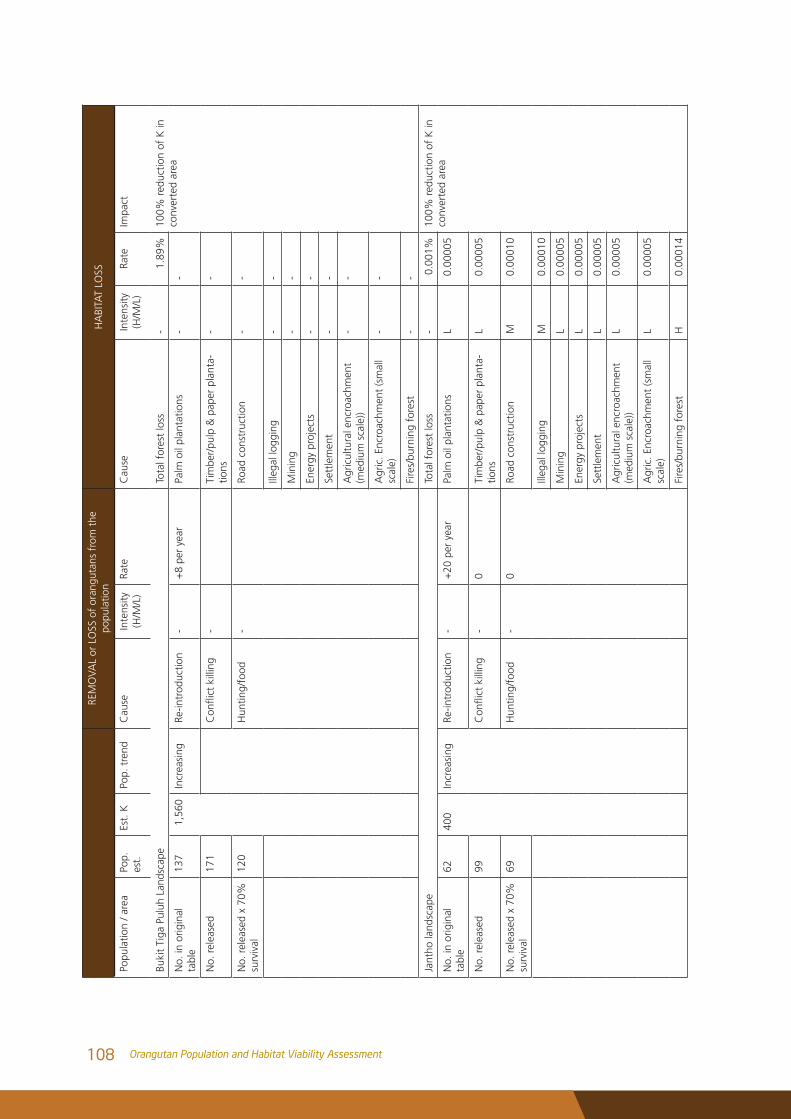
RE
MO
VAL
or L
OSS
of
oran
guta
ns f
rom
the
popu
latio
nH
ABI
TAT
LOSS
Popu
latio
n / a
rea
Pop.
es
t.
Est.
KPo
p. t
rend
Cau
seIn
tens
ity
(H/M
/L)
Rate
Cau
seIn
tens
ity
(H/M
/L)
Rate
Impa
ct
Buki
t Ti
ga P
uluh
Lan
dsca
peTo
tal f
ores
t lo
ss-
1.89
%10
0% r
educ
tion
of K
in
conv
erte
d ar
eaN
o. in
orig
inal
ta
ble
137
1,56
0
Incr
easi
ngRe
-intr
oduc
tion
-+
8 pe
r ye
arPa
lm o
il pl
anta
tions
--
No.
rel
ease
d17
1
Conflictkilling
-Ti
mbe
r/pu
lp &
pap
er p
lant
a-tio
ns-
-
No.
rel
ease
d x
70%
su
rviv
al12
0H
untin
g/fo
od
-
Road
con
stru
ctio
n-
-
Ill
egal
logg
ing
--
Min
ing
--
Ener
gy p
roje
cts
--
Sett
lem
ent
--
Agr
icul
tura
l enc
roac
hmen
t (m
ediu
m s
cale
))-
-
Agr
ic. E
ncro
achm
ent
(sm
all
scal
e)-
-
Fire
s/bu
rnin
g fo
rest
--
Jant
ho la
ndsc
ape
Tota
l for
est
loss
-0.
001%
100%
red
uctio
n of
K in
co
nver
ted
area
No.
in o
rigin
al
tabl
e62
400
Incr
easi
ngRe
-intr
oduc
tion
-+
20 p
er y
ear
Palm
oil
plan
tatio
nsL
0.00
005
No.
rel
ease
d99
Conflictkilling
-0
Tim
ber/
pulp
& p
aper
pla
nta-
tions
L0.
0000
5
No.
rel
ease
d x
70%
su
rviv
al69
Hun
ting/
food
-0
Road
con
stru
ctio
nM
0.00
010
Illeg
al lo
ggin
gM
0.00
010
Min
ing
L0.
0000
5
Ener
gy p
roje
cts
L0.
0000
5
Sett
lem
ent
L0.
0000
5
Agr
icul
tura
l enc
roac
hmen
t (m
ediu
m s
cale
))L
0.00
005
Agr
ic. E
ncro
achm
ent
(sm
all
scal
e)L
0.00
005
Fire
s/bu
rnin
g fo
rest
H0.
0001
4
108 Orangutan Population and Habitat Viability Assessment
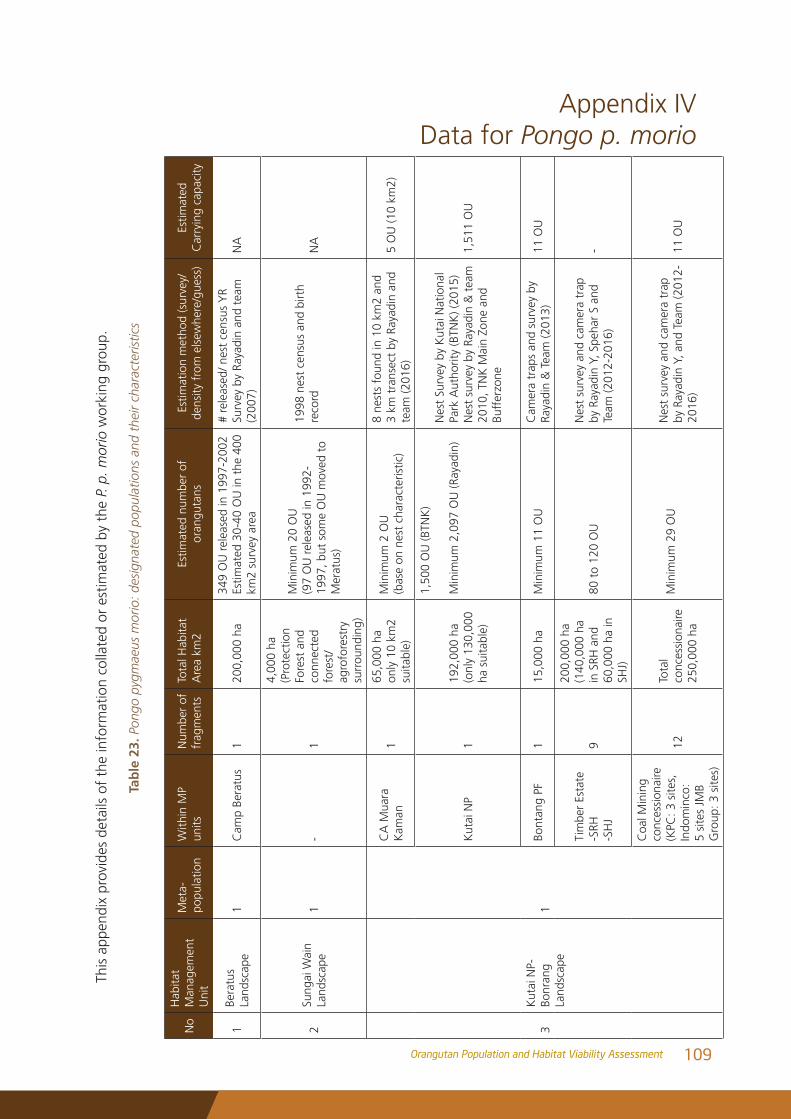
No
Hab
itat
Man
agem
ent
Uni
t
Met
a-po
pula
tion
With
in M
P un
itsN
umbe
r of
fr
agm
ents
Tota
l Hab
itat
Are
a km
2Es
timat
ed n
umbe
r of
or
angu
tans
Estim
atio
n m
etho
d (s
urve
y/de
nsity
fro
m e
lsew
here
/gue
ss)
Estim
ated
C
arry
ing
capa
city
1Be
ratu
s La
ndsc
ape
1C
amp
Bera
tus
120
0,00
0 ha
349
OU
rel
ease
d in
199
7-20
02Es
timat
ed 3
0-40
OU
in t
he 4
00
km2
surv
ey a
rea
# re
leas
ed/ n
est
cens
us Y
RSu
rvey
by
Raya
din
and
team
(2
007)
NA
2Su
ngai
Wai
n La
ndsc
ape
1-
1
4,00
0 ha
(Pro
tect
ion
Fore
st a
nd
conn
ecte
d fo
rest
/ ag
rofo
rest
ry
surr
ound
ing)
Min
imum
20
OU
(97
OU
rel
ease
d in
199
2-19
97, b
ut s
ome
OU
mov
ed t
o M
erat
us)
1998
nes
t ce
nsus
and
birt
h re
cord
NA
3K
utai
NP-
Bonr
ang
Land
scap
e1
CA
Mua
ra
Kam
an1
65,0
00 h
a
only
10
km2
suita
ble)
Min
imum
2 O
U(b
ase
on n
est
char
acte
ristic
)
8 ne
sts
foun
d in
10
km2
and
3 km
tra
nsec
t by
Ray
adin
and
te
am (2
016)
5
OU
(10
km2)
Kut
ai N
P1
192,
000
ha(o
nly
130,
000
ha s
uita
ble)
1,50
0 O
U (B
TNK
)
Min
imum
2,0
97 O
U (R
ayad
in)
Nes
t Su
rvey
by
Kut
ai N
atio
nal
Park
Aut
horit
y (B
TNK
) (20
15)
Nes
t su
rvey
by
Raya
din
& t
eam
20
10, T
NK
Mai
n Zo
ne a
nd
Buff
erzo
ne
1,51
1 O
U
Bont
ang
PF1
15,0
00 h
aM
inim
um 1
1 O
UC
amer
a tr
aps
and
surv
ey b
y Ra
yadi
n &
Tea
m (2
013)
11 O
U
Tim
ber
Esta
te-S
RH
-SH
J9
200,
000
ha(1
40,0
00 h
a in
SRH
and
60
,000
ha
in
SHJ)
80 t
o 12
0 O
UN
est
surv
ey a
nd c
amer
a tr
ap
by R
ayad
in Y
, Spe
har
S an
d Te
am (2
012-
2016
)-
Coa
l Min
ing
conc
essi
onai
re
(KPC
: 3 s
ites,
Indo
min
co:
5 si
tes
JMB
Gro
up: 3
site
s)
12To
tal
conc
essi
onai
re
250,
000
ha
Min
imum
29
OU
Nes
t su
rvey
and
cam
era
trap
by
Ray
adin
Y, a
nd T
eam
(201
2-20
16)
11 O
U
Appendix IVData for Pongo p. morio
This
app
endi
x pr
ovid
es d
etai
ls o
f th
e in
form
atio
n co
llate
d or
est
imat
ed b
y th
e P.
p. m
orio
wor
king
gro
up.
Tab
le 2
3. P
ongo
pyg
mae
us m
orio
: des
igna
ted
popu
latio
ns a
nd t
heir
char
acte
ristic
s
109Orangutan Population and Habitat Viability Assessment
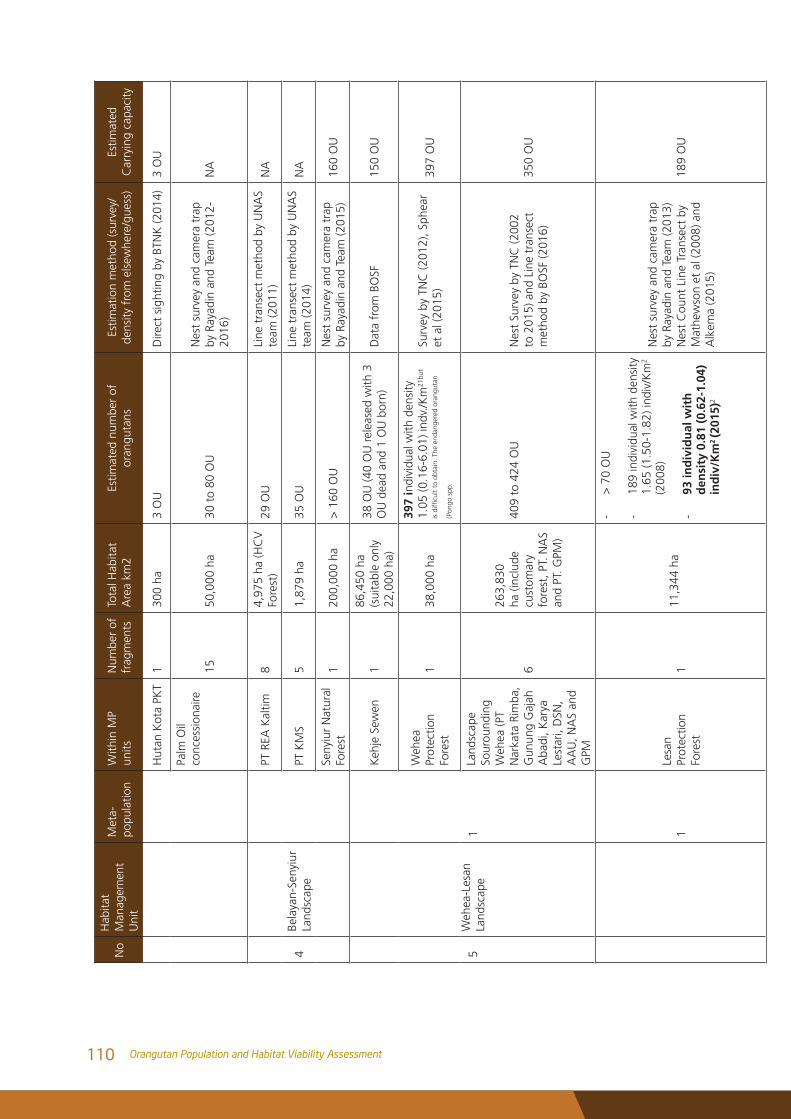
No
Hab
itat
Man
agem
ent
Uni
t
Met
a-po
pula
tion
With
in M
P un
itsN
umbe
r of
fr
agm
ents
Tota
l Hab
itat
Are
a km
2Es
timat
ed n
umbe
r of
or
angu
tans
Estim
atio
n m
etho
d (s
urve
y/de
nsity
fro
m e
lsew
here
/gue
ss)
Estim
ated
C
arry
ing
capa
city
Hut
an K
ota
PKT
130
0 ha
3 O
UD
irect
sig
htin
g by
BTN
K (2
014)
3 O
U
Palm
Oil
conc
essi
onai
re15
50,0
00 h
a30
to
80 O
UN
est
surv
ey a
nd c
amer
a tr
ap
by R
ayad
in a
nd T
eam
(201
2-20
16)
NA
4Be
laya
n-Se
nyiu
r La
ndsc
ape
PT R
EA K
altim
84,
975
ha (H
CV
Fo
rest
)29
OU
Line
tra
nsec
t m
etho
d by
UN
AS
team
(201
1)N
A
PT K
MS
51,
879
ha35
OU
Line
tra
nsec
t m
etho
d by
UN
AS
team
(201
4)N
A
Seny
iur
Nat
ural
Fo
rest
120
0,00
0 ha
> 1
60 O
UN
est
surv
ey a
nd c
amer
a tr
ap
by R
ayad
in a
nd T
eam
(201
5)16
0 O
U
5W
ehea
-Les
an
Land
scap
e1
Keh
je S
ewen
186
,450
ha
(sui
tabl
e on
ly
22,0
00 h
a)
38 O
U (4
0 O
U r
elea
sed
with
3
OU
dea
d an
d 1
OU
bor
n)D
ata
from
BO
SF15
0 O
U
Weh
ea
Prot
ectio
n Fo
rest
138
,000
ha
397
indi
vidu
al w
ith d
ensi
ty
1.05
(0.1
6-6.
01) i
ndv.
/Km
21bu
t
isdifficulttoobtain.Theendangeredorangutan
(Pon
go s
pp.
Surv
ey b
y TN
C (2
012)
, Sph
ear
et a
l (20
15)
397
OU
Land
scap
e So
urou
ndin
g W
ehea
(PT
Nar
kata
Rim
ba,
Gun
ung
Gaj
ah
Aba
di, K
arya
Le
star
i, D
SN,
AA
U, N
AS
and
GPM
6
263,
830
ha (i
nclu
de
cust
omar
y fo
rest
, PT.
NA
S an
d PT
. GPM
)
409
to 4
24 O
UN
est
Surv
ey b
y TN
C (2
002
to 2
015)
and
Lin
e tr
anse
ct
met
hod
by B
OSF
(201
6)35
0 O
U
1Le
san
Prot
ectio
n Fo
rest
111
,344
ha
- >
70
OU
- 18
9 in
divi
dual
with
den
sity
1.
65 (1
.50-
1.82
) ind
iv/K
m2
(200
8)
- 93
ind
ivid
ual
wit
h
den
sity
0.8
1 (0
.62-
1.04
) in
div
/Km
2 (2
015)
2
Nes
t su
rvey
and
cam
era
trap
by
Ray
adin
and
Tea
m (2
013)
Nes
t C
ount
Lin
e Tr
anse
ct b
y M
athe
wso
n et
al (
2008
) and
A
lkem
a (2
015)
189
OU
110 Orangutan Population and Habitat Viability Assessment
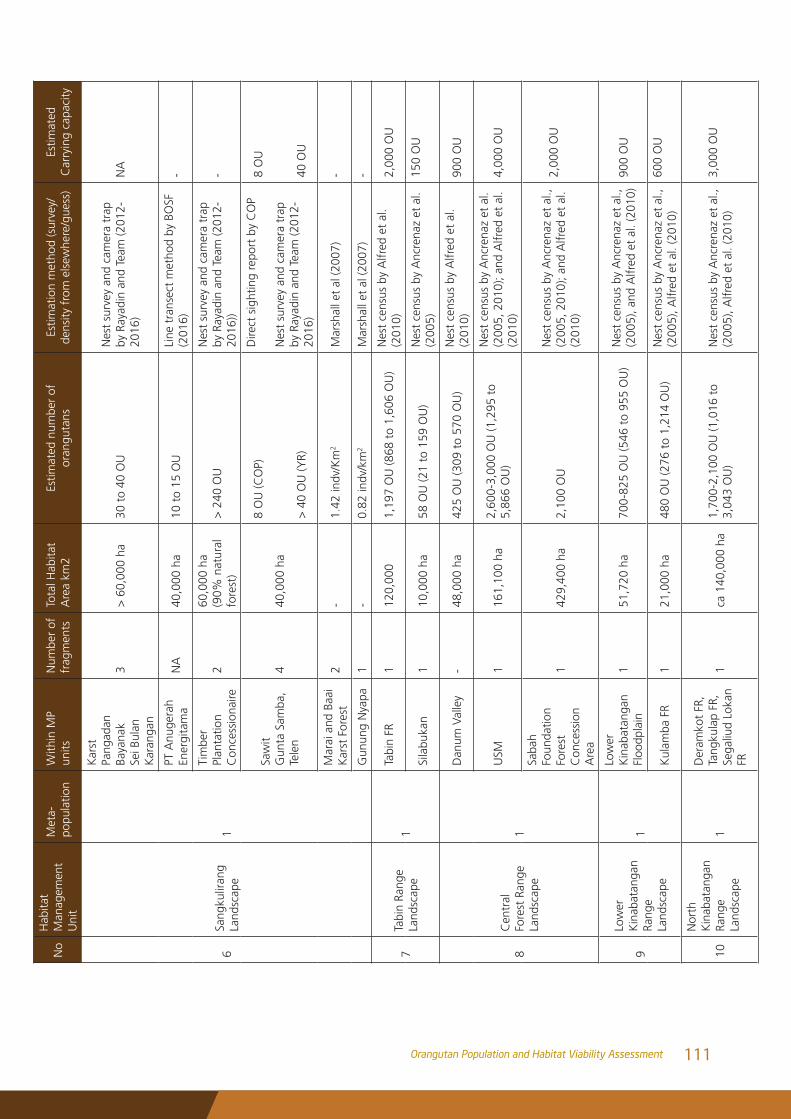
No
Hab
itat
Man
agem
ent
Uni
t
Met
a-po
pula
tion
With
in M
P un
itsN
umbe
r of
fr
agm
ents
Tota
l Hab
itat
Are
a km
2Es
timat
ed n
umbe
r of
or
angu
tans
Estim
atio
n m
etho
d (s
urve
y/de
nsity
fro
m e
lsew
here
/gue
ss)
Estim
ated
C
arry
ing
capa
city
6Sa
ngku
liran
g La
ndsc
ape
1
Kar
stPa
ngad
anBa
yana
kSe
i Bul
anK
aran
gan
3>
60,
000
ha30
to
40 O
UN
est
surv
ey a
nd c
amer
a tr
ap
by R
ayad
in a
nd T
eam
(201
2-20
16)
NA
PT A
nuge
rah
Ener
gita
ma
NA
40,0
00 h
a10
to
15 O
ULi
ne t
rans
ect
met
hod
by B
OSF
(2
016)
-
Tim
ber
Plan
tatio
n C
once
ssio
naire
2
60,0
00 h
a(9
0% n
atur
al
fore
st)
> 2
40 O
UN
est
surv
ey a
nd c
amer
a tr
ap
by R
ayad
in a
nd T
eam
(201
2-20
16))
-
Saw
it G
unta
Sam
ba,
Tele
n4
40,0
00 h
a
8 O
U (C
OP)
> 4
0 O
U (Y
R)
Dire
ct s
ight
ing
repo
rt b
y C
OP
Nes
t su
rvey
and
cam
era
trap
by
Ray
adin
and
Tea
m (2
012-
2016
)
8 O
U
40 O
U
Mar
ai a
nd B
aai
Kar
st F
ores
t2
-1.
42 in
dv/K
m2
Mar
shal
l et
al (2
007)
-
Gun
ung
Nya
pa1
-0.
82 in
dv/k
m2
Mar
shal
l et
al (2
007)
-
7Ta
bin
Rang
e La
ndsc
ape
1Ta
bin
FR1
120,
000
1,19
7 O
U (8
68 t
o 1,
606
OU
)N
est
cens
us b
y A
lfred
et
al.
(201
0)2,
000
OU
Sila
buka
n1
10,0
00 h
a58
OU
(21
to 1
59 O
U)
Nes
t ce
nsus
by
Anc
rena
z et
al.
(200
5)15
0 O
U
8C
entr
al
Fore
st R
ange
La
ndsc
ape
1
Dan
um V
alle
y-
48,0
00 h
a42
5 O
U (3
09 t
o 57
0 O
U)
Nes
t ce
nsus
by
Alfr
ed e
t al
. (2
010)
900
OU
USM
116
1,10
0 ha
2,60
0-3,
000
OU
(1,2
95 t
o 5,
866
OU
)
Nes
t ce
nsus
by
Anc
rena
z et
al.
(200
5, 2
010)
; and
Alfr
ed e
t al
. (2
010)
4,00
0 O
U
Saba
h Fo
unda
tion
Fore
st
Con
cess
ion
Are
a
142
9,40
0 ha
2,10
0 O
UN
est
cens
us b
y A
ncre
naz
et a
l.,
(200
5, 2
010)
; and
Alfr
ed e
t al
. (2
010)
2,00
0 O
U
9
Low
er
Kin
abat
anga
n Ra
nge
Land
scap
e
1
Low
er
Kin
abat
anga
n Fl
oodp
lain
151
,720
ha
700-
825
OU
(546
to
955
OU
)N
est
cens
us b
y A
ncre
naz
et a
l.,
(200
5), a
nd A
lfred
et
al. (
2010
)90
0 O
U
Kul
amba
FR
121
,000
ha
480
OU
(276
to
1,21
4 O
U)
Nes
t ce
nsus
by
Anc
rena
z et
al.,
(2
005)
, Alfr
ed e
t al
. (20
10)
600
OU
10
Nor
th
Kin
abat
anga
n Ra
nge
Land
scap
e1
Der
amko
t FR
, Ta
ngku
lap
FR,
Sega
liud
Loka
n FR
1ca
140
,000
ha
1,70
0-2,
100
OU
(1,0
16 t
o 3,
043
OU
)N
est
cens
us b
y A
ncre
naz
et a
l.,
(200
5), A
lfred
et
al. (
2010
)3,
000
OU
111Orangutan Population and Habitat Viability Assessment
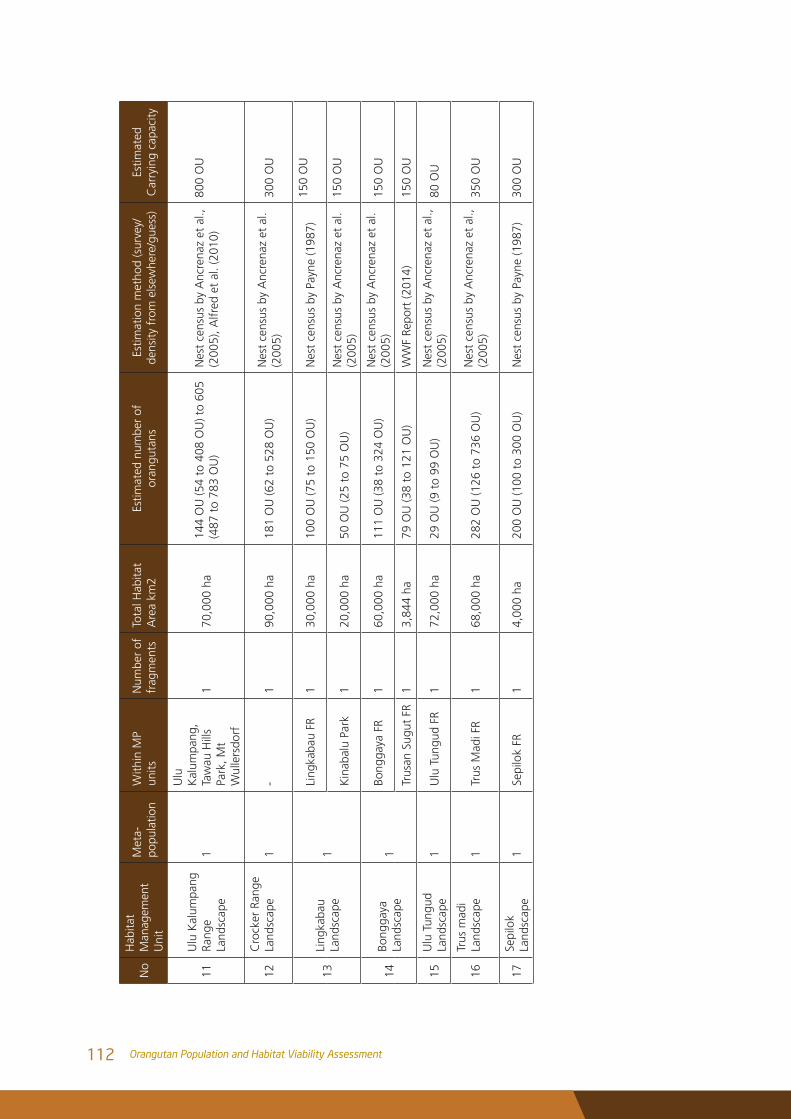
No
Hab
itat
Man
agem
ent
Uni
t
Met
a-po
pula
tion
With
in M
P un
itsN
umbe
r of
fr
agm
ents
Tota
l Hab
itat
Are
a km
2Es
timat
ed n
umbe
r of
or
angu
tans
Estim
atio
n m
etho
d (s
urve
y/de
nsity
fro
m e
lsew
here
/gue
ss)
Estim
ated
C
arry
ing
capa
city
11U
lu K
alum
pang
Ra
nge
Land
scap
e1
Ulu
K
alum
pang
, Ta
wau
Hill
s Pa
rk, M
t W
ulle
rsdo
rf
170
,000
ha
144
OU
(54
to 4
08 O
U) t
o 60
5 (4
87 t
o 78
3 O
U)
Nes
t ce
nsus
by
Anc
rena
z et
al.,
(2
005)
, Alfr
ed e
t al
. (20
10)
800
OU
12C
rock
er R
ange
La
ndsc
ape
1-
190
,000
ha
181
OU
(62
to 5
28 O
U)
Nes
t ce
nsus
by
Anc
rena
z et
al.
(200
5)30
0 O
U
13Li
ngka
bau
Land
scap
e1
Ling
kaba
u FR
130
,000
ha
100
OU
(75
to 1
50 O
U)
Nes
t ce
nsus
by
Payn
e (1
987)
150
OU
Kin
abal
u Pa
rk1
20,0
00 h
a50
OU
(25
to 7
5 O
U)
Nes
t ce
nsus
by
Anc
rena
z et
al.
(200
5)15
0 O
U
14Bo
ngga
ya
Land
scap
e1
Bong
gaya
FR
160
,000
ha
111
OU
(38
to 3
24 O
U)
Nes
t ce
nsus
by
Anc
rena
z et
al.
(200
5)15
0 O
U
Trus
an S
ugut
FR
13,
844
ha79
OU
(38
to 1
21 O
U)
WW
F Re
port
(201
4)15
0 O
U
15U
lu T
ungu
d La
ndsc
ape
1U
lu T
ungu
d FR
172
,000
ha
29 O
U (9
to
99 O
U)
Nes
t ce
nsus
by
Anc
rena
z et
al.,
(2
005)
80 O
U
16Tr
us m
adi
Land
scap
e1
Trus
Mad
i FR
168
,000
ha
282
OU
(126
to
736
OU
)N
est
cens
us b
y A
ncre
naz
et a
l.,
(200
5)35
0 O
U
17Se
pilo
k La
ndsc
ape
1Se
pilo
k FR
14,
000
ha20
0 O
U (1
00 t
o 30
0 O
U)
Nes
t ce
nsus
by
Payn
e (1
987)
300
OU
112 Orangutan Population and Habitat Viability Assessment
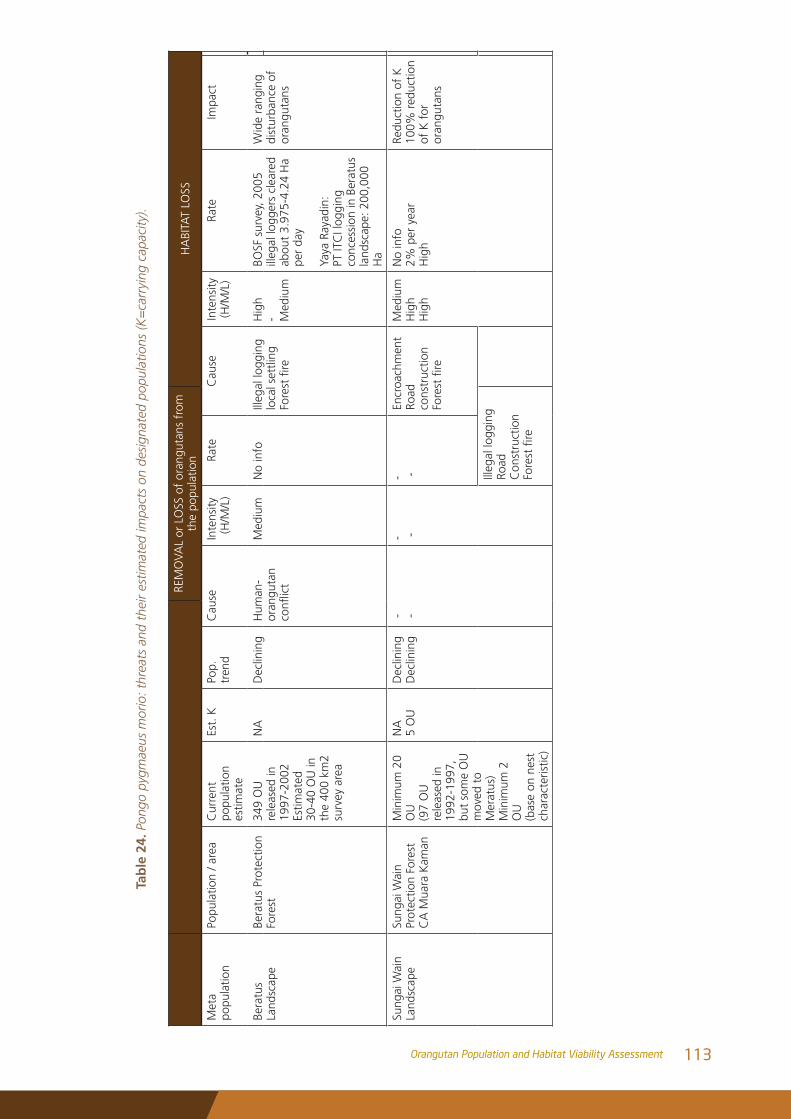
REM
OVA
L or
LO
SS o
f or
angu
tans
fro
m
the
popu
latio
nH
ABI
TAT
LOSS
Met
a po
pula
tion
Popu
latio
n / a
rea
Cur
rent
po
pula
tion
estim
ate
Est.
K
Pop.
tr
end
Cau
seIn
tens
ity(H
/M/L
)Ra
teC
ause
Inte
nsity
(H/M
/L)
Rate
Impa
ct
Bera
tus
Land
scap
eBe
ratu
s Pr
otec
tion
Fore
st34
9 O
U
rele
ased
in
1997
-200
2 Es
timat
ed
30-4
0 O
U in
th
e 40
0 km
2 su
rvey
are
a
NA
Dec
linin
gH
uman
-or
angu
tan
conflict
Med
ium
No
info
Illeg
al lo
ggin
g
loca
l set
tling
Forestfire
Hig
h - M
ediu
m
BOSF
sur
vey,
200
5ill
egal
logg
ers
clea
red
abou
t 3.
975-
4.24
Ha
per
day
Yaya
Ray
adin
: PT
ITC
I log
ging
co
nces
sion
in B
erat
us
land
scap
e: 2
00,0
00
Ha
Wid
e ra
ngin
g di
stur
banc
e of
or
angu
tans
Sung
ai W
ain
Land
scap
e Su
ngai
Wai
n Pr
otec
tion
Fore
stC
A M
uara
Kam
an
Min
imum
20
OU
(9
7 O
U
rele
ased
in
1992
-199
7,
but
som
e O
U
mov
ed t
o M
erat
us)
Min
imum
2
OU
(b
ase
on n
est
char
acte
ristic
)
NA
5 O
U
Dec
linin
gD
eclin
ing
- -- -
- -En
croa
chm
ent
Road
co
nstr
uctio
n Forestfire
Med
ium
H
igh
Hig
h
No
info
2%
per
yea
rH
igh
Redu
ctio
n of
K
100%
red
uctio
n of
K f
or
oran
guta
ns
Illeg
al lo
ggin
g Ro
ad
Con
stru
ctio
n Forestfire
Tab
le 2
4. P
ongo
pyg
mae
us m
orio
: thr
eats
and
the
ir es
timat
ed im
pact
s on
des
igna
ted
popu
latio
ns (K
=ca
rryi
ng c
apac
ity).
113Orangutan Population and Habitat Viability Assessment
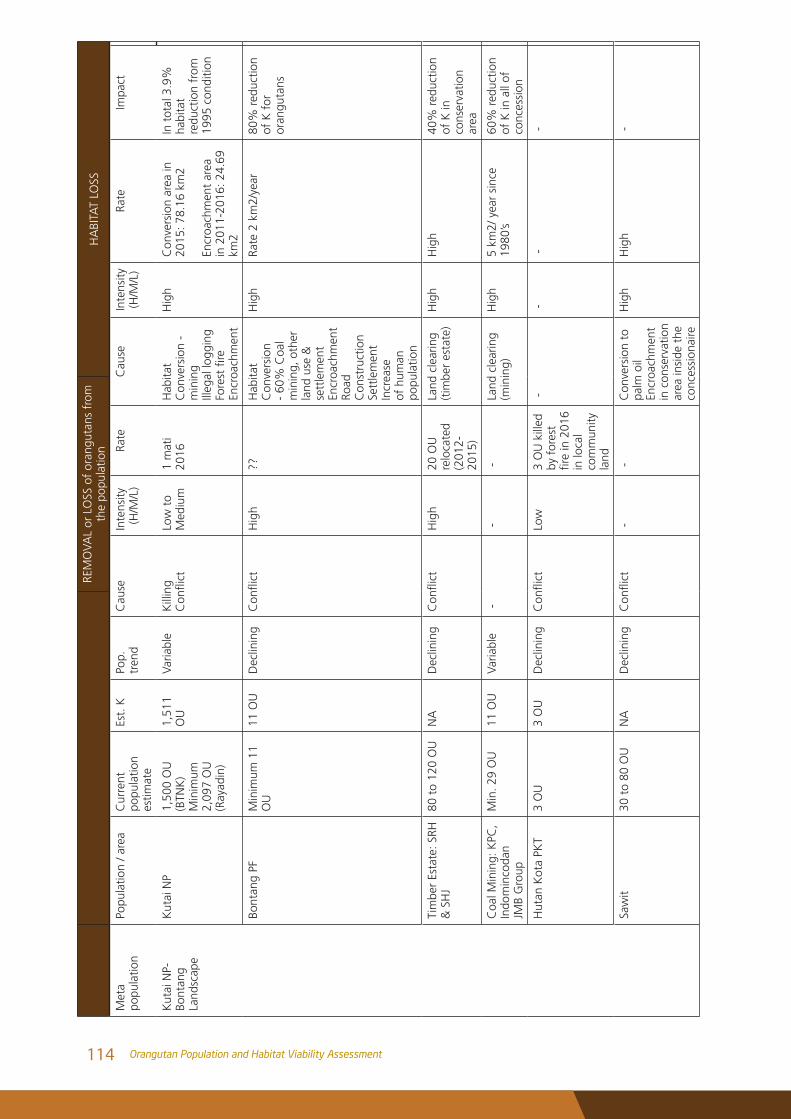
REM
OVA
L or
LO
SS o
f or
angu
tans
fro
m
the
popu
latio
nH
ABI
TAT
LOSS
Met
a po
pula
tion
Popu
latio
n / a
rea
Cur
rent
po
pula
tion
estim
ate
Est.
K
Pop.
tr
end
Cau
seIn
tens
ity(H
/M/L
)Ra
teC
ause
Inte
nsity
(H/M
/L)
Rate
Impa
ct
Kut
ai N
P-
Bont
ang
Land
scap
e
Kut
ai N
P1,
500
OU
(B
TNK
) M
inim
um
2,09
7 O
U
(Ray
adin
)
1,51
1 O
UVa
riabl
eK
illin
g Conflict
Low
to
Med
ium
1 m
ati
2016
Hab
itat
Con
vers
ion
- m
inin
g Ill
egal
logg
ing
Forestfire
En
croa
chm
ent
Hig
h C
onve
rsio
n ar
ea in
20
15: 7
8.16
km
2 En
croa
chm
ent
area
in
201
1-20
16: 2
4.69
km
2
In t
otal
3.9
%
habi
tat
redu
ctio
n fr
om
1995
con
ditio
n
Bont
ang
PFM
inim
um 1
1 O
U11
OU
Dec
linin
gConflict
Hig
h??
Hab
itat
Con
vers
ion
- 60
% C
oal
min
ing,
oth
er
land
use
&
sett
lem
ent
Encr
oach
men
t Ro
ad
Con
stru
ctio
n Se
ttle
men
t In
crea
se
of h
uman
po
pula
tion
Hig
hRa
te 2
km
2/ye
ar80
% r
educ
tion
of K
for
or
angu
tans
Tim
ber
Esta
te: S
RH
& S
HJ
80 t
o 12
0 O
UN
AD
eclin
ing
Conflict
Hig
h20
OU
re
loca
ted
(201
2-20
15)
Land
cle
arin
g (t
imbe
r es
tate
)H
igh
Hig
h40
% r
educ
tion
of K
in
cons
erva
tion
area
Coa
l Min
ing:
KPC
, In
dom
inco
dan
JMB
Gro
up
Min
. 29
OU
11 O
UVa
riabl
e -
- -
Land
cle
arin
g (m
inin
g)H
igh
5 km
2/ y
ear
sinc
e 19
80’s
60%
red
uctio
n of
K in
all
of
conc
essi
on
Hut
an K
ota
PKT
3 O
U3
OU
Dec
linin
gConflict
Low
3
OU
kill
ed
by f
ores
t firein2016
in lo
cal
com
mun
ity
land
- -
- -
Saw
it 30
to
80 O
UN
AD
eclin
ing
Conflict
- -
Con
vers
ion
to
palm
oil
Encr
oach
men
t in
con
serv
atio
n ar
ea in
side
the
co
nces
sion
aire
Hig
hH
igh
-
114 Orangutan Population and Habitat Viability Assessment
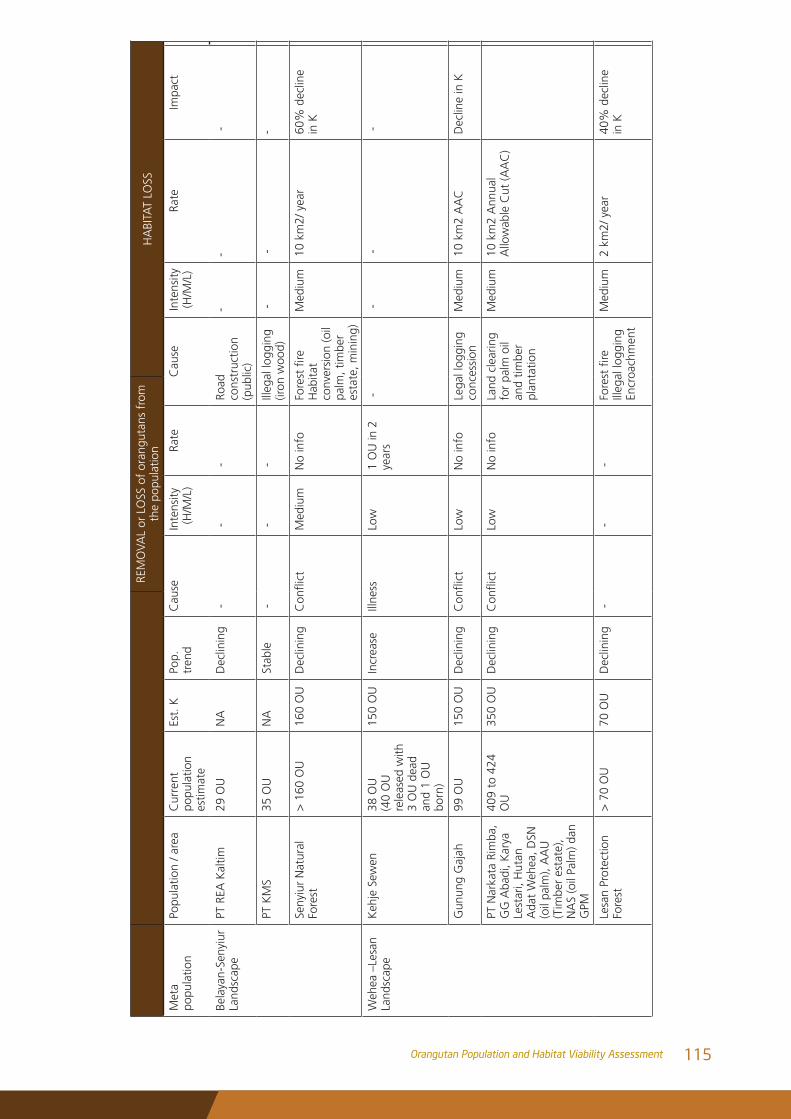
REM
OVA
L or
LO
SS o
f or
angu
tans
fro
m
the
popu
latio
nH
ABI
TAT
LOSS
Met
a po
pula
tion
Popu
latio
n / a
rea
Cur
rent
po
pula
tion
estim
ate
Est.
K
Pop.
tr
end
Cau
seIn
tens
ity(H
/M/L
)Ra
teC
ause
Inte
nsity
(H/M
/L)
Rate
Impa
ct
Bela
yan-
Seny
iur
Land
scap
ePT
REA
Kal
tim29
OU
NA
Dec
linin
g -
- -
Road
co
nstr
uctio
n (p
ublic
)
--
-
PT K
MS
35 O
UN
ASt
able
- -
-Ill
egal
logg
ing
(iron
woo
d) -
--
Seny
iur
Nat
ural
Fo
rest
> 1
60 O
U16
0 O
UD
eclin
ing
Conflict
Med
ium
No
info
Forestfire
H
abita
t co
nver
sion
(oil
palm
, tim
ber
esta
te, m
inin
g)
Med
ium
10 k
m2/
yea
r60
% d
eclin
e in
K
Weh
ea –
Lesa
n La
ndsc
ape
Keh
je S
ewen
38 O
U
(40
OU
re
leas
ed w
ith
3 O
U d
ead
and
1 O
U
born
)
150
OU
Incr
ease
Illne
ssLo
w
1 O
U in
2
year
s -
- -
-
Gun
ung
Gaj
ah99
OU
150
OU
Dec
linin
gConflict
Low
N
o in
foLe
gal l
oggi
ng
conc
essi
onM
ediu
m10
km
2 A
AC
D
eclin
e in
K
PT N
arka
ta R
imba
, G
G A
badi
, Kar
ya
Lest
ari,
Hut
an
Ada
t W
ehea
, DSN
(o
il pa
lm),
AA
U
(Tim
ber
esta
te),
NA
S (o
il Pa
lm) d
an
GPM
409
to 4
24
OU
350
OU
Dec
linin
gConflict
Low
No
info
Land
cle
arin
g fo
r pa
lm o
il an
d tim
ber
plan
tatio
n
Med
ium
10 k
m2
Ann
ual
Allo
wab
le C
ut (A
AC
)
Lesa
n Pr
otec
tion
Fore
st>
70
OU
70 O
UD
eclin
ing
- -
-Forestfire
Ill
egal
logg
ing
Encr
oach
men
t
Med
ium
2 km
2/ y
ear
40%
dec
line
in K
115Orangutan Population and Habitat Viability Assessment
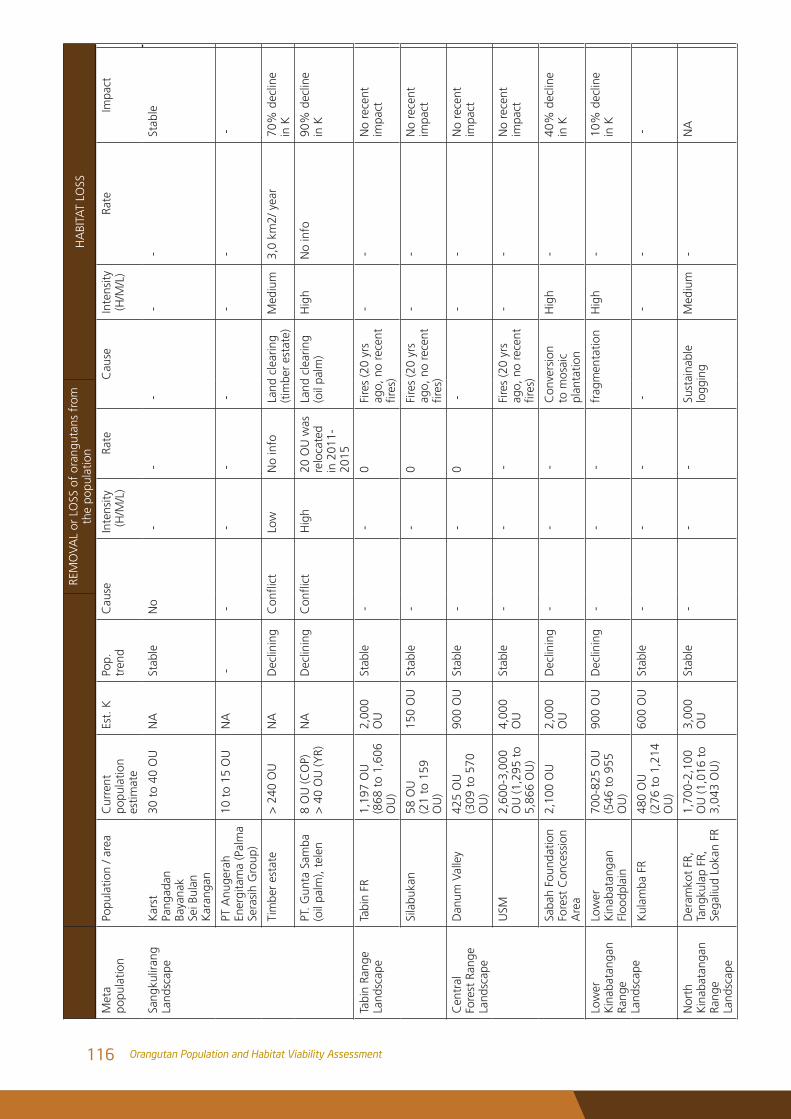
REM
OVA
L or
LO
SS o
f or
angu
tans
fro
m
the
popu
latio
nH
ABI
TAT
LOSS
Met
a po
pula
tion
Popu
latio
n / a
rea
Cur
rent
po
pula
tion
estim
ate
Est.
K
Pop.
tr
end
Cau
seIn
tens
ity(H
/M/L
)Ra
teC
ause
Inte
nsity
(H/M
/L)
Rate
Impa
ct
Sang
kulir
ang
Land
scap
eK
arst
Pa
ngad
an
Baya
nak
Sei B
ulan
K
aran
gan
30 t
o 40
OU
NA
Stab
leN
o -
- -
- -
Stab
le
PT A
nuge
rah
Ener
gita
ma
(Pal
ma
Sera
sih
Gro
up)
10 t
o 15
OU
NA
- -
- -
- -
- -
Tim
ber
esta
te>
240
OU
NA
Dec
linin
gConflict
Low
No
info
Land
cle
arin
g (t
imbe
r es
tate
)M
ediu
m3,
0 km
2/ y
ear
70%
dec
line
in K
PT. G
unta
Sam
ba
(oil
palm
), te
len
8 O
U (C
OP)
>
40
OU
(YR)
NA
Dec
linin
gConflict
Hig
h20
OU
was
re
loca
ted
in 2
011-
2015
Land
cle
arin
g (o
il pa
lm)
Hig
hN
o in
fo90
% d
eclin
e in
K
Tabi
n Ra
nge
Land
scap
e
Tabi
n FR
1,19
7 O
U
(868
to
1,60
6 O
U)
2,00
0 O
U
Stab
le -
-0
Fire
s (2
0 yr
s ag
o, n
o re
cent
fires)
- -
No
rece
nt
impa
ct
Sila
buka
n58
OU
(2
1 to
159
O
U)
150
OU
St
able
- -
0Fi
res
(20
yrs
ago,
no
rece
nt
fires)
- -
No
rece
nt
impa
ct
Cen
tral
Fo
rest
Ran
ge
Land
scap
e
Dan
um V
alle
y42
5 O
U
(309
to
570
OU
)
900
OU
St
able
- -
0 -
- -
No
rece
nt
impa
ct
USM
2,60
0-3,
000
OU
(1,2
95 t
o 5,
866
OU
)
4,00
0 O
U
Stab
le -
- -
Fire
s (2
0 yr
s ag
o, n
o re
cent
fires)
- -
No
rece
nt
impa
ct
Saba
h Fo
unda
tion
Fore
st C
once
ssio
n A
rea
2,10
0 O
U2,
000
OU
D
eclin
ing
- -
-C
onve
rsio
n to
mos
aic
plan
tatio
n
Hig
h -
40%
dec
line
in K
Low
er
Kin
abat
anga
n Ra
nge
Land
scap
e
Low
er
Kin
abat
anga
n Fl
oodp
lain
700-
825
OU
(5
46 t
o 95
5 O
U)
900
OU
D
eclin
ing
- -
-fr
agm
enta
tion
Hig
h -
10%
dec
line
in K
Kul
amba
FR
480
OU
(2
76 t
o 1,
214
OU
)
600
OU
St
able
- -
- -
- -
-
Nor
th
Kin
abat
anga
n Ra
nge
Land
scap
e
Der
amko
t FR
, Ta
ngku
lap
FR,
Sega
liud
Loka
n FR
1,70
0-2,
100
OU
(1,0
16 t
o 3,
043
OU
)
3,00
0 O
U
Stab
le -
- -
Sust
aina
ble
logg
ing
Med
ium
-N
A
116 Orangutan Population and Habitat Viability Assessment
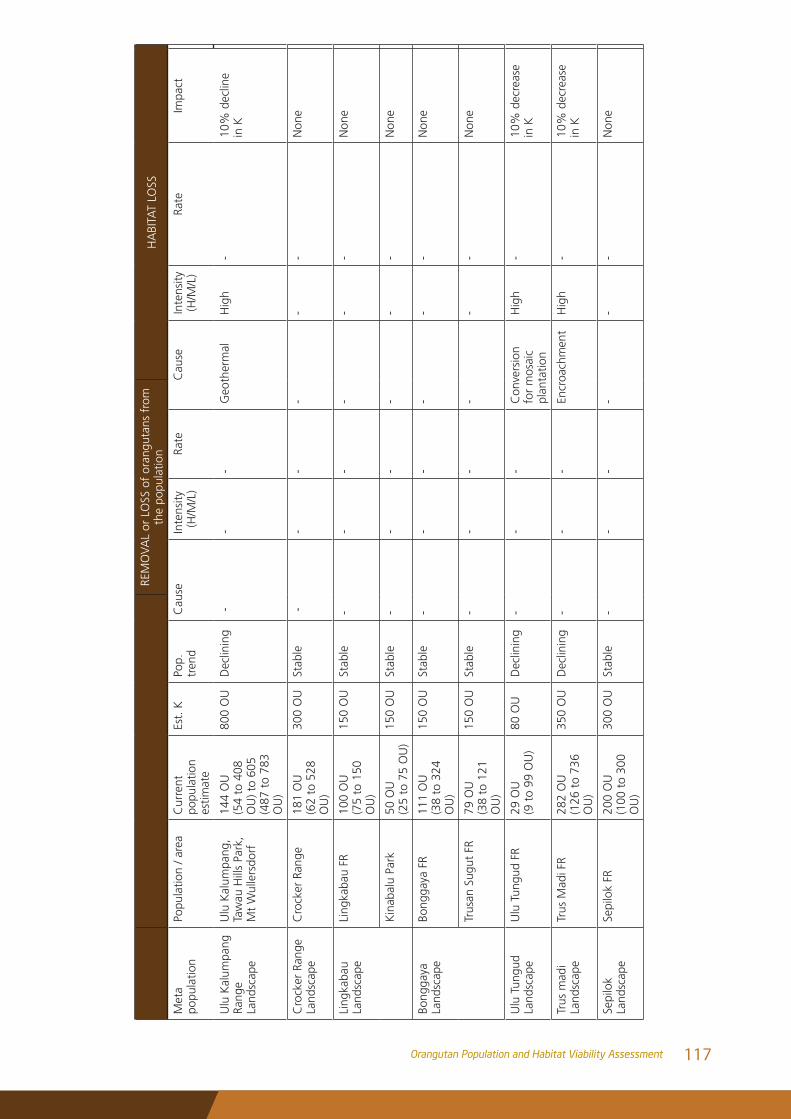
REM
OVA
L or
LO
SS o
f or
angu
tans
fro
m
the
popu
latio
nH
ABI
TAT
LOSS
Met
a po
pula
tion
Popu
latio
n / a
rea
Cur
rent
po
pula
tion
estim
ate
Est.
K
Pop.
tr
end
Cau
seIn
tens
ity(H
/M/L
)Ra
teC
ause
Inte
nsity
(H/M
/L)
Rate
Impa
ct
Ulu
Kal
umpa
ng
Rang
e La
ndsc
ape
Ulu
Kal
umpa
ng,
Taw
au H
ills
Park
, M
t W
ulle
rsdo
rf
144
OU
(5
4 to
408
O
U) t
o 60
5 (4
87 t
o 78
3 O
U)
800
OU
D
eclin
ing
--
- G
eoth
erm
alH
igh
-10
% d
eclin
e in
K
Cro
cker
Ran
ge
Land
scap
eC
rock
er R
ange
181
OU
(6
2 to
528
O
U)
300
OU
St
able
--
- -
- -
Non
e
Ling
kaba
u La
ndsc
ape
Ling
kaba
u FR
100
OU
(7
5 to
150
O
U)
150
OU
St
able
--
--
--
Non
e
Kin
abal
u Pa
rk50
OU
(2
5 to
75
OU
)15
0 O
U
Stab
le-
--
--
-N
one
Bong
gaya
La
ndsc
ape
Bong
gaya
FR
111
OU
(3
8 to
324
O
U)
150
OU
St
able
--
--
--
Non
e
Trus
an S
ugut
FR
79 O
U
(38
to 1
21
OU
)
150
OU
St
able
--
--
--
Non
e
Ulu
Tun
gud
Land
scap
eU
lu T
ungu
d FR
29 O
U
(9 t
o 99
OU
)80
OU
D
eclin
ing
--
-C
onve
rsio
n fo
r m
osai
c pl
anta
tion
Hig
h-
10%
dec
reas
e in
K
Trus
mad
i La
ndsc
ape
Trus
Mad
i FR
282
OU
(1
26 t
o 73
6 O
U)
350
OU
D
eclin
ing
--
-En
croa
chm
ent
Hig
h-
10%
dec
reas
e in
K
Sepi
lok
Land
scap
eSe
pilo
k FR
200
OU
(1
00 t
o 30
0 O
U)
300
OU
St
able
--
--
--
Non
e
117Orangutan Population and Habitat Viability Assessment
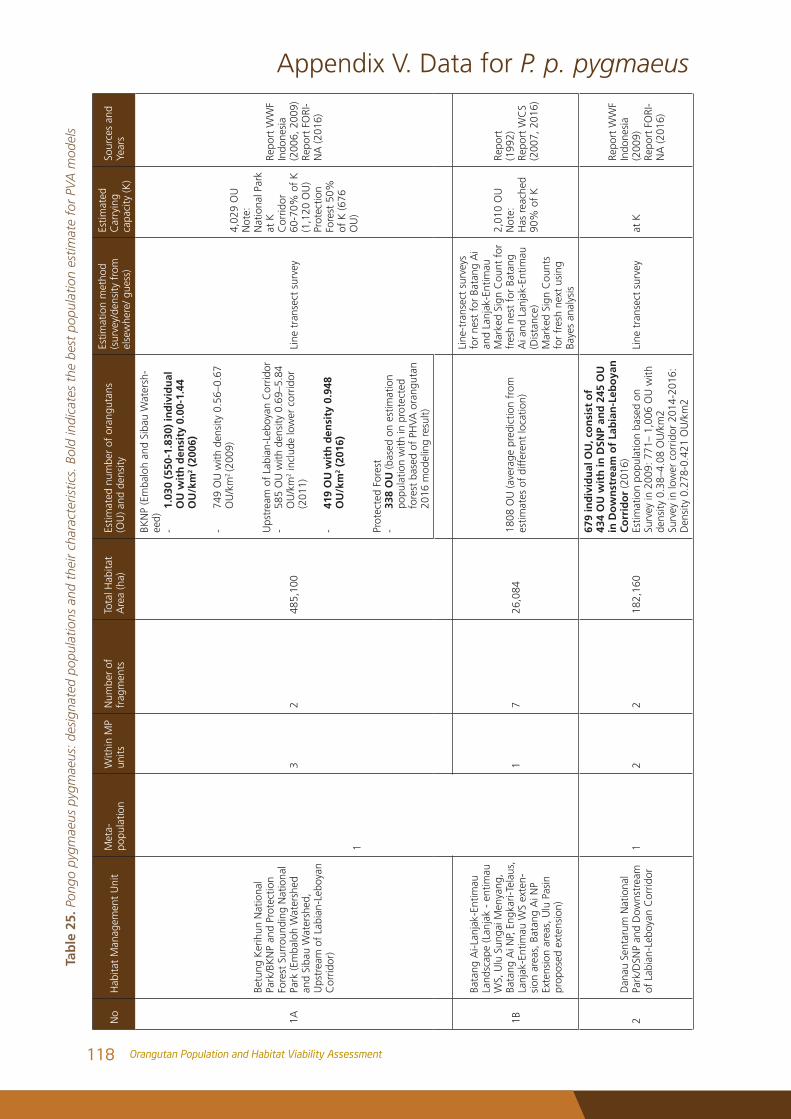
No
Hab
itat
Man
agem
ent
Uni
tM
eta-
popu
latio
nW
ithin
MP
units
Num
ber
of
frag
men
tsTo
tal H
abita
t A
rea
(ha)
Estim
ated
num
ber
of o
rang
utan
s (O
U) a
nd d
ensi
ty
Estim
atio
n m
etho
d (s
urve
y/de
nsity
fro
m
else
whe
re/ g
uess
)
Estim
ated
C
arry
ing
capa
city
(K)
Sour
ces
and
Year
s
1A
Betu
ng K
erih
un N
atio
nal
Park
/BK
NP
and
Prot
ectio
n Fo
rest
Sur
roun
ding
Nat
iona
l Pa
rk (E
mba
loh
Wat
ersh
ed
and
Siba
u W
ater
shed
, U
pstr
eam
of
Labi
an-L
eboy
an
Cor
ridor
)
1
32
485,
100
BKN
P (E
mba
loh
and
Siba
u W
ater
sh-
eed)
- 1.
030
(550
-1.8
30)
ind
ivid
ual
O
U w
ith
den
sity
0.0
0-1.
44
OU
/km
2 (2
006)
- 74
9 O
U w
ith d
ensi
ty 0
.56–
0.67
O
U/k
m2 (2
009)
Ups
trea
m o
f La
bian
-Leb
oyan
Cor
ridor
- 58
5 O
U w
ith d
ensi
ty 0
.69–
5.84
O
U/k
m2
incl
ude
low
er c
orrid
or
(201
1)
- 41
9 O
U w
ith
den
sity
0.9
48
OU
/km
2 (2
016)
Prot
ecte
d Fo
rest
-
338
OU
(bas
ed o
n es
timat
ion
popu
latio
n w
ith in
pro
tect
ed
fore
st b
ased
of
PHVA
ora
ngut
an
2016
mod
elin
g re
sult)
Line
tra
nsec
t su
rvey
4,02
9 O
U
Not
e:
Nat
iona
l Par
k at
K
Cor
ridor
60
-70%
of
K
(1,1
20 O
U)
Prot
ectio
n Fo
rest
50%
of
K (6
76
OU
)
Repo
rt W
WF
Indo
nesi
a (2
006,
200
9)
Repo
rt F
ORI
-N
A (2
016)
1B
Bata
ng A
i-Lan
jak-
Entim
au
Land
scap
e (L
anja
k -
entim
au
WS,
Ulu
Sun
gai M
enya
ng,
Bata
ng A
i NP,
Eng
kari-
Tela
us,
Lanj
ak-E
ntim
au W
S ex
ten-
sion
are
as, B
atan
g A
i NP
Exte
nsio
n ar
eas,
Ulu
Pas
in
prop
osed
ext
ensi
on)
17
26,0
8418
08 O
U (a
vera
ge p
redi
ctio
n fr
om
estim
ates
of
diff
eren
t lo
catio
n)
Line
-tra
nsec
t su
rvey
s fo
r ne
st f
or B
atan
g A
i an
d La
njak
-Ent
imau
M
arke
d Si
gn C
ount
for
fr
esh
nest
for
Bat
ang
Ai a
nd L
anja
k-En
timau
(D
ista
nce)
M
arke
d Si
gn C
ount
s fo
r fr
esh
next
usi
ng
Baye
s an
alys
is
2,01
0 O
U
Not
e:
Has
rea
ched
90
% o
f K
Repo
rt
(199
2)
Repo
rt W
CS
(200
7, 2
016)
2D
anau
Sen
taru
m N
atio
nal
Park
/DSN
P an
d D
owns
trea
m
of L
abia
n-Le
boya
n C
orrid
or1
22
182,
160
679
ind
ivid
ual
OU
, co
nsi
st o
f
434
OU
wit
h in
DSN
P an
d 2
45 O
U
in D
ow
nst
ream
of
Lab
ian
-Leb
oya
n
Co
rrid
or
(201
6)
Estim
atio
n po
pula
tion
base
d on
Su
rvey
in 2
009:
771
– 1,
006
OU
with
de
nsity
0.3
8–4.
08 O
U/k
m2
Su
rvey
in lo
wer
cor
ridor
201
4-20
16:
Den
sity
0.2
78-0
.421
OU
/km
2
Line
tra
nsec
t su
rvey
at K
Repo
rt W
WF
Indo
nesi
a (2
009)
Re
port
FO
RI-
NA
(201
6)
Appendix V. Data for P. p. pygmaeusTa
ble
25.
Pon
go p
ygm
aeus
pyg
mae
us: d
esig
nate
d po
pula
tions
and
the
ir ch
arac
teris
tics.
Bol
d in
dica
tes
the
best
pop
ulat
ion
estim
ate
for
PVA
mod
els
118 Orangutan Population and Habitat Viability Assessment
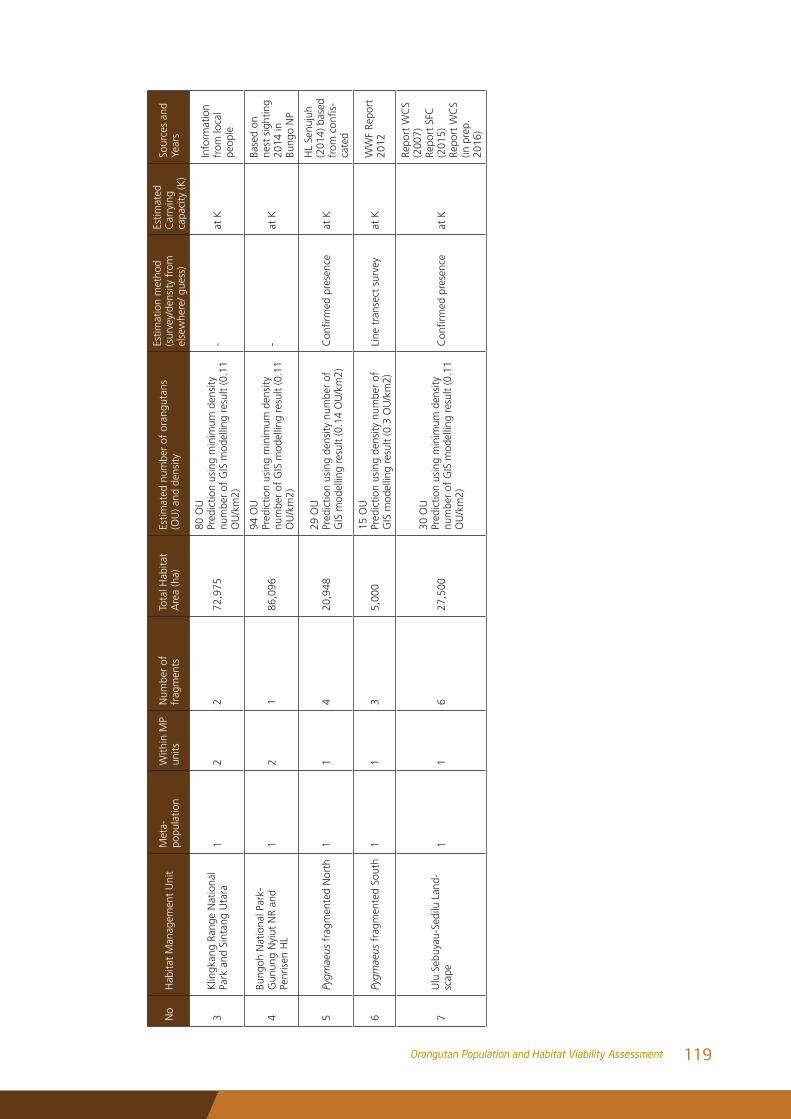
No
Hab
itat
Man
agem
ent
Uni
tM
eta-
popu
latio
nW
ithin
MP
units
Num
ber
of
frag
men
tsTo
tal H
abita
t A
rea
(ha)
Estim
ated
num
ber
of o
rang
utan
s (O
U) a
nd d
ensi
ty
Estim
atio
n m
etho
d (s
urve
y/de
nsity
fro
m
else
whe
re/ g
uess
)
Estim
ated
C
arry
ing
capa
city
(K)
Sour
ces
and
Year
s
3K
lingk
ang
Rang
e N
atio
nal
Park
and
Sin
tang
Uta
ra1
22
72,9
75
80 O
U
Pred
ictio
n us
ing
min
imum
den
sity
nu
mbe
r of
GIS
mod
ellin
g re
sult
(0.1
1 O
U/k
m2)
-at
KIn
form
atio
n fr
om lo
cal
peop
le
4Bu
ngoh
Nat
iona
l Par
k-G
unun
g N
yiut
NR
and
Penr
isen
HL
12
186
,096
94 O
U
Pred
ictio
n us
ing
min
imum
den
sity
nu
mbe
r of
GIS
mod
ellin
g re
sult
(0.1
1 O
U/k
m2)
-at
K
Base
d on
ne
st s
ight
ing
2014
in
Bung
o N
P
5Py
gmae
us f
ragm
ente
d N
orth
11
420
,948
29
OU
Pr
edic
tion
usin
g de
nsity
num
ber
of
GIS
mod
ellin
g re
sult
(0.1
4 O
U/k
m2)
Confirmedpresence
at K
HL
Senu
juh
(201
4) b
ased
fromconfis
-ca
ted
6Py
gmae
us f
ragm
ente
d So
uth
11
3 5,
000
15 O
U
Pred
ictio
n us
ing
dens
ity n
umbe
r of
G
IS m
odel
ling
resu
lt (0
.3 O
U/k
m2)
Line
tra
nsec
t su
rvey
at K
WW
F Re
port
20
12
7U
lu S
ebuy
au-S
edilu
Lan
d-sc
ape
11
627
,500
30 O
U
Pred
ictio
n us
ing
min
imum
den
sity
nu
mbe
r of
GIS
mod
ellin
g re
sult
(0.1
1 O
U/k
m2)
Confirmedpresence
at K
Repo
rt W
CS
(200
7)
Repo
rt S
FC
(201
5)
Repo
rt W
CS
(in p
rep.
20
16)
119Orangutan Population and Habitat Viability Assessment
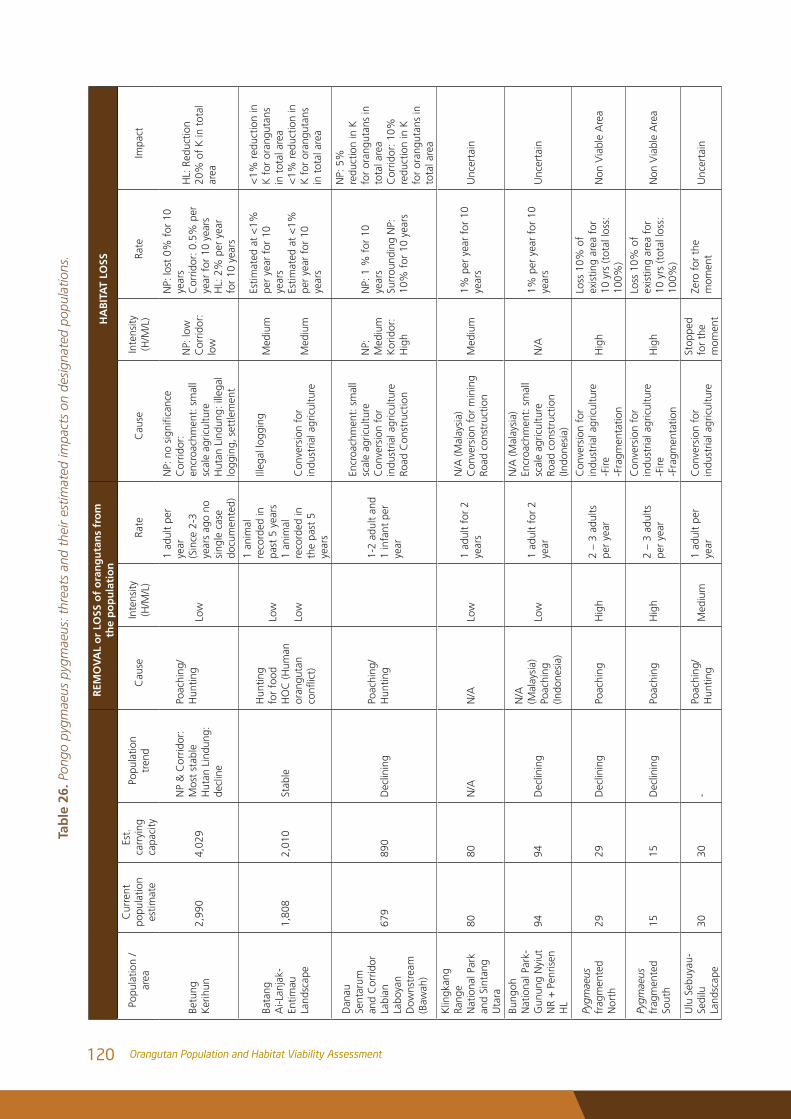
REM
OV
AL
or
LOSS
of
ora
ng
uta
ns
fro
m
the
po
pu
lati
on
HA
BIT
AT
LOSS
Popu
latio
n /
area
Cur
rent
po
pula
tion
estim
ate
Est.
ca
rryi
ng
capa
city
Popu
latio
n tr
end
Cau
seIn
tens
ity(H
/M/L
)Ra
teC
ause
Inte
nsity
(H/M
/L)
Rate
Impa
ct
Betu
ng
Ker
ihun
2,99
04,
029
NP
& C
orrid
or:
Mos
t st
able
Hut
an L
indu
ng:
decl
ine
Poac
hing
/ H
untin
gLo
w
1 ad
ult
per
year
(Sin
ce 2
-3
year
s ag
o no
si
ngle
cas
e do
cum
ente
d)
NP:nosignificance
Cor
ridor
: en
croa
chm
ent:
sm
all
scal
e ag
ricul
ture
Hut
an L
indu
ng: i
llega
l lo
ggin
g, s
ettle
men
t
NP:
low
Cor
ridor
: lo
w
NP:
lost
0%
for
10
year
sC
orrid
or: 0
.5%
per
ye
ar f
or 1
0 ye
ars
HL:
2%
per
yea
r fo
r 10
yea
rs
HL:
Red
uctio
n 20
% o
f K
in t
otal
ar
ea
Bata
ng
Ai-L
anja
k-En
timau
La
ndsc
ape
1,80
82,
010
Stab
le
Hun
ting
for
food
HO
C (H
uman
or
angu
tan
conflict)
Low
Low
1 an
imal
re
cord
ed in
pa
st 5
yea
rs1
anim
al
reco
rded
in
the
past
5
year
s
Illeg
al lo
ggin
g
Con
vers
ion
for
indu
stria
l agr
icul
ture
Med
ium
Med
ium
Estim
ated
at
<1%
pe
r ye
ar f
or 1
0 ye
ars
Estim
ated
at
<1%
pe
r ye
ar f
or 1
0 ye
ars
<1%
red
uctio
n in
K
for
ora
ngut
ans
in t
otal
are
a<
1% r
educ
tion
in
K f
or o
rang
utan
s in
tot
al a
rea
Dan
au
Sent
arum
an
d C
orrid
or
Labi
an
Labo
yan
Dow
nstr
eam
(B
awah
)
679
890
Dec
linin
gPo
achi
ng/
Hun
ting
1-2
adul
t an
d 1
infa
nt p
er
year
Encr
oach
men
t: s
mal
l sc
ale
agric
ultu
reC
onve
rsio
n fo
r in
dust
rial a
gric
ultu
reRo
ad C
onst
ruct
ion
NP:
M
ediu
mK
orid
or:
Hig
h
NP:
1 %
for
10
year
sSu
rrou
ndin
g N
P:
10%
for
10
year
s
NP:
5%
re
duct
ion
in K
fo
r or
angu
tans
in
tota
l are
aC
orrid
or: 1
0%
redu
ctio
n in
K
for
oran
guta
ns in
to
tal a
rea
Klin
gkan
g Ra
nge
Nat
iona
l Par
k an
d Si
ntan
g U
tara
8080
N/A
N/A
Low
1 ad
ult
for
2 ye
ars
N/A
(Mal
aysi
a)C
onve
rsio
n fo
r m
inin
gRo
ad c
onst
ruct
ion
Med
ium
1% p
er y
ear
for
10
year
sU
ncer
tain
Bung
oh
Nat
iona
l Par
k-G
unun
g N
yiut
N
R +
Pen
risen
H
L
9494
Dec
linin
g
N/A
(M
alay
sia)
Poac
hing
(In
done
sia)
Low
1 ad
ult
for
2 ye
ar
N/A
(Mal
aysi
a)En
croa
chm
ent:
sm
all
scal
e ag
ricul
ture
Road
con
stru
ctio
n (In
done
sia)
N/A
1%
per
yea
r fo
r 10
ye
ars
Unc
erta
in
Pygm
aeus
fr
agm
ente
d N
orth
2929
Dec
linin
gPo
achi
ngH
igh
2 –
3 ad
ults
pe
r ye
ar
Con
vers
ion
for
indu
stria
l agr
icul
ture
-Fire
-Fra
gmen
tatio
n
Hig
h
Loss
10%
of
exis
ting
area
for
10
yrs
(tot
al lo
ss:
100%
)
Non
Via
ble
Are
a
Pygm
aeus
fr
agm
ente
d So
uth
1515
Dec
linin
gPo
achi
ngH
igh
2 –
3 ad
ults
pe
r ye
ar
Con
vers
ion
for
indu
stria
l agr
icul
ture
-Fire
-Fra
gmen
tatio
n
Hig
h
Loss
10%
of
exis
ting
area
for
10
yrs
(tot
al lo
ss:
100%
)
Non
Via
ble
Are
a
Ulu
Seb
uyau
-Se
dilu
La
ndsc
ape
3030
-Po
achi
ng/
Hun
ting
Med
ium
1 ad
ult
per
year
Con
vers
ion
for
indu
stria
l agr
icul
ture
Stop
ped
for
the
mom
ent
Zero
for
the
m
omen
tU
ncer
tain
Tab
le 2
6. P
ongo
pyg
mae
us p
ygm
aeus
: thr
eats
and
the
ir es
timat
ed im
pact
s on
des
igna
ted
popu
latio
ns.
120 Orangutan Population and Habitat Viability Assessment
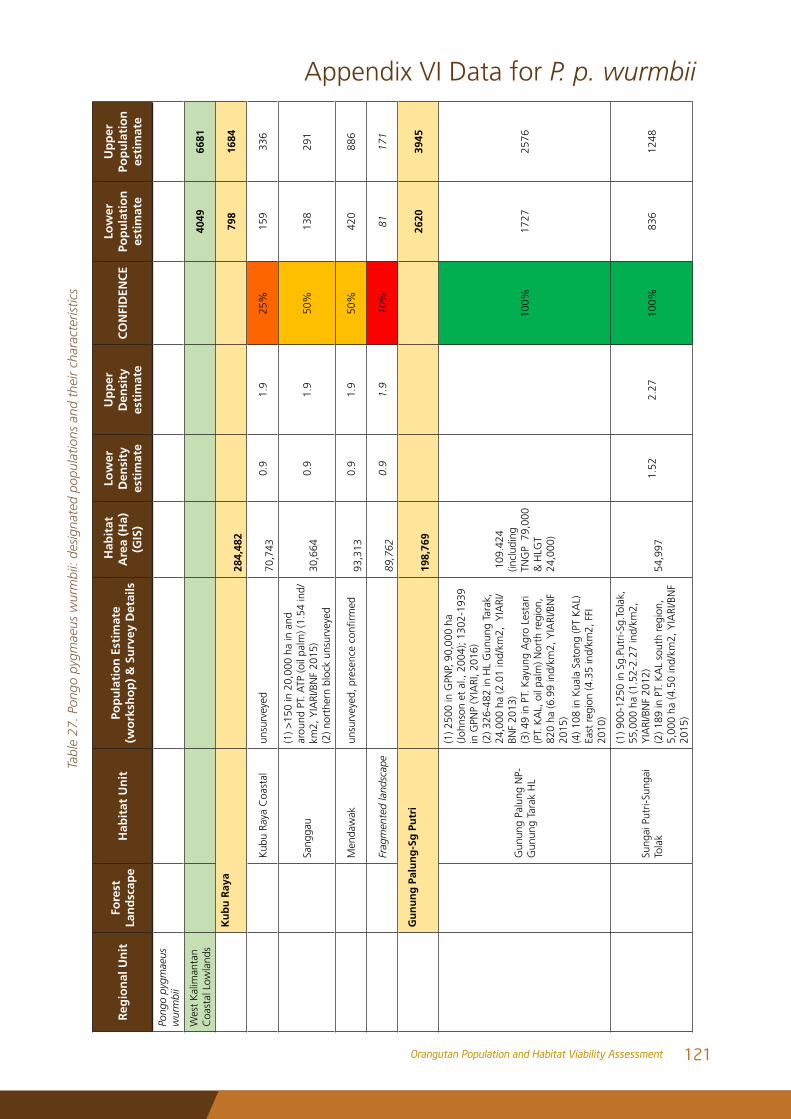
Reg
ion
al U
nit
Fore
st
Lan
dsc
ape
Hab
itat
Un
itPo
pu
lati
on
Est
imat
e (w
ork
sho
p)
& S
urv
ey D
etai
ls
Hab
itat
A
rea
(Ha)
(G
IS)
Low
er
Den
sity
es
tim
ate
Up
per
D
ensi
ty
esti
mat
eC
ON
FID
ENC
ELo
wer
Po
pu
lati
on
es
tim
ate
Up
per
Po
pu
lati
on
es
tim
ate
Pong
o py
gmae
us
wur
mbi
i
Wes
t K
alim
anta
n C
oast
al L
owla
nds
40
4966
81
K
ub
u R
aya
28
4,48
2
798
1684
Kub
u Ra
ya C
oast
alun
surv
eyed
70,7
43
0.9
1.9
25%
159
336
Sang
gau
(1) >
150
in 2
0,00
0 ha
in a
nd
arou
nd P
T. A
TP (o
il pa
lm) (
1.54
ind/
km2,
YIA
RI/B
NF
2015
) (2
) nor
ther
n bl
ock
unsu
rvey
ed
30,6
64
0.9
1.9
50%
138
291
Men
daw
akunsurveyed,presenceconfirmed
93,3
13
0.9
1.9
50%
420
886
Frag
men
ted
land
scap
e
89,7
62
0.9
1.9
10%
8117
1
G
un
un
g P
alu
ng
-Sg
Pu
tri
19
8,76
9
2620
3945
Gun
ung
Palu
ng N
P-G
unun
g Ta
rak
HL
(1) 2
500
in G
PNP,
90,
000
ha
(Joh
nson
et
al.,
2004
); 13
02-1
939
in G
PNP
(YIA
RI, 2
016)
(2
) 326
-482
in H
L G
unun
g Ta
rak,
24
,000
ha
(2.0
1 in
d/km
2, Y
IARI
/BN
F 20
13)
(3) 4
9 in
PT.
Kay
ung
Agr
o Le
star
i (P
T. K
AL,
oil
palm
) Nor
th r
egio
n,
820
ha (6
.99
ind/
km2,
YIA
RI/B
NF
2015
) (4
) 108
in K
uala
Sat
ong
(PT
KA
L)
East
reg
ion
(4.3
5 in
d/km
2, F
FI
2010
)
109
.424
(in
clud
ing
TNG
P 7
9,00
0 &
HLG
T 24
,000
)
100%
1727
2576
Sung
ai P
utri-
Sung
ai
Tola
k
(1) 9
00-1
250
in S
g.Pu
tri-S
g.To
lak,
55
,000
ha
(1.5
2-2.
27 in
d/km
2,
YIA
RI/B
NF
2012
) (2
) 189
in P
T. K
AL
sout
h re
gion
, 5,
000
ha (4
.50
ind/
km2,
YIA
RI/B
NF
2015
)
54,9
97
1.52
2.27
100%
836
1248
Appendix VI Data for P. p. wurmbiiTa
ble
27. P
ongo
pyg
mae
us w
urm
bii:
desi
gnat
ed p
opul
atio
ns a
nd t
heir
char
acte
ristic
s
121Orangutan Population and Habitat Viability Assessment
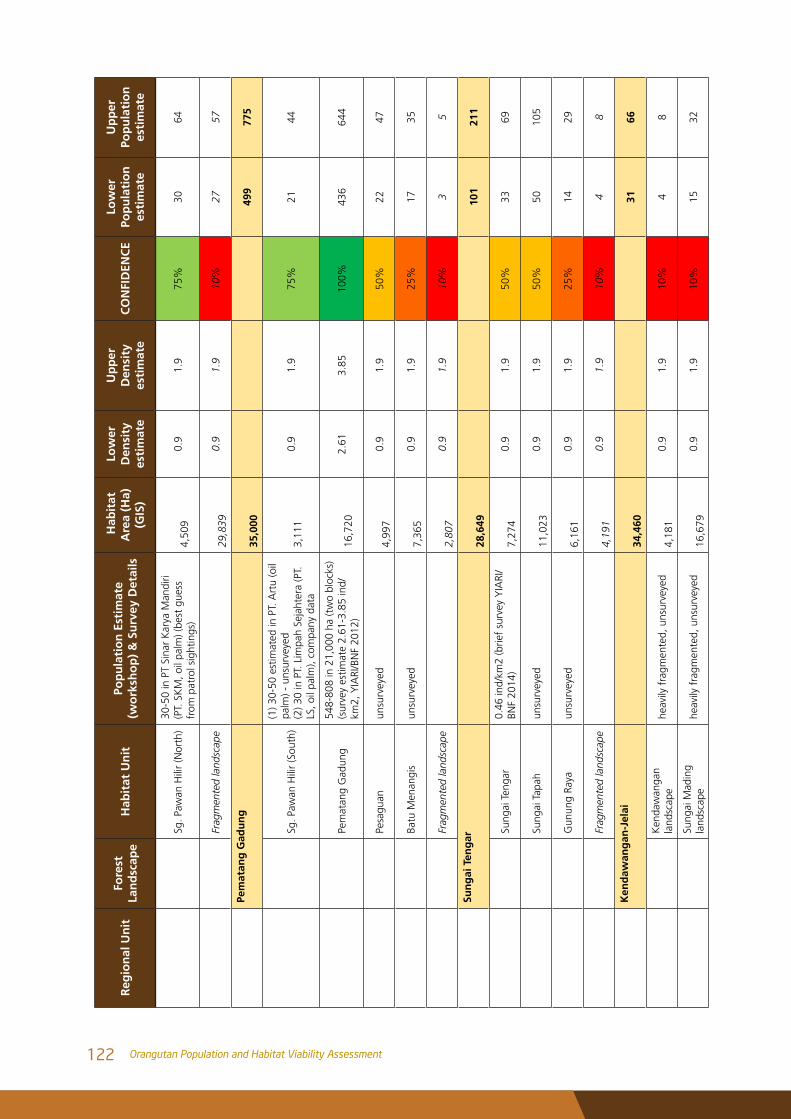
Reg
ion
al U
nit
Fore
st
Lan
dsc
ape
Hab
itat
Un
itPo
pu
lati
on
Est
imat
e (w
ork
sho
p)
& S
urv
ey D
etai
ls
Hab
itat
A
rea
(Ha)
(G
IS)
Low
er
Den
sity
es
tim
ate
Up
per
D
ensi
ty
esti
mat
eC
ON
FID
ENC
ELo
wer
Po
pu
lati
on
es
tim
ate
Up
per
Po
pu
lati
on
es
tim
ate
Sg. P
awan
Hili
r (N
orth
)30
-50
in P
T Si
nar
Kar
ya M
andi
ri (P
T. S
KM
, oil
palm
) (be
st g
uess
fr
om p
atro
l sig
htin
gs)
4,
509
0.9
1.9
75%
3064
Frag
men
ted
land
scap
e
29,8
39
0.9
1.9
10%
2757
Pe
mat
ang
Gad
un
g
35
,000
499
775
Sg. P
awan
Hili
r (S
outh
)
(1) 3
0-50
est
imat
ed in
PT.
Art
u (o
il pa
lm) -
uns
urve
yed
(2) 3
0 in
PT.
Lim
pah
Seja
hter
a (P
T.LS
, oil
palm
), co
mpa
ny d
ata
3,
111
0.9
1.9
75%
2144
Pem
atan
g G
adun
g54
8-80
8 in
21,
000
ha (t
wo
bloc
ks)
(sur
vey
estim
ate
2.61
-3.8
5 in
d/km
2, Y
IARI
/BN
F 20
12)
16,7
20
2.61
3.85
100%
436
644
Pesa
guan
unsu
rvey
ed
4,99
7 0.
91.
950
%22
47
Batu
Men
angi
sun
surv
eyed
7,
365
0.9
1.9
25%
1735
Frag
men
ted
land
scap
e
2,
807
0.9
1.9
10%
35
Su
ng
ai T
eng
ar
28
,649
101
211
Sung
ai T
enga
r0.
46 in
d/km
2 (b
rief
surv
ey Y
IARI
/BN
F 20
14)
7,
274
0.9
1.9
50%
3369
Sung
ai T
apah
unsu
rvey
ed
11
,023
0.
91.
950
%50
105
Gun
ung
Raya
unsu
rvey
ed
6,16
1 0.
91.
925
%14
29
Frag
men
ted
land
scap
e
4,
191
0.9
1.9
10%
48
K
end
awan
gan
-Jel
ai
34
,460
3166
Ken
daw
anga
n la
ndsc
ape
heav
ily f
ragm
ente
d, u
nsur
veye
d
4,18
1 0.
91.
910
%4
8
Sung
ai M
adin
g la
ndsc
ape
heav
ily f
ragm
ente
d, u
nsur
veye
d
16
,679
0.
91.
910
%15
32
122 Orangutan Population and Habitat Viability Assessment
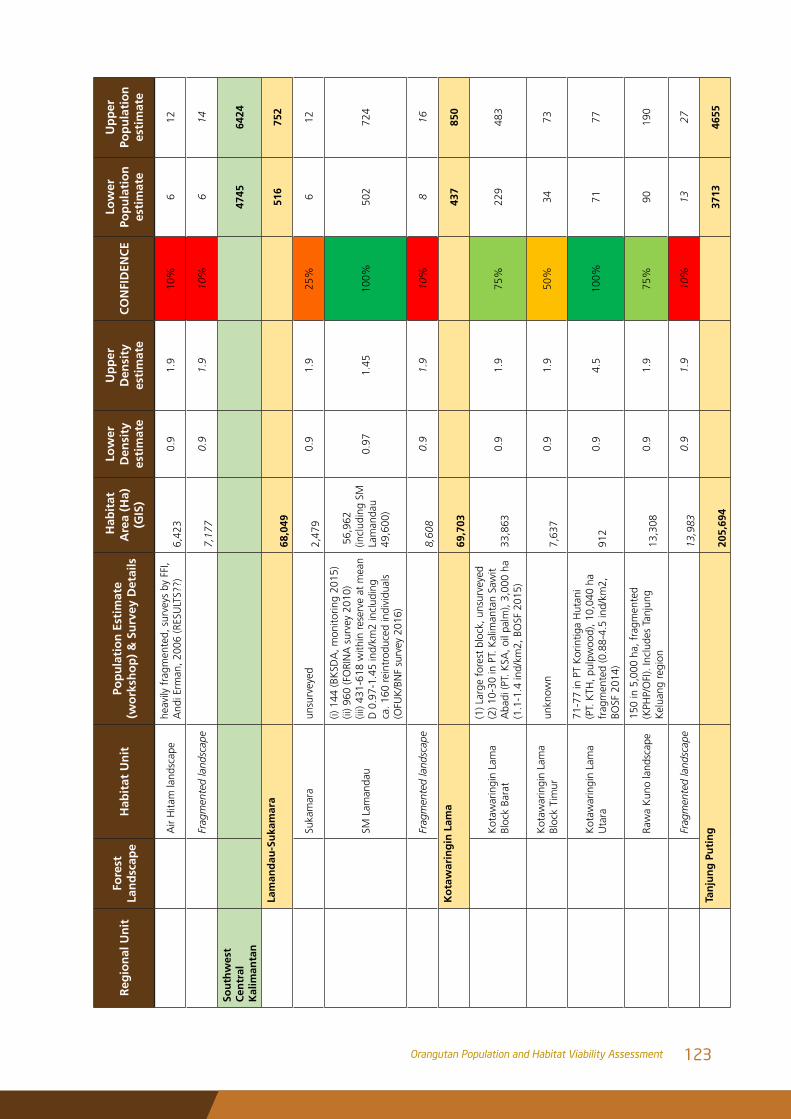
Reg
ion
al U
nit
Fore
st
Lan
dsc
ape
Hab
itat
Un
itPo
pu
lati
on
Est
imat
e (w
ork
sho
p)
& S
urv
ey D
etai
ls
Hab
itat
A
rea
(Ha)
(G
IS)
Low
er
Den
sity
es
tim
ate
Up
per
D
ensi
ty
esti
mat
eC
ON
FID
ENC
ELo
wer
Po
pu
lati
on
es
tim
ate
Up
per
Po
pu
lati
on
es
tim
ate
Air
Hita
m la
ndsc
ape
heav
ily f
ragm
ente
d, s
urve
ys b
y FF
I, A
ndi E
rman
, 200
6 (R
ESU
LTS?
?)
6,42
3 0.
91.
910
%6
12
Frag
men
ted
land
scap
e
7,
177
0.9
1.9
10%
614
Sou
thw
est
Cen
tral
K
alim
anta
n
4745
6424
La
man
dau
-Su
kam
ara
68,0
49
51
675
2
Suka
mar
aun
surv
eyed
2,
479
0.9
1.9
25%
612
SM L
aman
dau
(i) 1
44 (B
KSD
A, m
onito
ring
2015
) (ii
) 960
(FO
RIN
A s
urve
y 20
10)
(iii)
431-
618
with
in r
eser
ve a
t m
ean
D 0
.97-
1.45
ind/
km2
incl
udin
g ca
. 160
rei
ntro
duce
d in
divi
dual
s (O
FUK
/BN
F su
rvey
201
6)
56,
962
(incl
udin
g SM
La
man
dau
49,6
00)
0.97
1.45
100%
502
724
Frag
men
ted
land
scap
e
8,
608
0.9
1.9
10%
816
K
ota
war
ing
in L
ama
69,7
03
43
785
0
Kot
awar
ingi
n La
ma
Bloc
k Ba
rat
(1) L
arge
for
est
bloc
k, u
nsur
veye
d (2
) 10-
30 in
PT.
Kal
iman
tan
Saw
it A
badi
(PT.
KSA
, oil
palm
), 3,
000
ha
(1.1
-1.4
ind/
km2,
BO
SF 2
015)
33,8
63
0.9
1.9
75%
229
483
Kot
awar
ingi
n La
ma
Bloc
k Ti
mur
unkn
own
7,
637
0.9
1.9
50%
3473
Kot
awar
ingi
n La
ma
Uta
ra
71-7
7 in
PT
Kor
intig
a H
utan
i (P
T. K
TH, p
ulpw
ood)
, 10,
040
ha
frag
men
ted
(0.8
8-4.
5 in
d/km
2,
BOSF
201
4)
912
0.9
4.5
100%
7177
Raw
a K
uno
land
scap
e15
0 in
5,0
00 h
a, f
ragm
ente
d (K
PHP/
OFI
). In
clud
es T
anju
ng
Kel
uang
reg
ion
13,3
08
0.9
1.9
75%
9019
0
Frag
men
ted
land
scap
e
13,9
83
0.9
1.9
10%
1327
Ta
nju
ng
Pu
tin
g
205,
694
37
1346
55
123Orangutan Population and Habitat Viability Assessment
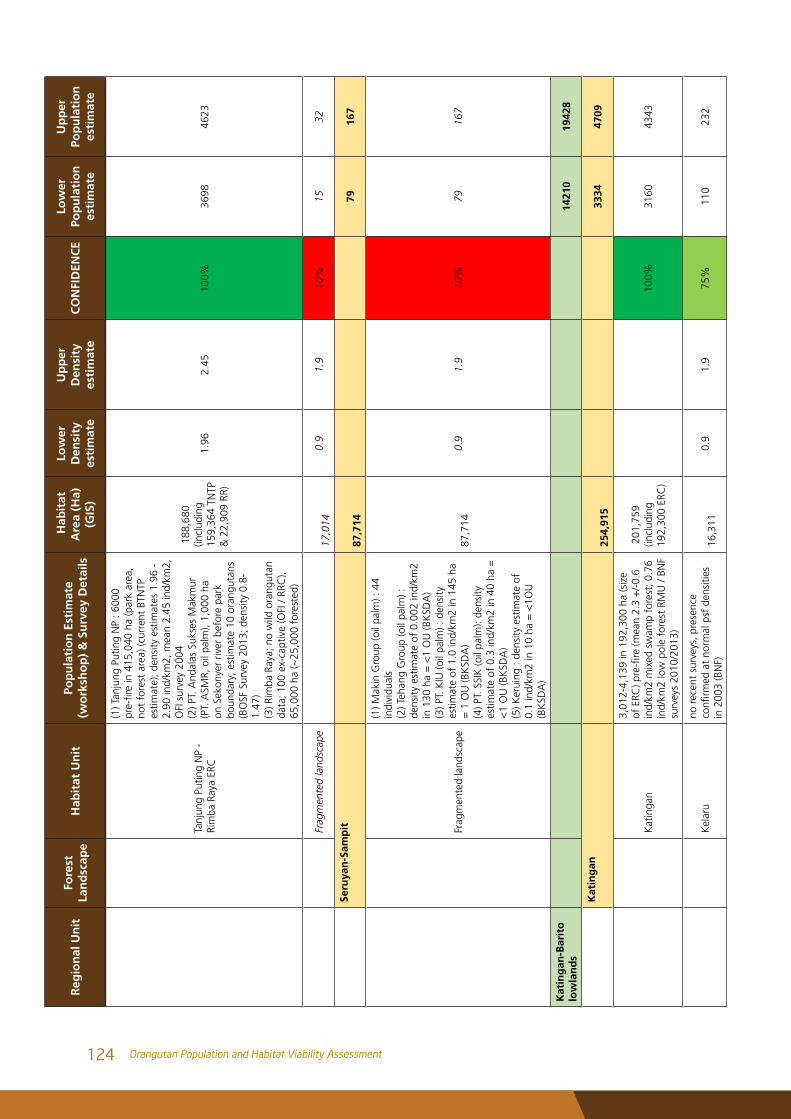
Reg
ion
al U
nit
Fore
st
Lan
dsc
ape
Hab
itat
Un
itPo
pu
lati
on
Est
imat
e (w
ork
sho
p)
& S
urv
ey D
etai
ls
Hab
itat
A
rea
(Ha)
(G
IS)
Low
er
Den
sity
es
tim
ate
Up
per
D
ensi
ty
esti
mat
eC
ON
FID
ENC
ELo
wer
Po
pu
lati
on
es
tim
ate
Up
per
Po
pu
lati
on
es
tim
ate
Tanj
ung
Putin
g N
P -
Rim
ba R
aya
ERC
(1) T
anju
ng P
utin
g N
P : 6
000
pre-firein415,040ha(parkarea,
not
fore
st a
rea)
(cur
rent
BTN
TP
estim
ate)
; den
sity
est
imat
es 1
.96
- 2.
90 in
d/km
2, m
ean
2.45
ind/
km2,
O
FI s
urve
y 20
04
(2) P
T. A
ndal
as S
ukse
s M
akm
ur
(PT.
ASM
R, o
il pa
lm),
1,00
0 ha
on
Sek
onye
r riv
er b
efor
e pa
rk
boun
dary
; est
imat
e 10
ora
ngut
ans
(BO
SF S
urve
y 20
13; d
ensi
ty 0
.8-
1.47
) (3
) Rim
ba R
aya;
no
wild
ora
ngut
an
data
; 100
ex-
capt
ive
(OFI
/ RR
C),
65,0
00 h
a (~
25,0
00 f
ores
ted)
188
,680
(in
clud
ing
159,
364
TNTP
&
22,
909
RR)
1.96
2.45
100%
3698
4623
Frag
men
ted
land
scap
e
17,0
14
0.9
1.9
10%
1532
Se
ruya
n-S
amp
it
87
,714
7916
7
Frag
men
ted
land
scap
e
(1) M
akin
Gro
up (o
il pa
lm) :
44
indi
vidu
als
(2) T
ehan
g G
roup
(oil
palm
) :
dens
ity e
stim
ate
of 0
.002
ind/
km2
in 1
30 h
a =
<1
OU
(BK
SDA
) (3
) PT.
KIU
(oil
palm
) : d
ensi
ty
estim
ate
of 1
.0 in
d/km
2 in
145
ha
= 1
OU
(BK
SDA
) (4
) PT.
SSI
K (o
il pa
lm):
dens
ity
estim
ate
of 0
.3 in
d/km
2 in
40
ha =
<
1 O
U (B
KSD
A)
(5) K
erui
ng :
dens
ity e
stim
ate
of
0.1
ind/
km2
in 1
0 ha
= <
1OU
(B
KSD
A)
87,7
14
0.9
1.9
10%
7916
7
Kat
ing
an-B
arit
o
low
lan
ds
14
210
1942
8
K
atin
gan
25
4,91
5
3334
4709
Kat
inga
n
3,01
2-4,
139
in 1
92,3
00 h
a (s
ize
ofERC)pre-fire(mean2.3+/-0.6
ind/
km2
mix
ed s
wam
p fo
rest
; 0.7
6 in
d/km
2 lo
w p
ole
fore
st R
MU
/ BN
F su
rvey
s 20
10/2
013)
201
,759
(in
clud
ing
192,
300
ERC
)
10
0%31
6043
43
Kel
aru
no r
ecen
t su
rvey
s, p
rese
nce
confirmedatnormalpsfdensities
in 2
003
(BN
F)
16,3
11
0.9
1.9
75%
110
232
124 Orangutan Population and Habitat Viability Assessment
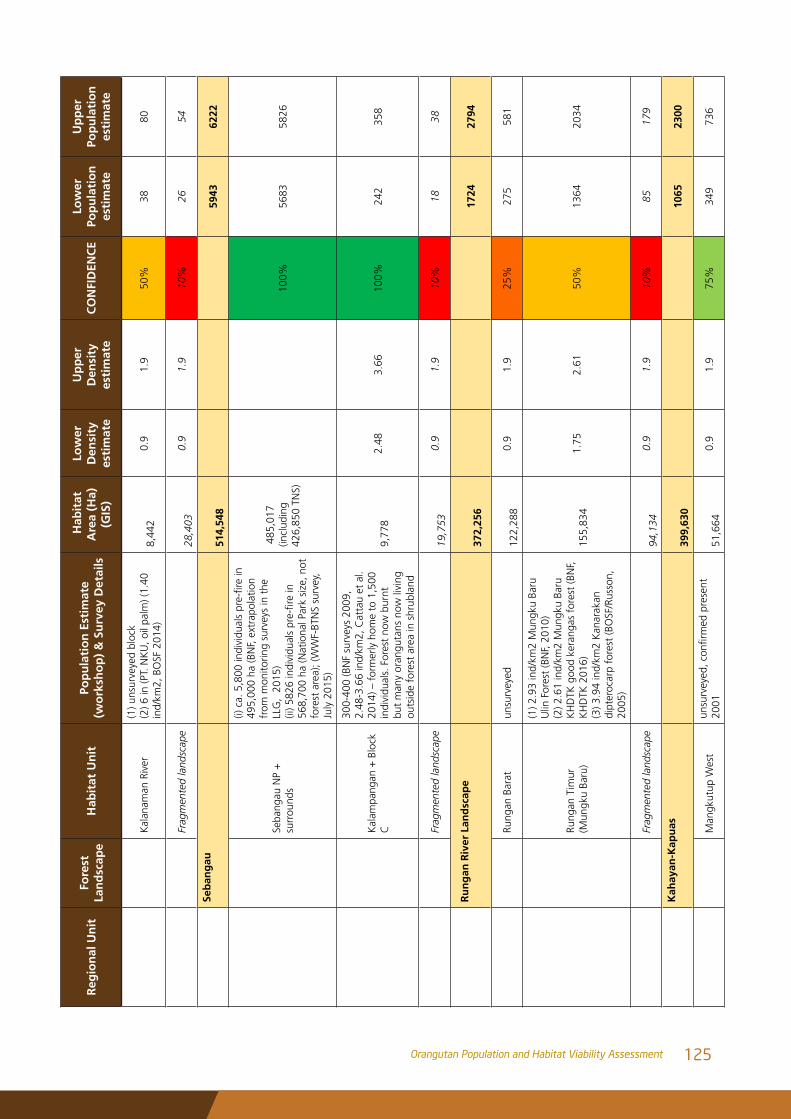
Reg
ion
al U
nit
Fore
st
Lan
dsc
ape
Hab
itat
Un
itPo
pu
lati
on
Est
imat
e (w
ork
sho
p)
& S
urv
ey D
etai
ls
Hab
itat
A
rea
(Ha)
(G
IS)
Low
er
Den
sity
es
tim
ate
Up
per
D
ensi
ty
esti
mat
eC
ON
FID
ENC
ELo
wer
Po
pu
lati
on
es
tim
ate
Up
per
Po
pu
lati
on
es
tim
ate
Kal
anam
an R
iver
(1) u
nsur
veye
d bl
ock
(2) 6
in (P
T. N
KU
, oil
palm
) (1.
40
ind/
km2,
BO
SF 2
014)
8,
442
0.9
1.9
50%
3880
Frag
men
ted
land
scap
e
28,4
03
0.9
1.9
10%
2654
Se
ban
gau
51
4,54
8
5943
6222
Seba
ngau
NP
+
surr
ound
s
(i)ca.5,800individualspre-firein
495,
000
ha (B
NF,
ext
rapo
latio
n fr
om m
onito
ring
surv
eys
in t
he
LLG
, 20
15)
(ii)5826individualspre-firein
568,
700
ha (N
atio
nal P
ark
size
, not
fo
rest
are
a); (
WW
F-BT
NS
surv
ey,
July
201
5)
485
,017
(in
clud
ing
426,
850
TNS)
10
0%56
8358
26
Kal
ampa
ngan
+ B
lock
C
300-
400
(BN
F su
rvey
s 20
09,
2.48
-3.6
6 in
d/km
2, C
atta
u et
al.
2014
) – f
orm
erly
hom
e to
1,5
00
indi
vidu
als.
For
est
now
bur
nt
but
man
y or
angu
tans
now
livi
ng
outs
ide
fore
st a
rea
in s
hrub
land
9,
778
2.48
3.66
100%
242
358
Frag
men
ted
land
scap
e
19,7
53
0.9
1.9
10%
1838
R
un
gan
Riv
er L
and
scap
e
372,
256
17
2427
94
Rung
an B
arat
unsu
rvey
ed
122,
288
0.9
1.9
25%
275
581
Rung
an T
imur
(M
ungk
u Ba
ru)
(1) 2
.93
ind/
km2
Mun
gku
Baru
U
lin F
ores
t (B
NF,
201
0)
(2) 2
.61
ind/
km2
Mun
gku
Baru
K
HD
TK g
ood
kera
ngas
for
est
(BN
F,
KH
DTK
201
6)
(3) 3
.94
ind/
km2
Kan
arak
an
dipt
eroc
arp
fore
st (B
OSF
/Rus
son,
20
05)
15
5,83
4 1.
752.
6150
%13
6420
34
Frag
men
ted
land
scap
e
94,1
34
0.9
1.9
10%
8517
9
K
ahay
an-K
apu
as
399,
630
10
6523
00
Man
gkut
up W
est
unsurveyed,confirmedpresent
2001
51,6
64
0.9
1.9
75%
349
736
125Orangutan Population and Habitat Viability Assessment
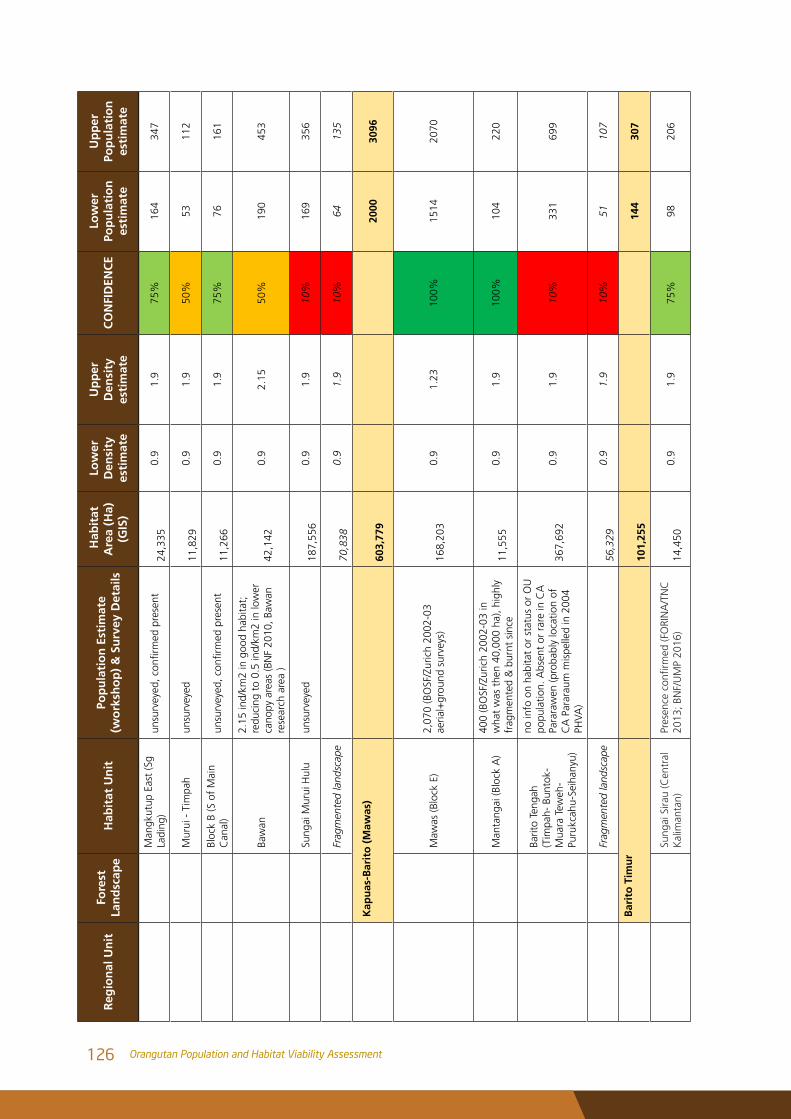
Reg
ion
al U
nit
Fore
st
Lan
dsc
ape
Hab
itat
Un
itPo
pu
lati
on
Est
imat
e (w
ork
sho
p)
& S
urv
ey D
etai
ls
Hab
itat
A
rea
(Ha)
(G
IS)
Low
er
Den
sity
es
tim
ate
Up
per
D
ensi
ty
esti
mat
eC
ON
FID
ENC
ELo
wer
Po
pu
lati
on
es
tim
ate
Up
per
Po
pu
lati
on
es
tim
ate
Man
gkut
up E
ast
(Sg
Ladi
ng)
unsurveyed,confirmedpresent
24,3
35
0.9
1.9
75%
164
347
Mur
ui -
Tim
pah
unsu
rvey
ed
11
,829
0.
91.
950
%53
112
Bloc
k B
(S o
f M
ain
Can
al)
unsurveyed,confirmedpresent
11,2
66
0.9
1.9
75%
7616
1
Baw
an
2.15
ind/
km2
in g
ood
habi
tat;
re
duci
ng t
o 0.
5 in
d/km
2 in
low
er
cano
py a
reas
(BN
F 20
10, B
awan
re
sear
ch a
rea
)
42,1
42
0.9
2.15
50%
190
453
Sung
ai M
urui
Hul
uun
surv
eyed
18
7,55
6 0.
91.
910
%16
935
6
Frag
men
ted
land
scap
e
70,8
38
0.9
1.9
10%
6413
5
K
apu
as-B
arit
o (
Maw
as)
60
3,77
9
2000
3096
Maw
as (B
lock
E)
2,07
0 (B
OSF
/Zur
ich
2002
-03
aeria
l+gr
ound
sur
veys
)
168,
203
0.9
1.23
100%
1514
2070
Man
tang
ai (B
lock
A)
400
(BO
SF/Z
uric
h 20
02-0
3 in
w
hat
was
the
n 40
,000
ha)
, hig
hly
frag
men
ted
& b
urnt
sin
ce
11,5
55
0.9
1.9
100%
104
220
Barit
o Te
ngah
(T
impa
h- B
unto
k-M
uara
Tew
eh-
Puru
kcah
u-Se
ihan
yu)
no in
fo o
n ha
bita
t or
sta
tus
or O
U
popu
latio
n. A
bsen
t or
rar
e in
CA
Pa
rara
wen
(pro
babl
y lo
catio
n of
C
A P
arar
aum
mis
pelle
d in
200
4 PH
VA)
36
7,69
2 0.
91.
910
%33
169
9
Frag
men
ted
land
scap
e
56,3
29
0.9
1.9
10%
5110
7
B
arit
o T
imu
r
101,
255
14
430
7
Sung
ai S
irau
(Cen
tral
K
alim
anta
n)Presenceconfirmed(FORINA/TNC
2013
; BN
F/U
MP
2016
)
14
,450
0.
91.
975
%98
206
126 Orangutan Population and Habitat Viability Assessment
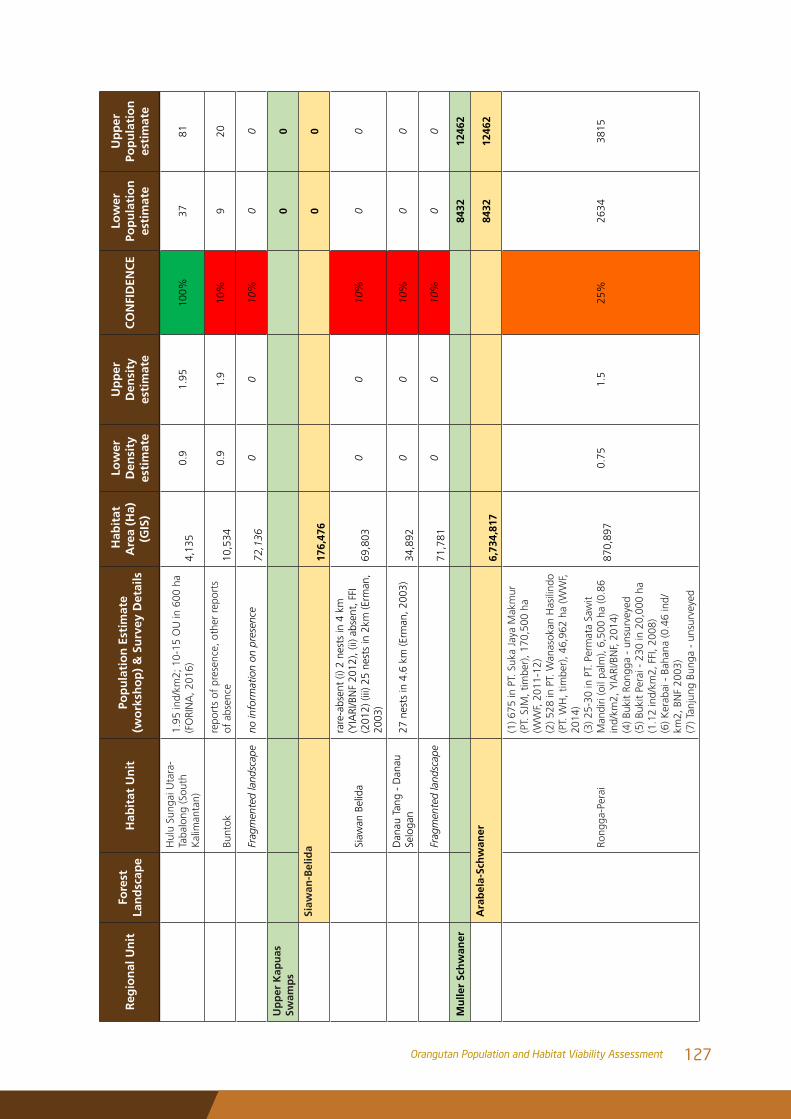
Reg
ion
al U
nit
Fore
st
Lan
dsc
ape
Hab
itat
Un
itPo
pu
lati
on
Est
imat
e (w
ork
sho
p)
& S
urv
ey D
etai
ls
Hab
itat
A
rea
(Ha)
(G
IS)
Low
er
Den
sity
es
tim
ate
Up
per
D
ensi
ty
esti
mat
eC
ON
FID
ENC
ELo
wer
Po
pu
lati
on
es
tim
ate
Up
per
Po
pu
lati
on
es
tim
ate
Hul
u Su
ngai
Uta
ra-
Taba
long
(Sou
th
Kal
iman
tan)
1.95
ind/
km2;
10-
15 O
U in
600
ha
(FO
RIN
A, 2
016)
4,
135
0.9
1.95
100%
3781
Bunt
okre
port
s of
pre
senc
e, o
ther
rep
orts
of
abs
ence
10,5
34
0.9
1.9
10%
920
Frag
men
ted
land
scap
eno
info
rmat
ion
on p
rese
nce
72,1
36
00
10%
00
Up
per
Kap
uas
Sw
amp
s
00
Si
awan
-Bel
ida
17
6,47
6
00
Siaw
an B
elid
a
rare
-abs
ent
(i) 2
nes
ts in
4 k
m
(YIA
RI/B
NF
2012
), (ii
) abs
ent,
FFI
(2
012)
(iii)
25
nest
s in
2km
(Erm
an,
2003
)
69,8
03
00
10%
00
Dan
au T
ang
- D
anau
Se
loga
n27
nes
ts in
4.6
km
(Erm
an, 2
003)
34,8
92
00
10%
00
Frag
men
ted
land
scap
e
71,7
81
00
10%
00
Mu
ller
Sch
wan
er
8432
1246
2
A
rab
ela-
Sch
wan
er
6,
734,
817
84
3212
462
Rong
ga-P
erai
(1) 6
75 in
PT.
Suk
a Ja
ya M
akm
ur
(PT.
SJM
, tim
ber)
, 170
,500
ha
(WW
F, 2
011-
12)
(2) 5
28 in
PT.
Wan
asok
an H
asili
ndo
(PT.
WH
, tim
ber)
, 46,
962
ha (W
WF,
20
14)
(3) 2
5-30
in P
T. P
erm
ata
Saw
it M
andi
ri (o
il pa
lm),
6,50
0 ha
(0.8
6 in
d/km
2, Y
IARI
/BN
F, 2
014)
(4
) Buk
it Ro
ngga
- u
nsur
veye
d (5
) Buk
it Pe
rai -
230
in 2
0,00
0 ha
(1
.12
ind/
km2,
FFI
, 200
8)
(6) K
erab
ai -
Bah
ana
(0.4
6 in
d/km
2, B
NF
2003
) (7
) Tan
jung
Bun
ga -
uns
urve
yed
87
0,89
7 0.
751.
525
%26
3438
15
127Orangutan Population and Habitat Viability Assessment
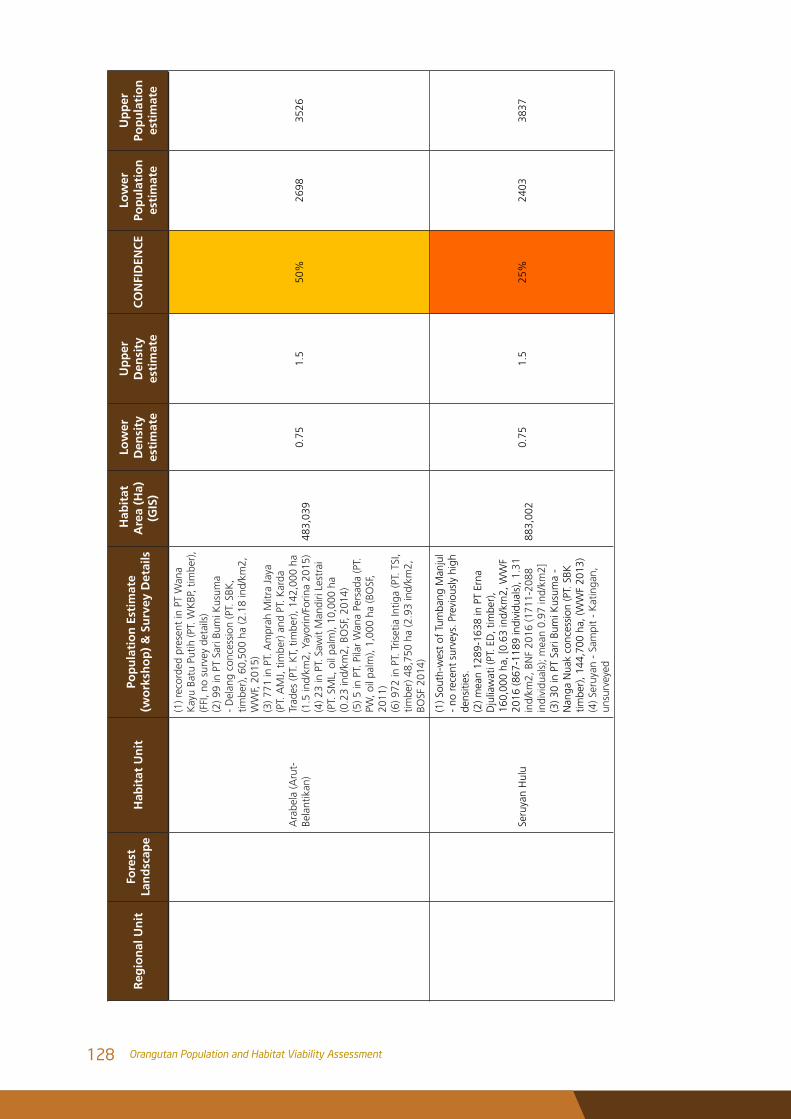
Reg
ion
al U
nit
Fore
st
Lan
dsc
ape
Hab
itat
Un
itPo
pu
lati
on
Est
imat
e (w
ork
sho
p)
& S
urv
ey D
etai
ls
Hab
itat
A
rea
(Ha)
(G
IS)
Low
er
Den
sity
es
tim
ate
Up
per
D
ensi
ty
esti
mat
eC
ON
FID
ENC
ELo
wer
Po
pu
lati
on
es
tim
ate
Up
per
Po
pu
lati
on
es
tim
ate
Ara
bela
(Aru
t-Be
lant
ikan
)
(1) r
ecor
ded
pres
ent
in P
T W
ana
Kay
u Ba
tu P
utih
(PT.
WK
BP, t
imbe
r),
(FFI
, no
surv
ey d
etai
ls)
(2) 9
9 in
PT
Sari
Bum
i Kus
uma
- D
elan
g co
nces
sion
(PT.
SBK
, tim
ber)
, 60,
500
ha (2
.18
ind/
km2,
W
WF,
201
5)
(3) 7
71 in
PT.
Am
prah
Mitr
a Ja
ya
(PT.
AM
J, t
imbe
r) a
nd P
T. K
arda
Tr
ades
(PT.
KT,
tim
ber)
, 142
,000
ha
(1.5
ind/
km2,
Yay
orin
/For
ina
2015
) (4
) 23
in P
T. S
awit
Man
diri
Lest
rai
(PT.
SM
L, o
il pa
lm),
10,0
00 h
a (0
.23
ind/
km2,
BO
SF, 2
014)
(5
) 5 in
PT.
Pila
r W
ana
Pers
ada
(PT.
PW
, oil
palm
), 1,
000
ha (B
OSF
, 20
11)
(6) 9
72 in
PT.
Tris
etia
Intig
a (P
T. T
SI,
timbe
r) 4
8,75
0 ha
(2.9
3 in
d/km
2,
BOSF
201
4)
48
3,03
9 0.
751.
550
%26
9835
26
Seru
yan
Hul
u
(1) S
outh
-wes
t of
Tum
bang
Man
jul
- no
rec
ent
surv
eys.
Pre
viou
sly
high
de
nsiti
es.
(2) m
ean
1289
-163
8 in
PT
Erna
D
julia
wat
i (PT
. ED
, tim
ber)
, 16
0,00
0 ha
, [0.
63 in
d/km
2, W
WF
2016
(867
-118
9 in
divi
dual
s), 1
.31
ind/
km2,
BN
F 20
16 (1
711-
2088
in
divi
dual
s); m
ean
0.97
ind/
km2]
(3
) 30
in P
T Sa
ri Bu
mi K
usum
a -
Nan
ga N
uak
conc
essi
on (P
T. S
BK
timbe
r), 1
44,7
00 h
a, (W
WF
2013
) (4
) Ser
uyan
- S
ampi
t -
Kat
inga
n,
unsu
rvey
ed
88
3,00
2 0.
751.
525
%24
0338
37
128 Orangutan Population and Habitat Viability Assessment
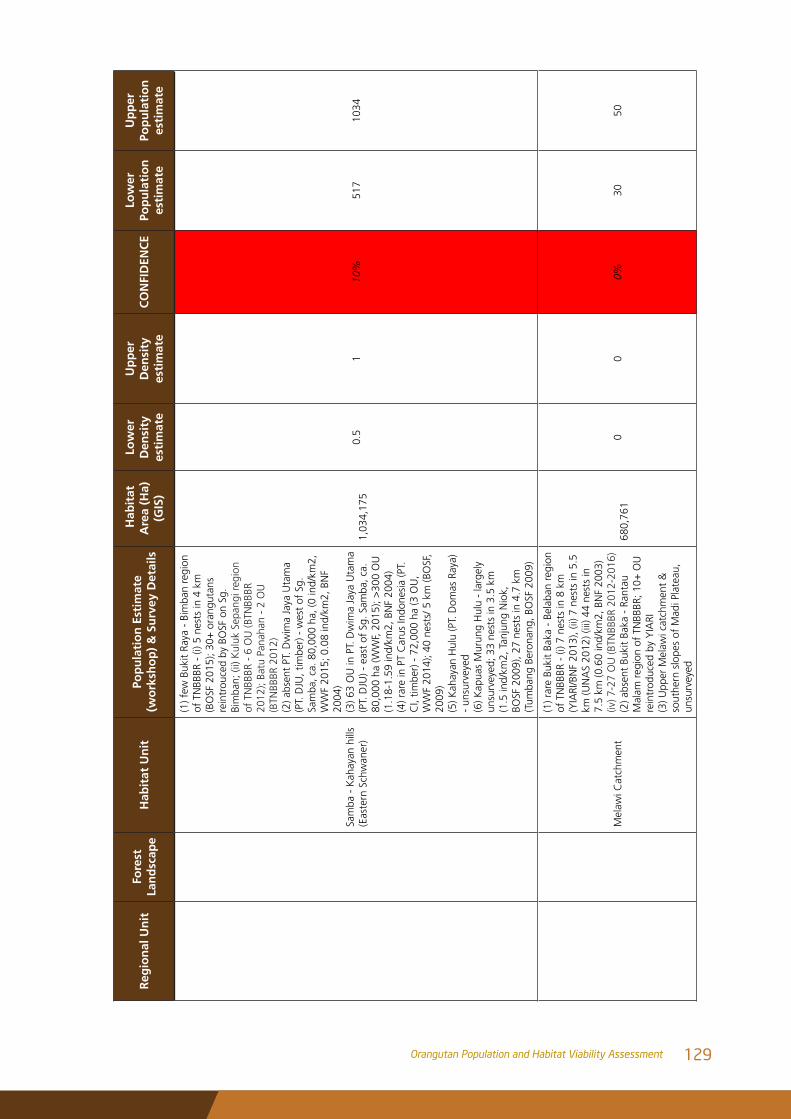
Reg
ion
al U
nit
Fore
st
Lan
dsc
ape
Hab
itat
Un
itPo
pu
lati
on
Est
imat
e (w
ork
sho
p)
& S
urv
ey D
etai
ls
Hab
itat
A
rea
(Ha)
(G
IS)
Low
er
Den
sity
es
tim
ate
Up
per
D
ensi
ty
esti
mat
eC
ON
FID
ENC
ELo
wer
Po
pu
lati
on
es
tim
ate
Up
per
Po
pu
lati
on
es
tim
ate
Sam
ba -
Kah
ayan
hill
s (E
aste
rn S
chw
aner
)
(1) f
ew B
ukit
Raya
- B
imba
n re
gion
of
TN
BBBR
- (i
) 5 n
ests
in 4
km
(B
OSF
201
5); 3
0+ o
rang
utan
s re
intr
ouce
d by
BO
SF o
n Sg
. Bi
mba
n; (i
i) K
uluk
Sep
angi
reg
ion
of T
NBB
BR -
6 O
U (B
TNBB
BR
2012
); Ba
tu P
anah
an -
2 O
U
(BTN
BBBR
201
2)
(2) a
bsen
t PT
. Dw
ima
Jaya
Uta
ma
(PT.
DJU
, tim
ber)
- w
est
of S
g.
Sam
ba, c
a. 8
0,00
0 ha
, (0
ind/
km2,
W
WF
2015
; 0.0
8 in
d/km
2, B
NF
2004
) (3
) 63
OU
in P
T. D
wim
a Ja
ya U
tam
a (P
T. D
JU) -
eas
t of
Sg.
Sam
ba, c
a.
80,0
00 h
a (W
WF,
201
5); >
300
OU
(1
.18-
1.59
ind/
km2,
BN
F 20
04)
(4) r
are
in P
T C
arus
Indo
nesi
a (P
T.
CI,
timbe
r) -
72,
000
ha (3
OU
, W
WF
2014
); 40
nes
ts/ 5
km
(BO
SF,
2009
) (5
) Kah
ayan
Hul
u (P
T. D
omas
Ray
a)
- un
surv
eyed
(6
) Kap
uas
Mur
ung
Hul
u -
larg
ely
unsu
rvey
ed; 3
3 ne
sts
in 3
.5 k
m
(1.5
ind/
km2,
Tan
jung
Nio
k,
BOSF
200
9), 2
7 ne
sts
in 4
.7 k
m
(Tum
bang
Ber
onan
g, B
OSF
200
9)
1,03
4,17
5 0.
51
10%
517
1034
Mel
awi C
atch
men
t
(1) r
are
Buki
t Ba
ka -
Bel
aban
reg
ion
of T
NBB
BR -
(i) 7
nes
ts in
8 k
m
(YIA
RI/B
NF
2013
), (ii
) 7 n
ests
in 5
.5
km (U
NA
S 20
12) (
iii) 4
4 ne
sts
in
7.5
km (0
.60
ind/
km2,
BN
F 20
03)
(iv) 7
-27
OU
(BTN
BBBR
201
2-20
16)
(2) a
bsen
t Bu
kit
Baka
- R
anta
u M
alam
reg
ion
of T
NBB
BR; 1
0+ O
U
rein
trod
uced
by
YIA
RI
(3) U
pper
Mel
awi c
atch
men
t &
so
uthe
rn s
lope
s of
Mad
i Pla
teau
, un
surv
eyed
68
0,76
1 0
00%
3050
129Orangutan Population and Habitat Viability Assessment
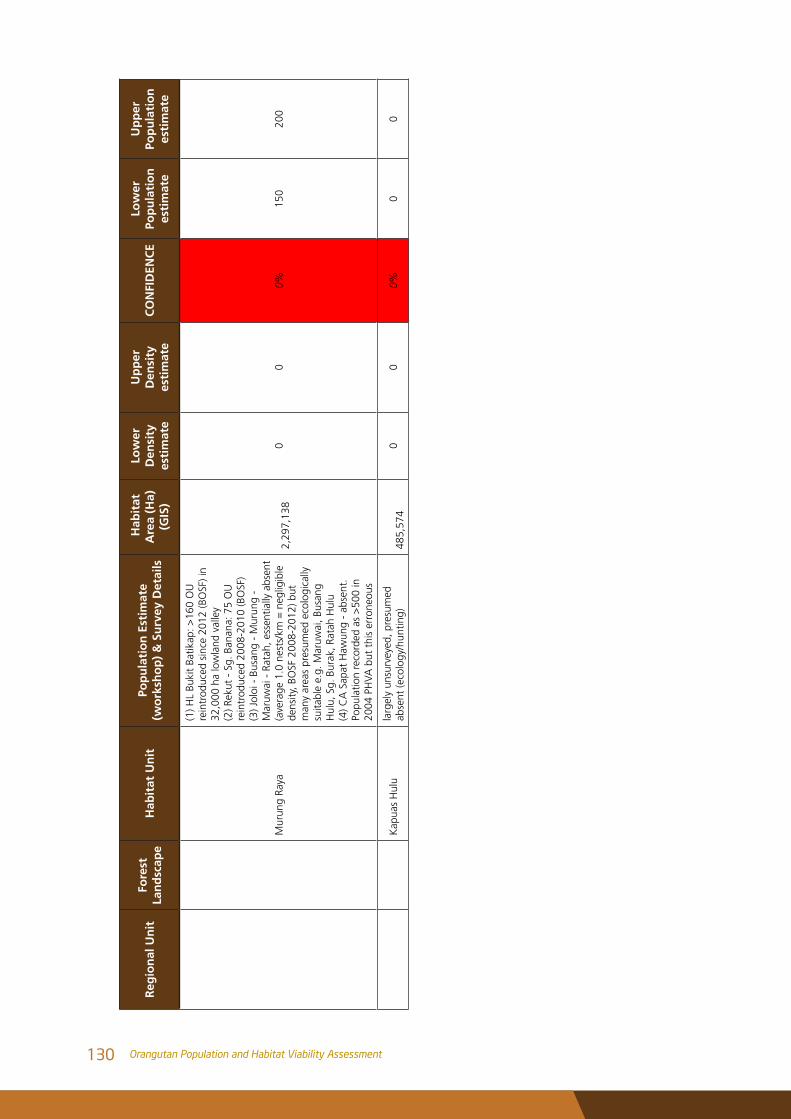
Reg
ion
al U
nit
Fore
st
Lan
dsc
ape
Hab
itat
Un
itPo
pu
lati
on
Est
imat
e (w
ork
sho
p)
& S
urv
ey D
etai
ls
Hab
itat
A
rea
(Ha)
(G
IS)
Low
er
Den
sity
es
tim
ate
Up
per
D
ensi
ty
esti
mat
eC
ON
FID
ENC
ELo
wer
Po
pu
lati
on
es
tim
ate
Up
per
Po
pu
lati
on
es
tim
ate
Mur
ung
Raya
(1) H
L Bu
kit
Batik
ap: >
160
OU
re
intr
oduc
ed s
ince
201
2 (B
OSF
) in
32,0
00 h
a lo
wla
nd v
alle
y (2
) Rek
ut -
Sg.
Ban
ana:
75
OU
re
intr
oduc
ed 2
008-
2010
(BO
SF)
(3) J
oloi
- B
usan
g -
Mur
ung
- M
aruw
ai -
Rat
ah, e
ssen
tially
abs
ent
(ave
rage
1.0
nes
ts/k
m =
neg
ligib
le
dens
ity, B
OSF
200
8-20
12) b
ut
man
y ar
eas
pres
umed
eco
logi
cally
su
itabl
e e.
g. M
aruw
ai, B
usan
g H
ulu,
Sg.
Bur
ak, R
atah
Hul
u (4
) CA
Sap
at H
awun
g -
abse
nt.
Popu
latio
n re
cord
ed a
s >
500
in
2004
PH
VA b
ut t
his
erro
neou
s
2,29
7,13
8 0
00%
150
200
Kap
uas
Hul
ula
rgel
y un
surv
eyed
, pre
sum
ed
abse
nt (e
colo
gy/h
untin
g)
485,
574
00
0%0
0
130 Orangutan Population and Habitat Viability Assessment