arxiv:nucl-ex/0108019v1 20 aug 2001arxiv:nucl-ex/0108019v1 20 aug 2001 measurementsand...
TRANSCRIPT

arX
iv:n
ucl-
ex/0
1080
19v1
20
Aug
200
1
Measurements and Simulations of Cherenkov
Light in Lead Fluoride Crystals ⋆
P. Achenbach a,1, S. Baunack a, K. Grimm a, T. Hammel a,D. von Harrach a, A. Lopes Ginja a, F.E. Maas a, E. Schilling a,
H. Stroher b
aInstitut fur Kernphysik, Johannes Gutenberg-Universitat, Becherweg 45, 55099
Mainz, Germany
bInstitut fur Kernphysik, Forschungszentrum Julich GmbH, 52425 Julich,
Germany
Abstract
The anticipated use of more than one thousand lead fluoride (PbF2) crystals as afast and compact Cherenkov calorimeter material in a parity violation experiment atMAMI stimulated the investigation of the light yield (L.Y.) of these crystals. Thenumber of photoelectrons (p.e.) per MeV deposited energy has been determinedwith a hybrid photomultiplier tube (HPMT). In response to radioactive sourcesa L.Y. between 1.7 and 1.9 p.e./MeV was measured with 4% statistical and 5%systematic error. The L.Y. optimization with appropriate wrappings and couplingswas investigated by means of the HPMT. Furthermore, a fast Monte Carlo sim-ulation based on the GEANT code was employed to calculate the characteristicsof Cherenkov light in the PbF2 crystals. The computing time was reduced by afactor of 50 compared to the regular photon tracking method by implementing de-tection probabilities as a three-dimensional look-up table. For a single crystal a L.Y.of 2.1 p.e./MeV was calculated. The corresponding detector response to electronsbetween 10 and 1000 MeV was highly linear with a variation smaller than 1%.
Key words: Cherenkov counters; lead fluoride; light yield; photoelectrondistributions; Monte Carlo simulationsPACS classification: 24.10 – Lx; 29.40 – Ka
⋆ This work is part of the doctoral thesis of P. Achenbach.1 Corresponding author. Tel.: +49 6131 39 22958; fax +49 6131 39 22964; e-mail:[email protected].
Preprint submitted to Elsevier Preprint 23 October 2018

1 Introduction
The A4 collaboration is preparing a measurement of the parity violating asym-metry A0 in elastic scattering of right and left handed electrons on an unpo-larized proton target at the Mainz Microtron MAMI [1]. An electromagneticcalorimeter was built in the years 1999 and 2000 to carry out the precisemeasurement with a total accuracy of δA0 < 5%. In order to obtain a clearseparation of events in the low energy tail of the elastic peak to a backgroundof photons from π0 decays, soft electrons and pions an energy resolution of
∆E/E ≤ 3.5%/√
E[GeV] in arrays of 3×3 detectors and a fast online calibra-tion are needed. This energy resolution not only depends on intrinsic showerand leakage fluctuations but also on the effective light yield (L.Y.). There-fore the number of photoelectrons (p.e.) per MeV deposited energy at a givenquantum efficiency of a photocathode is of great interest. Additionally, theeffect of non-linearities in the response, which might produce a degradation ofthe energy resolution, should be taken into account.
In the early nineties lead fluoride in its cubic lattice form (β-PbF2) was dis-covered as a Cherenkov radiator for electromagnetic calorimetry [2–4] becauseof its high transparency and compactness. The optical transmittance of theβ-PbF2 crystals extends below 270 nm, their radiation resistance is moder-ate [5] and the A4 collaboration decided to use them in order to exploit theirexcellent time response (< 20 ns). Since the L.Y. of β-PbF2 is low comparedto scintillating crystals a search for scintillation in doped and orthorhombicPbF2 was performed in recent years [6,7]. The measurements presented in thispaper have proved that the L.Y. of good quality crystals is sufficient for theirapplication in medium and high energy physics experiments. Two methods ofaccessing the L.Y. will be presented: on the one hand the use of low energyradioactive sources to measure photoelectron distributions and on the otherhand a Monte Carlo code to simulate the Cherenkov photon production anddetection in the crystals.
One has to consider that PbF2 only emits few photons per MeV of depositedenergy, which complicates conventional laboratory measurements. The detec-tion of single photons is usually performed by means of regular photomulti-plier tubes (PMTs) as well as by ultraviolet-sensitive multi-wire proportionalchambers (MWPCs). Both types of photon sensors are limited in their intrin-sic resolution by fluctuations in the number of secondary electrons producedat the first dynode of a PMT or in the avalanche around the anode wire of aMWPC. This limitation favors the use of the recently reinvented hybrid pho-tomultiplier tube (HPMT) with its excellent multiple photon separation andhigh efficiency. A HPMT consists of a reversely biased silicon P-I-N diode, inwhich highly accelerated photoelectrons create a few thousand electron-holepairs with much smaller statistical fluctuations. In Section 2 of this paper it
2

will be shown that a HPMT allows to study the effective L.Y. and relatedproperties of PbF2 crystals.
To realize the second method, the GEANT 3.21 Monte Carlo code [8] wasused. The transport of Cherenkov photons from the location of their produc-tion to the photocathode requires a step by step tracking through uniformattenuating media to the nearest boundaries. Usually, large computing timesare required because photons are refracted or reflected and the tracking has tocontinue until either absorption, detection or escape of the photons will occur.In Section 3 of this paper, a method is described that avoids the tracking assoon as a look-up table is generated, which tabulates the detection probabili-ties of a photon depending on its wavelength, its angle relative to the primaryparticle’s direction and its longitudinal location of production.
Section 4 provides the summary of the L.Y. measurements and simulations.
2 Measurements of the Light Yield
2.1 Experimental Arrangements
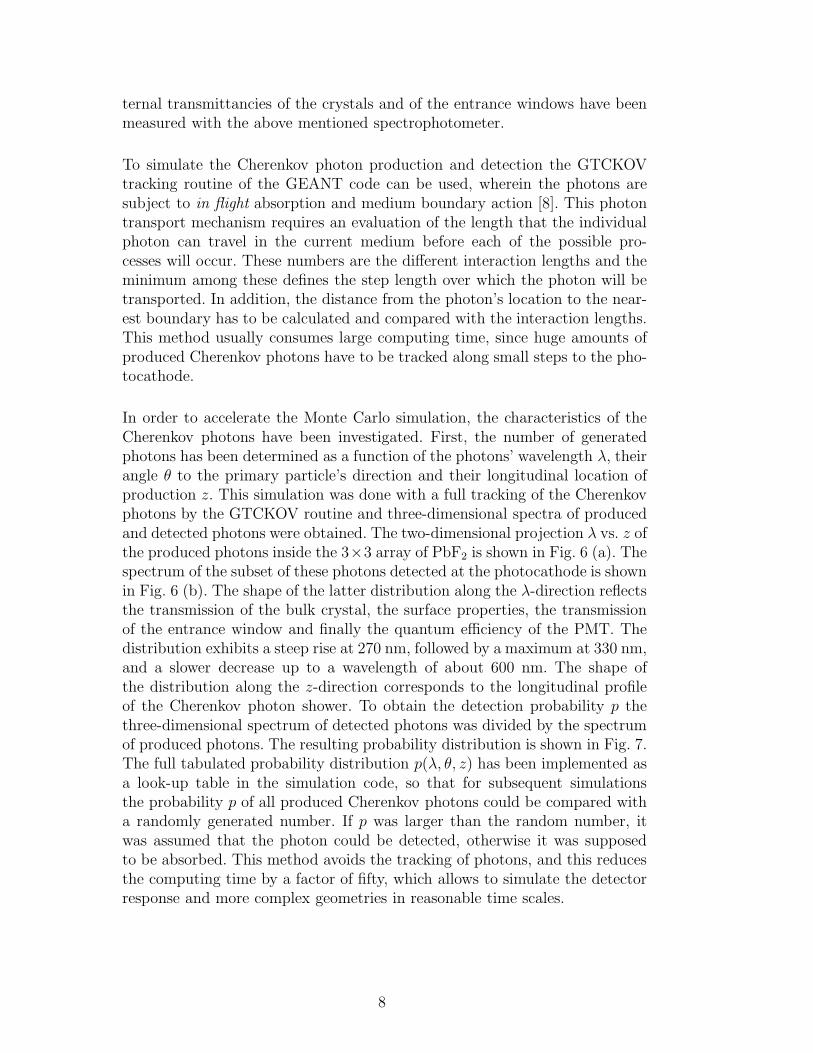
For the laboratory measurements at Mainz an electrostatically focused HPMTmanufactured by DEP 2 with a photocathode of 19 mm useful input diameterwas employed. The S20 photocathode featured a high quantum efficiency inthe ultraviolet region with 27% at 270 nm and 25% at 400 nm. The HPMTwas operated at −15 kV accelerating voltage and with an applied reversed-bias voltage of +90 V. Two electrodes at a potential of −11 kV providedthe focusing of the released photoelectrons onto a silicon P-I-N diode. Eachbombarding photoelectron led to the creation of ≈ 3500 electron-hole-pairs,causing an electrical current in the diode. This output signal was subsequentlyamplified by a low-noise charge pre-amplifier, which was built in the HPMThousing to avoid any unnecessary cabling capacitances by a direct charge cou-pling. Coincidences between the HPMT signal and a scintillating counter wereused to detect the cascading γ-decay of 60Co isotopes. The number of p.e. re-leased from the HPMT photocathode on a quartz window were counted toobtain the L.Y. of the crystal. The block diagramme in Fig. 1 (a) illustratesthe geometry of the detectors as well as the applied electronic components.The PbF2 crystal was read out by the HPMT whereas the plastic scintilla-tor opposite to the crystal was read out by a regular PMT. The source wasplaced between the two detectors. Most of the measurements were done withthe 60Co source, but during parts of the data taking a 90Sr source was used.
2 Delft Electronic Products BV, Roden, The Netherlands
3

Then the scintillator was read out by two coincidence detectors to define thetrigger, see Fig. 1 (b). This set-up allowed to measure events in which noparticle has hit the PbF2 crystal. A blue LED was used in separate calibra-tion measurements to obtain the HPMT characteristics. All detectors werelocated in a light-tight box. The crystal and the plastic scintillator were cou-pled with silicone rubber pads of Elastosil RT 601 with a high transparencyand good coupling reproducibility. The pre-amplifier signals have been shapedby a commercially available spectroscopy equipment. The energy spectra wererecorded by Constant Fraction Discriminators (CFDs) and Analog-to-DigitalConverters (ADCs) accessed by a CAMAC bus. The coincidence measure-ments exhibited almost no background, but dark counts contributed to falsecoincidences, i.e. random signals fell accidentally into the measurement gate.The dominant contribution to those counts is the thermal emission of electronsoff the photocathode. Its rate depends on the temperature and the stabiliza-tion time of the HPMT. Thirty minutes after switching the high voltage onthe rate of dark pulses had decreased exponentially to 5% of the initial rateto about 75 counts per second. After some hours of stabilization the rate hadfurther decreased to about 50 counts per second.
2.2 Performance of the HPMT
Measured photoelectron spectra such as the one shown in Fig. 2 have beenobtained with very short and highly attenuated LED pulses. The photoelec-tron distributions are composed of Gaussian shaped peaks corresponding tothe overlap of an integer number of released photoelectrons and a contin-uum. More than 10 photoelectron peaks are clearly separated. A calibra-tion of the obtained spectra in numbers of photoelectrons versus channelsof the ADC was possible with an accuracy of 0.026%, since the peak po-sitions showed a very high degree of linearity. The contrast function f =(Peak− Valley)/(Peak + Valley) calculated from the photoelectron peaks ofthe shown photoelectron distribution is presented in Fig. 3. The straightsolid line at 0.03, which is commonly defined as the limit of peak resolu-tion, crosses the exponentially fitted data points at 14 p.e., demonstrating theexcellent resolving power of the HPMT. Photon counting measurements withHPMTs of up to fifteen resolved photoelectron peaks have been reported byC. d’Ambrosio [9]. In contrast, PMTs could resolve only two or three photo-electron peaks.
The photoelectron peaks have been fitted and single photoelectron resolutionsσmeas = 10.7% (≈ 1.60 keV) were found almost independent on the peak po-sition. Two effects contribute to this variance: the fluctuations in the numberof electron-hole pairs σdiode and the electronic noise σnoise. The latter must notbe neglected in HPMT measurements, because the total gain of a HPMT is
4

of the order of a few thousand whereas the PMT gain is usually of the orderof 106 − 107. The set-up with the strontium source and the plastic scintillatoras a trigger allowed to measure the width of the pedestals in the ADC distri-butions of the HPMT spectra. The obtained variance of 9.5% (≈ 1.43 keV) ofthe pedestal peak corresponds to the electronic noise σnoise and can be sub-tracted in quadrature from the measured variance, resulting in the intrinsicresolution σdiode = 0.75 keV. The continuum in the spectrum is explained bybackscattering of the accelerated photoelectrons off the diode surface whichre-enter the diode at a smaller angle or with lower energy [9]. The ohmiccontact being responsible for the backscattering effect is ion implanted andits thickness amounts to only 0.05 µm. The fraction of backscattered eventscould be estimated by calculating the ratio of the continuous area to the peakarea, which was about 80%.
2.3 Analysis of the Photoelectron Distributions
In the first part of this study, several small PbF2 samples of the dimensions25× 25× 25 mm3 were used. The samples have been polished on all faces bythe manufacturer SICCAS. The average number of p.e. detected by the HPMTwas determined from the photoelectron distributions using the expression:
〈n〉meas =
∑
m qmNm∑
mNm
,
where qm is the calibrated channel number in p.e. and Nm the number ofcounts per channel. The number 〈n〉meas averaged over a series of measurementsamounted to (1.55± 0.06) p.e. with a good reproducibility. Some of the emit-ted γ-rays of the cobalt source undergo Compton scattering and transfer theirenergy to electrons which produce Cherenkov light. The maximum electronenergy can be calculated by using Emax
e= Eγ [1−(1+Eγ/m0c
2)−1] = 890 keV,where m0c
2 is the rest mass of the electron. Electrons with velocities belowthe Cherenkov threshold of βthr = 1/n ≈ 0.54 cannot contribute to the L.Y.;this limit is equivalent to a minimum electron energy Emin
e= 608 keV. Since
the number of emitted Cherenkov photons increases with the electron energy,a mean electron energy 〈E〉 ≈ 800 ± 40 keV can be used for evaluating thedetector response. Because significant changes have not been observed whencomparing the cobalt source spectra with the β-excited strontium source spec-tra, the assumed systematic error in the electron energy of 5% was confirmed.By dividing the mean number 〈n〉meas of p.e. by the mean energy 〈E〉 a L.Y.of 1.9 p.e./MeV was obtained. The calculated statistical error of the effectiveL.Y. of 4% is one order of magnitude larger than the one in the calibrationmeasurements. This is due to the low count rates using the Cherenkov radiatorPbF2 and could be improved by longer measurements.
5

In the second part of the study large size 302×150 mm3 crystals were investi-gated. Fig. 4 shows a typical photoelectron distribution where the scale is givenin numbers of photoelectrons. Their mean number 〈n〉meas = (1.38±0.05) p.e.corresponds to 1.7 p.e./MeV. The difference between the result of the sampleand the one of the large crystal is explained by the different light collectionefficiency, since this is a function of the crystal’s size, shape and surface finish.The use of a small sample reduces uncertainties in the light collection processdue to imperfections of the surface, because most of the light produced insidea sample directly reaches the photocathode.
2.4 Optimization of the Light Yield
Since only a small fraction of the produced Cherenkov photons is detected,the wrapping of the crystals could enhance their L.Y. However, the Cherenkovlight is peaked in the forward direction with respect to the primary particle’sdirection and the improvement is small compared to scintillation counters. Thelight collection efficiency for different wrappings was measured with the de-scribed set-up and the cobalt source. Wrapping materials investigated were ahigh density, porous, chalk-loaded polyethylene fleece Tyvek 3 in two differentthicknesses (≈ 75 µm and ≈ 150 µm), two types of PTFE Teflon (≈ 25 µm and≈ 80 µm), a nitrocellulose membrane 4 and a polyvinylidene fluoride namedImmobilon-P 5 (≈ 140 µm), which is commonly used as a transfer membrane.The reference L.Y. for the comparison was determined using the unwrappedcrystal. The light detected in this measurement is assumed to originate frominternal reflections at the polished crystals’ faces. Then, consecutive layers ofthe different reflectors have been added on all five faces. However, it is knownthat further layers of material compromise the gain in L.Y. due to the increas-ing amount of dead material between the crystals, which makes it possible forshower particles to escape the detector. The measured photoelectron distribu-tions have been analyzed according to the method described in the previoussection and the results are presented in Table 1. Using two layers of Teflon tapeor one layer of Immobilon-P gave the highest effective L.Y., confirming earlierresults obtained with a prototype PbF2 calorimeter at the MAMI Microtron.Both wrapping materials resulted in a 12% increase compared to a crystalwithout wrapping. For this reason the membrane Immobilon-P was chosen foruse in the final detector assembly of the A4 calorimeter. The membrane hasa nominal pore size of 0.45 µm, its mechanical strength is barely sufficient.It is hydrophobic, but it looses its reflectivity when exposed to moisture orcoupling grease.
3 Du Pont de Nemours, Le Grand Saconnex, Switzerland4 Biometra biomedizinische Analytik GmbH, Gottingen,Germany5 Millipore GmbH, Eschborn, Germany
6

Since the number of p.e. is strongly affected by the wavelength-dependentreflectivity of the wrapping material, a comparative measurement has beencarried out with the commercial double beam spectrophotometer ShimadzuUV-2101 PC. In Fig. 5 the diffuse reflectance R is shown as a function of thewavelength. The reflectivity of the Immobilon-P membrane reached 100% inthe visual area of the spectrum and started decreasing at about 310 nm.
To detect the propagating photons, they have to be transmitted through anair gap, an optical grease or a glue to the photocathode. The reflection lossesat these boundaries strongly depend on the difference in reflection indices ofthe PbF2 crystal and the optical coupling. To find the coupling with mini-mum losses in effective L.Y., the properties of different optical oils, greasesand glues were studied in the laboratory measurements. The best result hasbeen obtained with the two-component silicone rubber Elastosil RT 601 6 . Thecompound has a viscosity of 5000 mPa s, can be poured on the crystal, andcures at room temperature during 12 hours. Its refractive index (n = 1.41) issomewhat lower than that of the entrance window (n = 1.48) and significantlylower than that of PbF2 (n ≈ 1.82 at 400 nm). Curing a silicon layer of 0.1 mmthickness in direct contact with the PMT and the crystal not only provided agood optical coupling but also some adherence of the PMT and its base.
3 Monte Carlo Simulations
3.1 The Geometrical Set-up and the Detection Method
For the requirements of the A4 experiment the Cherenkov light production anddetection in PbF2 crystals have been simulated using the Monte Carlo codeGEANT 3.21 [8]. The geometrical set-up used was a matrix consisting of a 3×3array of tapered PbF2 crystals with 26×26 mm2 front faces and 30×30 mm2
readout faces and lengths of 150, 155 and 160 mm, all nine crystals pointingto the interaction vertex at a distance of about 105 cm. Air gaps of 300 µmbetween adjacent crystals have been implemented. The number of photons de-tected by the photon sensor has to be evaluated from their interactions at thecrystals’ surface. The reflection coefficient of the surface finish parameterizesits reflectivity from perfect smoothness to maximum roughness. A reasonablenumber of 90− 91% was found by a comparison with measurements compris-ing PbF2 crystals at the MAMI electron beam. This value includes the diffusereflectance of the Immobilon-P transfer membrane. The characteristics of 11
8
inch diameter Philips XP2910 PMTs with borosilicate entrance windows andbi-alkali cathodes have been used to simulate the photon detection. The in-
6 Wacker-Chemie GmbH, Burghausen/Obb., Germany
7
ternal transmittancies of the crystals and of the entrance windows have beenmeasured with the above mentioned spectrophotometer.
To simulate the Cherenkov photon production and detection the GTCKOVtracking routine of the GEANT code can be used, wherein the photons aresubject to in flight absorption and medium boundary action [8]. This photontransport mechanism requires an evaluation of the length that the individualphoton can travel in the current medium before each of the possible pro-cesses will occur. These numbers are the different interaction lengths and theminimum among these defines the step length over which the photon will betransported. In addition, the distance from the photon’s location to the near-est boundary has to be calculated and compared with the interaction lengths.This method usually consumes large computing time, since huge amounts ofproduced Cherenkov photons have to be tracked along small steps to the pho-tocathode.
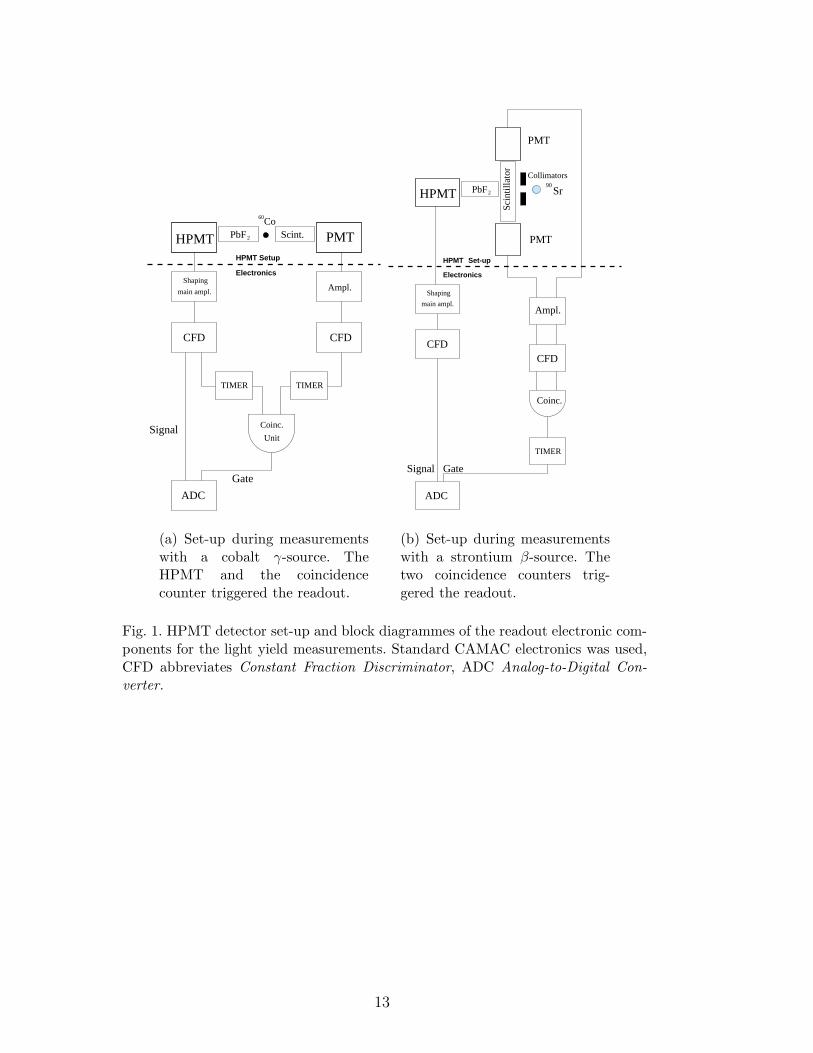
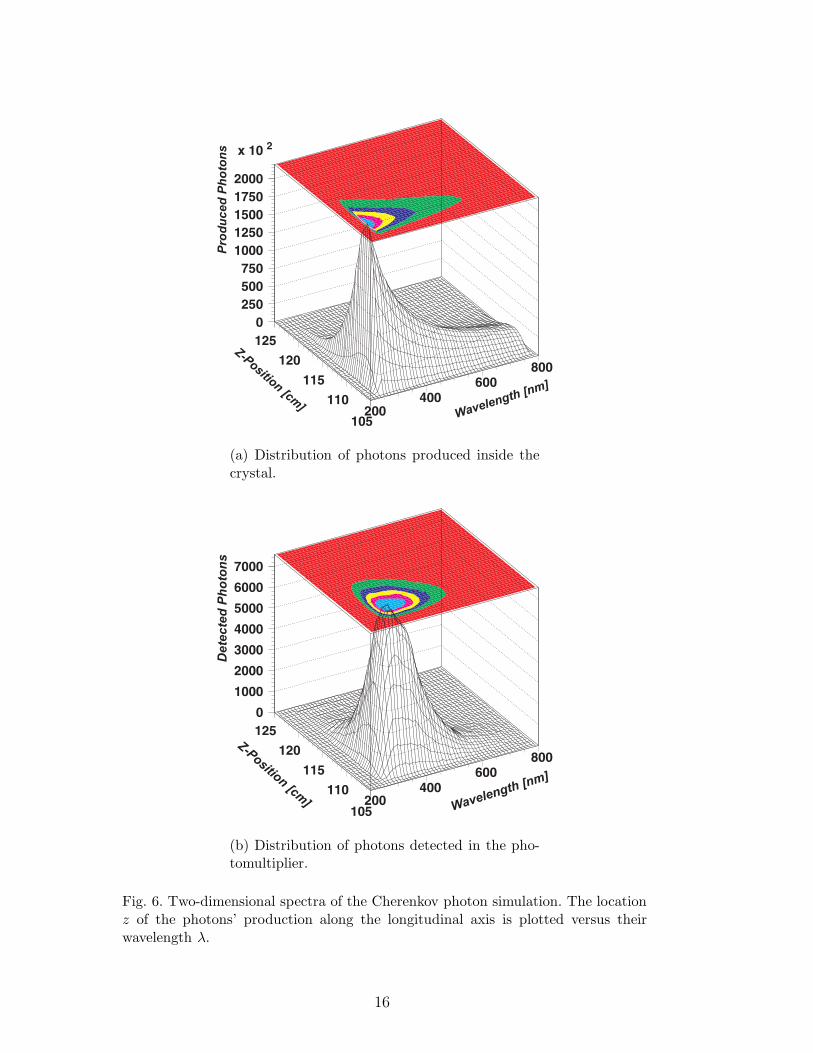
In order to accelerate the Monte Carlo simulation, the characteristics of theCherenkov photons have been investigated. First, the number of generatedphotons has been determined as a function of the photons’ wavelength λ, theirangle θ to the primary particle’s direction and their longitudinal location ofproduction z. This simulation was done with a full tracking of the Cherenkovphotons by the GTCKOV routine and three-dimensional spectra of producedand detected photons were obtained. The two-dimensional projection λ vs. z ofthe produced photons inside the 3×3 array of PbF2 is shown in Fig. 6 (a). Thespectrum of the subset of these photons detected at the photocathode is shownin Fig. 6 (b). The shape of the latter distribution along the λ-direction reflectsthe transmission of the bulk crystal, the surface properties, the transmissionof the entrance window and finally the quantum efficiency of the PMT. Thedistribution exhibits a steep rise at 270 nm, followed by a maximum at 330 nm,and a slower decrease up to a wavelength of about 600 nm. The shape ofthe distribution along the z-direction corresponds to the longitudinal profileof the Cherenkov photon shower. To obtain the detection probability p thethree-dimensional spectrum of detected photons was divided by the spectrumof produced photons. The resulting probability distribution is shown in Fig. 7.The full tabulated probability distribution p(λ, θ, z) has been implemented asa look-up table in the simulation code, so that for subsequent simulationsthe probability p of all produced Cherenkov photons could be compared witha randomly generated number. If p was larger than the random number, itwas assumed that the photon could be detected, otherwise it was supposedto be absorbed. This method avoids the tracking of photons, and this reducesthe computing time by a factor of fifty, which allows to simulate the detectorresponse and more complex geometries in reasonable time scales.
8

3.2 Simulated Properties of the Cherenkov Light
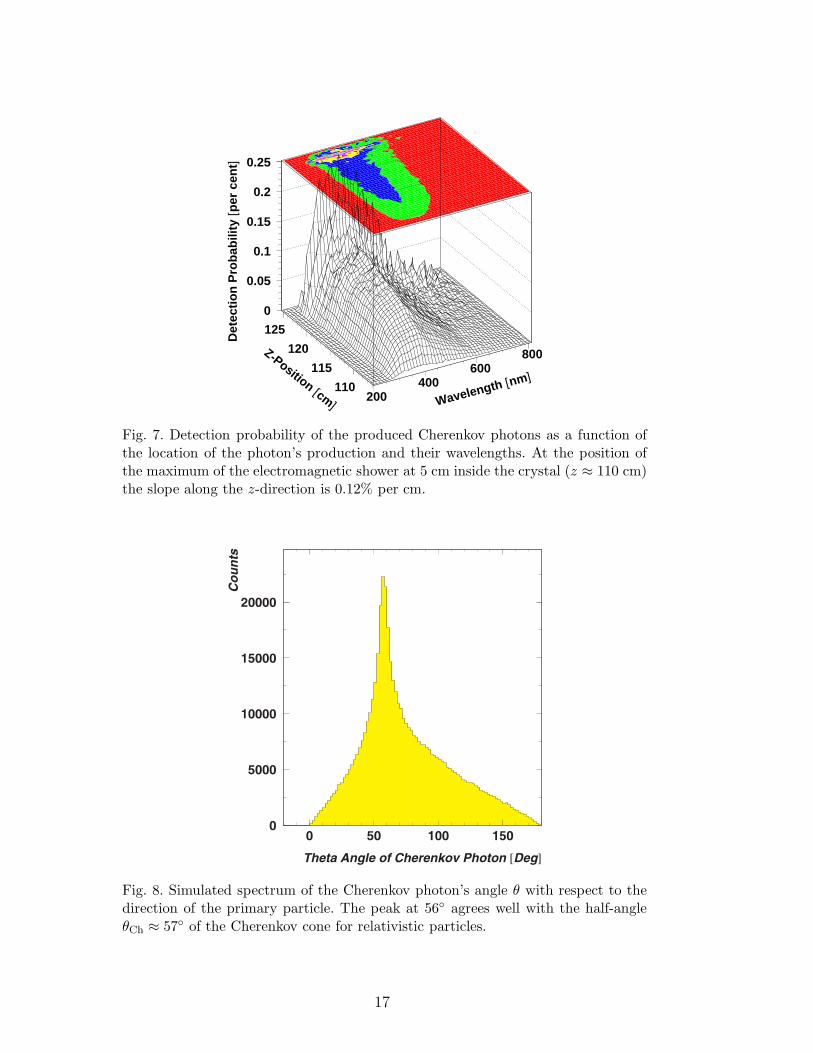
The half-angle θCh = arccos(1/nβ) of the Cherenkov cone is a characteristicobservable for a particle with velocity v = βc in a medium with the indexof refraction n. Depending on the lateral development of the electromagneticshower particles an angular distribution of the emitted Cherenkov photons asshown in Fig. 8 was evaluated. The maximum of the distribution at 56◦ isclearly pronounced, which corresponds to the half-angle θCh = 57◦ of relativis-tic leptons, but tails of the distribution reach 0 and 180 degrees. The calcu-lated number of radiating leptons per event was 〈n〉lep ≈ 219 lep./GeV. Thedistribution of the number of photons produced per centimeter path lengthextended from only few photons up to a limit of dN/dx ≈ 900 photons/cm.The strong rise to the limit is due to the low rest mass of the electrons andpositrons. The value of the obtained limit is in accordance with the theoreticalnumber, which can be calculated by the following equation [10]:
d2N
dxdλ=
2παz2
λ2
(
1−1
β2n2(λ)
)
The lateral distribution of the Cherenkov photons was found to be narrowerthan the distribution of the energy deposition in the electromagnetic shower.This is caused by the decreasing fraction of energy which is carried by theleptons with increasing depth inside the crystals [10] and due to the largerfraction of leptons with increasing lateral extension that have energies belowthe Cherenkov threshold of 608 keV. This results in an apparent Moliere radiusRM ≈ 1.8 cm which is smaller than the nominal radius RM = 2.2 cm (see e. g.[2]).
3.3 Light Yield and Detector Response
Cherenkov radiators are characterized by their effective L.Y. and their intrinsicnon-linearity. The best energy resolution will be achieved when the L.Y. islarge and proportional to the energy of the primary particle. Since 〈n〉lep issmall, its fluctuations δnlep = 6% at 734 MeV contribute considerably to theenergy resolution of the crystals. The total number of produced Cherenkovphotons amounted to nCh ≈ 20, 000 photons at 855 MeV, which is equivalentto 23.4 photons/MeV. This number, however, is of low significance, becausethe photons are subject to a multitude of processes reducing the number byabout 90%. For that reason it is more interesting to determine the number ofp.e. detected by a photon sensor of given type and sensitivity. This effectiveL.Y. is a function of nCh and depends on the light collection efficiency, thequantum efficiency and the efficiency of the photoelectron collection. In a
9

3 × 3 array the simulated L.Y. at 855 MeV was 〈n〉sim = (2163 ± 2) p.e.which corresponds to an effective L.Y. of 2.53 p.e./MeV. By using a set-upconsisting of only a single crystal a L.Y. of 2.10 p.e./MeV was calculated. Thisvalue was simulated at energies above 10 MeV and could be compared withthe low energy measurements, but one has to be aware that the simulationdoes not include small imperfections in the light and photoelectron collection.In contrast, the real crystals exhibited minor defects in the bulk material andon the surface. In addition, the detector response is degraded at such lowelectron energies. Together both facts presumably explain the small differencebetween the simulated and measured L.Y.
Calculations using different electron energies provided a measure of the detec-tor response and its differential non-linearity, which is defined by the variationin the L.Y. as a function of the energy of primary particle. At energies be-tween 10 and 1000 MeV the L.Y. increased monotonically between 2.52 and2.54 p.e./MeV. The projection of the detection probability distribution on theaxis of the photon’s longitudinal location of production p(z) is interesting interms of the non-linearity of the L.Y. As can be inferred from Fig. 7., its slopein z-direction is 0.12% per cm at the position of the shower maximum at 5 cminside the crystal (z ≈ 110 cm).
4 Summary
The L.Y. of the Cherenkov radiator PbF2 has been studied, because the parityviolation experiment at MAMI requires a good energy resolution of its elec-tromagnetic calorimeter and a high L.Y. of their crystals. It is shown that aHPMT can be used to obtain the effective L.Y. Measurements with a low en-ergy γ-source as well as with a β-source revealed a number of 1.7−1.9 p.e./MeVwith 4% statistical and 5% systematic error. The L.Y. was increased by us-ing appropriate wrappings on the crystal and a well adapted coupling to thephoton sensor. The latter results confirmed that the Immobilon-P membraneis the best wrapping material to be used with Cherenkov crystals.
Monte Carlo simulations have been performed in order to evaluate the L.Y. ofan electromagnetic calorimeter consisting of 3×3 PbF2 crystals. By establish-ing a method to accelerate the GEANT code a computing time reduction bya factor of fifty was achieved. Nevertheless, a simulation with full Cherenkovphoton tracking was still needed to obtain the detection probability distribu-tion. This approach was used to simulate various experimental implicationsand geometrical effects. An effective L.Y. of 2.1 p.e./MeV for a single PbF2
crystal was calculated, which agrees fairly well with the HPMT measurements,taking small imperfections of the crystal and a lower detector response at verylow energies into account. The L.Y. is very high compared to other Cherenkov
10

radiators and is needed to obtain the good energy resolution required by theparity violation experiment. Besides, the simulations predicted a very highlinearity of the response in the energy range between 10 and 1000 MeV witha variation smaller than 1%. This promising result confirms that PbF2 is verywell suited for its use as a calorimeter material, since larger non-linearitieswould have degraded the energy resolution.
Acknowledgement
The authors would like to thank J. Garcia from University of Valencia for hishelp during parts of the HPMT measurements.
References
[1] D. v. Harrach, Measurement of Parity Violating Electron Scattering onHydrogen, Proposal for an Experiment A4/1-93, Mainz Microtron MAMI,Gutenberg-University Mainz, Germany, 1993.
[2] D. F. Anderson et al., Lead Fluoride: an Ultra-compact Cherenkov Radiatorfor EM Calorimetry, Nucl. Instrum. Methods Phys. Research A290, 385–389(1990).
[3] C. L. Woody et al., A Study on the Use of Lead Fluoride for ElectromagneticCalorimetry, IEEE Trans. Nucl. Sci. 40(4), 546–551 (1993).
[4] R. D. Appuhn et al., Electromagnetic Calorimetry with Lead Fluoride Crystals,Nucl. Instrum. Methods Phys. Research A350, 208–215 (1994).
[5] P. Achenbach et al., Radiation Resistance and Optical Properties of LeadFluoride Cherenkov Crystals, Nucl. Instrum. Methods Phys. Research A416(2–3), 357–363 (1998).
[6] S. N. Baliakin et al., Deformation and Thermal Treatment Application toHeavy Scintillators Production, in HEAVY SCINTILLATORS for Scientific
and Industrial Applications, edited by F. de Notaristefani et al., pages 587–591,Gif-sur-Yvette Cedex, France, 1993, Editions Frontieres, Proc. ’CRYSTAL 2000’in Chamonix, France, September 22–26, 1992.
[7] D. F. Anderson et al., Search for Scintillation in Doped and Orthorhombic LeadFluoride, Nucl. Instrum. Methods Phys. Research A342, 473–476 (1994).
[8] Application Software Group, Geant Detector Description and Simulation Tool,CERN Computing and Networks Division, Geneva, Switzerland, 1994, CernProgram Library Long Writeup W5013.
11

[9] C. d’Ambrosio, T. Gys, D. Piedigrossi, D. Puertolas, and S. Tailhardat,Photoncounting with a Hybrid Photomultiplier Tube (HPMT), Nucl. Instrum.Methods Phys. Research A338, 389–397 (1994).
[10] Particle Data Group, Review of Particle Physics, Eur. Phys. Jour. C 15(1–4),1–878 (2000).
12
HPMT Setup
Electronics
CFD CFD
TIMERTIMER
Coinc.
Unit
PbF2
Gate
Signal
Ampl.
ADC
Scint.
60Co
Shaping
HPMT
main ampl.
PMT
(a) Set-up during measurementswith a cobalt γ-source. TheHPMT and the coincidencecounter triggered the readout.
Collimators
HPMT Set-up
Electronics
Scin
tilla
tor
2PbF
TIMER
CFD
ADC
GateSignal
HPMT
Shaping
main ampl.
PMT
Sr90
CFD
Ampl.
Coinc.
PMT
(b) Set-up during measurementswith a strontium β-source. Thetwo coincidence counters trig-gered the readout.
Fig. 1. HPMT detector set-up and block diagrammes of the readout electronic com-ponents for the light yield measurements. Standard CAMAC electronics was used,CFD abbreviates Constant Fraction Discriminator, ADC Analog-to-Digital Con-
verter.
13

Number of Photoelectrons
Co
un
ts
300
400
500600700800900
1000
2000
3000
4000
0 2 4 6 8 10 12
Fig. 2. Photoelectron distribution of highly attenuated LED pulses that have beenmeasured with the HPMT. The distribution is composed of Gaussian shaped peaksand a continuum. Note the large peak-to-valley ratio of the first photoelectron peak.
Photoelectron Peak
Co
ntr
ast
Fu
nct
ion
0
0.2
0.4
0.6
0.8
0 2 4 6 8 10 12 14
Fig. 3. The HPMT contrast function f which was calculated from the photoelectronpeaks of the LED pulse measurements. The straight solid line at 0.03, which iscommonly defined as the limit of peak resolution, crosses the exponentially fitteddata points at 14 p.e.
14

Number of Photoelectrons
Co
un
ts
1
10
10 2
10 3
10 4
0 1 2 3 4 5 6
Fig. 4. A typical photoelectron distribution of a PbF2 crystal from the series ofmeasurements with the 60Co γ-source. The distribution corresponds to the meannumber of photoelectrons 〈n〉meas = (1.38 ± 0.05) p.e. from which a L.Y. of 1.7p.e./MeV was derived.
Wavelength [nm]
Dif
fuse
Ref
lect
ance
[%]
0
20
40
60
80
100
200 300 400 500 600 700 800
Fig. 5. Diffuse reflectance of wrapping materials. The different types of materialare encoded as follows: solid line = Immobilon-P (Millipore); dot-dashed = Tyvek(Du Pont); narrow dots = office paper; dashed = Teflon; wide dots = nitrocellulosemembrane (Biometra).
15
(a) Distribution of photons produced inside thecrystal.
(b) Distribution of photons detected in the pho-tomultiplier.
Fig. 6. Two-dimensional spectra of the Cherenkov photon simulation. The locationz of the photons’ production along the longitudinal axis is plotted versus theirwavelength λ.
16
Wavelength [nm]
Z-Position [cm]
Det
ecti
on
Pro
bab
ility
[per
cen
t]
200400
600800
110
115
120
125
0
0.05
0.1
0.15
0.2
0.25
Fig. 7. Detection probability of the produced Cherenkov photons as a function ofthe location of the photon’s production and their wavelengths. At the position ofthe maximum of the electromagnetic shower at 5 cm inside the crystal (z ≈ 110 cm)the slope along the z-direction is 0.12% per cm.
Fig. 8. Simulated spectrum of the Cherenkov photon’s angle θ with respect to thedirection of the primary particle. The peak at 56◦ agrees well with the half-angleθCh ≈ 57◦ of the Cherenkov cone for relativistic particles.
17

Table 1Effective light yield (L.Y.) of a PbF2 crystal wrapped in several layers of differentreflective materials. The thickness of the wrapping defines the dead material betweenadjacent crystals.
Wrapping Material No. of Layers Thickness [µm] L.Y. [%]
Immobilon-P 1 140 112.1
Teflon Tape 2 160 112.1
Teflon + Al 4 + 1 100 + 35 111.5
Teflon 3 75 110.5
Teflon Tape 1 80 109.7
Tyvek 1 140 108.6
Teflon + Al 3 + 1 75 + 35 108.0
Tyvek 1 80 106.9
Teflon 2 50 106.5
Office Paper 1 100 105.8
Teflon 1 25 102.7
Unwrapped 100.0
18