practicas concertadas en una economia pequeña
TRANSCRIPT

8/6/2019 Practicas concertadas en una economia pequeña
http://slidepdf.com/reader/full/practicas-concertadas-en-una-economia-pequena 1/61Electronic copy available at: http://ssrn.com/abstract=1799336Electronic copy available at: http://ssrn.com/abstract=1799336
No. 2011-037
EXPLORING NATIONAL CONCERTED PRACTICES IN AN
OPEN SMALL ECONOMY: WHAT DOES THE CHANGE IN THE
COMPETITION LAW IN THE NETHERLANDS REVEAL?
By Fatih Cemil Ozbugday
March, 2011
ISSN 0924-7815
8/6/2019 Practicas concertadas en una economia pequeña
http://slidepdf.com/reader/full/practicas-concertadas-en-una-economia-pequena 2/61Electronic copy available at: http://ssrn.com/abstract=1799336Electronic copy available at: http://ssrn.com/abstract=1799336
1
Exploring National Concerted Practices in an Open Small Economy
Exploring National Concerted Practices in an Open Small
Economy: What Does the Change in the Competition Law
in the Netherlands Reveal?
Fatih Cemil Ozbugday
The CentER Graduate School & Tilburg Law and Economics Center (TILEC), Tilburg University,
Tilburg, the Netherlands.
Address: Room K 421, PO Box 90153, 5000 LE Tilburg
e-mail: [email protected]
Fax: + 31 13 466 3042
Telephone: +31 13 466 4037
8/6/2019 Practicas concertadas en una economia pequeña
http://slidepdf.com/reader/full/practicas-concertadas-en-una-economia-pequena 3/61
2
Abstract
The present study examines the impact of several industry characteristics on the propensity to
collude using a dataset on the existence of collusion across Dutch industries during the late
1990s and early 2000s. The results of the Probit model with sample selection indicate that our
sample of Dutch concerted practices is non-random in the sense that it only consists of anti-
competitive agreements that were subject of an antitrust immunity behavior. Our bivariate
probit model with sample selection indicates that concerted practices are less likely to be seen
in service industries relative to manufacturing industries. The results also show that it is more
likely that firms engaged in concerted practices in unconcentrated industries. Furthermore,
we could not find a non-linear relationship between concentration and the presence of
collusion. There is also strong evidence from all the regressions that concerted practices are
less likely in industries where entry is more possible. Interestingly, our estimation results
indicate that there is a positive correlation between cartel prevalence and import penetration,
which implies that import competition did not discipline firm behavior and foreign importers
joined the cartel paradise in the Netherlands. As to the role of measures of asymmetry on
concerted practice prevalence, the association between patenting activity and propensity to
engage in collusion is ambiguous in the current setting, while advertising intensity, as the
second measure of asymmetry, is associated with increased likelihood of collusion. Contrary
to the previous empirical findings, market growth has been found to have a negative effect on
the probability of a concerted practice in an industry. Furthermore, our proposition that
growing demand might attract new entrants, which, in turn, hampers collusion, has been
falsified in the current context.
Key Words: Cartels, Competition law, Overt collusion, Probit model with sample selection,
the Netherlands

8/6/2019 Practicas concertadas en una economia pequeña
http://slidepdf.com/reader/full/practicas-concertadas-en-una-economia-pequena 4/61
3
1. Introduction
Even though the benefits of unfettered competition have been well-documented and well-
understood in economic theory, markets in daily life have been characterized by many forms
of multilateral anti-competitive behaviors known as cartel formation or collusion. For
instance, a study by Clarke and Evenett (2003) reports that during the 1990s, the European
Commission and the United States Department of Justice between them prosecuted over 40
cross-border cartels that involved private firms. If one takes the within-border cartel cases
and undetected cartels into account, the number is enormous.
More importantly than the number of cartel cases, the damage they give to the economy has
made economists and policymakers worry about the phenomenon of collusion. A recent study
by Connor (2004) reveals that the median increase in price resulting from collusion was about
25 %, which shows how effective these collective agreements among firms are. Similarly,
Griffin (1989) finds that cartels in his sample charged a 45 % markup over marginal costs on
average.
Given the enormity of cases, and the welfare transfers they have caused, the detection of
cartels- which is a longstanding antitrust problem- is highly essential. In this respect, it is
important for regulatory bodies to develop structural screens to forecast where and under
which conditions cartels are more likely to be formed, which will help them allocate
investigative resources where they would be most constructive. According to Harrington
(2008), this screening process is the first stage of a multi-stage process of the detection of
cartels, which is followed by verification and prosecution. Basically, the role of screening is
to identify candidates that are worthy of closer scrutiny for verification process, which
requires extensive analysis to distinguish competition and collusion.
8/6/2019 Practicas concertadas en una economia pequeña
http://slidepdf.com/reader/full/practicas-concertadas-en-una-economia-pequena 5/61
4
Even though in most antitrust cases, detection process is initiated by complaints from
competitors and/or buyers, and leniency programs; structural screens that combine economic
theory with data can also serve as a screening function1
. Indeed, a considerable interest in the
theory of collusion is reflected in the literature over the past few decades, which may serve as
a guideline for developing screens. Yet, in spite of the vast theoretical literature on the factors
facilitating or hampering collusion, empirical studies examining industry characteristics that
affect the likelihood of observing a collusive practice using direct evidence are sparse.
When developing such structural screens in which industry characteristics bearing on the
likelihood of collusion are assessed, the endogeneity of market structure and non-random
sample problems should be taken into account. This study is the first empirical study on
industry characteristics bearing on the likelihood of collusion which considers both
endogeneity and sample selection problems. Since there is not a formal econometric
procedure to handle both endogeneity and sample selection issues simultaneously, we have
considered using lagged values of explanatory variables to alleviate the endogeneity problem,
short of using instrumental variables. Having reviewed the empirical literature on industry
characteristics bearing on the likelihood of collusion, in order to develop a variant of the
structural screens mentioned above, the current study examines the impact of several industry
characteristics on the propensity to collude using a dataset on the existence of collusion
across Dutch industries during the late 1990s and early 2000s. The final sample employed for
the econometric analysis of the presence of collusion in this paper contains 112 industries.
The econometric results, inter alia, suggest that our sample of Dutch concerted practices is
1 The difference between screening and verification is that screening identifies suspicious practice, but does not
provide final evidence of collusion.
8/6/2019 Practicas concertadas en una economia pequeña
http://slidepdf.com/reader/full/practicas-concertadas-en-una-economia-pequena 6/61
5
non-random in the sense that it only consists of anti-competitive agreements that were subject
of an antitrust immunity seeking behavior. Our bivariate probit model with sample selection
indicates that concerted practices are less likely to be seen in service industries relative to
manufacturing industries. The results also show that it is more likely that firms engaged in
concerted practices in unconcentrated industries, everything else being equal. The relevant
explanation for this counter-intuitive finding is that cartels prevailed in unconcentrated
industries thanks to the trade associations that brought all those firms together to involve in
restrictive practices. Furthermore, we could not find a non-linear relationship between
concentration and the presence of collusion.
There is also strong evidence from all the regressions that concerted practices are less likely
in industries where entry is more possible. Interestingly, our estimation results indicate that
there is a positive correlation between cartel prevalence and import penetration, which
implies that import competition did not discipline firm behavior and foreign importers joined
the cartel paradise in the Netherlands. As to the role of measures of asymmetry on concerted
practice prevalence, the association between patenting activity and propensity to engage in
collusion is ambiguous in the current setting, while advertising intensity, as the second
measure of asymmetry, is associated with increased likelihood of collusion. This second
counter-intuitive finding of the analysis can be explained by the fact that advertisement costs
can also serve as entry barriers which increase the likelihood of collusion.
Contrary to the previous empirical findings, market growth has been found to have a negative
effect on the probability of a concerted practice in an industry. Seemingly, the theoretical
prediction that collusion is easier to sustain under higher rates of growth has been offset by other
mechanisms that we cannot observe in the current setting. A possible explanation might be that
higher demand uncertainties that are arising from fast growth might dominate the effect of growth
8/6/2019 Practicas concertadas en una economia pequeña
http://slidepdf.com/reader/full/practicas-concertadas-en-una-economia-pequena 7/61
6
itself. Furthermore, our proposition that growing demand might attract new entrants, which, in
turn, hampers collusion, has been falsified in the current context.
The remainder of the paper is as follows: Section 2 presents a review of prior empirical
research on factors that facilitate or hinder collusion. Section 3 explains the institutional
background and gives the details of data employed in this study. Section 4 introduces the
econometric model and Section 5 presents the results. Finally Section 6 concludes.
2. A Review of Prior Empirical Research
Throughout the economic literature there have been various empirical studies examining the
functioning of cartels. These empirical studies mostly rely on the details published by
antitrust authorities on uncovered illegal cartels and the records of legal cartels survived in
the past. For instance, Porter (1983) examines price wars in a railroad cartel in the late 1800s
in the U.S. Genesove and Mullin (1998) study the American Sugar Industry cartel during the
late 1800s and early 1900s. Recently, Röller and Steen (2006) have analyzed the Norwegian
legal cement cartel for the period 1955-1968 to study the effectiveness of the cartel.
However, for a more comprehensive overview of the workings of cartel, the reader might
refer to Harrington (2006), in which details about cartels from about 20 European
Commission decisions over 1999-2004 are examined, and to Levenstein and Suslow (2006),
who study 19 case studies of various individual cartels
Apart from the studies focusing on the workings of cartels, another strand of the literature has
focused on the factors having an impact on cartel stability on an aggregate level. This strand
of the literature has mainly centered on characteristics influencing cartel duration and cartel
formation, which are the most common measures of cartel effectiveness, since they are the

8/6/2019 Practicas concertadas en una economia pequeña
http://slidepdf.com/reader/full/practicas-concertadas-en-una-economia-pequena 8/61
7
most easily gauged. As Levenstein and Suslow (2006) put, we would, ideally, like to compare
the prices and profits that prevailed with what would have occurred absent the cartel.
Nevertheless, this type of counterfactual analysis is barely undertaken in the literature.
Instead, empirical cartel studies have revolved around factors impacting the stability of
cartels using the information demonstrated in court decrees.
Theoretical foundations of the above-mentioned factors are firmly established in theories of
collusion. The term “collusion” is basically understood as a cooperative agreement that is
self-enforcing by nature as these agreements cannot be legally contracted most of the time.
Thence, thanks to the self-enforcing nature of collusion, repeated interactions (over time and
across markets) among firms provide the necessary incentives for colluding. Accordingly,
theoretical scholars have invoked to the theory of repeated games to model the stability of
collusion.
To illustrate this repeated game setting mathematically, let us consider the following
condition necessary for a collusion to be sustained:
Π
> Π
=0
[1]
That is:
Π
− Π
> 0
=0

8/6/2019 Practicas concertadas en una economia pequeña
http://slidepdf.com/reader/full/practicas-concertadas-en-una-economia-pequena 9/61
8
[2]
where
Π is the one-period profit jointly maximized,
Π is the one-period monopoly profit,
is the number of firms in the industry, and is the discount rate (Tirole, 1988, p. 247-48).
This condition ensures that the threshold discounted expected future profits net of one-period
monopoly profit resulting from cheating must be positive so that collusion is sustainable.
As can be seen from the necessary condition stated in equations (1) and (2), to determine
whether collusion is sustainable, the discount factor is of crucial importance. It actually
shows how patient firms are. For instance, for impatient firms with a lower discount factor;
that is, for firms putting a higher weight on current profits relative to expected future profits,
it is harder to sustain collusion. Conversely, it is easier to sustain collusion for patient firms
with a higher discount factor; that is, for firms putting a lower weight on current profits
relative to expected future profits. However, all in all, the overall sustainability of collusion
hinges on the critical threshold for the discount factor notwithstanding very high or very low
discount factors firms have. Stated more precisely, the discount factors firms participating in
a collusive agreement have must exceed the critical threshold for the discount factor in order
for collusion to be maintained. Consequently, the lower this threshold is, the easier a
collusion to be kept up.
As expressed by Ivaldi et al. (2003), the determination of this critical threshold provides a
background for evaluating the extent for collusion. Stated more explicitly, in order to gauge
the effect of the industry characteristics on the likelihood of collusion, we can eyeball how
these industry characteristics would have an influence on this critical threshold. While a
8/6/2019 Practicas concertadas en una economia pequeña
http://slidepdf.com/reader/full/practicas-concertadas-en-una-economia-pequena 10/61
9
collusion-hindering factor will raise this critical threshold, a facilitating factor will decrease
it.
I review below the main characteristics associated with the (in)stability of collusion, chiefly
by examining how these factors influence the above-mentioned threshold. In doing so, I refer
to the empirical studies analyzing these factors. For theoretical studies, one can refer to the
comprehensive review by Feuerstein (2005).
2.1. Factors Impacting Collusion
I draw on the classification made by Ivaldi et al. (2003) in identifying the relevant factors
affecting the sustainability of collusion. First, there are some structural variables that are
associated with the extent and characteristics of competition such as entry barriers, market
transparency, and the number of competitors etc. Second, there are factors from the demand
side that are associated with the evolution of demand in the market: how volatile is the
market demand? Does the market have future growth prospects? Are there considerable
business cycles in the market? Third, there are characteristics associated with the supply side,
which are mostly related to the degree of asymmetry among firms in the market: Is there
radical innovation in production technologies? Do firms have symmetric structures? To what
extent does the product differentiation take place?
Based on the classification described in the previous paragraph, this section reviews the
impact of various industry features that have been identified by previous empirical literature
to have impact on the stability of collusion.
2.1.1. Structural Variables

8/6/2019 Practicas concertadas en una economia pequeña
http://slidepdf.com/reader/full/practicas-concertadas-en-una-economia-pequena 11/61
10
The concept of market structure is central to industrial organization literature. It essentially
stands on the factors that are believed to have an impact on the extent and characteristics of
competition. Hence, these factors, which can also be entitled as structural variables, by
nature, are the factors affecting the sustainability of collusion. Among these structural
variables, the number of competitors, entry barriers, market transparency, and the degree of
firms’ interaction are the most noteworthy ones.
In what follows, I review the structural variables that the literature has singled out as being
pertinent when evaluating the sustainability of collusion within a market. Nonetheless, one
should bear in mind that these variables are neither necessary nor sufficient for a collusion to
be maintained, but solely influence the likelihood that collusion is sustained. A final caveat is
that these structural variables might be endogenous. That is, these characteristics may be the
outcome of a collusive act by firms in the industry rather than being factors ex-ante affecting
the likelihood of collusion.
2.1.1.1. Number of Firms
The number of competitors in the market is a crucial factor in determining the likelihood of
collusion. Correspondingly, the concentration measures of the industry such as Hirschman-
Herfindahl Index (HHI) are also important determinants of collusion. In general, a small
number of firms in the industry, which corresponds to a high-level of concentration, is
associated with a high probability of collusion. The main reason is that coordination is more
difficult, the larger the number of participants involved. Accordingly, a large number of
parties make deviations from the collusive contract harder to track. Furthermore, the larger
the number of firms involved, the lower a share they get from the jointly-maximized profits,

8/6/2019 Practicas concertadas en una economia pequeña
http://slidepdf.com/reader/full/practicas-concertadas-en-una-economia-pequena 12/61
11
which makes deviations from collusive agreements more attractive and punishments to these
deviations by other competitors less costly.
Beyond what has been said, the participants can have different views about the optimal price,
since their cost structures vary and/or their views about demand conditions might diverge.
Consequently, as Hey and Kelley (1974) puts, the smaller the number of competitors, the less
likely it is that these differences will appear.
Empirical evidence concerning the impact of the number of firms in the industry or the
concentration on the likelihood of collusion conforms to the theoretical predictions with few
exceptions. Hay and Kelley (1974) examined the violations prosecuted by the Antitrust
Division and found that these cases appear to be in concentrated markets. Asch and Seneca
(1975) analyzed a sample of 101 large manufacturing corporations- of which 51 are colluders
and of which 50 are randomly selected non-colluders- for the period 1958-1967 in U.S. They
concluded that firms in highly concentrated industries characterized by low entry barriers are
more collusion prone. Likewise, Fraas and Greer (1977) analyzed the formal legal actions of
the Antitrust Division of the U.S. Department of Justice against illegal (explicit) price fixing
arrangements. Using non-parametric statistical techniques, they revealed that relatively small
number of competitors is favorable to the presence of collusion. Grout and Sonderegger
(2005) investigated cartel evidence using European Commission cases from 1990 to 2005 and
the U.S. Department of Justice horizontal price fixing cases from 1994 to 2005, and found
that concentration in the form of market share of the largest three firms is positively linked to
cartel formation.
8/6/2019 Practicas concertadas en una economia pequeña
http://slidepdf.com/reader/full/practicas-concertadas-en-una-economia-pequena 13/61
12
Contrary to the findings above, Asch and Seneca (1976) and Dick (1996) reported that
industry concentration is negatively related to incidence of collusion. More specifically, Dick
(1996) studied legal and privately enforced industry cartels that formed under the Webb-
Pomerene Export Trade Act, and found that cartels are more apt to form in industries that had
many small firms. However, it should be borne in mind that these so-called Webb-Pomerene
cartels had been formed to enable groups of small manufacturers to economize on marketing
costs by coordinating their export marketing activities. An efficiency-driven argument might
also be at work in a case like this. That is, by colluding and raising prices, less efficient firms
might be able to survive, resulting in a decline in concentration. As to the study by Asch and
Seneca (1976), they examined the role of collusion in the profitability of American
manufacturing corporations that were found guilty of cartel formation during the period
1958-1967. A possible shortcoming of their study- and in this regard of some studies
mentioned above- is that the data originate from antitrust cases and might therefore be subject
to selection bias. Alternatively, their study might be suffering from omitted variable bias as
cartels might be prevalent in unconcentrated industries thanks to the coordinating role played
by trade associations. More importantly, these studies do not address the endogeneity
problem either. That is, the papers do not take into account the fact that the concentration
ratio or the number of firms itself might be endogenous, as they are a function of the
competitive regime.
Symeonidis’s (2003) study was the first attempt to address this endogeneity problem by
running a two-stage Probit model in which the concentration ratios have been replaced by the
fitted values. His sample includes 151 industries, of which 71 are categorized as “collusive”
(legal cartels registered under Britain’s 1956 Restrictive Trade Practices Act) and of which
80 are classified as “competitive” that are chosen randomly. His main finding is that the
8/6/2019 Practicas concertadas en una economia pequeña
http://slidepdf.com/reader/full/practicas-concertadas-en-una-economia-pequena 14/61
13
likelihood of collusion escalates with concentration but decreases with concentration squared.
Therefore, this concentration (number of firms)-likelihood of collusion puzzle is said to be
explained best by Symeonidis’s (2003) finding of a concave relationship between cartel
presence and concentration, since he takes into both selection and endogeneity issues.
2.1.1.2. Exclusionary Practices
Another important factor to have an impact on incidence of collusion is exclusionary
practices such as entry barriers. Ivaldi et al. (2003) argue that collusion is hard to maintain if
barriers to entry are low. Typically, any attempt to set prices above the competitive level to
jointly maximize the profits would attract the potential competitors and thereby trigger entry
absent entry barriers, which annihilates the profitability of collusion. Moreover, the
possibility of future entry is associated with toning down the scope for retaliation, as it
decreases the potential cost of deviation in terms of relinquished future profits.
Cartels are well aware of the fact that entry will attenuate their attempts to raise profits.
Dick’s (1996) study of Webb-Pomerene cartels revealed that these cartels were inclined to
appear in industries characterized by high barriers to entry reflected in large amounts of fixed
capital requirements. Likewise, Symeonidis (2003) reported a positive impact of capital
intensity, which was interpreted as a proxy for barrier to entry, on the likelihood of collusion.
Finally, Grout and Sonderegger (2005) unfolded that traditional entry barriers proxied as
gross capital expenditure per firm, the level of stocks per firm, and the level of R&D per firm
have marginal effects on cartel formation. They ascribe this lack of strong entry barrier
evidence to the fact that their data are based on cartels that have been discovered and
successfully prosecuted, and hence the data might not include the cases in which cartel
members avoided raising entry barriers for the fear of being discovered and prosecuted.

8/6/2019 Practicas concertadas en una economia pequeña
http://slidepdf.com/reader/full/practicas-concertadas-en-una-economia-pequena 15/61
14
Nonetheless; as stated by Levenstein and Suslow (2006), one should note that the most
successful cartels do not basically take barriers to entry as exogenous; they vigorously try to
create them. Therefore, the endogeneity of barriers to entry should be considered when
modeling their impact on the likelihood of collusion.
2.1.1.3. Interaction Frequency among Firms
The conventional wisdom about the impact of frequency of interaction among firms on the
likelihood of collusion puts that the more frequently firms interact, the more easily collusion
will be expedited, as firms can react more swiftly to a deviation by any of them. That is, by
reducing the reaction time to deviations from the collusive agreement, increased interaction
frequency among firms facilitate collusion. Should the flock of time that must pass by before
any deviation could be punished be long, the payoffs from deviation can be enjoyed longer,
which makes deviation more tempting. Besides, a longer reaction time shifts possible
retaliations further in the future, which makes punishment less daunting, since firms discount
the future.
Empirically, it is almost impossible to keep track of interactions among cartel members.
Nevertheless, interaction frequencies among firms can most officially and at best be proxied
by a variety of regimental and disciplinary arrangements such as trade associations, single
sales agencies etc. For example, by engaging in the collection and dissemination of
information, industry associations often create an environment where firms are able to
interact easily and frequently, which may abet collusion. However, empirical studies
examining the effect of these on cartel formation have been scarce throughout the literature.
For instance, Hey and Kelley (1974) documented that trade associations are positively
8/6/2019 Practicas concertadas en una economia pequeña
http://slidepdf.com/reader/full/practicas-concertadas-en-una-economia-pequena 16/61
15
associated with incidence of collusion. Unequivocally, these arrangements can also be seen as
devices to monitor behaviors of each cartel participants. However, in most general terms, this
type of arrangements can be employed to proxy interaction frequencies.
Another marginal way to gauge the frequency of interaction among firms is to check how
spatially they are encountered. By increasing the frequency of interaction between the firms,
multi-market contact can promote collusion. Besides, Ivaldi et al. (2003) point out that by
alleviating asymmetries that appear in individual markets, multi-market contact might enable
firms to maintain collusion in markets where the industry characteristics alone would not
allow such collusion. For instance, one firm might possess a competitive advantage in one
market and its competitor might have its own competitive advantage in another market. Then,
multi-market contact leads to an overall symmetry that expedites collusion even though a
market-level approach might imply that collusion is hard to maintain. Unfortunately,
empirical papers studying the impact of multi-market contact on collusion has been sparse,
too. Being the only empirical work examining this relationship, Hey and Kelley (1974)
reported that industries that are determined to be colluding in one local market are repeatedly
to be found colluding in other local markets.
2.1.1.4. A History of Cartel Activity
Whether an industry has had a history of cartelization might be a relevant factor in assessing
the likelihood of collusion. As stated by Dick (1996), should particular industries be
structurally leaned towards cartelization, their past behavior should be a tenable predictor of
their current and future behavior. Some earlier empirical research provides evidence for this
proposition. Hey and Kelley (1974) concluded that industries colluding at one point in time
often can be found to be colluding at later points in time. The upholding evidence by Suslow

8/6/2019 Practicas concertadas en una economia pequeña
http://slidepdf.com/reader/full/practicas-concertadas-en-una-economia-pequena 17/61
16
(1988) and Marquez (1994) revealed that between 36 % and 64 % of international commodity
cartels made multiple attempts at fixing price. On the other hand, Dick (1996) found only 19
out of the 125 so-called Webb-Pomerene cartels made repeated attempts to form a cartel
agreement. The overall conclusion of the study was that cartel formation was consistently
unrelated to the industry’s cartel history. A relevant explanation for this finding is that most
of the collapses in cartel agreements aroused from enforcement problems that could not be
resolved. Alternatively, cartels might have been abrogated forever just after they achieved
their initial goals. In such cases, cartels are less likely to be formed in industries characterized
by a history of cartelization.
Contrarily, a history of cartel activity in a certain industry might indicate the presence of a
“culture of collusion” among firms in that industry, which promotes coordination. More
interestingly, any prior attempt to form a cartel might help firms “learn” identifying a
collusive equilibrium and coordinate on it. As stated more explicitly by Levenstein and
Suslow (2006), what cartels can learn is how to monitor output and prices of individual cartel
participants to detect cheating, how to configure incentives so that collusion is more
preferable to cheating in the long run, how to impose punishments in response to cheating,
and, how to design exclusionary practices to deter entry by nonparticipants.
In sum, there is not a clear-cut answer to the question of whether an industry has had a
history of cartelization has a positive or negative impact on the likelihood of collusion.
2.1.2. Demand Side Variables
By and large, demand side variables are considered as factors associated with the evolution of
demand in the market. Is the market demand growing, stagnating, or declining? Are there

8/6/2019 Practicas concertadas en una economia pequeña
http://slidepdf.com/reader/full/practicas-concertadas-en-una-economia-pequena 18/61
17
substantial fluctuations in the market demand? By changing the level of expected future
profits, and thereby the patience firms have, these variables can have influence on collusion
formation either in a positive or negative way. Finally, the structure of the demanders in the
market can also have an impact on the likelihood of collusion by changing the level of cartel
enforcement costs. In what follows, I recapitulate the demand side variables associated with
the likelihood of collusion.
2.1.2.1. Demand Growth
It is widely acknowledged that collusion is easier to maintain when short-term gains from
cheating are relatively little in comparison to the cost of future retaliation. Naturally, this
suggests that collusion is easier to sustain in growing markets in which discounted future
profits to be enjoyed are larger relative to today’s profits. Contrariwise, collusion is more
difficult to sustain in markets characterized by declining demand, which implies that future
profits are smaller compared to todays notwithstanding retaliation. However, this type of
reasoning is invalid in the absence of a fixed number of market players. Stated more literally,
growing demand might attract new entrants, which hampers collusion as explained in the
subsection of “Exclusionary Practices” above. Ivaldi et al. (2003) argue that it is convenient
to disengage the intrinsic impact of demand growth from the impact of entry and other
factors, in order to evaluate the contribution of market demand growth to likelihood of
collusion. In markets where entry barriers are low, demand growth invites entry, and the
ultimate effect will be that it will thwart collusion. Oppositely, in markets characterized by
high entry barriers, demand growth might facilitate collusion. Alternatively, a high level of
demand growth might also be germane to higher demand uncertainty and, therefore,
destabilize collusion, which will be discussed in the next sub-section.

8/6/2019 Practicas concertadas en una economia pequeña
http://slidepdf.com/reader/full/practicas-concertadas-en-una-economia-pequena 19/61
18
The corollary evidence on the impact of demand growth on cartel formation is that growth
has a positive impact on the likelihood of collusion. Dick (1996) reported that doubling the
rate of demand growth raised cartel formation probability by 1 %. Along similar lines, Grout
and Sonderegger (2005) found that growth in demand has an extremely robust positive effect
on cartel formation. However, the conundrum is perhaps best explained by Symeonidis
(2003). His results provided evidence of an inverted-U relationship between demand growth
and the likelihood of collusion2
. He concluded that while a moderate growth rate is more
favorable for stable collusion than a stagnant or declining demand, fast growth hampers
collusion. All in all, each of the mechanisms described in the previous paragraph would lead
to a non-monotonic relationship between demand growth and incidence of collusion. That is,
the impact of demand growth on collusion will be positive for some positive values below a
certain level while it will be negative for high levels of demand growth.
2.1.2.2. Business Cycles and Demand Fluctuations
As formally captured by Rotemberg and Saloner (1986) and Haltiwanger and Harrington
(1991), and extended further by Bagwell and Staiger (1997), collusion is less sustainable in
markets characterized by demand fluctuations. The underlying argument is that when the
market is at a peak, short-term gains from cheating are greatest while the cost of retaliation is
minimal. Consequently, collusion is more difficult to sustain during those times.
The empirical evidence on the above-mentioned corollary of the impact of demand
fluctuations on collusion is mixed though. Gallet and Schroeter (1995) studied the U.S. rayon
industry during the 1930s and tested the effects of demand volatility and expected future
industry profits on collusion. They found that the degree of coordination fell when demand
2 The coefficients of growth and growth-squared are positive and negative, respectively.

8/6/2019 Practicas concertadas en una economia pequeña
http://slidepdf.com/reader/full/practicas-concertadas-en-una-economia-pequena 20/61
19
was high and when the expectation of future profits was lower. Likewise, Gallet (1997)
studied the effects of market demand and import supply on the degree of oligopoly
coordination in the U.S. steel industry since 1950. His results showed that coordination was
weakest during periods of high market demand meaning that collusion among U.S. steel
producers was countercyclical. On the other hand, Dick (1996) reported that cartel formation
was unrelated to business cycle timing.
2.1.2.3. Buyer Concentration
It should be clear that powerful buyers make collusion harder to sustain owing to the fact that
buyers might take advantage of price wars between cartel members. In an attempt to do so,
buyers will use their power strategically, so as to vitiate any collusive agreement that might
prevail among suppliers in the market. What is more, from cartel participants’ perspective,
cartel enforcement costs will be much higher when buyers are numerous and spread
geographically. Nonetheless, the empirical evidence regarding the impact of buyer
concentration on cartel formation is both scarce and unconvincing. Being the only empirical
work examining this relationship, Dick (1996) found that cartel formation was unrelated to
concentration among buyers.
2.1.3. Supply Side Variables
Among factors facilitating collusion, supply side variables loom large. These characteristics
are mostly related to the extent of asymmetry among firms in the market. Do firms have
similar cost structures and production facilities? Do firms supply similar products, or is there
considerable product differentiation? What is the level of innovation and technology in the
market? By altering the discount factors,δ , firms have, which is a gauge of the asymmetry
among firms, the answers to these questions will clearly have an impact on the likelihood of

8/6/2019 Practicas concertadas en una economia pequeña
http://slidepdf.com/reader/full/practicas-concertadas-en-una-economia-pequena 21/61
20
collusion. For instance, by investing in a superior technology, a firm might be able to reduce
its costs, and thereby sell its products at a lower price, which may destroy the incentives for
that firm to collude.
I review below the supply side variables of which impact on the likelihood of collusion have
been studied throughout the empirical literature.
2.1.3.1. Cost Asymmetries and Quality Differences
Collusion is more difficult to sustain under cost asymmetries and quality differences of the
products sold by different firms, as low cost and/or high quality firms are more difficult to
discipline in this asymmetric setting. The reason comes from the fact that there is less room
for the rival high-cost and/or low quality firms to trigger a price war. Among the factors
affecting cost asymmetries and (perceived) quality differences, innovation and vertical
differentiation are the most predominant ones.
2.1.3.2. Innovativeness
Innovativeness of an industry is expected to be of crucial importance in determining the
likelihood of collusion in a market, since innovation fosters asymmetries in costs and/or
qualities. As a result, collusion is less likely to be expected to occur in innovative markets.
The empirical evidence accurately predicts this relationship despite being not strong.
Symeonidis (1999) studied U.K. manufacturing industries in the mid 1950s and found that
there is a negative link between collusive pricing and R&D intensity, which is considered to
be a proxy for innovativeness, even though the relationship is not very strong. Similarly, in
his subsequent study of legal cartels registered under Britain’s 1956 Restrictive Trade

8/6/2019 Practicas concertadas en una economia pequeña
http://slidepdf.com/reader/full/practicas-concertadas-en-una-economia-pequena 22/61
21
Practices Act, Symeonidis (2003) found that there is a weak link between R&D intensity and
collusion. Overall, the empirical evidence is in line with theoretical predictions in spite of
being weak.
2.1.3.3. Vertical Differentiation
As previously mentioned, collusion is more difficult to sustain under (perceived) quality
differences of the products sold by different firms, as high quality firms are more difficult to
discipline in this asymmetric setting. In an attempt to offer better products and/or increase the
quality differences between their products and their rivals’ products, these high quality firms
vertically differentiate their products. Empirically, advertising can be seen as a proxy to
account for this vertical differentiation.
The empirical evidence on the impact of advertising on collusion is strong and convincing.
Asch and Seneca (1975) found that the colluders are centered in industries characterized by
low advertising intensity. Along similar lines, Symeonidis (1999) reported strong evidence
that collusive pricing was much less common in advertising-intensive industries compared to
industries without substantial advertising. Finally, Symeonidis (2003) revealed that incidence
of price collusion is lower in advertising-intensive industries.
Alternatively, a related predisposition of a market to effective collusion is the level of product
homogeneity. Hey and Kelley (1974) unfolded that conspiracy among competitors were most
likely to occur when the product is homogenous. Similarly, Asch and Seneca’s (1976)
findings support the hypothesis that collusion is more likely to occur in the relatively
homogeneous producer goods firms. In accordance with these results, in his analysis of
Webb-Pomerene cartels, Dick (1996) found that differentiated products were 7.8% less likely

8/6/2019 Practicas concertadas en una economia pequeña
http://slidepdf.com/reader/full/practicas-concertadas-en-una-economia-pequena 23/61
22
to be imported through a cartel, and durable products manufacturing industries, which were
characterized by product heterogeneity, were 3.9% less likely to be cartelized.
In sum, there is a strong negative relationship between the degree of vertical integration and
collusion, which has extensively been documented throughout the empirical literature.
3. The Enforcement of Dutch Antitrust Policy during the Last Two Decades
Netherlands’ competition policy has evolved considerably over the past two decades. The old
Economic Competition Act of 1956 (WEM: Wet Economische Mededinging), which was
based on the so-called “abuse system”, was replaced by the new Competition Act
(Mededingingswet), which was based on “prohibition system”. Concurrently, the new
enforcement agency, the Nederlandse Mededingingsautoriteit (NMa) was established in
1998. There have been several amendments in the Competition Act since then. The
Competition Act was first amended in accordance with the European Competition Law in
2004 as a result of European Regulation 1/2003. Another amendment took place on July 1st,
2005, when the NMa was given the status of Autonomous Administrative Authority. Finally,
as of October 1st, 2007, the NMa has been awarded additional powers, as a result of the
evaluation of the Competition Act.
Under the former Economic Competition Act, the enforcer, which was the Ministry of
Economic Affairs (MEA), had to plead in each case that a behavior or agreement infringed
the law. The MEA, as the enforcer, had the burden of proof, which is reversed under the new
prohibition system, so that the firm should show that practices or agreements associated with
the law’s prohibitions are in conformity with the standard. Furthermore, the old Economic
Competition Act’s main touchstone was simply the “general interest”, a concept lacking in
8/6/2019 Practicas concertadas en una economia pequeña
http://slidepdf.com/reader/full/practicas-concertadas-en-una-economia-pequena 24/61
23
context or guidance for decisions. Firms with a restrictive agreement that was not against the
“general interest” had to inform the MEA, which consequently registered the agreement in
the Dutch “Kartel Register”. Deciding whether behavior was against the general interest or
not required deliberation with other ministries, which were mostly concerned about other
aspects of the general interest rather than competition policy. In a report by OECD (1998), it
is stated that every case could turn out to be an opportunity for fundamental debate about the
relative ascendancy of competition policy, and for many years competition policy
undoubtedly lost. Accordingly, those choices about aspects of general interest led to the lax
enforcement of the old Economic Competition Act.
Generally speaking, the lax enforcement of the previous competition law resulted in tolerance
towards collusive business behavior in the Netherlands, which, in turn, increased the
reputation of the Netherlands as “cartel paradise”. The government’s confidential register of
cartels included 245 agreements to divide markets, around 270 agreements to fix prices,
together with around 50 exclusive dealing agreements and more than 200 agreements to
control competition in distribution (OECD, 1993, p. 60). The resilience of these restrictive
agreements can be seen from details that the MEA (1989) released in 1989 on 109 horizontal
price agreements active in September 1988. 40 per cent of these agreements had survived for
more than twenty years and a further 20 per cent had already celebrated their tenth
anniversary (Asbeek- Brusse and Griffiths, 1998, p. 24). As to the scale of these agreements,
77 % of them were at national level, while the remaining 23 % were operating locally.
Strikingly, the majority of these agreements consisted of multiple provisions, as can be seen
from Table I.
<INSERT TABLE I HERE>
8/6/2019 Practicas concertadas en una economia pequeña
http://slidepdf.com/reader/full/practicas-concertadas-en-una-economia-pequena 25/61
24
In 1992, the MEA (1992) released details on the 201 market sharing agreements that were
registered in existence in September 1991. In comparison to the previously mentioned
horizontal price agreements, these were relatively younger. Only 14 per cent had been kept
on the records for more than two decades and another 17 per cent had been on the register for
more than ten years (Asbeek- Brusse and Griffiths, 1998, p. 25). Even within the general
description of “market sharing”, 94 % of these agreements involved other forms of restrictive
practices.
More dramatically, as reported by de Jong (1990), 21 of the total 55 incidences of serious
restrictions to competition of a predominantly national character that have been the subject of
an Order under Article 85(1) EEC Treaty during 1970-1989 (almost 40 % of the cases)
involved the Netherlands.
Having shown that the Netherlands was a cartel paradise under the former Economic
Competition Act, we can discuss more detailed explanations for the failure of the prosecution
of restrictive practices. Indeed, most of the explanation lies within the nature of the
legislation itself. First of all, the old Economic Competition Act postulated that cartels are not
deleterious, unless the government showed the contrary, which left the burden of proof to the
government. Second, the term “general interest”, a concept lacking in context or guidance for
decisions, was not specified within the Act, which left the MEA a large margin of judgment.
Finally, even though there was a cartel register, the Act did not propose provisions for
busting unregistered cartels or for sanctions against non-registration. Consequently, the
agreements kept under the register represented an incomplete depiction of cartels.
8/6/2019 Practicas concertadas en una economia pequeña
http://slidepdf.com/reader/full/practicas-concertadas-en-una-economia-pequena 26/61
25
To summarize, the competition policy under the former Economic Competition Act was
completely reactive. As other aspects of the general interest included macro-economic policy
objectives in the form of price controls, or its industrialization and regional policies, or
industrial subsidies supporting sectors during the first oil crisis, competition policy could not
find much space to itself. Furthermore, as discussed by Asbeek- Brusse and Griffiths (1998),
the conflicts were resolved within the deliberations between governmental officials and
business representatives. More often than not, officials at the MEA worked concomitantly
with business representatives. This intimacy resulted in a gentle stance towards collusive
business behavior.
Given that the local legislative climate posed little threat to collusive business behavior, one
might raise the question of whether trade dependence of the Dutch economy had an impact of
a disciplining act on concerted practices. The answer of that question lies in the fact that
three-fourths of Dutch consumers’ purchases were domestic. Industries such as construction,
utilities, financial transactions, transport, retail trade, and consumer and professional services,
which constitute much of the economy, were isolated from imports. More importantly, since
the market was small, competition in some of these sectors that are characterized economies
of scale took place among a relatively small number of suppliers (OECD, 1998, p. 7).
As a second potential threat to collusive business behavior in the Netherlands, given the lax
enforcement of the domestic competition law, one might also consider the involvement of
European Commission (EC) and the European Competition Law. Indeed, the fact that the
Dutch were among the last to have legislation that did not ban concerted practices utterly
meant that Dutch cartels were under close scrutiny by the EC to a greater extent. The early
impact of the EC competition law was on the behavior of firms rather than the enforcement of
8/6/2019 Practicas concertadas en una economia pequeña
http://slidepdf.com/reader/full/practicas-concertadas-en-una-economia-pequena 27/61
26
the domestic competition law. For instance, while there were 125 registered collective
exclusive dealing agreements in 1963, there were only 45 agreements registered in 1978
(Mok, 1978, p. 743-744). Part of this decrease might be ascribed to the closer scrutiny by the
EC into Dutch cartels. This closer scrutiny had started in 1971, when the first EC decision
conveying that a cartel among Dutch firms (the Dutch Cement Dealers’ Association) had
violated Article 81 TEC came3,4
, and it reached its peak in 1977, when the EC banned the
system of collective exclusive dealing among Dutch bicycle dealers5, even though it had been
allowed after some adjustments under the former Economic Competition Act. More
dramatically, in 1992, the EC decided that the Dutch construction cartel, which was a purely
national cartel by nature, was in violation of Article 81(1) TEC and imposed a fine of 22.498
million ECU6
. This decision was later ratified by the European Court of First Instance. In
addition to that the EC initiated a procedure against the Dutch government based on Article
226 TEC. More precisely, it argued that the Dutch competition law and administrative
practices, inter alia the industry’s agreements, impeded the proper functioning of the
European competition rules (Drahos, 2001, p. 213).
The Dutch government’s initial reaction was to invigorate the anti-cartel policy within the
existing framework. Aside from a more active policy of handling cartel complaints, this
included a sequence of general prohibitions on horizontal price agreements (effective from
July 1993) and, on market sharing agreements and collusive tendering agreements (effective
from June 1994). However, given the inapplicability of these early prohibitions due to the
3 Decision of 16 December 1971, JO 1972 L13/34
4Case 8/72
5 Centraal Bureau voor de Rijwielhandel, OJ 1978 L20/18
6 Building and construction industry in the Netherlands, OJ 1992 L92/1

8/6/2019 Practicas concertadas en una economia pequeña
http://slidepdf.com/reader/full/practicas-concertadas-en-una-economia-pequena 28/61
27
nature of the former “abuse system”; a new Competition Act (Mededingingswet), which was
based on “prohibition system”, was launched in 1998, accompanied by the establishment of
the new enforcement agency (NMa).
Article 6 of the new Competition Act conforms to Article 101 TFEU (ex Article 81 TEC and
ex Article 85 EEC Treaty) in its prohibition of all kinds of anti-competitive agreements. As to
exemptions, the Dutch competition law subsumes all of the EU block exemptions for general
types of agreements, exemptions for specific sectors, and exemptions for specific
agreements.7 This incorporation is dynamic in the sense that the Dutch law incorporates not
only those exemptions already endorsed but also those that will be endorsed in the future.8
Furthermore, the new Competition Act allowed undertakings to apply for dispensation for
agreements that were already in existence and that had begun in the era of “cartel paradise”.
More specifically, firms were allowed to request exemption from Article 6 Mw via Article 17
Mw (which has been repealed later) of the Competition Act. However, one should note that
not every anti-competitive practice would get antitrust-immunity. To be more specific, in
Article 17 Mw it was stated: “The director general may grant an exemption from the
prohibition of Article 6(1) Mw for agreements, decisions or concerted practices, within the
meaning of that Article, which contribute to improving the production or distribution or to
promoting technical or economic progress, while allowing consumers a fair share of the
resulting benefit, and which do not: (a) impose any restrictions on the undertakings
concerned, ones that are not indispensable to the attainment of these objectives, or (b) afford
such undertakings the possibility of eliminating competition in respect of a substantial part of
7 The Competition Act, Articles 12-14 Mw.
8 The Competition Act, Article 12 Mw.
8/6/2019 Practicas concertadas en una economia pequeña
http://slidepdf.com/reader/full/practicas-concertadas-en-una-economia-pequena 29/61
28
the products and services in question.” Thus, Article 17 Mw specified that undertakings
would be exempted from Article 6 Mw if said agreements, decisions or conduct improved
production/distribution or stimulated economic or technical progress, and, if a reasonable
portion of the benefits accrued to consumers. In return for applying for an exemption, firms
were obliged to provide data on several features of the planned cooperation: the number of
firms involved, the duration of agreements, the total sales of all firms involved in cooperative
agreement etc. The reaction was that the NMa was swarmed with dispensation requests –
1,100 at the deadline. Most of the agreements for which exemption is sought took place in
health care industry, as a result of caution for agreements that would not be prohibited, and in
construction industry, which was characterized by a long history of cartelization. The
assessment of these exemption requests by the NMa literally took years (until 2004). Based
on assessments, the NMa (i) rejected the request, as the agreement is not anti-competitive, or (ii)
dispensation was granted for some other requests, even though the agreements were
anticompetitive by nature, or (iii) dispensation was granted after altering or reformulating the
initial agreements by the firms involved, or (iv) reached the decision that the Competition Act
is not applicable.
Referring to the NMa’s verdicts on dispensation applications, of these dispensation requests,
47 % did not violate any of the new competition rules, whereas of the other 53 %, only 9 %
were granted as dispensations by the NMa.
There were several different motives of parties to apply for dispensation. For some of them,
the main motivation was legal certainty as in the case of health care industry. Firms wanted to
avoid the blackbox about competition issues, since there had been drastic changes in the
competition law and its enforcement, which left most of the companies hesitant about their

8/6/2019 Practicas concertadas en una economia pequeña
http://slidepdf.com/reader/full/practicas-concertadas-en-una-economia-pequena 30/61
29
agreements with other undertakings. Even though general prohibitions on horizontal price
agreements and, on market sharing agreements and collusive tendering agreements became
effective as of July 1993, and of June 1994, respectively; there were not many prosecutions
during the period of 1993-1998 (the period between the early prohibitions and the change in
the competition law).
However, the motivation for firms with anti-competitive agreements was different. At the
time of the change in the law, there were some “cartels” with large amounts of investments
facing overcapacity problems. The members of those “cartels” wanted to divide overcapacity,
and, in search of legal protection, they applied for exemption for their agreements9
.
At this point, one might argue that hardcore cartels were not included in the subsample of the
dispensations requests with anti-competitive agreements. That is, “dirty” cartels should not be
expected to be on the original list in the first place, since one cannot expect cartels to be
reported in 1998, as they had already been declared illegal in 1994. This view is partially
correct, as there were very few price-fixing cases in these dispensation requests. Yet, the
remaining dispensation requests with anti-competitive agreements include market sharing,
bid rigging (which has always been a problem in the Netherlands, and not been seen as anti-
competitive), joint production agencies (e.g. asphalt production) etc, which are notable
violations of the competition law. Actually, these are typical Dutch cartels operating at
national or local level. Besides, one should remember that even though there were general
prohibitions under the former competition act, these provisions were laxly applicable and the
enforcement was very weak in the sense that there were very few prosecutions during the
period of 1993-1998. Nonetheless, the data generating process for our sample of multilateral
9 Interview with Prof. van Sinderen (the Chief Economist of the NMa)
8/6/2019 Practicas concertadas en una economia pequeña
http://slidepdf.com/reader/full/practicas-concertadas-en-una-economia-pequena 31/61
30
anti-competitive practices is a bit different than the data generating process for an authority
busting cartels or the data generating process for leniency applications.
4. Linking the Dutch Competition Authority’s Decisions to Industry
Characteristics in a Binary Probit Model with Sample Selection: Data and Empirical
Specifications
4.1 Data Sources
We use different sources of data for the current analysis. These are Dispensation Requests
Database, Production Survey (PS) and Community Innovation Survey (CIS). Below, we
concisely describe these main sources of data in more detail.
Dispensation Requests Database
This database consists of original dispensation requests from the NMa achieves. This
database is confidential and is not publicly available to researchers. The database includes the
names of companies with an agreement, the code of the industry in which they were
operating at the time of application (SBI10
codes), the number of companies in an agreement,
the total annual revenues of the companies involved in an agreement, and the duration of
agreement.
In total, there are around 1,100 dispensation applications. For the minority of the dispensation
applications for which the competition law was relevant, immunity was granted. More
specifically, 37 concerted practices in various industries were exempted from the competition
law. There is not a clear pattern for these industries that had antitrust immunity. As to the
10 De Standaard Bedrijfsindeling
8/6/2019 Practicas concertadas en una economia pequeña
http://slidepdf.com/reader/full/practicas-concertadas-en-una-economia-pequena 32/61
31
length of the antitrust immunity, the average time period during which these multilateral
restrictive practices were exempted from competition law was 5.39 years.
Referring back to the NMa’s verdicts on dispensation applications, of these dispensation
requests, 53 % had violated the Competition Act. For these agreements dispensation was
either granted even though the agreements were anticompetitive by nature, or dispensation
was granted after altering or reformulating the initial agreements by the firms involved. Thus,
we know about the existence of collusion in an industry conditional on exemption
application, and thence can specify our dependent variable as a binary variable taking value 1
for “collusive” industries, and 0 for non-collusive industries based on NMa’s decisions. One
can promptly raise the famous problem of sample selection. We will consider this problem,
other econometric issues and possible objections in detail in the next section.
Besides, the data set can also be enriched, as the beginning dates of the collusive agreements
are known from exemption requests. For instance, if NMa did not grant an exemption for a
specific industry in 2001, and if the beginning of the cooperative agreement was in 1998,
then it can be inferred that the industry was characterized as being collusive in 1999 and 2000
as well. The implied assumption here is that the nature of the collusive act was constant
throughout the agreement and that the cartel did not break up during that period.
PS
Production Survey (PS) is conducted by the Dutch Bureau of Statistics (CBS) on a yearly
basis. Data from PS is available for the period between 1993 and 2006.11
11 Data for the industries transport and telecom only covers the period 2000-2006.
The PS is a sampled
survey; only firms with more than 20 employees are included in the sample each year. For

8/6/2019 Practicas concertadas en una economia pequeña
http://slidepdf.com/reader/full/practicas-concertadas-en-una-economia-pequena 33/61
32
smaller firms, sampling fractions decrease, and consequently smallest firms will have gaps in
the data for several years. Moreover, Statistics Netherlands apply a rotating sample method to
reduce the administrative burden of (small) firms. This also reduces consecutive observations
of firms.
CIS
Data on innovation activities has been collected from the Dutch section of Community
Innovation Survey (CIS). CIS is a European harmonized questionnaire, held every two years,
containing questions about innovative activities in companies. Our innovation data covers the
period 1996-2006. In fact, we use six consecutive CIS-surveys: i.e. CIS2 for 1994-1996,
CIS2, 5 for 1996-1998, CIS3 for 1998-2000, CIS3, 5 for 2000-2002, CIS4 for 2002-2004,
and CIS2005 for 2004-2006. Moreover, firms with less than ten employees are not included
in CIS.
<INSERT TABLE II HERE>
Yet, there are some shortcomings that limit the options for research. For instance, CIS
contains industries that are not present in PS and vice versa. This reduces the number of
industries that can be examined. Second, CIS suffers from lower response rates and the
responses can be selective as it is most likely that innovative firms are more inclined to
respond than firms that do not innovate. Moreover, since we do not have CIS data in odd
years, we interpolate the innovation data. Finally, CIS does not capture all aspects of
innovation. For example, information on human capital formation is not included in CIS.

8/6/2019 Practicas concertadas en una economia pequeña
http://slidepdf.com/reader/full/practicas-concertadas-en-una-economia-pequena 34/61
33
Taking the caveats of our sources for granted, after aggregating firm level data to industry
level data, we merged the two data sources at the 3 (and sometimes 4) digit SIC-code. Having
juxtaposed the datasets provided by the CBS and the NMa, we have obtained a sample of 225
observations. However, as there are missing variables for some of the observations in the
CBS dataset, the numbers of observations for various covariates are incomplete and different
from each other. Subsequently, the final sample employed for the econometric analysis of the
impact of several industry characteristics on the propensity to collude contains 112 industries.
4.2 Empirical Strategy and Variables
Before we proceed with the estimation strategy we will first discuss the potential problems in
the dataset and the econometric setting. Firstly, as mentioned previously, one might object to
the construction of dataset by arguing that hardcore cartels were not included in the
subsample of the dispensations requests with anti-competitive agreements. That is, “dirty”
cartels should not be expected to be on the original list in the first place, since one cannot
expect cartels to be reported in 1998, as they had already been declared illegal in 1994. This
view is partially correct, as there were very few price-fixing cases in these dispensation
requests. Yet, the remaining dispensation requests with anti-competitive agreements include
market sharing, bid rigging (which has always been a problem in the Netherlands, and not
been seen as anti-competitive), joint production agencies (e.g. asphalt production) etc, which
are notable violations of the competition law. Actually, these are typical Dutch cartels
operating at national or local level. Besides, one should remember that even though there
were general prohibitions under the former competition act, these provisions were laxly
applicable and the enforcement was very weak in the sense that there were very few
prosecutions during the period of 1993-1998. Yet, we should acknowledge that the data
generating process for our sample of multilateral anti-competitive practices is a bit different
8/6/2019 Practicas concertadas en una economia pequeña
http://slidepdf.com/reader/full/practicas-concertadas-en-una-economia-pequena 35/61
34
than the data generating process for an authority busting cartels or the data generating process
for leniency applications.
The second objection is that these Dutch “cartels” are related to explicit collusion, but not to
tacit collusion. Might it be the case that some of the industries characterized as being non-
collusive were actually engaged in tacit collusion? The answer is “they might have”, and
unfortunately there is no second source or whatsoever to validate this.
Thirdly, as a newly-established reputation-builder, the NMa might have over-reported and
erred on the side of classifying non-serious coordination mechanisms as cartels. Translated
into the econometrics language, this means that the NMa misclassified agreements in the
dispensation requests, which might result in momentous measurement error in the dependent
variable, and jeopardize the reliability of the inferences. Again, there is no validation data to
cross-check the classification. We are dependent on the NMa’s verdicts on agreements.
Fourthly, it is recognized that these concerted practices or “cartels” are located in industries
of which exogenous characteristics make collusion easier to maintain. Yet, it is also
acknowledged that collusive agreements among firms have impact on industry structure (see
for instance Symeonidis (2002)). That is, these characteristics may be the outcome of
collusive acts by firms in the industry rather than being factors ex-ante affecting the
likelihood of collusion. Thus, the industry features might be endogenous with respect to
cartel presence. In order to alleviate this endogeneity problem, we will use predetermined
lagged values of industry characteristics as explanatory variables.

8/6/2019 Practicas concertadas en una economia pequeña
http://slidepdf.com/reader/full/practicas-concertadas-en-una-economia-pequena 36/61
35
Last but not the least; sample selection might be a huge problem in the current context, since
non-application by firms for an exemption might result in significant bias in the present data.
Stated differently, we only know about anti-competitive multilateral agreements conditional
on dispensation applications. There are other cartels that continued to operate silently
elsewhere without awareness and surveillance of the NMa. Arguably, our sample is not
random in the sense that it only consists of anti-competitive agreements that were subject of
an antitrust immunity seeking behavior. Thus, concerning the estimation technique, we have
considered using Probit model with sample selection developed by van de Ven and van Pragg
(1981). This model assumes that there is an underlying relationship in the form of
∗ = + 1
[Latent equation] [3]
such that we are able to observe only the binary outcome, which is the presence of
collusion in our setting
= ∗ > 0
[Probit equation] [4]
Nonetheless, the dependent variable is not always observed. Instead, the dependent
variable for observation is observed only if
= + 2 > 0
[Selection equation] [5]

8/6/2019 Practicas concertadas en una economia pequeña
http://slidepdf.com/reader/full/practicas-concertadas-en-una-economia-pequena 37/61
36
where 1 and 2 are standard normally distributed (i.e. 1~(0,1) and 2~(0,1)) and
corr(1, 2) = . When 0, standard Probit techniques applied to the Probit equation
results in biased estimates. However, the Probit model with sample selection yields
consistent and asymptotically efficient estimates for all the parameters in this class of
models. Furthermore, for the model to be identified, the selection equation should have
at least one variable that is not in the Probit equation, which has been ensured in our
case.
The log-likelihood function is defined as
ln = ln Φ2 + , + , ∈≠0
+ ln Φ2− + , + , −∈=0
+ ln�1 −Φ + ∉
[6]
where is the set of observations for which is observed, offset denotes for the
variables of which coefficient is constrained to 1, Φ2(. ) Is the cumulative bivariate
normal distribution function (with mean [0 0]′), Φ(. )is the standard cumulative normal,
and is an optional weight for observation .
In the maximum likelihood estimation of this model, ρ is not straightforwardly
estimated. Instead, atanh ρ is directly estimated:

8/6/2019 Practicas concertadas en una economia pequeña
http://slidepdf.com/reader/full/practicas-concertadas-en-una-economia-pequena 38/61
37
atanh =1
2ln 1 +
1 −
[7]
Descriptive statistics for the whole sample, as well as separately for service and
manufacturing industries are presented in Table II. As previously noted, the empirical model
we will use is a Probit model with sample selection with the following specification:
= + 1 + 2_ℎℎ + 3_ℎℎ_2 + 4_
+ 5_ + 6_ + 7_ + 8_+ 9_ℎ + 10_ℎ _ + + 1
[8] [Probit Equation]
= + 1 + 2ℎℎ + 3 + 4 + 5
+6 + 7 + 8ℎ + 9 + 2
[9] [Selection Equation]
In the present study, collusive behavior is modeled by the existence of a concerted practice in
a given industry, which is a binary variable. We observe whether there is an anti-competitive
concerted practice in an industry only if the parties involved applied for a dispensation. Thus,
the dependent variable,
, is the presence of a concerted practice (collusion). On the
other hand, when choosing our explanatory variables, we pick up variables of which impact

8/6/2019 Practicas concertadas en una economia pequeña
http://slidepdf.com/reader/full/practicas-concertadas-en-una-economia-pequena 39/61
38
on collusion is documented in theoretical studies and former empirical papers. The set of
regressors for the Probit equation, the industry characteristics, includes, first of all,
structural variables. To begin with, service is a dummy variable which is equal to one for
service industries, and zero for manufacturing industries. The concentration measure used is
Hirshman-Herfindahl Index (lag_hhi). As mentioned in the review of prior empirical
research, the concentration measures of the industry important determinants of collusion.
Nevertheless, one might argue that if competition is region-wide instead of nation-wide,
lag_hhi might be a poor measure for market structure. I made an effort to identify such cases
and excluded a few observations from the sample12
. Furthermore, in order to see if there is a
non-linear relationship between cartel prevalence and concentration as in Symeonidis (2003),
we have also used HHI squared (lag_hhi_2). Elsewhere industry averages of the binary
variables indicating if firms use trade associations as information resources (lag_infotrade) are
also included in the analysis to check if those institutions facilitated concerted practices. Our
hypothesis is that by engaging in the collection and dissemination of information, industry
associations often create an environment where firms are able to interact easily and frequently,
which may abet collusion. Besides, in order to proxy import competition, we have included
lag_import , the shares of total imports in total sales in a given industry, to examine if foreign
competition disciplined firms and disrupted their collusive behaviors. Finally, we have
included the ratio of the new entrant firms to all the firms in the industry ( lag_entry) as a
proxy for entry barriers, in order to verify the hypothesis maintaining that collusion is harder
to maintain if barriers to entry are low.
12 Those excluded industries include Restaurants, Hospital Activities, Veterinary Activities, Taxi Operation etc,
for which competition operates at regional level.

8/6/2019 Practicas concertadas en una economia pequeña
http://slidepdf.com/reader/full/practicas-concertadas-en-una-economia-pequena 40/61
39
The second set of regressors includes supply side variables. It is intuitive to think that asymmetry
deters collective behavior: for example, firms that are in a similar position would find it easier to
reach an agreement which suits all of them. Thus, we have included measures of asymmetry to
check if these have an impact on the presence of collusion. The first asymmetry measure is
advertising intensity (lag_advertising), which is defined at the industry level as advertising
expenditures divided by total sales. Empirically, advertising can also be seen as a proxy to
account for vertical differentiation, under which collusion is more difficult to sustain, since high
quality firms are more difficult to discipline in this asymmetric setting. Alternatively,
advertisement costs can create entry barriers as proposed by Sutton (1991), since, for example,
high advertisement expenditures may signal to potential entrants that they need huge amounts of
advertisement to promote their products. Nevertheless, high advertisement expenses can also be
an indicator of tough levels of competition in an industry. Companies try to make their products
known to people and to promote their features via advertising, so consumers will prefer their
products over the products of their competitors. Our analysis will show the final role of
advertising on collusion prevalence. On the other hand, as a measure of innovative output that is
another measure of asymmetry, we have included the ratio of firms with at least one patent
application (lag_patent ). We would expect that the probability of collusion decreases with this
variable, since innovation fosters asymmetries in costs and/or qualities, which, in turn, makes
collusion more difficult.
The final set of explanatory variables contains demand side variables. As measures of market
demand growth, the percentage growth of sales in the relevant market (lag_growth) is also
considered at industry level in the current analysis. It had been noted in the literature review that
collusion is easier to sustain in growing markets in which discounted future profits to be
enjoyed are larger relative to today’s profits, and collusion is more difficult to sustain in
markets characterized by declining demand, which implies that future profits are smaller

8/6/2019 Practicas concertadas en una economia pequeña
http://slidepdf.com/reader/full/practicas-concertadas-en-una-economia-pequena 41/61
40
compared to todays notwithstanding retaliation. However, this type of reasoning is invalid in
the absence of a fixed number of market players. Stated more literally, growing demand
might attract new entrants, which hampers collusion. In order to test this proposition, we have
interacted demand growth with the ratio of the new entrant firms to all the firms in the
industry that proxies entry barriers (lag_growth X lag_entry).
Since we know about the existence of collusion in an industry conditional on exemption
application, which implies that our sample might be non-random, we should also specify a
selection equation. In the selection equation, the dependent variable is a binary variable
which is one if there has been an exemption application, and zero if there is no exemption
application. As to the explanatory variables, instead of lagged values we include current
values of the same variables except the interaction term. Moreover, we also include another
variable, cocompet , which is the average of the binary variables for firms indicating whether
they are involved in collaboration with their competitors for innovation. We argue that the
more collaboration for innovation with competitors in an industry, the more likely that firms
seek antitrust immunity via Article 17 Mw for their concerted practices.
Having explained the data and empirical strategy, we can now turn to estimation results
which are displayed in the next section.
5. The Empirical Results
This section displays the results of the estimation of the models described above. In Table III,
we present the results of both the Probit models with sample selection and the simple Probit
models with various specifications to provide a baseline of comparison. We report the
marginal effects, calculated at the sample means in Table IV.

8/6/2019 Practicas concertadas en una economia pequeña
http://slidepdf.com/reader/full/practicas-concertadas-en-una-economia-pequena 42/61
41
First of all, the estimates of the correlation coefficient between error terms of the Probit
equation and selection equation suggest that we should refer to selection models, since the
correlation coefficient in all specifications are statistically significantly different from zero,
which can be seen from atanh(rho) in Table III. This suggests that the parameter estimates in
simple Probit models are plagued by sample selection bias, which indicates a major problem.
Therefore, we restrict our attention to the results of the Probit model with sample selection
when interpreting the estimation results.
<INSERT TABLE III HERE>
Having said that the results of the selection equation reveal that exemption application in
Dutch industries is not random, we can promptly interpret the results. First of all, even though
increased interaction in the market in the form of collaboration with their competitors for
innovation (cocompet ) seems to be associated with the increased likelihood of exemption
application, its impact is imprecise. Similarly, it is also interesting to notice that there is no
significant association between advertising intensity (advertising) and the propensity to ask
for antitrust immunity. On the other hand, the less concentrated an industry is, the more likely
that there is an exemption application, as hhi is statistically significant in all specifications (at
5 % and 1 % levels). Elsewhere, increases in import competition (import ) reduces the
expected probability of exemption application in an industry, so do the innovative output
measured as the ratio of firms with at least one patent application ( patent ) and the percentage
growth of sales in the relevant market (growth), as the coefficients on all these variables are
statistically significantly negative in each specification (at 1 % level). Conversely, the
coefficients on the usage ratio of trade associations as information resources (infotrade) and

8/6/2019 Practicas concertadas en una economia pequeña
http://slidepdf.com/reader/full/practicas-concertadas-en-una-economia-pequena 43/61
42
the ratio of the new entrant firms to all the firms in the industry ( entry) as a proxy for entry
barriers are statistically significantly positive (at 1 % level) in each specification, implying
that these variables appear to increase the likelihood of exemption application in an industry.
The results of the Probit equation provide strong evidence that concerted practices are less
likely to be seen in service industries relative to manufacturing industries, since the
coefficient of service is statistically significantly (at 1 % significance level) negative in all
specifications. The marginal effects of service on the expected probability of collusion when
there is no exemption application as demonstrated in Table IV imply that it is 22-34 % less
likely to encounter a concerted practice in a service industry compared to manufacturing
industry.
The results also suggest that the incidence of concerted practices is lower in concentrated
industries: the coefficient on lag_hhi is negative and everywhere statistically significant
(except model 3) at the 1 % level. This means that it is more likely that firms engaged in
concerted practices in unconcentrated industries, everything else being equal. A potential
explanation for this finding is that industries with a relatively smaller number of firms might
have been able to coordinate tacitly without any necessity of overt collusion. Alternatively,
cartels might have prevailed in unconcentrated industries thanks to the role played by trade
associations. Indeed, the link between trade association and the presence of a concerted
practice seems to be consistent with this latter interpretation: the coefficient on lag_infotrade
is statistically significantly positive at the 1 % or the 5 % level in all specifications except
model 3. The median of the concerted practice participants, which is 57, also indicates that
trade associations were crucial to bring all those firms together to involve in restrictive
practices.

8/6/2019 Practicas concertadas en una economia pequeña
http://slidepdf.com/reader/full/practicas-concertadas-en-una-economia-pequena 44/61
43
Elsewhere, the coefficient on the square of concentration measure imply that there is no non-
linear relationship between concentration and the presence of collusion, as it is statistically
insignificantly positive (Model 1 and Model 5) or statistically significantly negative (Model
3) in various specifications.
There is also strong evidence from all the regressions that concerted practices are less likely
in industries where entry is more possible: the coefficients on lag_entry are negative and
significant at the 1 %, 5 % or 10 % levels. A potential explanation for the negative
association between entry and collusion is that in contestable industries where barriers to
entry are low firms might be less eager to collude, since their coordination would only invite
entry by outsiders, which would make the incumbents worse off anyhow. On the other hand,
a more reasonable explanation would be that absent any entry, the identities of main rivals do
not change frequently, which makes coordination and monitoring among firms less difficult.
Interestingly, our estimation results indicate that there is a positive correlation between cartel
prevalence and import penetration: lag_import enters statistically significantly (at the 1 %
and 5 % levels) to all regressions with a positive sign. This implies that import competition
did not discipline firm behavior. This finding is also consistent with the analysis of Konings
et al. (2001), which revealed that import competition did not result in lower price cost
margins, and concluded that foreign importers joined the cartel paradise in the Netherlands.
As to the role of measures of asymmetry on concerted practice prevalence, the association
between patenting activity and propensity to engage in collusion is ambiguous in the current
setting: the coefficient on lag_patent is statistically insignificant in all specifications in spite
8/6/2019 Practicas concertadas en una economia pequeña
http://slidepdf.com/reader/full/practicas-concertadas-en-una-economia-pequena 45/61
44
of being negative. Thus, our hypothesis stating that the probability of collusion decreases with
innovative output has not been confirmed. On the other hand, the coefficient on the second
measure of asymmetry, lag_advertising, is statistically significantly positive at 10 % level in
all specifications. This suggests that advertisement costs serve as entry barriers which increase
the likelihood of collusion instead of being a proxy for vertical differentiation under which
collusion is less likely.
Contrary to the previous empirical findings, market growth (lag_growth) has been found to have
a negative effect on the probability of a concerted practice in an industry. Seemingly, the
theoretical prediction that collusion is easier to sustain under higher rates of growth has been
offset by other mechanisms that we cannot observe in the current setting. A possible explanation
might be that higher demand uncertainties that are arising from fast growth might dominate the
effect of growth itself. Furthermore, our proposition that growing demand might attract new
entrants, which, in turn, hampers collusion has been falsified in the current context, as the
coefficient on the interaction term consisting of demand growth and the ratio of the new
entrant firms to all the firms in the industry that proxies entry barriers ( lag_growth X
lag_entry) is statistically significantly positive (at 1 % level) in all specifications where it is
included.
<INSERT TABLE IV HERE>
In Table IV we also display the marginal effects of covariates on the probability of collusion
when there is no exemption application E[collusion=1, exemption=0] at sample means. This
is the most interesting case, since it allows us to make inferences about industries where there
might be concerted practices but no exemption application. In line with the results discussed
above, the marginal effects indicate that increases in firms’ usage of trade associations as
8/6/2019 Practicas concertadas en una economia pequeña
http://slidepdf.com/reader/full/practicas-concertadas-en-una-economia-pequena 46/61
45
information resources (lag_infotrade) and increases in foreign competition gauged by the shares
of total imports in total sales in a given industry (lag_import ) is linked to the increased
probability of finding a concerted practice in an industry where there is no exemption
application. On the other hand, if entry, proxied by the ratio of the new entrant firms to all the
firms in the industry (lag_entry), concentration, measured by Hirshman-Herfindahl Index
(lag_hhi), and market growth, gauged by the percentage growth of sales in the relevant market
(lag_growth) increase, it is less likely to encounter a concerted practice in these industries.
Interestingly, the higher the advertising costs, the more likely to see concerted practices.
6. Conclusion
As stated by Harrington (2008), developing structural screens is a cost-effective method for
identifying industries where practices by firms are sufficiently indicative of the presence of
collusion. These structural screens might also be employed by regulatory authorities as a part
of their activist policy of screening for collusion so that cartel detection process is initiated by
these screens rather than complaints from competitors and/or buyers, and leniency programs.
When developing structural screens in which industry characteristics bearing on the
likelihood of collusion are assessed, the endogeneity of market structure and non-random
sample problems should be taken into account. Among former similar studies, Symeonidis
(2003) is the only one which tackles the problem of endogeneity. However, in his analysis of
restrictive agreements for which registration was mandatory under the 1956 Restrictive Trade
Practices Act, he argues that non-registration of agreements would not result in sample
selection bias, since collusive arrangements of all kinds were not enforceable in the court by
then. Nevertheless, just as the former Dutch Economic Competition Act’s main touchstone
was the “general interest”, the 1956 Restrictive Trade Practices Act’s standard for the
8/6/2019 Practicas concertadas en una economia pequeña
http://slidepdf.com/reader/full/practicas-concertadas-en-una-economia-pequena 47/61
46
restrictive agreements to be registered was “public interest”. Only the subset of restrictive
agreements of which positive benefits outweighed the foreseen detriments or, agreements that
were considered by the Registrar of Restrictive Trading Agreements as not substantially
affecting competition were allowed to be retained. Even though he makes use of secondary
information resources in his analysis to verify that sample selection does not pose a problem
in his setting, he does not formally test it.
This study is the first empirical study on industry characteristics bearing on the likelihood of
collusion which tackles sample selection problem. Since there is not a formal econometric
procedure to handle both endogeneity and sample selection issues simultaneously, we have
considered using lagged values of explanatory variables to alleviate the endogeneity problem,
short of using instrumental variables. Having reviewed the empirical literature on industry
characteristics bearing on the likelihood of collusion, in order to develop a variant of the
structural screens mentioned above, the current study has examined the impact of several
industry characteristics on the propensity to collude using a dataset on the existence of
collusion across Dutch industries during the late 1990s and early 2000s. The final sample
employed for the econometric analysis of the presence of collusion in this paper contains 112
industries. The econometric results, inter alia, suggest that our sample of Dutch concerted
practices is non-random in the sense that it only consists of anti-competitive agreements that
were subject of an antitrust immunity seeking behavior. Our bivariate probit model with
sample selection indicates that concerted practices are less likely to be seen in service
industries relative to manufacturing industries. The results also show that it is more likely that
firms engaged in concerted practices in unconcentrated industries, everything else being
equal. The relevant explanation for this counter-intuitive finding is that cartels prevailed in
unconcentrated industries thanks to the trade associations that brought all those firms together

8/6/2019 Practicas concertadas en una economia pequeña
http://slidepdf.com/reader/full/practicas-concertadas-en-una-economia-pequena 48/61
47
to involve in restrictive practices. Furthermore, we could not find a non-linear relationship
between concentration and the presence of collusion.
There is also strong evidence from all the regressions that concerted practices are less likely
in industries where entry is more possible. Interestingly, our estimation results indicate that
there is a positive correlation between cartel prevalence and import penetration, which
implies that import competition did not discipline firm behavior and foreign importers joined
the cartel paradise in the Netherlands. As to the role of measures of asymmetry on concerted
practice prevalence, the association between patenting activity and propensity to engage in
collusion is ambiguous in the current setting, while advertising intensity, as the second
measure of asymmetry, is associated with increased likelihood of collusion. This second
counter-intuitive finding of the analysis can be explained by the fact that advertisement costs
can also serve as entry barriers which increase the likelihood of collusion.
Contrary to the previous empirical findings, market growth has been found to have a negative
effect on the probability of a concerted practice in an industry. Seemingly, the theoretical
prediction that collusion is easier to sustain under higher rates of growth has been offset by other
mechanisms that we cannot observe in the current setting. A possible explanation might be that
higher demand uncertainties that are arising from fast growth might dominate the effect of growth
itself. Furthermore, our proposition that growing demand might attract new entrants, which, in
turn, hampers collusion, has been falsified in the current context.
Acknowledgements
The author would like to thank Prof. Kai-Uwe Kuhn, Prof. Eric van Damme, Prof. Damien
Geradin, Prof. Joe Harrington, Prof. Jan Boone, Prof. Erik Brouwer, Prof. Jarig van Sinderen,
Dr. Laura Parrett, Dr. Ron Kemp, Dr. Lapo Filistrucchi and Remco Hoepelman for their

8/6/2019 Practicas concertadas en una economia pequeña
http://slidepdf.com/reader/full/practicas-concertadas-en-una-economia-pequena 49/61
48
critical comments, and participants at CLEEN Conference at Amsterdam Center for Law and
Economics (ACLE) and at TILEC retreat for their helpful discussions.
Appendix
The Chronology of the Developments in the Dutch Competition Law
1935: The Business Agreements Act (Ondernemersovereenkomstenwet)
The first Dutch national legislation
Main aim: to curtail the deleterious effects of excessive (domestic) competition on
prices and employment. => it inclined the approbation of anti-competitive agreements
and the government, if seen necessary, even made it compulsory to join an agreement
for firms rejecting participation.
1941: Cartel Decree (Kartelbesluit) of 1941
Compelled by the Nazi government of occupation
Formed a confidential cartel register without providing any sanctions for non-
acquiescence.
Remained intact for the following ten years
1951: The Suspension of Business Regulation Act
Interim legislation.
Fight against cartels operating against the public interest
Wijsen (1956) reports that over a period of six years the government litigated 36
cartels, in 14 of which it had acknowledged agreements to be unenforceable while in a
further 19 cases it declared that the cartel had been amended convincingly.

8/6/2019 Practicas concertadas en una economia pequeña
http://slidepdf.com/reader/full/practicas-concertadas-en-una-economia-pequena 50/61
49
1956: The Economic Competition Act (Wet Economische Mededinging)13
It maintained the cartel register and extended its coverage in a way to include
banking, insurance and transport industries.
Liberal professions were excluded from the terms of the Act.
The Act still allowed the minister to compel a cartel agreement on the industry as a
whole conditional on:
• That participants of the agreement demand this. Namely, the government cannot
commence such a procedure,
• That participants of the agreement represent a “substantial majority” of the
industry,
• And that the extension to the agreement is in line with public interest and interests
of the industry.
1971: The first EC decision conveying that a cartel among Dutch firms had violated Article
81 TEC came.
1977: The EC banned the system of collective exclusive dealing among Dutch bicycle
dealers, even though it had been allowed after some adjustments under the Economic
Competition Act of 1956.
1992: The EC decided that the Dutch construction cartel, which was a purely national cartel
by nature, was in violation of Article 81(1) TEC and imposed a fine of 22.498 million ECU
(5.2.1992, Building and construction industry in the Netherlands). This decision was later
ratified by the European Court of First Instance. In addition to that the EC initiated a
13 became operative in 1958.
8/6/2019 Practicas concertadas en una economia pequeña
http://slidepdf.com/reader/full/practicas-concertadas-en-una-economia-pequena 51/61
50
procedure against the Dutch government based on Article 226 TEC. More precisely, it argued
that the Dutch competition law and administrative practices, inter alia the industry’s
agreements, impeded the proper functioning of the European competition rules.
1990s: strengthening of anti-cartel policy within the existing framework. Apart from a more
alert policy of dealing with cartel complaints, this embraced a series of general prohibitions
against:
1993: Prohibition on horizontal price agreements (effective from July 1993)
1994: Prohibition on market sharing agreements and collusive tendering agreements
(effective from June 1994)
1998: The Competition Act (Mededingingswet)
2004: The amendment of the Competition Act
2005: The NMa was awarded the status of Autonomous Administrative Authority.
2007: The NMa has been granted additional powers.
References
Asbeek-Brusse, W. & Griffiths, R. (1998). Paradise Lost or Paradise Regained? Cartel Policy
and Cartel Legislation in the Netherlands. In S. Martin (Ed.), Competition Policies in
Europe (pp. 15-39). North-Holland: Elsevier Science.

8/6/2019 Practicas concertadas en una economia pequeña
http://slidepdf.com/reader/full/practicas-concertadas-en-una-economia-pequena 52/61
51
Asch, P., & Seneca, J.J. (1975). Characteristics of Collusive Firms. Journal of Industrial
Economics, 23(3), 223-37
Asch, P., & Seneca, J.J. (1976). Is Collusion Profitable? Review of Economics and Statistics,
58(1), 1-12
Bagwell, K., & Staiger, R.W. (1997). Collusion over the Business Cycle. RAND Journal of
Economics, 28(1), 82-106
Clarke, J. L., & Evenett, S.J. (2003). The Deterrent Effects of National Anticartel Laws:
Evidence from the International Vitamins Cartel. The Antitrust Bulletin, Fall, 689-726
Connor, J.M. (2004). How High Do Cartels Raise Prices? Implications for Reform of the
Antitrust Sentencing Guidelines. American Antitrust Institute Working Paper 04-01
de Jong, H.W. (1990). Nederland: Het Kartelparadijs van Europa?. Economisch Statistische
Berichten, March 14, 244-248
Dick, A.R. (1996). Identifying Contracts, Combinations and Conspiracies in Restraint of
Trade. Managerial and Decision Economics, 17(2), 203-16
Drahos, M. (2001). Convergence of competition laws and policies in the European
Community: Germany, Austria, and the Netherlands. Dissertation, University of
Utrecht
8/6/2019 Practicas concertadas en una economia pequeña
http://slidepdf.com/reader/full/practicas-concertadas-en-una-economia-pequena 53/61
52
Feuerstein, S. (2005). Collusion in Industrial Economics - A Survey. Journal of Industry,
Competition and Trade, 5(3), 163-198
Fraas, A.G., & Greer, D.F. (1977). Market Structure and Price Collusion: An Empirical
Analysis. Journal of Industrial Economics, 26(1), 21-44
Gallet, C. A. (1997). Cyclical Fluctuations and Coordination in the U.S. Steel Industry.
Applied Economics, 29(3), 279-85
Gallet, C.A., & Schroeter, J.R. (1995). The Effects of the Business Cycle on Oligopoly
Coordination: Evidence from the U.S. Rayon Industry. Review of Industrial
Organization, 10(2), 181-96
Genesove, D., & Mullin, W.P. (1998). Testing Static Oligopoly Models: Conduct and Cost in
the Sugar Industry, 1890-1914. RAND Journal of Economics, 29(2), 355-377
Griffin, J.M. (1989). Previous Cartel Experience: Any Lessons for OPEC? In L.R. Klein & J.
Marquez (Eds.), Economics in Theory and Practice: An Eclectic Approach, Dordrecht:
Kluwer Academic.
Grout, P.A., & Sonderegger, S. (2005). Predicting Cartels. OFT Discussion Paper, 773,
Office of Fair Trade.
Haltiwanger, J. C., & Harrington, J.E. Jr. (1991). The Impact of Cyclical Demand
Movements on Collusive Behavior. RAND Journal of Economics, 22(1), 89-106
8/6/2019 Practicas concertadas en una economia pequeña
http://slidepdf.com/reader/full/practicas-concertadas-en-una-economia-pequena 54/61
53
Harrington, J.E. Jr. (2006). How Do Cartels Operate? Foundations and Trends in
Microeconomics, 2(1)
Harrington, J.E. Jr. (2008). Detecting Cartels. In P. Buccirossi (Ed.), Handbook of Antitrust
Economics, Cambridge, MIT Press.
Hay, G.A., & Kelley, D. (1974). An Empirical Survey of Price Fixing Conspiracies. Journal
of Law and Economics, 17(1), 13–38
Ivaldi, M., Jullien, B., Rey, P., Seabright, P., & Tirole, J. (2003). The economics of tacit
collusion. Final Report for DG Competition, European Commission. IDEI, Toulouse.
Konings, J., van Cayseele, P., & Warzynski, F. (2001). The Dynamics of Industrial Mark-ups
in Two Small Open Economies: Does National Competition Policy Matter?
International Journal of Industrial Organization, 19(5), 841-859
Levenstein, M.C., & Suslow, V.Y. (2006). What Determines Cartel Success? Journal of
Economic Literature, 44(1), 43-95
Marquez, J. (1994). Life Expectancy of International Cartels: An Empirical Analysis. Review
of Industrial Organization, 9(3), 331-341
MEA (1989). Bijlage bij adviesaanvraag betreffende horizontale prijsregelingen, 8 March.

8/6/2019 Practicas concertadas en una economia pequeña
http://slidepdf.com/reader/full/practicas-concertadas-en-una-economia-pequena 55/61
54
MEA (1992). Bijlage bij adviesaanvraag inzake marktverdelingskartels, 7 April.
Mok, M.R. (1978). 20 Jaar WEM. Sociaal-Economische Wetgeving. Tijdschrift voor
Europees en economisch recht, 11, 737-760.
OECD (1993). OECD Economic Surveys 1992-1993: Netherlands. Paris.
OECD (1998). Regulatory Reform In The Netherlands: The Role Of Competition Policy In
Regulatory Reform. Paris.
Porter, R.H. (1983). A Study of Cartel Stability: The Joint Executive Committee, 1880-1886.
Bell Journal of Economics, 14(2), 301-314
Röller, L.H. and Steen, F. (2006). On the Workings of a Cartel: Evidence from the
Norwegian Cement Industry. American Economic Review, 96(1), 321-338
Rotemberg, J. J. and Saloner, G. (1986). A Supergame-Theoretic Model of Price Wars during
Booms. American Economic Review, 76(3), 390-407
Suslow, V.Y. (1988). Stability in International Cartels: An Empirical Survey. Hoover
Institution Domestic Studies Program Working Paper, No. E-88-7
Sutton, J. (1991). Sunk Costs and Market Structure. Cambridge, MIT Press.
8/6/2019 Practicas concertadas en una economia pequeña
http://slidepdf.com/reader/full/practicas-concertadas-en-una-economia-pequena 56/61
55
Symeonidis, G. (1999). Cartel Stability in Advertising-Intensive and R&D-Intensive
Industries. Economics Letters, 62(1), 121-129
Symeonidis, G. (2002). The Effects of Competition: Cartel Policy and the Evolution of
Strategy and Structure in British Industry. Cambridge, MIT Press.
Symeonidis, G. (2003). In Which Industries Is Collusion More Likely? Evidence from the
U.K. Journal of Industrial Economics, 51(1), 45-74
Tirole, J. (1988). The Theory of Industrial Organisation. Cambridge, MIT Press.
van de Ven, W.P.M.M., & van Pragg, B.M.S. (1981). The Demand for Deductibles in Private
Health Insurance: A Probit Model with Sample Selection. Journal of Econometrics,
17(2), 229-252
Wijsen, J.F. (1956). Cartel Legislation in the Netherlands. Cartel, vol. 6

8/6/2019 Practicas concertadas en una economia pequeña
http://slidepdf.com/reader/full/practicas-concertadas-en-una-economia-pequena 57/61
56
Tables
Table I: The Distribution of Provisions in the Horizontal Agreements of which Details
were published by the MEA in 1989
The Provision(s) in the Horizontal Agreement Percentages
Joint tendering with no other provisions 24%
Joint tendering + Conditions criteria 4%
Joint tendering + Exclusivity clauses 7%
Price fixing with no other provisions 4%
Price fixing + Market sharing 17%
Price fixing + Production, sales or marketing quotas 14%Price fixing + Conditions criteria 12%
Price fixing + Exclusivity clauses 8%
Price fixing + Centralized purchasing and sales agencies 8%

8/6/2019 Practicas concertadas en una economia pequeña
http://slidepdf.com/reader/full/practicas-concertadas-en-una-economia-pequena 58/61
57
Table II: Descriptive Statistics
VariablesManufacturing Service All
Mean Std. Dev. Mean Std. Dev. Mean Std. Dev.
STRUCTURAL
VARIABLES
service 0.4606 0.4985
lag_hhi 0.1598 0.1692 0.0514 0.0672 0.1331 0.1577
lag_hhi_2 0.0541 0.1337 0.0072 0.0209 0.0426 0.1183
lag_infotrade 0.0263 0.1195 0.0177 0.0786 0.0221 0.1016
lag_entry 0.0741 0.1127 0.1018 0.0828 0.0858 0.1021
lag_import 49.9900 22.9736 9.4491 13.7449 32.9113 28.0316
SUPPLY SIDE VARIABLES
lag_patent 0.1677 0.1809 0.0300 0.1268 0.1009 0.1714
lag_advertising 0.0132 0.0168 0.0144 0.0256 0.0135 0.0194
DEMAND SIDE
VARIABLES
lag_growth 0.0727 0.4606 0.1004 0.5507 0.0797 0.4848
lag_growth X lag_entry 0.0083 0.1282 0.0095 0.0874 0.0085 0.1220
SELECTION EQUATION
VARIABLES
infotrade 0.1192 0.1164 0.0657 0.0797 0.0931 0.1037hhi 0.1571 0.1812 0.0579 0.0606 0.1330 0.1660
entry 0.0909 0.0729 0.1114 0.0764 0.0994 0.0751
patent 0.1195 0.1124 0.0975 0.1057 0.1089 0.1098
advertising 0.0150 0.0173 0.0171 0.0266 0.0155 0.0200
growth 0.1225 0.6642 0.0717 0.2855 0.1099 0.5934
cocompet 0.0676 0.0961 0.0536 0.0901 0.0607 0.0935
import 50.3278 23.2852 9.3000 13.3477 33.1524 28.2757
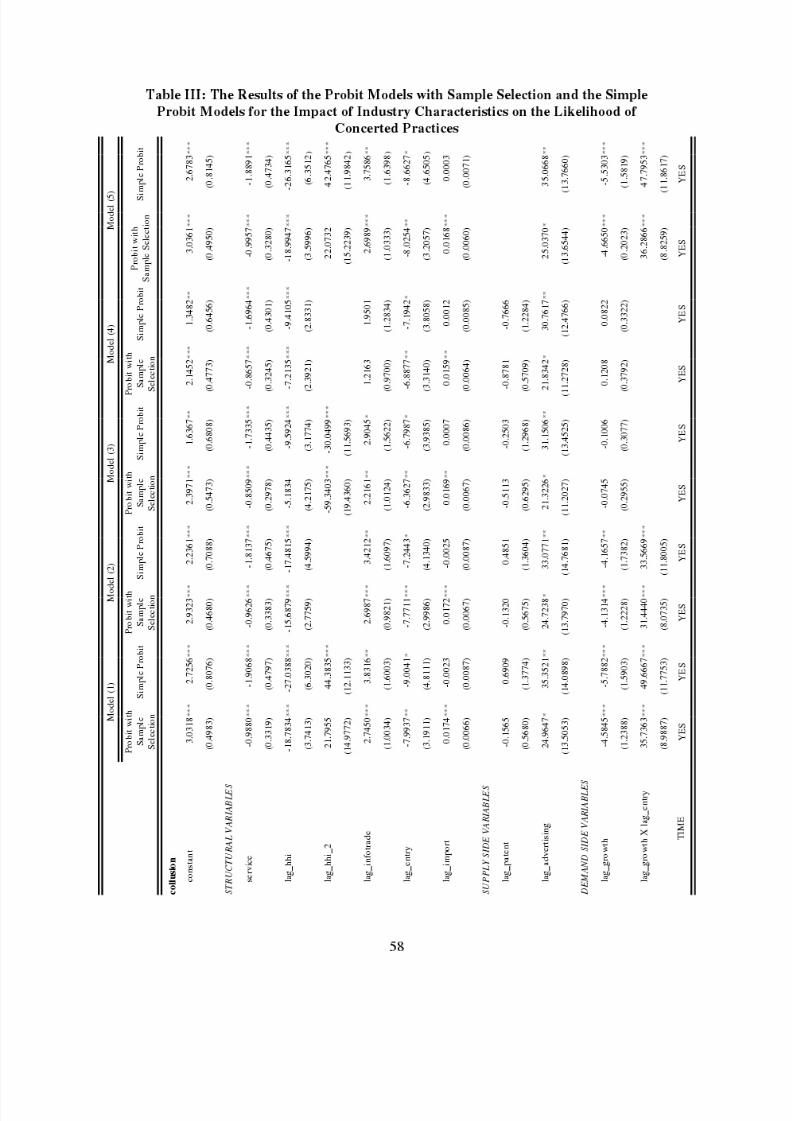
8/6/2019 Practicas concertadas en una economia pequeña
http://slidepdf.com/reader/full/practicas-concertadas-en-una-economia-pequena 59/61
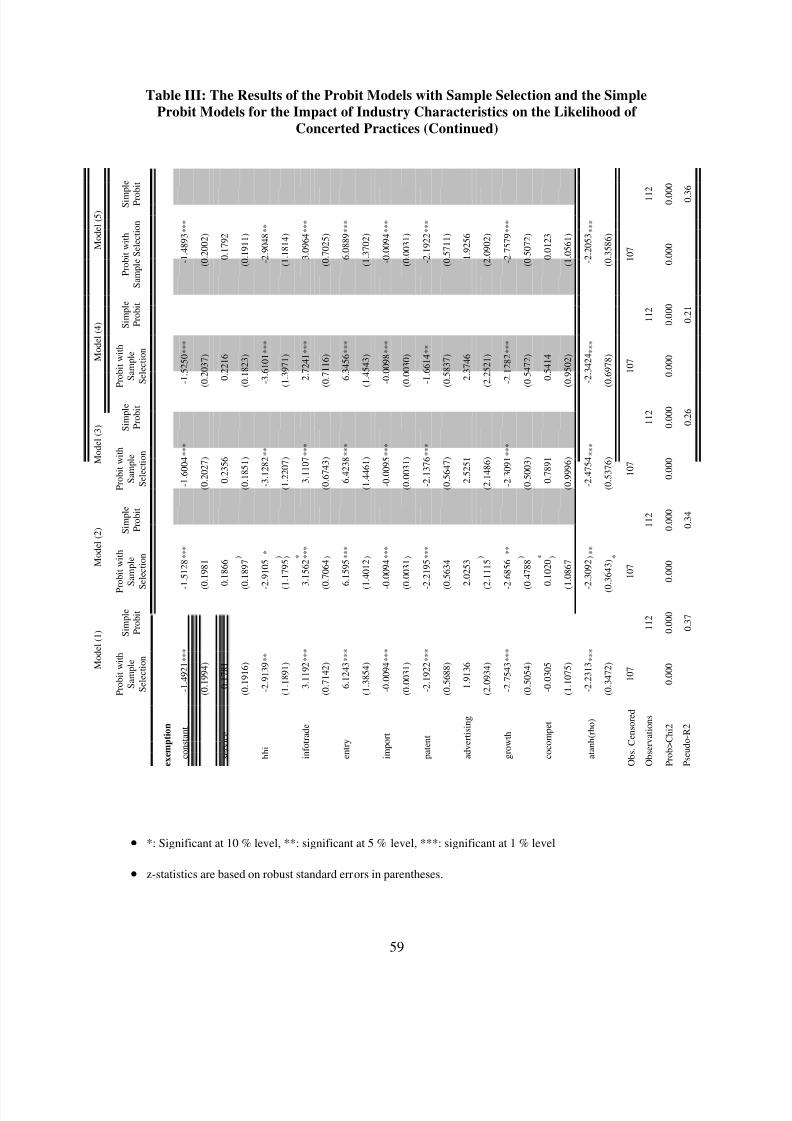
8/6/2019 Practicas concertadas en una economia pequeña
http://slidepdf.com/reader/full/practicas-concertadas-en-una-economia-pequena 60/61
59
Table III: The Results of the Probit Models with Sample Selection and the Simple
Probit Models for the Impact of Industry Characteristics on the Likelihood of
Concerted Practices (Continued)
M o d e l ( 5 )
S i m p l e
P r o b i t
1 1 2
0 . 0
0 0
0 . 3
6
P r o b i t w i t h
S a m p l e S e l e c t i o n
* * *
* *
* * *
* * *
* * *
* * *
* * *
* * *
1 0 7
0 . 0
0 0
- 1 . 4
8 9 3
( 0 . 2
0 0 2 )
0 . 1
7 9 2
( 0 . 1
9 1 1 )
- 2 . 9
0 4 8
( 1 . 1
8 1 4 )
3 . 0
9 6 4
( 0 . 7
0 2 5 )
6 . 0
8 8 9
( 1 . 3
7 0 2 )
- 0 . 0
0 9 4
( 0 . 0
0 3 1 )
- 2 . 1
9 2 2
( 0 . 5
7 1 1 )
1 . 9
2 5 6
( 2 . 0
9 0 2 )
- 2 . 7
5 7 9
( 0 . 5
0 7 2 )
0 . 0
1 2 3
( 1 . 0
5 6 1 )
- 2 . 2
0 5 3
( 0 . 3
5 8 6 )
M
o d e l ( 4 ) S
i m p l e
P r o b i t
1 1 2
0 . 0
0 0
0 . 2
1
P r o b i t w
i t h
S a m p l
e
S e l e c t i o n *
* *
* * *
* * *
* * *
* * *
* *
* * *
* * *
1 0 7
0 . 0 0 0
- 1 . 5
2 5 0
( 0 . 2
0 3 7 )
0 . 2
2 1 6
( 0 . 1
8 2 3 )
- 3 . 6
1 0 1
( 1 . 3
9 7 1 )
2 . 7
2 4 1
( 0 . 7
1 1 6 )
6 . 3
4 5 6
( 1 . 4
5 4 3 )
- 0 . 0
0 9 8
( 0 . 0
0 3 0 )
- 1 . 6
6 1 4
( 0 . 5
8 3 7 )
2 . 3
7 4 6
( 2 . 2
5 2 1 )
- 2 . 1
2 8 2
( 0 . 5
4 7 2 )
0 . 5
4 1 4
( 0 . 9
5 0 2 )
- 2 . 3
4 2 4
( 0 . 6
9 7 8 )
M o d e l ( 3 ) S
i m p l e
P r o b i t
1 1 2
0 . 0
0 0
0 . 2
6
P r o b i t w i t h
S a m p l e
S e l e c t i o n *
* *
* *
* * *
* * *
* * *
* * *
* * *
* * *
1 0 7
0 . 0
0 0
- 1 . 6
0 0 4
( 0 . 2
0 2 7 )
0 . 2
3 5 6
( 0 . 1
8 5 1 )
- 3 . 1
2 8 2
( 1 . 2
2 0 7 )
3 . 1
1 0 7
( 0 . 6
7 4 3 )
6 . 4
2 3 8
( 1 . 4
4 6 1 )
- 0 . 0
0 9 5
( 0 . 0
0 3 1 )
- 2 . 1
3 7 6
( 0 . 5
6 4 7 )
2 . 5
2 5 1
( 2 . 1
4 8 6 )
- 2 . 3
0 9 1
( 0 . 5
0 0 3 )
0 . 7
8 9 1
( 0 . 9
9 9 6 )
- 2 . 4
7 5 4
( 0 . 5
3 7 6 )
M o d e l ( 2 ) S
i m p l e
P r o b i t
1 1 2
0 . 0
0 0
0 . 3
4
P r o b i t w i t h
S a m p l e
S e l e c t i o n *
* *
) ) * *
) * * *
) * * *
) * * *
) * * *
) ) * * *
) ) * * *
1 0 7
0 . 0
0 0
- 1 . 5
1 2 8
( 0 . 1
9 8 1
0 . 1
8 6 6
( 0 . 1
8 9 7
- 2 . 9
1 0 5
( 1 . 1
7 9 5
3 . 1
5 6 2
( 0 . 7
0 6 4
6 . 1
5 9 5
( 1 . 4
0 1 2
- 0 . 0
0 9 4
( 0 . 0
0 3 1
- 2 . 2
1 9 5
( 0 . 5
6 3 4
2 . 0
2 5 3
( 2 . 1
1 1 5
- 2 . 6
8 5 6
( 0 . 4
7 8 8
0 . 1
0 2 0
( 1 . 0
8 6 7
- 2 . 3
0 9 2
( 0 . 3
6 4 3 )
M o d e l ( 1 ) S
i m p l e
P r o b i t
1 1 2
0 . 0
0 0
0 . 3
7
P r o b i t w i t h
S a m p l e
S e l e c t i o n *
* *
* *
* * *
* * *
* * *
* * *
* * *
* * *
1 0 7
0 . 0
0 0
- 1 . 4
9 2 1
( 0 . 1
9 9 4 )
0 . 1
7 8 1
( 0 . 1
9 1 6 )
- 2 . 9
1 3 9
( 1 . 1
8 9 1 )
3 . 1
1 9 2
( 0 . 7
1 4 2 )
6 . 1
2 4 3
( 1 . 3
8 5 4 )
- 0 . 0
0 9 4
( 0 . 0
0 3 1 )
- 2 . 1
9 2 2
( 0 . 5
6 8 8 )
1 . 9
1 3 6
( 2 . 0
9 3 4 )
- 2 . 7
5 4 3
( 0 . 5
0 5 4 )
- 0 . 0
3 0 5
( 1 . 1
0 7 5 )
- 2 . 2
3 1 3
( 0 . 3
4 7 2 )
e x e m p t i o n
c o n s t a n t
s e r v i c e
h h i
i n f o t r a d e
e n t r y
i m p o r t
p a t e n t
a d v e r t i s i n g
g r o w t h
c o c o m p e t
a t a n h ( r h o )
O b s . C e n s o r e d
O b s e r v a t i o n s
P r o b > C h i 2
P s e u d o - R 2
• *: Significant at 10 % level, **: significant at 5 % level, ***: significant at 1 % level
• z-statistics are based on robust standard errors in parentheses.
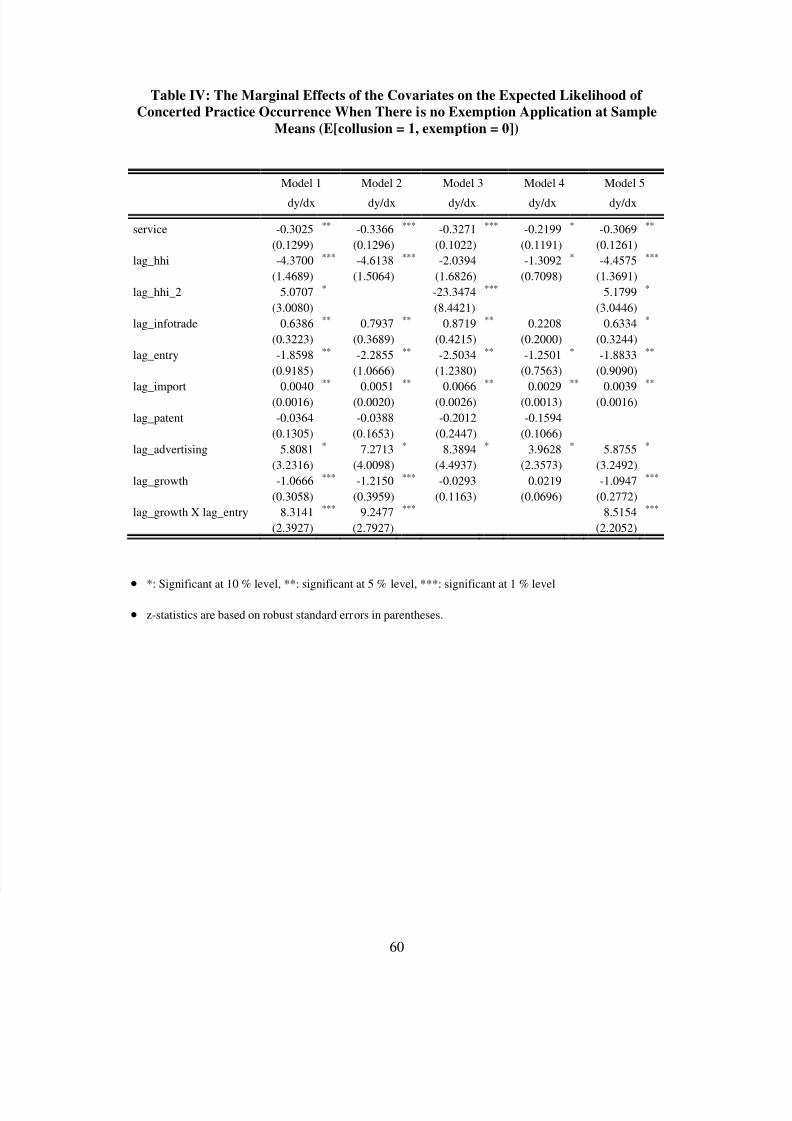
8/6/2019 Practicas concertadas en una economia pequeña
http://slidepdf.com/reader/full/practicas-concertadas-en-una-economia-pequena 61/61
Table IV: The Marginal Effects of the Covariates on the Expected Likelihood of
Concerted Practice Occurrence When There is no Exemption Application at Sample
Means (E[collusion = 1, exemption = 0])
Model 1 Model 2 Model 3 Model 4 Model 5
dy/dx dy/dx dy/dx dy/dx dy/dx
service -0.3025 ** -0.3366 *** -0.3271 *** -0.2199 * -0.3069 **
(0.1299) (0.1296) (0.1022) (0.1191) (0.1261)
lag_hhi -4.3700 *** -4.6138 *** -2.0394 -1.3092 * -4.4575 ***
(1.4689) (1.5064) (1.6826) (0.7098) (1.3691)
lag_hhi_2 5.0707 * -23.3474 *** 5.1799 *
(3.0080) (8.4421) (3.0446)
lag_infotrade 0.6386 ** 0.7937 ** 0.8719 ** 0.2208 0.6334 *
(0.3223) (0.3689) (0.4215) (0.2000) (0.3244)
lag_entry -1.8598**
-2.2855**
-2.5034**
-1.2501*
-1.8833**
(0.9185) (1.0666) (1.2380) (0.7563) (0.9090)
lag_import 0.0040 ** 0.0051 ** 0.0066 ** 0.0029 ** 0.0039 **
(0.0016) (0.0020) (0.0026) (0.0013) (0.0016)
lag_patent -0.0364 -0.0388 -0.2012 -0.1594
(0.1305) (0.1653) (0.2447) (0.1066)
lag_advertising 5.8081 * 7.2713 * 8.3894 * 3.9628 * 5.8755 *
(3.2316) (4.0098) (4.4937) (2.3573) (3.2492)
lag_growth -1.0666 *** -1.2150 *** -0.0293 0.0219 -1.0947 ***
(0.3058) (0.3959) (0.1163) (0.0696) (0.2772)
lag_growth X lag_entry 8.3141 *** 9.2477 *** 8.5154 ***
(2.3927) (2.7927) (2.2052)
• *: Significant at 10 % level, **: significant at 5 % level, ***: significant at 1 % level
• z-statistics are based on robust standard errors in parentheses.