pavementdesigndatahandbookdesign of flexible pavements (irc : 37-2001) 14 1.4.1 design traffic 14...
TRANSCRIPT
JJSSSS MMaahhaavviiddyyaappeeeetthhaaSSrrii JJaayyaacchhaammaarraajjeennddrraa CCoolllleeggee OOff EEnnggiinneeeerriinngg
MMyyssoorree--557700 000066
PPAAVVEEMMEENNTT DDEESSIIGGNN DDAATTAA HHAANNDD BBOOOOKK
CCoommppiilleedd BByy
DDrr.. PP.. NNaannjjuunnddaasswwaammyy
DDEEPPAARRTTMMEENNTT OOFF CCIIVVIILL EENNGGIINNEEEERRIINNGG2011

CCOONNTTEENNTTSSPPaaggee NNoo..
11.. ANALYSIS AND DESIGN OF FLEXIBLE PAVEMENT 11
11..11.. Boussinesq’s Solution – Point Load 11
11..22.. Circular Load with Uniform Vertical Pressure 22
11..22..11 Solutions at Axis of Symmetry 22
11..22..22 Foster and Ahlvin Charts 33
11..33.. STRESSES IN LAYERED SYSTEM 66
11..33..11.. Solutions at Axis of Symmetry 66
1.3.2. Three Layer Elastic Solutions 1100
11..44.. DESIGN OF FLEXIBLE PAVEMENTS (IRC : 37-2001) 1144
1.4.1 Design Traffic 1144
1.4.2 Traffic growth rate 1144
1.4.3 Design Life 1144
1.4.4 Vehicle Damage Factor 1155
1.4.5 Distribution of Commercial traffic over the carriageway 1155
1.4.6 Design Criteria 1166
1.4.7 Design Criteria 1166
1.4.8 Design Charts and Catalogue 1177
1.4.9 Pavement Composition 2222
1.4.10 Final Remarks 2222
22.. ANALYSIS AND DESIGN OF RIGID PAVEMENTS 2233
2.1 Modulus of Subgrade Reaction (K) 2233
2.2 Radius of Relative Stiffness (l) 2233
2.3 Equivalent Radius of Resisting Section (b) 2233
2.4 Critical Load Positions 2244
2.5 Stresses and Deflections due to Wheel Load 2244
22..55..11 Corner Loading 2244

2.5.2 Interior Loading 2255
2.5.3 Edge Loading 2255
2.5.4 Dual Tires 2266
2.6 Temperature Stresses 2277
22..66..11 Warping Stresses (Westergaard Analysis) 2277
2.6.2 Frictional Stresses 2288
2.7 IRC Recommendations for Design of Plain Jointed Rigid Pavements for Highways (IRC : 58-2002)
2288
22..77..11 Legal Axle Load Limits 2288
2.7.2 Load Safety Factors 2299
2.7.3 Tyre Pressure 2299
2.7.4 Design Period 2299
2.7.5 Design Traffic 2299
2.7.6 Characteristics of Sub-grade 2299
2.7.7 Characteristics of Concrete 3300
2.7.8 Fatigue Behaviour of Cement Concrete 3311
2.7.9 Stress Computations 3311
2.7.10 Temperature Differential 3322
2.7.11 Recommended Design Procedure for Slab Thickness 3322
2.7.12 Design of Joints 3333
Design Data Hand Book
Department of Civil Engineering 1
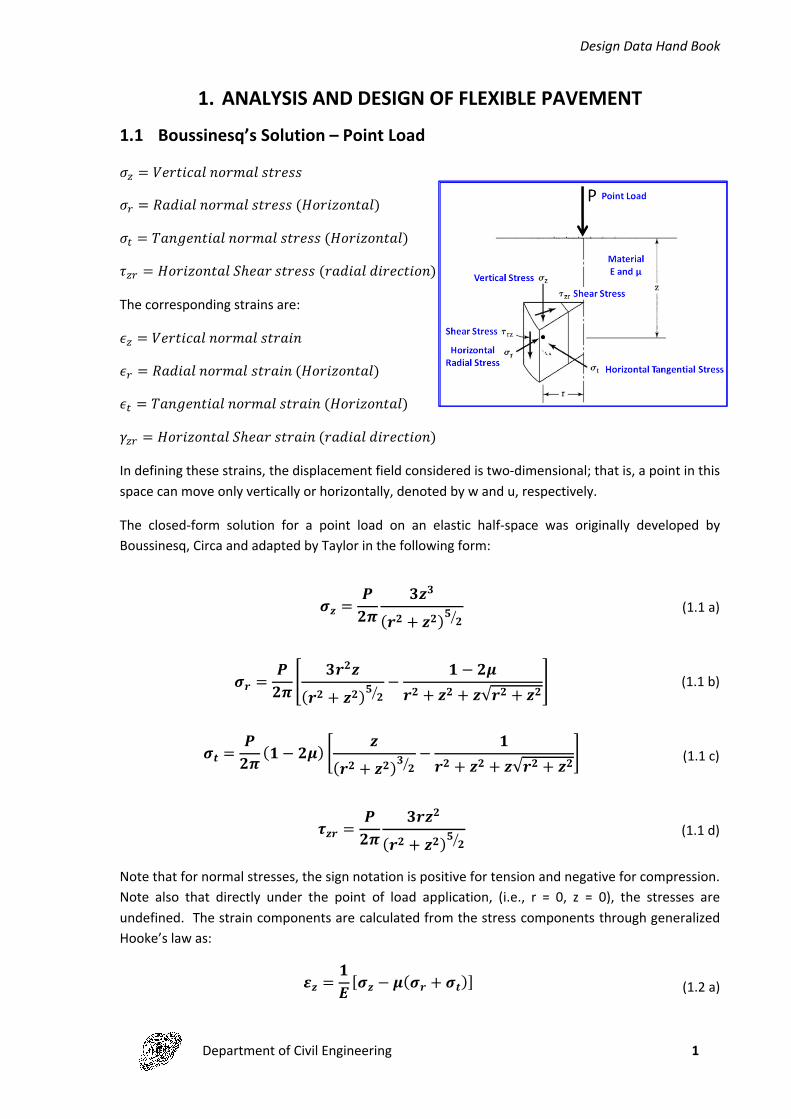
1. ANALYSIS AND DESIGN OF FLEXIBLE PAVEMENT
1.1 Boussinesq’s Solution – Point Load
�� = ��������������������
�� = ������������������(����������)
�� = ����������������������(����������)
��� = �����������ℎ���������(���������������)
The corresponding strains are:
�� = ��������������������
�� = ������������������(����������)
�� = ����������������������(����������)
��� = �����������ℎ���������(���������������)
In defining these strains, the displacement field considered is two-dimensional; that is, a point in this space can move only vertically or horizontally, denoted by w and u, respectively.
The closed-form solution for a point load on an elastic half-space was originally developed by Boussinesq, Circa and adapted by Taylor in the following form:
�� = ���
���
(�� + ��)� ��(1.1 a)
�� = ���� ����
(�� + ��)� ��− � − ��
�� + �� + �√�� + ��� (1.1 b)
�� =��� (� − ��) � �
(�� + ��)� ��− �
�� + �� + �√�� + ��� (1.1 c)
��� = ���
����
(�� + ��)� ��(1.1 d)
Note that for normal stresses, the sign notation is positive for tension and negative for compression. Note also that directly under the point of load application, (i.e., r = 0, z = 0), the stresses are undefined. The strain components are calculated from the stress components through generalized Hooke’s law as:
�� = �� [�� − �(�� + ��)] (1.2 a)
Design Data Hand Book
Department of Civil Engineering 2
�� = �� [�� − �(�� + ��)] (1.2 b)
�� =�� [�� − �(�� + ��)] (1.2 c)
��� = ����(� + �)� = ���
�(1.2 d)
where G is the shear modulus of the elastic medium.
The vertical and horizontal deflections, w and u, at any point are computed by integrating the vertical and horizontal strains respectively. The resulting expressions are:
� = ���� � (� + �)��
(�� + ��)� �⁄ + �(� − ��)�(�� + ��)
� (1.3 a)
� = �(� + �)(� − ��)���� � ���
(� − ��)(�� + ��)� �⁄ + ��(�� + ��)
− �� (1.3 b)
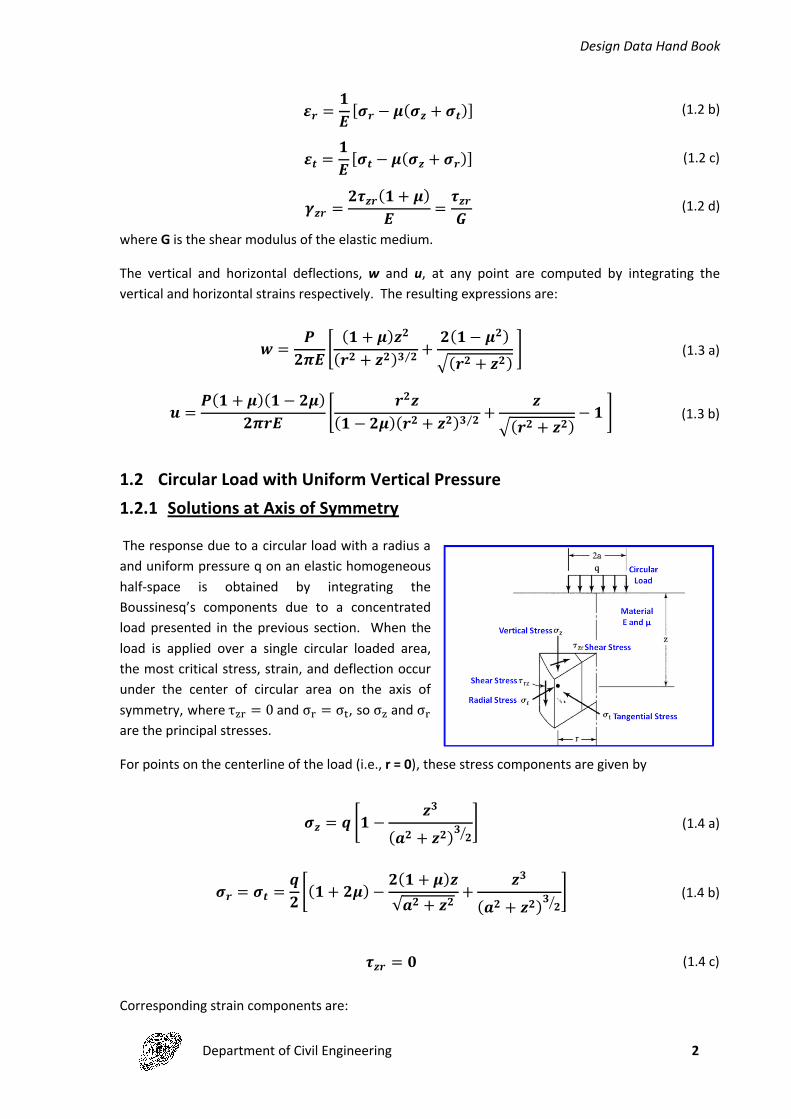
1.2 Circular Load with Uniform Vertical Pressure1.2.1 Solutions at Axis of Symmetry
The response due to a circular load with a radius a and uniform pressure q on an elastic homogeneous half-space is obtained by integrating the Boussinesq’s components due to a concentrated load presented in the previous section. When the load is applied over a single circular loaded area, the most critical stress, strain, and deflection occur under the center of circular area on the axis of symmetry, where τ�� = 0 and σ� = σ�, so σ� and σ�are the principal stresses.
For points on the centerline of the load (i.e., r = 0), these stress components are given by
�� = � �� − ��(�� + ��)� ��
� (1.4 a)
�� = �� =�� �(� + ��) − �(� + �)�
√�� + ��+ ��
(�� + ��)� ��� (1.4 b)
��� = � (1.4 c)
Corresponding strain components are:
Design Data Hand Book
Department of Civil Engineering 3
�� = (� + �)�� �(� − ��) + ���
√�� + ��− ��
(�� + ��)� ��� (1.5 a)
�� = (� + �)��� �(� − ��) − �(� − �)�
√�� + ��+ ��
(�� + ��)� ��� (1.5 b)
and the vertical deflection under the centerline of the load is given by
� =(� + �)��
� � ��(�� + ��)
+ � − ��� ���� + �� − ��� (1.6 a)
� = ����
��√�� + ��whenμ = 0.5 (1.6 b)
On the surface of the half-space (i.e., z = 0)
� = �� ��(� − ��)� � whenz = 0 (1.6 c)
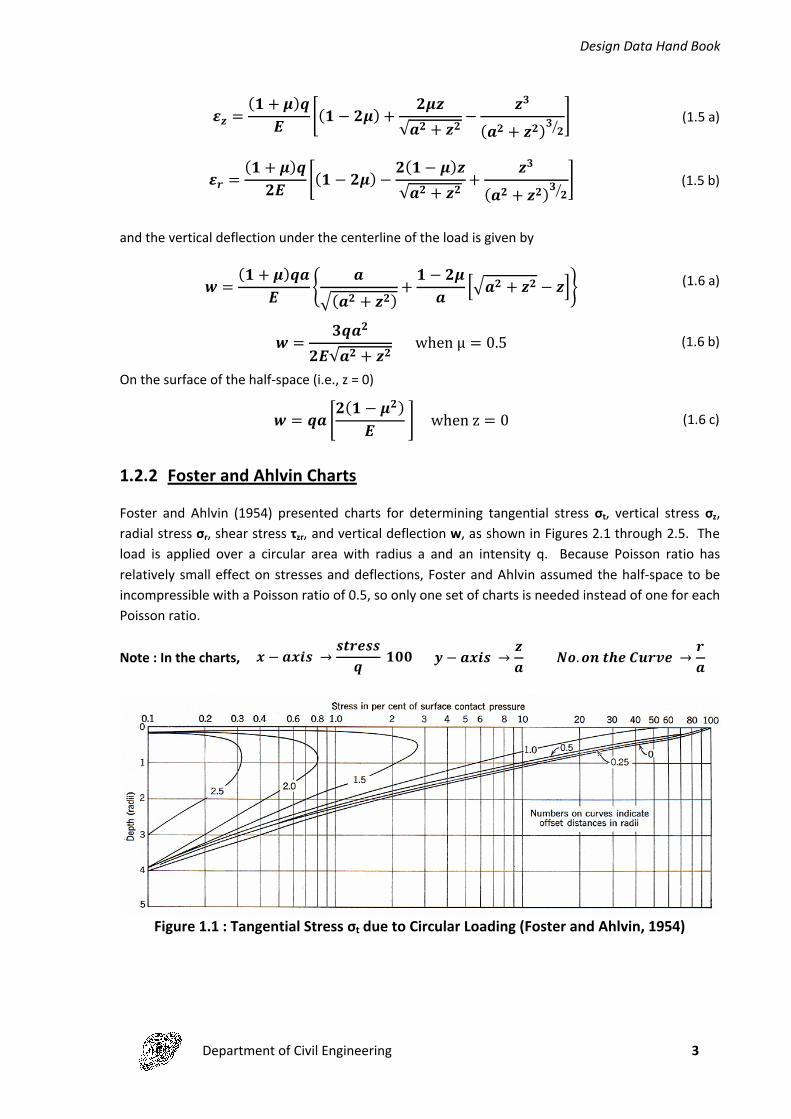
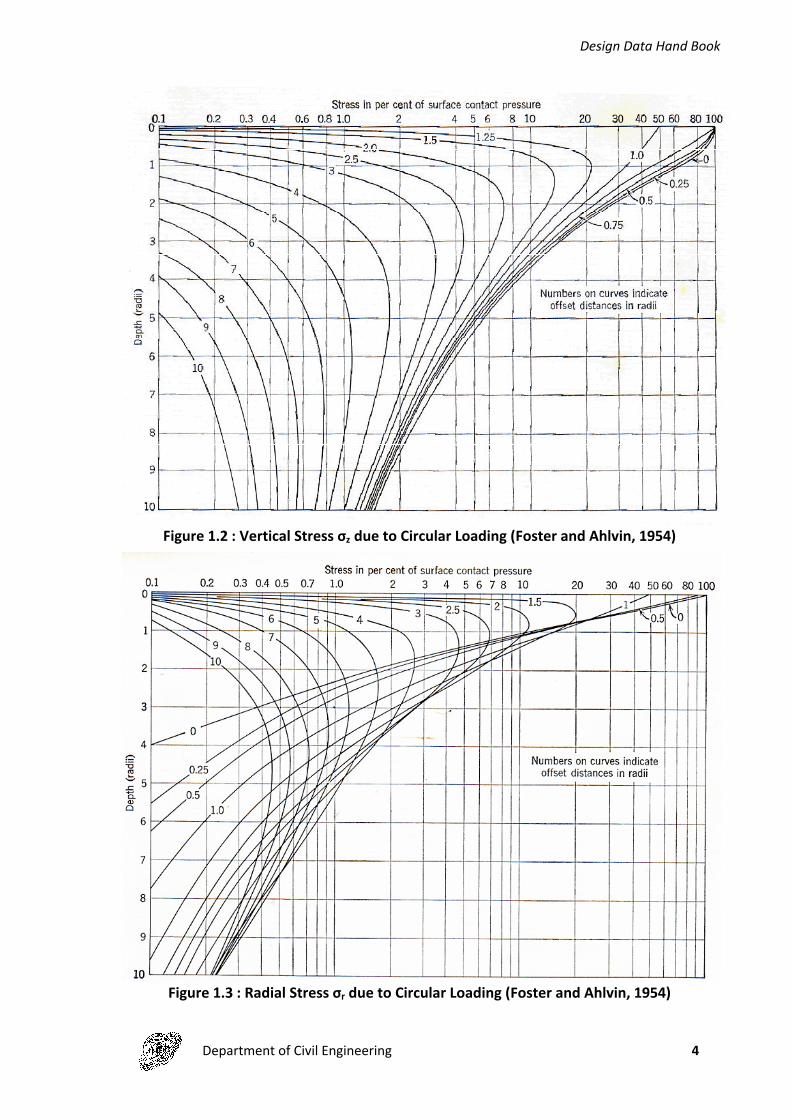
1.2.2 Foster and Ahlvin Charts
Foster and Ahlvin (1954) presented charts for determining tangential stress σt, vertical stress σz, radial stress σr, shear stress τzr, and vertical deflection w, as shown in Figures 2.1 through 2.5. The load is applied over a circular area with radius a and an intensity q. Because Poisson ratio has relatively small effect on stresses and deflections, Foster and Ahlvin assumed the half-space to be incompressible with a Poisson ratio of 0.5, so only one set of charts is needed instead of one for each Poisson ratio.
Note : In the charts, � − ���� → ������� ��� � − ���� → �
� ��.���������� → ��
Figure 1.1 : Tangential Stress σt due to Circular Loading (Foster and Ahlvin, 1954)
Design Data Hand Book
Department of Civil Engineering 4
Figure 1.2 : Vertical Stress σz due to Circular Loading (Foster and Ahlvin, 1954)
Figure 1.3 : Radial Stress σr due to Circular Loading (Foster and Ahlvin, 1954)
Design Data Hand Book
Department of Civil Engineering 5
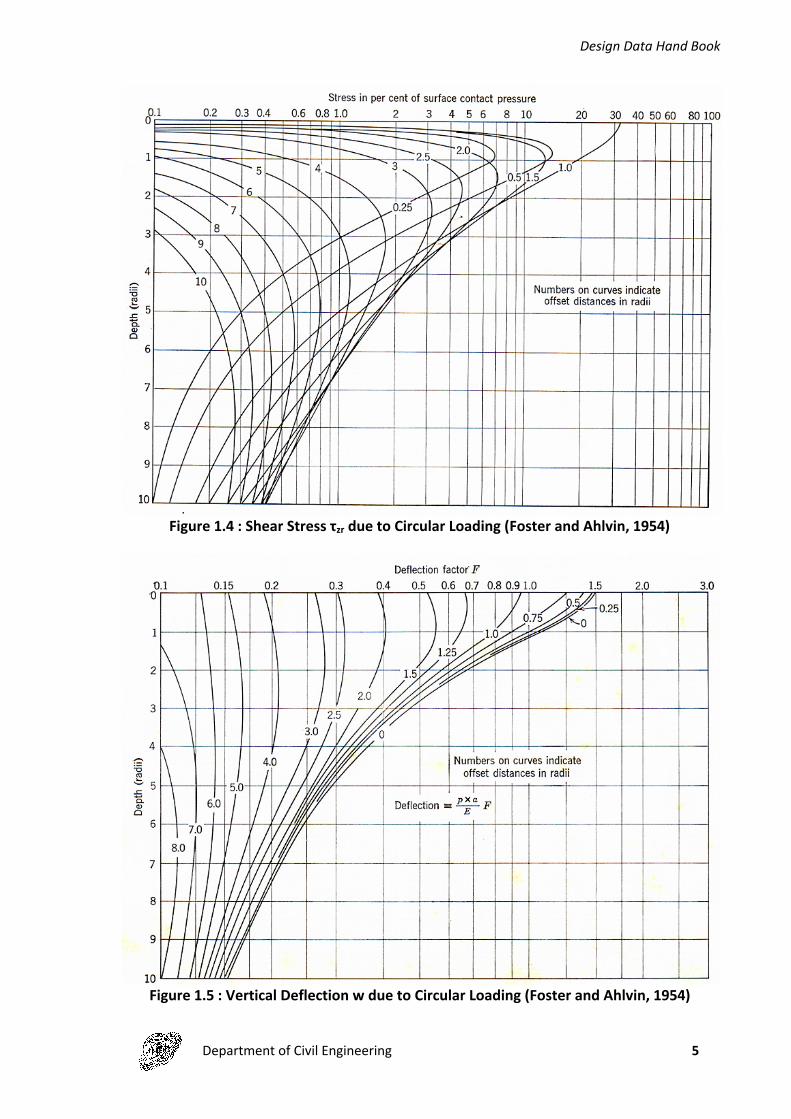
Figure 1.4 : Shear Stress τzr due to Circular Loading (Foster and Ahlvin, 1954)
Figure 1.5 : Vertical Deflection w due to Circular Loading (Foster and Ahlvin, 1954)
Design Data Hand Book
Department of Civil Engineering 6
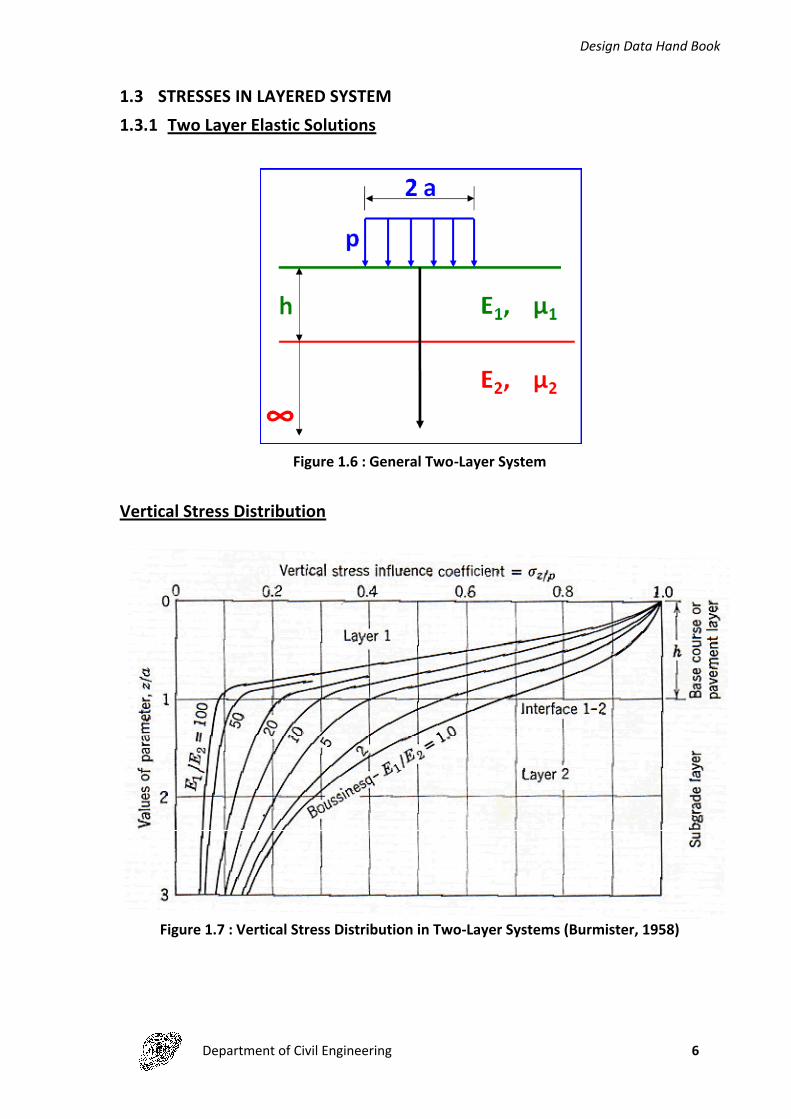
1.3 STRESSES IN LAYERED SYSTEM1.3.1 Two Layer Elastic Solutions
Figure 1.6 : General Two-Layer System
Vertical Stress Distribution
Figure 1.7 : Vertical Stress Distribution in Two-Layer Systems (Burmister, 1958)
Design Data Hand Book
Department of Civil Engineering 7
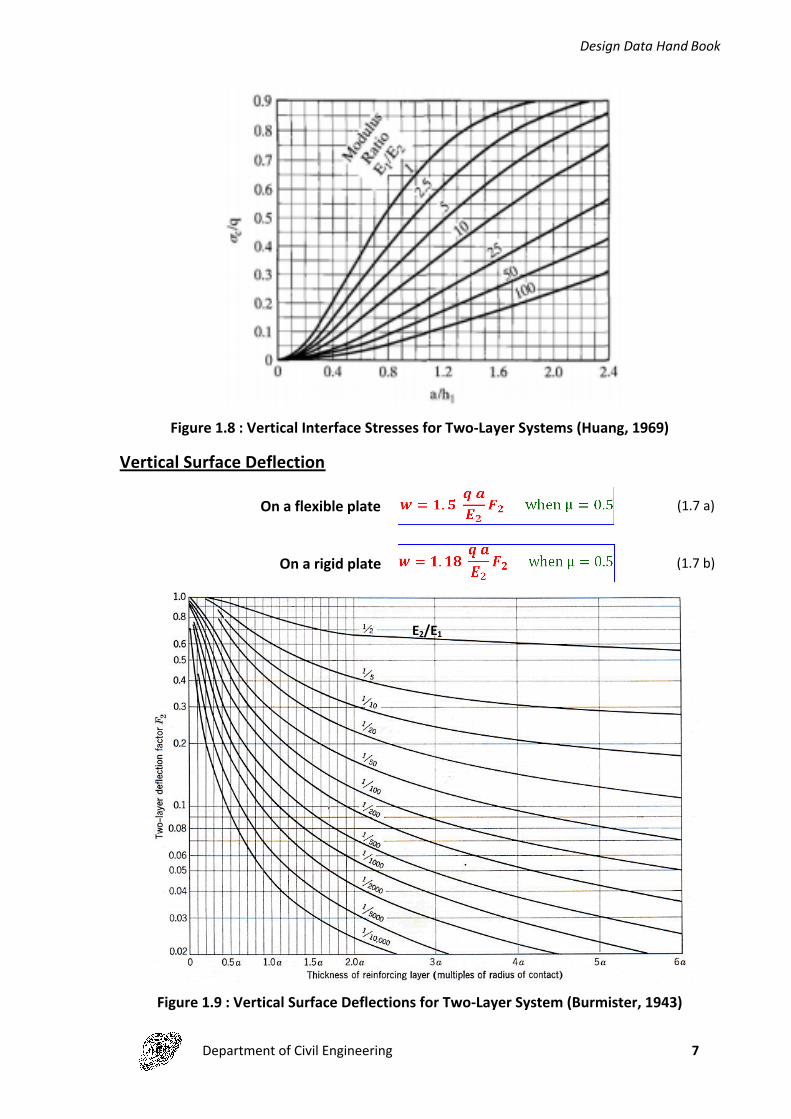
Figure 1.8 : Vertical Interface Stresses for Two-Layer Systems (Huang, 1969)
Vertical Surface Deflection
On a flexible plate (1.7 a)
On a rigid plate (1.7 b)
Figure 1.9 : Vertical Surface Deflections for Two-Layer System (Burmister, 1943)
E2/E1

Design Data Hand Book
Department of Civil Engineering 8
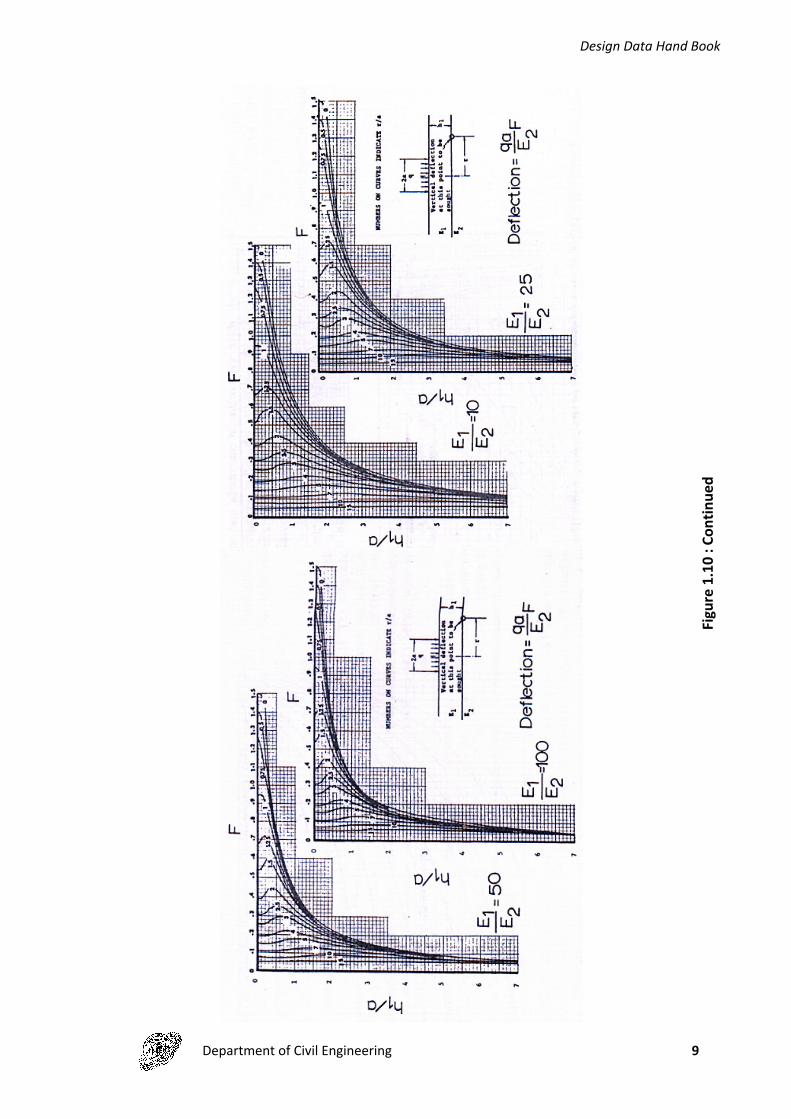
Vertical Interface Deflection
Figu
re 1
.10
: Ver
tical
Inte
rfac
e De
flect
ion
for T
wo-
Laye
r Sys
tem
s (Hu
ang,
196
9)
Design Data Hand Book
Department of Civil Engineering 9
Figu
re 1
.10
: Con
tinue
d
Design Data Hand Book
Department of Civil Engineering 10
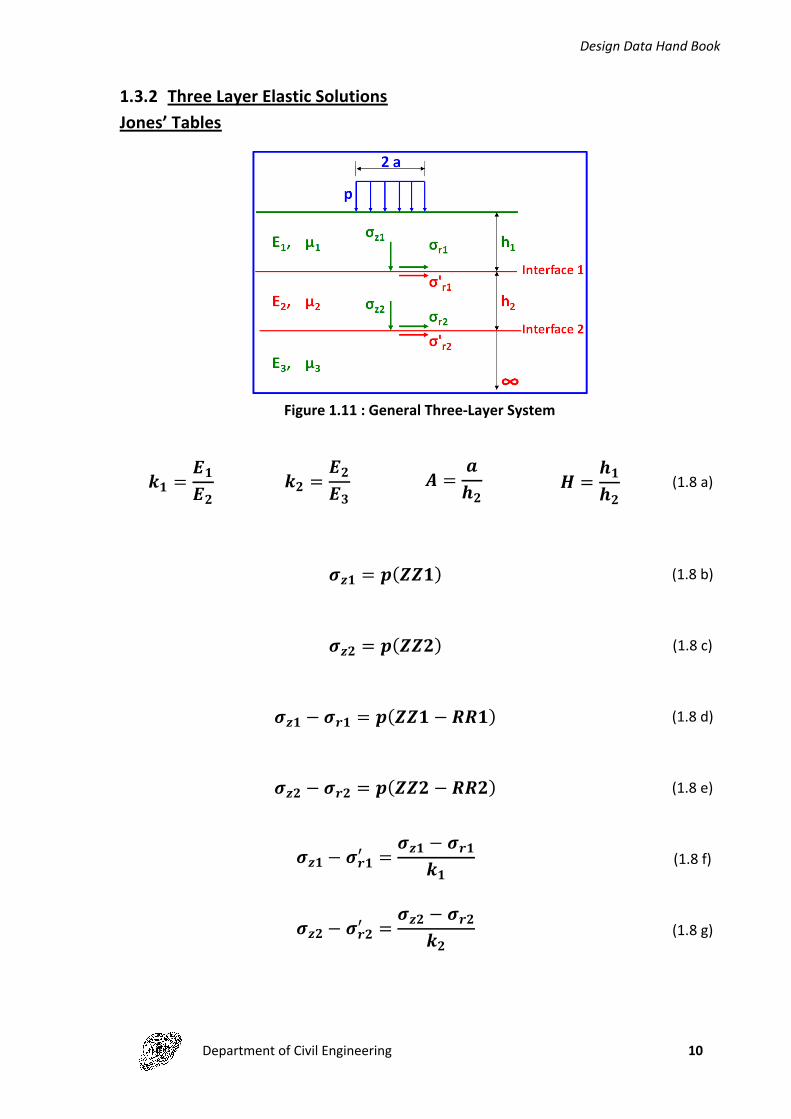
1.3.2 Three Layer Elastic SolutionsJones’ Tables
Figure 1.11 : General Three-Layer System
�� = ����
�� = ����
� = ���
� = ����
(1.8 a)
��� = �(���) (1.8 b)
��� = �(���) (1.8 c)
��� − ��� = �(��� − ���) (1.8 d)
��� − ��� = �(��� − ���) (1.8 e)
��� − ���� = ��� − ���
��(1.8 f)
��� − ���� = ��� − ���
��(1.8 g)

Design Data Hand Book
Department of Civil Engineering 11
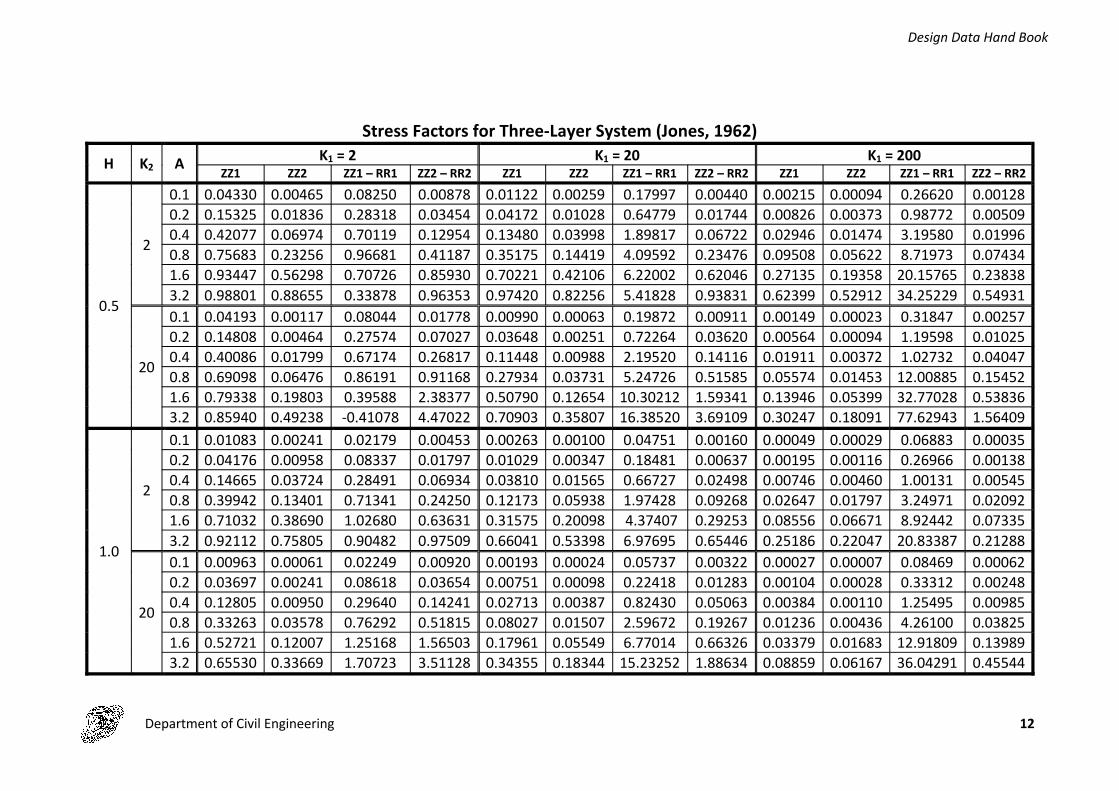
Stress Factors for Three-Layer System (Jones, 1962)
H K2 A K1 = 2 K1 = 20 K1 = 200ZZ1 ZZ2 ZZ1 – RR1 ZZ2 – RR2 ZZ1 ZZ2 ZZ1 – RR1 ZZ2 – RR2 ZZ1 ZZ2 ZZ1 – RR1 ZZ2 – RR2
0.125
2
0.1 0.42950 0.00896 0.70622 0.01716 0.14529 0.00810 1.81178 0.01542 0.03481 0.00549 3.02259 0.009690.2 0.78424 0.03493 0.97956 0.06647 0.38799 0.03170 3.76886 0.06003 0.11491 0.02167 8.02452 0.038120.4 0.98044 0.12667 0.70970 0.23531 0.78651 0.11650 5.16717 0.21640 0.33218 0.08229 17.64175 0.142860.8 0.99434 0.36932 0.22319 0.63003 1.02218 0.34941 3.43631 0.60493 0.72695 0.27307 27.27701 0.452081.6 0.99364 0.72113 -0.19982 0.97707 0.99060 0.69014 1.15211 0.97146 1.00203 0.63916 23.38638 0.908613.2 0.99922 0.96148 -0.28916 0.84030 0.99893 0.93487 0.06894 0.88358 1.00828 0.92560 11.87014 0.91469
20
0.1 0.43022 0.00228 0.69332 0.03467 0.14447 0.00182 1.80664 0.02985 0.03336 0.00128 3.17763 0.019800.2 0.78414 0.00899 0.92086 0.13541 0.38469 0.00716 3.74573 0.11697 0.10928 0.00509 8.66097 0.078270.4 0.97493 0.03392 0.46583 0.49523 0.77394 0.02710 5.05489 0.43263 0.31094 0.01972 20.12259 0.298870.8 0.97806 0.11350 -0.66535 1.49612 0.98610 0.09061 2.92533 1.33736 0.65934 0.07045 36.29943 1.016941.6 0.96921 0.31263 -2.82859 3.28512 0.93712 0.24528 -1.27093 2.99215 0.87931 0.20963 49.40857 2.643133.2 0.98591 0.68433 -5.27906 5.05952 0.96330 0.55490 -7.35384 5.06489 0.93309 0.49938 57.84369 4.89895
0.25
2
0.1 0.15524 0.00710 0.28362 0.01353 0.04381 0.00530 0.63215 0.00962 0.00909 0.00259 0.96553 0.004070.2 0.42809 0.02783 0.70225 0.05278 0.14282 0.02091 1.83766 0.03781 0.03269 0.01027 3.10763 0.016110.4 0.77939 0.10306 0.96634 0.19178 0.37882 0.07933 3.86779 0.14159 0.10684 0.04000 8.37852 0.062210.8 0.96703 0.31771 0.66885 0.55211 0.75904 0.26278 5.50796 0.44710 0.30477 0.14513 18.95534 0.218601.6 0.98156 0.66753 0.17331 0.95080 0.98743 0.61673 4.24281 0.90115 0.66786 0.42940 31.18909 0.585533.2 0.99840 0.93798 -0.05691 0.89390 1.00064 0.91258 1.97494 0.93254 0.98447 0.84545 28.98500 0.89191
20
0.1 0.15436 0.00179 0.25780 0.02728 0.04236 0.00123 0.65003 0.01930 0.00776 0.00065 1.08738 0.008610.2 0.42462 0.00706 0.67115 0.10710 0.13708 0.00488 1.90693 0.07623 0.02741 0.00257 3.59448 0.034210.4 0.76647 0.02697 0.84462 0.39919 0.35716 0.01888 4.13976 0.29072 0.08634 0.01014 10.30923 0.133650.8 0.92757 0.09285 0.21951 1.26565 0.68947 0.06741 6.48948 0.98565 0.23137 0.03844 26.41442 0.491351.6 0.91393 0.26454 -1.22411 2.94860 0.85490 0.20115 6.95639 2.55231 0.46835 0.13148 57.46409 1.538333.2 0.95243 0.60754 -3.04320 4.89878 0.90325 0.48647 6.05854 4.76234 0.71083 0.37342 99.29034 3.60964
Design Data Hand Book
Department of Civil Engineering 12
Stress Factors for Three-Layer System (Jones, 1962)
H K2 A K1 = 2 K1 = 20 K1 = 200ZZ1 ZZ2 ZZ1 – RR1 ZZ2 – RR2 ZZ1 ZZ2 ZZ1 – RR1 ZZ2 – RR2 ZZ1 ZZ2 ZZ1 – RR1 ZZ2 – RR2
0.5
2
0.1 0.04330 0.00465 0.08250 0.00878 0.01122 0.00259 0.17997 0.00440 0.00215 0.00094 0.26620 0.001280.2 0.15325 0.01836 0.28318 0.03454 0.04172 0.01028 0.64779 0.01744 0.00826 0.00373 0.98772 0.005090.4 0.42077 0.06974 0.70119 0.12954 0.13480 0.03998 1.89817 0.06722 0.02946 0.01474 3.19580 0.019960.8 0.75683 0.23256 0.96681 0.41187 0.35175 0.14419 4.09592 0.23476 0.09508 0.05622 8.71973 0.074341.6 0.93447 0.56298 0.70726 0.85930 0.70221 0.42106 6.22002 0.62046 0.27135 0.19358 20.15765 0.238383.2 0.98801 0.88655 0.33878 0.96353 0.97420 0.82256 5.41828 0.93831 0.62399 0.52912 34.25229 0.54931
20
0.1 0.04193 0.00117 0.08044 0.01778 0.00990 0.00063 0.19872 0.00911 0.00149 0.00023 0.31847 0.002570.2 0.14808 0.00464 0.27574 0.07027 0.03648 0.00251 0.72264 0.03620 0.00564 0.00094 1.19598 0.010250.4 0.40086 0.01799 0.67174 0.26817 0.11448 0.00988 2.19520 0.14116 0.01911 0.00372 1.02732 0.040470.8 0.69098 0.06476 0.86191 0.91168 0.27934 0.03731 5.24726 0.51585 0.05574 0.01453 12.00885 0.154521.6 0.79338 0.19803 0.39588 2.38377 0.50790 0.12654 10.30212 1.59341 0.13946 0.05399 32.77028 0.538363.2 0.85940 0.49238 -0.41078 4.47022 0.70903 0.35807 16.38520 3.69109 0.30247 0.18091 77.62943 1.56409
1.0
2
0.1 0.01083 0.00241 0.02179 0.00453 0.00263 0.00100 0.04751 0.00160 0.00049 0.00029 0.06883 0.000350.2 0.04176 0.00958 0.08337 0.01797 0.01029 0.00347 0.18481 0.00637 0.00195 0.00116 0.26966 0.001380.4 0.14665 0.03724 0.28491 0.06934 0.03810 0.01565 0.66727 0.02498 0.00746 0.00460 1.00131 0.005450.8 0.39942 0.13401 0.71341 0.24250 0.12173 0.05938 1.97428 0.09268 0.02647 0.01797 3.24971 0.020921.6 0.71032 0.38690 1.02680 0.63631 0.31575 0.20098 4.37407 0.29253 0.08556 0.06671 8.92442 0.073353.2 0.92112 0.75805 0.90482 0.97509 0.66041 0.53398 6.97695 0.65446 0.25186 0.22047 20.83387 0.21288
20
0.1 0.00963 0.00061 0.02249 0.00920 0.00193 0.00024 0.05737 0.00322 0.00027 0.00007 0.08469 0.000620.2 0.03697 0.00241 0.08618 0.03654 0.00751 0.00098 0.22418 0.01283 0.00104 0.00028 0.33312 0.002480.4 0.12805 0.00950 0.29640 0.14241 0.02713 0.00387 0.82430 0.05063 0.00384 0.00110 1.25495 0.009850.8 0.33263 0.03578 0.76292 0.51815 0.08027 0.01507 2.59672 0.19267 0.01236 0.00436 4.26100 0.038251.6 0.52721 0.12007 1.25168 1.56503 0.17961 0.05549 6.77014 0.66326 0.03379 0.01683 12.91809 0.139893.2 0.65530 0.33669 1.70723 3.51128 0.34355 0.18344 15.23252 1.88634 0.08859 0.06167 36.04291 0.45544

Design Data Hand Book
Department of Civil Engineering 13
Stress Factors for Three-Layer System (Jones, 1962)
H K2 A K1 = 2 K1 = 20 K1 = 200ZZ1 ZZ2 ZZ1 – RR1 ZZ2 – RR2 ZZ1 ZZ2 ZZ1 – RR1 ZZ2 – RR2 ZZ1 ZZ2 ZZ1 – RR1 ZZ2 – RR2
2.0
2
0.1 0.00250 0.00100 0.00555 0.00188 0.00059 0.00033 0.01219 0.00051 0.00011 0.00008 0.01737 0.000090.2 0.00991 0.00397 0.02199 0.00750 0.00235 0.00130 0.04843 0.00203 0.00045 0.00033 0.06913 0.000360.4 0.03832 0.01569 0.08465 0.02950 0.00922 0.00518 0.18857 0.00803 0.00179 0.00131 0.27103 0.001420.8 0.13516 0.05974 0.29365 0.11080 0.03412 0.02023 0.68382 0.03093 0.00685 0.00520 1.00808 0.005531.6 0.36644 0.20145 0.75087 0.35515 0.10918 0.07444 2.04134 0.10864 0.02441 0.02003 3.27590 0.020433.2 0.67384 0.51156 1.17294 0.77434 0.29183 0.23852 4.60426 0.30709 0.08061 0.07248 9.02195 0.06638
20
0.1 0.00181 0.00025 0.00652 0.00378 0.00033 0.00008 0.01568 0.00094 0.00005 0.00002 0.02160 0.000140.2 0.00716 0.00099 0.02586 0.01507 0.00130 0.00031 0.06236 0.00374 0.00018 0.00007 0.08604 0.000580.4 0.02746 0.00394 0.10017 0.05958 0.00503 0.00123 0.24425 0.01486 0.00071 0.00030 0.33866 0.002290.8 0.09396 0.01535 0.35641 0.22795 0.01782 0.00485 0.90594 0.05789 0.00261 0.00119 1.27835 0.009011.6 0.23065 0.05599 1.00785 0.78347 0.05012 0.01862 2.91994 0.21190 0.00819 0.00467 4.35311 0.033903.2 0.37001 0.17843 2.16033 2.13215 0.11331 0.06728 7.95104 0.67732 0.02341 0.01784 13.26873 0.11666
4.0
2
0.1 0.00057 0.00034 0.00147 0.00065 0.00013 0.00010 0.00312 0.00015 0.00003 0.00002 0.00437 0.000020.2 0.00228 0.00137 0.00587 0.00260 0.00054 0.00039 0.01245 0.00029 0.00011 0.00009 0.01746 0.000090.4 0.00905 0.00544 0.02324 0.01032 0.00214 0.00154 0.04944 0.00235 0.00042 0.00036 0.06947 0.000360.8 0.03500 0.02135 0.08957 0.04031 0.00837 0.00610 0.19247 0.00924 0.00168 0.00142 0.27221 0.001441.6 0.12354 0.07972 0.31215 0.14735 0.03109 0.02358 0.69749 0.03488 0.00646 0.00560 1.01140 0.005533.2 0.34121 0.25441 0.81908 0.43632 0.10140 0.08444 2.09049 0.11553 0.02332 0.02126 3.28913 0.01951
20
0.1 0.00030 0.00008 0.00201 0.00128 0.00005 0.00002 0.00413 0.00025 0.00001 0.00000 0.00545 0.000030.2 0.00119 0.00034 0.00803 0.00510 0.00021 0.00009 0.01651 0.00099 0.00003 0.00002 0.02178 0.000140.4 0.00469 0.00134 0.03191 0.02032 0.00083 0.00035 0.06569 0.00396 0.00013 0.00008 0.08673 0.000540.8 0.01790 0.00532 0.12427 0.07991 0.00321 0.00138 0.25739 0.01565 0.00050 0.00031 0.34131 0.002151.6 0.06045 0.02049 0.45100 0.29991 0.01103 0.00542 0.95622 0.05993 0.00186 0.00124 1.28773 0.008333.2 0.14979 0.07294 1.36427 0.97701 0.03258 0.02061 3.10980 0.20906 0.00612 0.00483 4.38374 0.03010

Design Data Hand Book
Department of Civil Engineering 14
1.4 DESIGN OF FLEXIBLE PAVEMENTS (IRC : 37-2001)1.4.1 Design Traffic
The design traffic is considered in terms of cumulative number of standard axles (in the lane carrying maximum traffic) to be carried during the design life of pavement using
� = ���[(� + �)� − �]� ∗ � ∗ � ∗ � (1.9 a)
N The cumulative number of standard axles to be catered for in the design life in terms of msa
A Initial traffic in the year of completion of construction in terms of the number of commercial vehicles per day
D Lane distribution factorF Vehicle damage factorn Design life in yearsr Annual growth rate of commercial vehicles
The traffic in the year of completion is estimated using
� = �(� + �)� (1.9 b)
P Number of commercial vehicles as per last countx Number of years between the last count and the year of completion of
construction
1.4.2 Traffic growth rate
Traffic growth rates should be estimated
by studying the past trends of traffic growth, and
by establishing econometric models, as per the procedure outlined in IRC:108 “Guidelines for traffic prediction on rural highways”.
If adequate data is not available, it is recommended that an average annual growth rate of 7.5 percent may be adopted.
1.4.3 Design Life
For the design of pavement, the design life is defined in terms of the cumulative number of standard axles that can be carried before strengthening of pavement is necessary.
It is recommended that pavements for National Highways (NH) and State Highways (SH) should be design for a life of 15 years. Expressways and Urban roads nay be designed for a longer life of 20 years. For other categories of roads, a design life of 10 to 15 years may be adopted.
Design Data Hand Book
Department of Civil Engineering 15
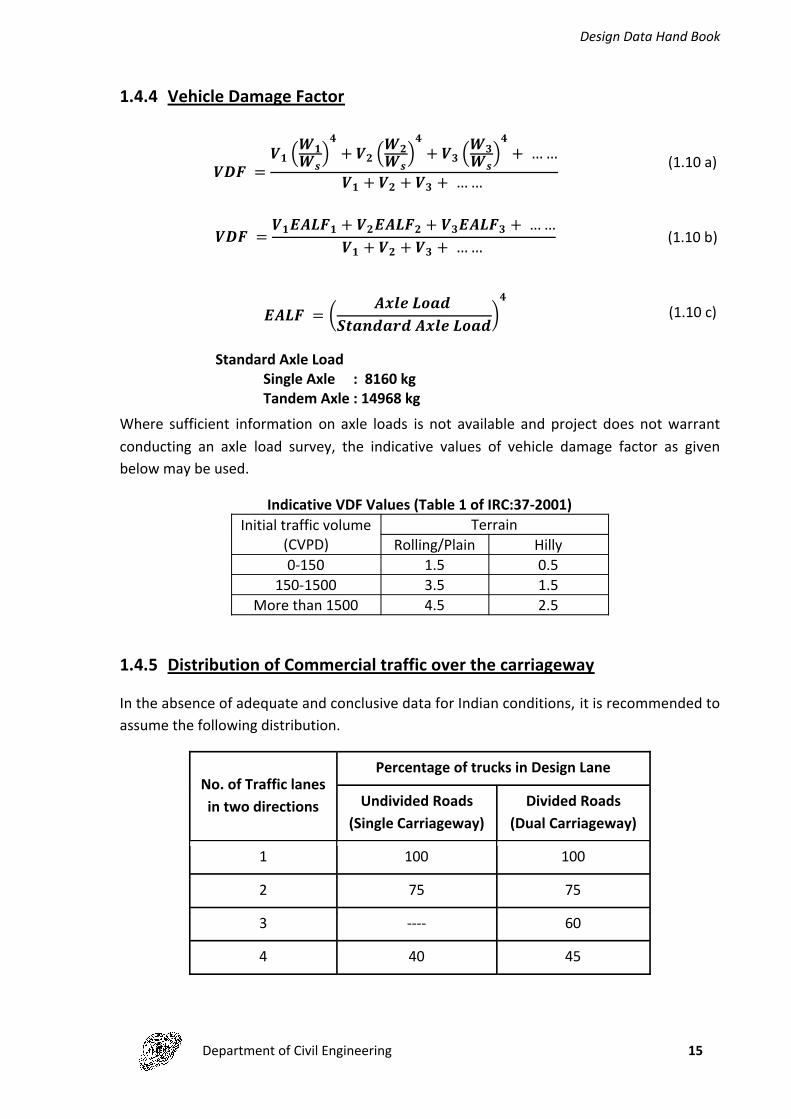
1.4.4 Vehicle Damage Factor
��� =�� ���
����+ �� ���
����+ �� ���
����+……
�� + �� + �� +……(1.10 a)
��� = ������� + ������� + ������� +……�� + �� + �� +…… (1.10 b)
���� = � �������������������������
�(1.10 c)
Standard Axle LoadSingle Axle : 8160 kgTandem Axle : 14968 kg
Where sufficient information on axle loads is not available and project does not warrant conducting an axle load survey, the indicative values of vehicle damage factor as given below may be used.
Indicative VDF Values (Table 1 of IRC:37-2001)Initial traffic volume
(CVPD)Terrain
Rolling/Plain Hilly0-150 1.5 0.5
150-1500 3.5 1.5More than 1500 4.5 2.5
1.4.5 Distribution of Commercial traffic over the carriageway
In the absence of adequate and conclusive data for Indian conditions, it is recommended to assume the following distribution.
No. of Traffic lanes in two directions
Percentage of trucks in Design Lane
Undivided Roads(Single Carriageway)
Divided Roads(Dual Carriageway)
1 100 100
2 75 75
3 ---- 60
4 40 45
Design Data Hand Book
Department of Civil Engineering 16
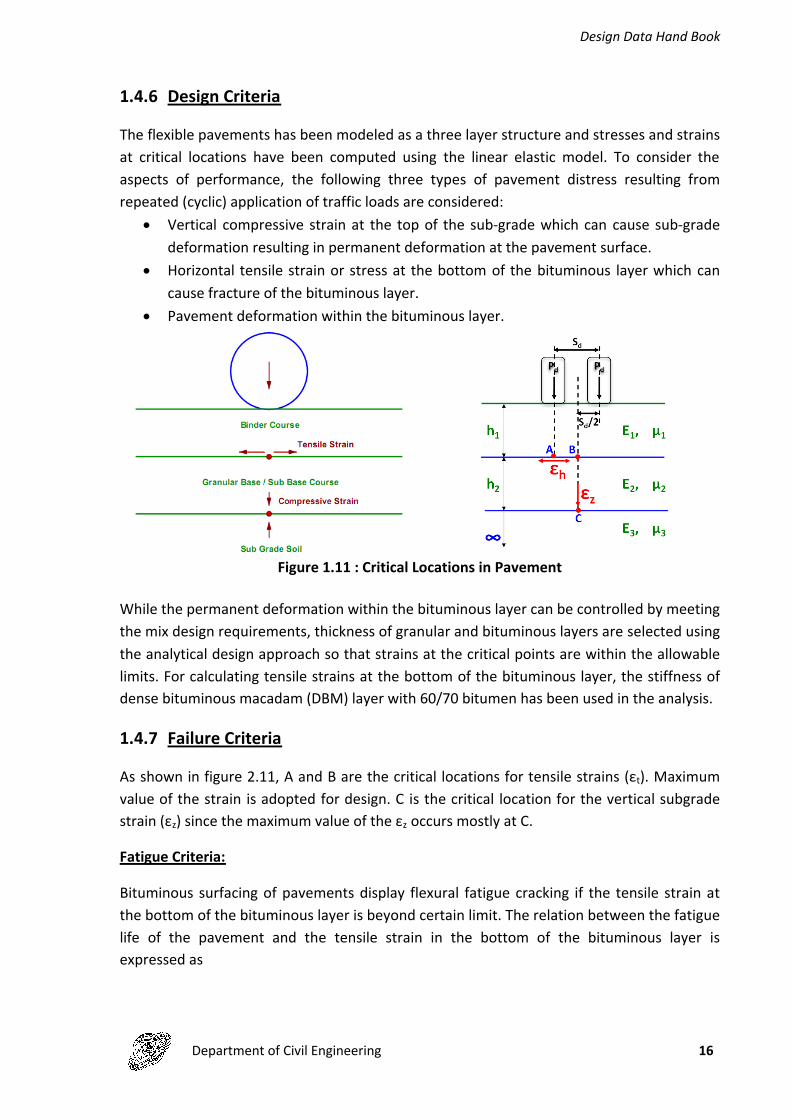
1.4.6 Design Criteria
The flexible pavements has been modeled as a three layer structure and stresses and strains at critical locations have been computed using the linear elastic model. To consider the aspects of performance, the following three types of pavement distress resulting from repeated (cyclic) application of traffic loads are considered:
Vertical compressive strain at the top of the sub-grade which can cause sub-grade deformation resulting in permanent deformation at the pavement surface.
Horizontal tensile strain or stress at the bottom of the bituminous layer which can cause fracture of the bituminous layer.
Pavement deformation within the bituminous layer.
Figure 1.11 : Critical Locations in Pavement
While the permanent deformation within the bituminous layer can be controlled by meeting the mix design requirements, thickness of granular and bituminous layers are selected using the analytical design approach so that strains at the critical points are within the allowable limits. For calculating tensile strains at the bottom of the bituminous layer, the stiffness of dense bituminous macadam (DBM) layer with 60/70 bitumen has been used in the analysis.
1.4.7 Failure Criteria
As shown in figure 2.11, A and B are the critical locations for tensile strains (εt). Maximum value of the strain is adopted for design. C is the critical location for the vertical subgrade strain (εz) since the maximum value of the εz occurs mostly at C.
Fatigue Criteria:
Bituminous surfacing of pavements display flexural fatigue cracking if the tensile strain at the bottom of the bituminous layer is beyond certain limit. The relation between the fatigue life of the pavement and the tensile strain in the bottom of the bituminous layer is expressed as
Design Data Hand Book
Department of Civil Engineering 17
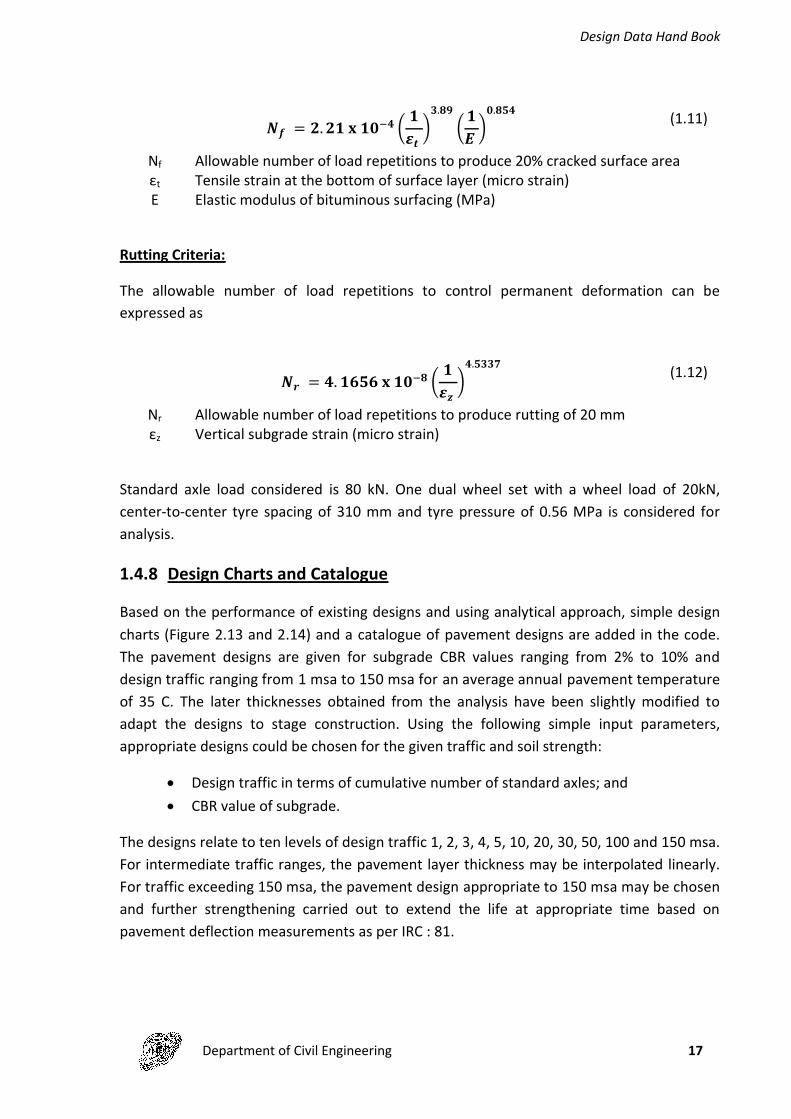
�� = �. ������� � ���
��.��
�����.��� (1.11)
Nf Allowable number of load repetitions to produce 20% cracked surface areaεt Tensile strain at the bottom of surface layer (micro strain)E Elastic modulus of bituminous surfacing (MPa)
Rutting Criteria:
The allowable number of load repetitions to control permanent deformation can be expressed as
�� = �. ��������� � ���
��.���� (1.12)
Nr Allowable number of load repetitions to produce rutting of 20 mmεz Vertical subgrade strain (micro strain)
Standard axle load considered is 80 kN. One dual wheel set with a wheel load of 20kN, center-to-center tyre spacing of 310 mm and tyre pressure of 0.56 MPa is considered for analysis.
1.4.8 Design Charts and Catalogue
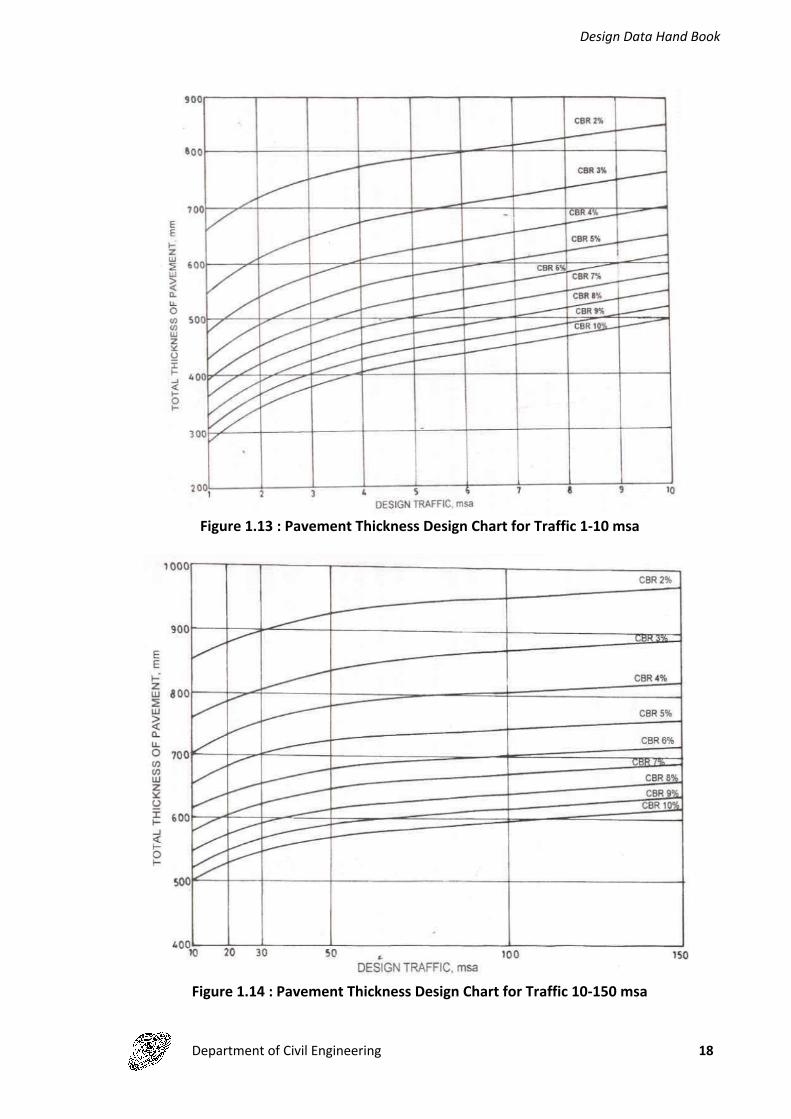
Based on the performance of existing designs and using analytical approach, simple design charts (Figure 2.13 and 2.14) and a catalogue of pavement designs are added in the code. The pavement designs are given for subgrade CBR values ranging from 2% to 10% and design traffic ranging from 1 msa to 150 msa for an average annual pavement temperature of 35 C. The later thicknesses obtained from the analysis have been slightly modified to adapt the designs to stage construction. Using the following simple input parameters, appropriate designs could be chosen for the given traffic and soil strength:
Design traffic in terms of cumulative number of standard axles; and CBR value of subgrade.
The designs relate to ten levels of design traffic 1, 2, 3, 4, 5, 10, 20, 30, 50, 100 and 150 msa. For intermediate traffic ranges, the pavement layer thickness may be interpolated linearly. For traffic exceeding 150 msa, the pavement design appropriate to 150 msa may be chosen and further strengthening carried out to extend the life at appropriate time based on pavement deflection measurements as per IRC : 81.
Design Data Hand Book
Department of Civil Engineering 18
Figure 1.13 : Pavement Thickness Design Chart for Traffic 1-10 msa
Figure 1.14 : Pavement Thickness Design Chart for Traffic 10-150 msa
Design Data Hand Book
Department of Civil Engineering 19
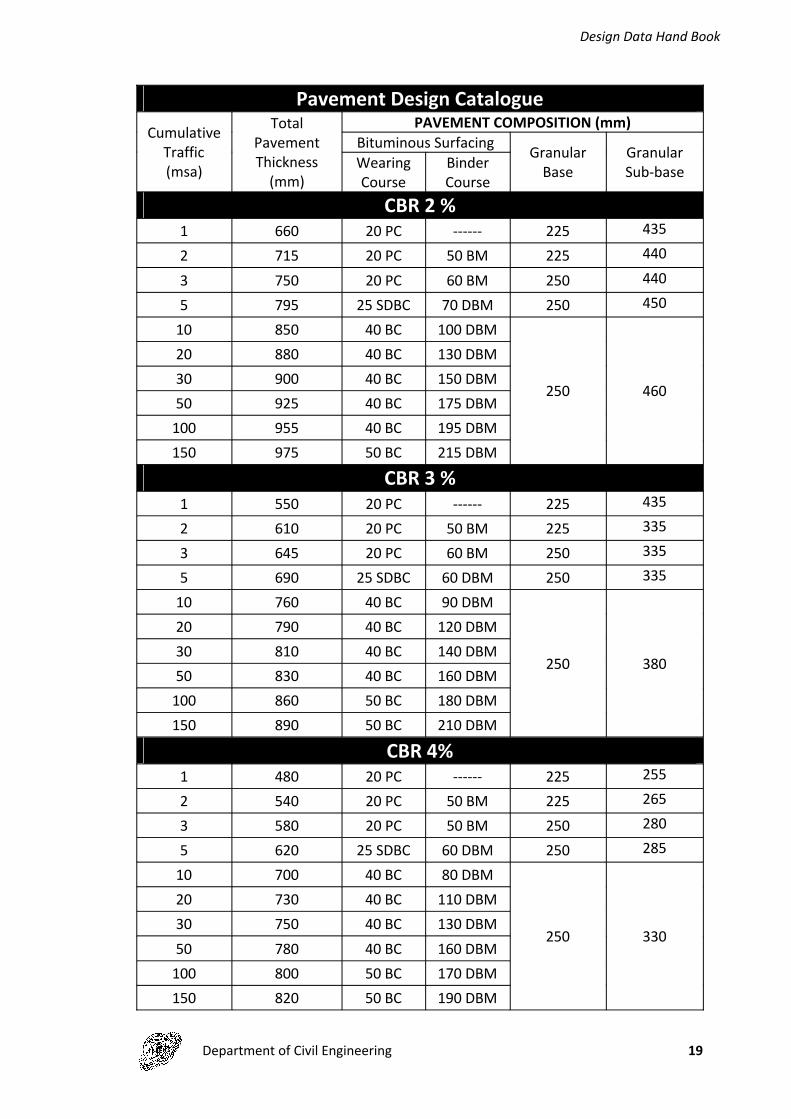
Pavement Design CatalogueCumulative
Traffic(msa)
Total Pavement Thickness
(mm)
PAVEMENT COMPOSITION (mm)Bituminous Surfacing Granular
BaseGranular Sub-base Wearing
CourseBinder Course
CBR 2 %1 660 20 PC ------ 225 435
2 715 20 PC 50 BM 225 440
3 750 20 PC 60 BM 250 440
5 795 25 SDBC 70 DBM 250 450
10 850 40 BC 100 DBM
250 460
20 880 40 BC 130 DBM30 900 40 BC 150 DBM50 925 40 BC 175 DBM
100 955 40 BC 195 DBM150 975 50 BC 215 DBM
CBR 3 %1 550 20 PC ------ 225 435
2 610 20 PC 50 BM 225 335
3 645 20 PC 60 BM 250 335
5 690 25 SDBC 60 DBM 250 335
10 760 40 BC 90 DBM
250 380
20 790 40 BC 120 DBM30 810 40 BC 140 DBM50 830 40 BC 160 DBM
100 860 50 BC 180 DBM150 890 50 BC 210 DBM
CBR 4%1 480 20 PC ------ 225 255
2 540 20 PC 50 BM 225 265
3 580 20 PC 50 BM 250 280
5 620 25 SDBC 60 DBM 250 285
10 700 40 BC 80 DBM
250 330
20 730 40 BC 110 DBM30 750 40 BC 130 DBM50 780 40 BC 160 DBM
100 800 50 BC 170 DBM150 820 50 BC 190 DBM

Design Data Hand Book
Department of Civil Engineering 20
Pavement Design CatalogueCumulative
Traffic(msa)
Total Pavement Thickness
(mm)
PAVEMENT COMPOSITION (mm)Bituminous Surfacing Granular
BaseGranular Sub-base Wearing
CourseBinder Course
CBR 5%1 430 20 PC ------ 225 205
2 490 20 PC 50 BM 225 215
3 530 20 PC 50 BM 250 230
5 580 25 SDBC 55 DBM 250 250
10 660 40 BC 70 DBM
250 300
20 690 40 BC 100 DBM30 710 40 BC 120 DBM50 730 40 BC 140 DBM
100 750 50 BC 150 DBM150 770 50 BC 170 DBM
CBR 6 %1 390 20 PC ------ 225 165
2 450 20 PC 50 BM 225 175
3 490 20 PC 50 BM 250 190
5 535 25 SDBC 50 DBM 250 210
10 615 40 BC 65 DBM
250 260
20 640 40 BC 90 DBM30 655 40 BC 105 DBM50 675 40 BC 125 DBM
100 700 50 BC 140 DBM150 720 50 BC 160 DBM
CBR 7%1 375 20 PC ------ 225 150
2 425 20 PC 50 BM 225 150
3 460 20 PC 50 BM 250 160
5 505 25 SDBC 50 DBM 250 180
10 580 40 BC 60 DBM
250 230
20 610 40 BC 90 DBM30 630 40 BC 110 DBM50 650 40 BC 130 DBM
100 675 50 BC 145 DBM150 695 50 BC 165 DBM

Design Data Hand Book
Department of Civil Engineering 21
Pavement Design CatalogueCumulative
Traffic(msa)
Total Pavement Thickness
(mm)
PAVEMENT COMPOSITION (mm)Bituminous Surfacing Granular
BaseGranular Sub-base Wearing
CourseBinder Course
CBR 8%1 375 20 PC ------ 225 150
2 425 20 PC 50 BM 225 150
3 450 20 PC 50 BM 250 150
5 475 25 SDBC 50 DBM 250 150
10 550 40 BC 60 DBM
250 200
20 575 40 BC 85 DBM30 590 40 BC 100 DBM50 610 40 BC 120 DBM
100 640 50 BC 140 DBM150 660 50 BC 160 DBM
CBR 9%1 375 20 PC ------ 225 150
2 425 20 PC 50 BM 225 150
3 450 20 PC 50 BM 250 150
5 475 25 SDBC 50 DBM 250 150
10 540 40 BC 50 DBM
250 200
20 570 40 BC 80 DBM30 585 40 BC 95 DBM50 605 40 BC 115 DBM
100 635 50 BC 135 DBM150 655 50 BC 155 DBM
CBR 10 %1 375 20 PC ------ 225 150
2 425 20 PC 50 BM 225 150
3 450 20 PC 50 BM 250 150
5 475 25 SDBC 50 DBM 250 150
10 540 40 BC 50 DBM
250 200
20 565 40 BC 75 DBM30 580 40 BC 90 DBM50 600 40 BC 110 DBM
100 630 50 BC 130 DBM150 650 50 BC 150 DBM
Design Data Hand Book
Department of Civil Engineering 22
1.4.9 Pavement Composition
Sub-base Course Natural sand, gravel, laterite, brick metal, crushed stone or combinations thereof Minimum CBR :
20% upto 2 msa traffic 30% exceeding 2 msa
Minimum Thickness 150 mm for traffic < 10 msa 200 mm for traffic ≥ 10 msa
If subgrade CBR < 2%, design for subgrade CBR of 2% and provide a 150 mm thick capping layer of minimum CBR 10% in addition to sub-base
Base Course Unbound granular material – WBM, WMM or other equivalent granular construction
conforming to IRC/MORT&H specifications Minimum Thickness
225 mm for traffic ≤ 2 msa 250 mm for traffic > 2 msa
If WBM is used and traffic > 10 msa, minimum thickness is 300 mm (4 layers of 75 mm each)
Bituminous Surfacing Wearing course or Binder course+wearing course Wearing course : Surface dressing, open-graded premix carpet, mix seal surfacing,
SDBC and BC Binder course : BM, DBM, mix seal surfacing, SDBC and BC Wearing surface used is open-graded premix carpet of thickness upto 25 mm, it
should not be counted towards the total thickness
1.4.10 Final Remarks
The present guidelines follows mechanistic empirical approach and developed new set of designs up to 150 msa
Thickness charts are still available for CBR values of up to 10% only Design charts are available for only a pavement temperature of 35o C The contribution of individual component layers is still not realized fully with the
system of catalogue thicknesses. The same can be done with the analytical tool for design.
Design Data Hand Book
Department of Civil Engineering 23
2. ANALYSIS AND DESIGN OF RIGID PAVEMENTS
2.1 Modulus of Subgrade Reaction (K)
� = �∆
(2.1 a)
p Pressure sustained by a rigid plate of diameter 75 cm at design deflection ∆∆ Design deflection = 0.125 cm
Allowance for Worst Subgrade Moisture
�� = � �����
(2.1 b)
pus Pressure required in the plate bearing test for design deflection of 0.125 cm which produces a deformation of δ in unsoaked consolidation test
ps Pressure required to produce the same deformation δ in the soaked consolidation test
K Modulus of subgrade reaction for the prevailing moisture conditionKs Corrected modulus of subgrade reaction for worst subgrade moisture
Correction for Small Plate Size
� = �����
(2.1 c)
K1 Modulus of subgrade reaction determined using plate of radius a1
K Corrected modulus of subgrade reaction for standard plate of radius a
2.2 Radius of Relative Stiffness (l)
� = � ���
���(� − ��)�� �� (2.2)
E Modulus of elasticity of cement concreteμ Poisson’s ratio of concrete = 0.15h Slab thicknessK Modulus of subgrade reaction
2.3 Equivalent Radius of Resisting Section (b)
� = ��. ��� + �� − �. ��������� < 1.724ℎ (2.3)
� = ������ ≥ �. ����A Radius of wheel load distribution H Slab thickness
Design Data Hand Book
Department of Civil Engineering 24
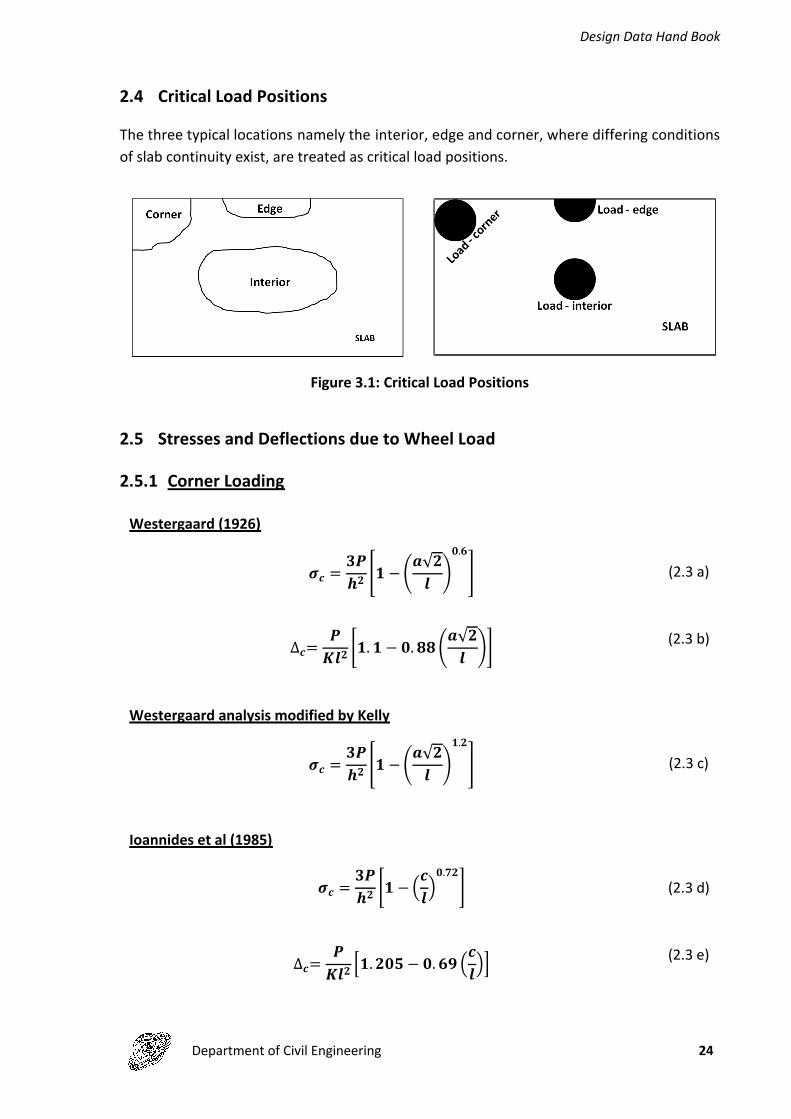
2.4 Critical Load Positions
The three typical locations namely the interior, edge and corner, where differing conditions of slab continuity exist, are treated as critical load positions.
Figure 3.1: Critical Load Positions
2.5 Stresses and Deflections due to Wheel Load
2.5.1 Corner Loading
Westergaard (1926)
�� =���� �� −��√�� �
�.�
� (2.3 a)
∆�=���� ��. � − �. ����√�� �� (2.3 b)
Westergaard analysis modified by Kelly
�� =���� �� −��√�� �
�.�
� (2.3 c)
Ioannides et al (1985)
�� =���� �� − ����
�.��� (2.3 d)
∆�=���� ��. ��� − �. �� �����
(2.3 e)
Design Data Hand Book
Department of Civil Engineering 25
2.5.2 Interior Loading
Westergaard (1926)
�� =�(� + �)�
���� ��� �� + �. ����� (2.4 a)
∆�=�
���� �� + ��� ��� � ���� − �. ���� ����
�� (2.4 b)
2.5.3 Edge LoadingWestergaard (1926)
�� = �.������ �� ��� ���� + �. ���� (2.5 a)
Westergaard’s analysis Modified by Teller and Sutherland (1948)
�� = �.������ (� + �. ���) �� ��� ���� + ���(�) − �. ����� (2.5 b)
Ioannides et al (1985) – Semicircular loaded area
�� = �(� + �)��(� + �)�� ��� � ���
������� + �. �� − ��� + (� + ��)
�� � (2.5 c)
∆�= ���� + �. ������ � �� −
(�. ��� + �. ���)�� � (2.5 d)
When μ = 0.15
�� = �. ������ �� ��� ���� + �. ��� ���� + �. ���� (2.5 e)
∆�=�. ����
��� �� −�. ��� ����� (2.5 f)
Design Data Hand Book
Department of Civil Engineering 26
Ioannides et al (1985) – Circular loaded area
�� = �(� + �)��(� + �)�� ��� � ���
������� + �. �� − ��� + � − �
� + �. ��(� + ��)�� � (2.5 g)
∆�= ���� + �. ������ � �� −
(�. �� + �. ��)�� � (2.5 h)
When μ = 0.15
�� = �. ������ �� ��� ���� + �. ��� ���� − �. ���� (2.5 i)
∆�=�. ����
��� �� −�. �� ����� (2.5 j)
σc, σi, σe Maximum stress at corner, interior and edge loading respectively∆c, ∆i, ∆e Maximum deflection at corner, interior and edge loading respectively
h Slab thicknessP Wheel loadK Modulus of subgrade reactiona Radius of wheel load distribution l Radius of relative stiffnessb Radius of resisting sectionc Side length of square contact area = 1.772aE Modulus of elasticity of cement concreteμ Poisson’s ratio of concrete = 0.15
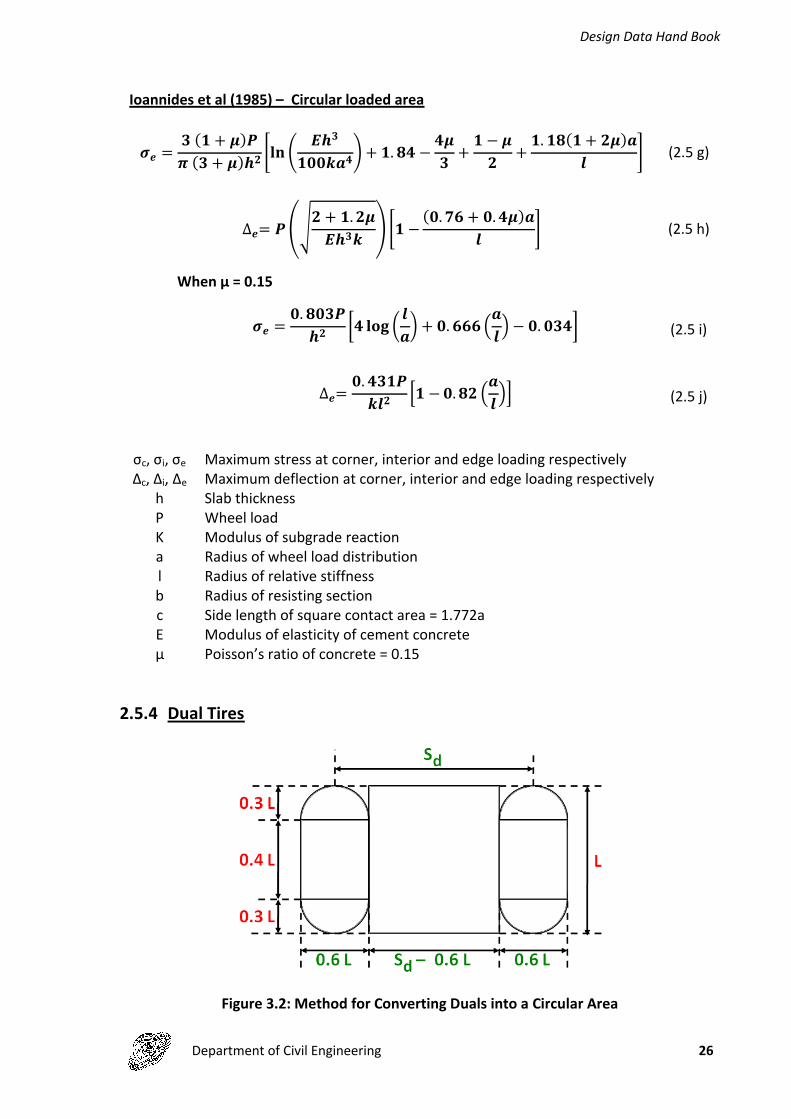
2.5.4 Dual Tires
Figure 3.2: Method for Converting Duals into a Circular Area
Design Data Hand Book
Department of Civil Engineering 27
If Pd is the load on one tire and q is the contact pressure, the area of each tire is
��� = [�(�. ��)� + (�. ��)(�. ��)] = �. ��������� = � ��
�. ����� (2.6 a)
The area of equivalent circle is
��� = �(�. ������) + (�� − �. ��)� = �. ������ + ��� (2.6 b)
The radius of contact area
� = ��. �������� + ��
� � ���. ������
�.�(2.6 c)
2.6 Temperature Stresses
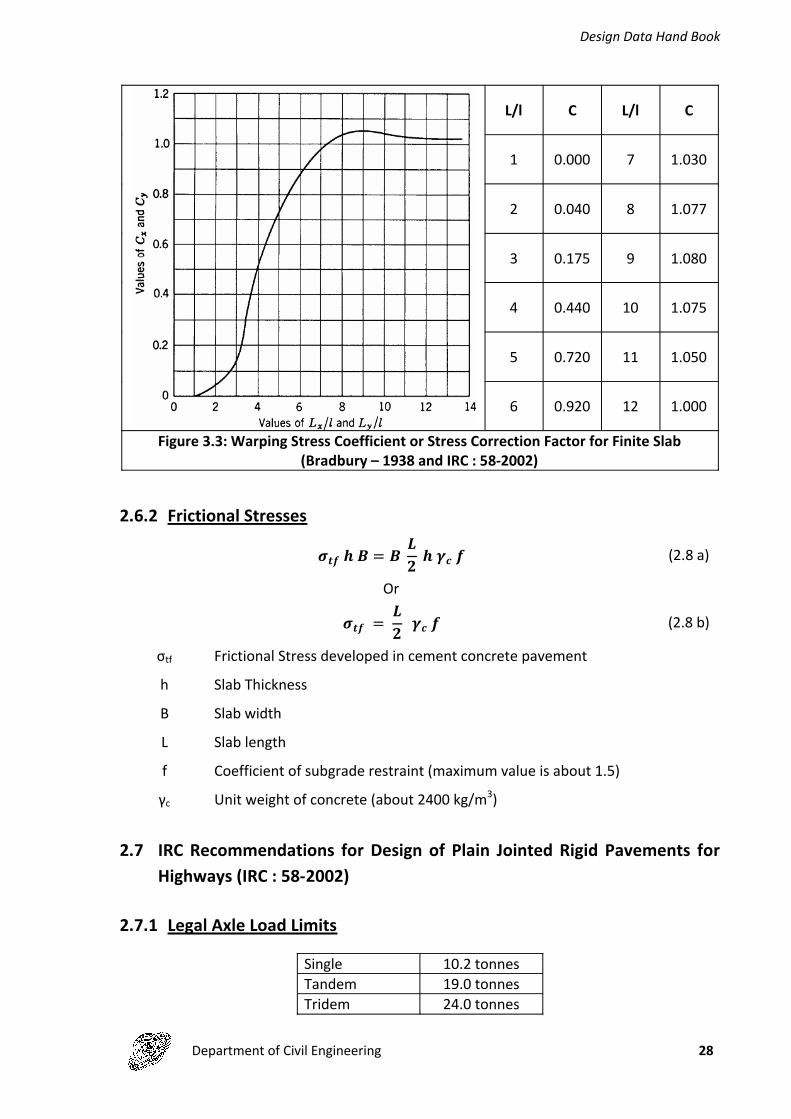
2.6.1 Warping Stresses (Westergaard Analysis)Interior
��� =���� ��� + ���
� − �� � (2.7 a)
Edge
��� = ������ ����� = �����
� (2.7 b)
Corner
��� =���
�(� − �)��� (2.7 c)
σtc, σti, σte Maximum warping stress at corner, interior and edge region respectively
a Radius of wheel load distribution
l Radius of relative stiffness
E Modulus of elasticity of cement concrete
μ Poisson’s ratio of concrete = 0.15
α Thermal coefficient of concrete
Cx, Cy, Bradbury warping stress coefficient
Design Data Hand Book
Department of Civil Engineering 28
L/l C L/l C
1 0.000 7 1.030
2 0.040 8 1.077
3 0.175 9 1.080
4 0.440 10 1.075
5 0.720 11 1.050
6 0.920 12 1.000
Figure 3.3: Warping Stress Coefficient or Stress Correction Factor for Finite Slab(Bradbury – 1938 and IRC : 58-2002)
2.6.2 Frictional Stresses
����� = � �� ���� (2.8 a)
Or
��� = ����� (2.8 b)
σtf Frictional Stress developed in cement concrete pavement
h Slab Thickness
B Slab width
L Slab length
f Coefficient of subgrade restraint (maximum value is about 1.5)
γc Unit weight of concrete (about 2400 kg/m3)
2.7 IRC Recommendations for Design of Plain Jointed Rigid Pavements for Highways (IRC : 58-2002)
2.7.1 Legal Axle Load Limits
Single 10.2 tonnesTandem 19.0 tonnesTridem 24.0 tonnes
Design Data Hand Book
Department of Civil Engineering 29
2.7.2 Load Safety Factors
Expressway/NH/SH/MDR 1.2Lesser importance with lower truck traffic 1.1Residential and other streets 1.0
2.7.3 Tyre PressureRange 0.7 to 1.0 MPa No significant effect on pavements ≥ 20cm thick0.8 MPa is adopted
2.7.4 Design PeriodNormal – 30 yearsAccurate prediction not possible – 20 years
2.7.5 Design Traffica. 2-lane 2-way road – 25% of total for fatigue designb. 4-lane or multi-lane divided traffic – 25% of total traffic in the direction of
predominant traffic.c. New highway links where no traffic data is available - data from roads similar
classification and importanced. Average annual growth rate – 7.5%e. Cumulative Number of Repetitions of Axles
� = ���[(� + �)� − �]� � (2.9 a)
� = �(� + �)� (2.9 b)
A Initial number of axles per day in the year when the road is operationalR Annual rate of growth of commercial trafficN Design period in yearsP Number of commercial vehicles as per last countX Number of years between the last count and the year of completion of
construction
2.7.6 Characteristics of Sub-grade
Modulus of sub-grade reaction (K)
a. Pressure sustained per unit deflectionb. Plate bearing test (IS : 9214 – 1974)c. Limiting design deflection = 1.25mmd. K75 = 0.5 k30
e. One test/km/lane
Design Data Hand Book
Department of Civil Engineering 30
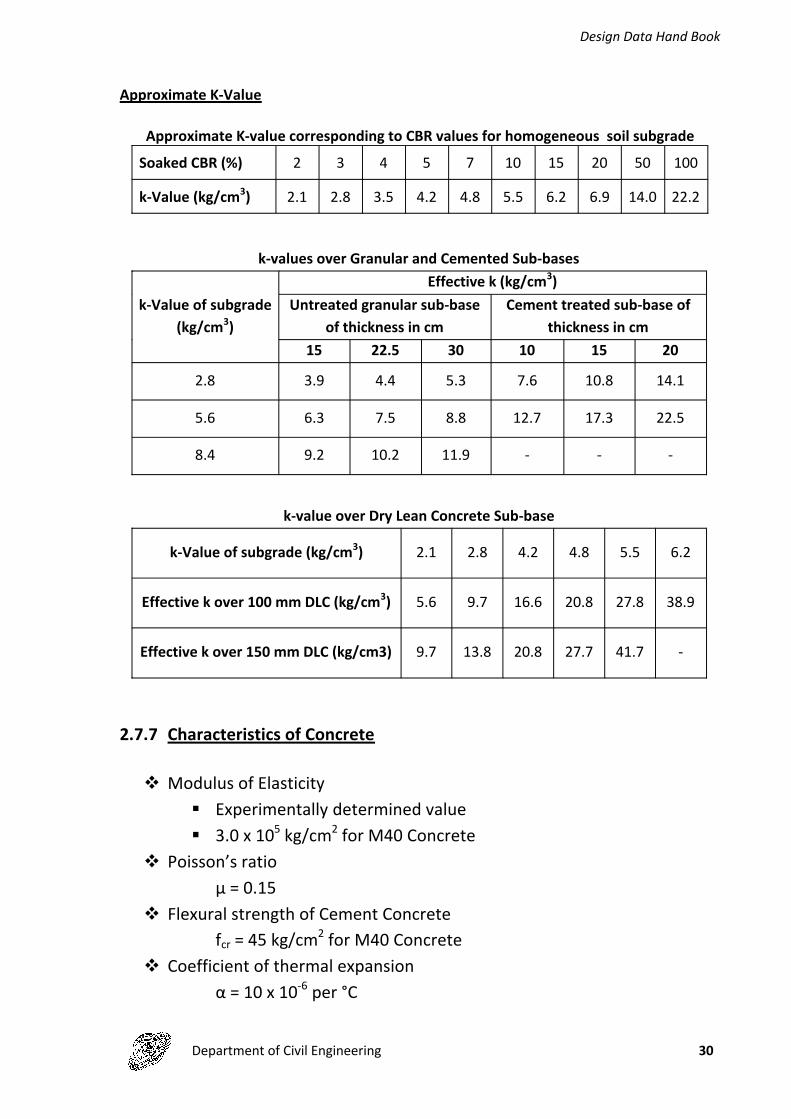
Approximate K-Value
Approximate K-value corresponding to CBR values for homogeneous soil subgrade
Soaked CBR (%) 2 3 4 5 7 10 15 20 50 100
k-Value (kg/cm3) 2.1 2.8 3.5 4.2 4.8 5.5 6.2 6.9 14.0 22.2
k-values over Granular and Cemented Sub-bases
k-Value of subgrade(kg/cm3)
Effective k (kg/cm3)Untreated granular sub-base
of thickness in cmCement treated sub-base of
thickness in cm15 22.5 30 10 15 20
2.8 3.9 4.4 5.3 7.6 10.8 14.1
5.6 6.3 7.5 8.8 12.7 17.3 22.5
8.4 9.2 10.2 11.9 - - -
k-value over Dry Lean Concrete Sub-base
k-Value of subgrade (kg/cm3) 2.1 2.8 4.2 4.8 5.5 6.2
Effective k over 100 mm DLC (kg/cm3) 5.6 9.7 16.6 20.8 27.8 38.9
Effective k over 150 mm DLC (kg/cm3) 9.7 13.8 20.8 27.7 41.7 -
2.7.7 Characteristics of Concrete
Modulus of Elasticity Experimentally determined value 3.0 x 10⁵ kg/cm2 for M40 Concrete
Poisson’s ratio µ = 0.15
Flexural strength of Cement Concretefcr = 45 kg/cm2 for M40 Concrete
Coefficient of thermal expansion α = 10 x 10-6 per °C
Design Data Hand Book
Department of Civil Engineering 31
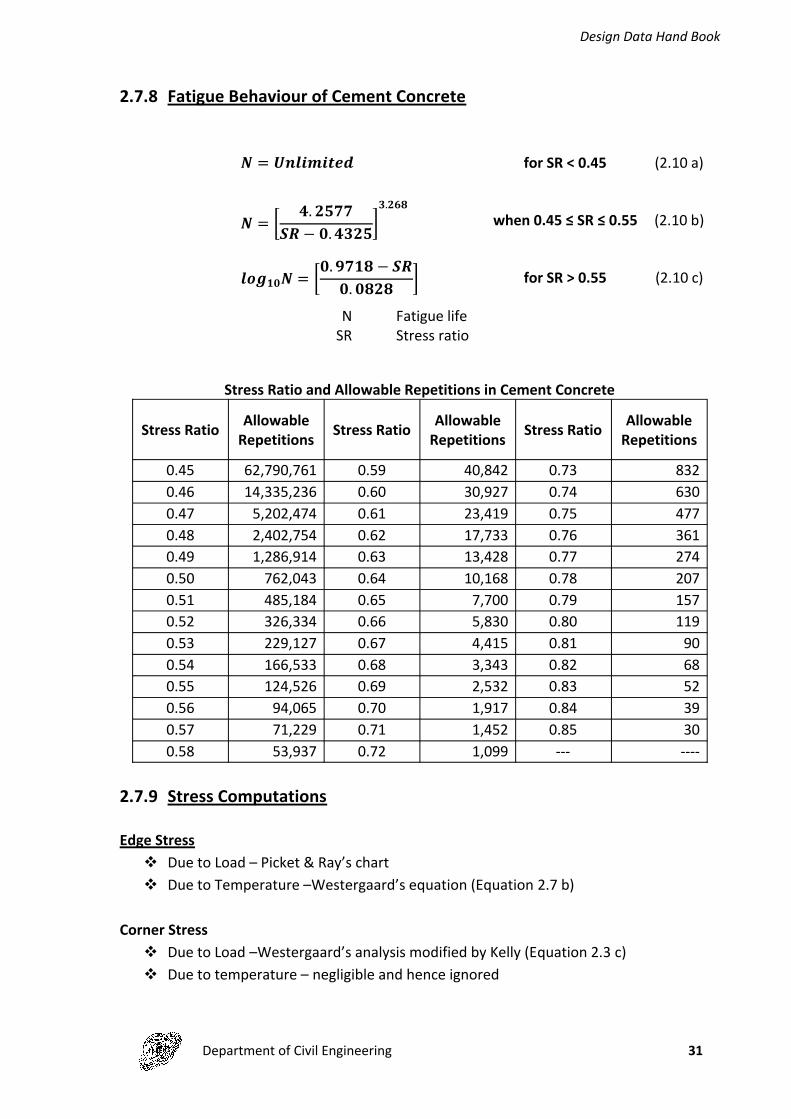
2.7.8 Fatigue Behaviour of Cement Concrete
� = ��������� for SR < 0.45 (2.10 a)
� = � �. ������ − �. �����
�.���when 0.45 ≤ SR ≤ 0.55 (2.10 b)
������ = ��. ���� − ���. ���� � for SR > 0.55 (2.10 c)
N Fatigue lifeSR Stress ratio
Stress Ratio and Allowable Repetitions in Cement Concrete
Stress Ratio Allowable Repetitions Stress Ratio Allowable
Repetitions Stress Ratio Allowable Repetitions
0.45 62,790,761 0.59 40,842 0.73 8320.46 14,335,236 0.60 30,927 0.74 6300.47 5,202,474 0.61 23,419 0.75 4770.48 2,402,754 0.62 17,733 0.76 3610.49 1,286,914 0.63 13,428 0.77 2740.50 762,043 0.64 10,168 0.78 2070.51 485,184 0.65 7,700 0.79 1570.52 326,334 0.66 5,830 0.80 1190.53 229,127 0.67 4,415 0.81 900.54 166,533 0.68 3,343 0.82 680.55 124,526 0.69 2,532 0.83 520.56 94,065 0.70 1,917 0.84 390.57 71,229 0.71 1,452 0.85 300.58 53,937 0.72 1,099 --- ----
2.7.9 Stress Computations
Edge Stress Due to Load – Picket & Ray’s chart Due to Temperature –Westergaard’s equation (Equation 2.7 b)
Corner Stress Due to Load –Westergaard’s analysis modified by Kelly (Equation 2.3 c) Due to temperature – negligible and hence ignored
Design Data Hand Book
Department of Civil Engineering 32
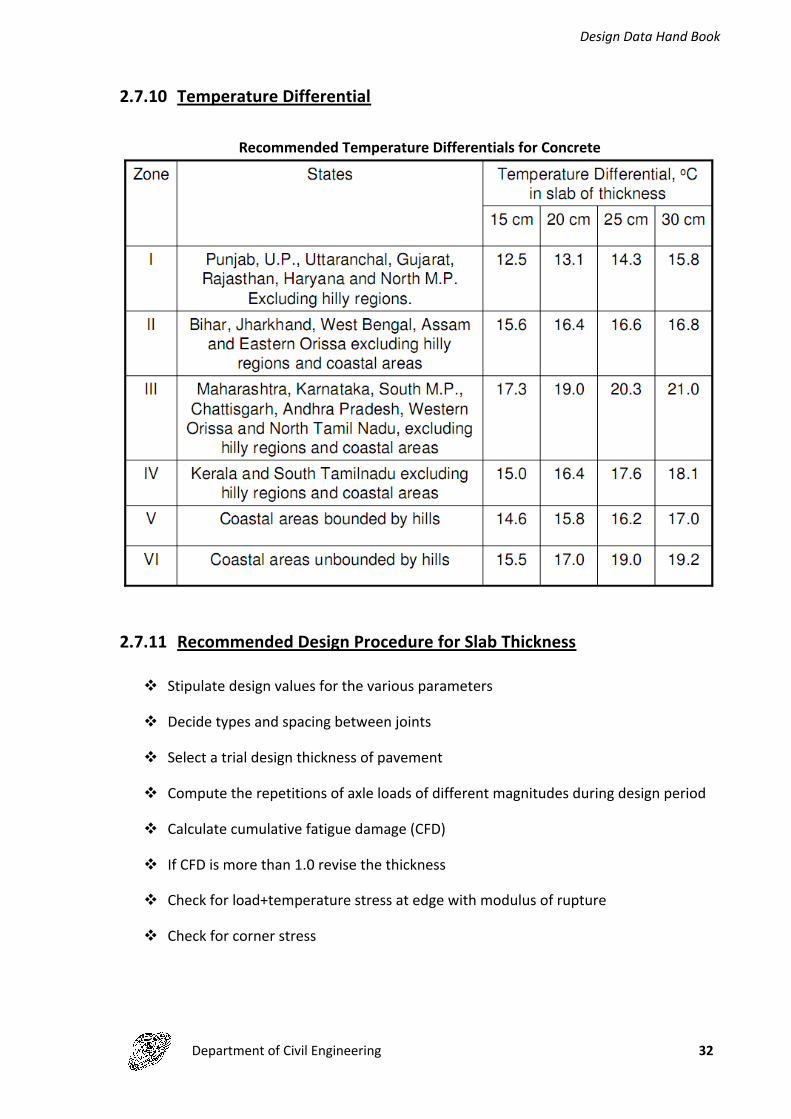
2.7.10 Temperature Differential
Recommended Temperature Differentials for Concrete
2.7.11 Recommended Design Procedure for Slab Thickness
Stipulate design values for the various parameters
Decide types and spacing between joints
Select a trial design thickness of pavement
Compute the repetitions of axle loads of different magnitudes during design period
Calculate cumulative fatigue damage (CFD)
If CFD is more than 1.0 revise the thickness
Check for load+temperature stress at edge with modulus of rupture
Check for corner stress
Design Data Hand Book
Department of Civil Engineering 33
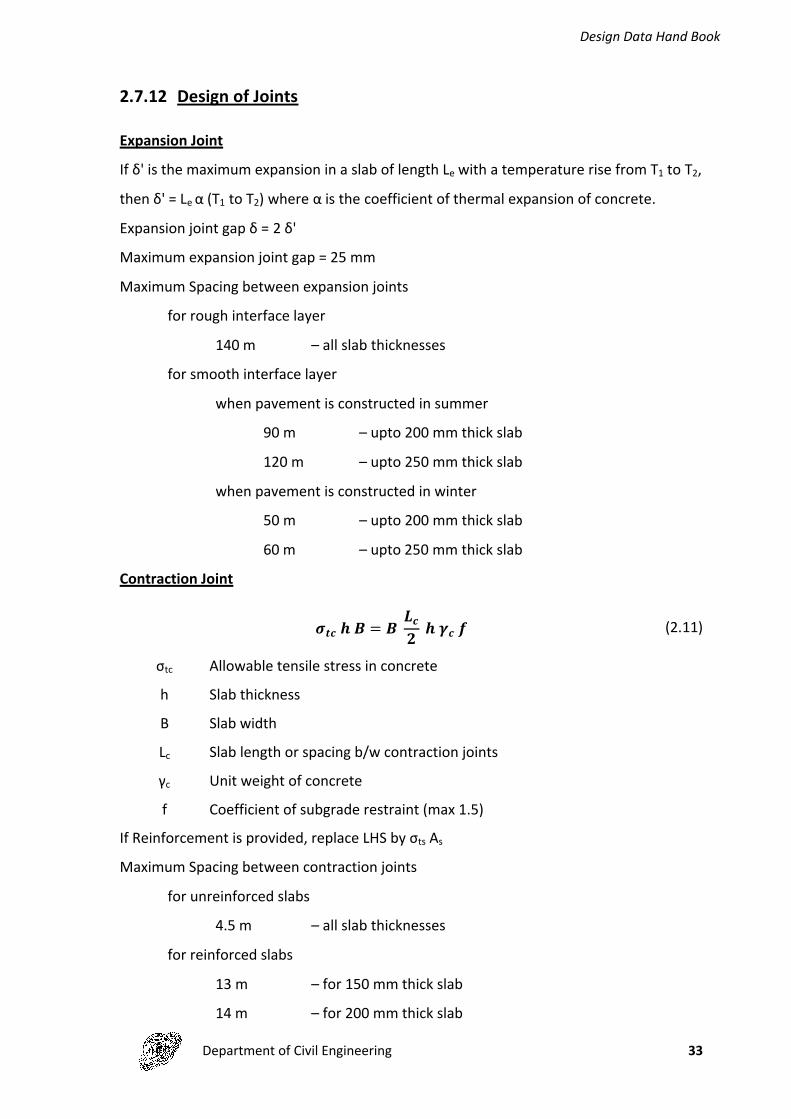
2.7.12 Design of Joints
Expansion Joint
If δ' is the maximum expansion in a slab of length Le with a temperature rise from T1 to T2,
then δ' = Le α (T1 to T2) where α is the coefficient of thermal expansion of concrete.
Expansion joint gap δ = 2 δ'
Maximum expansion joint gap = 25 mm
Maximum Spacing between expansion joints
for rough interface layer
140 m – all slab thicknesses
for smooth interface layer
when pavement is constructed in summer
90 m – upto 200 mm thick slab
120 m – upto 250 mm thick slab
when pavement is constructed in winter
50 m – upto 200 mm thick slab
60 m – upto 250 mm thick slab
Contraction Joint
����� = � ��� ���� (2.11)
σtc Allowable tensile stress in concrete
h Slab thickness
B Slab width
Lc Slab length or spacing b/w contraction joints
γc Unit weight of concrete
f Coefficient of subgrade restraint (max 1.5)
If Reinforcement is provided, replace LHS by σts As
Maximum Spacing between contraction joints
for unreinforced slabs
4.5 m – all slab thicknesses
for reinforced slabs
13 m – for 150 mm thick slab
14 m – for 200 mm thick slab
Design Data Hand Book
Department of Civil Engineering 34
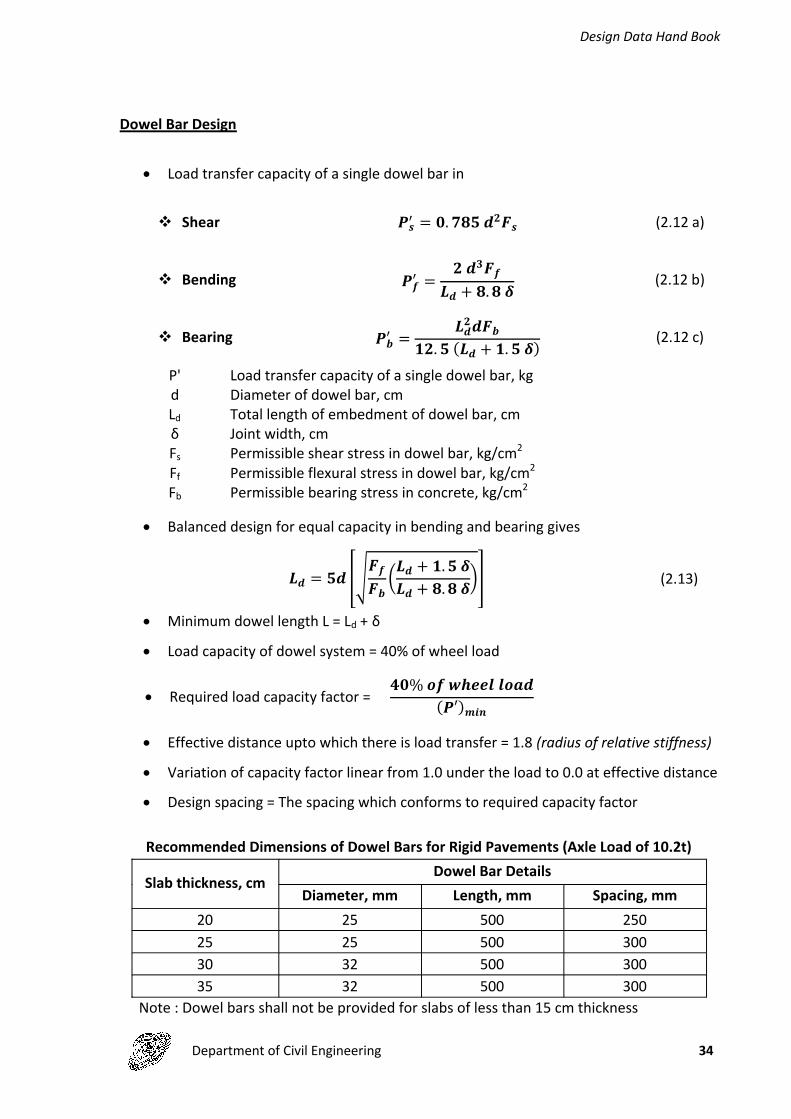
Dowel Bar Design
Load transfer capacity of a single dowel bar in
Shear ��� = �. ������� (2.12 a)
Bending ��� = �����
�� + �.�� (2.12 b)
Bearing ��� = ��
������. �(�� + �. ��) (2.12 c)
P' Load transfer capacity of a single dowel bar, kgd Diameter of dowel bar, cmLd Total length of embedment of dowel bar, cmδ Joint width, cmFs Permissible shear stress in dowel bar, kg/cm2
Ff Permissible flexural stress in dowel bar, kg/cm2
Fb Permissible bearing stress in concrete, kg/cm2
Balanced design for equal capacity in bending and bearing gives
�� = �� ������
��� + �.���� + �.���� (2.13)
Minimum dowel length L = Ld + δ
Load capacity of dowel system = 40% of wheel load
Required load capacity factor = ��%�����������
(�′)���
Effective distance upto which there is load transfer = 1.8 (radius of relative stiffness)
Variation of capacity factor linear from 1.0 under the load to 0.0 at effective distance
Design spacing = The spacing which conforms to required capacity factor
Recommended Dimensions of Dowel Bars for Rigid Pavements (Axle Load of 10.2t)
Slab thickness, cmDowel Bar Details
Diameter, mm Length, mm Spacing, mm20 25 500 25025 25 500 30030 32 500 30035 32 500 300
Note : Dowel bars shall not be provided for slabs of less than 15 cm thickness

Design Data Hand Book
Department of Civil Engineering 35
Tie Bar Design
Area of steel per unit length of joint is obtained by equating the total friction to the total tension developed in the tie bars
����� = ����� (2.14)
Length of embedment required to develop a bond strength equal to working stress of steel
����� =��� ���� or �� =
�� ���
���(2.15)
σts Allowable tensile stress in steel = 1400 kg/cm2
As Area of tie barB distance b/w the joint and nearest free edgeh Slab thicknessγc Unit weight of concretef Coefficient of subgrade restraint (max 1.5)Lt Length of tie barP Perimeter of tie bard Diameter of tie bar
σbc Allowable bond stress in concrete = 24.6 kg/cm2 for deformed tie bars= 17.5 kg/cm2 for plain tie bars
Details of Tie Bars for Longitudinal Joint of Two-Lane Rigid Pavements
Slab Thickness
cm
Tie bar details, cm
Diametermm
Max. spacing, cm Minimum Length, cmPlainbars
Deformed bars
Plainbars
Deformed bars
15 8 33 53 44 4810 52 83 51 56
2010 39 62 51 5612 56 90 58 64
2512 45 72 58 6416 80 128 72 80
3012 37 60 58 6416 66 106 72 80
35 12 32 51 57 6416 57 91 72 80
Note: The recommended details are based on the following values of design parameters
σts Allowable tensile stress in steel = 2000 kg/cm2 for deformed bars= 1250 kg/cm2 for plain bars
σbc Allowable bond stress in concrete = 24.6 kg/cm2 for deformed bars= 17.5 kg/cm2 for plain bars
Design Data Hand Book
Department of Civil Engineering 36
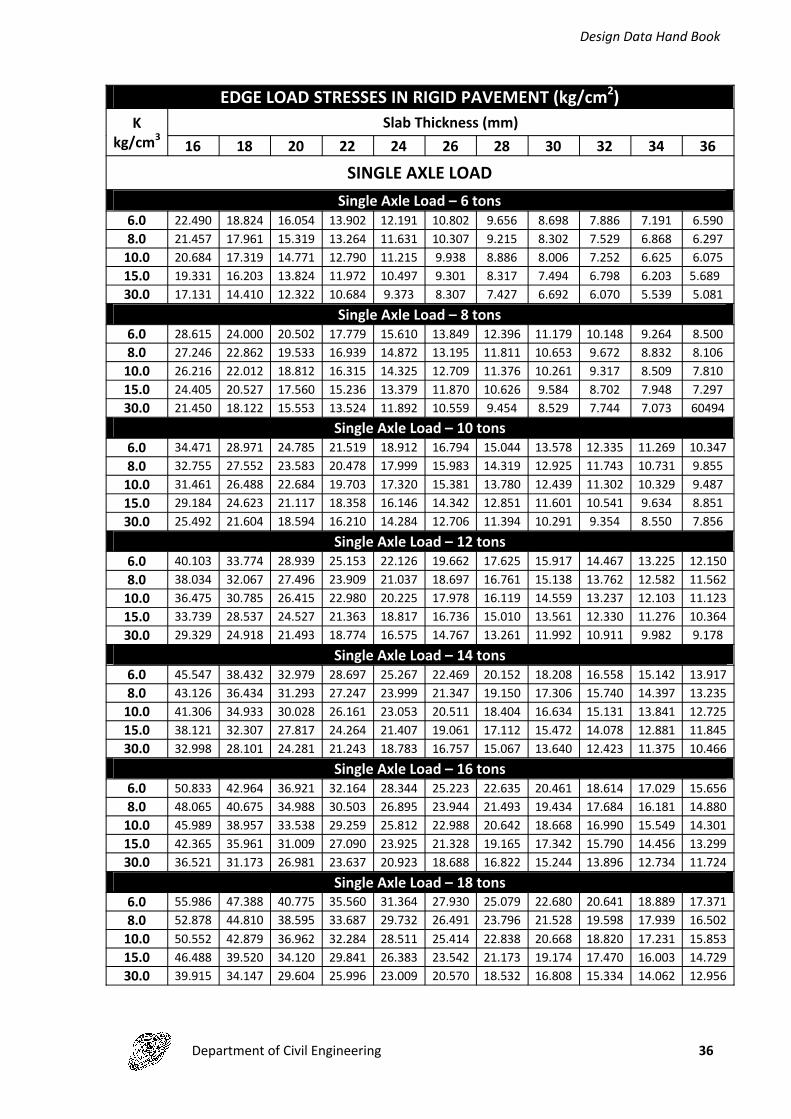
EDGE LOAD STRESSES IN RIGID PAVEMENT (kg/cm2)K
kg/cm3Slab Thickness (mm)
16 18 20 22 24 26 28 30 32 34 36
SINGLE AXLE LOADSingle Axle Load – 6 tons
6.0 22.490 18.824 16.054 13.902 12.191 10.802 9.656 8.698 7.886 7.191 6.5908.0 21.457 17.961 15.319 13.264 11.631 10.307 9.215 8.302 7.529 6.868 6.297
10.0 20.684 17.319 14.771 12.790 11.215 9.938 8.886 8.006 7.252 6.625 6.07515.0 19.331 16.203 13.824 11.972 10.497 9.301 8.317 7.494 6.798 6.203 5.68930.0 17.131 14.410 12.322 10.684 9.373 8.307 7.427 6.692 6.070 5.539 5.081
Single Axle Load – 8 tons6.0 28.615 24.000 20.502 17.779 15.610 13.849 12.396 11.179 10.148 9.264 8.5008.0 27.246 22.862 19.533 16.939 14.872 13.195 11.811 10.653 9.672 8.832 8.106
10.0 26.216 22.012 18.812 16.315 14.325 12.709 11.376 10.261 9.317 8.509 7.81015.0 24.405 20.527 17.560 15.236 13.379 11.870 10.626 9.584 8.702 7.948 7.29730.0 21.450 18.122 15.553 13.524 11.892 10.559 9.454 8.529 7.744 7.073 60494
Single Axle Load – 10 tons6.0 34.471 28.971 24.785 21.519 18.912 16.794 15.044 13.578 12.335 11.269 10.3478.0 32.755 27.552 23.583 20.478 17.999 15.983 14.319 12.925 11.743 10.731 9.855
10.0 31.461 26.488 22.684 19.703 17.320 15.381 13.780 12.439 11.302 10.329 9.48715.0 29.184 24.623 21.117 18.358 16.146 14.342 12.851 11.601 10.541 9.634 8.85130.0 25.492 21.604 18.594 16.210 14.284 12.706 11.394 10.291 9.354 8.550 7.856
Single Axle Load – 12 tons6.0 40.103 33.774 28.939 25.153 22.126 19.662 17.625 15.917 14.467 13.225 12.1508.0 38.034 32.067 27.496 23.909 21.037 18.697 16.761 15.138 13.762 12.582 11.562
10.0 36.475 30.785 26.415 22.980 20.225 17.978 16.119 14.559 13.237 12.103 11.12315.0 33.739 28.537 24.527 21.363 18.817 16.736 15.010 13.561 12.330 11.276 10.36430.0 29.329 24.918 21.493 18.774 16.575 14.767 13.261 11.992 10.911 9.982 9.178
Single Axle Load – 14 tons6.0 45.547 38.432 32.979 28.697 25.267 22.469 20.152 18.208 16.558 15.142 13.9178.0 43.126 36.434 31.293 27.247 23.999 21.347 19.150 17.306 15.740 14.397 13.235
10.0 41.306 34.933 30.028 26.161 23.053 20.511 18.404 16.634 15.131 13.841 12.72515.0 38.121 32.307 27.817 24.264 21.407 19.061 17.112 15.472 14.078 12.881 11.84530.0 32.998 28.101 24.281 21.243 18.783 16.757 15.067 13.640 12.423 11.375 10.466
Single Axle Load – 16 tons6.0 50.833 42.964 36.921 32.164 28.344 25.223 22.635 20.461 18.614 17.029 15.6568.0 48.065 40.675 34.988 30.503 26.895 23.944 21.493 19.434 17.684 16.181 14.880
10.0 45.989 38.957 33.538 29.259 25.812 22.988 20.642 18.668 16.990 15.549 14.30115.0 42.365 35.961 31.009 27.090 23.925 21.328 19.165 17.342 15.790 14.456 13.29930.0 36.521 31.173 26.981 23.637 20.923 18.688 16.822 15.244 13.896 12.734 11.724
Single Axle Load – 18 tons6.0 55.986 47.388 40.775 35.560 31.364 27.930 25.079 22.680 20.641 18.889 17.3718.0 52.878 44.810 38.595 33.687 29.732 26.491 23.796 21.528 19.598 17.939 16.502
10.0 50.552 42.879 36.962 32.284 28.511 25.414 22.838 20.668 18.820 17.231 15.85315.0 46.488 39.520 34.120 29.841 26.383 23.542 21.173 19.174 17.470 16.003 14.72930.0 39.915 34.147 29.604 25.996 23.009 20.570 18.532 16.808 15.334 14.062 12.956
Design Data Hand Book
Department of Civil Engineering 37
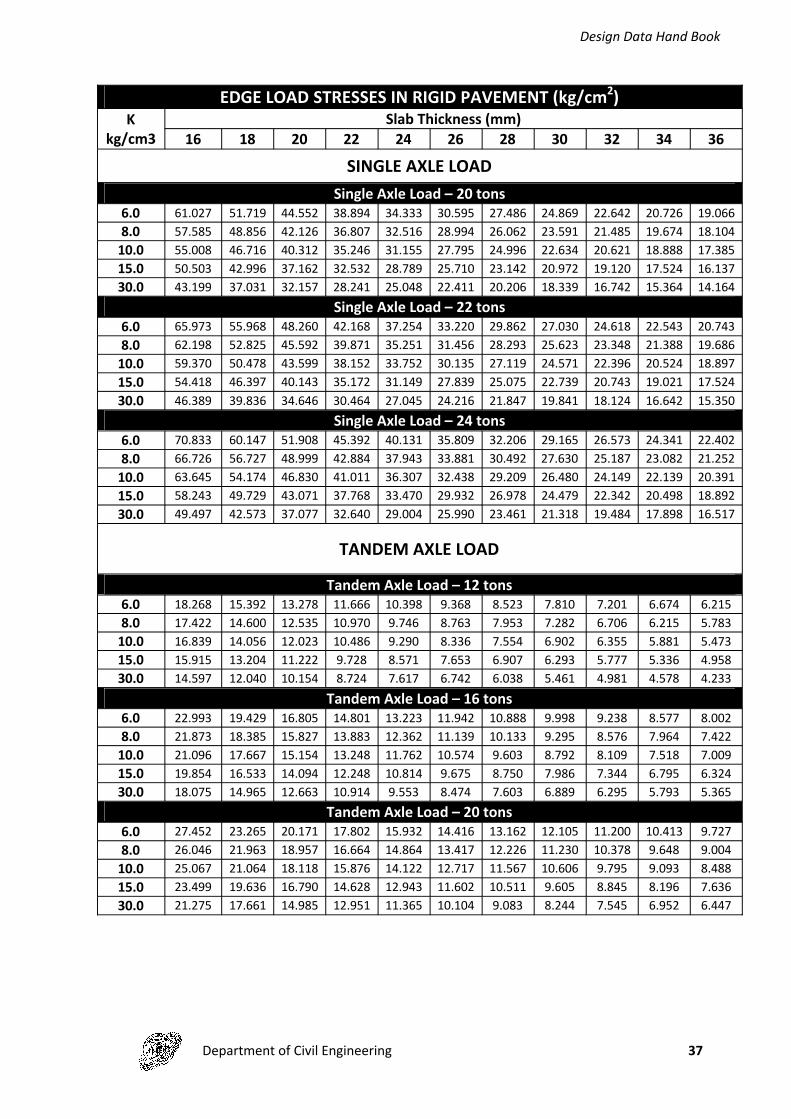
EDGE LOAD STRESSES IN RIGID PAVEMENT (kg/cm2)K
kg/cm3Slab Thickness (mm)
16 18 20 22 24 26 28 30 32 34 36
SINGLE AXLE LOADSingle Axle Load – 20 tons
6.0 61.027 51.719 44.552 38.894 34.333 30.595 27.486 24.869 22.642 20.726 19.0668.0 57.585 48.856 42.126 36.807 32.516 28.994 26.062 23.591 21.485 19.674 18.104
10.0 55.008 46.716 40.312 35.246 31.155 27.795 24.996 22.634 20.621 18.888 17.38515.0 50.503 42.996 37.162 32.532 28.789 25.710 23.142 20.972 19.120 17.524 16.13730.0 43.199 37.031 32.157 28.241 25.048 22.411 20.206 18.339 16.742 15.364 14.164
Single Axle Load – 22 tons6.0 65.973 55.968 48.260 42.168 37.254 33.220 29.862 27.030 24.618 22.543 20.7438.0 62.198 52.825 45.592 39.871 35.251 31.456 28.293 25.623 23.348 21.388 19.686
10.0 59.370 50.478 43.599 38.152 33.752 30.135 27.119 24.571 22.396 20.524 18.89715.0 54.418 46.397 40.143 35.172 31.149 27.839 25.075 22.739 20.743 19.021 17.52430.0 46.389 39.836 34.646 30.464 27.045 24.216 21.847 19.841 18.124 16.642 15.350
Single Axle Load – 24 tons6.0 70.833 60.147 51.908 45.392 40.131 35.809 32.206 29.165 26.573 24.341 22.4028.0 66.726 56.727 48.999 42.884 37.943 33.881 30.492 27.630 25.187 23.082 21.252
10.0 63.645 54.174 46.830 41.011 36.307 32.438 29.209 26.480 24.149 22.139 20.39115.0 58.243 49.729 43.071 37.768 33.470 29.932 26.978 24.479 22.342 20.498 18.89230.0 49.497 42.573 37.077 32.640 29.004 25.990 23.461 21.318 19.484 17.898 16.517
TANDEM AXLE LOAD
Tandem Axle Load – 12 tons6.0 18.268 15.392 13.278 11.666 10.398 9.368 8.523 7.810 7.201 6.674 6.2158.0 17.422 14.600 12.535 10.970 9.746 8.763 7.953 7.282 6.706 6.215 5.783
10.0 16.839 14.056 12.023 10.486 9.290 8.336 7.554 6.902 6.355 5.881 5.47315.0 15.915 13.204 11.222 9.728 8.571 7.653 6.907 6.293 5.777 5.336 4.95830.0 14.597 12.040 10.154 8.724 7.617 6.742 6.038 5.461 4.981 4.578 4.233
Tandem Axle Load – 16 tons6.0 22.993 19.429 16.805 14.801 13.223 11.942 10.888 9.998 9.238 8.577 8.0028.0 21.873 18.385 15.827 13.883 12.362 11.139 10.133 9.295 8.576 7.964 7.422
10.0 21.096 17.667 15.154 13.248 11.762 10.574 9.603 8.792 8.109 7.518 7.00915.0 19.854 16.533 14.094 12.248 10.814 9.675 8.750 7.986 7.344 6.795 6.32430.0 18.075 14.965 12.663 10.914 9.553 8.474 7.603 6.889 6.295 5.793 5.365
Tandem Axle Load – 20 tons6.0 27.452 23.265 20.171 17.802 15.932 14.416 13.162 12.105 11.200 10.413 9.7278.0 26.046 21.963 18.957 16.664 14.864 13.417 12.226 11.230 10.378 9.648 9.004
10.0 25.067 21.064 18.118 15.876 14.122 12.717 11.567 10.606 9.795 9.093 8.48815.0 23.499 19.636 16.790 14.628 12.943 11.602 10.511 9.605 8.845 8.196 7.63630.0 21.275 17.661 14.985 12.951 11.365 10.104 9.083 8.244 7.545 6.952 6.447
Design Data Hand Book
Department of Civil Engineering 38
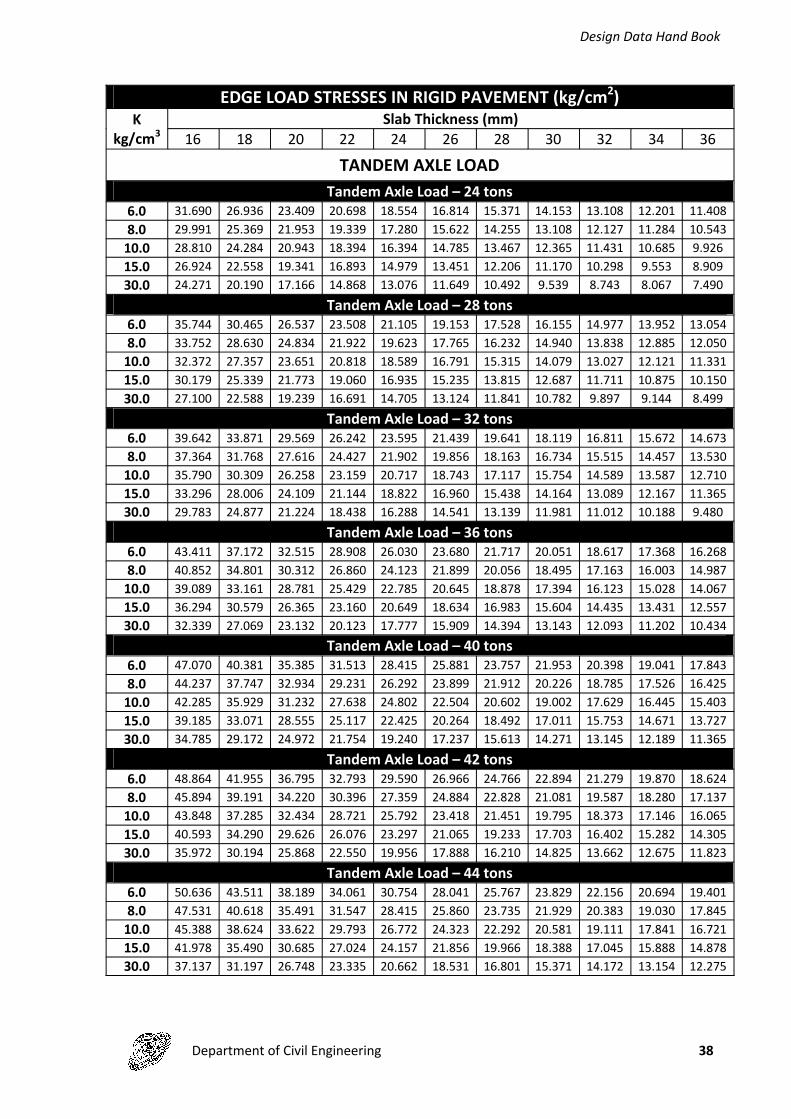
EDGE LOAD STRESSES IN RIGID PAVEMENT (kg/cm2)K
kg/cm3Slab Thickness (mm)
16 18 20 22 24 26 28 30 32 34 36
TANDEM AXLE LOADTandem Axle Load – 24 tons
6.0 31.690 26.936 23.409 20.698 18.554 16.814 15.371 14.153 13.108 12.201 11.4088.0 29.991 25.369 21.953 19.339 17.280 15.622 14.255 13.108 12.127 11.284 10.543
10.0 28.810 24.284 20.943 18.394 16.394 14.785 13.467 12.365 11.431 10.685 9.92615.0 26.924 22.558 19.341 16.893 14.979 13.451 12.206 11.170 10.298 9.553 8.90930.0 24.271 20.190 17.166 14.868 13.076 11.649 10.492 9.539 8.743 8.067 7.490
Tandem Axle Load – 28 tons6.0 35.744 30.465 26.537 23.508 21.105 19.153 17.528 16.155 14.977 13.952 13.0548.0 33.752 28.630 24.834 21.922 19.623 17.765 16.232 14.940 13.838 12.885 12.050
10.0 32.372 27.357 23.651 20.818 18.589 16.791 15.315 14.079 13.027 12.121 11.33115.0 30.179 25.339 21.773 19.060 16.935 15.235 13.815 12.687 11.711 10.875 10.15030.0 27.100 22.588 19.239 16.691 14.705 13.124 11.841 10.782 9.897 9.144 8.499
Tandem Axle Load – 32 tons6.0 39.642 33.871 29.569 26.242 23.595 21.439 19.641 18.119 16.811 15.672 14.6738.0 37.364 31.768 27.616 24.427 21.902 19.856 18.163 16.734 15.515 14.457 13.530
10.0 35.790 30.309 26.258 23.159 20.717 18.743 17.117 15.754 14.589 13.587 12.71015.0 33.296 28.006 24.109 21.144 18.822 16.960 15.438 14.164 13.089 12.167 11.36530.0 29.783 24.877 21.224 18.438 16.288 14.541 13.139 11.981 11.012 10.188 9.480
Tandem Axle Load – 36 tons6.0 43.411 37.172 32.515 28.908 26.030 23.680 21.717 20.051 18.617 17.368 16.2688.0 40.852 34.801 30.312 26.860 24.123 21.899 20.056 18.495 17.163 16.003 14.987
10.0 39.089 33.161 28.781 25.429 22.785 20.645 18.878 17.394 16.123 15.028 14.06715.0 36.294 30.579 26.365 23.160 20.649 18.634 16.983 15.604 14.435 13.431 12.55730.0 32.339 27.069 23.132 20.123 17.777 15.909 14.394 13.143 12.093 11.202 10.434
Tandem Axle Load – 40 tons6.0 47.070 40.381 35.385 31.513 28.415 25.881 23.757 21.953 20.398 19.041 17.8438.0 44.237 37.747 32.934 29.231 26.292 23.899 21.912 20.226 18.785 17.526 16.425
10.0 42.285 35.929 31.232 27.638 24.802 22.504 20.602 19.002 17.629 16.445 15.40315.0 39.185 33.071 28.555 25.117 22.425 20.264 18.492 17.011 15.753 14.671 13.72730.0 34.785 29.172 24.972 21.754 19.240 17.237 15.613 14.271 13.145 12.189 11.365
Tandem Axle Load – 42 tons6.0 48.864 41.955 36.795 32.793 29.590 26.966 24.766 22.894 21.279 19.870 18.6248.0 45.894 39.191 34.220 30.396 27.359 24.884 22.828 21.081 19.587 18.280 17.137
10.0 43.848 37.285 32.434 28.721 25.792 23.418 21.451 19.795 18.373 17.146 16.06515.0 40.593 34.290 29.626 26.076 23.297 21.065 19.233 17.703 16.402 15.282 14.30530.0 35.972 30.194 25.868 22.550 19.956 17.888 16.210 14.825 13.662 12.675 11.823
Tandem Axle Load – 44 tons6.0 50.636 43.511 38.189 34.061 30.754 28.041 25.767 23.829 22.156 20.694 19.4018.0 47.531 40.618 35.491 31.547 28.415 25.860 23.735 21.929 20.383 19.030 17.845
10.0 45.388 38.624 33.622 29.793 26.772 24.323 22.292 20.581 19.111 17.841 16.72115.0 41.978 35.490 30.685 27.024 24.157 21.856 19.966 18.388 17.045 15.888 14.87830.0 37.137 31.197 26.748 23.335 20.662 18.531 16.801 15.371 14.172 13.154 12.275
Design Data Hand Book
Department of Civil Engineering 39
RReeffeerreenncceess
IRC : 37 – 2001 “Guidelines for the Design of Flexible Pavements”, Second Revision, Indian Roads Congress
IRC : 58 – 2002 “Guidelines for the Design of Plain Jointed Rigid Pavements for Highways”, Second Revision, Indian Roads Congress
Papagiannakis A T and Masad E A (2008) “Pavement Design and Materials” John Wiley and Sons
Rajib B. Mallick and Tahar El-Korchi (2009) “Pavement Engineering – Principles and Practice”, CRC Press, Taylor & Francis Group
Yang H Huang (2004) “Pavement Analysis and Design”, 2nd edition, Prentice Hall
Yoder and Witzack (1975) “Principles of Pavement Design”, 2nd edition, John Wileys and Sons