oregon traffic safety performance plan › nhtsa › whatsup › safeteaweb › fy09 › fy... ·...
TRANSCRIPT
� T R A N S P O R T A T I O N S A F E T Y D I V I S I O N �
OREGON TRAFFIC SAFETY
PERFORMANCE PLAN
Fiscal Year 2009
Federal Version
� O R E G O N D E P A R T M E N T O F T R A N S P O R T A T I O N �

OREGON
TRAFFIC SAFETY
PERFORMANCE PLAN
Fiscal Year 2009
FEDERAL VERSION
Produced: July, 2008
Transportation Safety Division Oregon Department of Transportation
235 Union Street NESalem, Oregon 97301-1054


Table of Contents
Foreword .............................................................................................................................................. iDocument Purpose............................................................................................................................. iiProcess Description .......................................................................................................................... iiiOverview of Highway Safety Planning Process ................................................................................ iv
Performance Goals............................................................................................................................. v
Acronyms and Definitions .................................................................................................................viiProgram Area
Statewide ..................................................................................................................................1
Bicyclist Safety..........................................................................................................................5
Community Traffic Safety .........................................................................................................7
Driver Education .................................................................................................................... 11
Emergency Medical Services (EMS) ..................................................................................... 15
Equipment Safety Standards................................................................................................ 17
Highway Safety Investment Program (HSIP) ........................................................................ 19
Impaired Driving – Alcohol .................................................................................................... 23
Impaired Driving – Drugs ...................................................................................................... 27
Judicial Outreach ................................................................................................................... 31
Motorcycle Safety .................................................................................................................. 33
Occupant Protection.............................................................................................................. 37
Pedestrian Safety .................................................................................................................. 41
Police Traffic Services ........................................................................................................... 45
Region 1 ................................................................................................................................. 49
Region 2 ................................................................................................................................. 53
Region 3 ................................................................................................................................. 57
Region 4 ................................................................................................................................. 61
Region 5 ................................................................................................................................. 65
Roadway Safety ..................................................................................................................... 69
Safe Routes to School........................................................................................................... 73
Speed ..................................................................................................................................... 77
Traffic Records....................................................................................................................... 81
Work Zone Safety .................................................................................................................. 85
Youth Transportation Safety (0-14)...................................................................................... 89
Youth Transportation Safety (15-20) ................................................................................... 91
USDOT Funds Allocated to Highway Safety ................................................................................... 95
2009 Anticipated Revenues Summary.......................................................................................... 97
2009 Anticipated Revenues by Program Area .............................................................................. 98
Project Funding Narratives ............................................................................................................. 99
Highway Safety Program Cost Summary ..................................................................................... 117
Highway Safety Plan...................................................................................................................... 119
State Certifications and Assurances............................................................................................ 121


Foreword
This report has been prepared to satisfy federal reporting and provide documentation for the 2009 federal grant year.
The 2009 Performance Plan will be approved by the Oregon Transportation Safety Committee (OTSC) on July 15, 2008 and subsequent approval by the Oregon Transportation Commission (OTC) will be requested on August 20, 2008. The majority of the projects will occur from October 2008 through September 2009.
The process for identification of problems, establishing performance goals, developing programs and projects is detailed on page iii. A detailed flow chart of the grant program planning process is offered on page iv, Overview of Highway Safety Planning Process.
Each program area page consists of five different parts.
1. A link to the Transportation Safety Action Plan which shows how we are addressing the long range strategies for Oregon.
2. Problem statements are presented for each topical area.
3. Data tables have been updated to reflect the latest information available and provide previous years’ averages where possible.
4. Goal statements are aimed at 2015 and performance measures for 2009.
5. Project summaries are listed by individual project, by funding source, at the end of the document. The amounts provided are federal dollars, unless in brackets, which denotes state/other funding sources.
Throughout the 2009 fiscal year the following funds are expected (financial figures represent the latest grant and match revenues available through June 30, 2008):
Federal funds: $51,922,128 State/local match: [$7,224,000] Grand Total $59,146,128
Copies of this report are available and may be requested by contacting the Transportation Safety Division at (503) 986-4190 or (800) 922-2022.
i
Document Purpose
The purpose of this document is to show the effectiveness of the broad collaboration that takes place in Oregon’s highway safety community. We are also able to show the significant impact our funds, time, and programs are having on the safety of the traveling public.
The plan represents a one-year look at the 2009 program including all of the funds controlled by the Transportation Safety Division. In addition, every year an Annual Evaluation report is completed that explains what funds were spent and how we fared on our annual performance measures.
We are looking forward to a successful 2009 program where many injuries are avoided and the fatality toll is dramatically reduced.
ii
Process Description Below is a summary of the process currently followed by the Transportation Safety Division (TSD) to plan and implement its grant program. The program is based on a complete and detailed problem analysis prior to the selection of projects. A broad spectrum of agencies at state and local levels and special interest groups are involved in project selection and implementation. In addition, grants are awarded to TSD so we can, in turn, award contracts to private agencies or manage multiple mini-grants. Self-awarded TSD grants help us supplement our basic program to provide more effective statewide services involving a variety of agencies and groups working with traffic safety programs that are not eligible for direct grants.
Process for Identifying Problems Problem analysis is completed by Transportation Safety Division staff, the Oregon Transportation Safety Committee (OTSC), and involved agencies and groups. A state-level analysis is completed, using the most recent data available (currently 2007 data), to certify that Oregon has the potential to fund projects in various program areas. Motor vehicle crash data, survey results (belt use, helmet use, public perception), and other data on traffic safety problems are analyzed. State and local agencies are asked to respond to surveys throughout the year to help identify problems. Program level analysis is included with each of the National Highway Traffic Safety Administration (NHTSA) and Federal Highway Administration (FHWA) priority areas such as impaired driving, safety belts, and police traffic services. This data is directly linked to performance goals and proposed projects for the coming year, and is included in project objectives. Not all of the reviewed data is published in the Performance Plan.
Process for Establishing Performance Goals Performance goals for each program are established by TSD staff, taking into consideration data sources that are reliable, readily available, and reasonable as representing outcomes of the program. Performance measures incorporate elements of the Oregon Benchmarks, Oregon Transportation Safety Action Plan, the Safety Management System, and nationally recognized measures. Both long-range (by the year 2015) and short-range (current year) measures are utilized and updated annually.
Process for Developing Programs and Projects Programs and projects are designed to impact problems that are identified through the problem identification process described above. Program development and project selection begin with program specific planning meetings that involve professionals who work in various aspects of the specific program. A series of public meetings are held around the state to obtain the input of the general public (types of projects to be funded are selected based on problem identification). Specific geographic areas are chosen from among these jurisdictions determined to have a significant problem based on jurisdictional problem analysis. Project selection begins with proposed projects requested from eligible state and local public agencies and non-profit groups involved in traffic safety. Selection panels may be used to complement TSD staff work in order to identify the best projects for the coming year. Past panels have been comprised of OTSC members, the Oregon Transportation Commission, statewide associations, and other traffic safety professionals. Projects are selected using criteria that includes: response to identified problems, potential for impacting performance goals, innovation, clear objectives, adequate evaluation plans, and cost effective budgets. Those projects ranked the highest are included in Oregon’s funding plan.
The flow chart on the following page presents the grant program planning process in detail.
iii
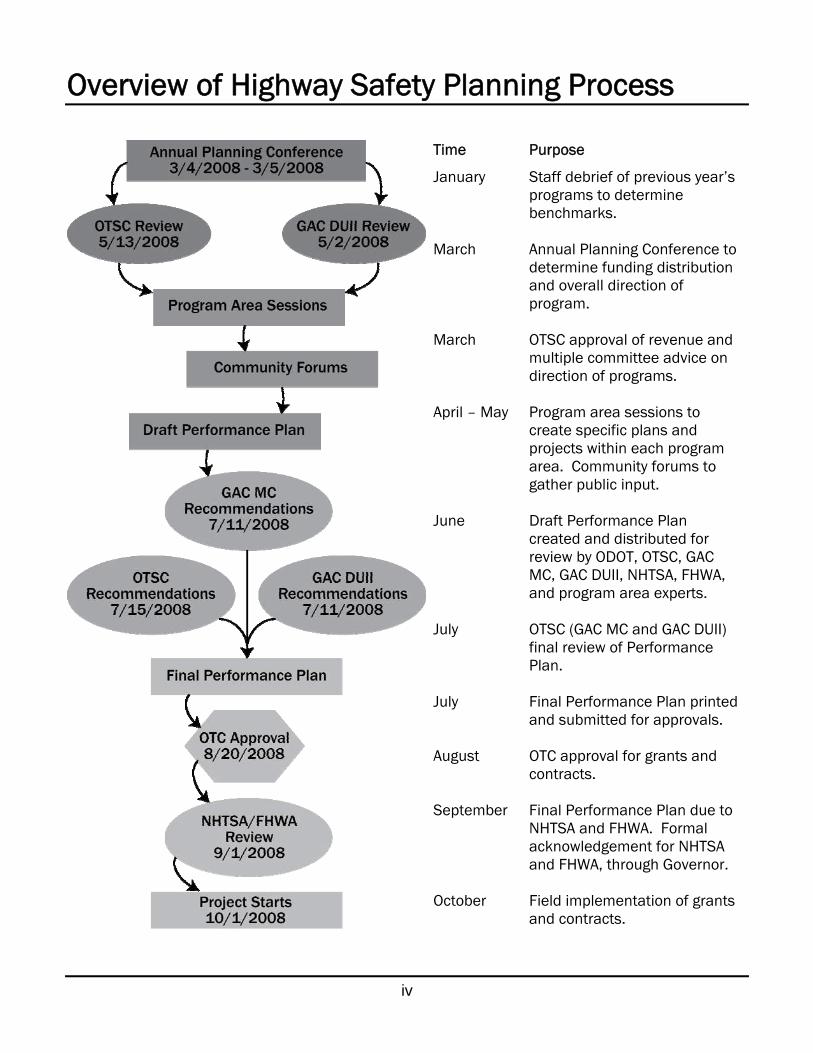
Overview of Highway Safety Planning Process
Time Purpose
January Staff debrief of previous year’s programs to determine benchmarks.
March Annual Planning Conference to determine funding distribution and overall direction of program.
March OTSC approval of revenue and multiple committee advice on direction of programs.
April – May Program area sessions to create specific plans and projects within each program area. Community forums to gather public input.
June Draft Performance Plan created and distributed for review by ODOT, OTSC, GAC MC, GAC DUII, NHTSA, FHWA, and program area experts.
July OTSC (GAC MC and GAC DUII) final review of Performance Plan.
July Final Performance Plan printed and submitted for approvals.
August OTC approval for grants and contracts.
September Final Performance Plan due to NHTSA and FHWA. Formal acknowledgement for NHTSA and FHWA, through Governor.
October Field implementation of grants and contracts.
iv

Performance Goals
This report highlights traffic safety activities during the upcoming federal fiscal year 2009. The data contained in this report reflects the most current available. Due to the time frame within which statewide records are compiled, transportation statistics for 2007 were not always available.
v

vi

Acronyms and Definitions
AASHTO American Association of State Highway and Transportation Officials ACTS Alliance for Community Traffic Safety AGC Associated General Contractors ARIDE Advanced Roadside Impaired Driving Enforcement ATV All Terrain Vehicles BAC Blood Alcohol Content CFAA Criminal Fine and Assessment Account CTSP Community Traffic Safety Program DHS Oregon Department of Human Services DMV Driver and Motor Vehicle Services, Oregon Department of Transportation DPSST Department of Public Safety Standards and Training DRE Drug Recognition Expert DUII Driving Under the Influence of Intoxicants (sometimes DUI is used) EMS Emergency Medical Services F & I Fatal and injury crashes FARS Fatal Analysis Reporting System, U.S. Department of Transportation FHWA Federal Highway Administration FMCSA Federal Motor Carrier Safety Administration GR Governor’s Representative GAC-DUII Governor’s Advisory Committee on DUII GAC-Motorcycle Governor’s Advisory Committee on Motorcycle Safety GHSA Governor’s Highway Safety Association HSP Highway Safety Plan, the grant application submitted for federal section 402 and
similar funds. Funds are provided by the National Highway Traffic Safety Administration and the Federal Highway Administration.
IACP International Association of Chiefs of Police ICS Incident Command System IRIS Integrated Road Information System ISTEA The federal Intermodal Surface Transportation Efficiency Act of 1991 that funds
the national highway system and gives state and local governments more flexibility in determining transportation solutions. It requires states and MPOs to cooperate in long-range planning. It requires states to develop six management systems, one of which is the Highway Safety Management System (SMS).
LCDC Land Conservation and Development Commission MADD Mothers Against Drunk Driving MPO Metropolitan Planning Organization. MPOs are designated by the governor to
coordinate transportation planning in an urbanized area of the state. MPOs exist in the Portland, Salem, Eugene-Springfield, and Medford areas.
NHTSA National Highway Traffic Safety Administration OACP Oregon Association Chiefs of Police OBDU Oregon Bridge Delivery Unit OBDP Oregon Bridge Development Partners OBM Oregon Benchmark ODAA Oregon District Attorneys Association ODE Oregon Department of Education ODOT Oregon Department of Transportation
vii
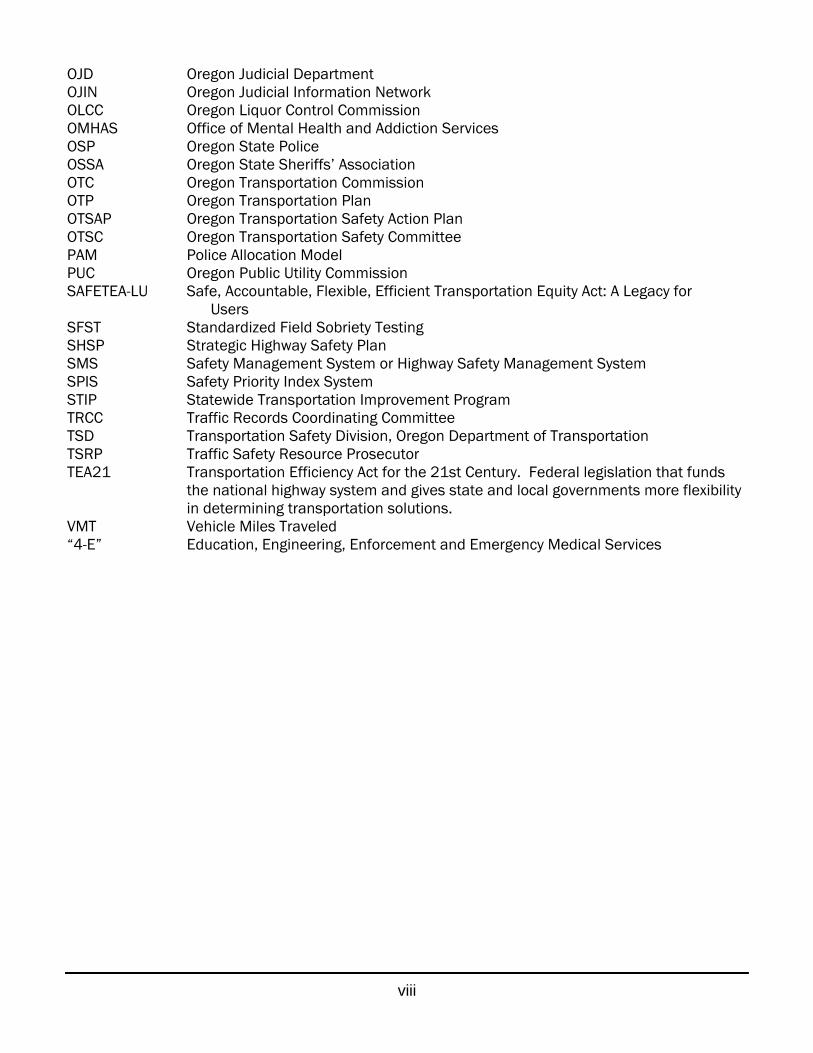
OJD Oregon Judicial Department OJIN Oregon Judicial Information Network OLCC Oregon Liquor Control Commission OMHAS Office of Mental Health and Addiction Services OSP Oregon State Police OSSA Oregon State Sheriffs’ Association OTC Oregon Transportation Commission OTP Oregon Transportation Plan OTSAP Oregon Transportation Safety Action Plan OTSC Oregon Transportation Safety Committee PAM Police Allocation Model PUC Oregon Public Utility Commission SAFETEA-LU Safe, Accountable, Flexible, Efficient Transportation Equity Act: A Legacy for
Users SFST Standardized Field Sobriety Testing SHSP Strategic Highway Safety Plan SMS Safety Management System or Highway Safety Management System SPIS Safety Priority Index System STIP Statewide Transportation Improvement Program TRCC Traffic Records Coordinating Committee TSD Transportation Safety Division, Oregon Department of Transportation TSRP Traffic Safety Resource Prosecutor TEA21 Transportation Efficiency Act for the 21st Century. Federal legislation that funds
the national highway system and gives state and local governments more flexibility in determining transportation solutions.
VMT Vehicle Miles Traveled “4-E” Education, Engineering, Enforcement and Emergency Medical Services
viii

Statewide
Link to the Transportation Safety Action Plan: Action #14, 16
Action #14 Continue efforts to maintain the Transportation Safety Division, Oregon Department of Transportation, as the Transportation Safety Resource Center for Oregon, and actively encourage greater use of public information materials and research reports by local agencies.
Action #16 Advocate modifying federal standards and guidelines to continuously improve the ability of the Oregon Department of Transportation to allocate resources to the highest priority safety needs.
The Problem
• In 2007, 455 people were killed and 27,850 were injured in traffic crashes in Oregon.
• In 2006, the VMT increased approximately 0.6 percent compared to 2005.
• In 2007, 29 percent of Oregon’s citizens do not believe the transportation system is safe or as safe as the prior year, one of the smallest percentage ever received for this question.
Oregon Traffic Crash Data and Measures of Exposure, 2004 – 2007 1999-2003 % Change
Average 2004 2005 2006 2007 2004-2007 Total Crashes 48,708 41,440 44,881 45,072 44,163 6.6% Fatal Crashes 403 388 443 418 411 5.9% Injury Crashes 18,553 18,279 19,447 19,778 18,501 1.2% Property Damage Crashes 29,751 22,773 24,991 24,876 25,251 10.9%
Fatalities 460 456 487 478 455 -0.2% Fatalities per 100 Million VMT 1.32 1.28 1.38 1.35 1.31 2.4% Fatalities per Population (in thousands) 0.13 0.13 0.13 0.13 0.12 -4.6% Injuries 27,853 27,346 29,023 29,597 27,850 1.8% Injuries per 100 Million VMT 80.11 76.82 82.26 83.42 80.26 4.5% Injuries per Population (in thousands) 8.08 7.63 7.99 8.02 7.44 -2.6%
Population (in thousands) 3,451 3,583 3,631 3,691 3,745 4.5% Vehicle Miles Traveled (in millions) 34,768 35,598 35,282 35,482 34,700 -2.5% No. Licensed Drivers (in thousands) 2,764 2,911 2,955 3,031 3,167 8.8% No. Registered Vehicles (in thousands) 3,807 3,986 4,005 4,063 4,153 4.2%
% Who Think Transportation System is as Safe or Safer than Last Year 70.6% 75.0% 72.0% 69.0% 71.0% -5.3%
Sources: Crash Analysis and Reporting, Oregon Department of Transportation Fatality Analysis Reporting System, U.S. Department of Transportation
Federal Highway Administration Center for Population Research and Census, School of Urban and Public Affairs, Portland State University Public Opinion Survey, Executive Summary; Intercept Research Corporation
1

Fatal and Injury Crash Involvement by Age of Driver, 2007 # of Drivers in % of Total # of Licensed % of Total Over/Under
Age of Driver F&I Crashes F&I Crashes Drivers Drivers Representation* 14 & Younger 4 0.01% N/A 0.00% 0.00 15 46 0.13% 14,322 0.46% 0.29 16 621 1.80% 27,278 0.88% 2.03 17 960 2.78% 35,176 1.14% 2.43 18 1,114 3.22% 40,103 1.30% 2.48 19 1,026 2.97% 43,673 1.42% 2.09 20 1,004 2.90% 45,931 1.49% 1.95 21 925 2.68% 49,437 1.60% 1.67 22-24 2,456 7.10% 165,673 5.37% 1.32 25-34 6,680 19.32% 603,028 19.56% 0.99 35-44 5,820 16.83% 553,344 17.95% 0.94 45-54 5,768 16.68% 569,218 18.46% 0.90 55-64 4,026 11.64% 478,835 15.53% 0.75 65-74 1,799 5.20% 259,668 8.42% 0.62 75 & Older 1,197 3.46% 197,511 6.41% 0.54 Unknown 1,132 3.27% 19 0.00% 0.00 Total 34,578 100.00% 3,083,216 100.00%
*Representation is percent of fatal and injury crashes divided by percent of licensed drivers. Sources: Crash Analysis and Reporting, Oregon Department of Transportation
Fatality Analysis Reporting System, U.S. Department of Transportation Driver and Motor Vehicle Services, Oregon Department of Transportation
Goal
• Reduce the traffic fatality rate to 0.85 per hundred million vehicle miles traveled, 333 fatalities, by 2015.
Performance Measures
• Reduce the fatality rate of 1.31 per hundred million vehicle miles traveled, the 2007 level, to 1.23 per hundred million vehicles miles traveled, 436 fatalities, through December 31, 2009.
• Reduce the traffic injury rate of 80.26 per hundred million miles traveled, the 2007 level, to 76.0 per hundred million vehicle miles traveled, 23,182 injuries, through December 31, 2009.
Strategies
• A comprehensive traffic safety public information and education program that is designed to impact a change in the public’s behavior concerning the issues of safe driving, DUII, safety belts, child safety seats, speed, motorcycle safety, bicycle safety, equipment standards, driver education and traffic laws.
• An annual traffic safety conference designed to reach 250 citizens and professionals with up-to-date information on various traffic safety issues.
• Implement 2007 law changes.
2

• Publicize and train law enforcement, judicial branch, legislators and prosecutors on 2007 law changes.
• Continue the development of a revised Transportation Safety Action Plan, the long-range planning document for addressing the “4-E”’s in transportation safety issues in Oregon.
• Raise awareness of the safety actions advocated in the Transportation Safety Action Plan through a published document available in print and electronic form.
• Make effective use of Internet, direct mail, and news media channels to raise awareness of Transportation Safety Action Plan, or the issues and actions identified by the Action Planning process.
• Advocate for a transportation system that is self-educating and self-enforcing for its users.
• Continue to operate with adequate powers, be suitably equipped and organized to carry out a state highway safety program.
3

4

Bicyclists in Motor Vehicle Crashes on Oregon Roadways, 2004-2007 99-03 % Change
Average 2004 2005 2006 2007 2004-2007
Injuries (crashes w/ motor vehicles) Number 644 677 779 726 617 -8.9%
Percent of total Oregon injuries 2.3% 2.5% 2.7% 2.5% 2.2% -10.5%
Fatalities (crashes w/ motor vehicles) Number 7 9 11 14 15 66.7%
Percent of total Oregon fatalities 1.6% 2.0% 2.3% 2.9% 3.3% 67.0%
Percent Helmet Use (children) 46.0% 58% 50% 47% 53% -8.6%
Source: Crash Analysis and Reporting, Oregon Department of Transportation Bicycle Helmet Observation Study, Intercept Research Corporation
Bicyclist Safety
Link to the Transportation Safety Action Plan: Action #66, 67
Action #66 Increase public education and enforcement efforts regarding the rules of operation for bicycles, scooters, skates, skateboards, personal assistive devices and any new device that is legally permitted on roadways of Oregon.
Action #67Increase emphasis on programs that will encourage bicycle and other alternative mode travel and improve safety for these modes.
The Problem
• In 2007, 395 bicyclists age 20+ years were injured in motor vehicle crashes compared to 475 in 2005.
• In 2006, motorists failed to yield right-of-way to bicyclists in 312 crashes compared to 328 in 2005.
• In 2006, 21 percent of all bicyclist crashes were at dusk, dawn or low light conditions.
• In 2007, correct helmet use increased to 53 percent, compared to 47 percent in 2006.
• A review of crash data shows that the most common errors in bicyclists versus motor vehicle crashes are the errors at intersections: failure to yield, turning in front of oncoming traffic, disregarding a traffic sign or signal. Data shows that responsibility for these errors are equally shared between bicyclists and motorists.
5
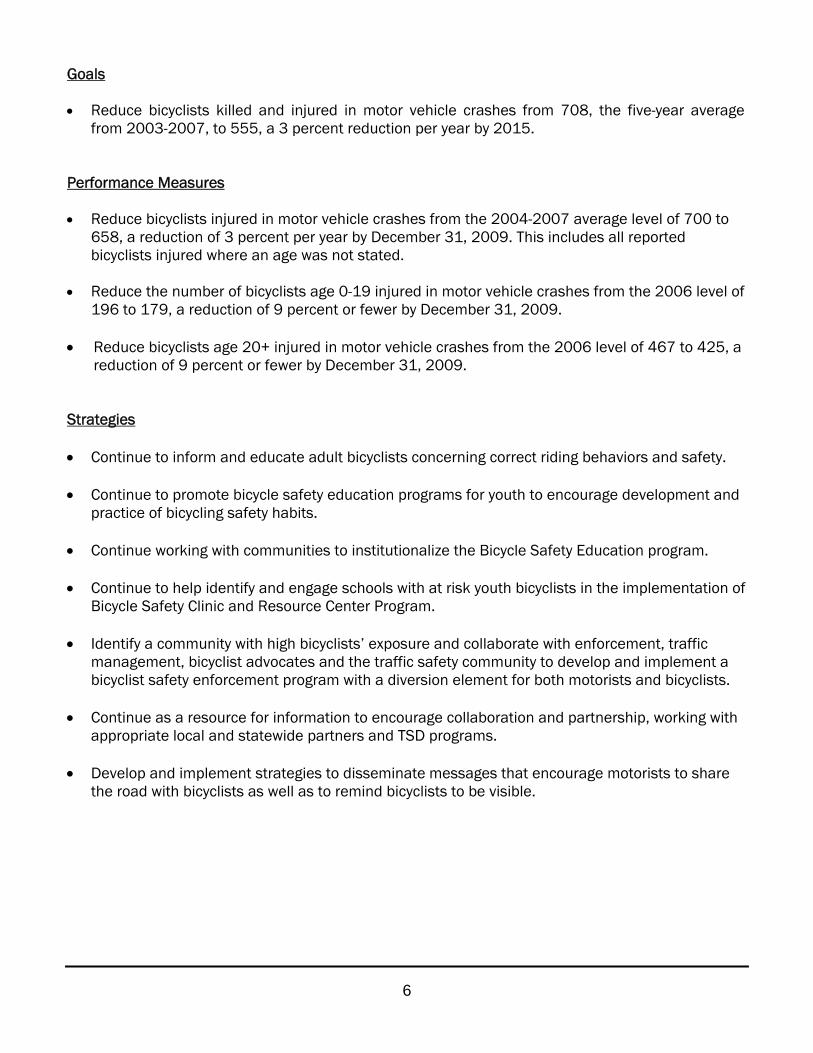
Goals
• Reduce bicyclists killed and injured in motor vehicle crashes from 708, the five-year average from 2003-2007, to 555, a 3 percent reduction per year by 2015.
Performance Measures
• Reduce bicyclists injured in motor vehicle crashes from the 2004-2007 average level of 700 to 658, a reduction of 3 percent per year by December 31, 2009. This includes all reported bicyclists injured where an age was not stated.
• Reduce the number of bicyclists age 0-19 injured in motor vehicle crashes from the 2006 level of 196 to 179, a reduction of 9 percent or fewer by December 31, 2009.
• Reduce bicyclists age 20+ injured in motor vehicle crashes from the 2006 level of 467 to 425, a reduction of 9 percent or fewer by December 31, 2009.
Strategies
• Continue to inform and educate adult bicyclists concerning correct riding behaviors and safety.
• Continue to promote bicycle safety education programs for youth to encourage development and practice of bicycling safety habits.
• Continue working with communities to institutionalize the Bicycle Safety Education program.
• Continue to help identify and engage schools with at risk youth bicyclists in the implementation of Bicycle Safety Clinic and Resource Center Program.
• Identify a community with high bicyclists’ exposure and collaborate with enforcement, traffic management, bicyclist advocates and the traffic safety community to develop and implement a bicyclist safety enforcement program with a diversion element for both motorists and bicyclists.
• Continue as a resource for information to encourage collaboration and partnership, working with appropriate local and statewide partners and TSD programs.
• Develop and implement strategies to disseminate messages that encourage motorists to share the road with bicyclists as well as to remind bicyclists to be visible.
6
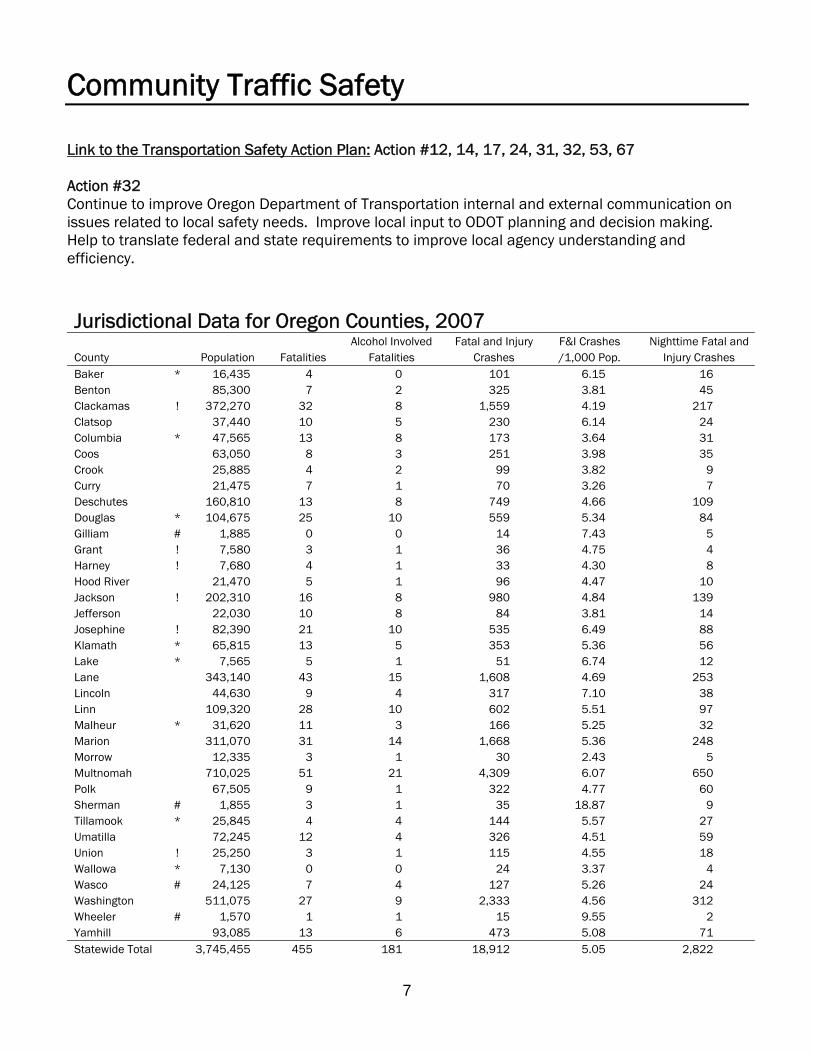
Community Traffic Safety
Link to the Transportation Safety Action Plan: Action #12, 14, 17, 24, 31, 32, 53, 67
Action #32 Continue to improve Oregon Department of Transportation internal and external communication on issues related to local safety needs. Improve local input to ODOT planning and decision making. Help to translate federal and state requirements to improve local agency understanding and efficiency.
Jurisdictional Data for Oregon Counties, 2007 Alcohol Involved Fatal and Injury F&I Crashes Nighttime Fatal and
County Population Fatalities Fatalities Crashes /1,000 Pop. Injury Crashes Baker * 16,435 4 0 101 6.15 16 Benton 85,300 7 2 325 3.81 45 Clackamas ! 372,270 32 8 1,559 4.19 217 Clatsop 37,440 10 5 230 6.14 24 Columbia * 47,565 13 8 173 3.64 31 Coos 63,050 8 3 251 3.98 35 Crook 25,885 4 2 99 3.82 9 Curry 21,475 7 1 70 3.26 7 Deschutes 160,810 13 8 749 4.66 109 Douglas * 104,675 25 10 559 5.34 84 Gilliam # 1,885 0 0 14 7.43 5 Grant ! 7,580 3 1 36 4.75 4 Harney ! 7,680 4 1 33 4.30 8 Hood River 21,470 5 1 96 4.47 10 Jackson ! 202,310 16 8 980 4.84 139 Jefferson 22,030 10 8 84 3.81 14 Josephine ! 82,390 21 10 535 6.49 88 Klamath * 65,815 13 5 353 5.36 56 Lake * 7,565 5 1 51 6.74 12 Lane 343,140 43 15 1,608 4.69 253 Lincoln 44,630 9 4 317 7.10 38 Linn 109,320 28 10 602 5.51 97 Malheur * 31,620 11 3 166 5.25 32 Marion 311,070 31 14 1,668 5.36 248 Morrow 12,335 3 1 30 2.43 5 Multnomah 710,025 51 21 4,309 6.07 650 Polk 67,505 9 1 322 4.77 60 Sherman # 1,855 3 1 35 18.87 9 Tillamook * 25,845 4 4 144 5.57 27 Umatilla 72,245 12 4 326 4.51 59 Union ! 25,250 3 1 115 4.55 18 Wallowa * 7,130 0 0 24 3.37 4 Wasco # 24,125 7 4 127 5.26 24 Washington 511,075 27 9 2,333 4.56 312 Wheeler # 1,570 1 1 15 9.55 2 Yamhill 93,085 13 6 473 5.08 71 Statewide Total 3,745,455 455 181 18,912 5.05 2,822
7

Jurisdictional Data for Oregon Cities over 10,000 Population, 2007 Population Alcohol-Involved Fatal and Injury F&I Crashes Nighttime Fatal and
City Estimate Fatalities Fatalities Crashes /1,000 Pop. Injury Crashes Albany * 47,470 6 1 201 4.23 26 Ashland * 21,630 0 0 59 2.73 6 Astoria * 10,045 0 0 48 4.78 3 Baker City 10,105 0 0 26 2.57 0 Beaverton * 85,560 2 1 659 7.70 74 Bend * 77,780 5 3 311 4.00 40 Canby * 15,140 0 0 20 1.32 1 Central Point 17,025 0 0 49 2.88 6 Coos Bay * 16,210 0 0 48 2.96 5 Cornelius 10,895 1 0 36 3.30 1 Corvallis 54,890 0 0 191 3.48 24 Dallas 15,065 0 0 23 1.53 1 Eugene 153,690 5 1 776 5.05 94 Forest Grove 20,775 0 0 51 2.45 7 Gladstone * 12,200 0 0 39 3.20 1 Grants Pass 31,740 4 3 273 8.60 30 Gresham 99,225 4 1 473 4.77 63 Happy Valley 10,380 0 0 12 1.16 3 Hermiston 15,780 0 0 61 3.87 9 Hillsboro 88,300 3 1 476 5.39 67 Keizer * 35,435 0 0 66 1.86 7 Klamath Falls * 21,040 1 0 96 4.56 12 La Grande * 12,850 0 0 33 2.57 4 Lake Oswego * 36,345 0 0 98 2.70 13 Lebanon 14,705 1 1 48 3.26 7 McMinnville 31,665 1 1 100 3.16 9 Medford * 75,675 2 1 393 5.19 33 Milwaukie * 20,920 1 1 90 4.30 17 Newberg * 21,675 1 0 73 3.37 5 Newport 10,455 1 1 69 6.60 1 Ontario * 11,325 0 0 47 4.15 6 Oregon City 30,060 1 0 176 5.85 24 Pendleton 17,260 0 0 55 3.19 4 Portland ! 568,380 34 16 3,569 6.28 537 Prineville 10,190 0 0 32 3.14 1 Redmond * 24,805 0 0 153 6.17 14 Roseburg 21,255 1 0 146 6.87 12 Salem * 152,290 6 3 959 6.30 128 Sherwood 16,365 2 1 45 2.75 6 Springfield 57,320 1 1 247 4.31 40 St. Helens 12,075 1 0 21 1.74 2 The Dalles * 13,045 0 0 43 3.30 4 Tigard 46,715 3 0 291 6.23 41 Troutdale 15,430 1 1 52 3.37 8 Tualatin 26,025 0 0 157 6.03 15 West Linn * 24,180 0 0 83 3.43 4 Wilsonville 17,405 0 0 66 3.79 5 Woodburn 22,875 0 0 72 3.15 10 Total 2,181,670 88 38 11,112 5.09 1,430
Sources: Crash Analysis and Reporting, Oregon Department of Transportation; Fatality Analysis Reporting System, U.S. Department of Transportation; Center for Population Research and Census, School of Urban and Public Affairs, Portland State University Text in italics based on urban boundary changes per national census.
*= Local Traffic Safety Group != Safe Community Site #= City/County Group
8
The Problem
• More than 60 percent of Oregon cities and counties do not have a systematic approach addressing transportation related injury and death.
• While a volunteer work force exists, often there is no local mechanism for mobilizing and motivating these volunteers.
Goal
• Increase the number of Oregonians represented by a community-level transportation safety program to 75 percent by 2015 compared to 61 percent, the 2002 figure.
Performance Measures
• Increase the number of local transportation safety committees in Oregon from 54 the 2007 number, to 60 by December 31, 2009.
• Increase the number of documented neighborhood associations addressing traffic safety from 130 to 140 by December 31, 2009.
• Reduce the per-capita fatal and injury crash rate, in communities with a traffic safety group to five percent below the 2002 statewide rate of one crash per 184 persons, resulting in a rate of one crash per 175 persons by December 31, 2009.
• Maintain or increase the number of active Safe Community programs by December 31, 2009. (As of federal fiscal year 2006, there were ten Safe Community programs in Oregon: Clackamas County, Grant County, Harney County, Jackson County, Malheur County, Tillamook County, Union County, Wallowa County, City of Eugene, and City of Portland.)
Strategies
• Continue the development of Safe Communities Programs, addressing both fatal and injury prevention and cost issues in targeted communities.
• Continue Comprehensive Community Traffic Safety Programs, emphasizing projects in targeted communities.
• Expand the number of Oregonians who participate in transportation injury prevention at the community level, through projects that create innovative opportunities for citizens to become involved. Track these individuals by increasing the number of documented traffic safety groups.
• Include region representatives in community-level traffic safety programs by providing opportunity to have substantive input into Safe Community and other projects, including grants management and on-site assistance of local groups.
9
• Provide print materials and technical tools designed to foster community-level approaches to traffic safety issues.
• Encourage local level partnerships that cross traditional program, group, and topical divisions through training and hands-on technical assistance provided by both region representatives and centralized offerings. Develop activities that act as a catalyst for expanded safety activity.
• Evaluate opportunities to increase employer participation in traffic safety programs. Implement at least one employer based strategy.
10

Driver Education
Link to the Transportation Safety Action Plan: Action #10
Action #10 Driver education is highlighted as one of the nine key actions in the Transportation Safety Action Plan. Improving the quality of the driver education program and creating a delivery system to increase the number of teens completing an approved driver education course is critical to reduce teen crashes and injuries.
The Problem
• Pursuant to an audit of the use of state highway funds, the Office of the Attorney General requested changes in the criteria for determining which students would qualify public schools to receive reimbursement from the Student Driver Training Fund.
• There is a need to eliminate inconsistencies in the various driver education public/private providers by establishing a model statewide program with standards proven to reduce risk factors of teen driver crashes.
• There is a statewide need for more qualified and updated driver education instructors. Western Oregon University has created instructor preparation courses: the Basic Foundation, Behind-The-Wheel and Classroom based on National Standards. A need exists to provide this training in the ODOT’s five regional areas.
• Not all private driver education commercial schools teach from the same curriculum, nor is it required. However, just like the public curriculum, covering concepts to reduce the risk factors is critical. ODOT-TSD approved private commercial drive schools teaching 15, 16, and 17 year olds must submit their curriculum to ODOT TSD for approval on a three-year cycle. There is a need to identify the number of students completing an approved private driver education program. Only 12 out of the 25 private commercial driving schools offer approved TSD driver education programs.
Driver Education in Oregon, 2003-2007
DMV Licenses Issued (Age 16-17) Public Schools Providing ODOT-TSD Approved DE Community Colleges Providing ODOT-TSD Approved DE
Commercial Vendors Providing ODOT-TSD Approved DE
DE Students completing DE Students that did not complete an ODOT-TSD approved DE program before licensing
2003 2004* 2005 2006 2007 2008
Projected
28,195
94
28,290
94
27,731
87
27,688
80
29,500
76
27,500
76
8 8 8 7 7 7
14 14 15 12 11 13
10,156
16,039
9,046
18,520
9,542
17,189
9,327
17,804
8,989
18,511
9,259
18,241
Source: Driver and Motor Vehicle Services, Oregon Department of Transportation Transportation Safety Division, Oregon Department of Transportation
11
*2002-2004: Dropped in DE enrollment caused by Attorney General Ruling that the person must not have a license before completion of DE to be eligible for reimbursement. Report from private drive schools were double reported in the count of public and private schools students. Due to cuts in educational funding Local districts choose to increase fees for student participants.
2004-05: Drop in public providers due to local districts outsourcing DE service to a community colleges and ESDs -Example- One ESD provides 25 school districts with DE Services in 13 counties in fifty-two high school areas -One district had site base management changes and went from five providers into to one provider with no reduction in students reached. 2006: Increase in enrollment due to increase reimbursement from $150 to 210 There are 25 private commercial driving schools registered with DMV for driver training.
Goal
• Develop a driver education system that results in increased student participation in driver education of newly licensed teens under the age of eighteen from 8,989 to 10,876 (21 percent increase) by the 2015.
• Implement consistent, statewide program standards with content, outcomes and habit formation for the driver education providers by 2015.
• Require completion of an ODOT approved driver education program as a licensing requirement with the Oregon Legislature by 2012.
Performance Measures
• Promote the importance of driver education and expand the delivery system for driver education in Oregon by increasing the number of students completing driver education from 8,989 in 2007 to 9,259 by December 31, 2009.
• Complete training of private and public driver education instructors from 189 in 2007 to 275 by December 31, 2009.
• Complete on site inspections/audits of approved Driver Education providers that include reviewing instructor’s qualifications, curriculum and reimbursement from 30 in 2007 to 75 by December 31, 2009.
• Distribute Driver Education Reimbursement funds and update web tool for Transportation Safety Division and provider use supporting changes in student qualification in reimbursement process by December 31, 2009.
Strategies
• Develop and maintain a mailing database for all providers teaching Driver Education.
• Develop a marketing plan to increase access and completion of quality Driver Education in Oregon.
• Continue implementation of statewide curriculum standards and instructor training as a part of the new administrative rules adopted April 1, 2007.
12

• Develop web tool that integrates DMV licensing information into course completion tracking for students of schools involved in the reimbursement process and track private provider driver education students.
• Develop tracking system and database to collect and maintain information on driver education program providers as well as instructors as they complete courses required by April 1, 2007, as stated in Oregon Administrative Rules.
• Develop a plan to work with selected driver education providers and National Institute of Driver Behavior (NIDB) to create a model driver risk prevention pilot project utilizing the Computer Activity Program and the ADTSEA/NIDB standards.
• Develop assessment/inspection form for monitoring driver education providers.
• Develop database to track Trainer of Trainer activities as they provide training for front line instructors throughout the state.
• Continue to work with NHTSA, ODOT Research Division and other research groups to evaluate the elements of the Oregon driver education program.
• Continue to promote best practices through quality professional development.
13

14
Emergency Medical Services (EMS)
Link to the Transportation Safety Action Plan: Action #26, 27, 28
Action #26Complete a review of EMS related statutes with the goal of developing an effective and integrated EMS system for the state of Oregon. Develop a comprehensive statewide EMS plan and designate the EMS Section of the Health Division to do the following: establish standards for local EMS service delivery, transportation services, and care facilities; establish certification requirements for EMS service providers; provide training; develop a statewide communication system; establish a statewide trauma system; provide public information and education about EMS services; and provide adequate funding and periodically evaluate system performance.
Action #27 Maintain quality of 9-1-1 services and look for opportunities for improvements, as new technologies become available.
Action #28 Continue efforts to enhance communication between engineering, enforcement, education and EMS.
The Problem
• Traffic crashes contribute heavily to the patient load of Oregon hospitals and EMS agencies. The Oregon economy has caused many larger hospitals to make cuts and their foundations have reduced support, as well. Smaller and rural community hospitals often face even more severe budgetary constraints. Pre-hospital stabilization and long-distance transport of patients to facilities that can provide the appropriate level of care is critical in reducing the health and financial impact of injuries and fatalities.
• Many states, including Oregon, still do not have comprehensive trauma system legislation that provides for a comprehensive system of trauma care as part of the EMS system. It is well recognized that comprehensive EMS and trauma legislation is paramount to the success of an effective EMS system.
• Our national and state 9-1-1 systems are decades old and was not built to handle the text, data, photos and video that are increasingly common in communication. This antiquated network cannot transmit the information available from new technologies.
Goal
• Identify and collaborate with hospitals, emergency medical services agencies and/or EMS advisory board committees in their transportation safety related medical care and programs. Focus on rural EMS, statewide data collection and training. Report on progress by 2015.
15
• Collaborate with Department of Human Services (DHS) EMS toward achieving comprehensive trauma system legislation that provides for a comprehensive system of trauma care as part of Oregon’s EMS system. Have necessary legislation in place by the 2015 Legislative Session.
• Collaborate with the EMS Directors to ensure Transportation Safety Division’s involvement in the implementation of the 2006 NHTSA EMS Reassessment of Oregon recommendations. Develop an effective and integrated EMS system for the state of Oregon, reporting on progress by 2015.
• Stay apprised of the “Next Generation 9-1-1” Initiative, a national initiative to establish the infrastructure for transmission of voice, data, and photographs from different types of communication devices to the Public Safety Answering Points and on to emergency responder networks. Look for opportunities from the national initiative to improve Oregon’s 9-1-1 system. Target improvement implementation for 2015.
• Establish formal presence for EMS and other medical related programs in the overall highway safety programs by 2015, stressing the importance of the 4-E’s: engineering, enforcement, education and EMS.
Performance Measures
• Identify and collaborate with hospitals, emergency medical services agencies and EMS advisory board committees in their transportation safety related medical care and programs by December 31, 2009.
• Encourage and collaborate with the EMS Directors to develop a comprehensive statewide EMS plan for Oregon by December 31, 2009. As a result of the 2006 NHTSA EMS Reassessment of Oregon, DHS, has hired an EMS and Trauma Systems Director and a Medical Director EMS and Trauma Systems to plan and implement EMS and Trauma initiatives to improve EMS in Oregon.
• Identify and established formal presences of EMS in highway safety programs, report by December 31, 2009.
Strategies
• Work in coordination with DHS and other partners to develop a comprehensive and integrated EMS system for Oregon.
• Participate in the EMS Transition Advisory Team to provide technical assistance as necessary.
• Provide mini-grant funding to hospitals and/or EMS providers throughout Oregon to improve statewide EMS (i.e., education, outreach, assistance within communities, training, ambulance equipment, etc.)
• Use the 2006 NHTSA EMS Reassessment findings and recommendations for guidance to develop and integrate EMS system for Oregon.
16

Equipment Safety Standards
Link to the Transportation Safety Action Plan: Action #15
Action #15 Continue to improve public knowledge of vehicle safety equipment, and its role in safe vehicle operation. Improve current mechanisms to raise awareness of common vehicle equipment maintenance and use errors, and seek new or more effective ways to raise awareness and increase compliance with proper use and maintenance guidelines. Develop improved mechanisms to educate the public about Antilock Braking Systems (ABS) use.
The Problem
• Oregon complies with the federal vehicle equipment and safety standards; however, Oregon does not publish the standards.
• Equipment retailers sell and/or modify vehicles that are not in compliance with the Federal Motor Vehicle Safety Standards (FMVSS), Oregon Revised Statutes or Oregon Administrative Rule.
• General knowledge of vehicle codes concerning vehicle equipment, especially in the area of lighting equipment, is lacking in the general driving public. This lack of knowledge presents hazards as drivers continue to violate equipment statutes.
• Vehicle equipment defects are not consistently reported in crashes.
Automobile Vehicle Defect Crashes on Oregon Highways, 2004-2007 99-03 % Change
Average 2004 2005 2006 2007 2004-2007
Total Vehicle Defect Crashes Number 554 486 514 531 507 4.3%
Property Damage Crashes Number 322 240 234 258 248 3.3%
Non-fatal & Injury Crashes Number 226 238 268 265 250 5.0% Number of persons injured 357 389 449 416 398 2.3%
Fatal Crashes Number 5 8 12 8 9 12.5% Number of persons killed 7 12 15 8 9 -25.0%
Source: Crash Analysis and Reporting, Oregon Department of Transportation Includes: Autos, Pickups, Vans, SUVs, Motorhomes, Motorcycles and Mopeds. Types of defects: trailer connection broken, steering, brakes, wheel
came off, hood flew up, lost load, tire failure, other. (Trucks, buses and semi vehicle safety and equipment standards are administered and enforced by the Motor Carrier Division of ODOT.)
17
Goal
• Reduce the number of vehicle-defect crashes from 507 in 2007 to 494 or lower by 2015.
Performance Measures
• Update the TSD administrative rules on vehicle and equipment safety standards within nine months of legislative changes.
• Design and develop a public information and education outreach campaign for continued or emerging vehicle safety issues and post the information on the TSD website by December 31, 2009.
• Disseminate information to 25 automobile dealerships, automobile parts and after-market equipment retailers to educate them about equipment compliance by December 31, 2009.
• Record the number of vehicle equipment phone and website inquiries.
• Disseminate information to law enforcement agencies about state and federal motor vehicle safety standards.
Strategies
• Update Oregon Administrative Rules on equipment to reflect current federal law or clarify current federal or state law.
• Educate the public, the auto industry, the after-market equipment retailers, law enforcement and judicial officials about vehicle equipment codes through the use of TSD’s website, flyers, news releases, events, and verbal communications.
• Explore statewide standards requiring public motor pool cars to meet or exceed national crash standards.
18
Highway Safety Investment Program (HSIP)
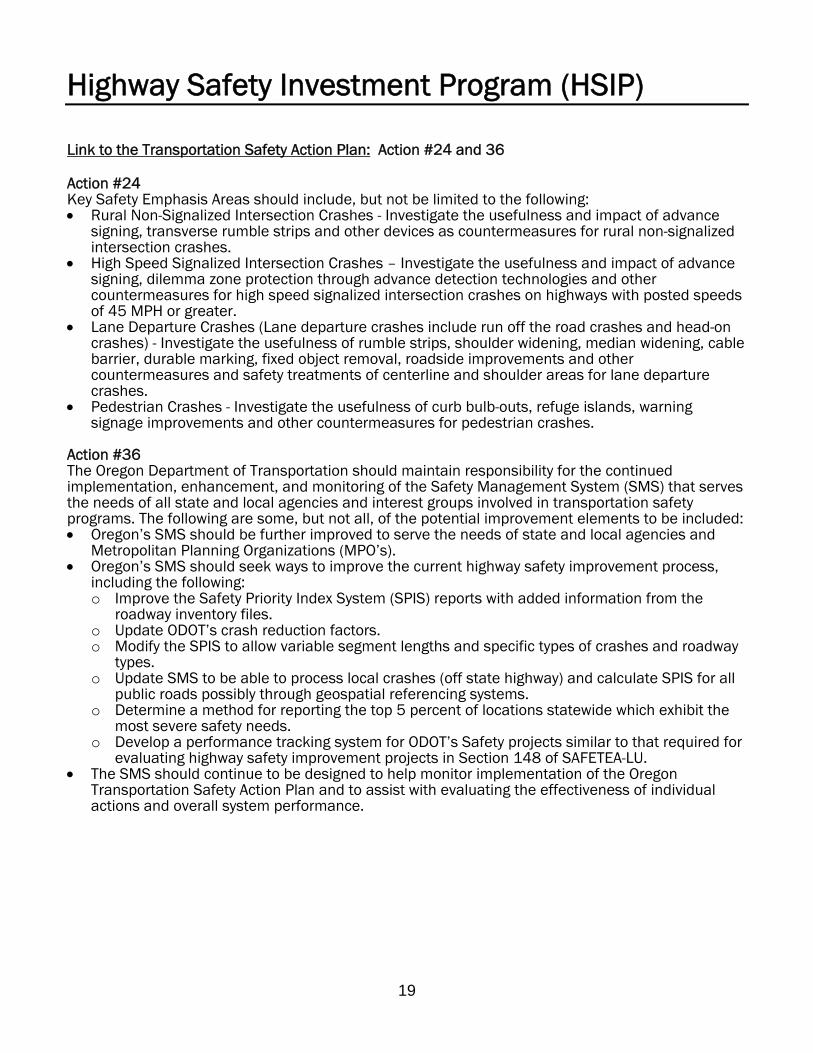
Link to the Transportation Safety Action Plan: Action #24 and 36
Action #24 Key Safety Emphasis Areas should include, but not be limited to the following: • Rural Non-Signalized Intersection Crashes - Investigate the usefulness and impact of advance
signing, transverse rumble strips and other devices as countermeasures for rural non-signalized intersection crashes.
• High Speed Signalized Intersection Crashes – Investigate the usefulness and impact of advance signing, dilemma zone protection through advance detection technologies and other countermeasures for high speed signalized intersection crashes on highways with posted speeds of 45 MPH or greater.
• Lane Departure Crashes (Lane departure crashes include run off the road crashes and head-on crashes) - Investigate the usefulness of rumble strips, shoulder widening, median widening, cable barrier, durable marking, fixed object removal, roadside improvements and other countermeasures and safety treatments of centerline and shoulder areas for lane departure crashes.
• Pedestrian Crashes - Investigate the usefulness of curb bulb-outs, refuge islands, warning signage improvements and other countermeasures for pedestrian crashes.
Action #36 The Oregon Department of Transportation should maintain responsibility for the continued implementation, enhancement, and monitoring of the Safety Management System (SMS) that serves the needs of all state and local agencies and interest groups involved in transportation safety programs. The following are some, but not all, of the potential improvement elements to be included: • Oregon’s SMS should be further improved to serve the needs of state and local agencies and
Metropolitan Planning Organizations (MPO’s). • Oregon’s SMS should seek ways to improve the current highway safety improvement process,
including the following: o Improve the Safety Priority Index System (SPIS) reports with added information from the
roadway inventory files. o Update ODOT’s crash reduction factors. o Modify the SPIS to allow variable segment lengths and specific types of crashes and roadway
types. o Update SMS to be able to process local crashes (off state highway) and calculate SPIS for all
public roads possibly through geospatial referencing systems. o Determine a method for reporting the top 5 percent of locations statewide which exhibit the
most severe safety needs. o Develop a performance tracking system for ODOT’s Safety projects similar to that required for
evaluating highway safety improvement projects in Section 148 of SAFETEA-LU. • The SMS should continue to be designed to help monitor implementation of the Oregon
Transportation Safety Action Plan and to assist with evaluating the effectiveness of individual actions and overall system performance.
19

The Problem
• The purpose of the Highway Safety Investment Program (HSIP) is to achieve a significant reduction in fatalities and serious injuries on public roads.
• HSIP is a stand-alone core federal-aid highway safety program with a renewed call for data-driven, strategic highway safety programs focusing on results, and provides increased flexibility in state funding for safety.
• City and County Roads account for half of the fatal and serious injury crashes in the state but these crashes are spread over 43,000 miles of roadway.
• State highways have the highest rate of fatal and serious injury crashes per mile.
Oregon Highways, Fatal and Serious Injury Crashes, 2007 Fatal and Serious Injury Deaths and Serious Centerline Miles
Public Roads by Jurisdiction Crashes Injuries on System State Highways 944 1,156 8,038 City Streets 516 598 10,620 County Roads 443 555 33,167 Other Roadways 26 34 7,932 Total (All Public Roads) 1,929 2,343 59,757
Source: Crash Analysis and Reporting, Oregon Department of Transportation
Goals
• Focus efforts on using the safety funds to address high priority sites with the objective of reducing the number of fatal and serious injury crashes from 1,929 in 2007 by an average of 20 every year by 2015.
• Improve the identification and analysis of highway safety problems and opportunities from a state highway only system to an all public roads system by September 2009.
• Incorporate the latest safety methodologies and techniques (Highway Safety Manual) for analyzing the safety of roadways by 2012.
Performance Measures
• Develop an annual report evaluating and assessing results of safety projects in order to develop effective safety projects by September 30, 2009.
• Develop an annual report of the top 5 percent hazardous sites, identifying potential remedies, estimated costs and impediments to implementation in order to incorporate an optimum number of sites with cost effective remedies in the Statewide Transportation Improvement Program by September 30, 2009.
• Develop expanded annual report of top 5 percent hazardous sites to include all Public Roads by December 31, 2009.
20

Strategies
Continue research in the following:
• Assessment of Statewide Intersection Safety Performance.
• Calibration of new Safety Models.
• Provide training for new Safety Investigation Manual.
• Support Access Management efforts to evaluate effectiveness of program for improving safety.
• Develop performance measuring/tracking of Safety Projects and Engineering Safety Program.
• Develop new GIS based Safety Priority Index System (SPIS) for all public roads.
• Develop simple GIS based tools for local agencies, enforcement and public.
• Develop new Collision Diagramming tool.
• Work with PSU and OSU to develop Oregon Safety database and analysis tools.
• Investigate and incorporate Highway Safety Manual Concepts into Safety Management System.
• Support use of Road Safety Audits for ODOT and local agencies.
21

22

Impaired Driving – Alcohol
Link to the Transportation Safety Action Plan: Action #1, 2, 4, 37
Action #1 Develop a Traffic Law Enforcement Strategic Plan which addresses the needs and specialties of the Oregon State Police, County Sheriff and City Police Departments. The plan should be developed with assistance from a high level, broadly based Task Force that includes representatives of all types of enforcement agencies, as well as non-enforcement agencies impacted by enforcement activities.
Action #2 Encourage more traffic law enforcement training for police as part of the requirements for the Basic Certificate and improve traffic law training offerings. To encourage participation, offer training on a regional basis on a variety of topics including Standard Field Sobriety Testing (SFST), Drug Recognition Expert (DRE), and Traffic Enforcement Program Management.
Action #4 Evaluate techniques and new approaches for providing training and updates to Oregon’s Judicial body, seeking to develop consistent adjudication outcomes statewide. Implement the most promising techniques and approaches as they are identified. Evaluate the effectiveness of these techniques and approaches through survey and research tools.
Action #37 Continue to recognize the prevalence of driving under the influence of controlled substances and revise driving under the influence of intoxicants (DUII) statutes to address the legal issues around sobriety check points, expand the definition of DUII to include over the counter and prescription medications, and support the implementation of these revisions, and offer a comprehensive statewide DRE training program.
The Problem
• Data from the Fatality Analysis Reporting System (FARS), which is based on police, medical, and other information, show that in 2007, 39.8 percent of all traffic fatalities were alcohol-related. 161 of the fatalities involved only alcohol; 46 involved only other drugs; and 22 were a combination of both alcohol and other drugs.
• Alcohol continues to be an overwhelming factor in impaired driving fatal and injury crashes. Although, there have been great strides in the drop in alcohol-only fatalities from 176 in 2004 to the current 2007 level of 161.
• Between 2003 and 2007 of the 18 children age 0-14 killed in alcohol-involved crashes, 9 (or 50 percent) were passengers in a vehicle operated by a driver who had been drinking.
• Mental health providers and law enforcement indicate that they are seeing evidence that more people are “self-medicating,” or abusing over-the-counter or prescription drugs.
23
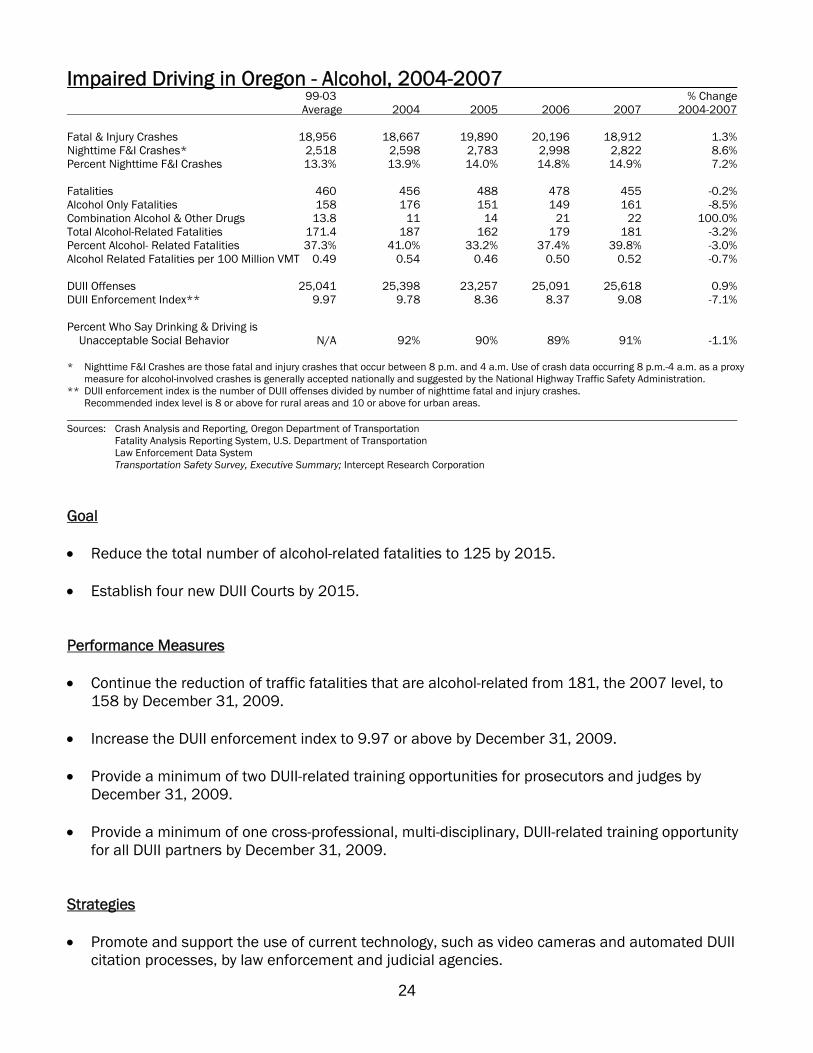
Impaired Driving in Oregon - Alcohol, 2004-2007 99-03 % Change
Average 2004 2005 2006 2007 2004-2007
Fatal & Injury Crashes 18,956 18,667 19,890 20,196 18,912 1.3% Nighttime F&I Crashes* 2,518 2,598 2,783 2,998 2,822 8.6% Percent Nighttime F&I Crashes 13.3% 13.9% 14.0% 14.8% 14.9% 7.2%
Fatalities 460 456 488 478 455 -0.2% Alcohol Only Fatalities 158 176 151 149 161 -8.5% Combination Alcohol & Other Drugs 13.8 11 14 21 22 100.0% Total Alcohol-Related Fatalities 171.4 187 162 179 181 -3.2% Percent Alcohol- Related Fatalities 37.3% 41.0% 33.2% 37.4% 39.8% -3.0% Alcohol Related Fatalities per 100 Million VMT 0.49 0.54 0.46 0.50 0.52 -0.7%
DUII Offenses 25,041 25,398 23,257 25,091 25,618 0.9% DUII Enforcement Index** 9.97 9.78 8.36 8.37 9.08 -7.1%
Percent Who Say Drinking & Driving is Unacceptable Social Behavior N/A 92% 90% 89% 91% -1.1%
* Nighttime F&I Crashes are those fatal and injury crashes that occur between 8 p.m. and 4 a.m. Use of crash data occurring 8 p.m.-4 a.m. as a proxy measure for alcohol-involved crashes is generally accepted nationally and suggested by the National Highway Traffic Safety Administration.
** DUII enforcement index is the number of DUII offenses divided by number of nighttime fatal and injury crashes. Recommended index level is 8 or above for rural areas and 10 or above for urban areas.
Sources: Crash Analysis and Reporting, Oregon Department of Transportation Fatality Analysis Reporting System, U.S. Department of Transportation Law Enforcement Data System Transportation Safety Survey, Executive Summary; Intercept Research Corporation
Goal
• Reduce the total number of alcohol-related fatalities to 125 by 2015.
• Establish four new DUII Courts by 2015.
Performance Measures
• Continue the reduction of traffic fatalities that are alcohol-related from 181, the 2007 level, to 158 by December 31, 2009.
• Increase the DUII enforcement index to 9.97 or above by December 31, 2009.
• Provide a minimum of two DUII-related training opportunities for prosecutors and judges by December 31, 2009.
• Provide a minimum of one cross-professional, multi-disciplinary, DUII-related training opportunity for all DUII partners by December 31, 2009.
Strategies
• Promote and support the use of current technology, such as video cameras and automated DUII citation processes, by law enforcement and judicial agencies.
24

• Implement a system of programs to deter impaired driving, which will include laws, effective enforcement of these laws, visible and aggressive prosecution, and strong adjudication of same.
• Create DUII enforcement projects that provide highly visible patrols and selective enforcement methods utilizing up-to-date field sobriety techniques.
• Support comprehensive community DUII prevention projects that employ collaborative efforts in the development and execution of strategic information and education campaigns targeting youth and adults, and focusing specific attention to those who engage in high-risk behaviors.
• Continue to support DRE training for enforcement officers, prosecutors, and judges to facilitate in the arrest, prosecution, and adjudication of alcohol and/or drug impaired drivers.
• Create public information and education campaigns to raise awareness specific to Oregon’s barriers in reducing incidence of impaired driving fatalities and crashes. Media products for these activities include print, radio, television, and other possible innovative digital mediums.
• Develop public information and education campaigns targeting specific law changes that will occur during the 2009 Legislative Session.
• Explore the opportunity for new drug/alcohol courts similar to the Multnomah County Court DISP program.
• Support a statewide Transportation Safety Resource Prosecutor (TSRP) who is available to all prosecutors, particularly for cases that may set a state precedent.
• Continue to provide training opportunities for laboratory technicians, law enforcement and prosecutors on use of new breath testing equipment.
25

26

Impaired Driving – Drugs
Link to the Transportation Safety Action Plan: Action #1, 2, 4, 37
Action #1 Develop a Traffic Law Enforcement Strategic Plan which addresses the needs and specialties of the Oregon State Police, County Sheriff and City Police Departments. The plan should be developed with assistance from a high level, broadly based Task Force that includes representatives of all types of enforcement agencies, as well as non-enforcement agencies impacted by enforcement activities.
Action #2 Encourage more traffic law enforcement training for police as part of the requirements for the Basic Certificate and improve traffic law training offerings. To encourage participation, offer training on a regional basis on a variety of topics including Standard Field Sobriety Testing (SFST), Drug Recognition Expert (DRE), and Traffic Enforcement Program Management.
Action #4 Evaluate techniques and new approaches for providing training and updates to Oregon’s Judicial body, seeking to develop consistent adjudication outcomes statewide. Implement the most promising techniques and approaches as they are identified. Evaluate the effectiveness of these techniques and approaches through survey and research tools.
Action #37 Continue to recognize the prevalence of driving under the influence of controlled substances and revise driving under the influence of intoxicants (DUII) statutes to address the legal issues around sobriety check points, expand the definition of DUII to include over the counter and prescription medications, and support the implementation of these revisions, and offer a comprehensive statewide DRE training program.
The Problem
• Data from the Fatality Analysis Reporting System (FARS), which is based on police, medical, and other information, show that in 2007, 14.7 percent of all traffic fatalities were drug-related. 161 of the fatalities involved only alcohol; 46 involved only other drugs; and 22 were a combination of both alcohol and other drugs.
• Since the inception of the Drug Recognition Expert (DRE) program in January 1995, Oregon has experienced an increase in drug-impaired driving arrests, from 428 in 1995, to 1,092 in 2007. Impairment, due to drugs other than alcohol, continues to have a negative impact on traffic safety.
• Mental health providers and law enforcement are seeing evidence indicating that more people are “self-medicating,” or abusing prescription or over-the-counter drugs.
• Due to current Oregon law, drivers impaired by over-the-counter and/or prescription drugs do not get DUIIs and are therefore not referred to treatment.
• DUII courts significantly reduce recidivism. There are currently only two in Oregon.
27

Impaired Driving in Oregon – Other Drugs, 2004-2007 99-03 % Change
Average 2004 2005 2006 2007 2004-2007
Fatal & Injury Crashes 18,956 18,667 19,890 20,196 18,912 1.3% Nighttime F&I Crashes* 2,518 2,598 2,783 2,998 2,822 8.6% Percent Nighttime F&I Crashes 13.3% 13.9% 14.0% 14.8% 14.9% 7.2%
Fatalities 460 456 487 478 455 -0.2% Other Drug Only Fatalities 28.4 31 36 33 46 48.4% Combination Other Drug and Alcohol 13.8 11 14 21 22 100.0% Other Drug-Related Fatalities 42.0 42 50 63 67 59.5% Percent Other Drug-Involved Fatalities 9.2% 9.2% 10.2% 13.2% 14.7% 59.9%
DUII Arrests (drugs other than Alcohol) 938 1,367 1,246 1,006 1,092 -20.1%
* Nighttime F&I Crashes are those fatal and injury crashes that occur between 8 p.m. and 4 a.m. Use of crash data occurring 8 p.m.-4 a.m. as a proxy measure for alcohol-involved crashes is generally accepted nationally and suggested by the National Highway Traffic Safety Administration.
Sources: Crash Analysis and Reporting, Oregon Department of Transportation Fatality Analysis Reporting System, U.S. Department of Transportation Law Enforcement Data System
Goal
• Reduce the total number of drug-related fatalities to 40 by 2015.
• Establish four new DUII courts by 2015.
Performance Measures
• Increase the number of certified DREs from 215, in 2006, to 225 by December 31, 2009.
• Increase the number of DRE evaluations from 1,249 in 2006 to at least 1,367 the 2004 number, in 2009.
Strategies
• Revise statute to change the definition of intoxicants to include “any substance that impairs to a noticeable or perceptible degree.”
• Promote and support the use of current technology, such as video cameras and DRE techniques, by law enforcement and judicial agencies.
• Implement a system of programs to deter impaired driving, which will include laws, effective enforcement of these laws, visible and aggressive prosecution, and strong adjudication of same.
• Create DUII enforcement projects that provide highly visible patrols and selective enforcement methods utilizing up-to-date field sobriety techniques and Drug Recognition Experts (DREs).
28
• Support comprehensive community DUII prevention projects that employ collaborative efforts in the development and execution of strategic information and education campaigns targeting youth and adults, and focusing specific attention to those who engage in high-risk behaviors.
• Continue to support DRE training for enforcement officers, prosecutors, and judges to facilitate in the arrest, adjudication, and conviction of alcohol and/or drug impaired drivers.
• Create public information and education campaigns targeting youth, adults, and those engaged in high-risk behaviors. Media products for these activities include print and electronic media, as well as classrooms.
• Create public information and education campaigns targeting specific law changes that will occur during the 2009 Legislative Session.
• Explore the opportunity for new DUII courts.
• Work with DHS and their partners to investigate who can provide further information on drug use patterns of DUII offenders.
• Explore ways to enhance other drug related reporting in the citation process which would include LEDS, the citation form itself, DMV, and citation tracking.
• Develop methods to communicate with medical community, e.g., pharmacy and physicians, to recognize the possibility of drug impairment in their patients and the relative hazard they present on Oregon's roadways.
• Support a statewide TSRP who is available to all prosecutors, particularly for DRE cases.
• Seek support and insight from the GAC on DUII on immerging issues relating to driving under the influence of drugs other than alcohol.
• Solicit the GAC on DUII’s suggestions and support on implementing related plans.
29

30
Judicial Outreach
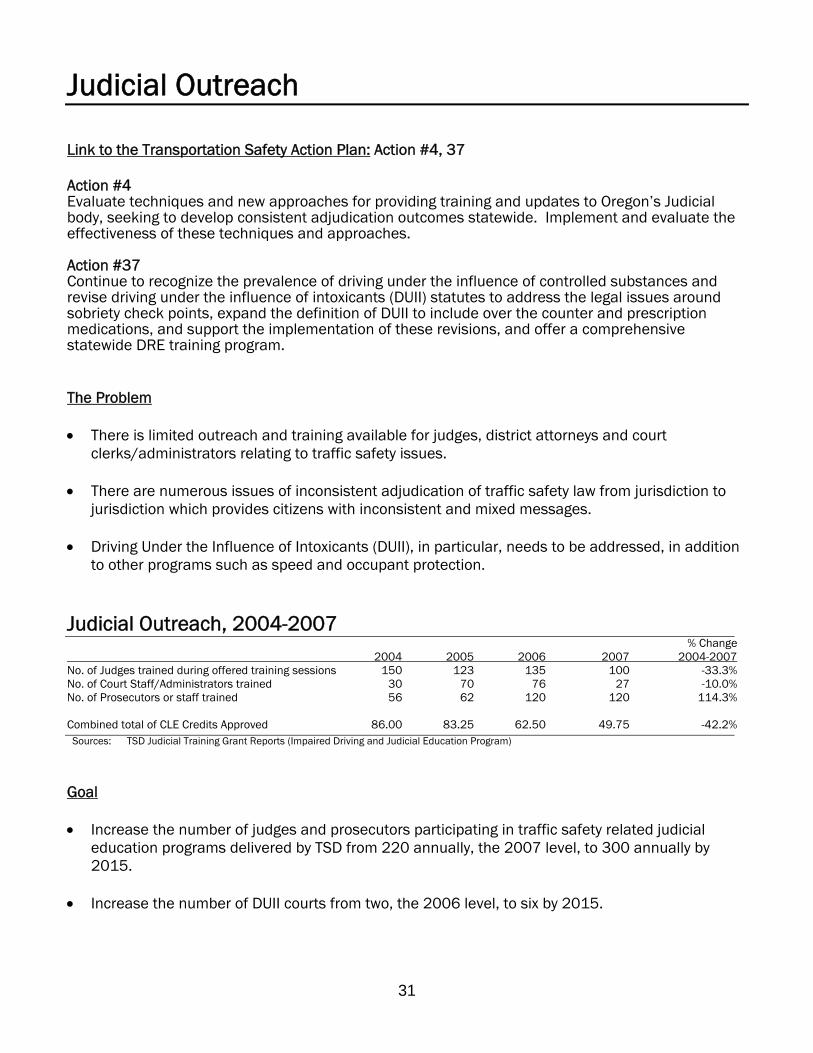
Link to the Transportation Safety Action Plan: Action #4, 37
Action #4 Evaluate techniques and new approaches for providing training and updates to Oregon’s Judicial body, seeking to develop consistent adjudication outcomes statewide. Implement and evaluate the effectiveness of these techniques and approaches.
Action #37 Continue to recognize the prevalence of driving under the influence of controlled substances and revise driving under the influence of intoxicants (DUII) statutes to address the legal issues around sobriety check points, expand the definition of DUII to include over the counter and prescription medications, and support the implementation of these revisions, and offer a comprehensive statewide DRE training program.
The Problem
• There is limited outreach and training available for judges, district attorneys and court clerks/administrators relating to traffic safety issues.
• There are numerous issues of inconsistent adjudication of traffic safety law from jurisdiction to jurisdiction which provides citizens with inconsistent and mixed messages.
• Driving Under the Influence of Intoxicants (DUII), in particular, needs to be addressed, in addition to other programs such as speed and occupant protection.
Judicial Outreach, 2004-2007 % Change
2004 2005 2006 2007 2004-2007 No. of Judges trained during offered training sessions 150 123 135 100 -33.3% No. of Court Staff/Administrators trained 30 70 76 27 -10.0% No. of Prosecutors or staff trained 56 62 120 120 114.3%
Combined total of CLE Credits Approved 86.00 83.25 62.50 49.75 -42.2% Sources: TSD Judicial Training Grant Reports (Impaired Driving and Judicial Education Program)
Goal
• Increase the number of judges and prosecutors participating in traffic safety related judicial education programs delivered by TSD from 220 annually, the 2007 level, to 300 annually by 2015.
• Increase the number of DUII courts from two, the 2006 level, to six by 2015.
31

Performance Measures
• Increase the number of prosecutors or staff participating in education programs from 120, the 2007 level, to 140 by December 31, 2009.
• Increase the number of Court Staff/Administrators receiving traffic safety education from 27 annually, the 2007 level, to 100 annually by December 31, 2009.
• Increase the combined number of approved CLE credits offered by TSD funded educational opportunities from 49.75 annually, the 2007 level, to 100 annually by December 31, 2009.
*CLE is short for MCLE which means Minimum Continuing Legal Education activities. For judges that are active members of the Oregon State Bar, there is a minimum number of continuing legal education credits required to maintain certification as a licensed attorney.
The MCLE rules require that all regular active members complete forty-five (45) hours of approved continuing legal education activities in each three (3) year reporting period. Of those forty-five (45) hours, nine (9) must be on the subject of professional responsibility; five (5) of the nine (9) must be legal ethics credits, one of the nine (9) professional responsibility hours must be on lawyers’ child abuse reporting obligations. Three (3) of the nine (9) professional responsibility hours must be on “elimination of bias,” which is defined as an activity “directly related to the practice of law and designed to educate attorneys to identify and eliminate from the legal profession and from the practice of law biases against persons because of race, gender, economic status, creed, color, religion, national origin, disability, age or sexual orientation.” MCLE Rule 3.2 and 5.5. http://www.osbar.org/_docs/rulesregs/mclerules.pdf.
Strategies
• Coordinate and deliver an annual Traffic Safety Educational Conference to Oregon Judges. Invite some court administrators to attend.
• Participate as a member of the Chief Justice Advisory Committee on Local Courts. Staff the Sub Committee on Court Technology, Judicial Education and Chair the Legislative Sub Committee as appointed by order the Supreme Court Chief Justice Order # 07-012 continuing through September 10, 2009.
• Participate and/or assist in providing additional training opportunities to Judges, District Attorneys, City Prosecutors and Court Administrators in needed traffic safety related topics.
• Provide one DUII multi-disciplinary cross functional training for prosecutors, judges, law enforcement, parole and probation officers, as well as OLCC and DMV staff to enhance adjudication of the crime of DUII.
• Provide two DUII related classes: “Protecting Lives/Saving Futures” for prosecutor and law enforcement teams, and the “Prosecuting the Drugged Driver” class for prosecutors.
• Support a statewide DUII prosecutor (TSRP) to assure consistency in DUII court case law.
32

Motorcycle Safety
Link to the Transportation Safety Action Plan: Action #9
Action #9 Make motorcycle rider education mandatory to age 21 and fund the increased cost by raising the motorcycle endorsement fee from $7.00 to $10.00. By 2012, extend requirement to all persons seeking their first motorcycle endorsement. (Mandatory rider education for riders under 21 became law in 1997. The endorsement fee was increased to $14.00 by law in 1997.)
The Problem
• Fatal motorcycle crashes represented 11.7 percent of the fatal crashes in 2007 while only representing 2.8 percent of the total vehicles registered in 2007.
• Alcohol was involved in 41.2 percent of motorcycle fatalities in 2007.
• Non-endorsed motorcyclists were involved in 35.4 percent of motorcycle fatalities in 2007.
• Speed is over-represented in fatal crashes. Fourteen of 51 in 2007 occurred on corners where the motorcyclist lost control and was unable to make it safely around the corner. Thirteen crashes in 2007 were caused by motorcyclists traveling too fast for conditions.
• The average age of the fatally involved rider remained at 43 in 2007.
• Non-DOT motorcycle helmets are allowed by definition under ORS 801.366. Usage of these non- DOT helmets by motorcyclists endangers the health of the wearer in a motorcycle crash. The 2007 observational helmet use survey reflected a two percent increase in their usage from 2006.
Motorcycles on Oregon Highways, 2004-2007 99-03 % Change
Average 2004 2005 2006 2007 2004-2007 Fatal Crashes
Number 32.2 34 47 43 48 41.2% Percent of fatal crashes 7.9% 8.8% 10.6% 10.3% 11.7% 32.7% Number of motorcyclists killed 32.2 37 47 45 51 37.8%
Fatalities Percent alcohol-involved fatalities 43.1% 31.8% 37.5% 40.9% 41.2% 29.6% Percent non-endorsed fatalities 17.0% 13.5% 33.3% 14.0% 35.4% 162.3%
Injury Crashes Number 356 455 535 622 601 32.1% Percent of injury crashes 1.9% 2.5% 2.8% 3.1% 3.2% 30.5%
33
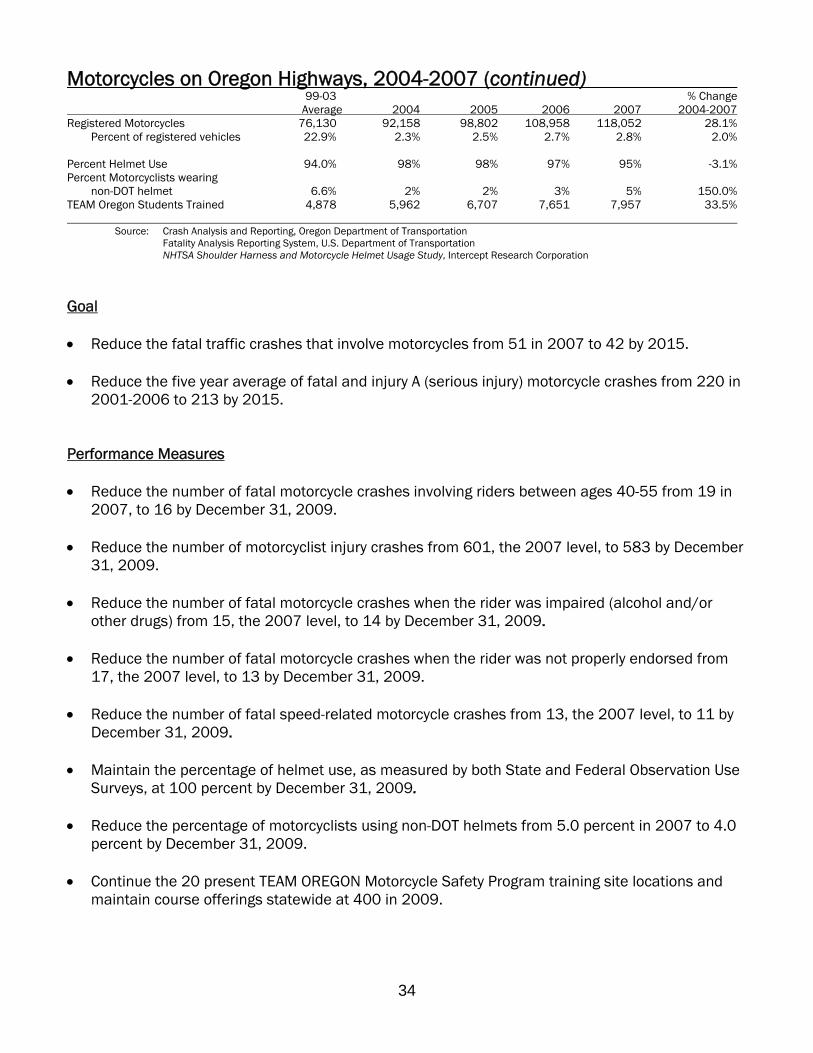
Motorcycles on Oregon Highways, 2004-2007 (continued)99-03 % Change
Average 2004 2005 2006 2007 2004-2007 Registered Motorcycles 76,130 92,158 98,802 108,958 118,052 28.1%
Percent of registered vehicles 22.9% 2.3% 2.5% 2.7% 2.8% 2.0%
Percent Helmet Use 94.0% 98% 98% 97% 95% -3.1% Percent Motorcyclists wearing
non-DOT helmet 6.6% 2% 2% 3% 5% 150.0% TEAM Oregon Students Trained 4,878 5,962 6,707 7,651 7,957 33.5%
Source: Crash Analysis and Reporting, Oregon Department of Transportation Fatality Analysis Reporting System, U.S. Department of Transportation NHTSA Shoulder Harness and Motorcycle Helmet Usage Study, Intercept Research Corporation
Goal
• Reduce the fatal traffic crashes that involve motorcycles from 51 in 2007 to 42 by 2015.
• Reduce the five year average of fatal and injury A (serious injury) motorcycle crashes from 220 in 2001-2006 to 213 by 2015.
Performance Measures
• Reduce the number of fatal motorcycle crashes involving riders between ages 40-55 from 19 in 2007, to 16 by December 31, 2009.
• Reduce the number of motorcyclist injury crashes from 601, the 2007 level, to 583 by December 31, 2009.
• Reduce the number of fatal motorcycle crashes when the rider was impaired (alcohol and/or other drugs) from 15, the 2007 level, to 14 by December 31, 2009.
• Reduce the number of fatal motorcycle crashes when the rider was not properly endorsed from 17, the 2007 level, to 13 by December 31, 2009.
• Reduce the number of fatal speed-related motorcycle crashes from 13, the 2007 level, to 11 by December 31, 2009.
• Maintain the percentage of helmet use, as measured by both State and Federal Observation Use Surveys, at 100 percent by December 31, 2009.
• Reduce the percentage of motorcyclists using non-DOT helmets from 5.0 percent in 2007 to 4.0 percent by December 31, 2009.
• Continue the 20 present TEAM OREGON Motorcycle Safety Program training site locations and maintain course offerings statewide at 400 in 2009.
34
Strategies
• Continue the TEAM OREGON Motorcycle Safety Program beginning, intermediate and rider skills practice training courses at 20 different locations throughout the state.
• Continue the motorcycle campaigns in the Transportation Safety Division’s Public Information and Education program, focusing on separating drinking and riding, correct licensing, proper protective riding gear, speed, and rider training for all riders, including riders over the age of 40 that are over represented in fatal and injury crashes.
• Ensure courses are located within 50 miles of 97 percent of Oregon’s motorcycle population and courses are offered within a maximum of 60 days at all course locations, with most locations offering at least one course per month. Site locations in communities with higher populations offer anywhere from two to twelve courses per month.
• Encourage all motorcycle riders to get TEAM OREGON training and be properly endorsed. Disseminate information using public information and education campaigns and public outreach by the Governor’s Advisory Committee on Motorcycle Safety.
35

36

Occupant Protection
Link to the Transportation Safety Action Plan: Action #50
Action #50 Continue public education efforts aimed at increasing proper use of safety belts and child restraint systems.
The Problem
• Non-use of Restraints: The 2007 Oregon observed use surveys indicate three percent of passenger car occupants, six percent of pickup truck drivers and twelve percent of sports car drivers did not use restraints. Thirty-eight percent of children aged five to eight were not riding in age-appropriate restraint systems. During 2006, Oregon crash reports indicate forty-three percent of motor vehicle occupant fatalities were unrestrained.
• Improper Use of Safety Belts: Some adult occupants inadvertently compromise the effectiveness of their belt systems and put themselves or other occupants at severe risk of unnecessary injury by using safety belts improperly: placing the shoulder belt under the arm or behind the back, securing more than one passenger in a single belt system, using only the automatic shoulder portion of a two-part belt system (where the lap belt portion is manual), or placing a child into a belt system before it fits correctly.
• Improper Use of Child Restraint Systems: Drivers are confused by the multitude of child restraint models, changing laws and changing “best practice” recommendations. Children must graduate through a series of different types of restraints until they are large enough to fit in an adult lap/shoulder belt.
• Affordability of Child Restraint Systems: Low income families and caregivers may have difficulty affording the purchase of child safety seats or booster seats, particularly when they need to accommodate multiple children. This leads to non-use or to reuse of second-hand seats which may be unsafe for various reasons.
Observed Use Survey Results, 2004 - 2007 99-03 % Change
Average 2004 2005 2006 2007 2004-2007
Total Occupant Use 89.8% 94% 96% 97% 97% 3.2%
Safety Belt Use Driver 89.4% 94% 96% 96% 97% 3.2% All passengers 4 years and older 88.8% 92% 95% 96% 96% 4.3% Passengers 9 – 15 years of age N/A N/A N/A 98% 96% N/A
37
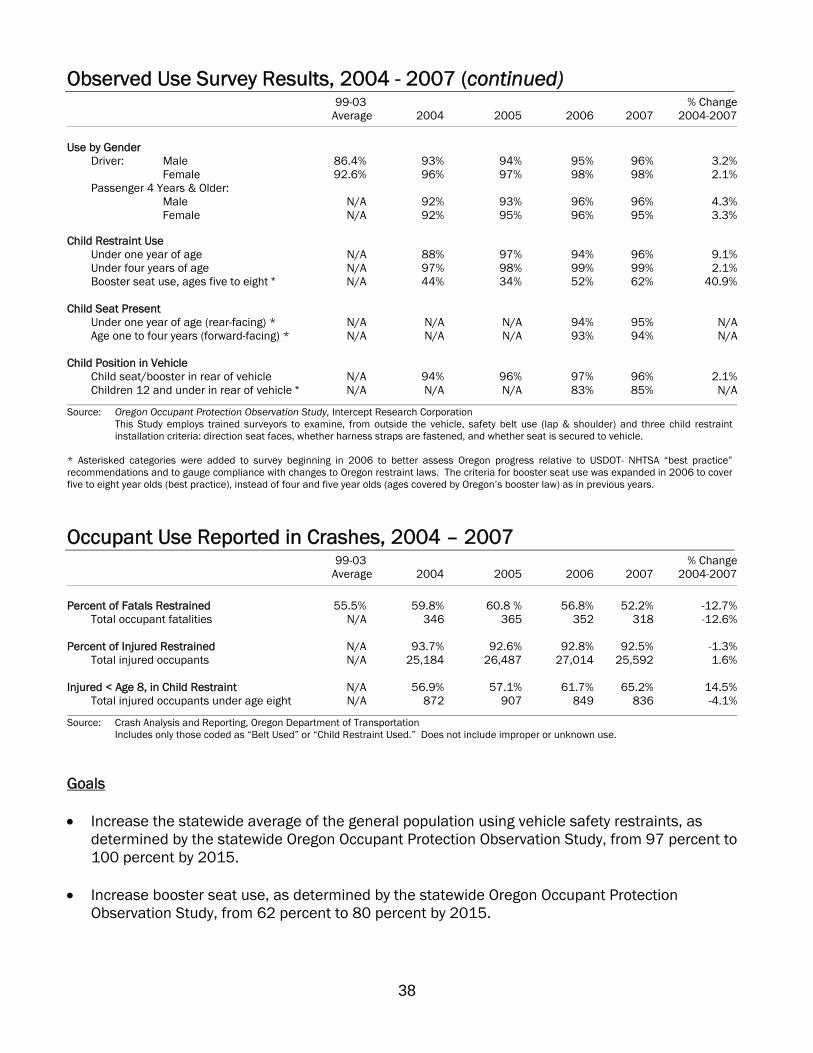
Observed Use Survey Results, 2004 - 2007 (continued) 99-03 % Change
Average 2004 2005 2006 2007 2004-2007
Use by Gender Driver: Male 86.4% 93% 94% 95% 96% 3.2%
Female 92.6% 96% 97% 98% 98% 2.1% Passenger 4 Years & Older:
Male N/A 92% 93% 96% 96% 4.3% Female N/A 92% 95% 96% 95% 3.3%
Child Restraint Use Under one year of age N/A 88% 97% 94% 96% 9.1% Under four years of age N/A 97% 98% 99% 99% 2.1% Booster seat use, ages five to eight * N/A 44% 34% 52% 62% 40.9%
Child Seat Present Under one year of age (rear-facing) * N/A N/A N/A 94% 95% N/A Age one to four years (forward-facing) * N/A N/A N/A 93% 94% N/A
Child Position in Vehicle Child seat/booster in rear of vehicle N/A 94% 96% 97% 96% 2.1% Children 12 and under in rear of vehicle * N/A N/A N/A 83% 85% N/A
Source: Oregon Occupant Protection Observation Study, Intercept Research Corporation This Study employs trained surveyors to examine, from outside the vehicle, safety belt use (lap & shoulder) and three child restraint installation criteria: direction seat faces, whether harness straps are fastened, and whether seat is secured to vehicle.
* Asterisked categories were added to survey beginning in 2006 to better assess Oregon progress relative to USDOT- NHTSA “best practice” recommendations and to gauge compliance with changes to Oregon restraint laws. The criteria for booster seat use was expanded in 2006 to cover five to eight year olds (best practice), instead of four and five year olds (ages covered by Oregon’s booster law) as in previous years.
Occupant Use Reported in Crashes, 2004 – 2007 99-03 % Change
Average 2004 2005 2006 2007 2004-2007
Percent of Fatals Restrained 55.5% 59.8% 60.8 % 56.8% 52.2% -12.7% Total occupant fatalities N/A 346 365 352 318 -12.6%
Percent of Injured Restrained N/A 93.7% 92.6% 92.8% 92.5% -1.3% Total injured occupants N/A 25,184 26,487 27,014 25,592 1.6%
Injured < Age 8, in Child Restraint N/A 56.9% 57.1% 61.7% 65.2% 14.5% Total injured occupants under age eight N/A 872 907 849 836 -4.1%
Source: Crash Analysis and Reporting, Oregon Department of Transportation Includes only those coded as “Belt Used” or “Child Restraint Used.” Does not include improper or unknown use.
Goals
• Increase the statewide average of the general population using vehicle safety restraints, as determined by the statewide Oregon Occupant Protection Observation Study, from 97 percent to 100 percent by 2015.
• Increase booster seat use, as determined by the statewide Oregon Occupant Protection Observation Study, from 62 percent to 80 percent by 2015.
38
Performance Measures
• Increase the percentage of children under one year of age who are being transported in vehicles equipped with child safety seats from 96 percent to 97 percent by December 31, 2009.
• Increase the percentage of vehicles equipped with child safety seats, if transporting children ages one to four years old, from 94 percent to 95 percent by December 31, 2009.
• Increase the percentage of vehicles equipped with booster seats, if transporting children ages five to eight years old, from 62 percent to 65 percent by December 31, 2009.
• Increase the percentage of children aged twelve and under, who are being transported in rear seating positions, from 85 percent to 87 percent by December 31, 2009.
Strategies
• Continue public education efforts aimed at educating the public regarding Oregon law and increasing proper and consistent use of safety belts and child restraint systems.
• Expand outreach to “new” audiences.
• Provide funding for law enforcement agencies to conduct overtime enforcement of safety belt/child restraint laws and to heighten enforcement visibility through news media contacts, safety belt/child seat inspections, and other promotional activities.
• Provide funding for statewide coordination of child passenger safety technician training, technician certification, and child seat inspections.
• Promote correct use of child restraint systems among the general public, parents, child care providers, health professionals, emergency medical personnel, law enforcement officers, and the court system.
• Maintain statewide pool of Certified Child Passenger Safety Technicians (CPSTs) who can routinely provide child safety seat check-ups to meet demand within their local communities.
• Subsidize purchase of child safety seats for no or low-income families.
• Target marketing and enforcement campaigns to low-use rate populations.
• Support efforts to keep Oregon restraint laws compatible with national “best practice” recommendations.
39

40
Pedestrian Safety
Link to the Transportation Safety Action Plan: Action #65, 67
Action #65 Increase emphasis on programs that will encourage pedestrian travel and improve pedestrian safety. The Pedestrian Safety program will work to accomplish this action by expanding public education efforts on pedestrian and driver safety awareness and responsibilities through media messages and publications.
Encourage more aggressive enforcement of pedestrian traffic laws, particularly near schools, parks and other pedestrian intensive locations. The Pedestrian Safety programs works in tandem with community interest groups and law enforcement to provide resources and education to conduct pedestrian safety operations throughout the state of Oregon.
Action #67 Increase emphasis on programs that will encourage walking and other alternative mode travel and improve safety for these modes. To accomplish this action, we will continue to work with community organizations to promote walking as a healthy commuting option and to educate pedestrians and drivers about road safety.
The Problem
• In 2006, 742 pedestrians were involved in fatal or injury motor vehicle crashes, compared to 674 in 2005.
• In 2006, 382 pedestrians were killed or injured at intersections or in a crosswalk, compared to 332 in 2005.
• In 2006, 46 percent of all pedestrian crashes occurred at dusk, dawn or in low light conditions, compared to 44 percent in 2005.
• In 2006, 68 pedestrians aged 65+ were killed or injured, compared to 53 in 2005.
• In 2006, 103 pedestrians (15 percent of total) aged 0-14 were killed or injured, compared to 112 (17 percent of total) in 2005.
41

Pedestrians in Motor Vehicle Crashes on Oregon Roadways, 2004-2007 99-03 % Change
Average 2004 2005 2006 2007 2004-2007 Injuries Number 606 552 625 654 552 0.0%
Percent of total Oregon injuries 2.2% 2.0% 2.2% 2.2% 2.0% -1.8% Number injured Xing in crosswalk or intersection 322 287 332 369 299 4.2% Percent Xing in crosswalk or intersection 53.1% 52.0% 53.1% 56.4% 54.2 4.2%
Fatalities Number 51 45 49 48 50 11.1% Percent of total Oregon fatalities 11.1% 9.9% 10.1% 10.0% 11.0% 11.4% Number of fatalities Xing in crosswalk or intersection 12 10 15 13 16 60.0%
Percent Xing in crosswalk or intersection 24.0% 20.4% 30.6% 27.1% 32.0% 56.8% Source: Crash Analysis and Reporting, Oregon Department of Transportation
Fatality Analysis Reporting System, U.S. Department of Transportation
Goals
• To reduce the number of pedestrian fatalities from the 2007 level of 50 to 38, a 3 percent reduction per year, by 2015.
• To reduce the number of pedestrian injuries from 600, the five-year average from 2003 to 2007, to 456, a 3 percent reduction per year, by 2015.
Performance Measures
• Reduce the number of pedestrian fatalities from the 2007 level of 50 to 47, a 6 percent reduction by December 31, 2009.
• Reduce the number of pedestrian injuries from 600, the five-year average from 2003-2007, to 564, a 6 percent reduction, or less by December 31, 2009.
• Reduce the number of pedestrians killed crossing in crosswalk or intersection to 10 or less, a reduction of 20 percent from the average number of fatalities of 13 between 2003 and 2007, by December 31, 2009.
• Reduce the number of pedestrians injured crossing in crosswalk or intersection from the 2003-2007 average of 324 to 305 or less, a decrease of 6 percent, by December 31, 2009.
Strategies
• Expand public awareness of Oregon pedestrian right-of-way laws through public information and education campaign.
• Conduct pedestrian safety and traffic law training workshops to Oregon law enforcement personnel.
• Collaborate with local and community partners to enhance and reinforce educational efforts.
42

• Continue to collaborate with Transportation Safety Division program managers in combining efforts around pedestrian safety and other traffic safety issues like speed, impairment, youth and elderly representation.
• Continue to support and provide efforts to increase driver, pedestrian and parent awareness of safety issues, particularly being seen in low-light conditions.
43

44
Police Traffic Services
Link to the Transportation Safety Action Plan: Action #1, 5
Action #1 Develop a Traffic Law Enforcement Strategic Plan which addresses the needs and specialties of the Oregon State Police, County Sheriff and City Police Departments. The plan should be developed with assistance from a high level, broadly based Task Force that includes representatives of all types of enforcement agencies, as well as non-enforcement agencies impacted by enforcement activities.
Action #5 Continue efforts to establish processes to train enforcement personnel, deputy district attorneys, judges, Driver and Motor Vehicle Services personnel, treatment providers, corrections personnel and others. An annual training program could include information about changes in laws and procedures, help increase the stature of traffic enforcement, and gain support for implementing changes.
The Problem
• The need for increased enforcement resources is not generally recognized outside the law enforcement community.
• Oregon is well below the national rate of 2.2 officers per 1,000 population with 1.43 officers per 1,000 population in 2007.
• There is a need for increased training for police officers in the use of speed measurement equipment (radar / lidar), Crash Investigation Training, distance between cars technology training and traffic law changes from the recent legislative sessions.
• Due to retirements and promotions, there is a new group of supervisors in law enforcement, therefore training on managing or supervising traffic units would be timely.
• There is a need to increase the available training to certified motorcycle officers in Oregon.
• Decreasing budgets and inadequate personnel prevent most enforcement agencies from responding to crashes that are non-injury and non-blocking. Approximately 60 percent of these crashes are reported only by the parties involved and provide minimum data that can be used to assess crash problems.
• Currently, the Oregon State Police have received budget authority for 100 new troopers yet this will not allow for 24 hour coverage for all stations.
• Currently, the Oregon State Police have reduced their patrol and crime lab positions due to budget cuts and the failure of Ballot Measure 28 and 30. The sworn-trooper positions in the patrol division have been reduced to 329 from 464 in less than one year. The 2007-2009 budget includes 100 new trooper FTEs.
45

• Many county and city police departments lack the resources necessary to dedicate officers to traffic teams thus would benefit from additional enforcement training and overtime grants.
Police Traffic Services, 2004-2007 99-03 % Change
Average 2004 2005 2006 2007 2004-2007
Total Fatal Traffic Crashes 403 388 443 418 411 5.9% Total Injury Crashes 18,553 18,279 19,447 19,778 18,501 1.2% Total Fatalities 460 456 487 478 455 -0.2% Total Injuries 27,853 27,346 29,023 29,597 27,850 1.8%
Top 10 Driver Errors in Total Crashes: Failed to Avoid stopped or parked
vehicle ahead other than school bus 14,540 13,521 13,941 13,677 12,786 -5.4% Did not have right-of-way 7,759 7,743 9,224 8,974 8,194 5.8% Driving too fast for conditions 6,196 7,484 7,701 6,948 6,759 -9.7% Ran off Road N/A 4,495 5,601 6,438 6,570 46.2% Failed to Maintain Lane N/A 1,972 3,840 3,728 5,236 165.5% Inattention N/A 2,730 2,313 2,663 2,276 -16.6% Left turn in front of oncoming traffic 2,752 2,437 2,059 2,204 1,994 -18.2% Disregarded traffic signal 2,274 1,863 1,994 2,075 1,989 6.8% Failed to decrease speed for slower
moving vehicle 1,104 954 1,517 1,648 1,636 71.5% Following too closely N/A 991 1,086 1,189 1,383 39.6%
Number of Speed Related Convictions 210,972 167,183 165,792 171,229 176,259 5.4% No. of Law Enforcement Officers 5,428 5,356 5,392 5,373 5,346 -0.2% Officers per 1,000 Population 1.57 1.50 1.48 1.46 1.43 -4.5% Percent Who Say More Enforcement Needed 17.2% 15% 18% 20% 24% 60.0%
NOTE: The large reduction of “Top 10 Driver Errors” is due to a change in the way the data is now disseminated. Source: Crash Analysis and Reporting, Oregon Department of Transportation
Fatality Analysis Reporting System, U.S. Department of Transportation Department of Public Safety Standards and Training Driver and Motor Vehicle Services, Oregon Department of Transportation Oregon State Police Forensic Services Transportation Safety Survey, Executive Summary; Intercept Research Corporation
Goals
• Improve the enforcement of traffic safety laws and regulations intended to reduce death, injury and property damage by providing law enforcement training and education in key traffic safety areas as identified in top ten driver error codes for Oregon crashes in addition to fatal and injury crash data.
• Train at least 300 police officers annually (5 percent of the total police population) in Speed Enforcement, Crash Investigations, Police Supervisory Courses, Distance Between Cars Technology and provide support to enhance Police Motorcycle training in Oregon by 2015.
• Provide expertise and assistance to the Speed Management Task Force.
46

Performance Measures
• Provide radar and lidar training to 50 police officers statewide through online courses in order to increase the number of police officers who can utilize speed equipment to enforce speeding laws in Oregon by December 31, 2009.
• Provide training and certification to at least 100 police officers in distance between cars technology to assist in reducing the incidence of following too close crashes by December 31, 2009.
• Coordinate delivery of the Police Supervisors Conference and train 300 officers prior to December 31, 2009.
• Provide 3-day regional crash investigations training to at least 100 police officers by December 31, 2009.
• Provide at least 20 scholarships to Police Motor Officer training opportunities by December 31, 2009.
Strategies
• Send out two statewide announcements offering the online lidar and radar training.
• Announce and coordinate Distance Between Cars Technology Certification. Provide certification to 50 police officers.
• Begin planning process for 2009 Police Supervisors Conference.
• Participate as requested on the Speed Task Force.
• Provide one 3-day regional crash investigations training course to at least 40 police.
• Provide scholarship assistance to at least 10 Motor officers.
47

48

Region 1 Overview
Region 1 oversees the public’s transportation investments in Clackamas, Columbia, Hood River, Multnomah, Washington counties and portions of Tillamook and Clatsop. Motorist, truckers, buses, and bicyclists travel more than 18 million miles on Region 1 highway every day. We watch over:
• 753 miles of highway • 10 cities, three counties and one • 87 miles of bikeways unincorporated area have established local • 107 miles of sidewalks traffic safety committees or similar action • 584 bridges groups.
• 7,363 traffic signals • There are two currently active safety corridors
• and two truck safety corridors within the Over 3,500 major signs Region. • Thousands of smaller signs, lights, ramp
meters, variable signs, etc.
Region 1
Link to the Transportation Safety Action Plan: Action #31
Action #31 Continue to provide a Transportation Safety Specialist position in each of the Oregon Department of Transportation regions, providing a safety perspective to all operations as well as direct communication between the Oregon Department of Transportation and local transportation safety agencies and programs.
The Problem
• There is a lack of consistent integration between Transportation Safety programs and other Region level work including scoping, prospectus development, project design, public transportation, corridor planning, data collection and actual contracting / construction.
• The current “Top 10% List” for hazardous crash locations has about 3,000 qualifying entries - too many to guarantee even a cursory look at each site. Many locations in the top 10 percent are not addressable without major investments ($5-10 million) and are therefore beyond the scope of ODOT safety funds in all categories. Region 1 has over half of all top 10 percent locations in the state.
• Media attention and political interest in specific locations is often not related to the statistical “size” of the crash problem at that location, making it more difficult to design and find funds for a solution acceptable to the community of interest. We need better communication and education for decision makers so we can achieve common goals among highway, traffic, community and political leaders.
49

Region 1, Transportation Safety Related Information
Statewide Fatalities vs. Region 1 % Change
2004 2005 2006 2007 2004-2007 Clackamas County 23 41 28 32 39.1% Columbia County 4 9 8 13 225.0% Hood River County 7 3 5 5 -28.6% Multnomah County 46 40 41 51 10.9% Washington County 31 30 37 27 -12.9% Region 1 Total 111 123 119 128 15.3% Statewide Fatalities 456 487 478 455 -0.2%
Region 1 Fatalities Percent of State 24.34% 25.26% 24.90% 28.13% 15.6% Region 1 Fatalities per 100,000 Population 6.99 7.63 7.27 7.70 10.2%
Statewide Speed-Related Fatalities vs. Region 1 % Change
2004 2005 2006 2007 2004-2007 Clackamas County 8 17 14 22 175.0% Columbia County 3 5 2 7 133.3% Hood River County 7 2 1 5 -28.6% Multnomah County 29 22 20 27 -6.9% Washington County 19 13 19 11 -42.1% Region 1 Speed Involved Fatalities 66 59 56 72 9.1% Statewide Total Speed Involved Fatalities 264 262 227 216 -18.2%
Speed-Involved Fatalities Percent of Region 1 59.46% 47.97% 47.46% 56.25% -5.4% Speed-Involved Fatalities Percent of State 25.00% 22.52% 24.67% 33.33% 33.3% Statewide Speed-Involved % Total 57.89% 53.80% 47.49% 47.47 -18.0%
Statewide Alcohol-Involved Fatalities vs. Region 1 % Change
2004 2005 2006 2007 2004-2007 Clackamas County 8 16 13 8 0.0% Columbia County 3 2 1 8 166.7% Hood River County 6 1 1 1 -83.3% Multnomah County 23 16 14 21 -8.7% Washington County 10 15 17 9 -10.0% Region 1 Alcohol-Involved Fatalities 50 50 46 47 -6.0% Statewide Total Alcohol-Involved Fatalities 187 162 179 181 -3.2%
Alcohol-Involved Fatalities Percent of Region 1 45.05% 40.65% 38.66% 36.72% -18.5% Alcohol-Involved Fatalities Percent of State 26.74% 30.86% 25.70% 25.97% -2.9% Statewide Fatalities Alcohol-Involved % Total 41.01% 33.26% 37.45% 39.78% -3.0%
2007 Region 1, County Fatal and Injury Crash Data Alcohol Involved Fatal and Injury F&I Crashes Nighttime Fatal and
County Population Fatalities Fatalities Crashes /1,000 Pop. Injury Crashes Clackamas County 372,270 32 8 1,559 4.19 217 Columbia County 47,565 13 8 173 3.64 31 Hood River County 21,470 5 1 96 4.47 10 Multnomah County 710,025 51 21 4,309 6.07 650 Washington County 511,075 27 9 2,333 4.56 312 Region 1 Total 1,662,405 128 47 8,470 5.10 1,220 Statewide Total 3,745,455 455 181 18,912 5.05 2,822 Percent of State 44.38% 28.13% 25.97% 44.79% N/A 43.23%
Sources: Crash Analysis and Reporting, Oregon Department of Transportation Fatality Analysis Reporting System, U.S. Department of Transportation Center for Population Research and Census, School of Urban and Public Affairs, Portland State University
50
Goal
• To decrease the number of annual fatalities in Region 1 from the 2004-2007 average of 120 to 88 by 2015.
• To decrease the number of annual speed related fatalities in Region 1 from the 2004-2007 average of 63 fatalities to 42 or less by 2015.
• To decrease the number of annual alcohol and drug-related fatalities in Region 1 from the 2003-2006 average of 48 to 32 by 2015.
Performance Measures
• In cooperation with local agencies evaluate and prioritize 20 sites from the state’s “Top 10% Sites” list that could benefit from targeted enforcement and/or education campaigns by December 31, 2009. Share that information with the appropriate state or local enforcement and engineering agencies.
• Evaluate 100 percent of the 3,100 "Top 10% Sites" for possible safety projects within the limits of the various ODOT safety funds (STIP Safety, Safety Improvement Program, SIP, HEP, or the new federal programs which may replace these funding sources) using 2005-2007 data by December 31, 2009.
• Identify and assist in development of at least four Local Traffic Safety projects based on locally identified priorities. Projects, to be completed by December 31, 2009. Projects may target but will not be not limited to:
• Speed and/or alcohol traffic law enforcement;
• Multi-modal safety, including pedestrian, bicycle and vehicles sharing the road; and
• Cooperative projects among several adjoining jurisdictions including government and media partners.
• Communicate with and serve as a resource for 20 unique events offered by the 10 currently established local traffic safety committees, either in person or by utilizing other ODOT staff, by December 31, 2009.
• Provide at least two training sessions or other opportunities to ODOT Project Leaders, city or county Traffic Managers and other state or local “traffic partners” to provide greater access to and understanding of Transportation Safety programs by December 31, 2009.
Strategies
• Identify high crash locations (using the Safety Priority Index System, Hazard Elimination Program and reports from ODOT Districts). Nominate projects where spending non-TSD funds or limited TSD funds will be most effective in reducing crashes and injuries. Break out crash information by type if possible to improve project planning. Using experienced traffic investigators, manage
51

regional analysis of over 3,000 "Top 10%" locations. Become familiar with new federal funding categories to see which may be applicable to these high-crash locations.
• Identify the top sites from the list above which could benefit from targeted enforcement and/or education campaigns as opposed to construction fixes. Give priority to those areas where speed, alcohol or other drug use may be a primary factor. Give priority to innovative efforts to target and stage directed patrols. Promote and reward efforts to use educational programs to boost or replace enforcement efforts (when possible).
• Identify and assist in development of at least four Local Traffic Safety projects. Provide mini-grants or loaner equipment (such as radar) to local agencies to address identified safety problems. Provide means for these projects to access and develop media relationships with regional ODOT staff and local media. Promote projects which target one or more of:
• Formation and vitalization of local traffic safety committees;
• Multi-modal safety, including pedestrian, bicycle and vehicles sharing the road; and
• Cooperative projects among several adjoining jurisdictions.
• Identify and develop partnerships with at least four governmental, professional or volunteer organizations. These partnerships will share skills, services, or other non-monetary resources in promoting or implementing transportation safety efforts. These efforts should include media support and could be used to complement Local Traffic Safety projects or other regional safety efforts.
• Bring ODOT non-safety professional staff, such as Project Leaders and employees in other disciplines to TSD conference events and training. Provide to prospective attendees better information on training elements, class leaders and types of training sessions available.
52

The Northwest Region includes: • More than 13,000 square miles and a • 99 local government partners (cities,
population of more than one million Oregonians. counties, MPO’s, COG’s and PACT’s; more • Five of Oregon’s 10-largest population centers. than any other region). • 3,718 miles of state highway, with 868 bridges • Three Area Commissions on
and four tunnels. Transportation (ACT’s). • 6,701,520,000 annual vehicle miles traveled • Six formally established Safety Corridors.
region-wide. • Approximately 20 city, 2 county official and • 18,360,000 daily vehicle miles traveled region- many unofficial Local Traffic Safety
wide. Committees with several other similarly • Four maintenance districts. related committees. • 860 miles of railroad. • Six SAFE KIDS Chapters. • Seven deep-water ports. • Approximately 60 School Districts.
The Problem
• Lack of full awareness and incorporation of Transportation Safety Division programs and topic areas into ODOT Region 2 and its communities.
• Need for identification of changing local traffic safety committees, safe communities or similarly functioning transportation safety advocacy groups.
• Need for more representation and availability of the Region Transportation Safety Coordinator (RTSC) within the Region.
• High frequency of policy makers, press, and community perceptions involved with many crash locations thus focus on the highest crash locations can be difficult.
Region 2
Link to the Transportation Safety Action Plan: Action #31
Action #31 Continue to provide a Transportation Safety Specialist position in each of the Oregon Department of Transportation Regions, providing a safety perspective to all operations as well as direct communication between the Oregon Department of Transportation and local transportation safety agencies and programs.
Region 2 Overview
ODOT’s Northwest Region 2 provides transportation facilities and services for one-third of Oregon’s population. Region 2 is responsible for planning, developing, constructing, operating, and maintaining the transportation system in Benton, Clatsop, Lane, Lincoln, Linn, Marion, Polk, Tillamook and Yamhill Counties, as well as portions of Clackamas, Washington, Klamath, and Jefferson Counties. More than one million people live in the Region 2 area. Region 2 is responsible for 3,718 miles of state highways. There are four Maintenance Districts and four Area Management Offices with approximately 485 employees.
53

Region 2, Transportation Safety Related Information
Statewide Fatalities vs. Region 2 % Change
2004 2005 2006 2007 2004-2007 Benton County 5 4 6 7 40.0% Clatsop County 9 12 8 10 11.1% Lane County 37 35 50 43 16.2% Lincoln County 5 11 10 9 80.0% Linn County 18 27 31 28 55.6% Marion County 37 34 28 31 -16.2% Polk County 11 10 9 9 -18.2% Tillamook County 12 12 4 4 -66.7% Yamhill County 7 19 16 13 85.7% Region 2 Total 141 164 162 154 9.2% Statewide Fatalities 456 487 478 455 -0.2%
Region 2 Fatalities Percent of State 30.92% 33.68% 33.89% 33.85% 9.5% Region 2 Fatalities per 100,000 Population 12.58 14.64 14.67 13.78 9.5%
Statewide Speed Involved Fatalities vs. Region 2 % Change
2004 2005 2006 2007 2004-2007 Benton County 2 3 3 4 100.0% Clatsop County 5 5 3 2 -60.0% Lane County 21 16 22 11 -47.6% Lincoln County 3 8 5 4 33.3% Linn County 11 13 17 16 45.5% Marion County 23 26 22 18 -21.7% Polk County 10 5 2 1 -90.0% Tillamook County 8 8 1 2 -75.0% Yamhill County 2 12 6 10 400.0% Region 2 Speed-Involved Fatalities 85 96 81 68 -20.0% Statewide Total Fatalities Speed-Involved 264 262 227 216 -18.2%
Speed-Involved Fatalities Percent of Region 2 60.28% 58.54% 50.00% 44.16% -26.8% Speed-Involved Fatalities Percent of State 32.20% 36.64% 35.68% 31.48% -2.2% Statewide Fatalities Speed-Involved % Total 57.89% 53.80% 47.49% 47.47% -18.0%
Statewide Alcohol Involved Fatalities vs. Region 2 % Change
2004 2005 2006 2007 2004-2007 Benton County 2 2 2 2 0.0% Clatsop County 2 4 2 5 150.0% Lane County 9 12 18 15 66.7% Lincoln County 1 4 4 4 300.0% Linn County 8 6 9 10 25.0% Marion County 20 12 9 14 -30.0% Polk County 5 4 4 1 -80.0% Tillamook County 5 3 1 4 -20.0% Yamhill County 1 2 3 6 500.0% Region 2 Alcohol-Involved Fatalities 53 49 52 61 15.1% Statewide Total Fatalities Alcohol-Involved 187 162 179 181 -3.2%
Alcohol-Involved Fatalities Percent of Region 2 37.60% 29.88% 32.10% 39.61% 5.4% Alcohol-Involved Fatalities Percent of State 28.34% 30.25% 29.05% 33.70% 18.9% Statewide Fatalities Alcohol-Involved % Total 41.01% 33.20% 37.53% 39.78% -3.0%
54

2007 Region 2, County Fatal and Injury Crash Data Alcohol Involved Fatal and Injury F&I Crashes Nighttime Fatal and
County Population Fatalities Fatalities Crashes /1,000 Pop. Injury Crashes Benton County 85,300 7 2 325 3.81 45 Clatsop County 37,440 10 5 230 6.14 24 Lane County 343,140 43 15 1,608 4.69 253 Lincoln County 44,630 9 4 317 7.10 38 Linn County 109,320 28 10 602 5.51 97 Marion County 311,070 31 14 1,668 5.36 248 Polk County 67,505 9 1 322 4.77 60 Tillamook County 25,845 4 4 144 5.57 27 Yamhill County 93,085 13 6 473 5.08 71 Region 2 Total 1,117,335 154 61 5,689 5.09 863 Statewide Total 3,745,455 455 181 18,912 5.05 2,822 Percent of State 29.83% 33.85% 33.70% 30.08% N/A 30.58%
Sources: Crash Analysis and Reporting, Oregon Department of Transportation Fatality Analysis Reporting System, U.S. Department of Transportation Center for Population Research and Census, School of Urban and Public Affairs, Portland State University
Goal
• Decrease the number of region fatalities from 154 in 2007 to 123 by 2015.
• Decrease the number of region fatal and all injury crashes from 5,689 in 2007 to 4,314 by 2015.
• Decrease the number of region speed related fatalities from 68 in 2007 to 62 by 2015.
• Reduce the number of region alcohol-involved fatalities from 61 in 2007 to 40 by 2015.
Performance Measures
• Communicate with, serve as a resource for, and meet with all Region 2 established local traffic safety committees, either in person or by utilizing other ODOT staff, by December 31, 2009.
• Communicate with, serve as a resource for and meet with other local safety advocate groups to increase the presence of our safety messages in the Region 2 area. Will attend a minimum of 24 such meetings a year. This will be accomplished by December 31, 2009.
• Incorporate transportation safety “4-E” approaches (education, engineering, enforcement and emergency medical services) into Region safety project scoping trips, SPIS site investigations, community planning efforts and special projects when and where ever possible by December 31, 2009. Attend one such meeting a month.
• Develop and administer annual Safety Corridor Plans per statewide guidelines for the six Region 2 existing safety corridors by December 31, 2008. Decommission safety corridor(s) if warranted and stakeholder agreement is reached, by December 31, 2009.
55
Strategies
• Continue to provide transportation safety, topic specific, information to the public through public service announcements, on the Region 2 website, and by providing topical information to local transportation safety committees.
• Continue to provide transportation safety education through safety and health fairs as well as by visiting classrooms throughout the Region with topic specific safety education material and presentations.
• Continue to partner with local safety related advocacy groups such as local traffic safety committees, neighborhood association and Safe Kids groups. Will participate in the events of other groups bringing transportation safety topics to the forefront.
• Continue to promote transportation safety issues and the “4-E” approach into Region Safety Project Scoping trips, SPIS site analysis, planning efforts and traffic / community groups. Will also continue to be an active transportation safety advocate among the staff at Region 2.
• Continue to disseminate traffic safety information to all my partners in the Region via e-mail lists where ever possible.
• Continue to work on bringing a multi-cultural approach to educating the citizens of our Region ensuring that information is available in several languages.
• Continue to learn more from our traffic unit and be a part of their team in evaluating project for inclusion of safety issues.
• Continue to learn more about specific safety programs within Transportation Safety Division and how we can partner to further the issues in each program area.
• Be available as a resource to anyone in the Region 2 area interested in promoting transportation safety within their group and/or community.
56
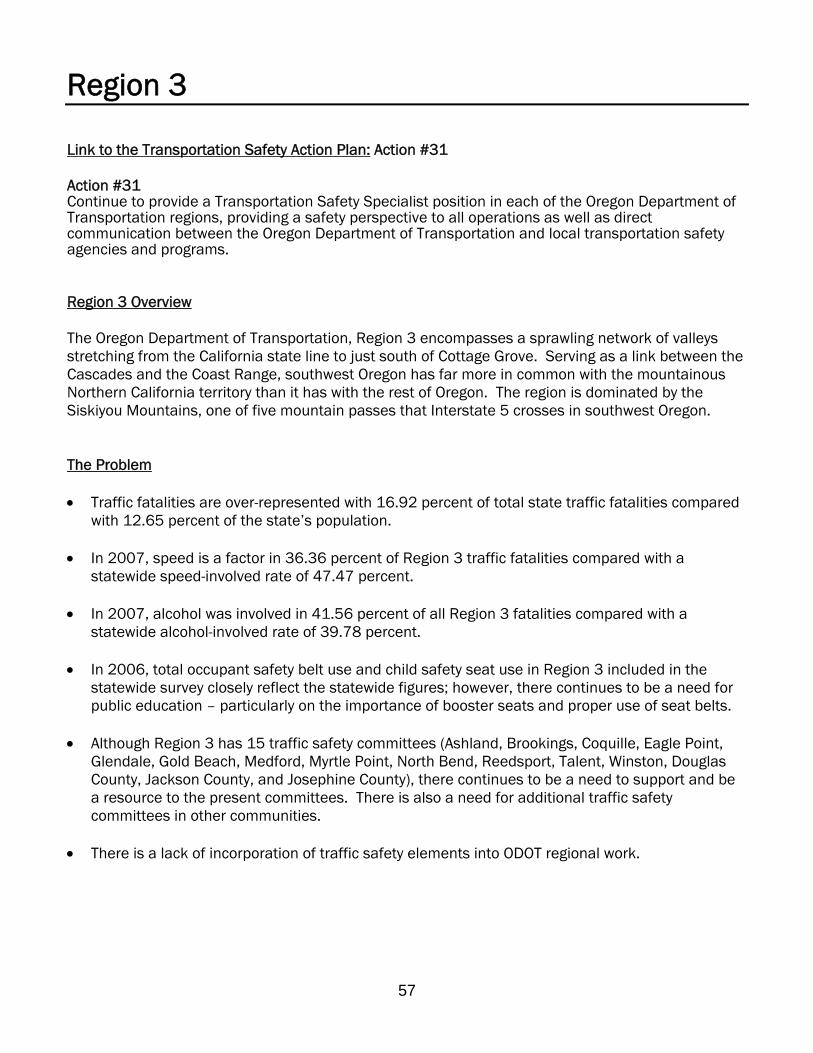
Region 3
Link to the Transportation Safety Action Plan: Action #31
Action #31 Continue to provide a Transportation Safety Specialist position in each of the Oregon Department of Transportation regions, providing a safety perspective to all operations as well as direct communication between the Oregon Department of Transportation and local transportation safety agencies and programs.
Region 3 Overview
The Oregon Department of Transportation, Region 3 encompasses a sprawling network of valleys stretching from the California state line to just south of Cottage Grove. Serving as a link between the Cascades and the Coast Range, southwest Oregon has far more in common with the mountainous Northern California territory than it has with the rest of Oregon. The region is dominated by the Siskiyou Mountains, one of five mountain passes that Interstate 5 crosses in southwest Oregon.
The Problem
• Traffic fatalities are over-represented with 16.92 percent of total state traffic fatalities compared with 12.65 percent of the state’s population.
• In 2007, speed is a factor in 36.36 percent of Region 3 traffic fatalities compared with a statewide speed-involved rate of 47.47 percent.
• In 2007, alcohol was involved in 41.56 percent of all Region 3 fatalities compared with a statewide alcohol-involved rate of 39.78 percent.
• In 2006, total occupant safety belt use and child safety seat use in Region 3 included in the statewide survey closely reflect the statewide figures; however, there continues to be a need for public education – particularly on the importance of booster seats and proper use of seat belts.
• Although Region 3 has 15 traffic safety committees (Ashland, Brookings, Coquille, Eagle Point, Glendale, Gold Beach, Medford, Myrtle Point, North Bend, Reedsport, Talent, Winston, Douglas County, Jackson County, and Josephine County), there continues to be a need to support and be a resource to the present committees. There is also a need for additional traffic safety committees in other communities.
• There is a lack of incorporation of traffic safety elements into ODOT regional work.
57
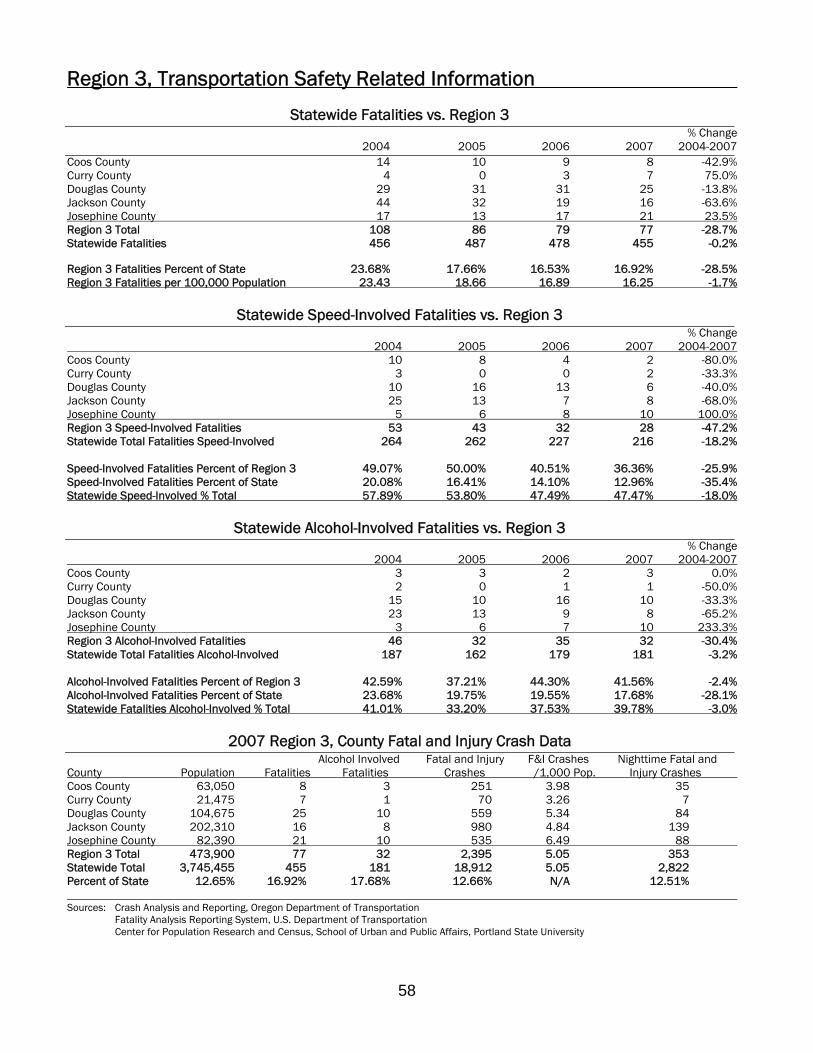
Region 3, Transportation Safety Related Information
Statewide Fatalities vs. Region 3 % Change
2004 2005 2006 2007 2004-2007 Coos County 14 10 9 8 -42.9% Curry County 4 0 3 7 75.0% Douglas County 29 31 31 25 -13.8% Jackson County 44 32 19 16 -63.6% Josephine County 17 13 17 21 23.5% Region 3 Total 108 86 79 77 -28.7% Statewide Fatalities 456 487 478 455 -0.2%
Region 3 Fatalities Percent of State 23.68% 17.66% 16.53% 16.92% -28.5% Region 3 Fatalities per 100,000 Population 23.43 18.66 16.89 16.25 -1.7%
Statewide Speed-Involved Fatalities vs. Region 3 % Change
2004 2005 2006 2007 2004-2007 Coos County 10 8 4 2 -80.0% Curry County 3 0 0 2 -33.3% Douglas County 10 16 13 6 -40.0% Jackson County 25 13 7 8 -68.0% Josephine County 5 6 8 10 100.0% Region 3 Speed-Involved Fatalities 53 43 32 28 -47.2% Statewide Total Fatalities Speed-Involved 264 262 227 216 -18.2%
Speed-Involved Fatalities Percent of Region 3 49.07% 50.00% 40.51% 36.36% -25.9% Speed-Involved Fatalities Percent of State 20.08% 16.41% 14.10% 12.96% -35.4% Statewide Speed-Involved % Total 57.89% 53.80% 47.49% 47.47% -18.0%
Statewide Alcohol-Involved Fatalities vs. Region 3 % Change
2004 2005 2006 2007 2004-2007 Coos County 3 3 2 3 0.0% Curry County 2 0 1 1 -50.0% Douglas County 15 10 16 10 -33.3% Jackson County 23 13 9 8 -65.2% Josephine County 3 6 7 10 233.3% Region 3 Alcohol-Involved Fatalities 46 32 35 32 -30.4% Statewide Total Fatalities Alcohol-Involved 187 162 179 181 -3.2%
Alcohol-Involved Fatalities Percent of Region 3 42.59% 37.21% 44.30% 41.56% -2.4% Alcohol-Involved Fatalities Percent of State 23.68% 19.75% 19.55% 17.68% -28.1% Statewide Fatalities Alcohol-Involved % Total 41.01% 33.20% 37.53% 39.78% -3.0%
2007 Region 3, County Fatal and Injury Crash Data Alcohol Involved Fatal and Injury F&I Crashes Nighttime Fatal and
County Population Fatalities Fatalities Crashes /1,000 Pop. Injury Crashes Coos County 63,050 8 3 251 3.98 35 Curry County 21,475 7 1 70 3.26 7 Douglas County 104,675 25 10 559 5.34 84 Jackson County 202,310 16 8 980 4.84 139 Josephine County 82,390 21 10 535 6.49 88 Region 3 Total 473,900 77 32 2,395 5.05 353 Statewide Total 3,745,455 455 181 18,912 5.05 2,822 Percent of State 12.65% 16.92% 17.68% 12.66% N/A 12.51%
Sources: Crash Analysis and Reporting, Oregon Department of Transportation Fatality Analysis Reporting System, U.S. Department of Transportation Center for Population Research and Census, School of Urban and Public Affairs, Portland State University
58

Goal
• To decrease the number of traffic fatalities in Region 3, by 3 percent per year from the 2003-2007 five-year average of 89, to 66 or below by 2015.
• To decrease the number in Injury A (serious) injuries in Region 3, by 5 percent of the 2004-2006 three-year average of 297, to 282 by 2015.
• To decrease the number of speed related fatalities in Region 3, by 3 percent per year from the 2003-2007 five-year average of 41, to 34 or below by 2015.
Performance Measures
• To communicate with and serve as a resource for the 15 currently established local traffic safety committees, a minimum of once, in person, by December 31, 2009.
• To coordinate or participate in a least 15 child safety seat trainings and public clinics in Region 3 through December 31, 2009.
• To coordinate and/or provide resources (print materials, safety booths, safety wheel, and videos) for 15 fairs, events and other traffic safety activities to educate and inform the public on traffic safety issues through December 31, 2009.
• To identify at least one safety related engineering project within Region 3 and work with the necessary agencies to fix the identified problem by December 31, 2009.
• To coordinate with and provide equipment to 10 agencies in need of resources to help prevent transportation safety related fatalities or injuries by December 31, 2009.
Strategies
• Coordinate and/or provide resources for traffic safety events.
• Focus educational efforts on speed, impaired driving, and occupant protection.
• Collaborate with other agencies/groups to raise awareness around transportation safety issues and plan appropriate measures to impact identified problems within Region 3.
• Work with existing traffic safety committees to enhance programs and to provide resources and information. Include ACTS Oregon in efforts and partner with them when able to help stabilize struggling committees. Work with communities that have a need, or have expressed interest in, forming new traffic safety committees.
• Provide mini-grants to local jurisdictions for traffic safety activities, minor engineering improvements, equipment, or overtime law enforcement.
• Coordinate quarterly meetings with CPS Technicians in Region 3 to plan CPS clinics and trainings.
59

60
Region 4
Link to the Transportation Safety Action Plan: Action #31
Action #31 Continue to provide a Transportation Safety Specialist position in each of the Oregon Department of Transportation regions, providing a safety perspective to all operations as well as direct communication between the Oregon Department of Transportation and local transportation safety agencies and programs.
Region 4 Overview
Region 4 encompasses Crook, Deschutes, Gilliam, Jefferson, Klamath, Lake, Sherman, Wasco, and Wheeler counties. Region 4 is rural in nature and Deschutes County is still one of the fastest growing counties in the state, with Crook County being the fastest growing county in the state (population grew 3.5 percent in 2007) based on data from Portland State University. Region 4 has 1,955 state highway road miles (4,064 lane miles), three maintenance districts and two active Safe Kids Chapters. Region 4 has one safety corridor on Highway 270 (OR Route 140 W) Lake of the Woods from MP 29 to MP 47.
The Problem
• Alcohol-related fatalities in Region 4 increased from 24 percent (19 fatalities) in 2005 to 42 percent (38) in 2006. Deschutes County rose from six fatalities to 19 fatalities and Klamath County’s numbers increased from four to nine fatalities.
• Region 4 had 56 fatalities in 2007. Deschutes and Klamath counties continue to have a higher fatality count than the rest of the counties within Region 4. Deschutes County had 13 fatalities (36 in 2006), Jefferson County had 10 (up from four in 2006) and Klamath County had 13 (29 in 2006).
• Speed-related fatalities are still playing a large role as the contributing factor in a fatal crash. Based on 2007 crash data, 48 percent (or 27) of the total fatalities had speed as the primary contributing factor in the crash. Jefferson, Klamath and Lake had the highest with six fatalities in Jefferson County and five fatalities in both Klamath and Lake Counties.
61

Region 4, Transportation Safety Related Information
Statewide Fatalities vs. Region 4 % Change
2004 2005 2006 2007 2004-2007 Crook County 2 4 4 4 100.0% Deschutes County 17 19 36 13 -23.5% Gilliam County 3 4 1 0 -100.0% Jefferson County 7 14 4 10 42.9% Klamath County 23 24 29 13 -43.5% Lake County 2 4 5 5 150.0% Sherman County 2 3 1 3 50.0% Wasco County 3 5 9 7 133.3% Wheeler County 1 2 1 1 0.0% Region 4 Total 60 79 90 56 -6.7% Statewide Fatalities 456 487 478 455 -0.2%
Region 4 Fatalities Percent of State 13.16% 16.22% 18.83% 12.31% -6.5% Region 4 Fatalities per 100,000 Population 20.78 27.37 29.91 17.98 -13.5%
Statewide Speed Involved Fatalities vs. Region 4 % Change
2004 2005 2006 2007 2004-2007 Crook County 1 2 1 1 0.0% Deschutes County 12 10 13 4 -66.7% Gilliam County 3 4 0 0 -100.0% Jefferson County 6 7 3 6 0.0% Klamath County 11 9 15 5 -54.5% Lake County 0 4 1 5 N/A Sherman County 1 1 0 3 200.0% Wasco County 1 3 7 2 100.0% Wheeler County 1 1 0 1 0.0% Region 4 Speed-Involved Fatalities 36 41 40 27 -25.0% Statewide Total Fatalities Speed-Involved 264 262 227 216 -18.2%
Speed-Involved Fatalities Percent of Region 4 60.00% 51.90% 44.44% 48.21% -19.6% Speed-Involved Fatalities Percent of State 13.64% 15.65% 17.62% 12.50% -8.3% Statewide Fatalities Speed-Involved % Total 57.89% 53.80% 47.49% 47.47% -18.0%
Statewide Alcohol Involved Fatalities vs. Region 4 % Change
2004 2005 2006 2007 2004-2007 Crook County 0 1 2 2 N/A Deschutes County 3 6 19 8 166.7% Gilliam County 3 0 0 0 -100.0% Jefferson County 5 5 3 8 60.0% Klamath County 15 4 9 5 -66.7% Lake County 0 0 0 1 N/A Sherman County 2 1 1 1 -50.0% Wasco County 1 1 3 4 300.0% Wheeler County 0 1 1 1 N/A Region 4 Alcohol-Involved Fatalities 29 19 38 30 3.4% Statewide Total Fatalities Alcohol-Involved 187 162 179 181 10.8%
Alcohol-Involved Fatalities Percent of Region 4 48.33% 24.05% 42.22% 53.57% 10.8% Alcohol-Involved Fatalities Percent of State 15.51% 11.73% 21.23% 16.57% 6.9% Statewide Fatalities Alcohol-Involved % Total 41.01% 33.20% 37.53% 39.78% -3.0%
62

2007 Region 4, County Fatal and Injury Crash Data Alcohol Involved Fatal and Injury F&I Crashes Nighttime Fatal and
County Population Fatalities Fatalities Crashes /1,000 Pop. Injury Crashes Crook County 25,885 4 2 99 3.82 9 Deschutes County 160,810 13 8 749 4.66 109 Gilliam County 1,885 0 0 14 7.43 5 Jefferson County 22,030 10 8 84 3.81 14 Klamath County 65,815 13 5 353 5.36 56 Lake County 7,565 5 1 51 6.74 12 Sherman County 1,855 3 1 35 18.87 9 Wasco County 24,125 7 4 127 5.26 24 Wheeler County 1,570 1 1 15 9.55 2 Region 4 Total 311,540 56 30 1,527 4.90 240 Statewide Total 3,745,455 455 181 18,912 5.05 2,822 Percent of State 8.32% 12.31% 16.57% 8.07% N/A 8.50%
Sources: Crash Analysis and Reporting, Oregon Department of Transportation Fatality Analysis Reporting System, U.S. Department of Transportation Center for Population Research and Census, School of Urban and Public Affairs, Portland State University
Goal
• Reduce crashes that have alcohol as a contributing factor in fatalities from the latest available five year average (2003-2007) of 29 fatalities reduced 3 percent a year for nine years to 22 fatalities by 2015.
• Reduce crashes that have speed as a contributing factor in fatalities from the latest available five year average (2003-2007) of 36 fatalities reduced 3 percent a year for nine years to 28 fatalities by 2015.
Performance Measures
• Assist in the development of a minimum of two local traffic safety projects based on locally identified priorities. Projects may target but will not be limited to: speed and/or alcohol traffic law enforcement; multi-modal safety; and cooperative projects, to be completed by December 31, 2009.
• Coordinate or provide a minimum of 15 child safety seat clinics in Region 4 by December 31, 2009.
• Coordinate and/or provide resources for safety fairs, county fairs, schools and other traffic safety activities to educate and inform the public on all areas of traffic safety issues. Reach 187,000 people (60 percent of the population of Region 4 based on 2007 data) by December 31, 2009.
• Analyze safety projects within Region 4 approximately every biennium after construction to see if safety improvements were met and have made a measurable difference.
Strategies
• Work with local agencies (OLCC, Police Agencies, etc.) to help reduce speed and alcohol-related fatalities in Region 4, with emphasis in Klamath County.
63
• Advocate for transportation safety in Region 4 by providing information and education on all aspects of traffic safety, coordinating traffic safety activities, work with community organizations and local traffic safety committees.
• Work with ACTS Oregon and local communities to possibly develop new safety committees or keeping the volunteer base growing. Provide resources and knowledge to enhance the productivity of the committees.
• Evaluate Region 4 highway safety projects three years after construction completion on the effectiveness of the safety improvements to the roadway.
• Work with ODOT, Oregon State Police, County Sheriff (Klamath and Jackson) law enforcement agencies and local community on safety efforts for the safety corridor established in April 2005 on Highway 270 (Oregon Route 140 W) Lake of the Woods from mile point 29 to mile point 47.
64

Region 5
Link to the Transportation Safety Action Plan: Action # 31
Action # 31 Continue to provide a Transportation Safety Specialist position in each of the Oregon Department of Transportation regions, providing a safety perspective to all operations as well as direct communication between the Oregon Department of Transportation and local transportation safety agencies and programs.
Region 5 Overview
Region 5 includes Baker, Grant, Harney, Malheur, Morrow, Umatilla, Union and Wallowa counties. The total population for the eight counties is 180,275 encompassing 2,108 State Highway, 8,101 county and 790 city miles of roadway, with three active safety corridors all located in Umatilla County.
All eight counties in Region 5 (Baker, Grant, Harney, Malheur, Morrow, Umatilla, Union, and Wallowa) have established Local Traffic Safety Committees or similar organizations.
The Problem
• In 2007 traffic fatalities continued to be a major issue in Region 5 with 8.8 percent of total state fatalities compared with 4.8 percent of the state’s population.
• In 2007 speed-involved traffic fatalities in Region 5 were over-represented with 53 percent of total state fatalities compared with a statewide speed-involved rate of 47 percent.
• In 2007 alcohol was involved in 27.5 percent of all Region 5 fatalities compared with a statewide alcohol-involved rate of 39.9 percent.
• Total Occupant Safety belt use and child safety seat use in Region 5 cities included in the statewide survey closely reflect the statewide figures; however, child safety seat clinics still show a high percentage (over 90 percent) of improper use of child safety seats or lack of child safety seat.
65
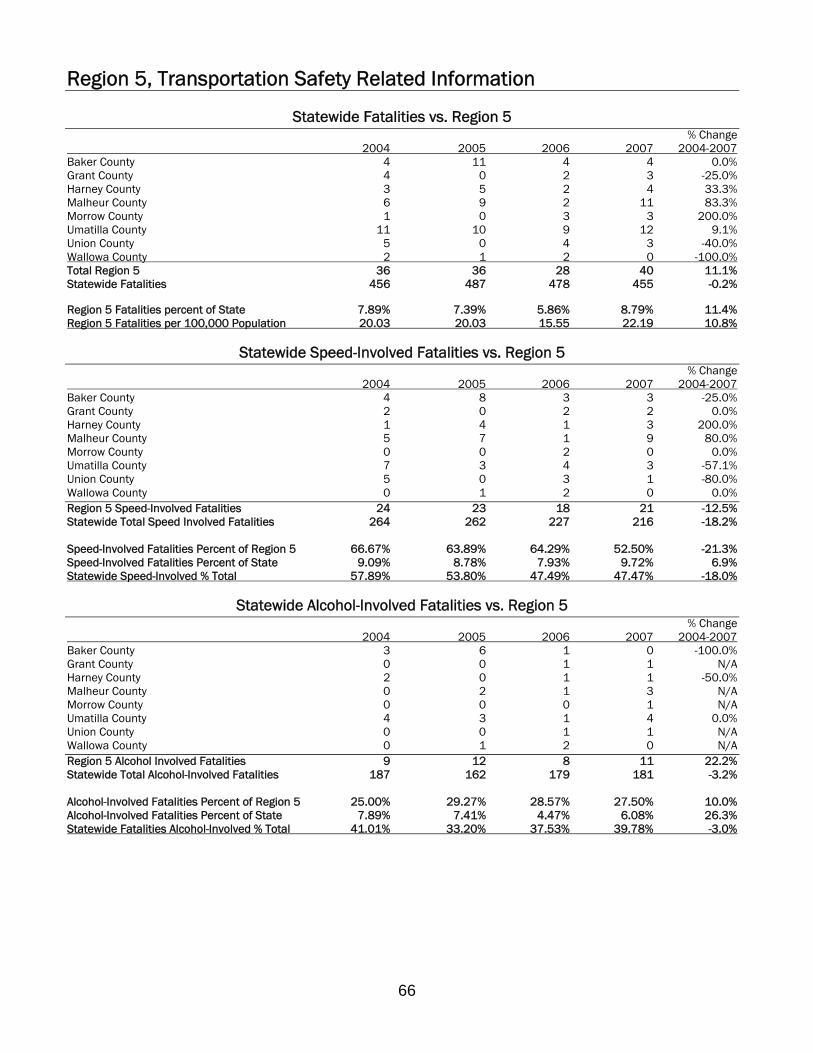
Region 5, Transportation Safety Related Information
Statewide Fatalities vs. Region 5 % Change
2004 2005 2006 2007 2004-2007 Baker County 4 11 4 4 0.0% Grant County 4 0 2 3 -25.0% Harney County 3 5 2 4 33.3% Malheur County 6 9 2 11 83.3% Morrow County 1 0 3 3 200.0% Umatilla County 11 10 9 12 9.1% Union County 5 0 4 3 -40.0% Wallowa County 2 1 2 0 -100.0% Total Region 5 36 36 28 40 11.1% Statewide Fatalities 456 487 478 455 -0.2%
Region 5 Fatalities percent of State 7.89% 7.39% 5.86% 8.79% 11.4% Region 5 Fatalities per 100,000 Population 20.03 20.03 15.55 22.19 10.8%
Statewide Speed-Involved Fatalities vs. Region 5 % Change
2004 2005 2006 2007 2004-2007 Baker County 4 8 3 3 -25.0% Grant County 2 0 2 2 0.0% Harney County 1 4 1 3 200.0% Malheur County 5 7 1 9 80.0% Morrow County 0 0 2 0 0.0% Umatilla County 7 3 4 3 -57.1% Union County 5 0 3 1 -80.0% Wallowa County 0 1 2 0 0.0% Region 5 Speed-Involved Fatalities 24 23 18 21 -12.5% Statewide Total Speed Involved Fatalities 264 262 227 216 -18.2%
Speed-Involved Fatalities Percent of Region 5 66.67% 63.89% 64.29% 52.50% -21.3% Speed-Involved Fatalities Percent of State 9.09% 8.78% 7.93% 9.72% 6.9% Statewide Speed-Involved % Total 57.89% 53.80% 47.49% 47.47% -18.0%
Statewide Alcohol-Involved Fatalities vs. Region 5
Baker County Grant County Harney County Malheur County Morrow County Umatilla County Union County Wallowa County Region 5 Alcohol Involved Fatalities Statewide Total Alcohol-Involved Fatalities
2004 3 0 2 0 0 4 0 0 9
187
2005 6 0 0 2 0 3 0 1
12 162
2006 1 1 1 1 0 1 1 2 8
179
2007 0 1 1 3 1 4 1 0
11 181
% Change 2004-2007
-100.0% N/A
-50.0% N/A N/A
0.0% N/A N/A
22.2% -3.2%
Alcohol-Involved Fatalities Percent of Region 5 Alcohol-Involved Fatalities Percent of State Statewide Fatalities Alcohol-Involved % Total
25.00% 7.89%
41.01%
29.27% 7.41%
33.20%
28.57% 4.47%
37.53%
27.50% 6.08%
39.78%
10.0% 26.3% -3.0%
66

2007 Region 5, County Fatal and Injury Crash Data Alcohol Involved Fatal and Injury F&I Crashes Nighttime Fatal and
County Population Fatalities Fatalities Crashes /1,000 Pop. Injury Crashes Baker County 16,435 4 0 101 6.15 16 Grant County 7,580 3 1 36 4.75 4 Harney County 7,680 4 1 33 4.30 8 Malheur County 31,620 11 3 166 5.25 32 Morrow County 12,335 3 1 30 2.43 5 Umatilla County 72,245 12 4 326 4.51 59 Union County 25,250 3 1 115 4.55 18 Wallowa County 7,130 0 0 24 3.37 4 Region 5 Total 180,275 40 11 831 4.61 146 Statewide Total 3,745,455 455 181 18,912 5.05 2,822 Percent of State 4.81% 8.79% 6.08% 4.39% N/A 5.17%
Sources: Crash Analysis and Reporting, Oregon Department of Transportation Fatality Analysis Reporting System, U.S. Department of Transportation Center for Population Research and Census, School of Urban and Public Affairs, Portland State University
Goal
• Maintain or reduce the number of traffic related fatalities from a 2003-2007 average of 37 to 25 by 2015.
• Reduce the number of speed-involved fatalities from a 2003-2007 average of 24 to 18 by 2015.
• Reduce the number of alcohol-involved fatalities from a 2003-2007 average of 11 to 7 by 2015.
Performance Measures
• Communicate with and serve as a resource for the seven currently established local traffic safety committees, either in person or by utilizing other ODOT staff, by December 31, 2009.
• Provide traffic safety information to approximately 108,000 people or 60 percent of the population in Region 5 in by December 31, 2009.
• Coordinate and/or provide 20 child safety seat trainings and public clinics in Region 5 by December 31, 2009.
• Maintain the 42 certified safety seat technicians in Region 5 and increase technicians in Baker and Grant counties by December 31, 2009.
• Identify the top five SPIS sites within Region 5 and work to reduce fatalities by five percent through implementation of education, enforcement, engineering and emergency services solutions (“4-E”) by December 31, 2009.
Strategies
• Provide traffic safety education materials and resources, coordinate and/or make presentations to 15 public/private elementary schools. Participate in 10 safety fairs for pre-school through junior high age students. Reach high school age students by speaking at 15 drivers training
67
classes and Choices and Consequences programs. Contact adults by speaking at two civic groups, six seatbelt diversion classes and DUII Victims Panels. Reach out to the entire community through education, by utilizing the safety wheel at two County fairs, three major county events and other traffic safety activities.
• Work with the seven existing local traffic safety committees to enhance programs and to provide resources and information.
• Work with Region Traffic Unit to identify the top five SPIS sites within Region 5. Work with regional law enforcement to increase patrols in those areas through overtime enforcement dollars. Work with local traffic safety committees and Region Traffic to find possible engineering fixes for those high crash sites.
• Work with regional law enforcement and traffic safety committees to identify areas with high DUII and speed related citations and crash sites. Work to reduce the violations and crashes through overtime enforcement.
• Work with the 42 certified child safety seat technicians in Region 5 to accomplish holding 20 public clinics and trainings throughout Region 5. Encourage traffic safety committee members in Baker and Grant Counties to become certified child safety seat technicians.
68

Roadway Safety
Link to the Transportation Safety Action Plan: Action #17, 21, 28
Action #17 Advocate for consideration of roadway, human, and vehicle elements of safety in modal, corridor and local system plan development and implementation.
Action #21 Continue to conduct research on driver behavior and roadway engineering issues. Evaluate the safety impact of new laws, new programs, and new materials.
Action #28 Continue efforts to enhance communication between engineering, enforcement, education and EMS.
The Problem
• Non-state road authorities do not program safety as a stand-alone priority for their transportation dollars in a consistent manner. Training and awareness are lacking on their flexibility and legal requirements.
• Traffic crash rates(2) on the State Highway System in 2006 increased slightly compared to 2005, however both 2005 and 2006 are still some of the lowest rates on record in recent years.
• State and local public works along with local officials continue to express a need for safety engineering training due to lack of trained employees, new employees, turnover and changes in accepted practices.
• Approximately 37 percent of all crashes in Oregon occur at intersections.
• The fatal and serious injury state highway crash rates have been consistently higher on the rural state highway system compared to the urban state highway system.
Traffic Fatality Rate in Oregon, 2003-2006 98-02 % Change
Average 2003 2004 2005 2006 2003-2006
National Traffic Fatality Rate1 1.53 1.48 1.44 1.46 1.42 -4.1%
Oregon Traffic Fatality Rate1 1.35 1.46 1.32 1.38 1.35 -7.5%
Highway System, Non-freeway Crash Rate2 1.60 1.46 1.13 1.24 1.26 -13.7% Hwy System Rural-Secondary Non-freeway Crash Rate 1.03 0.87 0.72 0.80 0.80 -8.0%
Highway System, Freeway Crash Rate 0.40 0.42 0.37 0.41 0.39 -7.1% County Roads/City Streets Crash Rate 2.02 2.18 1.70 1.85 1.86 -14.7%
Source: Crash Analysis and Reporting, Oregon Department of Transportation Fatality Analysis Reporting System, U.S. Department of Transportation
1 Deaths per 100 million vehicle miles traveled 2 Crashes per million vehicle miles traveled
69
Goals
• Further establish roadway safety initiatives and trainings for the Department, e.g., roadway safety engineering techniques, human factors, intersection design, rural highway rumble strip applications, roadway safety audits or use of roundabouts, etc., by 2015.
• Achieve consistency statewide in the development and implementation of the Safety Corridor Program by encouraging more crash data analysis, applying safety countermeasures, development of Safety Corridor Plan’s and Safety Corridor Plan Reviews by 2015.
Performance Measures
• Train 750 state and local public works and law enforcement staff on various engineering, enforcement and traffic safety related topics from 607 trained in 2007 to 750 trained by December 31, 2009.
• Conduct trainings and local workshops for state and local public works and law enforcement staff on various engineering, enforcement and traffic safety related topics from 22 trainings in 2007 to 25 by December 31, 2009.
• Further identify and implement “4-E” components to engineering related safety initiatives by December 31, 2009.
Strategies
• Participate on ODOT’s:
o Highway Safety Engineering Committee (HSEC) to evaluate and integrate the SAFETEA Highway Safety Initiative Program (HSIP).
o ODOT Pavement Management Committee to assure safety is maintained as a part of preservation projects.
o Participate on various ODOT Research Projects to assist in the identification of research findings that confirm applicable safety countermeasures to be implemented by ODOT and local agencies.
o Participate on the ODOT Informal Safety Committee to communicate the latest strategies and projects being used within TSD and share that information with other ODOT, OSP, and Federal agency staff.
• Fund overtime enforcement on the worst ranked safety corridors annually.
• Meet with Region Transportation Safety Coordinators to further implement a comprehensive Safety Corridor Program including use of more crash data and crash modification factors,
70

development of boilerplate documents to be used statewide and use of weighted averages for annual data reviews.
• Coordinate discussions and input on training topics to be provided within in the state. Seek comments and input from local agencies, FHWA and ODOT staff.
71

72

Safe Routes to School
Links to the Transportation Safety Action Plan: Action #65, 66, 67
Action #65 Emphasize programs that encourage pedestrian travel and improve pedestrian safety by expanding public education efforts with focus on driver behavior near schools; encourage aggressive enforcement of pedestrian traffic laws around schools; assist communities in pedestrian safety efforts by providing technical assistance and educational materials; increase funding for correcting pedestrian system deficiencies around schools.
Action #66 Increase public education and enforcement efforts regarding rules of operation for bicycles, scooters, skates, skateboards, personal assistive devices and other new devices permitted on Oregon roads.
Action #67 Increase emphasis on programs that encourage bicycling and other alternative mode travel and improve safety for these modes by establishing a stable funding source to implement and institutionalize bicyclist education in schools; increase funding for maintenance of bikeways and for programs that make walking and bicycling safe and attractive to children.
Safe Routes to School Overview
The goal of the program is to increase the ability and opportunity for children in grade levels k-8 to walk and bicycle to school. Assistance is available for education, encouragement and traffic enforcement activities, and engineering projects within two miles of the school.
The Problem
According to the National Safe Routes to School Clearinghouse data, in 1969, 42% of children 5 to 18 years of age walked or bicycled to school. In 2001, that rate dropped to 16%. In 1969, 87% of children 5-18 years of age who lived within one mile of school walked or bicycled to school. In 2001, 63% of children 5-18 years of age who lived within one mile of school walked or bicycled to school. This downward trend of children replacing a routine of physical activity with alternate modes of transportation has led to lifestyle changes that impact children, families, schools, neighborhoods, and the broader community. Less foot-powered transportation means more motor vehicle transportation around schools, resulting in increased traffic congestion which negatively impacts the walking and bicycling environment. Safe Routes to School programs are part of the solution to increase physical activity and improve unsafe walking and bicycling conditions.
73

Oregon Modes of School Commute by Children, by Grade Group, 2002 and 2006*
1st to 3rd Grade 4th to 5th Grade 6th to 8th Grade 9th to 12th Grade Total
On a regular basis, 2002 2006
Child walks to school at least 3 days per week
14.6% 13.1%
Child bikes to school at least 3 days per week
2.5% 1.6%
Child rides the school or public bus to school at least 3 days per week 43.7% 46.3%
Child rides in a car or carpool to school at least 3 days per week 49.9% 54.3%
2002 2006
21.3% 18.2%
3.1% 7.5%
46.1% 53.2%
43.7% 43.6%
2002 2006
23.0% 18.9%
5.2% 7.5%
48.6% 46.6%
40.4% 42.2%
2002 2006
19.2%
5.3%
38.7%
55.8%
--
--
--
--
2002 2006
19.2% 17.8%
3.6% 5.6%
46.0% 44.8%
45.0% 49.5%
Source: Oregon Behavioral Risk Factor Surveillance System
* Parents were asked to estimate frequency with which child used various modes of commute. Categories were not presented as mutually exclusive and results do not necessarily total 100%.
Goals
• Increase the number of schools that have a SRTS Action Plan from 30 in 2008, to 60 by 2015, an increase of 100 percent.
Performance Measures
• Establish baseline datasets for program standards and direction by December 31, 2009, focusing on crashes, injuries and fatalities in school zones.
• Establish baseline numbers and methodologies for determining partnerships that have been created as a result of Safe Routes to School Programs by December 31, 2009.
• Establish a baseline and goals for increasing the percentage of students who walk and bicycle as reported by schools using the National Clearinghouse for Safe Routes to School standardized Student Hand Tallies and Parent Surveys as adopted by the Safe Routes to School Advisory Committee.
Strategies
• Conduct statewide trainings on the Safe Routes to School funding program to schools, school districts, public works personnel, parents, and others who may wish to partner with schools in increasing the ability of students to walk and bike to and from school.
• Provide educational materials in support of pedestrian and bicycling safety to schools and school districts.
74

• Create public awareness of SRTS efforts by schools and communities through statewide marketing campaign.
• Partner with Oregon Walk and Bike Committee to promote International Walk and Bike Day and associated activities that promote physical activity among students.
• Collaborate with Transportation Safety Division program managers in combining efforts around pedestrian and bicycle safety and other traffic safety issues like speed and enforcement.
75

76

Speed
Link to the Transportation Safety Action Plan: Action #1
Action #1 Develop a Traffic Law Enforcement Strategic Plan which addresses the needs and specialties of the Oregon State Police, County Sheriff’s and City Police Departments. The plan should be developed with assistance from a high level, broadly based Task Force that includes representatives of all types of enforcement agencies, as well as non-enforcement agencies impacted by enforcement activities.
The Problem
• In 2007, 48 percent of all traffic fatalities in Oregon involved speeding (216 of 455 traffic deaths). Data reflects excessive speed or driving too fast for present conditions as the number one single contributing factor to fatal traffic crashes on Oregon roads in the year 2007.
• Over 50 percent of all annual traffic deaths in Oregon (including speed-related events) occur on the Rural State Highway System. The Oregon State Police do not have the staffing levels needed to appropriately address and make significant death and injury reductions given current and known future staffing levels through 2009. Multi-agency partnerships will be required to address this problem.
• According to Intercept Research Corporation’s “Transportation Safety Survey, Executive Summary” for August 2007, speeding was ranked number one as the most observed traffic safety issue (36%) by Oregon citizens.
• Speed-related crashes cost Oregonians an estimated $455,386,000 in total economic costs in 20051.
• Following are facts relative to increased speed:
• The chances of dying or being seriously injured in a traffic crash doubles for every 10 mph over 50 mph - this equates to a 400 percent greater chance at 70 mph than 50 mph.
• Crash forces increase exponentially with speed increases (i.e., 50 mph increased to 70 mph is a 40 percent increase in speed, while kinetic energy increases 96 percent).
• The stopping distance for a passenger car on dry asphalt increases from 229 feet at 50 mph to 387 feet at 70 mph - a 69 percent increase in stopping distance.
• Safety equipment in vehicles is tested at 35 mph - that same equipment loses the ability to work effectively at higher speeds.
• Police agencies, large and small, do not have adequate funding to allow for the purchase of needed enforcement equipment such as radar, laser, and radar trailers or reader boards to assist them with traffic enforcement duties.
77

• FHWA repealed speed-monitoring reports in the early 1990’s; therefore no valid speed report exists for Oregon.
Speed in Oregon, 2004-2007 99-03 % Change
Average 2004 2005 2006 2007 2004-2007
Total Number of Fatalities Statewide 460 456 487 478 455 -0.2% Number of People Killed Involving Speed 217 264 262 227 216 -18.2% Percent Involving Speed 47.0% 57.9% 53.8% 47.5% 47.5% -18.0%
Total Number of Injuries Statewide 27,853 27,346 29,023 29,597 27,850 1.8% Number of People Injured Involving Speed 8,141 8,891 8,513 7,850 6,653 -25.2% Percent Involving Speed 29.2% 32.5% 29.3% 26.5% 23.9% -26.5%
Number of Speed Related Convictions 210,972 167,183 165,792 171,229 176,259 5.4%
Sources: Driver and Motor Vehicle Services, Oregon Department of Transportation Crash Analysis and Reporting, Oregon Department of Transportation Fatality Analysis Reporting System, U.S. Department of Transportation 1Economic Cost of Oregon Motor Vehicle Traffic Crashes, 2005; National Safety Council
Goal
• Reduce the number of fatalities in speed-related crashes from 216 (47.5 percent of the 2007 total statewide fatalities) to 190 by 2015.
• Reduce the number of injuries in speed-related crashes from 7,850 (26.5 percent of the 2006 total statewide fatalities) to 7,000 by 2015.
Performance Measures
• Reduce the number of fatalities in speed-related crashes from 227 (47.5 percent of the 2006 level) to 218 by December 31, 2009.
• Reduce the number of injuries in speed-related crashes from 7,850 (26.5 percent of the 2006 level) to 7,300 by December 31, 2009.
• Participate as a member of the Speed Task Force to create effective countermeasures to addressing the complex speeding issues on Oregon roadways.
• Identify worst 10 historical speed-related problem locations from crash reconstruction reports, focus enforcement, engineering and educational efforts in order to make the biggest impact possible using limited funding and resources.
• Identify worst 10 historical locations for tailgating related collisions. Focus enforcement, engineering and educational efforts in order to make the biggest impact possible using limited funding and resources.
78

Strategies
• Assist in the creation of a Speed Task Force. Ensure task force maintains focus on goals and develops effective countermeasures utilizing a variety of stakeholders to address speeding issues in Oregon.
• Ensure that speed enforcement overtime dollars are used on the types of roadways in which the largest percentages of death and injuries are occurring. Priorities order is: Rural State Highways, County Roads, City Streets, and Interstate System.
• Work toward elevating the seriousness of the potential consequences of speeding behavior in the public eye as Oregon’s Number 1 contributing factor to traffic death and injury severity.
• Request research on drivers who have been convicted of speeding 100 mph or more. Use results to create counter-measures specifically targeting this group by December 31, 2009.
• Provide comprehensive statewide analysis of speed involved crashes by region annually. Work with Region Safety Coordinators to address specific problems in their areas. Provide funding if available.
• Provide annual public information and education on the issues of speed via media contractor, ODOT PIO’s and other media outlets.
79

80

Traffic Records
Link to the Transportation Safety Action Plan: Action #35, 36
Action # 35 Continue implementation of recommendations from Traffic Records Assessment, which will create a traffic records system that will adequately serve the needs of state and local agencies.
Action # 36 Maintain responsibility for the continued implementation, enhancement, and monitoring of the Safety Management System (SMS) that serves the needs of all state and local agencies and interest groups involved in transportation safety programs.
The Problem
• The use of automation, especially for field data collection, is lagging in Oregon. Collection of crash, citation, roadway, and EMS data all have been reviewed for the benefits that electronic collection would provide. To date, only minimal use of automation for data collection has been implemented for citations and EMS.
• Law enforcement agencies completed approximately 42 percent of the crash reports filed with DMV in 2007. Primary reliance for crash reports is placed on the drivers directly involved in the crashes. The data obtained from an operator report is less reliable than the police report (e.g., it is less likely that a driver will report circumstances that might indicate their fault for the crash).
• The current software for collection of EMS run reports information is out of date. Currently, there is only a Trauma Registry system in place statewide. Pursue a unique identifier system that follows patients across multiple incidents, is shared among medical data applications, and can be used for linkage with crash and other data to support analysis of crash outcomes and driver characteristics.
• There is a need for crash report training to be delivered at the Enforcement Conferences, as well as targeted training for engineers, prosecutors, judges, and EMS providers to promote improved crash data collection.
• Roadway information is not available for all public roads in the state whether under state or local jurisdiction. ODOT does not have a clear, consistent linear referencing system for highways in Oregon; the same road may have multiple numbers and duplicate milepost numbers, causing confusion for emergency responders.
81

Statistics for Traffic Records, 2004-2007 99-03 % Change
Average 2004 2005 2006 2007 2004-2007
Total Crashes 48,708 41,440 44,881 45,072 44,163 6.6%
Fatal Crashes 403 388 443 418 411 5.9% Injury Crashes 18,553 18,279 19,447 19,778 18,501 1.2% Property Damage Crashes 29,751 22,773 24,991 24,876 25,251 10.9%
Fatalities 460 456 487 478 455 -0.2% Fatalities per 100 Million VMT 1.32 1.28 1.38 1.35 1.31 2.4% Injuries 27,853 27,346 29,023 29,597 27,850 1.8% Injuries per 100 Million VMT 80.11 76.82 82.26 83.42 80.26 4.5%
Population (in thousands) 3,451 3,583 3,631 3,691 3,745 4.5% Vehicle Miles Traveled (millions) 34,768 35,598 35,282 35,482 34,700 -2.5% # of Licensed Drivers (in thousands) 2,764 2,911 2,955 3,031 3,167 8.8% # of Registered Vehicles (thousands) 3,807 3,986 4,005 4,063 4,153 4.2%
% Who Think Transportation System is Safe or Safer Than Last Year 69.8% 75% 72% 69% 71% -2.8%
Source: Crash Analysis and Reporting, Oregon Department of Transportation Fatality Analysis Reporting System, U.S. Department of Transportation Center for Population Research and Census, School of Urban and Public Affairs, Portland State University Public Opinion Survey, Executive Summary; Intercept Research Corporation
Goals
• Improve the timeliness, accuracy, completeness, uniformity, integration, and accessibility of traffic safety data in order to identify priorities for national, state, and local highway and traffic safety programs by 2015.
• Link the state traffic records data systems with other data systems within the state, such as systems that contain crash, vehicle, driver, enforcement/adjudication, and injury surveillance data by 2015.
Performance Measures
• Increase the percentage of law enforcement agencies using online crash data system for data retrieval and statistical reports from 6.8 percent of agencies (12 out of 177 agencies) in 2007 to 11.3 percent (20 agencies) by December 31, 2009.
• Increase the number of traffic citations that are distributed from law enforcement agencies to local courts electronically per year from approximately 33,000 citations in 2007 to 40,000 by December 31, 2009.
• Increase the percentage of crashes coded with a geospatial coordinate value from 38 percent in 2006 to 95 percent by December 31, 2009.
• Increase the percentage of crash reports submitted by law enforcement officers from 42.0 percent in 2007 to 45.0 percent by December 31, 2009.
82

• Improve the timeliness of the Crash System by demonstrating a measured decrease in number of days until the annual Statewide Crash Data File is available each year from 162 days from the end of 2007 to 130 days from the end of 2008 by December 31, 2009.
• Increase the percentage of EMS pre-hospital data records available on statewide EMS system from 0 percent in 2007 to 8 percent by December 31, 2009.
Strategies
• Complete a study on changing the state highway reference to eliminate multiple occurrences of the same mile marker on a single route.
• Provide a survey to all law enforcement agencies in Oregon to address the barriers to full crash reporting and to improve data capture, storage, and linkage.
• Develop crash report training to be delivered at law enforcement conferences to improve the collection and error rate of crash reports.
• Participate in a pilot program to expand the existing Safety Priority Index System (SPIS).
• Expand the TransViewer Internet Crash Reporting program and add query capabilities to meet the safety needs of ODOT’s external customers.
• Identify law enforcement agencies ready to pursue electronic field data collection for traffic citations and crash reports using software that allows the secure transfer of data from law enforcement agencies to local courts.
• Evaluate and pilot a collision diagramming tool that will expand current functionality for use by region traffic investigators, cities, and counties.
• Develop a system for rural ambulance service data tracking that conforms to NEMSIS guidelines.
83

84
Work Zone Safety
Link to the Transportation Safety Action Plan – Action #7, 28, 34
Action #7 Continue and expand efforts to reduce traffic-related deaths and injuries in roadway work zones. Continue the work zone enforcement program and enhance public information programs such as Give 'Em a Brake. Review ODOT policies and procedures relating to crew activity in work zones. Review road construction contract specifications dealing with placement and condition of traffic control devices. Consider legislative action to implement photo radar in work zones.
Action #28Continue efforts to enhance communication between engineering, enforcement, education and EMS.
Action #34 Continue to work with local government units, utility companies, and contractors to encourage improvements in the reliability of work zone signing.
The Problem
• Inattentiveness continues to be the number one cause of work zone crashes. Speed is a compounding factor.
• The five-year rolling average number of Oregon work zone deaths (2002-2006) is 8.8 in Oregon. This is only a slight decrease from the 2001-2005 rolling average of 9.0.
• In 2005, the national figure for traffic related work zone deaths increased by less than one percent from 2004 while Oregon’s work zone fatalities increased by 40 percent for the same period. Although, Oregon’s work zone fatalities have decreased from 20 in 2005 to an estimated five in 2006.
• More drivers and their passengers are injured and killed than on-site workers.
• Work Zone signing present when workers are not is the primary complaint drivers report with work zone operations.
• According to national studies, work zone crashes tend to be more severe than other crashes.
• Over 40 percent of work zone crashes occur in the transition zone before the work area.
• There’s an increase in exposure and, therefore an increase in potential risk to drivers and workers, due to a significant increase in state highway construction. This is a result of the Oregon Transportation Investment Act (OTIA) along with the annual State Transportation Improvement Program (STIP) projects.
85

Work Zones in Oregon, 2004-2007 99-03 % Change
Average 2004 2005 2006 2007 2004-2007 All Work Zone Traffic Crashes
Number 404 493 511 532 591 19.9% Total Oregon Fatalities 460 456 487 478 455 -0.2% Work Zone Fatalities
Number 5.6 12 20 5 11 -8.3% Percent of all fatalities 1.3% 2.6% 4.1% 1.0% 2.4% -8.1%
Work Zone Injuries Number 266 424 442 417 509 20.0% Percent of all injuries 1.0% 1.6% 1.5% 1.4% 1.8% 17.9%
Sources: Crash Analysis and Reporting, Oregon Department of Transportation Fatality Analysis Reporting System, U.S. Department of Transportation
Goal
• Reduce work zone fatalities from 12, the average for 2005 to 2007, to 10 or below each year through 2015.
• Maintain work zone injuries at 456, the average for 2005 to 2007, for each year through 2015.
• Maintain work zone crashes at 545, the average for 2005 to 2007, for each year through 2015.
Performance Measure
• Partner, coordinate and provide overtime work zone enforcement funds from 14 state and local police agencies in 2008 to 15 or more state and local police agencies by December 31, 2009.
• Provide work zone safety public information campaign to enhance work zone safety awareness through Oregon interstate billboard postings from two interstate locations in 2008 to two or more interstate locations by December 31, 2009.
• Provide a statewide media campaign(s) through the use of billboard, transit, radio, television, print materials and other outreach measures to promote work zone safety from one statewide campaign in 2008 to one or more coordinated statewide campaigns by December 31, 2009.
• Educate state and local public works agencies, consultants and contractors on the seriousness of work zone crashes and provide “4E” approaches to work zone safety from two statewide contacts in 2008 to two or more statewide contacts by December 31, 2009.
• Participate with ODOT Traffic Plans Engineer and ODOT Risk and Safety Manager to enhance options for use of positive protection devices and provide public works and law enforcement awareness of traffic control plan designs and signing standards through a statewide workshop or training from one in 2008 to one or more by December 31, 2009.
• Participate in the quality assurance work zone safety tour(s) from 80 percent of the tours in 2007 to 80 percent or more of the tours by December 31, 2009.
86
Strategies
• Participate in the Department’s identification of new trainings and promotion of existing trainings related to work zone safety education, engineering, EMS and enforcement, the “4-E” approach, for ODOT staff, local agencies, consultants, contractors, etc.
• Complete 30,000 overtime patrol hours in work zones between July 1, 2008 and June 30, 2009. (Target match effort is 5,100 hours.) Identify best practices for work zone enforcement and placement of enforcement funds.
• Support efforts to reduce work zone crashes through liaison work with ODOT Traffic and Roadway Section, Risk and Safety Manager, Regions, local agencies, consultants, contractors, and state and national non profits.
• Distribute at least 15,000 work zone safety promotional materials to citizens, tourists, public works’ agencies, city and county agencies, etc.
• Contract with consultant to assist in the initial development of an Oregon Work Zone Data Book to be updated annually and to participate on the pilot work zone photo radar pilot project.
87

88

Youth Transportation Safety (0-14)
Link to the Transportation Safety Action Plan: Action # 53
Action # 53 Implement the 2002 NHTSA Youth Assessment recommendations, focusing on the top ten chosen by the Youth Advisory Group. Continue to coordinate with the Advisory Group for completion and review or further direction.
The Problem
• The highest cause, on a whole, of death and injury to children ages 0-14 is motor vehicle crashes. To effect the greatest change, program areas that impact youth should be coordinated.
• Greatest cause of crashes involving fatalities and injuries is, overwhelmingly, speed too fast for conditions.
• When a child (age 0-14) is killed in an alcohol-related crash, 50% of the time the child is in the vehicle with the intoxicated driver.
• The Healthy Kids Learn Better Partnership has in the past included Transportation Safety Division as an additional partner in their collaboration with other state agencies to connect health and education for students and build supportive funding, leadership and policy. However, heavy emphasis is placed on other health issues, rather than the leading reason for children not making it to school.
• A Youth Plan has been created by a Core Youth Advisory Group, identifying 24 initiatives for establishing the 2007 Oregon Transportation Safety Action Plan for Youth. Priority issues addressing Youth 0-14 include motorized scooters, helmet use, children riding adult size all terrain vehicles, etc.
Oregon Crashes, 2004-2007 99-03 % Change
Average 2004 2005 2006 2007 2004-2007 Fatalities, ages 0-4 8.4 11 4 9 2 -81.8% Fatalities, ages 5-9 8.0 11 6 8 4 -63.6% Fatalities, ages 10-14 12.8 11 9 6 7 -36.4%
Total 29.2 33 19 23 13 -60.6%
Injuries, ages 0-4 611 518 537 459 482 -6.9% Injuries, ages 5-9 749 740 735 767 670 -9.5% Injuries, ages 10-14 1,054 872 996 946 819 -6.1%
Total 2,415 2,130 2,268 2,172 1,971 -7.5%
Source: Crash Analysis and Reporting, Oregon Department of Transportation Fatality Analysis Reporting System, U.S. Department of Transportation Department of Health and Human Services Centers for Disease Control and Prevention
89
Goal
• Reduce the number of crash-related fatalities of children ages 0-14 from 23, the five-year average from 2003-2007, to 18, a 24 percent reduction (or 3 percent reduction per year) by 2015.
• Reduce the number of crash-related injuries of children ages 0-14 from 2,146, the five-year average from 2003-2007, to 1,631, a 24 percent reduction (or 3 percent reduction per year) by 2015.
Performance Measures
• Reduce the number of crash-related fatalities of children ages 0-14 from 23, the five-year average from 2003-2007, to 21, a 6 percent reduction by December 31, 2009.
• Reduce the number of crash-related injuries of children ages 0-14 from 2,146, the five-year average from 2003-2007, to 2,017, a 6 percent reduction by December 31, 2009.
Strategies
• Continue to support and help enact laws impacting children in the 0-14 portion of the Youth Program in upcoming legislative sessions.
• Continue to provide a comprehensive and coordinated public information and education campaign on the causes of high motor vehicle crash rates for this age group. Additionally, continue to target occupant protection education and parental responsibility messages through media efforts for youth aged 0-14, identifying any potentially unreached audiences.
• Encourage communication among youth traffic safety program providers and coalitions through the continued development of a youth task force.
• Collaborate with Oregon Medical Association, Oregon Health Division, and local physician offices and partner with school districts and “Safe Routes to School” organizations to address family education issues of youth aged 0-14 in traffic safety.
• Continue to incorporate NHTSA Youth Assessment recommendations specific to the 0-14 age level, while also concentrating on addressing the Core Youth Advisory Group’s initiatives in the Youth Plan.
90
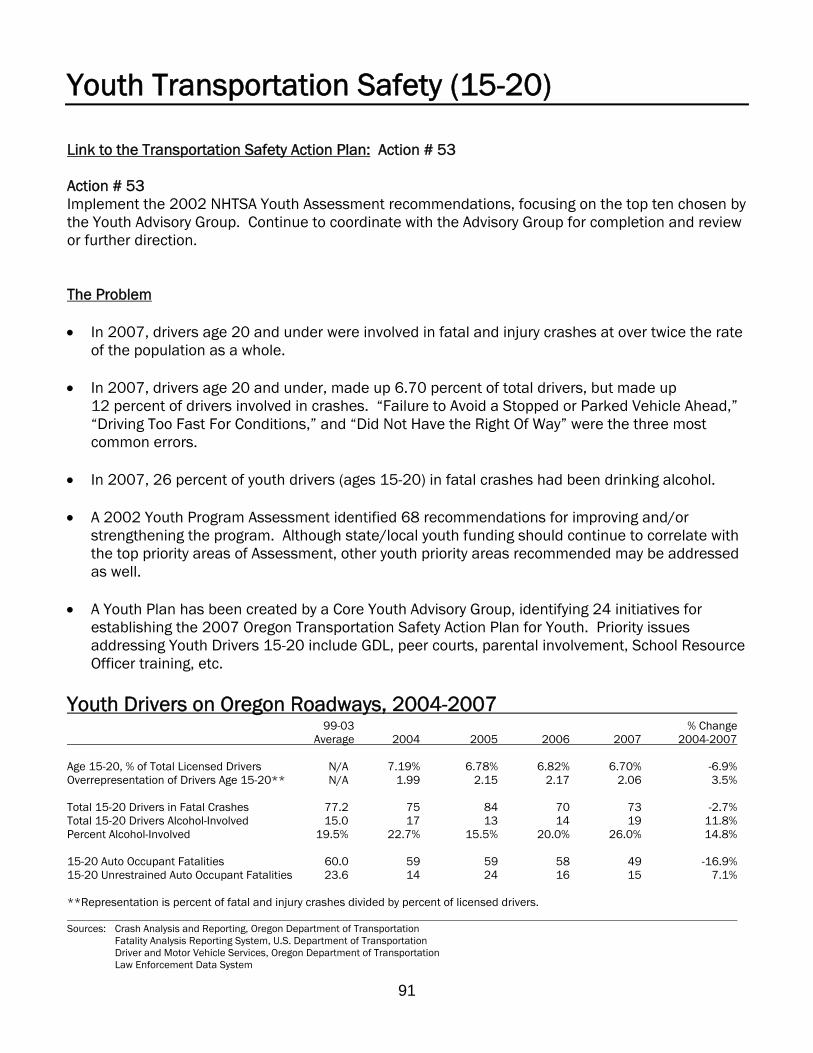
Youth Transportation Safety (15-20)
Link to the Transportation Safety Action Plan: Action # 53
Action # 53 Implement the 2002 NHTSA Youth Assessment recommendations, focusing on the top ten chosen by the Youth Advisory Group. Continue to coordinate with the Advisory Group for completion and review or further direction.
The Problem
• In 2007, drivers age 20 and under were involved in fatal and injury crashes at over twice the rate of the population as a whole.
• In 2007, drivers age 20 and under, made up 6.70 percent of total drivers, but made up 12 percent of drivers involved in crashes. “Failure to Avoid a Stopped or Parked Vehicle Ahead,” “Driving Too Fast For Conditions,” and “Did Not Have the Right Of Way” were the three most common errors.
• In 2007, 26 percent of youth drivers (ages 15-20) in fatal crashes had been drinking alcohol.
• A 2002 Youth Program Assessment identified 68 recommendations for improving and/or strengthening the program. Although state/local youth funding should continue to correlate with the top priority areas of Assessment, other youth priority areas recommended may be addressed as well.
• A Youth Plan has been created by a Core Youth Advisory Group, identifying 24 initiatives for establishing the 2007 Oregon Transportation Safety Action Plan for Youth. Priority issues addressing Youth Drivers 15-20 include GDL, peer courts, parental involvement, School Resource Officer training, etc.
Youth Drivers on Oregon Roadways, 2004-2007 99-03 % Change
Average 2004 2005 2006 2007 2004-2007
Age 15-20, % of Total Licensed Drivers N/A 7.19% 6.78% 6.82% 6.70% -6.9% Overrepresentation of Drivers Age 15-20** N/A 1.99 2.15 2.17 2.06 3.5%
Total 15-20 Drivers in Fatal Crashes 77.2 75 84 70 73 -2.7% Total 15-20 Drivers Alcohol-Involved 15.0 17 13 14 19 11.8% Percent Alcohol-Involved 19.5% 22.7% 15.5% 20.0% 26.0% 14.8%
15-20 Auto Occupant Fatalities 60.0 59 59 58 49 -16.9% 15-20 Unrestrained Auto Occupant Fatalities 23.6 14 24 16 15 7.1%
**Representation is percent of fatal and injury crashes divided by percent of licensed drivers.
Sources: Crash Analysis and Reporting, Oregon Department of Transportation Fatality Analysis Reporting System, U.S. Department of Transportation Driver and Motor Vehicle Services, Oregon Department of Transportation Law Enforcement Data System
91

Goal
• Reduce the over-representation of drivers age 20 and under in fatal and injury crashes from 2.07, the five-year average from 2003 to 2007, to 1.72, a 17 percent reduction by 2015.
• Reduce the number of drivers age 20 and under in fatal and injury crashes from 4,775 in 2007 to 3,629, a 24 percent reduction by 2015.
Performance Measures
• Reduce the number of drivers age 20 and under in fatal and injury crashes from 4,775 in 2007 to 4,493, a 6 percent reduction, by December 31, 2009.
• Reduce the number of “Failure to Avoid Stopped Vehicle,” age 15-20, driver errors from 1,756 in 2006 to 1,602, a 9 percent reduction, by December 31, 2009.
• Reduce the number of “Driving Too Fast for Conditions,” age 15-20 driver errors from 1,082 in 2006 to 988, a 9 percent reduction, by December 31, 2009.
• Reduce the number of “Did Not Have Right of Way,” age 15-20, driver errors from 1,007 in 2006 to 920, a 9 percent reduction, by December 31, 2009.
• Reduce the number of drivers age 15-20 that were alcohol-involved in fatal and injury crashes from 124 in 2007 to 116, a 6 percent reduction, by December 31, 2009.
• Reduce the number of unrestrained, age 15-20, passenger and driver fatalities from 15 in 2007 to 14, a 6 percent reduction, by December 31, 2009.
Strategies
• Continue to emphasize the graduated driver licensing law for teens in all driver education and traffic safety programs. Continue to generate discussion about secondary restrictions vs. primary restrictions and the enforcement of the graduated driver licensing restrictions in general.
• Encourage youth programs that combine enforcement, education and adjudication services to address youth driver safety.
• Encourage program(s) that address college campus impaired driving and other high-risk behaviors such as speeding.
• Coordinate and collaborate with other agencies and organizations that address youth issues and problems as they relate to transportation safety.
• Partner with other program areas such as Bicycle, Motorcycle, Occupant Protection, Driver Education, and Impaired Driving programs to address youth driving issues which will attempt to effect change in statistics of youth injuries and fatalities.
92
• Provide necessary information regarding youth transportation safety related issues impacting 2009 Legislation.
• Continue to incorporate NHTSA Youth Assessment recommendations specific to the 15-20 age level, while also concentrating on addressing the Core Youth Advisory Group’s initiatives in the Youth Plan.
93

94
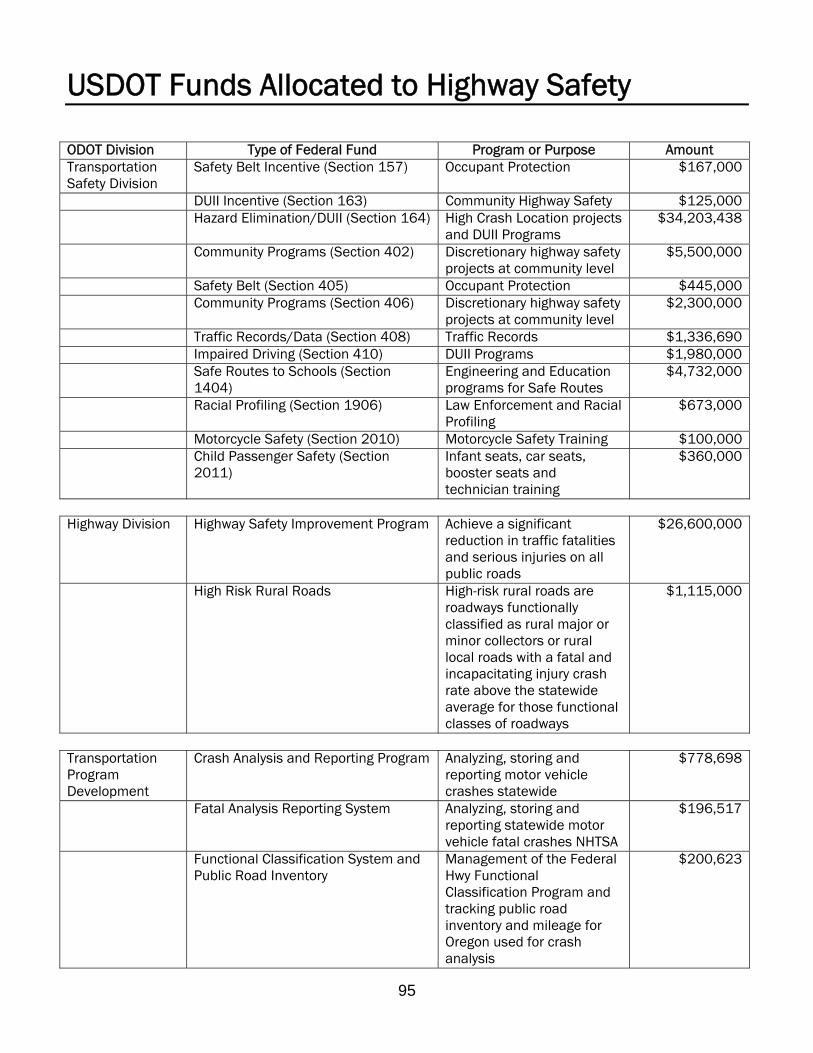
USDOT Funds Allocated to Highway Safety
ODOT Division Type of Federal Fund Program or Purpose Amount Transportation Safety Division
Safety Belt Incentive (Section 157) Occupant Protection $167,000
DUII Incentive (Section 163) Community Highway Safety $125,000 Hazard Elimination/DUII (Section 164) High Crash Location projects
and DUII Programs $34,203,438
Community Programs (Section 402) Discretionary highway safety projects at community level
$5,500,000
Safety Belt (Section 405) Occupant Protection $445,000 Community Programs (Section 406) Discretionary highway safety
projects at community level $2,300,000
Traffic Records/Data (Section 408) Traffic Records $1,336,690 Impaired Driving (Section 410) DUII Programs $1,980,000 Safe Routes to Schools (Section 1404)
Engineering and Education programs for Safe Routes
$4,732,000
Racial Profiling (Section 1906) Law Enforcement and Racial Profiling
$673,000
Motorcycle Safety (Section 2010) Motorcycle Safety Training $100,000 Child Passenger Safety (Section 2011)
Infant seats, car seats, booster seats and technician training
$360,000
Highway Division Highway Safety Improvement Program Achieve a significant reduction in traffic fatalities and serious injuries on all public roads
$26,600,000
High Risk Rural Roads High-risk rural roads are roadways functionally classified as rural major or minor collectors or rural local roads with a fatal and incapacitating injury crash rate above the statewide average for those functional classes of roadways
$1,115,000
Transportation Program Development
Crash Analysis and Reporting Program Analyzing, storing and reporting motor vehicle crashes statewide
$778,698
Fatal Analysis Reporting System Analyzing, storing and reporting statewide motor vehicle fatal crashes NHTSA
$196,517
Functional Classification System and Public Road Inventory
Management of the Federal Hwy Functional Classification Program and tracking public road inventory and mileage for Oregon used for crash analysis
$200,623
95
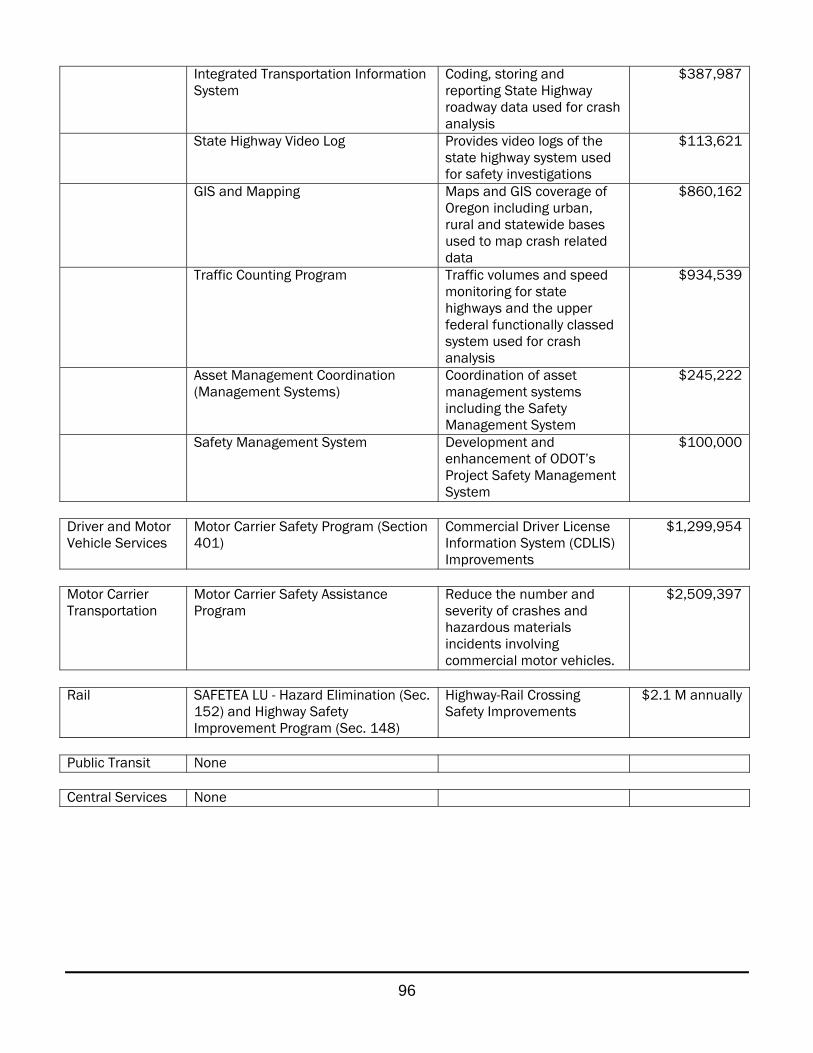
Integrated Transportation Information System
Coding, storing and reporting State Highway roadway data used for crash analysis
$387,987
State Highway Video Log Provides video logs of the state highway system used for safety investigations
$113,621
GIS and Mapping Maps and GIS coverage of Oregon including urban, rural and statewide bases used to map crash related data
$860,162
Traffic Counting Program Traffic volumes and speed monitoring for state highways and the upper federal functionally classed system used for crash analysis
$934,539
Asset Management Coordination (Management Systems)
Coordination of asset management systems including the Safety Management System
$245,222
Safety Management System Development and enhancement of ODOT’s Project Safety Management System
$100,000
Driver and Motor Motor Carrier Safety Program (Section Commercial Driver License $1,299,954 Vehicle Services 401) Information System (CDLIS)
Improvements
Motor Carrier Transportation
Motor Carrier Safety Assistance Program
Reduce the number and severity of crashes and hazardous materials
$2,509,397
incidents involving commercial motor vehicles.
Rail
Public Transit
SAFETEA LU - Hazard Elimination (Sec. 152) and Highway Safety Improvement Program (Sec. 148)
None
Highway-Rail Crossing Safety Improvements
$2.1 M annually
Central Services None
96

2009 Anticipated Revenues Summary Fund Sources Area FY 2008
Carry Forward Anticipated
FY 2009
USDOT Block Grants NHTSA Section 157 Incentive Discretinary Highway Safety $ 167,000 $ -FHWA Section 163 Discretinary Highway Safety $ 125,000 $ -FHWA Section 164 Impaired Driving and HSIP $ 28,013,438 $ 6,190,000 NHTSA Section 402 Discretinary Highway Safety $ 2,800,000 $ 2,700,000 NHTSA Section 405 Occupant Protection $ 445,000 $ -NHTSA Section 406 Discretinary Highway Safety $ 2,300,000 $ -NHTSA Section 408 Traffic Records $ 836,690 $ 500,000 NHTSA Section 410 Impaired Driving $ 680,000 $ 1,300,000 FHWA Section 1404 Safe Routes to School $ 3,432,000 $ 1,300,000 NHTSA Section 1906 Prohibit Racial Profiling $ 673,000 $ -NHTSA Section 2010 Motorcycle Safety $ - $ 100,000 NHTSA Section 2011 Child Passenger Safety $ - $ 360,000
Subtotal $ 39,472,128 $ 12,450,000
Other Revenues ODOT Youth Programs - TOF $ - $ 93,000 ODOT School Zones $ - $ 18,000 ODOT Work Zone Enforcement/Education $ - $ 1,800,000 Private Donation Speed Outreach $ 3,000 $ -DHS Grant Impaired Driving $ - $ 10,000 $28 per MC Endorsement Motorcycle Safety $ - $ 1,000,000 $6 per License Driver Education (SDTF) $ - $ 3,125,000 ODOT DMV - Flat State Match (Program Management) $ - $ 775,000 Highway Fund Regional Match (Program Management) $ 400,000
Subtotal $ 3,000 $ 7,221,000
FY 2008 FY 2009 Federal Revenues $ 39,472,128 $ 12,450,000 State/Other Revenues $ 3,000 $ 7,221,000 Total $ 39,475,128 $ 19,671,000
FY 2009 Federal Revenues $ 51,922,128 State/Other Revenues $ 7,224,000 Total $ 59,146,128
97

Fund Program Area FY 2009 Anticipated Revenues402 PS Bicycle Safety $ 125,000 $ 125,000
SDTF DE Driver Education Reimbursement $ 2,100,000 SDTF DE Driver Education WOU $ 300,000 SDTF DE Driver Education Statewide Services $ 300,000 $ 2,700,000
402 EM Emergency Medical Services $ 35,000 $ 35,000
164 HE HEP Projects (HSIP) $ 32,873,438 406 RS Roadway Safety $ 410,000 406 PT Chain Enforcement $ 50,000 ODOT RS Workzone Enforcement/Education $ 1,800,000 $ 35,133,438
164 AL Impaired Driving Projects $ 650,000 410 AL Impaired Driving Projects $ 1,880,000 DHS AL Impaired Driving Projects $ 10,000 $ 2,540,000
402 TC Judicial Information/Education $ 30,000 402 DE Safe and Courteous Driving $ 125,000 402 DE Employer Safety $ 10,000 402 DE Information/Education $ 125,000 406 DE Information/Education $ 125,000 $ 415,000
2010 MC Motorcycle Safety $ 100,000 ODOT DMV-$28 MC Motorcycle Safety $ 950,000 402 CL Equipment $ 10,000 $ 1,060,000
405 J2 Occupant Protection Projects $ 445,000 2011 K3 CPS-Booster $ 360,000 402 OP Occupant Protection Projects $ 600,000 157 OP Occupant Protection Projects $ 167,000 $ 1,572,000
402 PS Pedestrian Projects $ 130,000 $ 130,000
1906 K10 Prohibit Racial Profiling $ 673,000 $ 673,000
163 Regional Projects - Region 1 $ 25,000 163 Regional Projects - Region 2 $ 25,000 163 Regional Projects - Region 3 $ 25,000 163 Regional Projects - Region 4 $ 25,000 163 Regional Projects - Region 5 $ 25,000 $ 125,000
402 SA Safe Communities Projects $ 480,000 $ 480,000
1404 Safe Routes to School $ 4,642,000 $ 4,642,000
402 SC Speed Control Projects $ 850,000 Private Donation SE OTSC Speed $ 3,000 $ 853,000
408 TS Traffic Records $ 1,336,690 $ 1,336,690
402 DE Youth Projects $ 170,000 TOF DE Youth Projects $ 93,000 ODOT DE School Zone $ 18,000 $ 281,000
164 PA PA Planning and Administration $ 80,000 164 Flex RS Program Management $ 600,000 402 PA Planning and Administration $ 250,000 402 DE Driver Education (Program Management) $ 2,560,000 406 DE Driver Education (Program Management) $ 1,715,000 410 AL Impaired Driving (Program Management) $ 100,000 1404 Safe Routes to School (Program Management) $ 90,000 ODOT DMV - Flat State Match (Program Management) $ 775,000 ODOT DMV-$28 MC Motorcycles (Program Management) $ 50,000 SDTF DE Driver Education (Program Management) $ 425,000 Highway Fund Regional Match (Program Management) $ 400,000 $ 7,045,000
Total $ 59,146,128
2009 Anticipated Revenues by Program Area
98
Project Funding Narratives
Federal Revenue
Section 157
Occupant Protection
OSP Safety Belt Overtime Enforcement $85,000 Year-round overtime enforcement will be conducted by state police field units towards increasing compliance with safety belt/child restraint laws with coordination by OSP Patrol Division. Concurrent enforcement of speed and other traffic laws will be included. Participating agencies will attend pre-blitz training, coordinate with media, and conduct three (3) two-week enforcement blitzes.
TSD - Occupant Protection Law Enforcement Training $82,000 TSD staff will design and deliver two (2) Three Flags Campaign pre-blitz training workshops. This grant covers costs of conference facilities, participant food/lodging, speakers, announcements, meeting materials, follow-up mailings, and program awards and incentives.
Total Section 157 Funds $167,000
Regional Services
Region 1 – Regional Services
Section 163
$25,000 a. Prioritize 20 high crash locations from state “Top 10%” list with significant speed, alcohol, or drug
involvement. Develop action plans with four or more governmental or volunteer agencies for targeted crash reduction efforts.
b. Provide mini-grants or equipment to local agencies to address identified local safety problems, vitalize local safety committees or address multi-modal safety issues.
c. Provide for safety training to staff in the Regional office and to leaders in the community. Provide safety materials for public information and education for 15 events or approximately 45,000 contacts.
Region 2 – Regional Services $25,000 This project provides for the dissemination of transportation safety education in all of our Region communities. Outreach and education will be done through local Safety Fairs, Safety Committees, and safety presentations in local schools. We will partner with existing groups in our area to further the reach of transportation safety messages. This project will coordinate with Region 2 Traffic and area maintenance to provide minor engineering fixes for safety issues on local streets in our area. These fixes could include delineation, signing and basic improvements to the road that will result in safer conditions for the traveling public.
Region 3 - Regional Services $25,000 This project provides transportation safety coordination and services throughout ODOT's Region 3 by providing information and education on a variety of issues, coordinating traffic safety activities, and
99

working with traffic safety organizations. Small mini-grants will be provided to local jurisdictions or nonprofit organizations to address identified problems.
Region 4 – Regional Services $25,000 This project provides for traffic safety coordination and services throughout Region 4, which includes Crook, Deschutes, Gilliam, Jefferson, Klamath, Lake, Sherman, Wasco and Wheeler counties and all communities within. Project provides transportation safety education, outreach and enforcement resources and information to a wide variety of community based traffic safety programs. This project works closely with local law enforcement to provide data, equipment and education on transportation safety issues. Small local education projects may also be included in this project based on community need.
Region 5 – Regional Services $25,000 This project provides traffic safety coordination and services throughout Region 5, which encompasses the eight most eastern counties in the State of Oregon. This project provides education and enforcement information and resources to a variety of community-based traffic safety programs. This project works closely with law enforcement to provide data, equipment and education on traffic safety issues. This project coordinates activities throughout the region as an outreach for traffic safety education.
Total Section 163 Funds $125,000
Section 164 (Current and Prior Year)
Impaired Driving
DUII Statewide Services $50,000 This project specifically addresses a comprehensive training program for police, prosecutors, and judges on new laws, technology, methods, and techniques for success. Courses are offered statewide on a variety of topics such as enforcement of impaired driving laws and use of in-vehicle video cameras. A separate grant is created to provide for prosecutor and judges training.
DUII Court 1– XXXX County $75,000 Funds for this project will support a program coordinator for the DUII Court within this county. This position is critical to the oversight, organization and tracking of offenders while they are participating in the DISP program.
DUII Court 2– XXXX County $75,000 Funds for this project will support a program coordinator for the DUII Court within this county. This position is critical to the oversight, organization and tracking of offenders while they are participating in the DISP program.
DUII Court 3– XXXX County $75,000 Funds for this project will support a program coordinator for the DUII Court within this county. This position is critical to the oversight, organization and tracking of offenders while they are participating in the DISP program.
100

DUII Court 4– XXXX County $75,000 Funds for this project will support a program coordinator for the DUII Court within this county. This position is critical to the oversight, organization and tracking of offenders while they are participating in the DISP program.
DUII Court 5– XXXX County $75,000 Funds for this project will support a program coordinator for the DUII Court within this county. This position is critical to the oversight, organization and tracking of offenders while they are participating in the DISP program.
DUII Court 6– XXXX County $75,000 Funds for this project will support a program coordinator for the DUII Court within this county. This position is critical to the oversight, organization and tracking of offenders while they are participating in the DISP program.
DUII Prosecutor $150,000 This project provides an expert DUII prosecutor who serves as a resource to other prosecutors in handling the complex DUII laws. The DUII Prosecutor will travel throughout Oregon to assist with complex DUII cases.
Roadway Safety / Safety Corridor
TEA-21 2007 HSIP $5,188,547 This FFY 2009 Section 164 grant consists of continuation of several safety enhancement projects selected from eligible Oregon Hazard Elimination Program (HEP) projects. The projects were part of the FFY 2008 and will be continued within FFY 2009.
TEA-21 Lane Departure Initiative $6,171,533 This FFY 2009 Section 164 grant provides continuation of the project implementation for projects previously selected by the Highway Safety Engineering Committee (HSEC) during FFY 2006. These projects focus on the Lead State Initiative for Lane Departure Crashes.
TEA-21 HSEC 2007 Safety Initiatives $9,009,836 This FFY 2009 grant provides the continuation of safety project implementation of projects previously selected by the Highway Safety Engineering Committee (HSEC) during the FFY 2007.
TEA-21 HSEC 2008 Safety Initiatives $6,387,522 This FFY 2009 grant provides continuation of infrastructure safety enhancement projects to the state highway system. Projects were originally selected by the Highway Safety Engineering Committee (HSEC) during FFY 2008.
TEA-21 HSEC 2009 Safety Initiatives $6,116,000 This FFY 2009 grant provides infrastructure safety enhancement projects to the state highway system. Projects are selected by the Highway Safety Engineering Committee (HSEC) during FFY 2009.
101

Planning and Administration
Planning and Administration $80,000 Salaries, benefits, travel, services and supplies and office equipment will be funded for administrative personnel.
Program Management
Program Management $600,000 Salaries, benefits, travel, services and supplies and office equipment will be funded for program personnel.
Total Section 164 $34,203,438
Section 402 Bicycle Safety
Statewide Services $30,000 These funds will be used for implementation of the Annual Bicycle Helmet Observational Study; a portion of the TSD telephone citizen opinion surveys done annually in May and August; updates and reprints of existing informational resources such as, brochures and flyers; working with the TSD media contract creative team to continue to implement an informational campaign that encourages motorists to share the road with bicyclists.
Bicyclist Safety Mini-Grant Program $40,000 Provide funding for implementation of a statewide bicyclist safety mini-grant program to be administered by the Alliance for Community Traffic Safety, Oregon.
Bicyclist Safety Education Training $45,000 Provide funding to the Bicycle Transportation Alliance (BTA of Portland, Oregon) to continue the institutionalization of its Bicycle Safety Education Program in Oregon. This program, which has well over 50 percent match funds, is providing direct program service to primarily technical advice and assistance. Currently they provide the program to schools in six regional communities throughout the state: Portland Metro, Eugene/Springfield, Bend, Corvallis/Albany, Ashland, Rogue Valley, and Salem.
Community Cycling Center Safety Clinics $10,000 Provide Funding to the Community Cycling Center of Portland, Oregon, to continue the institutionalization of its Bicycle Safety Clinics and Bike Resource Centers at Marysville Elementary School. Using City of Portland Traffic Investigations data, CCC will identify school locations where data indicates youth bicyclists at risk and work with other schools to implement the safety clinics using the previous schools as models.
102

Emergency Medical Services
EMS Statewide Services $15,000 This project will assist in development and implementation of Oregon’s EMS Statewide Plan.
Governor John A. Kitzhaber, MD, Community Hospital Traffic Safety Grant $20,000 The purpose of the grant is to fund community hospitals and/or their EMS providers for projects that affect the treatment and outcome of traffic-related injuries.
Equipment
Statewide Services – Equipment $10,000 This project will contribute to the annual division telephone survey that includes questions around Equipment Safety; update and reprint brochures, flyers and other resource materials; contribute to the Public Information and Education contract to continue a campaign around motorist awareness of equipment safety issues.
Judicial
Judicial Education $30,000 To provide traffic safety related education to Oregon Municipal, Justice, and Circuit Court Judges. To work with State Circuit Courts, Court Administrators, and District Attorneys by providing traffic law training, materials, or topical experts to assist in education delivery.
Occupant Protection
Statewide Services Project (Gard & Gerber/Intercept Research/TSD) $220,000 This project will fund contracted design and distribution of public information/education campaign materials. This grant also provides in-house development of public information/education campaign materials including design, adaptation, translation/diversity outreach, reproduction and distribution of printed or taped media -- primarily for ODOT Storeroom distribution to public upon request. Three statewide observed use surveys will be conducted and reported to TSD. Two of the surveys, required by NHTSA, will be conducted surrounding the “Click It or Ticket” enforcement and will observe driver and right front seating. A third survey will observe all seating positions.
OSSA Safety Belt Overtime Enforcement $380,000 Year-round overtime enforcement will be conducted by local sheriff's offices towards increasing compliance with safety belt/child restraint laws with coordination by Oregon State Sheriffs Association. Concurrent enforcement of speed and other traffic laws will be included. Participating agencies will attend pre-blitz training, coordinate with media, and conduct three (3) two-week enforcement blitzes.
Pedestrian Safety
Statewide Services $30,000 Contribute to the annual division telephone survey that includes questions around Pedestrian Safety Enforcement awareness; update and reprint brochures, flyers and other resource materials; contribute to the Public Information and Education contract to continue a campaign around motorist awareness of pedestrians.
103
Pedestrian Safety Enforcement and Training $100,000 Fund the pedestrian safety enforcement (PSE) mini-grant program to include operations, training and evaluation, and diversion classes, to be administered by the Willamette Pedestrian Coalition and the Bicycle Transportation Alliance of Portland, Oregon.
Safe Communities
Statewide Services – Driver Education $125,000 This grant is split funded along with Impaired Driving, Motorcycle Safety, Occupant Protection, Roadway Safety, Pedestrian Safety and Bicyclist Safety (these other areas contribute additional funds over and above the Driver Education funding portion). This grant funds Public Information and Education activities, opinion and observational research (Belt, Helmet Surveys, DUII Sentencing Report, Public Information and Education Attitude Survey), training, mini-grants and special events. This grant will provide for costs associated with development of the Transportation Safety Action Plan revision.
At Risk Driver Information/Education $1,000 This project will provide funds to allow Driver and Motor Vehicle Services to develop and distribute messages and/or countermeasures targeted to reduce the instance and severity of crashes that result in injury and death. The efforts will specifically target the behaviors of medically or otherwise at risk drivers. This project will provide for development of countermeasures designed to reach at-risk populations and their influence groups. Examples of influence groups include family members, peers, and service providers.
Oregon State Police Community Education $1,000 This project will provide funds to allow the Oregon State Police to raise awareness of traffic safety issues that affect the communities where they patrol. The funds will make media materials available to the general public, to increase awareness of the need for voluntary compliance and/or enforcement of laws relating to specific traffic safety behaviors that result in crash related injury and death.
Employer Education Project $10,000 This project will be used to provide training and coordination targeted at reducing the incidence and severity of crashes which cause injury and death to Oregonians who are engaged in travel related to work. The project will allow for training, education and materials encouraging crash reducing changes in behavior among Oregon employers and employees.
Portland Safe Community $98,000 This project will use the previously developed elements of the Safe Community concept within the City of Portland, and surrounding communities. The project will continue work to develop and expand the Safe Community coalition, develop data gathering and sharing processes, further development and integrate safety plans, and implement projects identified through the Safe Community model for addressing transportation related injury and death. The project is focusing on implementing the plan developed for improvement of the 82nd Avenue high crash corridor.
104

Clackamas County Safe Community $98,000 This project will continue to integrate the elements of the Safe Community concept within Clackamas County, and will encourage partnerships with cities within the county. The project will allow work to develop and expand the work of the Safe Community coalition, develop data gathering and sharing processes, further development and integration of safety plans, and implementation of projects identified through the Safe Community model for addressing transportation related injury and death.
Safe Community Mini-Grants $50,000 Often described as the mini-grant program, this project encourages local activity by offering small-scale grants to local traffic safety commissions. The dual goals are to initiate special projects that have the potential to make a real impact on identified local problems, and to stimulate increased activity and health of local traffic safety groups. The project will seek to focus on speed, teen girls, and motorcycles where possible.
Innovative Community Projects $1,000 This project will offer small mini-grants or partnership dollars to communities that team local traffic safety committees and other local groups in new and/or innovative ways to address traffic safety behaviors. A portion of the funds may be used to provide materials or products that are identified by the local groups.
ACTS Oregon Safe Community Services $120,000 The project will provide in-person training, mentoring, technical assistance, special projects, and advocacy through access to a community traffic safety specialist. The project will provide deployment and monitoring of mini-grant program(s). This project will offer local traffic safety advocates access to additional technical assistance via weekday 1-800 telephone line, and newsletters. This project will provide for scholarships to the annual transportation safety conference. This project will also assist communities in involvement projects to promote volunteerism.
Malheur County Coordinator $30,000 This project will provide funds for a part time local safe community coordinator for the Malheur county area. The coordinator position will complement the existing coalition in Malheur County, and provide further organization allowing greater output from the existing coalitions. Project focus and direction will be determined by problem identification process. The project will develop a business plan for the Safe Community group.
Grant County Coordinator $30,000 This project will provide funds for a project activity in Grant County. Grant County has developed an active Safe Community coalition, and has identified new projects to improve traffic safety in the county. Project focus and direction will be determined by problem identification process. The project will develop a business plan for the safe community group.
Harney County Coordinator $20,000 This project will provide funds for a part time local safe community coordinator for the Harney County area. The coordinator position will complement the coalition in Harney County, and focus on providing organization which is will allowing greater output from the new coalition. Project focus and direction will be determined by problem identification process. The project will develop a business plan for the Safe Community group.
105
New Safe Community Project $1,000 This project will provide for beginning the process of establishing a Safe Community project in an Oregon city or county. The project will provide for a coordinator to gather identify coalition partners, data sources, and establish a data set. The project will perform a problem identification process, and identify promising projects that are appropriate for the Safe Community model. If time and resources allow, the project will begin developing projects in this first year grant.
Rogue Valley Safe Community Project $30,000 This project will provide for establishing a Safe Community project in the Rogue Valley. The project provides for a coordinator to identify and gather coalition partners, data sources, and establish a data set. The project will perform a problem identification process, and develop a business plan for the Safe Community group. The project will identify promising projects that are appropriate for the Safe Community model. If time and resources allow, the project will begin developing projects in this first year grant.
Safe and Courteous Driving $125,000 This project will provide public information, education and training regarding the need for Safe and Courteous Driving as a sub grant of the statewide services grant. Activities such as public awareness campaigns and associated training will be funded.
Speed Control
Speed Enforcement Public Information/Equipment $725,000 This project will be used to fund police overtime, equipment for speed enforcement to city, county and state police agencies, automation of police forms (such as crash reporting and citations to enhance the level of traffic law-enforcement and efficiencies). This project will also be used to fund focused police training courses in deficient areas in addition to Public Information and Education outreach in the areas of speed, following-too-closely and Fail to maintain safe distance from emergency vehicle issues. Additionally funds will be used to support other priority Traffic Law-Enforcement related functions.
OSP Rural State Highway Speed Enforcement $125,000 This project will be used to purchase overtime speed enforcement from the Oregon State Police on rural state highways in areas that through statistical crash analysis show a high incidence of speed-related crashes, injuries and fatalities.
Youth Program
Trauma Nurses Talk Tough – Train the Trainer $20,000 This project provides funding to continue statewide training of trauma care providers to teach the TNTT program. TNTT’s effective presentations address bicycle safety, and other wheeled sport safety (skateboards, rollerblades, scooters), high-risk drivers, seat belt use, impaired driving and speed. This project will also focus on training providers how to implement family transportation safety education. TNTT also contacts Network members every quarter to provide support and offer assistance, sends updated information and statistics in the form of a newsletter and conducts trainings for schools and other community groups on how to hold helmet sales and 8 hour trainings for child safety seat clinics.
106
Bike Wheels to Steering Wheels $20,000 This project will provide family traffic safety awareness education for Middle School students in 7th and 8th grades and their parents in the Portland Public School District MESA Clubs and Science and Health classrooms. The project will seek to provide proper exposure of basic traffic safety issues to youths prior to being licensed to drive and gives parents of these youths the opportunity to learn and use the tools for their involvement in the process. For the 08-09 federal fiscal year, TNTT will have a presence at the National Science Teachers Association Conference to promote the Bike Wheels to Steering Wheels curriculum to Science Teachers in statewide school districts.
School Resource Officer Training $30,000 This project will provide funding for trainings for school resource officers on identifying and targeting areas of the leading traffic safety causes of injury and death for ages 15-20. Also addressed may be legislative updates on other youth related laws and traffic safety issues relating to elementary and middle school age children.
Statewide Services - Youth $100,000 This project provides guidance, assistance and materials supporting efforts toward improving traffic safety for Oregon youth. Topic areas include speeding, seat belt use, underage drinking, substance abuse, increased driver awareness and attentiveness, making safe and healthy choices, parental involvement with young drivers, media messages for youth, driver education and graduated driver licensing media, and brochure creation. This year’s funding may include further printing of the 2007 Oregon Transportation Safety Action Plan for Youth.
Planning and Administration
Planning and Administration Salaries, benefits, travel, services and supplies and office equipment will be funded for administrative personnel.
$250,000
Program Management
Program Management $2,560,000 [$775,000]
Salaries, benefits, travel, services and supplies and office equipment will be funded for program personnel.
Region Program Management
Region Program Management [$400,000] Salaries, benefits, travel, services and supplies and office equipment will be funded for region program personnel.
$5,500,000 Total Section 402 Funds [$1,175,000]
107

Section 405
Occupant Protection
OACP Safety Belt Overtime Enforcement $445,000 Year-round overtime enforcement will be conducted by local police departments towards increasing compliance with safety belt/child restraint laws with coordination by Oregon Association Chiefs of Police. Concurrent enforcement of speed and other traffic laws will be included. Participating agencies will attend pre-blitz training, coordinate with media, and conduct three (3) two-week enforcement blitzes.
Total Section 405 Funds $445,000
Section 406
Roadway Safety
Engineering Safety Short Courses and Distance Learning $180,000 Provide safety engineering training to traffic engineers, analysts, transportation safety coordinators, enforcement personnel and public works staff and officials. Anticipated training will consist of the following: Traffic Engineer Fundamentals, Traffic Signal Design, Traffic Signal Timing, Designing Streets for Bicyclists, Designing Streets for Pedestrians, Design & Control for the Older Driver, Uniform Traffic Control Devices, Geometric Design & Urban Street Design. Alternatives may consist of Legal Aspects, Access Management, School Zones, Illumination and Lighting, Site Planning and Development, Safety Countermeasures and/or other safety related courses. Related materials are being posted to the internet for easy access. Approximately two local agencies will receive on-site traffic control device reviews by several specialists which will also be documented within a written program review.
Statewide Services – Roadway Safety $5,000 Purchase services for design and printing of Public Information and Education products relating to roadway safety and driver behavior. Purchase promotional products such as bags, buttons, stickers and brochures. Distribute message formats to appropriate individuals, agencies and organizations. Provide additional training services as necessary.
Safety Features for Local Roads and Streets $140,000 Provide traffic safety engineering training to local officials of smaller jurisdictions by holding workshops at various locations around the state for public works staff, local officials, and local traffic safety committees. Distribute the Traffic Practices Handbook and Quick Reference Guide to the 2003 Manual on Uniform Traffic Control Devices. Law Enforcement Training modules will continuously be enhanced and training sessions will be held.
Safety Corridor Education and Enforcement $85,000 Provide State and Local police agency overtime enforcement and education materials for priority safety corridors statewide. Continue annual planning process for all safety corridors maintaining designation.
108

Police Traffic Services
Chain Enforcement on Priority Mountain Passes $50,000 Identify priority mountain passes to provide State and Local police agency overtime enforcement to focus on commercial and passenger vehicle traction device compliance.
Statewide Services
Statewide Services $125,000 A comprehensive traffic safety public information program will be implemented. Materials and supplies developed through this project provide the general population with safe driving messages.
Program Management
Program Management $1,715,000 Salaries, benefits, travel, services and supplies and office equipment will be funded for program personnel.
Total Section 406 Funds $2,300,000
Section 408
Traffic Records
Traffic Records $1,336,690 Develop and implement a comprehensive transportation records and crash reporting program to manage and evaluate transportation safety. Identify barriers to full crash reporting and improve data capture, storage, and linkage. Encourage electronic field data collection for traffic citations and crash reports.
Total Section 408 Funds $1,336,690
Section 410
Impaired Driving
Statewide Services Program – DUII $460,000 A comprehensive traffic safety public information program will be implemented. Materials and supplies developed through this project provide the general population with safe driving messages relevant to alcohol and other intoxicating substances. DUII related PSAs in the form of billboards, print, water closet, television and radio will be aired. Surveys will be conducted.
DUII Overtime Enforcement Program - OSP $150,000 Oregon State Police continue to coordinate state enforcement with local police to enhance DUII enforcement in all 36 counties. Areas are selected with consideration to the relative DUII problem and willingness to participate. In a given area, OSP works with the county sheriff and/or one or more city police agencies to provide DUII enforcement. OSP provides DUII overtime patrol in all 36 counties throughout Oregon.
109
Drug Recognition Expert Training (DRE) $60,000 Provide training and coordination of the Oregon Drug Evaluation and Classification (DEC) Program and other related impaired driving programs in accordance with the International Association of Chief’s of Police (IACP) and NHTSA guidelines and recommendations.
Drug Recognition Expert Overtime Enforcement Project $60,000 Provides statewide overtime enforcement by DREs (Drug Recognition Experts) representing multiple law enforcement agencies.
ODAA/Law Enforcement "Protecting Lives Saving Futures" $50,000 This project funds a three-day training for new law enforcement and new prosecutors in the processes involved in a DUII arrest and conviction and encourages partnerships in dealing with the incidence of impaired driving.
DPSST/OLCC Inspector Training Project $2,000 This project provides funding for training of Oregon Liquor Control Commission inspectors at the police academy in relationship to evaluating service levels, determination of level of customer impairment and other DUII related issues. OLCC inspectors will undergo a four week training held at DPSST.
DISP – Portland Police Bureau $70,000 This project will fund the Portland Police Bureau Traffic Division to assist the Multnomah County DUII Intensive Supervision Program (DISP). This would provide direct law enforcement capability to the court based probation program. The primary function of the officers would be to conduct warrant sweeps.
Law Enforcement Spokesperson – DPSST $100,000 This project provides funding for the management and training of all DUII related law enforcement training in the State of Oregon. Training is held at various locations, to increase the number of certified trainers, provided mobile video training and conduct a survey of police agencies.
DUII Enforcement – OSSA Departments $353,000 Provides overtime patrol hours for law enforcement on DUII for roadways throughout Oregon. OSSA provides DUII overtime patrol in 30 counties throughout Oregon.
DUII Multi-Disciplinary Task Force Training Conference $50,000 This project provides funding for an annual training conference, specific to DUII issues, which includes all participating disciplines such as law enforcement, prosecutors, prevention and treatment professionals. This conference will be held in April of 2008. Over 380 people are expected to attend.
OSP Forensic Lab Equipment $200,000 This project provides funding to the OSP Forensic Laboratory for the purchase of equipment which will identify all impairing substances without limitations to specific substances.
OACP DUII Overtime Enforcement Project $325,000 This grant is a DUII overtime enforcement grant with Oregon Association of Chiefs of Police (OACP) to provide DUII leadership to city police departments throughout the state. Approximately 70 cities will received overtime funds for 2008.
110
Impaired Driving Program Management $100,000 Salaries, benefits, travel, services and supplies and office equipment will be funded for administrative personnel.
Total Section 410 Funds $1,980,000
Section 1404
Safe Routes to School
2005 Safe Routes to School Statewide Services Infrastructure $501,000 This is carry-over non-infrastructure funding to provide statewide outreach to communities in the promotion of Safe Routes to School activities focusing on education and encouragement, enforcement, engineering and evaluation.
2005 Safe Routes to School Grant ProgramThis is carry-over funding for reimbursement to communities, based on a competitive award process, for the implementation of the Safe Routes to School Action Plan addressing education and encouragement, enforcement, engineering and evaluation.
2006 Safe Routes to School Statewide Services Non-infrastructure $67,000 Infrastructure $507,000 This is carry-over non-infrastructure funding to provide statewide outreach to communities in the promotion of Safe Routes to School activities focusing on education and encouragement, enforcement, engineering and evaluation.
2006 Safe Routes to School Grant Program This is carry-over funding for reimbursement to communities, based on a competitive award process, for the implementation of the Safe Routes to School Action Plan addressing education and encouragement, enforcement, engineering and evaluation.
2007 Safe Routes to School Statewide Services Non-infrastructure $335,000 Infrastructure $692,000 This is carry-over non-infrastructure funding to provide statewide outreach to communities in the promotion of Safe Routes to School activities focusing on education and encouragement, enforcement, engineering and evaluation.
2007 Safe Routes to School Grant Program This is carry-over funding for reimbursement to communities, based on a competitive award process, for the implementation of the Safe Routes to School Action Plan addressing education and encouragement, enforcement, engineering and evaluation.
2008 Safe Routes to School Statewide Services Non-infrastructure $426,000 Infrastructure $904,000 This is carry-over non-infrastructure funding to provide statewide outreach to communities in the promotion of Safe Routes to School activities focusing on education and encouragement, enforcement, engineering and evaluation.
111

2008 Safe Routes to School Grant Program This is carry-over funding for reimbursement to communities, based on a competitive award process, for the implementation of the Safe Routes to School Action Plan addressing education and encouragement, enforcement, engineering and evaluation.
2009 Safe Routes to School Statewide Services Non-infrastructure $390,000 Infrastructure $820,000 This is carry-over non-infrastructure funding to provide statewide outreach to communities in the promotion of Safe Routes to School activities focusing on education and encouragement, enforcement, engineering and evaluation.
2009 Safe Routes to School Grant Program This is carry-over funding for reimbursement to communities, based on a competitive award process, for the implementation of the Safe Routes to School Action Plan addressing education and encouragement, enforcement, engineering and evaluation.
Safe Routes to School Program Management $90,000 Salaries, benefits, travel, services and supplies and office equipment will be funded for the Safe Routes to School Coordinator.
Total Section 1404 Funds $4,732,000
Section 1906
Racial Profiling Research
Racial Profiling Research $673,000 This project will be used to assist the Portland State University Criminal Justice Policy Research Institute Oregon Criminal Justice Commission in carrying out its’ duties of identifying and addressing issues surrounding racial profiling as it relates to traffic stops and Oregon Law-Enforcement.
Total Section 1906 Funds $673,000
Section 2010
Motorcycle Safety Program
Motorcycle Safety Program Enhancement Project $40,000 This project will provide funding for the enhancement of the state motorcycle safety training program through the purchase of training motorcycles, curriculum enhancement, vehicles, equipment and site lease and enhancement.
Statewide Services Program $50,000 This project will provide funding for Public Information and Education contract and campaign materials for motorist awareness of motorcycles.
112

Governor’s Advisory Committee on Motorcycle Safety $10,000 This project will provide funding for Public Information and Education motorist awareness materials based on priorities established by the Governor’s Advisory Committee on Motorcycle Safety.
Total Section 2010 Funds $100,000
Section 2011 Occupant Protection
ACTS Oregon Child Safety Seat Resource Center $180,000 The Center will provide the following ongoing services using a demand-based, first-come first-served approach to annual programming: nationally standardized child passenger safety training for technicians/instructors; informational presentations to parent, civic and other groups; technical assistance and referral services via 1-800 telephone line and website; and assistance with local inspection station staffing/coordination/advertising.
ACTS Oregon Child Safety Seat Resource Center – Low Income Assistance $50,000 This project provides funding for purchase and distribution of child seats and booster seats to low-income families within ODOT Region 1 (Portland Metro area and surrounding areas.)
TSD Regions - Enhancement of Community Level CPS Programs $130,000 This project will provide scholarships for CPS technician & instructor candidates, car seats and boosters for low income families, and equipment, supplies, and/or technical training to enhance the quality or capacity of child seat fitting stations, child seat distribution sites, and/or alternative sentencing programs having a significant CPS component.
Total Section 2011 Funds $360,000
113

Other Revenue
Private Donations
Speed Control
Speed Outreach This money is to be used for speed related purchases.
[$3,000]
Private Donations [$3,000]
Department of Human Services (DHS)
DUII Multi-Disciplinary Task Force Conference (Oregon DHS Grant) [$10,000] This project will provide funding for scholarships for professionals involved in the DUII process to attend the annual conference.
DHS [$10,000]
Student Driver Training Fund (SDTF)
Driver Education Program Reimbursement [$2,100,000] These funds reimburse public providers for their cost in providing driver education to students. Reimbursement is made to each public provider based on the number of students completing the driver education course, not to exceed $210 per student, the maximum allowed by law. Curriculum standards and delivery practices are met before reimbursement dollars are provided.
GDL Implementation - Information and Education [$300,000] These funds provide for trainer of trainers’ workshops and curriculum updates for ODOT-TSD. Funds also pay for a grant to Western Oregon University to train beginning instructors completing the three instructor preparation courses. Funds also support the driver education advisory committee quarterly meetings and support activities promoting “best practices” in driver education.
Statewide Services – Driver Education [$300,000] This grant is split funded along with Impaired Driving, Motorcycle Safety, Occupant Protection, Roadway Safety, Pedestrian Safety and Bicyclist Safety (these other areas contribute additional funds over and above the Driver Education funding portion). This grant funds Public Information and Education activities, opinion and observational research (Belt, Helmet Surveys, DUII Sentencing Report, Public Information and Education Attitude Survey), training, mini-grants and special events.
Student Driver Training Fund Program Management [$425,000] Salaries, benefits, travel, services and supplies and office equipment will be funded for Driver Education staff.
Total Section SDTF [$3,125,000]
114

Statewide Transportation Improvement Program (STIP)
School Zone
School Zone Local improvements at one or more school zones on a state highway.
[$18,000]
Work Zone Safety
Work Zone Education & Equipment Program [$150,000] Provide design, printing and distribution of promotional materials. Contractual services for development and distribution of work zone safety messages, posting of billboards, transit ads, radio ads and television ads. Contractual services for development of work zone data book and portions of the annual TSD Telephone Survey. Equipment purchases will consist of minor work zone related patrol equipment needed by state and local agencies providing work zone enforcement.
Work Zone Enforcement to OSP [$650,000] Provide special year-round enforcement patrols in work zones that meet federal design criteria for construction projects managed by ODOT. Enforcement will be provided by OSP. There is 28,368 overtime enforcement hours requested statewide for construction projects meeting these criteria during the 2007-2009 biennium. Photo radar in work zones as a pilot project may be included.
OBDU/P Work Zone Enforcement to OSP [$250,000] Provide special year-round enforcement patrols in work zones that meet federal design criteria for construction projects managed by ODOT Oregon Bridge Delivery Unit through its’ consultant Oregon Bridge Development Partners. Enforcement will be provided by OSP. There is 22,259 overtime enforcement hours requested statewide for construction projects meeting these criteria during the 2007-2009 biennium. Photo radar in work zones as a pilot project may be included.
Work Zone Enforcement to Local Police Agencies [$650,000] Provide special year-round enforcement patrols in work zones that meet federal design criteria for construction projects managed by ODOT. Enforcement will be provided by various local police agencies statewide. There is 13,083 overtime enforcement hours requested statewide for construction projects meeting these criteria during the 2007-2009 biennium. Photo radar in work zones as a pilot project may be included.
OBDU/P Work Zone Enforcement to Local Police Agencies [$100,000] Provide special year-round enforcement patrols in work zones that meet federal design criteria for construction projects managed by ODOTs Oregon Bridge Delivery Unit through its' consultant Oregon Bridge Development Partners. Enforcement will be provided by various local police agencies statewide. There is 1,166 overtime enforcement hours requested statewide for construction projects meeting these criteria during the 2007-2009 biennium. Photo radar in work zones as a pilot project may be included.
Total STIP Funds [$1,818,000]
115
Transportation Operating Fund (TOF)
Youth Safety
Think First [$46,500] This project addresses the high incidence of brain and spinal cord injuries suffered by Oregon’s youth through the deployment of Think First Injury Prevention programs. The Think First programs for grades kindergarten through 12 grade will be implemented in classrooms throughout Oregon. Presentations will be provided for participating school programs and a portion of the grant allows for participation in community outreach events. An increased presence of the program throughout the state will be promoted.
Trauma Nurses Talk Tough [$46,500] This funding supports the ongoing and expanding work of TNTT. TNTT conducts safety education programs for kindergarten through college, helps develop and participate in statewide safety promotional events, participates in research and data collection about traumatic injuries, promotes proper use of bicycle helmets, safety belts and car seats and works with other partners to provide safety information to high risk youth, including parents whenever possible.
Total TOF Funds [$93,000]
State Funds
Motorcycle Safety
Motorcycle Safety Program Management [$50,000] Salaries, benefits, travel, services and supplies and office equipment will be funded for the Motorcycle program manager.
$1 Statewide Motorcycle Safety Project [$104,000] This project will provide funding for membership in the National Association of State Motorcycle Administrators, public information and education, equipment expenses for the TEAM OREGON Motorcycle Safety program and observation use survey. This project also supports projects prioritized by the Governor’s Advisory Committee on Motorcycle Safety and includes committee member travel and meeting expenses.
Oregon State University TEAM OREGON [$846,000] This project will provide funding for training sites and daily operation of statewide motorcycle safety project. Daily operation includes: Mobile Program courses, instructor training, instructor update workshops, instructor and training location monitoring, public information and education activities by staff and instructors (public awareness presentations, fairs, mall shows, Sober Graduation presentations, motorcycle events, etc.) and daily operational functions. Training sites include site assistance, statewide liability insurance, equipment, printing and materials.
Total State Funds [$1,000,000]
116
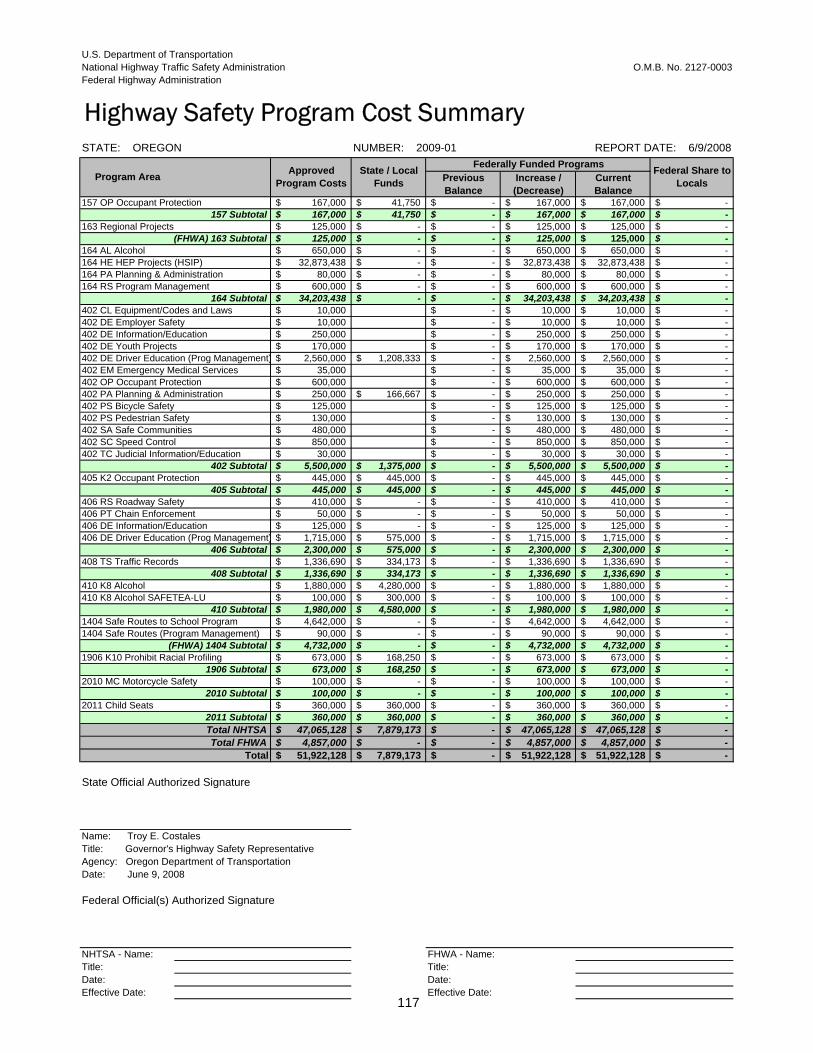
U.S. Department of Transportation National Highway Traffic Safety Administration Federal Highway Administration
O.M.B. No. 2127-0003
Highway Safety Program Cost SummarySTATE: OREGON NUMBER: 2009-01 REPORT DATE: 6/9/2008
Program Area Approved Program Costs
State / Local Funds
Federally Funded Programs Federal Share to LocalsPrevious
Balance Increase / (Decrease)
Current Balance
157 OP Occupant Protection 167,000$ 41,750$ $ - 167,000$ 167,000$ -$ 157 Subtotal 167,000$ 41,750$ $ - 167,000$ 167,000$ -$
163 Regional Projects 125,000$ -$ $ - 125,000$ 125,000$ -$ (FHWA) 163 Subtotal 125,000$ -$ $ - 125,000$ 125,000$ -$
164 AL Alcohol 650,000$ -$ $ - 650,000$ 650,000$ -$ 164 HE HEP Projects (HSIP) 32,873,438$ -$ $ - 32,873,438$ 32,873,438$ -$ 164 PA Planning & Administration 80,000$ -$ $ - 80,000$ 80,000$ -$ 164 RS Program Management 600,000$ -$ $ - 600,000$ 600,000$ -$
164 Subtotal 34,203,438$ -$ $ - 34,203,438$ 34,203,438$ -$ 402 CL Equipment/Codes and Laws 10,000$ $ - 10,000$ 10,000$ -$ 402 DE Employer Safety 10,000$ $ - 10,000$ 10,000$ -$ 402 DE Information/Education 250,000$ $ - 250,000$ 250,000$ -$ 402 DE Youth Projects 170,000$ $ - 170,000$ 170,000$ -$ 402 DE Driver Education (Prog Management) 2,560,000$ 1,208,333$ $ - 2,560,000$ 2,560,000$ -$ 402 EM Emergency Medical Services 35,000$ $ - 35,000$ 35,000$ -$ 402 OP Occupant Protection 600,000$ $ - 600,000$ 600,000$ -$ 402 PA Planning & Administration 250,000$ 166,667$ $ - 250,000$ 250,000$ -$ 402 PS Bicycle Safety 125,000$ $ - 125,000$ 125,000$ -$ 402 PS Pedestrian Safety 130,000$ $ - 130,000$ 130,000$ -$ 402 SA Safe Communities 480,000$ $ - 480,000$ 480,000$ -$ 402 SC Speed Control 850,000$ $ - 850,000$ 850,000$ -$ 402 TC Judicial Information/Education 30,000$ $ - 30,000$ 30,000$ -$
402 Subtotal 5,500,000$ 1,375,000$ $ - 5,500,000$ 5,500,000$ -$ 405 K2 Occupant Protection 445,000$ 445,000$ $ - 445,000$ 445,000$ -$
405 Subtotal 445,000$ 445,000$ $ - 445,000$ 445,000$ -$ 406 RS Roadway Safety 410,000$ -$ $ - 410,000$ 410,000$ -$ 406 PT Chain Enforcement 50,000$ -$ $ - 50,000$ 50,000$ -$ 406 DE Information/Education 125,000$ -$ $ - 125,000$ 125,000$ -$ 406 DE Driver Education (Prog Management) 1,715,000$ 575,000$ $ - 1,715,000$ 1,715,000$ -$
406 Subtotal 2,300,000$ 575,000$ $ - 2,300,000$ 2,300,000$ -$ 408 TS Traffic Records 1,336,690$ 334,173$ $ - 1,336,690$ 1,336,690$ -$
408 Subtotal 1,336,690$ 334,173$ $ - 1,336,690$ 1,336,690$ -$ 410 K8 Alcohol 1,880,000$ 4,280,000$ $ - 1,880,000$ 1,880,000$ -$ 410 K8 Alcohol SAFETEA-LU 100,000$ 300,000$ $ - 100,000$ 100,000$ -$
410 Subtotal 1,980,000$ 4,580,000$ $ - 1,980,000$ 1,980,000$ -$ 1404 Safe Routes to School Program 4,642,000$ -$ $ - 4,642,000$ 4,642,000$ -$ 1404 Safe Routes (Program Management) 90,000$ -$ $ - 90,000$ 90,000$ -$
(FHWA) 1404 Subtotal 4,732,000$ -$ $ - 4,732,000$ 4,732,000$ -$ 1906 K10 Prohibit Racial Profiling 673,000$ 168,250$ $ - 673,000$ 673,000$ -$
1906 Subtotal 673,000$ 168,250$ $ - 673,000$ 673,000$ -$ 2010 MC Motorcycle Safety 100,000$ -$ $ - 100,000$ 100,000$ -$
2010 Subtotal 100,000$ -$ $ - 100,000$ 100,000$ -$ 2011 Child Seats 360,000$ 360,000$ $ - 360,000$ 360,000$ -$
2011 Subtotal 360,000$ 360,000$ $ - 360,000$ 360,000$ -$ Total NHTSA 47,065,128$ 7,879,173$ $ - 47,065,128$ 47,065,128$ -$ Total FHWA 4,857,000$ -$ $ - 4,857,000$ 4,857,000$ -$
Total 51,922,128$ 7,879,173$ $ - 51,922,128$ 51,922,128$ -$
State Official Authorized Signature
Name: Troy E. Costales Title: Governor's Highway Safety Representative Agency: Oregon Department of Transportation Date: June 9, 2008
Federal Official(s) Authorized Signature
NHTSA - Name: FHWA - Name: Title: Title: Date: Date: Effective Date: Effective Date:
117

118
Highway Safety Plan
Oregon’s federal grant funds will be used to implement projects that are designed to respond to identified problems and impact performance goals. Federal funds will be used consistent with federal program guidelines, priority areas, and other federal funding requirements.
Since strategies designed to impact individual program areas are intimately related to specific problems and performance goals for that program, they are not included here. See specific program areas for the strategies planned for individual programs.
This Performance Plan has been formally approved and adopted by the Governor’s Representative for Highway Safety.
Date Troy E. Costales, Administrator Governor’s Representative for Highway Safety Transportation Safety Division Oregon Department of Transportation
119

120
State Certifications and Assurances
Failure to comply with applicable Federal statutes, regulations and directives may subject State officials to civil or criminal penalties and/or place the State in a high risk grantee status in accordance with 49 CFR §18.12.
Each fiscal year the State will sign these Certifications and Assurances that the State complies with all applicable Federal statutes, regulations, and directives in effect with respect to the periods for which it receives grant funding. Applicable provisions include, but not limited to, the following:
o 23 U.S.C. Chapter 4 - Highway Safety Act of 1966, as amended;
o 49 CFR Part 18 - Uniform Administrative Requirements for Grants and Cooperative Agreements to State and Local Governments
o 49 CFR Part 19 - Uniform Administrative Requirements for Grants and Agreements with Institutions of Higher Education, Hospitals and Other Nonprofit Organizations
o 23 CFR Chapter II - (§§1200, 1205, 1206, 1250, 1251, & 1252) Regulations governing highway safety programs
o NHTSA Order 462-6C - Matching Rates for State and Community Highway Safety Programs
o Highway Safety Grant Funding Policy for Field-Administered Grants
Certifications and Assurances
The Governor is responsible for the administration of the State highway safety program through a State highway safety agency which has adequate powers and is suitably equipped and organized (as evidenced by appropriate oversight procedures governing such areas as procurement, financial administration, and the use, management, and disposition of equipment) to carry out the program (23 USC 402(b) (1) (A));
The political subdivisions of this State are authorized, as part of the State highway safety program, to carry out within their jurisdictions local highway safety programs which have been approved by the Governor and are in accordance with the uniform guidelines promulgated by the Secretary of Transportation (23 USC 402(b) (1) (B));
At least 40 per cent of all Federal funds apportioned to this State under 23 USC 402 for this fiscal year will be expended by or for the benefit of the political subdivision of the State in carrying out local highway safety programs (23 USC 402(b) (1) (C)), unless this requirement is waived in writing;
The State will implement activities in support of national highway safety goals to reduce motor vehicle related fatalities that also reflect the primary data-related crash factors within the State as identified by the State highway safety planning process, including:
o National law enforcement mobilizations,
o Sustained enforcement of statutes addressing impaired driving, occupant protection, and driving in excess of posted speed limits,
121
o An annual statewide safety belt use survey in accordance with criteria established by the Secretary for the measurement of State safety belt use rates to ensure that the measurements are accurate and representative,
o Development of statewide data systems to provide timely and effective data analysis to support allocation of highway safety resources.
The State shall actively encourage all relevant law enforcement agencies in the State to follow the guidelines established for vehicular pursuits issued by the International Association of Chiefs of Police that are currently in effect.
This State's highway safety program provides adequate and reasonable access for the safe and convenient movement of physically handicapped persons, including those in wheelchairs, across curbs constructed or replaced on or after July 1, 1976, at all pedestrian crosswalks (23 USC 402(b) (1) (D));
Cash drawdowns will be initiated only when actually needed for disbursement, cash disbursements and balances will be reported in a timely manner as required by NHTSA, and the same standards of timing and amount, including the reporting of cash disbursement and balances, will be imposed upon any secondary recipient organizations (49 CFR 18.20, 18.21, and 18.41). Failure to adhere to these provisions may result in the termination of drawdown privileges);
The State has submitted appropriate documentation for review to the single point of contact designated by the Governor to review Federal programs, as required by Executive Order 12372 (Intergovernmental Review of Federal Programs);
Equipment acquired under this agreement for use in highway safety program areas shall be used and kept in operation for highway safety purposes by the State; or the State, by formal
agreement with appropriate officials of a political subdivision or State agency, shall cause such equipment to be used and kept in operation for highway safety purposes (23 CFR 1200.21);
The State will comply with all applicable State procurement procedures and will maintain a financial management system that complies with the minimum requirements of 49 CFR 18.20;
The State highway safety agency will comply with all Federal statutes and implementing regulations relating to nondiscrimination. These include but are not limited to: (a) Title VI of the Civil Rights Act of 1964 (P.L. 88-352) which prohibits discrimination on the basis of race, color or national origin (and 49 CFR Part 21); (b) Title IX of the Education Amendments of 1972, as amended (20 U.S.C. §§ 1681-1683, and 1685-1686), which prohibits discrimination on the basis of sex; (c) Section 504 of the Rehabilitation Act of 1973, as amended (29 U.S.C. §794), which prohibits discrimination on the basis of handicaps (and 49 CFR Part 27); (d) the Age Discrimination Act of 1975, as amended (42U.S.C. §§ 6101-6107), which prohibits discrimination on the basis of age; (e) the Drug Abuse Office and Treatment Act of 1972 (P.L. 92-255), as amended, relating to nondiscrimination on the basis of drug abuse; (f) the comprehensive Alcohol Abuse and Alcoholism Prevention, Treatment and Rehabilitation Act of 1970(P.L. 91-616), as amended, relating to nondiscrimination on the basis of alcohol abuse of alcoholism; (g) §§ 523 and 527 of the Public Health Service Act of 1912 (42 U.S.C. §§ 290 dd-3 and 290 ee-3), as amended, relating to confidentiality of alcohol and drug abuse patient records; (h) Title VIII of the Civil Rights Act of 1968 (42 U.S.C. §§ 3601 et seq.), as amended, relating to nondiscrimination in the sale, rental or financing of housing; (i) any other nondiscrimination provisions in the specific statute(s) under which application for Federal assistance is being made; and, (j) the
122
requirements of any other nondiscrimination statute(s) which may apply to the application.
The Drug-free Workplace Act of 1988 (49 CFR Part 29 Sub-part F):
The State will provide a drug-free workplace by:
a. Publishing a statement notifying employees that the unlawful manufacture, distribution, dispensing, possession or use of a controlled substance is prohibited in the grantee's workplace and specifying the actions that will be taken against employees for violation of such prohibition;
b. Establishing a drug-free awareness program to inform employees about:
1. The dangers of drug abuse in the workplace.
2. The grantee's policy of maintaining a drug-free workplace.
3. Any available drug counseling, rehabilitation, and employee assistance programs.
4. The penalties that may be imposed upon employees for drug violations occurring in the workplace.
c. Making it a requirement that each employee engaged in the performance of the grant be given a copy of the statement required by paragraph (a).
d. Notifying the employee in the statement required by paragraph (a) that, as a condition of employment under the grant, the employee will –
1. Abide by the terms of the statement.
2. Notify the employer of any criminal drug statute conviction for a violation occurring in the workplace no later than five days after such conviction.
e. Notifying the agency within ten days after receiving notice under subparagraph (d) (2) from an employee or otherwise receiving actual notice of such conviction.
f. Taking one of the following actions, within 30 days of receiving notice under subparagraph (d) (2), with respect to any employee who is so convicted –
1. Taking appropriate personnel action against such an employee, up to and including termination.
2. Requiring such employee to participate satisfactorily in a drug abuse assistance or rehabilitation program approved for such purposes by a Federal, State, or local health, law enforcement, or other appropriate agency.
g. Making a good faith effort to continue to maintain a drug-free workplace through implementation of paragraphs (a), (b), (c), (d), (e), and (f) above.
Buy America Act
The State will comply with the provisions of the Buy America Act (23 USC 101 Note) which contains the following requirements:
Only steel, iron and manufactured products produced in the United States may be purchased with Federal funds unless the Secretary of Transportation determines that such domestic purchases would be inconsistent with the public interest; that such materials are not reasonably available and of a satisfactory quality; or that inclusion of domestic materials will increase the cost of the overall project contract by more than 25 percent. Clear justification for the purchase of non-domestic items must be in the form of a waiver request submitted to and approved by the Secretary of Transportation.
123

Political Activity (Hatch Act)
The State will comply with the provisions of 5 U.S.C. §§ 1501-1508 and implementing regulations of 5 CFR Part 151, concerning "Political Activity of State or Local Offices, or Employees".
Certification Regarding Federal Lobbying
Certification for Contracts, Grants, Loans, and Cooperative Agreements
The undersigned certifies, to the best of his or her knowledge and belief, that:
1. No Federal appropriated funds have been paid or will be paid, by or on behalf of the undersigned, to any person for influencing or attempting to influence an officer or employee of any agency, a Member of Congress, an officer or employee of Congress, or an employee of a Member of Congress in connection with the awarding of any Federal contract, the making of any Federal grant, the making of any Federal loan, the entering into of any cooperative agreement, and the extension, continuation, renewal, amendment, or modification of any Federal contract, grant, loan, or cooperative agreement.
2. If any funds other than Federal appropriated funds have been paid or will be paid to any person for influencing or attempting to influence an officer or employee of any agency, a Member of Congress, an officer or employee of Congress, or an employee of a Member of Congress in connection with this Federal contract, grant, loan, or cooperative agreement, the undersigned shall complete and submit Standard Form-LLL, "Disclosure Form to Report Lobbying," in accordance with its instructions.
3. The undersigned shall require that the language of this certification be included in the award documents for all sub-award at all tiers (including subcontracts, subgrants, and contracts under grant, loans, and cooperative agreements) and that all subrecipients shall certify and disclose accordingly.
This certification is a material representation of fact upon which reliance was placed when this transaction was made or entered into. Submission of this certification is a prerequisite for making or entering into this transaction imposed by section 1352, title 31, U.S. Code. Any person who fails to file the required certification shall be subject to a civil penalty of not less than $10,000 and not more than $100,000 for each such failure.
Restriction on State Lobbying
None of the funds under this program will be used for any activity specifically designed to urge or influence a State or local legislator to favor or oppose the adoption of any specific legislative proposal pending before any State or local legislative body. Such activities include both direct and indirect (e.g., "grassroots") lobbying activities, with one exception. This does not preclude a State official whose salary is supported with NHTSA funds from engaging in direct communications with State or local legislative officials, in accordance with customary State practice, even if such communications urge legislative officials to favor or oppose the adoption of a specific pending legislative proposal.
Certification Regarding Debarment and Suspension
Instructions for Primary Certification
1. By signing and submitting this proposal, the prospective primary participant is providing the certification set out below.
124

2. The inability of a person to provide the certification required below will not necessarily result in denial of participation in this covered transaction. The prospective participant shall submit an explanation of why it cannot provide the certification set out below. The certification or explanation will be considered in connection with the department or agency's determination whether to enter into this transaction. However, failure of the prospective primary participant to furnish a certification or an explanation shall disqualify such person from participation in this transaction.
3. The certification in this clause is a material representation of fact upon which reliance was placed when the department or agency determined to enter into this transaction. If it is later determined that the prospective primary participant knowingly rendered an erroneous certification, in addition to other remedies available to the Federal Government, the department or agency may terminate this transaction for cause or default.
4. The prospective primary participant shall provide immediate written notice to the department or agency to which this proposal is submitted if at any time the prospective primary participant learns its certification was erroneous when submitted or has become erroneous by reason of changed circumstances.
5. The terms covered transaction, debarred, suspended, ineligible, lower tier covered transaction, participant, person, primary covered transaction, principal, proposal, and voluntarily excluded, as used in this clause, have the meaning set out in the Definitions and coverage sections of 49 CFR Part 29. You may contact the department or agency to which this proposal is being submitted for assistance in obtaining a copy of those regulations.
6. The prospective primary participant agrees by submitting this proposal that, should the proposed covered transaction be entered into, it shall not knowingly enter into any lower tier covered transaction with a person who is proposed for debarment under 48 CFR Part 9, subpart 9.4, debarred, suspended, declared ineligible, or voluntarily excluded from participation in this covered transaction, unless authorized by the department or agency entering into this transaction.
7. The prospective primary participant further agrees by submitting this proposal that it will include the clause titled "Certification Regarding Debarment, Suspension, Ineligibility and Voluntary Exclusion-Lower Tier Covered Transaction," provided by the department or agency entering into this covered transaction, without modification , in all lower tier covered transactions and in all solicitations for lower tier covered transactions.
8. A participant in a covered transaction may rely upon a certification of a prospective participant in a lower tier covered transaction that it is not proposed for debarment under 48 CFR Part 9, subpart 9.4, debarred, suspended, ineligible, or voluntarily excluded from the covered transaction, unless it knows that the certification is erroneous. A participant may decide the method and frequency by which it determines the eligibility of its principals. Each participant may, but is not required to, check the list of Parties Excluded from Federal Procurement and Non-procurement Programs.
9. Nothing contained in the foregoing shall be construed to require establishment of a system of records in order to render in good faith the certification required by this clause. The knowledge and information of a participant is not required to exceed that which is normally possessed by a prudent person in the ordinary course of business dealings.
125

10.Except for transactions authorized under paragraph 6 of these instructions, if a participant in a covered transaction knowingly enters into a lower tier covered transaction with a person who is proposed for debarment under 48 CFR Part 9, subpart 9.4, suspended, debarred, ineligible, or voluntarily excluded from participation in this transaction, in addition to other remedies available to the Federal Government, the department or agency may terminate this transaction for cause or default.
Certification Regarding Debarment, Suspension, and Other Responsibility Matters-Primary Covered Transactions
1. The prospective primary participant certifies to the best of its knowledge and belief, that its principals:
(a) Are not presently debarred, suspended, proposed for debarment, declared ineligible, or voluntarily excluded by any Federal department or agency;
(b) Have not within a three-year period preceding this proposal been convicted of or had a civil judgment rendered against them for commission of fraud or a criminal offense in connection with obtaining, attempting to obtain, or performing a public (Federal, State or local) transaction or contract under a public transaction; violation of Federal or State antitrust statutes or commission of embezzlement, theft, forgery, bribery, falsification or destruction of record, making false statements, or receiving stolen property;
(c) Are not presently indicted for or otherwise criminally or civilly charged by a governmental entity (Federal, State or Local) with commission of any of the offenses enumerated in
paragraph (1)(b) of this certification; and
(d) Have not within a three-year period preceding this application/proposal had one or more public transactions (Federal, State, or local) terminated for cause or default.
2. Where the prospective primary participant is unable to certify to any of the Statements in this certification, such prospective participant shall attach an explanation to this proposal.
Instructions for Lower Tier Certification
1. By signing and submitting this proposal, the prospective lower tier participant is providing the certification set out below.
2. The certification in this clause is a material representation of fact upon which reliance was placed when this transaction was entered into. If it is later determined that the prospective lower tier participant knowingly rendered an erroneous certification, in addition to other remedies available to the Federal government, the department or agency with which this transaction originated may pursue available remedies, including suspension and/or debarment.
3. The prospective lower tier participant shall provide immediate written notice to the person to which this proposal is submitted if at any time the prospective lower tier participant learns that its certification was erroneous when submitted or has become erroneous by reason of changed circumstances.
4. The terms covered transaction, debarred, suspended, ineligible, lower tier covered transaction, participant, person, primary covered transaction, principal, proposal, and voluntarily excluded, as used in this clause, have the meanings set out in the Definition and Coverage sections of 49
126
8. Nothing contained in the foregoing shall be construed to require establishment of a system of records in order to render in good faith the certification required by this clause. The knowledge and information of a participant is not required to exceed that which is normally possessed by a prudent person in the ordinary course of business dealings.
9. Except for transactions authorized under paragraph 5 of these instructions, if a participant in a covered transaction knowingly enters into a lower tier covered transaction with a person who is proposed for debarment under 48 CFR Part 9, subpart 9.4, suspended, debarred, ineligible, or voluntarily excluded from participation in this transaction, in addition to other remedies available to the Federal government, the department or agency with which this transaction originated may pursue available remedies, including suspension and/or debarment.
Certification Regarding Debarment, Suspension, Ineligibility and Voluntary Exclusion -- Lower Tier Covered Transactions:
1. The prospective lower tier participant certifies, by submission of this proposal, that neither it nor its principals is presently debarred, suspended, proposed for debarment, declared ineligible, or voluntarily excluded from participation in this transaction by any Federal department or agency.
2. Where the prospective lower tier participant is unable to certify to any of the statements in this certification, such prospective participant shall attach an explanation to this proposal.
CFR Part 29. You may contact the person to whom this proposal is submitted for assistance in obtaining a copy of those regulations.
5. The prospective lower tier participant agrees by submitting this proposal that, should the proposed covered transaction be entered into, it shall not knowingly enter into any lower tier covered transaction with a person who is proposed for debarment under 48 CFR Part 9, subpart 9.4, debarred, suspended, declared ineligible, or voluntarily excluded from participation in this covered transaction, unless authorized by the department or agency with which this transaction originated.
6. The prospective lower tier participant further agrees by submitting this proposal that is it will include the clause titled "Certification Regarding Debarment, Suspension, Ineligibility and Voluntary Exclusion -- Lower Tier Covered Transaction," without modification, in all lower tier covered transactions and in all solicitations for lower tier covered transactions. (See below)
7. A participant in a covered transaction may rely upon a certification of a prospective participant in a lower tier covered transaction that it is not proposed for debarment under 48 CFR Part 9, subpart 9.4, debarred, suspended, ineligible, or voluntarily excluded from the covered transaction, unless it knows that the certification is erroneous. A participant may decide the method and frequency by which it determines the eligibility of its principals. Each participant may, but is not required to, check the List of Parties Excluded from Federal Procurement and Non-procurement Programs.
127

Environmental Impact
The Governor's Representative for Highway Safety has reviewed the State's Fiscal Year 2009 highway safety planning document and hereby declares that no significant environmental impact will result from implementing this Highway Safety Plan. If, under a future revision, this Plan will be modified in such a manner that a project
would be instituted that could affect environmental quality to the extent that a review and statement would be necessary, this office is prepared to take the action necessary to comply with the National Environmental Policy Act of 1969 (42 USC 4321 et seq.) and the implementing regulations of the Council on Environmental Quality (40 CFR Parts 1500-1517).
Date Troy E. Costales Governor’s Representative for Highway Safety ODOT Transportation Safety Division
128

State Certifications and Assurances
Failure to comply with applicable Federal Certifications and Assurances statutes, regulations and directives may subject State officials to civil or criminal The Governor is responsible for the penalties and/or place the State in a high risk administration of the State highway safety grantee status in accordance with 4 9 CFR program through a State highway safety 918.12. agency which has adequate powers and is
suitably equipped and organized (as Each fiscal year the State will sign these evidenced by appropriate oversight procedures Certifications and Assurances that the State governing such areas as procurement, complies with all applicable Federal statutes, financial administration, and the use, regulations, and directives in effect with management, and disposition of equipment) to respect to the periods for which it receives carry out the program (23 USC 402(b) (1) (A)); grant funding. Applicable provisions include, but not limited to, the following: The political subdivisions of this State are
authorized, as part of the State highway safety o 23 U.S.C. Chapter 4 - Highway Safety program, to carry out within their jurisdictions
Act of 1966, as amended; local highway safety programs which have been approved by the Governor and are in
o 49 CFR Part 18 - Uniform accordance with the uniform guidelines Administrative Requirements for Grants promulgated by the Secretary of and Cooperative Agreements to State Transportation (23 USC 402(b) (1) (B)); and Local Governments
At least 40 per cent of all Federal funds o 49 CFR Part 1 9 - Uniform apportioned to this State under 23 USC 402
Administrative Requirements for Grants for this fiscal year will be expended by or for and Agreements with Institutions of the benefit of the political subdivision of the Higher Education, Hospitals and Other State in carrying out local highway safety Nonprofit Organizations programs (23 USC 402(b) (1) (C)), unless this
requirement is waived in writing; o 23 CFR Chapter It - (991200, 1205,
1206,1250,1251, & 1252) The State will implement activities in support Regulations governing highway safety of national highway safety goals to reduce programs motor vehicle related fatalities that aIs6 reflect
the primary data-related crash factors within o NHTSA Order 462-6C - Matching Rates the State as identified by the State highway
for State and Community Highway safety planning process, including: Safety Programs
o National law enforcement o Highway Safety Grant Funding Policy for mobilizations,
Field-Administered Grants o Sustained enforcement of statutes
addressing impaired driving, occupant protection, and driving in excess of posted speed limits,

o An annual statewide safety belt use agreement with appropriate officials of a survey in accordance with criteria political subdivision or State agency, shall established by the Secretary for the cause such equipment to be used and kept in measurement of State safety belt use operation for highway safety purposes (23 CFR rates to ensure that the measurements 1200.21); are accurate and representative,
The State will comply with all applicable State o Development of statewide data procurement procedures and will maintain a
systems to provide timely and effective financial management system that complies data analysis to support allocation of with the minimum requirements of 49 CFR highway safety resources. 18.20;
The State shall actively encourage all relevant The State highway safety agency will comply law enforcement agencies in the State to with all Federal statutes and implementing follow the guidelines established for vehicular regulations relating to nondiscrimination. pursuits issued by the International These include but are not limited to: (a) Title VI Association of Chiefs of Police that are of the Civil Rights Act of 1964 (P.L. 88-352) currently in effect. which prohibits discrimination on the basis of
race, color or national origin (and 49 CFR Part This State's highway safety program provides 21); (b) Title IX of the Education Amendments adequate and reasonable access for the safe of 1972, as amended (20 U.S.C. 55 1681- and convenient movement of physically 1683, and 1685-1686), which prohibits handicapped persons, including those in discrimination on the basis of sex; (c) Section wheelchairs, across curbs constructed or 504 of the Rehabilitation Act of 1973, as replaced on or after July 1, 1976, at all amended (29 U.S.C. 5794), which prohibits pedestrian crosswalks (23 USC 402(b) (1) (D)); discrimination on the basis of handicaps (and
49 CFR Part 27); (d) the Age Discrimination Act Cash drawdowns will be initiated only when of 1975, as amended (42U.S.C. 53 6101- actually needed for disbursement, cash 6107), which prohibits discrimination on the disbursements and balances will be reported basis of age; (e) the Drug Abuse Office and in a timely manner as required by NHTSA, and Treatment Act of 1972 (P,L. 92-255), as the same standards of timing and amount, amended, relating to nondiscrimination on the including the reporting of cash disbursement basis of drug abuse; (f) the comprehensive and balances, will be imposed upon any Alcohol Abuse and Alcoholism Prevention, secondary recipient organizations (49 CFR Treatment and Rehabilitation Act of 1970(P.L. 18.20, 18.21, and 18.41). Failure to adhere 91-616), as amended, relating40 to these provisions may result in the nondiscrimination on the basis 07 dlcohol termination of drawdown privileges); abuse of alcoholism; (g) 55 523 and 527 of
the Public Health Service Act of 1912 (42 The State has submitted appropriate U.S.C. 55 290 dd-3 and 290 ee-3), as documentation for review to the single point of amended, relating to confidentiality of alcohol contact designated by the Governor to review and drug abuse patient records; (h) Title Vlll of Federal programs, as required by Executive the Civil Rights Act of 1968 (42 U.S.C. 55 Order 12372 (Intergovernmental Review of 3601 et seq.), as amended, relating to Federal Programs); nondiscrimination in the sale, rental or
financing of housing; (i) any other Equipment acquired under this agreement for nondiscrimination provisions in the specific use in highway safety program areas shall be statute(s) under which application for Federal used and kept in operation for highway safety assistance is being made; and, (j) the purposes by the State; or the State, by formal

requirements of any other nondiscrimination statute(s) which may apply to the application. e. Notifying the agency within ten days after
receiving notice under subparagraph (d) (2) The Drug-free Workslace Act of 1988 from an employee or otherwise receiving (49 CFR Part 29 Sub- art F): actual notice of such conviction.
The State will provide a drug-free workplace f. Taking one of the following actions, within by: 3 0 days of receiving notice under
subparagraph (d) (2), with respect to any a. Publishing a statement notifying employee who is so convicted -
employees that the unlawful manufacture, distribution, dispensing, possession or use 1. Taking appropriate personnel action of a controlled substance is prohibited in against such an employee, up to and the grantee's workplace and specifying the including termination. actions that will be taken against employees for violation of such prohibition; 2. Requiring such employee to participate
satisfactorily in a drug abuse b. Establishing a drug-free awareness assistance or rehabilitation program
program to inform employees about: approved for such purposes by a Federal, State, or local health, law
1. The dangers of drug abuse in the enforcement, or other appropriate workplace. agency.
2. The grantee's policy of maintaining a drug-free workplace. g. Making a good faith effort to continue to
maintain a drug-free workplace through 3. Any available drug counseling, implementation of paragraphs (a), (b), (c),
rehabilitation, and employee assistance (d), (e), and (f) above. programs.
Buy America Act 4. The penalties that may be imposed
upon employees for drug violations The State will comply with the provisions of the occurring in the workplace. Buy America Act (23 USC 101 Note) which
contains the following requirements: c. Making it a requirement that each
employee engaged in the performance of Only steel, iron and manufactured p r~duc ts the grant be given a copy of the statement produced in the United States may be / < required by paragraph (a). purchased with Federal funds unless the
Secretary of Transportation determines that d. Notifying the employee in the statement such domestic purchases would be
required by paragraph (a) that, as a inconsistent with the public interest; that such condition of employment under the grant, materials are not reasonably available and of the employee will - a satisfactory quality; or that inclusion of
domestic materials will increase the cost of 1. Abide by the terms of the statement. the overall project contract by more than 25
percent. Clear justification for the purchase of 2. Notify the employer of any criminal drug non-domestic items must be in the form of a
statute conviction for a violation waiver request submitted to and approved by occurring in the workplace no later than the Secretary of Transportation. five days after such conviction.

Political Activity (Hatch Act) 3. The undersigned shall require that the language of this certification be included in
The State will comply with the provisions of 5 the award documents for all sub-award at U.S.C. 55 1501-1508 and implementing all tiers (including subcontracts, subgrants, regulations of 5 CFR Part 151, concerning and contracts under grant, loans, and "Political Activity of State or Local Offices, or cooperative agreements) and that all Employees". subrecipients shall certify and disclose
accordingly. Certification Regarding Federal Lobbying
This certification is a material representation Certification for Contracts, Grants, Loans, and of fact upon which reliance was placed when Cooperative Agreements this transaction was made or entered into.
Submission of this certification is a The undersigned certifies, to the best of his or prerequisite for making or entering into this her knowledge and belief, that: transaction imposed by section 1352, title 31.,
U.S. Code. Any person who fails to file the No Federal appropriated funds have been required certification shall be subject to a civll paid or will be paid, by or on behalf of the penalty of not less than $10,000 and not more undersigned, to any person for influencing than $100,000 for each such failure. or attempting to influence an officer or employee of any agency, a Member of Restriction on State Lobbving Congress, an officer or employee of Congress, or an employee of a Member of None of the funds under this program w ~ l l be Congress in connection with the awarding used for any activity specifically designed to of any Federal contract, the making of any urge or influence a State or local legislator to federal grant, the making of any Federal favor or oppose the adoption of any spec~flc loan, the entering into of any cooperative legislative proposal pending before any St illas agreement, and the extension, or local legislative body. Such activities ~nc'ltiCfPb continuation, renewal, amendment, or both direct and indirect (e.g., "grassroots"f modification of any Federal contract, grant, lobbying activities, with one exception. This loan, or cooperative agreement. does not preclude a State official whoso r;r~si&r$r
is supported with NHTSA funds from en$agtf.rg 2. If any funds other than Federal in direct communications with State of lucnl
appropriated funds have been paid or will legislative officials, in accordance wtth be paid to any person for influencing or customary State practice, even tf such attempting to influence an officer or communications urge legislative-off ICI& t9 employee of any agency, a Member of favor or oppose the adoption of a Speerftc Congress, an officer or employee of pending legislative proposal. Congress, or an employee of a Member of Congress in connection with this Federal Certification RegardinP D e b a m M contract, grant, loan, or cooperative Suspension agreement, the undersigned shall complete and submit Standard Form-LLL, Instructions for Primarv CertificaUufi "Disclosure Form to Report Lobbying," in accordance with its instructions. 1. By signing and submittrng thts @)trrtk
the prospective primary partrcrt~n~~' - providing the certificatton set r u t *

2. The inability of a person to provide the 6. The prospective primary participant agrees certification required below will not by submitting this proposal that, should the necessarily result in denial of participation proposed covered transaction be entered in this covered transaction. The into, it shall not knowingly enter into any prospective participant shall submit an lower tier covered transaction with a explanation of why it cannot provide the person who is proposed for debarment certification set out below. The certification under 48 CFR Part 9, subpart 9.4, or explanation will be considered in debarred, suspended, declared ineligible, connection with the department or or voluntarily excluded from participation in agency's determination whether to enter this covered transaction, unless authorized into this transaction. However, failure of by the department or agency entering into the prospective primary participant to this transaction. furnish a certification or an explanation shall disqualify such person from 7 . The prospective primary participant further participation in this transaction. agrees by submitting this proposal that it
will include the clause titled "Certification 3. The certification in this clause is a material Regarding Debarment, Suspension,
representation of fact upon which reliance Ineligibility and Voluntary Exclusion-Lower was placed when the department or Tier Covered Transaction," provided by the agency determined to enter into this department or agency entering into this transaction. If it is later determined that covered transaction, without modification , the prospective primary participant in all lower tier covered transactions and in knowingly rendered an erroneous all solicitations for lower tier covered certification, in addition to other remedies transactions. available to the Federal Government, the department or agency may terminate this 8. A participant in a covered transaction may transaction for cause or default. rely upon a certification of a prospective
participant in a lower tier covered 4. The prospective primary participant shall transaction that it is not proposed for
provide immediate written notice to the debarment under 48 CFR Part 9, subpart department or agency to which this 9.4, debarred, suspended, ineligible, or proposal is submitted if at any time the voluntarily excluded from the covered prospective primary participant learns its transaction, unless it knows that the certification was erroneous when certification is erroneous. A participant may submitted or has become erroneous by decide the method and frequency by which reason of changed circumstances. it determines the eligibility of its principals.
Each participant may, but is not reqlQired 5. The terms covered transaction, debarred, to, check the list of Parties Excluded fiom
suspended, ineligible, lower tier covered Federal Procurement and Non- transaction, participant, person, primary procurement Programs. covered transaction, principal, proposal, and voluntarily excluded, as used in this 9. Nothing contained in the foregoing shall be clause, have the meaning set out in the construed to require establishment of a Definitions and coverage sections of 4 9 system of records in order to render in CFR Part 29. You may contact the good faith the certification required by this department or agency to which this clause. The knowledge and information of proposal is being submitted for assistance a participant is not required to exceed that in obtaining a copy of those regulations. which is normally possessed by a prudent
person in the ordinary course of business dealings.

paragraph ( l ) (b) of this certification; 10.Except for transactions authorized under and
paragraph 6 of these instructions, if a participant in a covered transaction (d) Have not within a three-year period knowingly enters into a lower tier covered preceding this application/proposaI transaction with a person who is proposed had one or more public transactions for debarment under 48 CFR Part 9, (Federal, State, or local) terminated for subpart 9.4, suspended, debarred, cause or default. ineligible, or voluntarily excluded from participation in this transaction, in addition 2. Where the prospective primary participant to other remedies available to the Federal is unable to certify to any of the Government, the department or agency Statements in this certification, such may terminate this transaction for cause or prospective participant shall attach an default. explanation to this proposal.
Certification Regarding Debarment, Instructions for Lower Tier Certification Suspension, and Other Reswonsibilitv Matters- Primary Covered Transactions 1. By signing and submitting this proposal,
the prospective lower tier participant is 1. The prospective primary participant providing the certification set out below.
certifies to the best of its knowledge and belief, that its principals: 2. The certification in this clause is a material
representation of fact upon which reliance (a) Are not presently debarred, suspended, was placed when this transaction was
proposed for debarment, declared entered into. If it is later determined that ineligible, or voluntarily excluded by any the prospective lower tier participant Federal department or agency; knowingly rendered an erroneous
certification, in addition to other rgmedtes (b) Have not within a three-year period available to the Federal government, the
preceding this proposal been convicted department or agency with which this of or had a civil judgment rendered transaction originated may pursue against them for commission of fraud available remedies, including suspenslorl or a criminal offense in connection with and/or debarment. obtaining, attempting to obtain, or performing a public (Federal, State or 3. The prospective lower tier participant shrtll local) transaction or contract under a provide immediate written notice to tha public transaction; violation of Federal person to which this proposal is subnl~ttrrtl or State antitrust statutes or if at any time the prospective lower tier commission of embezzlement, theft, participant learns that its certificatlor, WIR forgery, bribery, falsification or erroneous when submitted or has becclnfgb destruction of record, making false erroneous by reason of changed statements, or receiving stolen circumstances. property;
4. The terms covered transaction, rfebbrrr (c) Are not presently indicted for or suspended, ineligible, lower tier covawd
otherwise criminally or civilly charged transaction, participant, persot?, prlmrrl by a governmental entity (Federal, covered transaction, principal, 1)ropne.r State or Local) with commission of any and voluntarily excluded, as usntl in 7')
of the offenses enumerated in clause, have the meanings srt ocjt l t ~ Definition and Coverage sectlotis {xi d'l

CFR Part 29. You may contact the person 8. Nothing contained in the foregoing shall be to whom this proposal is submitted for construed to require establishment of a assistance in obtaining a copy of those system of records in order to render in regulations. good faith the certification required by this
clause. The knowledge and information of 5. The prospective lower tier participant a participant is not required to exceed that
agrees by submitting this proposal that, which is normally possessed by a prudent should the proposed covered transaction person in the ordinary course of business be entered into, it shall not knowingly enter dealings. into any lower tier covered transaction with a person who is proposed for debarment 9. Except for transactions authorized under under 4 8 CFR Part 9, subpart 9.4, paragraph 5 of these instructions, if a debarred, suspended, declared ineligible, participant in a covered transaction or voluntarily excluded from participation in knowingly enters into a lower tier covered this covered transaction, unless authorized transaction with a person who is proposed by the department or agency with which for debarment under 4 8 CFR Part 9, this transaction originated. subpart 9.4, suspended, debarred,
ineligible, or voluntarily excluded from 6. The prospective lower tier participant participation in this transaction, in addition
further agrees by submitting this proposal to other remedies available to the Federal that is it will include the clause titled government, the department or agency "Certification Regarding Debarment, with which this transaction originated may Suspension, Ineligibility and Voluntary pursue available remedies, including Exclusion - Lower Tier Covered suspension and/or debarment. Transaction," without modification, in all lower tier covered transactions and in all Certification RegardinP Debarment, solicitations for lower tier covered Sus~ension, Ineli,gibiIitv and Voluntary transactions. (See below) Exclusion -- Lower Tier Covered Transactions:
7. A participant in a covered transaction may The prospective lower tier participant rely upon a certification of a prospective certifies, by submission of this proposal, participant in a lower tier covered that neither it nor its principals is presently transaction that it is not proposed for debarred, suspended, proposed for debarment under 48 CFR Part 9, subpart debarment, declared ineligible, or 9.4, debarred, suspended, ineligible, or voluntarily excluded from participation in voluntarily excluded from the covered this transaction by any Federal department transaction, unless it knows that the or agency. i
certification is erroneous. A participant may decide the method and frequency by which 2. Where the prospective lower tier it determines the eligibility of its principals. participant is unable to certify to any of the Each participant may, but is not required statements in this certification, such to, check the List of Parties Excluded from prospective participant shall attach an Federal Procurement and Non- explanation to this proposal. procurement Programs.
Environmental lm~ac t
The Governor's Representative for Highway Safety has reviewed the State's Fiscal Year 2009 highway safety planning document and hereby declares that no significant environmental impact will result from implementing this Highway Safety Plan. If, under a future revision, this Plan will be modified in such a manner that a project
Date ~ o v e r 6 r ' s ~6~reben ta t i ve for High way Safety ODOT Transportation Safety Division
would be instituted that could affect environmental quality to the extent that a review and statement would be necessary, this office is prepared to take the action necessary to comply with the National Environmental Policy Act of 1969 (42 USC 4321 et seq.) and the implementing regulations of the Council on Environmental Quality (40 CFR Parts 1500- 1517).