impacto econÓmico y social del capital de riesgo … · décadas, y ciclos económicos, operando y...
TRANSCRIPT

INFORME / SURVEYIMPACTO ECONÓMICO Y SOCIAL
DEL CAPITAL DE RIESGO EN ESPAÑA
ECONOMIC AND SOCIAL IMPACT OF VENTURE CAPITAL & PRIVATE EQUITY IN SPAIN
2010

La Asociación Española de Entidades de Capital-Riesgo (ASCRI) nace en 1986, sin ánimo de lucro, y tiene por objeto la representación,gestión y defensa de los intereses profesionales de sus socios, así como la promoción y el impulso de la creación de entidades cuyo ob-jeto sea la toma de participaciones temporales en el capital de empresas no financieras cuyos valores no coticen en el primer mercadode las Bolsas de Valores.
The Spanish Venture Capital Association (ASCRI) is a non profit association that was set up in 1986 to represent, manage and defend itsmembers’ professional interests, and to foster and promote the creation of companies whose corporate purpose consists of acquiring tem-porary stakes in the capital of non-financial companies whose shares are not quoted on the primary market of the Stock Exchanges.
Este informe ha sido elaborado por / this report has been produced by:José Martí Pellón / Universidad Complutense de MadridMarcos Salas de la Hera / Webcapitalriesgo.comDominique Barthel / Directora General de ASCRI
All rights reserved. ASCRI / webcapitalriesgo. 2010
Este documento puede descargarse de forma gratuita en:
www.ascri.orgwww.webcapitalriesgo.comwww.cdti.orgwww.pwc.com/es
Registration at the intellectual Property Registry: in progress.
INFORME / SURVEYIMPACTO ECONÓMICO Y SOCIAL
DEL CAPITAL DE RIESGO EN ESPAÑA
ECONOMIC AND SOCIAL IMPACT OF VENTURE CAPITAL & PRIVATE EQUITY IN SPAIN
2010
Patrocinado por/Sponsored by:

Para que un país prospere necesita un sistema de innovación dinámico y saludable, que cuente con buenos centros de investigación,tanto públicos como privados, adecuados mecanismos de transferencia del conocimiento, emprendedores dispuestos a afrontarnuevos retos y, por supuesto, financiación. Las entidades de capital riesgo son una parte importante del sistema al dotar de capitaly experiencia en la gestión a las PYMEs más innovadoras. El CDTI, en su afán por disponer de información rigurosa e independien-te de los distintos componentes de la innovación, quiere seguir apoyando, por quinto año consecutivo, este informe, que per-mite conocer el impacto real de esta actividad en la economía española.
Maurici LucenaDirector General del CDTI
Desde los inicios de la crisis en los mercados de crédito muchas voces han estado cuestionando el modelo de LBO y su futuroen un entorno de crédito menos benigno. No obstante, lo que muchos olvidan es que los gestores de Private Equity llevan variasdécadas, y ciclos económicos, operando y creando valor sin contar con las condiciones de los años dorados de liquidez de crédi-to. Porque su modelo de negocio radica en poner recursos económicos a disposición de los mejores gestores del mercado y moti-varles vía su conversión en accionistas de las empresas donde crean valor. Y eso es un modelo que funciona en cualquier momen-to del ciclo económico y crediticio. Las pruebas de su aportación están aquí en este informe, que demuestra el mayor crecimien-to de las compañías participadas por fondos Private Equity en términos de ventas, resultados y, especialmente, en creación deempleo, respecto a sus homólogas que no están respaldadas por el Private Equity. En el escenario actual, el modelo de PrivateEquity basado en conseguir modelos operativos eficientes e impulsar sólidas estrategias de crecimiento, tiene un papel crucial quedesempeñar en el retorno de la economía hacia un crecimiento sostenible. Por ello, desde PwC hemos hecho una decidida apues-ta por el sector, sabedores del rol que el Capital Riesgo y Private Equity desempeña en las economías.
Malcolm Lloyd Socio responsable de Transacciones y Private Equity PricewaterhouseCoopers
3
1. Carta del Presidente de ASCRI ........................................................................................................................ASCRI Chairman’s letter
2. Resumen del Informe de Impacto .....................................................................................................................Summary of Impact Report
3. El Capital Riesgo genera empleo de forma acelerada ...........................................................................................Venture Capital & Private Equity generate employment on an accelerated basis
4. El Capital Riesgo estimula el crecimiento y mejora la competitividad .......................................................................Venture Capital & Private Equity stimulate growth and improve competitiveness
5. El apoyo a empresas en sus primeras etapas impulsa un crecimiento acelerado y aumenta su esperanza de vida ...........Support to companies in their initial phases drives accelerated growth and increases life expectancy
6. La financiación de empresas en expansión tiene un efecto multiplicador en la economía ............................................Financing companies under expansion has a multiplying effect on the economy
7. El Capital Riesgo crea empleo y riqueza también en las empresas maduras ..............................................................Private Equity also creates employment and wealth at mature companies
8. El impacto del Capital Riesgo en diferentes sectores ............................................................................................The impact of Venture Capital & Private Equity on different sectors
9. Metodología del estudio y cuadros estadísticos.....................................................................................................Methodology of the study and statistical tables
4
6
8
8
10
12
14
16
26
Índice/Contents

4
1. ASCRI Chairman’s Letter
The objective of this annual report (in its fifth edition) is to measure venture capital & private equity’s contribution towards eco-nomic and social development in Spain. With this new edition, we once again demonstrate the positive impact of Venture Capital& Private Equity (VC&PE) on variables so important to the good health of our economy, such as: employment, sales volume andgross earnings, as well as the growth of total tangible and intangible assets.
It could be confirmed that these past two years have been quite tough on Spain’s economy. At the start of 2010, we are facedwith a depressing scenario: high unemployment, generalized decline in consumer spending, financing difficulties for companies, etc.In the face of this somber panorama, it is more important than ever to demonstrate that VC&PE – far from being the panacea thatwill cure us of all evils – is an efficient instrument for achieving more competitive, healthier companies that create jobs and survi-ve periods of crisis. In particular, in a country in which unemployment today reaches 20% of the active population, it is especiallyrelevant to demonstrate that VC&PE creates jobs on an accelerated basis. In future years, it could be seen how VC&PE has mana-ged the crisis.
This year we wanted to include in the report a chapter dedicated to the effects of VC&PE on those sectors in which it most inves-ted during the 1995-2004 decade, as well as in two strategic sectors for our economy: R&D and Hospitality and Leisure. The con-clusions of this chapter are quite interesting.
As in previous years, the report is based on the statistical work performed by a professional, independent, expert team in theVC&PE sector, led by Professor José Martí Pellón. The methodology followed is quite rigorous since it covers the entire collectiveof companies financed by VC&PE between the years 1995-2004, studying their growth in the three years subsequent to the entryof the venture capitalist, through the accounting data obtained form the Mercantile Registries. Subsequently, these data are con-trasted against those of a comparable group of companies that did not receive VC&PE financing (“control group”).
I wish to thank the entities supporting this new edition of the study, the Center for Technological Industrial Development (Centropara el Desarrollo Tecnológico Industrial; CDTI) and PRICEWATERHOUSECOOPERS, for the trust placed in ASCRI, and José MartíPellón and Marcos Salas de la Hera for their constant dedication and effort in preparing statistics of great quality and rigor, whichallow preparing serious, independent reports that are useful for everyone involved in this sector: investors, entrepreneurs, govern-ments, etc.
Ramón CerdeirasChairman
5
El objetivo de este informe anual – ésta es su quinta edición – es medir la contribución del capital riesgo al desarrolloeconómico y social de España. Con esta nueva edición, volvemos a demostrar el impacto positivo que tiene el CapitalRiesgo sobre variables tan importantes para la buena salud de nuestra economía como son: el empleo, el volumen deventas y resultado bruto, así como el crecimiento de los activos totales e inmateriales.
Creo que puede afirmarse que estos dos últimos años han sido muy duros para la economía de nuestro país y así, ainicios del 2010, nos encontramos con un triste escenario: desempleo elevado, caída generalizada del consumo, dificul-tades de financiación para las empresas, … Ante este panorama sombrío, es más que nunca importante demostrar queel Capital Riesgo es un instrumento eficaz para conseguir empresas más competitivas, más sanas, que creen empleo ysobrevivan a las épocas de crisis. En particular, en un país en el que el desempleo alcanza hoy el 20% de la poblaciónactiva, es de especial relevancia demostrar que el Capital Riesgo crea empleo de forma acelerada. En años venideros,veremos cómo el Capital Riesgo ha gestionado la crisis.
Este año hemos querido incorporar al informe un capítulo dedicado a los efectos del Capital Riesgo en aquellos sec-tores en los que más ha invertido durante la década 1995-2004, así como en dos sectores estratégicos para nuestraeconomía: I+D y Hostelería y Ocio. Las conclusiones de dicho capítulo son muy interesantes.
Como en años anteriores, el informe se ha basado en el trabajo estadístico realizado por un equipo profesional, inde-pendiente y experto en el sector de Capital Riesgo, encabezado por el profesor José Martí Pellón. La metodología segui-da es muy rigurosa ya que cubre la totalidad del colectivo de empresas financiadas por Capital Riesgo entre los años1995-2004, estudiando su crecimiento en los tres años posteriores a la entrada del capital riesgo, a través de los datoscontables publicados por los Registros Mercantiles y bases de datos SABI. Posteriormente, estos datos se contrastan conlos de un grupo de empresas comparables que no han recibido financiación de capital riesgo (“grupo de control”).
Quiero agradecer a las entidades que respaldan esta nueva edición del estudio, Centro para el Desarrollo TecnológicoIndustrial (CDTI) y PRICEWATERHOUSECOOPERS, la confianza depositada en ASCRI, y a José Martí Pellón y MarcosSalas de la Hera su constante dedicación y esfuerzo para elaborar estadísticas de gran calidad y rigurosidad, y que per-miten realizar informes serios, independientes y útiles para todos los implicados con este sector: inversores, empresa-rios, gobiernos, etc.
Ramón CerdeirasPresidente
1. Carta del Presidente de ASCRI
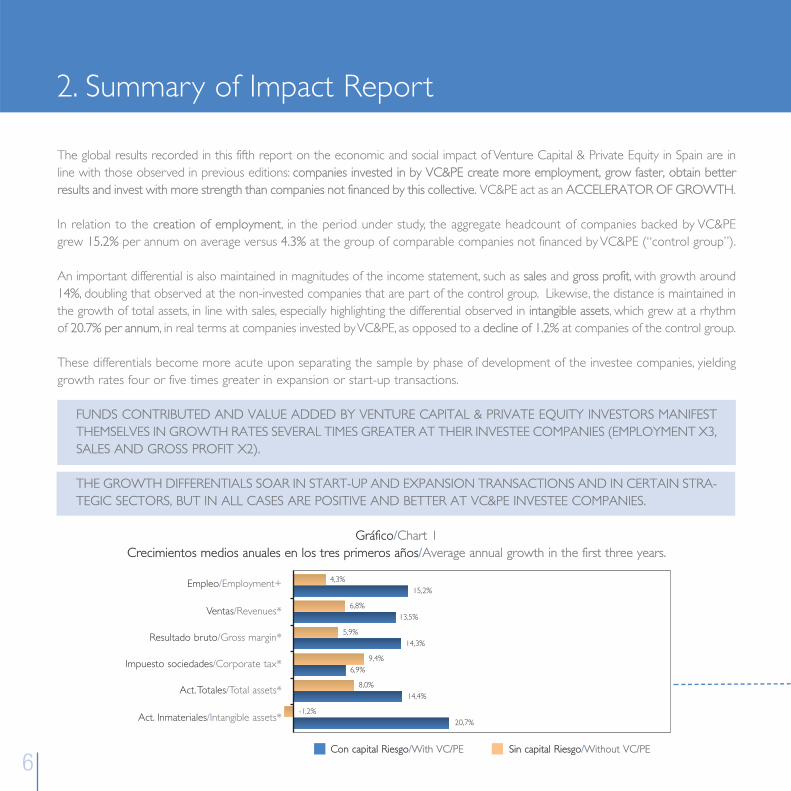
The global results recorded in this fifth report on the economic and social impact of Venture Capital & Private Equity in Spain are inline with those observed in previous editions: companies invested in by VC&PE create more employment, grow faster, obtain betterresults and invest with more strength than companies not financed by this collective. VC&PE act as an ACCELERATOR OF GROWTH.
In relation to the creation of employment, in the period under study, the aggregate headcount of companies backed by VC&PEgrew 15.2% per annum on average versus 4.3% at the group of comparable companies not financed by VC&PE (“control group”).
An important differential is also maintained in magnitudes of the income statement, such as sales and gross profit, with growth around14%, doubling that observed at the non-invested companies that are part of the control group. Likewise, the distance is maintained inthe growth of total assets, in line with sales, especially highlighting the differential observed in intangible assets, which grew at a rhythmof 20.7% per annum, in real terms at companies invested by VC&PE, as opposed to a decline of 1.2% at companies of the control group.
These differentials become more acute upon separating the sample by phase of development of the investee companies, yieldinggrowth rates four or five times greater in expansion or start-up transactions.
FUNDS CONTRIBUTED AND VALUE ADDED BY VENTURE CAPITAL & PRIVATE EQUITY INVESTORS MANIFESTTHEMSELVES IN GROWTH RATES SEVERAL TIMES GREATER AT THEIR INVESTEE COMPANIES (EMPLOYMENT X3,SALES AND GROSS PROFIT X2).
THE GROWTH DIFFERENTIALS SOAR IN START-UP AND EXPANSION TRANSACTIONS AND IN CERTAIN STRA-TEGIC SECTORS, BUT IN ALL CASES ARE POSITIVE AND BETTER AT VC&PE INVESTEE COMPANIES.
Gráfico/Chart 1Crecimientos medios anuales en los tres primeros años/Average annual growth in the first three years.
6
2. Summary of Impact Report
Empleo/Employment+
Ventas/Revenues*
Resultado bruto/Gross margin*
Impuesto sociedades/Corporate tax*
Act. Totales/Total assets*
Act. Inmateriales/Intangible assets*
Con capital Riesgo/With VC/PE Sin capital Riesgo/Without VC/PE
4,3%15,2%
6,8%13,5%
5,9%14,3%
9,4%6,9%
8,0%14,4%
-1,2%20,7%
Los resultados globales registrados en este quinto informe sobre el impacto económico y social del capital riesgo enEspaña están en línea con los observados en ediciones anteriores: las compañías participadas por Capital Riesgo creanmás empleo, crecen más rápidamente, obtienen mejores resultados e invierten con más fuerza que las compañías nofinanciadas por este colectivo. El Capital Riesgo actúa como ACELERADOR DE CRECIMIENTO.
En relación con la creación de empleo en el período estudiado, la plantilla agregada de las compañías respaldadas porel Capital Riesgo creció a una media del 15,2% anual frente al 4,3% en el grupo de empresas comparables no financia-das por el Capital Riesgo (“grupo de control”).
También se mantiene un importante diferencial en magnitudes de la cuenta de resultados, como ventas y resultadobruto, con crecimientos en el entorno del 14%, que duplican los observados en las empresas no participadas que for-man el grupo de control. De igual modo, la distancia se mantiene en el crecimiento de los activos totales, en línea conel de ventas, destacando especialmente el diferencial observado en los activos intangibles, en los que las participadaspor capital riesgo crecieron a un ritmo del 20,7% anual, en términos reales, frente a una caída del 1,2% en las empre-sas del grupo de control.
Estos diferenciales se agudizan más al separar la muestra por fase de desarrollo de las empresas participadas, marcán-dose crecimientos cuatro o más veces superiores en operaciones en expansión o arranque.
LOS RECURSOS APORTADOS Y EL VALOR AÑADIDO POR LOS INVERSORES DE CAPITAL RIESGO SEMANIFIESTAN EN CRECIMIENTOS VARIAS VECES SUPERIORES EN SUS EMPRESAS PARTICIPADAS(EMPLEO X3, VENTAS Y RESULTADO BRUTO X2).
LOS DIFERENCIALES DE CRECIMIENTOS SE DISPARAN EN LAS OPERACIONES EN ARRANQUE YEXPANSIÓN Y EN DETERMINADOS SECTORES ESTRATÉGICOS, PERO EN TODOS LOS CASOS SONPOSITIVOS Y MEJORES EN LAS EMPRESAS PARTICIPADAS POR EL CAPITAL RIESGO.
7
2. Resumen del Informe de Impacto
Datos para la muestra de 1.035 empresas, representativas de inversiones realizadas entre 1995 y 2004, con datos hasta 2007.Data related to the whole sample of 1,035 firms, representing investments from 1995 to 2004, with accounting data up to 2007.
* En euros constantes con año base en 2005/In constant 2005 Euro.+ Número de trabajadores/Number of employees.Fuente/Source: ASCRI/www.webcapitalriesgo.com

8
3. Venture Capital & Private Equity generate employment on an accelerated basis
On an aggregate basis, the 1,035 companies analyzed, which represent VC&PE investments from the decade 1995-2004, increasedtheir workforce in three years by 73,239 workers, exceeding 6.4-fold the figure recorded at companies forming the control group.In relative terms, the former grew 15.2% per annum and the latter 4.3%, both exceeding the average growth of real GDP in theperiod (3.8%).
It is necessary to emphasize that in the period under study, 1995-2004, growth rates are taken from years with an expansive eco-nomic environment and years with a recessive environment.
VENTURE CAPITAL & PRIVATE EQUITY CONTRIBUTE TO CREATING 6.4 TIMES MORE EMPLOYMENT.
THE GENERATION OF EMPLOYMENT IS MUCH GREATER AT COMPANIES THAT RECEIVE VC&PE FINANCING INTHEIR FIRST STAGES OF DEVELOPMENT (SEED AND START-UP) AND IN THE EXPANSION PHASE, REACHING 41%AND 21% RESPECTIVELY FOR COMPANIES FINANCED BY VC&PE, AS OPPOSED TO 11% AND 5% PER ANNUM ONAVERAGE AT COMPANIES WITH NO VC&PE INVESTMENT. COMPANIES IN THE FIRST PHASES AND UNDEREXPANSION REPRESENT 88% OF INVESTMENTS MADE BY VC&PE IN THE PERIOD 1995-2004.
WITH REGARD TO THE GENERATION OF EMPLOYMENT BY SECTORS, IN THE THREE SECTORS IN WHICH VC&PEPARTICIPATED MORE ACTIVELY (76% OF THE NUMBER OF COMPANIES) GROWTH RATES ARE ON THE ORDEROF 2.4 TO 5.8 TIMES GREATER AT COMPANIES WITH VC&PE.
4. Venture Capital & Private Equity stimulate growthand improve competitivenessThe effect of the intervention of a VC&PE entity, through capital financing and assistance in management, translates into significantgrowth in turnover and gross profits. Companies backed by VC&PE grow faster than other companies: their sales and gross mar-gin, in constant currency, grow at an average of 13.5% and 14.3% per annum, as opposed to 6.8% and 5.9%, respectively, in the con-trol group.
IN ABSOLUTE TERMS, VENTURE CAPITAL & PRIVATE EQUITY MULTIPLE BY 3 THE TURNOVER, GROSS PROFITAND INVESTMENT IN TOTAL ASSETS ACHIEVED BY OTHER SIMILAR COMPANIES.
9
De forma agregada, las 1.035 empresas analizadas, que representan las inversiones de Capital Riesgo de la década 1995-2004, aumentaron su plantilla en tres años en 73.239 trabajadores, superando en 6,4 veces la cifra registrada en lasempresas del grupo de control. En términos relativos, las primeras crecieron un 15,2% anual y las segundas un 4,3%,superando ambas el crecimiento medio del PIB real en el periodo (3,8%).
Es preciso destacar que en el período estudiado 1995-2004 se toman crecimientos de años con un entorno econó-mico expansivo y años con un entorno recesivo.
EL CAPITAL RIESGO CONTRIBUYE A CREAR 6,4 VECES MÁS EMPLEO.
LA GENERACIÓN DE EMPLEO ES MUCHO MAYOR EN LAS EMPRESAS QUE RECIBEN FINANCIACIÓNDE CAPITAL RIESGO EN SUS PRIMERAS ETAPAS DE DESARROLLO (SEMILLA Y ARRANQUE) Y EN LAFASE EXPANSIÓN, LLEGANDO AL 41%Y 21% RESPECTIVAMENTE PARA LAS EMPRESAS FINANCIADASPOR CAPITAL RIESGO, FRENTE AL 11% Y 5% DE MEDIA ANUAL EN LAS EMPRESAS SIN APORTACIÓNDEL CAPITAL RIESGO. LAS EMPRESAS EN PRIMERAS FASES Y EN EXPANSIÓN REPRESENTAN EL 88% DELAS INVERSIONES REALIZADAS POR EL CAPITAL RIESGO EN EL PERÍODO 1995-2004.
EN CUANTO A LA GENERACIÓN DE EMPLEO POR SECTORES, EN LOS TRES SECTORES EN LOS QUE ELCAPITAL RIESGO PARTICIPÓ MÁS ACTIVAMENTE (76% DEL NÚMERO DE EMPRESAS) LOS CRECIMIENTOSSON DEL ORDEN DE 2,4 A 5,8 VECES SUPERIORES EN EMPRESAS CON CAPITAL RIESGO.
4. El Capital Riesgo estimula el crecimiento y mejora la competitividadEl efecto de la intervención de una entidad de capital riesgo, mediante la financiación en capital y la ayuda en la gestión, setraduce en importantes crecimientos en la facturación y los resultados brutos. Las compañías respaldadas por el CapitalRiesgo crecen más rápidamente que las demás compañías: su volumen de ventas y su resultado bruto, en moneda cons-tante, crecen a una media del 13,5% y 14,3% anual, frente al 6,8% y 5,9%, respectivamente, en el grupo de control.
EN TÉRMINOS ABSOLUTOS, EL CAPITAL RIESGO MULTIPLICA POR 3 LA FACTURACIÓN, EL RESULTA-DO BRUTO Y LA INVERSIÓN EN ACTIVOS TOTALES ALCANZADOS POR OTRAS EMPRESAS SIMILARES.
3. El capital riesgo genera empleo de forma acelerada
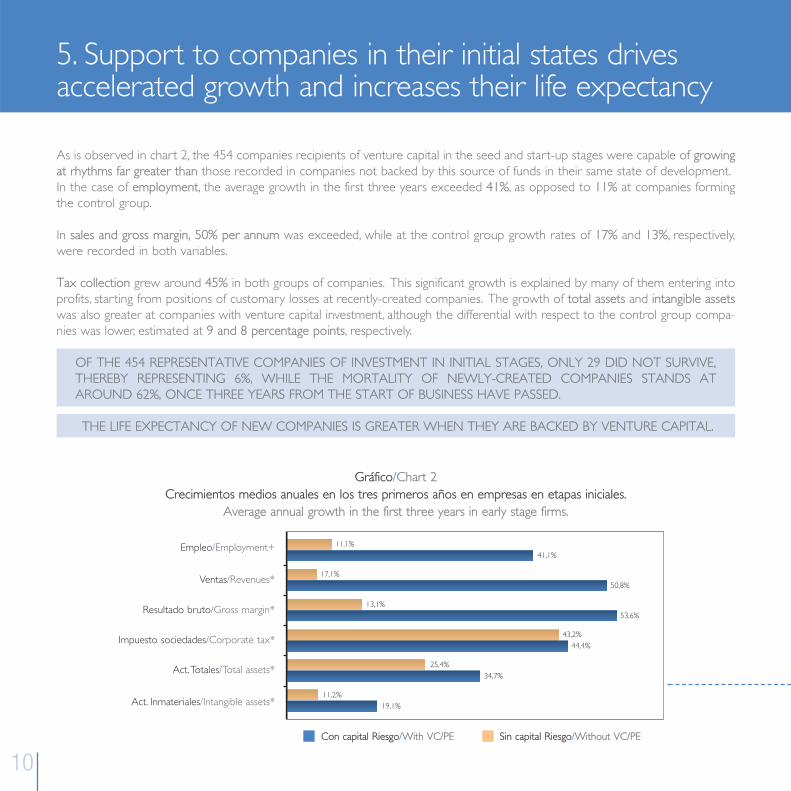
As is observed in chart 2, the 454 companies recipients of venture capital in the seed and start-up stages were capable of growingat rhythms far greater than those recorded in companies not backed by this source of funds in their same state of development. In the case of employment, the average growth in the first three years exceeded 41%, as opposed to 11% at companies formingthe control group.
In sales and gross margin, 50% per annum was exceeded, while at the control group growth rates of 17% and 13%, respectively,were recorded in both variables.
Tax collection grew around 45% in both groups of companies. This significant growth is explained by many of them entering intoprofits, starting from positions of customary losses at recently-created companies. The growth of total assets and intangible assetswas also greater at companies with venture capital investment, although the differential with respect to the control group compa-nies was lower, estimated at 9 and 8 percentage points, respectively.
OF THE 454 REPRESENTATIVE COMPANIES OF INVESTMENT IN INITIAL STAGES, ONLY 29 DID NOT SURVIVE,THEREBY REPRESENTING 6%, WHILE THE MORTALITY OF NEWLY-CREATED COMPANIES STANDS ATAROUND 62%, ONCE THREE YEARS FROM THE START OF BUSINESS HAVE PASSED.
THE LIFE EXPECTANCY OF NEW COMPANIES IS GREATER WHEN THEY ARE BACKED BY VENTURE CAPITAL.
Gráfico/Chart 2Crecimientos medios anuales en los tres primeros años en empresas en etapas iniciales.
Average annual growth in the first three years in early stage firms.
10
5. Support to companies in their initial states drives accelerated growth and increases their life expectancy
Empleo/Employment+
Ventas/Revenues*
Resultado bruto/Gross margin*
Impuesto sociedades/Corporate tax*
Act. Totales/Total assets*
Act. Inmateriales/Intangible assets*
Con capital Riesgo/With VC/PE Sin capital Riesgo/Without VC/PE
11,1%41,1%
17,1%50,8%
13,1%53,6%
43,2%44,4%
25,4%34,7%
11,2%19,1%
11
5. El apoyo a empresas en sus primeras etapas impulsa uncrecimiento acelerado y aumenta su esperanza de vida
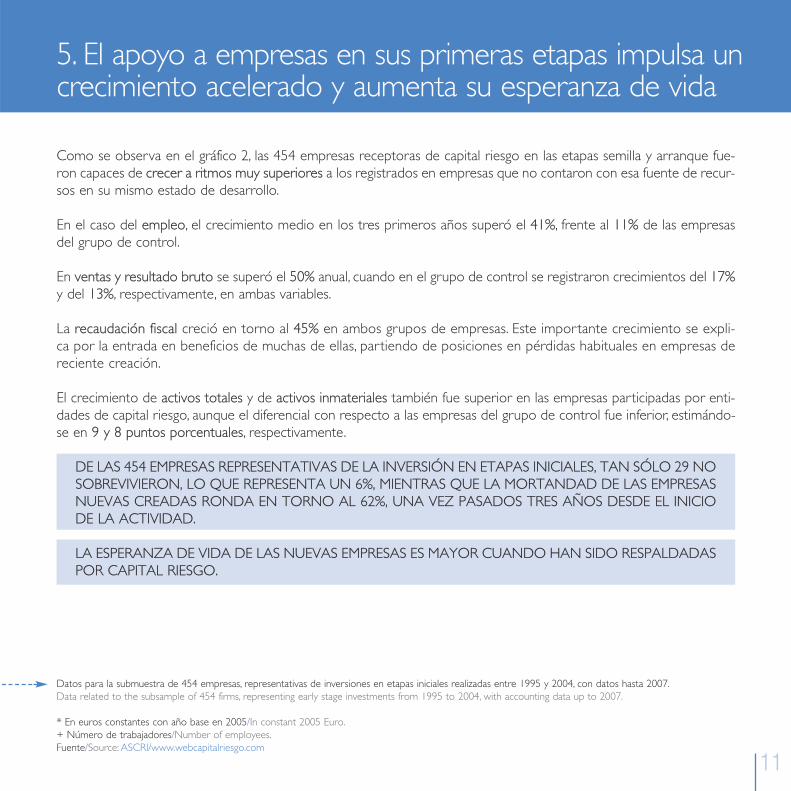
Como se observa en el gráfico 2, las 454 empresas receptoras de capital riesgo en las etapas semilla y arranque fue-ron capaces de crecer a ritmos muy superiores a los registrados en empresas que no contaron con esa fuente de recur-sos en su mismo estado de desarrollo.
En el caso del empleo, el crecimiento medio en los tres primeros años superó el 41%, frente al 11% de las empresasdel grupo de control.
En ventas y resultado bruto se superó el 50% anual, cuando en el grupo de control se registraron crecimientos del 17%y del 13%, respectivamente, en ambas variables.
La recaudación fiscal creció en torno al 45% en ambos grupos de empresas. Este importante crecimiento se expli-ca por la entrada en beneficios de muchas de ellas, partiendo de posiciones en pérdidas habituales en empresas dereciente creación.
El crecimiento de activos totales y de activos inmateriales también fue superior en las empresas participadas por enti-dades de capital riesgo, aunque el diferencial con respecto a las empresas del grupo de control fue inferior, estimándo-se en 9 y 8 puntos porcentuales, respectivamente.
DE LAS 454 EMPRESAS REPRESENTATIVAS DE LA INVERSIÓN EN ETAPAS INICIALES, TAN SÓLO 29 NOSOBREVIVIERON, LO QUE REPRESENTA UN 6%, MIENTRAS QUE LA MORTANDAD DE LAS EMPRESASNUEVAS CREADAS RONDA EN TORNO AL 62%, UNA VEZ PASADOS TRES AÑOS DESDE EL INICIODE LA ACTIVIDAD.
LA ESPERANZA DE VIDA DE LAS NUEVAS EMPRESAS ES MAYOR CUANDO HAN SIDO RESPALDADASPOR CAPITAL RIESGO.
Datos para la submuestra de 454 empresas, representativas de inversiones en etapas iniciales realizadas entre 1995 y 2004, con datos hasta 2007.Data related to the subsample of 454 firms, representing early stage investments from 1995 to 2004, with accounting data up to 2007.
* En euros constantes con año base en 2005/In constant 2005 Euro.+ Número de trabajadores/Number of employees.Fuente/Source: ASCRI/www.webcapitalriesgo.com

The evolution of the 458 investee companies in this stage also differs significantly from that observed at companies without VC&PEinvestment. In creation of employment the differential was greater than that recorded in the previous study, with average annualgrowth of the former of 21%, as opposed to 5% at the latter.
In sales and gross margin, annual growth through the third year of VC&PE investee companies stood at 16%, while the compara-ble companies of the control group only grew 5% in sales and 7% in gross profit.
The average annual growth of Corporate Income Tax was 9.3% at VC&PE investee companies, as opposed to 5.3% at the control group.
88% OF THE COMPANIES FINANCED BY VC&PE IN THE DECADE FROM 1995-2004 WERE COMPANIES IN THESTART-UP OR EXPANSION STAGE, THESE BEING THE COMPANIES AT WHICH GROWTH RATES IN EMPLOY-MENT, SALES, GROSS PROFIT, ASSETS AND TAXES ARE FAR GREATER THAN THOSE RECORDED AT COMPANIESNOT FINANCED BY VC&PE.
Gráfico/Chart 3Crecimientos medios anuales en los tres primeros años en empresas en expansión.
Average annual growth in the first three years in firms at the expansion stage.
12
6. Financing of Companies under expansion has amultiplying effect on the economy
Empleo/Employment+
Ventas/Revenues*
Resultado bruto/Gross margin*
Impuesto sociedades/Corporate tax*
Act. Totales/Total assets*
Act. Inmateriales/Intangible assets*
Con capital Riesgo/With VC/PE Sin capital Riesgo/Without VC/PE
5,0%21,4%
5,3%16,3%
6,9%15,9%
5,3%9,3%
9,4%13,4%
3,1%21,9%
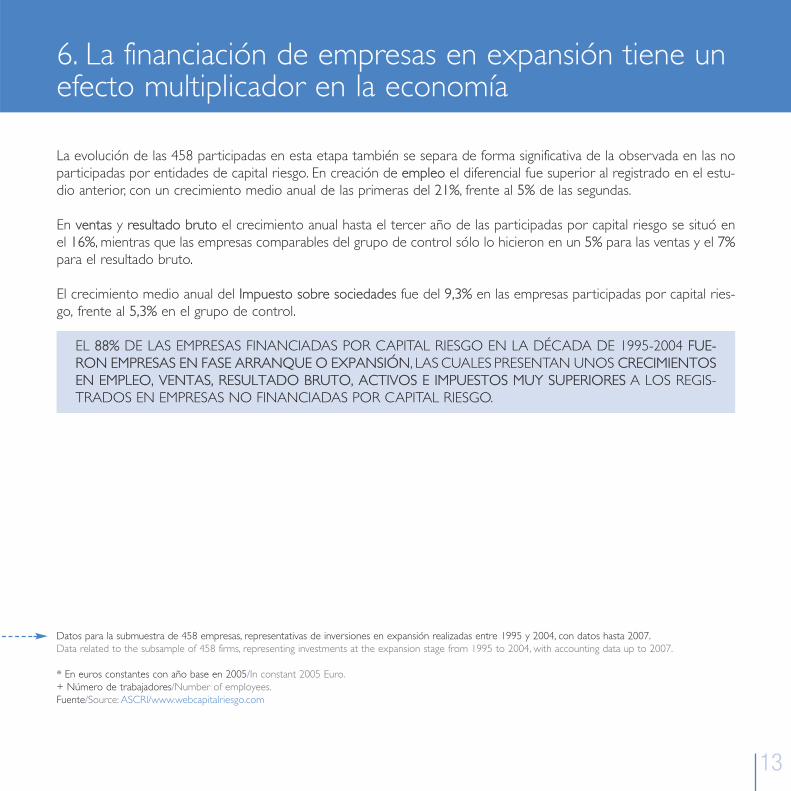
La evolución de las 458 participadas en esta etapa también se separa de forma significativa de la observada en las noparticipadas por entidades de capital riesgo. En creación de empleo el diferencial fue superior al registrado en el estu-dio anterior, con un crecimiento medio anual de las primeras del 21%, frente al 5% de las segundas.
En ventas y resultado bruto el crecimiento anual hasta el tercer año de las participadas por capital riesgo se situó enel 16%, mientras que las empresas comparables del grupo de control sólo lo hicieron en un 5% para las ventas y el 7%para el resultado bruto.
El crecimiento medio anual del Impuesto sobre sociedades fue del 9,3% en las empresas participadas por capital ries-go, frente al 5,3% en el grupo de control.
EL 88% DE LAS EMPRESAS FINANCIADAS POR CAPITAL RIESGO EN LA DÉCADA DE 1995-2004 FUE-RON EMPRESAS EN FASE ARRANQUE O EXPANSIÓN, LAS CUALES PRESENTAN UNOS CRECIMIENTOSEN EMPLEO, VENTAS, RESULTADO BRUTO, ACTIVOS E IMPUESTOS MUY SUPERIORES A LOS REGIS-TRADOS EN EMPRESAS NO FINANCIADAS POR CAPITAL RIESGO.
13
6. La financiación de empresas en expansión tiene unefecto multiplicador en la economía
Datos para la submuestra de 458 empresas, representativas de inversiones en expansión realizadas entre 1995 y 2004, con datos hasta 2007.Data related to the subsample of 458 firms, representing investments at the expansion stage from 1995 to 2004, with accounting data up to 2007.
* En euros constantes con año base en 2005/In constant 2005 Euro.+ Número de trabajadores/Number of employees.Fuente/Source: ASCRI/www.webcapitalriesgo.com
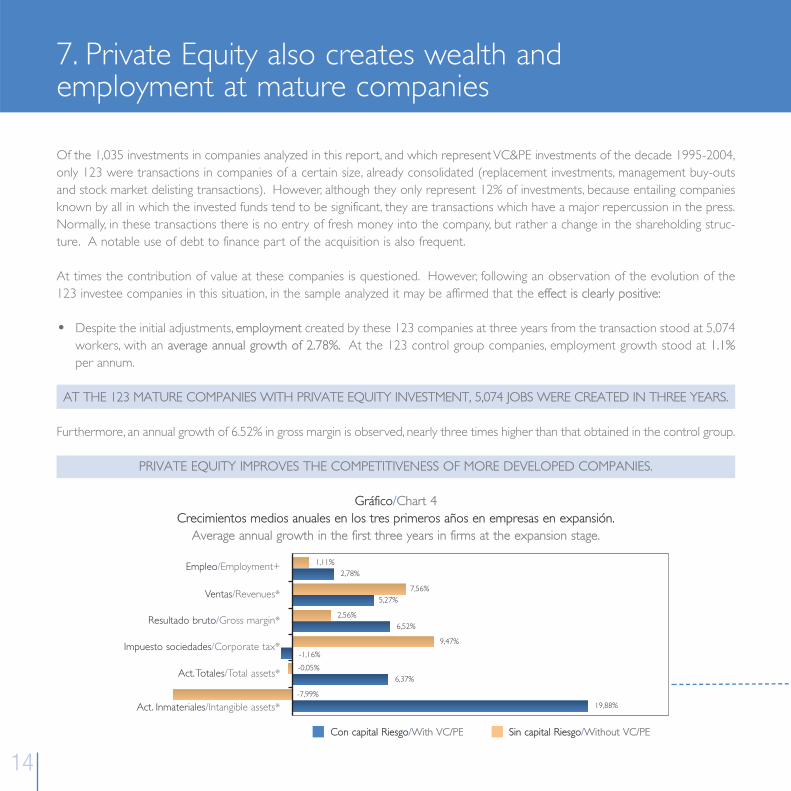
Of the 1,035 investments in companies analyzed in this report, and which represent VC&PE investments of the decade 1995-2004,only 123 were transactions in companies of a certain size, already consolidated (replacement investments, management buy-outsand stock market delisting transactions). However, although they only represent 12% of investments, because entailing companiesknown by all in which the invested funds tend to be significant, they are transactions which have a major repercussion in the press.Normally, in these transactions there is no entry of fresh money into the company, but rather a change in the shareholding struc-ture. A notable use of debt to finance part of the acquisition is also frequent.
At times the contribution of value at these companies is questioned. However, following an observation of the evolution of the123 investee companies in this situation, in the sample analyzed it may be affirmed that the effect is clearly positive:
Despite the initial adjustments, employment created by these 123 companies at three years from the transaction stood at 5,074workers, with an average annual growth of 2.78%. At the 123 control group companies, employment growth stood at 1.1%per annum.
AT THE 123 MATURE COMPANIES WITH PRIVATE EQUITY INVESTMENT, 5,074 JOBS WERE CREATED IN THREE YEARS.
Furthermore, an annual growth of 6.52% in gross margin is observed, nearly three times higher than that obtained in the control group.
PRIVATE EQUITY IMPROVES THE COMPETITIVENESS OF MORE DEVELOPED COMPANIES.
Gráfico/Chart 4Crecimientos medios anuales en los tres primeros años en empresas en expansión.
Average annual growth in the first three years in firms at the expansion stage.
14
7. Private Equity also creates wealth and employment at mature companies
Empleo/Employment+
Ventas/Revenues*
Resultado bruto/Gross margin*
Impuesto sociedades/Corporate tax*
Act. Totales/Total assets*
Act. Inmateriales/Intangible assets*
Con capital Riesgo/With VC/PE Sin capital Riesgo/Without VC/PE
1,11%2,78%
7,56%5,27%
2,56%6,52%
9,47%
-1,16%
-0,05%6,37%
-7,99%19,88%
•
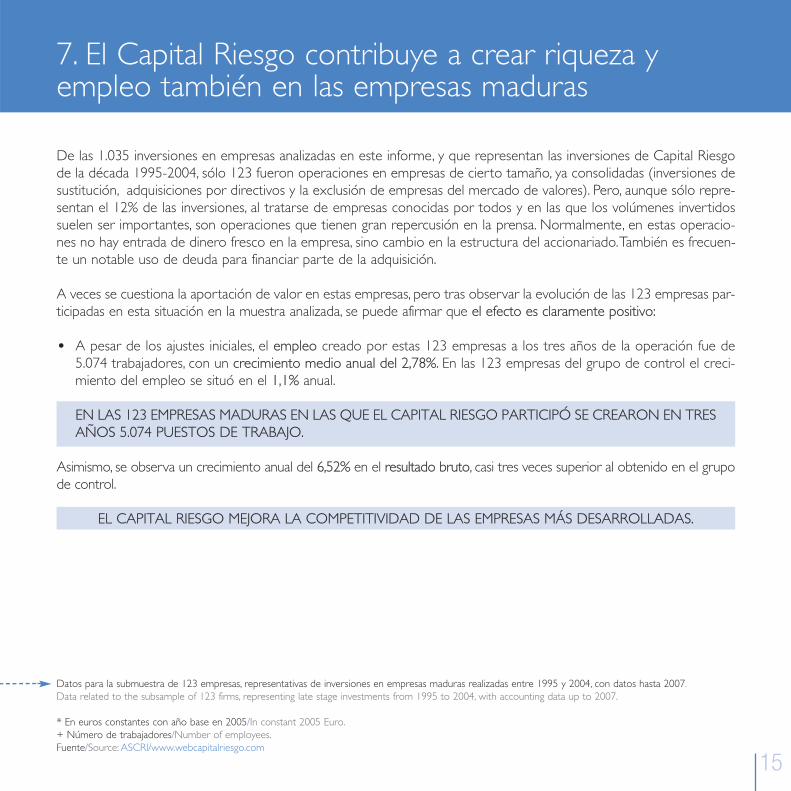
De las 1.035 inversiones en empresas analizadas en este informe, y que representan las inversiones de Capital Riesgode la década 1995-2004, sólo 123 fueron operaciones en empresas de cierto tamaño, ya consolidadas (inversiones desustitución, adquisiciones por directivos y la exclusión de empresas del mercado de valores). Pero, aunque sólo repre-sentan el 12% de las inversiones, al tratarse de empresas conocidas por todos y en las que los volúmenes invertidossuelen ser importantes, son operaciones que tienen gran repercusión en la prensa. Normalmente, en estas operacio-nes no hay entrada de dinero fresco en la empresa, sino cambio en la estructura del accionariado. También es frecuen-te un notable uso de deuda para financiar parte de la adquisición.
A veces se cuestiona la aportación de valor en estas empresas, pero tras observar la evolución de las 123 empresas par-ticipadas en esta situación en la muestra analizada, se puede afirmar que el efecto es claramente positivo:
A pesar de los ajustes iniciales, el empleo creado por estas 123 empresas a los tres años de la operación fue de5.074 trabajadores, con un crecimiento medio anual del 2,78%. En las 123 empresas del grupo de control el creci-miento del empleo se situó en el 1,1% anual.
EN LAS 123 EMPRESAS MADURAS EN LAS QUE EL CAPITAL RIESGO PARTICIPÓ SE CREARON EN TRESAÑOS 5.074 PUESTOS DE TRABAJO.
Asimismo, se observa un crecimiento anual del 6,52% en el resultado bruto, casi tres veces superior al obtenido en el grupode control.
EL CAPITAL RIESGO MEJORA LA COMPETITIVIDAD DE LAS EMPRESAS MÁS DESARROLLADAS.
15
7. El Capital Riesgo contribuye a crear riqueza yempleo también en las empresas maduras
Datos para la submuestra de 123 empresas, representativas de inversiones en empresas maduras realizadas entre 1995 y 2004, con datos hasta 2007.Data related to the subsample of 123 firms, representing late stage investments from 1995 to 2004, with accounting data up to 2007.
* En euros constantes con año base en 2005/In constant 2005 Euro.+ Número de trabajadores/Number of employees.Fuente/Source: ASCRI/www.webcapitalriesgo.com
•
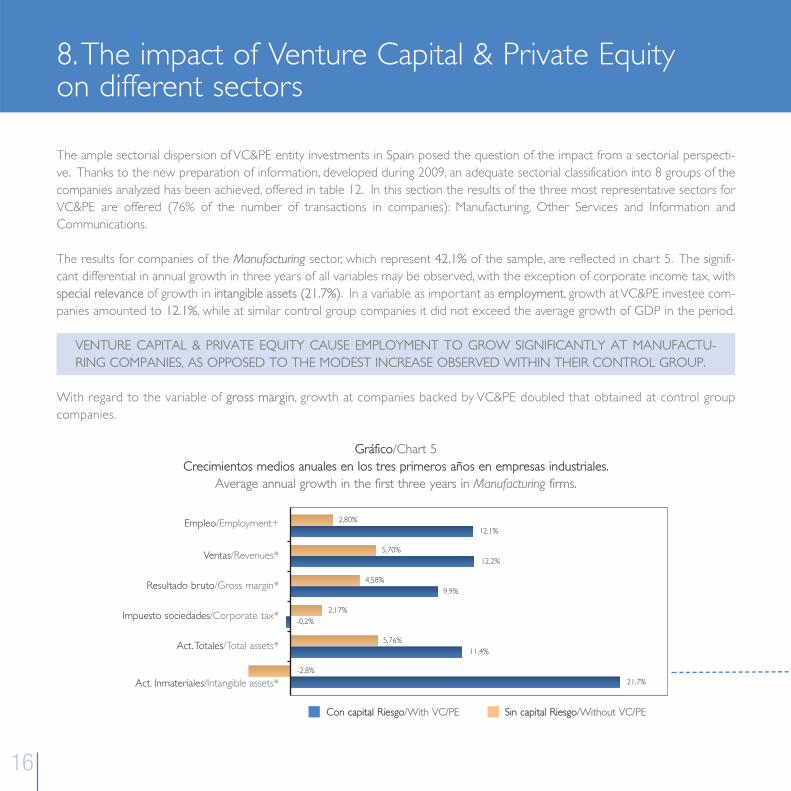
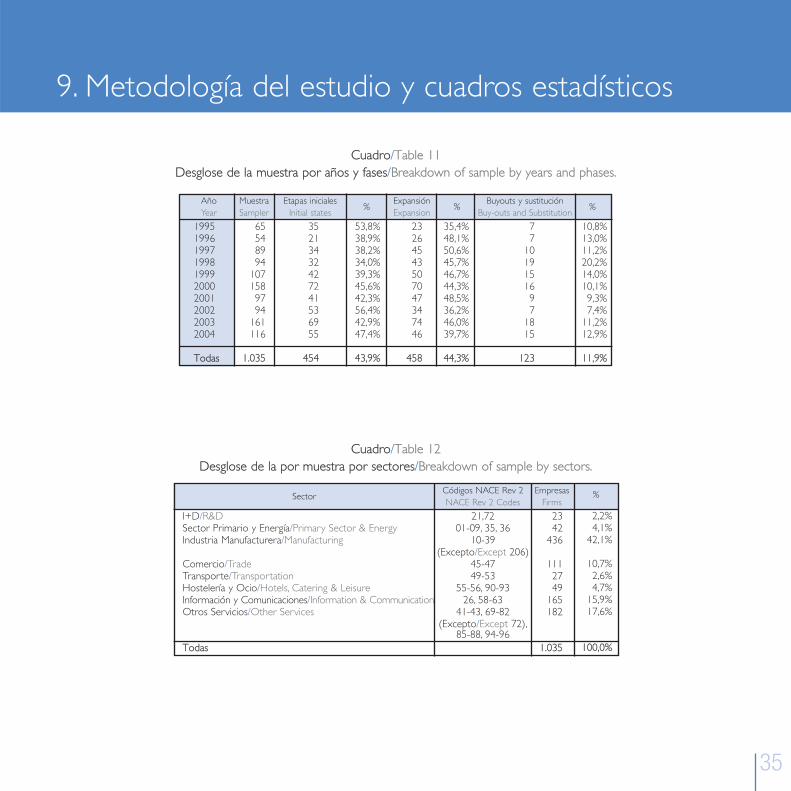
The ample sectorial dispersion of VC&PE entity investments in Spain posed the question of the impact from a sectorial perspecti-ve. Thanks to the new preparation of information, developed during 2009, an adequate sectorial classification into 8 groups of thecompanies analyzed has been achieved, offered in table 12. In this section the results of the three most representative sectors forVC&PE are offered (76% of the number of transactions in companies): Manufacturing, Other Services and Information andCommunications.
The results for companies of the Manufacturing sector, which represent 42.1% of the sample, are reflected in chart 5. The signifi-cant differential in annual growth in three years of all variables may be observed, with the exception of corporate income tax, withspecial relevance of growth in intangible assets (21.7%). In a variable as important as employment, growth at VC&PE investee com-panies amounted to 12.1%, while at similar control group companies it did not exceed the average growth of GDP in the period.
VENTURE CAPITAL & PRIVATE EQUITY CAUSE EMPLOYMENT TO GROW SIGNIFICANTLY AT MANUFACTU-RING COMPANIES, AS OPPOSED TO THE MODEST INCREASE OBSERVED WITHIN THEIR CONTROL GROUP.
With regard to the variable of gross margin, growth at companies backed by VC&PE doubled that obtained at control groupcompanies.
Gráfico/Chart 5Crecimientos medios anuales en los tres primeros años en empresas industriales.
Average annual growth in the first three years in Manufacturing firms.
16
8. The impact of Venture Capital & Private Equity on different sectors
Empleo/Employment+
Ventas/Revenues*
Resultado bruto/Gross margin*
Impuesto sociedades/Corporate tax*
Act. Totales/Total assets*
Act. Inmateriales/Intangible assets*
Con capital Riesgo/With VC/PE Sin capital Riesgo/Without VC/PE
2,80%12,1%
5,70%12,2%
4,58%9,9%
2,17%-0,2%
5,76%11,4%
-2,8%21,7%
17
8. El impacto del Capital Riesgo en diferentes sectores
Datos para la submuestra de 436 empresas, representativas de inversiones en empresas del sector Industria Manufacturera realizadas entre 1995 y 2004, condatos hasta 2007.Data related to the subsample of 436 firms, representing investments recorded from 1995 to 2004 in Manufacturing firms, with accounting data up to 2007.
* En euros constantes con año base en 2005/In constant 2005 Euro.+ Número de trabajadores/Number of employees.Fuente/Source: ASCRI/www.webcapitalriesgo.com
La amplia dispersión sectorial de las inversiones de las ECR (Entidades de Capital Riesgo) en España planteaba lacuestión del impacto desde una perspectiva sectorial. Gracias a la nueva elaboración de la información, desarrolla-da durante el año 2009, se ha logrado una adecuada clasificación sectorial de las empresas analizadas en 8 grupos,que se ofrece en el cuadro 12. En este apartado se ofrecen los resultados de los tres sectores más representativospara el Capital Riesgo (76% del número de operaciones en empresas): Industria Manufacturera, Otros Servicios eInformación y Comunicaciones.
Los resultados para las empresas del sector Industria Manufacturera, que representan el 42,1% de las empresas de lamuestra, se recogen en el gráfico 5. Se puede apreciar el importante diferencial en el crecimiento anual en tres añosde todas las variables, excepto en el impuesto de sociedades, con especial relevancia del crecimiento del activo inma-terial (21,7%). En una variable tan importante como es empleo, el crecimiento en las participadas por capital riesgoascendió al 12,1%, mientras que las empresas similares del grupo de control no superaron el crecimiento medio delPIB del periodo.
EL CAPITAL RIESGO ACRECIENTA SIGNIFICATIVAMENTE EL EMPLEO EN EMPRESAS INDUSTRIALES,FRENTE AL MODESTO AUMENTO OBSERVADO EN SU GRUPO DE CONTROL.
En cuanto a la variable Resultado bruto, el crecimiento en las empresas respaldadas por Capital Riesgo dobla al obte-nido en las del grupo de control.

18
The second sector in importance represents companies linked to the category Other Services1 with 17.6% of the sample. Chart 6shows that the six variables grew above 20%, five of them standing at around 30%. The dynamism of this sector is shown in the factthat control group companies also grew significantly above GDP, although at a great distance from VC&PE investee companies.
SERVICES COMPANIES BACKED BY VC&PE GREW ABOVE 20% PER ANNUM IN ALL MAGNITUDES ANALYZED.
Gráfico/Chart 6Crecimientos medios anuales en los tres primeros años en empresas de Otros Servicios.
Average annual growth in the first three years in Other Services firms.
Empleo/Employment+
Ventas/Revenues*
Resultado bruto/Gross margin*
Impuesto sociedades/Corporate tax*
Act. Totales/Total assets*
Act. Inmateriales/Intangible assets*
Con capital Riesgo/With VC/PE Sin capital Riesgo/Without VC/PE
4,96%28,86%
9,22%29,88%
6,87%26,85%
5,03%27,47%
11,63%21,08%
6,60%30,60%
Datos para la submuestra de 182 empresas, representativas de inversiones en empresas del sector Otros Servicios realizadas entre 1995 y 2004, con datos hasta2007/Data related to the subsample of 182 firms, representing investments recorded from 1995 to 2004 in Other Services firms from 1995 to 2004, with accoun-ting data up to 2007.
* En euros constantes con año base en 2005/In constant 2005 Euro.+ Número de trabajadores/Number of employees.Fuente/Source: ASCRI/www.webcapitalriesgo.com
1Professional, technical and administrative, engineering and construction, education and healthcare services.
8. The impact of Venture Capital & Private Equity on different sectors

19
El segundo sector en importancia representa a las empresas vinculadas con la categoría Otros Servicios1, con el 17,6%de la muestra. El gráfico 6 muestra que las seis variables crecieron por encima del 20%, situándose cinco de ellas en elentorno del 30%. El dinamismo de este sector se muestra en que las empresas del grupo de control también crecie-ron significativamente por encima del PIB, aunque a gran distancia de las empresas participadas por ECR.
LAS EMPRESAS DE SERVICIOS APOYADAS POR CAPITAL RIESGO CRECIERON POR ENCIMA DEL 20%ANUAL EN TODAS LAS MAGNITUDES ANALIZADAS.
1Servicios profesionales, técnicos y administrativos, ingeniería y construcción, educación y asistencia sanitaria.
8. El impacto del Capital Riesgo en diferentes sectores

20
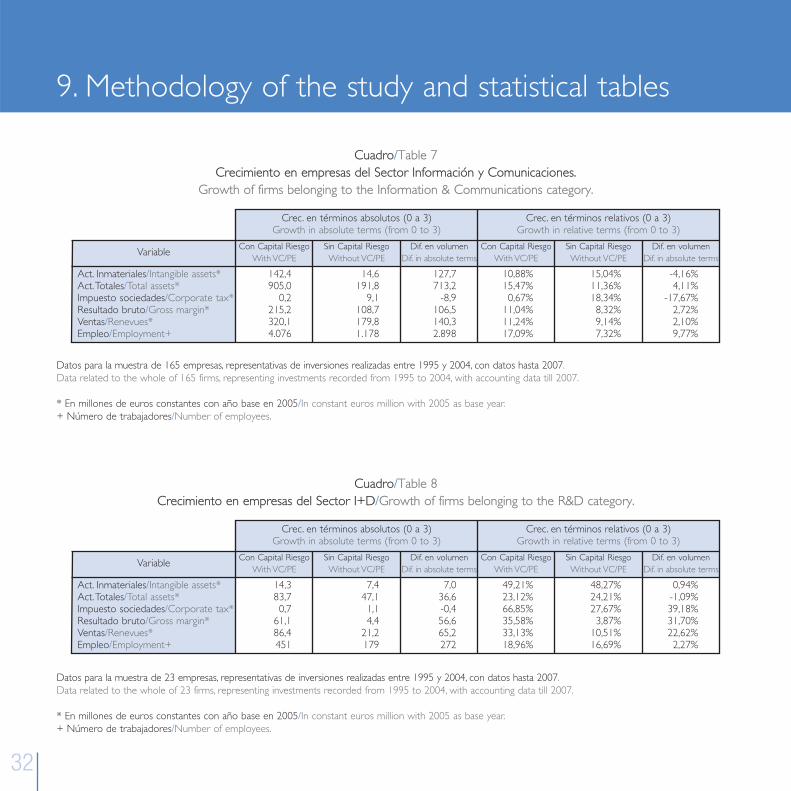
The third place in importance was held by Information and Communications companies, which represented 15.9% of the sample.The comparison to the control group, reflected in chart 7, once again points out a significant difference in the growth of employ-ment, estimated at 17.1%, at VC&PE investee companies and 7.3% at non-investee companies. Nevertheless, the differences areless noticeable in other variables, despite the fact that, except for corporate income tax, at all of them double digits are exceeded,with significant growth rates also being observed, which double the growth in GDP, at companies not invested in by VC&PE vehi-cles which were selected as being comparable.
INFORMATION AND COMMUNICATIONS PRESENTS HIGH GROWTH RATES AT ALL COMPANIES, WITH ANDWITHOUT VC&PE, WITH ADVANTAGE FOR THE FIRST ONES.
Gráfico/Chart 7Crecimientos medios anuales en los tres primeros años en empresas de Información y Comunicaciones.
Average annual growth in the first three years in Information and Communications firms.
Empleo/Employment+
Ventas/Revenues*
Resultado bruto/Gross margin*
Impuesto sociedades/Corporate tax*
Act. Totales/Total assets*
Act. Inmateriales/Intangible assets*
Con capital Riesgo/With VC/PE Sin capital Riesgo/Without VC/PE
7,3%17,1%
9,1%11,2%
8,3%11,0%
18,3%0,7%
11,4%15,5%
15,0%10,9%
Datos para la submuestra de 165 empresas, representativas de inversiones en empresas del sector Información y Comunicaciones realizadas entre 1995 y 2004, condatos hasta 2007/Data related to the subsample of 165 firms, representing investments recorded from 1995 to 2004 in Information & Communications firms from1995 to 2004, with accounting data up to 2007.
* En euros constantes con año base en 2005/In constant 2005 Euro.+ Número de trabajadores/Number of employees.Fuente/Source: ASCRI/www.webcapitalriesgo.com
8. The impact of Venture Capital & Private Equity on different sectors

21
8. El impacto del Capital Riesgo en diferentes sectores
El tercer lugar en importancia fue ocupado por las empresas de Información y Comunicaciones, que representaban el15,9% de las empresas de la muestra. La comparación con el grupo de control, recogida en el gráfico 7, vuelve aseñalar una importante diferencia en el crecimiento del empleo, estimado en el 17,1% en las participadas por capi-tal riesgo y el 7,3% en las no participadas. Sin embargo, las diferencias son menos apreciables en otras variables, apesar de que, salvo en el impuesto sobre sociedades, en todas ellas se superan los dos dígitos, observándose tam-bién importantes crecimientos, que duplican el crecimiento del PIB, en las empresas no participadas por ECR quefueron elegidas como comparables.
EN INFORMACIÓN Y COMUNICACIONES SE OBSERVA UN CRECIMIENTO ELEVADO EN TODAS LASEMPRESAS, CON Y SIN CAPITAL RIESGO, CON VENTAJA A FAVOR DE LAS PRIMERAS.
22
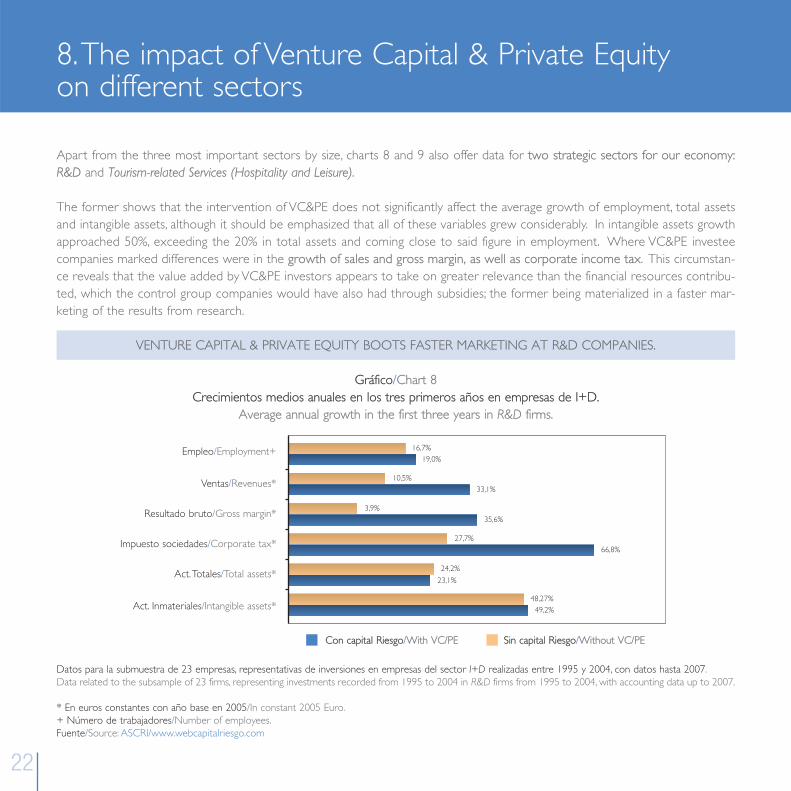
Apart from the three most important sectors by size, charts 8 and 9 also offer data for two strategic sectors for our economy:R&D and Tourism-related Services (Hospitality and Leisure).
The former shows that the intervention of VC&PE does not significantly affect the average growth of employment, total assetsand intangible assets, although it should be emphasized that all of these variables grew considerably. In intangible assets growthapproached 50%, exceeding the 20% in total assets and coming close to said figure in employment. Where VC&PE investeecompanies marked differences were in the growth of sales and gross margin, as well as corporate income tax. This circumstan-ce reveals that the value added by VC&PE investors appears to take on greater relevance than the financial resources contribu-ted, which the control group companies would have also had through subsidies; the former being materialized in a faster mar-keting of the results from research.
VENTURE CAPITAL & PRIVATE EQUITY BOOTS FASTER MARKETING AT R&D COMPANIES.
Gráfico/Chart 8Crecimientos medios anuales en los tres primeros años en empresas de I+D.
Average annual growth in the first three years in R&D firms.
Empleo/Employment+
Ventas/Revenues*
Resultado bruto/Gross margin*
Impuesto sociedades/Corporate tax*
Act. Totales/Total assets*
Act. Inmateriales/Intangible assets*
Con capital Riesgo/With VC/PE Sin capital Riesgo/Without VC/PE
16,7%19,0%
10,5%33,1%
3,9%35,6%
27,7%66,8%
24,2%
23,1%
48,27%49,2%
Datos para la submuestra de 23 empresas, representativas de inversiones en empresas del sector I+D realizadas entre 1995 y 2004, con datos hasta 2007.Data related to the subsample of 23 firms, representing investments recorded from 1995 to 2004 in R&D firms from 1995 to 2004, with accounting data up to 2007.
* En euros constantes con año base en 2005/In constant 2005 Euro.+ Número de trabajadores/Number of employees.Fuente/Source: ASCRI/www.webcapitalriesgo.com
8. The impact of Venture Capital & Private Equity on different sectors
Además de los tres sectores más importantes por tamaño, en los gráficos 8 y 9 también se ofrecen los datos para dossectores estratégicos para nuestra economía: I+D, y Servicios relacionados con el Turismo (Hostelería y Ocio).
El primero de ellos muestra que la intervención de capital riesgo no afecta significativamente al crecimiento medio delempleo, de los activos totales y de los inmateriales, aunque debe destacarse que todas estas variables crecieron deforma muy notable. En los activos inmateriales el crecimiento se acercó al 50%, superando el 20% en activos totales yacercándose a dicha cifra en el empleo. En donde las participadas por Capital Riesgo marcaron diferencias fue en elcrecimiento de ventas y del resultado bruto, así como del impuesto de sociedades. Esta circunstancia pone de mani-fiesto que el valor añadido por los inversores de capital riesgo parece adquirir mayor relevancia que los recursos finan-cieros aportados, que las empresas del grupo de control también pudieron tener a través de subvenciones, materiali-zándose aquél en una más rápida comercialización de los resultados de las investigaciones.
EL CAPITAL RIESGO AYUDA A COMERCIALIZAR MÁS RÁPIDO EN LAS EMPRESAS DE I+D.
23
8. El impacto del Capital Riesgo en diferentes sectores

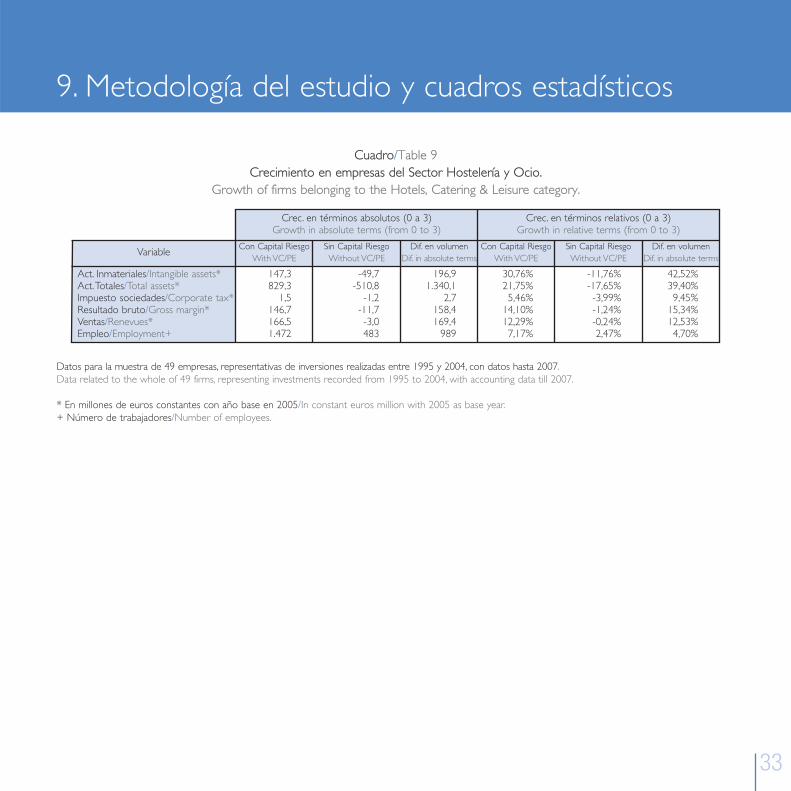
Finally, it is of interest to analyze the Hospitality and Leisure sector, due to its strategic interest in our economy. Chart 9 illustratesthe different evolution experienced by the group of companies backed by VC&PE in the three-year period post-investment and bythe group of similar companies that did not have this resource. Despite the fact that employment only grew by 7.2% per annumin the former, below the rhythm of the rest of VC&PE Entity investees, those belonging to the control group only grew by 2.5% inthis parameter. In the remaining variables, growth of the former was far greater while in those without VC&PE investment thevalues recorded were negative.
IN HOSPITALITY AND LEISURE, VC&PE BREAKS AWAY FROM THE NEGATIVE GROWTH OBSERVED IN COMPA-NIES WITHOUT THIS RESOURCE.
Gráfico/Chart 9Crecimientos medios anuales en los tres primeros años en empresas de Hostelería y Ocio.
Average annual growth in the first three years in Hotels, Catering and Leisure firms..
24
Empleo/Employment+
Ventas/Revenues*
Resultado bruto/Gross margin*
Impuesto sociedades/Corporate tax*
Act. Totales/Total assets*
Act. Inmateriales/Intangible assets*
Con capital Riesgo/With VC/PE Sin capital Riesgo/Without VC/PE
2,5%7,2%
-0,2%12,3%
-1,2%14,1%
-4,0%5,5%
-17,7%21,7%
-11,8%30,8%
Datos para la submuestra de 49 empresas, representativas de inversiones en empresas del sector Hostelería y Ocio realizadas entre 1995 y 2004, con datos hasta 2007.Data related to the subsample of 49 firms, representing investments recorded from 1995 to 2004 in Hotels, Catering & Leisure firms from 1995 to 2004, with accoun-ting data up to 2007.
* En euros constantes con año base en 2005/In constant 2005 Euro.+ Número de trabajadores/Number of employees.Fuente/Source: ASCRI/www.webcapitalriesgo.com
8. The impact of Venture Capital & Private Equity on different sectors
Finalmente, resulta de interés analizar el sector Hostelería y Ocio, por su interés estratégico en nuestro país. El gráfi-co 9 es ilustrativo de la diferente evolución experimentada por el grupo de empresas apoyadas por capital riesgoen el periodo de tres años posterior a la inversión y por el grupo de empresas similares que no contaron con eserecurso. A pesar de que el empleo sólo creció en un 7,2% anual en las primeras, por debajo de los ritmos del restode participadas por ECR, las del grupo de control sólo lo hicieron en un 2,5%. En las restantes variables los creci-mientos de las primeras fueron muy superiores, mientras que en las no participadas por capital riesgo los valoresregistrados fueron negativos.
EN HOSTELERÍA Y OCIO EL CAPITAL RIESGO ROMPE LOS CRECIMIENTOS NEGATIVOS OBSERVA-DOS EN EMPRESAS QUE NO CUENTAN CON ESTE RECURSO.
25
8. El impacto del Capital Riesgo en diferentes sectores

26
9. Methodology of the study and statistical tables
The objective of the work is to measure the contribution of VC&PE towards the country’s economic and social development. Itis not intended to separate to what degree said growth is due to the contribution of financial resources, as opposed to companiesthat might not have access to similar funds, or to the contribution of value of investment teams to investee companies. Even onlydue to the first of the causes, VC&PE would demonstrate contributing towards covering the financing void of companies that donot have access to sources of stable financing in order to undertake their projects.
In order to prepare the study, the departure point is the catalogue of investments carried out in Spain, obtained by the team ofProfessor José Martí Pellón, of the Complutense University in Madrid, in conjunction with webcapitalriesgo.com and ASCRI, for pre-paration of the annual VC&PE studies. The information on which this work is based is objective public information obtained fromofficial records1.
The approach consists of taking the data from a significant number of companies over a long period, in order to avoid the distor-tion arising from the economic cycle. Hence, years are included with high and low economic growth, with all calculations beingmade in constant currency. Given that there already was a sufficient historical series, this study takes into account the investmentsof a complete decade, from 1995-2004, following the evolution of each company through three years post-investment.
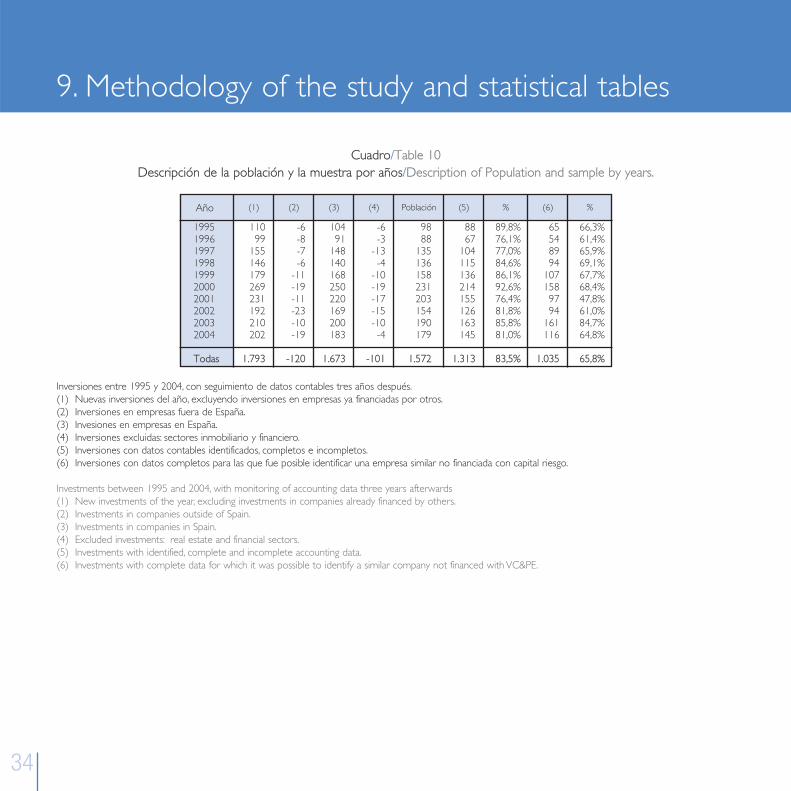
As a second new development, the entire universe of investments was again considered in order to eliminate those investmentswhich had already been invested in previous years. Under this perspective, the universe of investments made in the period underconsideration, after eliminating dual accounting due to syndication in the same year or due to investment in subsequent years, roseto 1,793 companies. Of this total, 120 investments outside of Spain and 101 made in the real estate and financial sectors wereexcluded, with the population to be studied thereby being formed by 1,572 companies. Of this number, it was possible to iden-tify 1,313 companies, representative of 83.5% of the population.
For the 278 remaining ones, it was not possible to complete the data for any of the following three reasons:
Breach of the obligation to file their accounts with the Registry.Disappearance of the company without having filed accounts with the Mercantile Registry, or filing in just one of the years.Acquisition and absorption by another company before reaching year three, thereby preventing it from being considered as aseparate entity for the purpose of calculating growth.
•••
1The authors thank the contribution of Maria Alejandra Ferrer and Alvaro Tresierra Tanaka to data collection and homogeneisation.

27
El objetivo del trabajo es medir la contribución del capital riesgo al desarrollo económico y social del país. No se pre-tende separar en qué grado dicho crecimiento se debe a la aportación de recursos financieros, frente a empresas quepodrían no tener acceso a recursos similares, o a la aportación de valor de los equipos de inversión a las empresasparticipadas. Incluso sólo por la primera de las causas, el capital riesgo demostraría que contribuye a cubrir el vacío definanciación de las empresas que no tienen acceso a fuentes de financiación estable para acometer sus proyectos.
Para la elaboración del estudio el punto de partida es el catálogo de inversiones realizadas en España, obtenido por elequipo del Profesor José Martí Pellón, de la Universidad Complutense de Madrid, en unión con webcapitalriesgo.comy ASCRI, para la elaboración de los estudios anuales de capital riesgo. La información sobre la que se apoya el trabajoes información pública objetiva obtenida de registros oficiales1.
El planteamiento consiste en tomar los datos de un número significativo de empresas en un periodo largo, para evitarla distorsión derivada del ciclo económico. De este modo, se incluyen años con crecimiento económico alto y bajo,realizando todos los cálculos en moneda constante. Dado que ya se cuenta con serie histórica suficiente, en este estu-dio se toman en cuenta las inversiones de una década completa, incluyéndose desde 1995 hasta 2004, siguiendo la evo-lución de cada empresa hasta tres años después de la inversión.
Como segunda novedad, se volvió a considerar todo el universo de inversiones para eliminar aquellas inversiones queya habían sido participadas en años anteriores. Bajo esta perspectiva, el universo de inversiones realizadas en el perio-do considerado, una vez eliminada la doble contabilización por sindicación en el mismo año o por inversión en añosposteriores, ascendió a 1.793 empresas. De este total se excluyeron 120 inversiones fuera de España y 101 realizadasen los sectores inmobiliario y financiero, quedando la población a estudiar constituida por 1.572 empresas. De estenúmero, fue posible identificar a 1.313 empresas, representativas del 83,5% de la población.
Para las 278 restantes no fue posible completar los datos por alguna de las tres razones siguientes:
Incumplimiento de la obligación de presentar sus cuentas en el Registro.Desaparición de la empresa sin que llegara a presentar cuentas al Registro Mercantil, o tan sólo uno de los años.Adquisición y absorción por parte de otra empresa antes de llegar al tercer año, lo que impide su consideracióncomo entidad separada para calcular crecimientos.
9. Metodología del estudio y cuadros estadísticos
•••
1Los autores agradecen la contribución de María Alejandra Ferrer y Álvaro Tresierra Tanaka en la recogida y homogeneización de los datos.
28
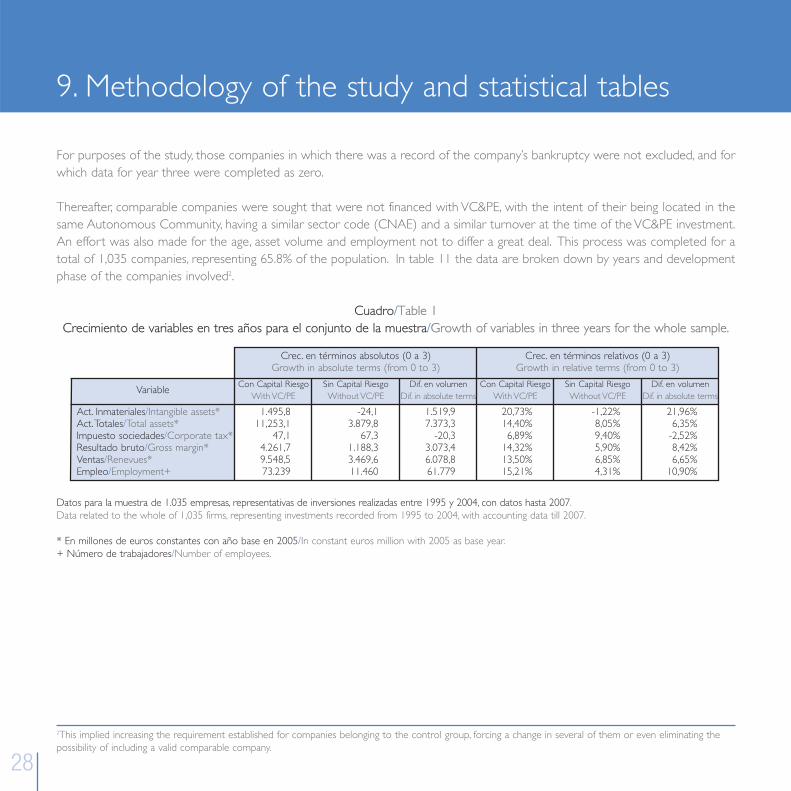
For purposes of the study, those companies in which there was a record of the company’s bankruptcy were not excluded, and forwhich data for year three were completed as zero.
Thereafter, comparable companies were sought that were not financed with VC&PE, with the intent of their being located in thesame Autonomous Community, having a similar sector code (CNAE) and a similar turnover at the time of the VC&PE investment.An effort was also made for the age, asset volume and employment not to differ a great deal. This process was completed for atotal of 1,035 companies, representing 65.8% of the population. In table 11 the data are broken down by years and developmentphase of the companies involved2.
Cuadro/Table 1Crecimiento de variables en tres años para el conjunto de la muestra/Growth of variables in three years for the whole sample.
2This implied increasing the requirement established for companies belonging to the control group, forcing a change in several of them or even eliminating thepossibility of including a valid comparable company.
Crec. en términos absolutos (0 a 3)Growth in absolute terms (from 0 to 3)
Crec. en términos relativos (0 a 3)Growth in relative terms (from 0 to 3)
Con Capital RiesgoWith VC/PE
Sin Capital RiesgoWithout VC/PE
Dif. en volumenDif. in absolute terms
Act. Inmateriales/Intangible assets*Act. Totales/Total assets*Impuesto sociedades/Corporate tax*Resultado bruto/Gross margin*Ventas/Renevues*Empleo/Employment+
Variable
1.495,811,253,1
47,14.261,79.548,573.239
-24,13.879,8
67,31.188,33.469,611.460
1.519,97.373,3
-20,33.073,46.078,861.779
20,73%14,40%6,89%
14,32%13,50%15,21%
-1,22%8,05%9,40%5,90%6,85%4,31%
21,96%6,35%
-2,52%8,42%6,65%
10,90%
Con Capital RiesgoWith VC/PE
Sin Capital RiesgoWithout VC/PE
Dif. en volumenDif. in absolute terms
Datos para la muestra de 1.035 empresas, representativas de inversiones realizadas entre 1995 y 2004, con datos hasta 2007.Data related to the whole of 1,035 firms, representing investments recorded from 1995 to 2004, with accounting data till 2007.
* En millones de euros constantes con año base en 2005/In constant euros million with 2005 as base year.+ Número de trabajadores/Number of employees.
9. Methodology of the study and statistical tables
29
A efectos del estudio, no se excluyeron aquellas empresas en las que había constancia de la quiebra de la empresa,completándose sus datos del tercer año con valores nulos.
A continuación, se buscaron empresas comparables no financiadas con capital riesgo, pretendiendo que estuviera en lamisma Comunidad Autónoma, tuviera un código sectorial (CNAE) similar, una cifra de ventas cercana en el momentode la inversión de capital riesgo, procurando también que la edad, el volumen de activos y el empleo no se diferencia-sen mucho. Este proceso fue completado para un total de 1.035 empresas, que representan el 65,8% de la población.En la tabla 11 se desglosan los datos por años y fase de desarrollo de las empresas involucradas2.
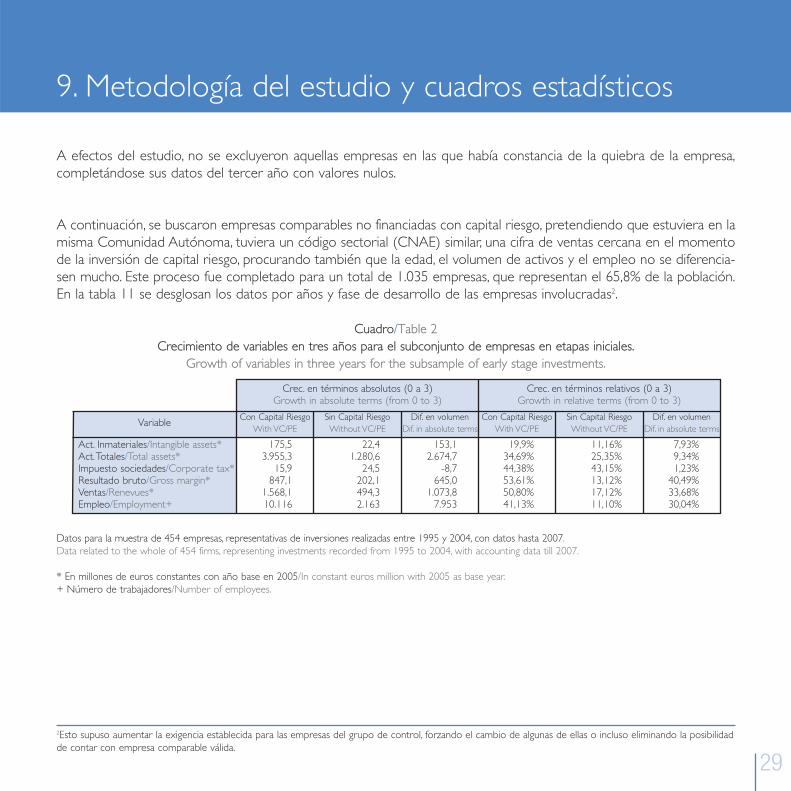
Cuadro/Table 2Crecimiento de variables en tres años para el subconjunto de empresas en etapas iniciales.
Growth of variables in three years for the subsample of early stage investments.
2Esto supuso aumentar la exigencia establecida para las empresas del grupo de control, forzando el cambio de algunas de ellas o incluso eliminando la posibilidadde contar con empresa comparable válida.
Crec. en términos absolutos (0 a 3)Growth in absolute terms (from 0 to 3)
Crec. en términos relativos (0 a 3)Growth in relative terms (from 0 to 3)
Con Capital RiesgoWith VC/PE
Sin Capital RiesgoWithout VC/PE
Dif. en volumenDif. in absolute terms
Act. Inmateriales/Intangible assets*Act. Totales/Total assets*Impuesto sociedades/Corporate tax*Resultado bruto/Gross margin*Ventas/Renevues*Empleo/Employment+
Variable
175,53.955,3
15,9847,1
1.568,110.116
22,41.280,6
24,5202,1494,32.163
153,12.674,7
-8,7645,0
1.073,87.953
19,9%34,69%44,38%53,61%50,80%41,13%
11,16%25,35%43,15%13,12%17,12%11,10%
7,93%9,34%1,23%
40,49%33,68%30,04%
Con Capital RiesgoWith VC/PE
Sin Capital RiesgoWithout VC/PE
Dif. en volumenDif. in absolute terms
Datos para la muestra de 454 empresas, representativas de inversiones realizadas entre 1995 y 2004, con datos hasta 2007.Data related to the whole of 454 firms, representing investments recorded from 1995 to 2004, with accounting data till 2007.
* En millones de euros constantes con año base en 2005/In constant euros million with 2005 as base year.+ Número de trabajadores/Number of employees.
9. Metodología del estudio y cuadros estadísticos
30
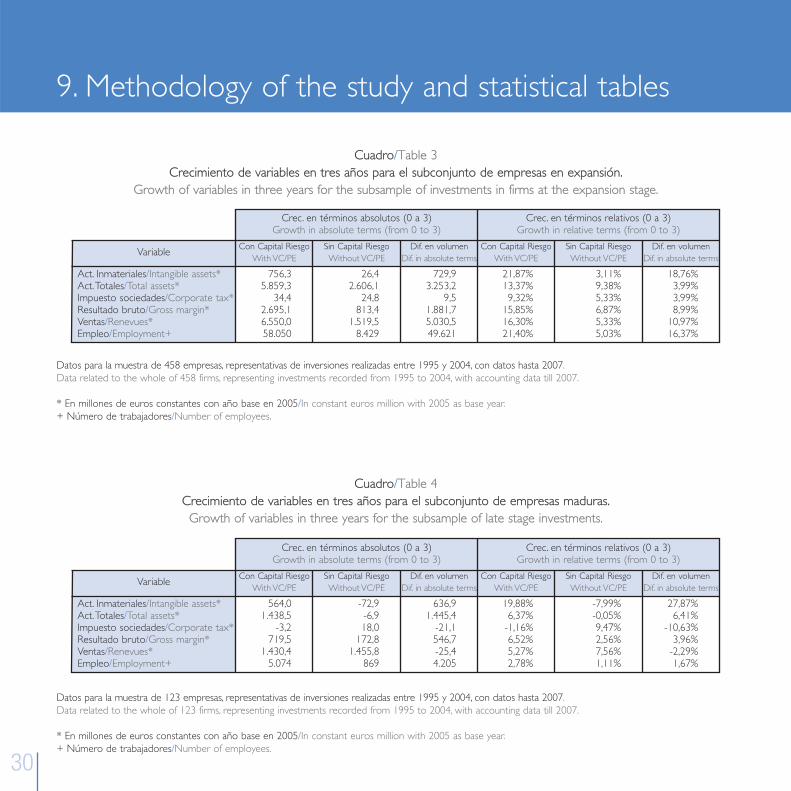
Cuadro/Table 3Crecimiento de variables en tres años para el subconjunto de empresas en expansión.
Growth of variables in three years for the subsample of investments in firms at the expansion stage.
Cuadro/Table 4Crecimiento de variables en tres años para el subconjunto de empresas maduras.Growth of variables in three years for the subsample of late stage investments.
Crec. en términos absolutos (0 a 3)Growth in absolute terms (from 0 to 3)
Crec. en términos relativos (0 a 3)Growth in relative terms (from 0 to 3)
Con Capital RiesgoWith VC/PE
Sin Capital RiesgoWithout VC/PE
Dif. en volumenDif. in absolute terms
Act. Inmateriales/Intangible assets*Act. Totales/Total assets*Impuesto sociedades/Corporate tax*Resultado bruto/Gross margin*Ventas/Renevues*Empleo/Employment+
Variable
756,35.859,3
34,42.695,16.550,058.050
26,42.606,1
24,8813,4
1.519,58.429
729,93.253,2
9,51.881,75.030,549.621
21,87%13,37%9,32%
15,85%16,30%21,40%
3,11%9,38%5,33%6,87%5,33%5,03%
18,76%3,99%3,99%8,99%
10,97%16,37%
Con Capital RiesgoWith VC/PE
Sin Capital RiesgoWithout VC/PE
Dif. en volumenDif. in absolute terms
Datos para la muestra de 458 empresas, representativas de inversiones realizadas entre 1995 y 2004, con datos hasta 2007.Data related to the whole of 458 firms, representing investments recorded from 1995 to 2004, with accounting data till 2007.
* En millones de euros constantes con año base en 2005/In constant euros million with 2005 as base year.+ Número de trabajadores/Number of employees.
Crec. en términos absolutos (0 a 3)Growth in absolute terms (from 0 to 3)
Crec. en términos relativos (0 a 3)Growth in relative terms (from 0 to 3)
Con Capital RiesgoWith VC/PE
Sin Capital RiesgoWithout VC/PE
Dif. en volumenDif. in absolute terms
Act. Inmateriales/Intangible assets*Act. Totales/Total assets*Impuesto sociedades/Corporate tax*Resultado bruto/Gross margin*Ventas/Renevues*Empleo/Employment+
Variable
564,01.438,5
-3,2719,5
1.430,45.074
-72,9-6,918,0
172,81.455,8
869
636,91.445,4
-21,1546,7-25,44.205
19,88%6,37%
-1,16%6,52%5,27%2,78%
-7,99%-0,05%9,47%2,56%7,56%1,11%
27,87%6,41%
-10,63%3,96%
-2,29%1,67%
Con Capital RiesgoWith VC/PE
Sin Capital RiesgoWithout VC/PE
Dif. en volumenDif. in absolute terms
Datos para la muestra de 123 empresas, representativas de inversiones realizadas entre 1995 y 2004, con datos hasta 2007.Data related to the whole of 123 firms, representing investments recorded from 1995 to 2004, with accounting data till 2007.
* En millones de euros constantes con año base en 2005/In constant euros million with 2005 as base year.+ Número de trabajadores/Number of employees.
9. Methodology of the study and statistical tables
31
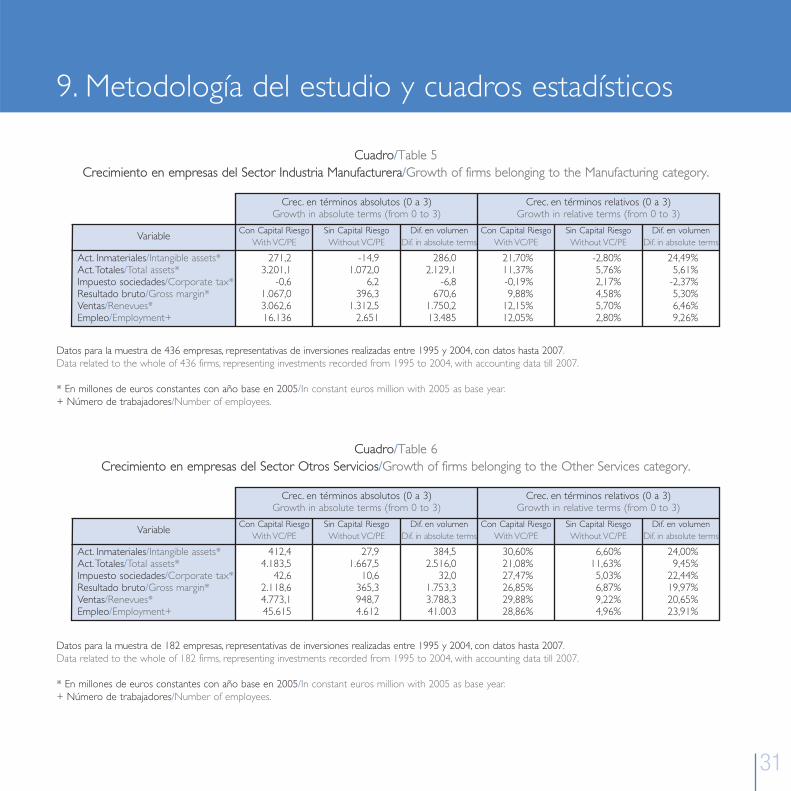
Cuadro/Table 5Crecimiento en empresas del Sector Industria Manufacturera/Growth of firms belonging to the Manufacturing category.
Cuadro/Table 6Crecimiento en empresas del Sector Otros Servicios/Growth of firms belonging to the Other Services category.
Crec. en términos absolutos (0 a 3)Growth in absolute terms (from 0 to 3)
Crec. en términos relativos (0 a 3)Growth in relative terms (from 0 to 3)
Con Capital RiesgoWith VC/PE
Sin Capital RiesgoWithout VC/PE
Dif. en volumenDif. in absolute terms
Act. Inmateriales/Intangible assets*Act. Totales/Total assets*Impuesto sociedades/Corporate tax*Resultado bruto/Gross margin*Ventas/Renevues*Empleo/Employment+
Variable
271,23.201,1
-0,61.067,03.062,616.136
-14,91.072,0
6,2396,3
1.312,52.651
286,02.129,1
-6,8670,6
1.750,213.485
21,70%11,37%-0,19%9,88%
12,15%12,05%
-2,80%5,76%2,17%4,58%5,70%2,80%
24,49%5,61%
-2,37%5,30%6,46%9,26%
Con Capital RiesgoWith VC/PE
Sin Capital RiesgoWithout VC/PE
Dif. en volumenDif. in absolute terms
Datos para la muestra de 436 empresas, representativas de inversiones realizadas entre 1995 y 2004, con datos hasta 2007.Data related to the whole of 436 firms, representing investments recorded from 1995 to 2004, with accounting data till 2007.
* En millones de euros constantes con año base en 2005/In constant euros million with 2005 as base year.+ Número de trabajadores/Number of employees.
Crec. en términos absolutos (0 a 3)Growth in absolute terms (from 0 to 3)
Crec. en términos relativos (0 a 3)Growth in relative terms (from 0 to 3)
Con Capital RiesgoWith VC/PE
Sin Capital RiesgoWithout VC/PE
Dif. en volumenDif. in absolute terms
Act. Inmateriales/Intangible assets*Act. Totales/Total assets*Impuesto sociedades/Corporate tax*Resultado bruto/Gross margin*Ventas/Renevues*Empleo/Employment+
Variable
412,44.183,5
42,62.118,64.773,145.615
27,91.667,5
10,6365,3948,74.612
384,52.516,0
32,01.753,33.788,341.003
30,60%21,08%27,47%26,85%29,88%28,86%
6,60%11,63%5,03%6,87%9,22%4,96%
24,00%9,45%
22,44%19,97%20,65%23,91%
Con Capital RiesgoWith VC/PE
Sin Capital RiesgoWithout VC/PE
Dif. en volumenDif. in absolute terms
Datos para la muestra de 182 empresas, representativas de inversiones realizadas entre 1995 y 2004, con datos hasta 2007.Data related to the whole of 182 firms, representing investments recorded from 1995 to 2004, with accounting data till 2007.
* En millones de euros constantes con año base en 2005/In constant euros million with 2005 as base year.+ Número de trabajadores/Number of employees.
9. Metodología del estudio y cuadros estadísticos
32
Cuadro/Table 7Crecimiento en empresas del Sector Información y Comunicaciones.
Growth of firms belonging to the Information & Communications category.
Cuadro/Table 8Crecimiento en empresas del Sector I+D/Growth of firms belonging to the R&D category.
Crec. en términos absolutos (0 a 3)Growth in absolute terms (from 0 to 3)
Crec. en términos relativos (0 a 3)Growth in relative terms (from 0 to 3)
Con Capital RiesgoWith VC/PE
Sin Capital RiesgoWithout VC/PE
Dif. en volumenDif. in absolute terms
Act. Inmateriales/Intangible assets*Act. Totales/Total assets*Impuesto sociedades/Corporate tax*Resultado bruto/Gross margin*Ventas/Renevues*Empleo/Employment+
Variable
142,4905,0
0,2215,2320,14.076
14,6191,8
9,1108,7179,81.178
127,7713,2
-8,9106,5140,32.898
10,88%15,47%0,67%
11,04%11,24%17,09%
15,04%11,36%18,34%8,32%9,14%7,32%
-4,16%4,11%
-17,67%2,72%2,10%9,77%
Con Capital RiesgoWith VC/PE
Sin Capital RiesgoWithout VC/PE
Dif. en volumenDif. in absolute terms
Datos para la muestra de 165 empresas, representativas de inversiones realizadas entre 1995 y 2004, con datos hasta 2007.Data related to the whole of 165 firms, representing investments recorded from 1995 to 2004, with accounting data till 2007.
* En millones de euros constantes con año base en 2005/In constant euros million with 2005 as base year.+ Número de trabajadores/Number of employees.
Crec. en términos absolutos (0 a 3)Growth in absolute terms (from 0 to 3)
Crec. en términos relativos (0 a 3)Growth in relative terms (from 0 to 3)
Con Capital RiesgoWith VC/PE
Sin Capital RiesgoWithout VC/PE
Dif. en volumenDif. in absolute terms
Act. Inmateriales/Intangible assets*Act. Totales/Total assets*Impuesto sociedades/Corporate tax*Resultado bruto/Gross margin*Ventas/Renevues*Empleo/Employment+
Variable
14,383,70,7
61,186,4451
7,447,11,14,4
21,2179
7,036,6-0,456,665,2272
49,21%23,12%66,85%35,58%33,13%18,96%
48,27%24,21%27,67%3,87%
10,51%16,69%
0,94%-1,09%39,18%31,70%22,62%2,27%
Con Capital RiesgoWith VC/PE
Sin Capital RiesgoWithout VC/PE
Dif. en volumenDif. in absolute terms
Datos para la muestra de 23 empresas, representativas de inversiones realizadas entre 1995 y 2004, con datos hasta 2007.Data related to the whole of 23 firms, representing investments recorded from 1995 to 2004, with accounting data till 2007.
* En millones de euros constantes con año base en 2005/In constant euros million with 2005 as base year.+ Número de trabajadores/Number of employees.
9. Methodology of the study and statistical tables
33
Cuadro/Table 9Crecimiento en empresas del Sector Hostelería y Ocio.
Growth of firms belonging to the Hotels, Catering & Leisure category.
Crec. en términos absolutos (0 a 3)Growth in absolute terms (from 0 to 3)
Crec. en términos relativos (0 a 3)Growth in relative terms (from 0 to 3)
Con Capital RiesgoWith VC/PE
Sin Capital RiesgoWithout VC/PE
Dif. en volumenDif. in absolute terms
Act. Inmateriales/Intangible assets*Act. Totales/Total assets*Impuesto sociedades/Corporate tax*Resultado bruto/Gross margin*Ventas/Renevues*Empleo/Employment+
Variable
147,3829,3
1,5146,7166,51.472
-49,7-510,8
-1,2-11,7-3,0483
196,91.340,1
2,7158,4169,4
989
30,76%21,75%5,46%
14,10%12,29%7,17%
-11,76%-17,65%-3,99%-1,24%-0,24%2,47%
42,52%39,40%9,45%
15,34%12,53%4,70%
Con Capital RiesgoWith VC/PE
Sin Capital RiesgoWithout VC/PE
Dif. en volumenDif. in absolute terms
Datos para la muestra de 49 empresas, representativas de inversiones realizadas entre 1995 y 2004, con datos hasta 2007.Data related to the whole of 49 firms, representing investments recorded from 1995 to 2004, with accounting data till 2007.
* En millones de euros constantes con año base en 2005/In constant euros million with 2005 as base year.+ Número de trabajadores/Number of employees.
9. Metodología del estudio y cuadros estadísticos
34
Cuadro/Table 10Descripción de la población y la muestra por años/Description of Population and sample by years.
(1)
1995199619971998199920002001200220032004
Todas
Año
11099
155146179269231192210202
1.793
(2)
-6-8-7-6
-11-19-11-23-10-19
-120
(3)
10491
148140168250220169200183
1.673
(4)
-6-3
-13-4
-10-19-17-15-10-4
-101
Población
9888
135136158231203154190179
1.572
(5)
8867
104115136214155126163145
1.313
%
89,8%76,1%77,0%84,6%86,1%92,6%76,4%81,8%85,8%81,0%
83,5%
(6)
65548994
1071589794
161116
1.035
%
66,3%61,4%65,9%69,1%67,7%68,4%47,8%61,0%84,7%64,8%
65,8%
Inversiones entre 1995 y 2004, con seguimiento de datos contables tres años después.(1) Nuevas inversiones del año, excluyendo inversiones en empresas ya financiadas por otros.(2) Inversiones en empresas fuera de España.(3) Invesiones en empresas en España.(4) Inversiones excluidas: sectores inmobiliario y financiero.(5) Inversiones con datos contables identificados, completos e incompletos.(6) Inversiones con datos completos para las que fue posible identificar una empresa similar no financiada con capital riesgo.
Investments between 1995 and 2004, with monitoring of accounting data three years afterwards(1) New investments of the year, excluding investments in companies already financed by others.(2) Investments in companies outside of Spain.(3) Investments in companies in Spain.(4) Excluded investments: real estate and financial sectors.(5) Investments with identified, complete and incomplete accounting data.(6) Investments with complete data for which it was possible to identify a similar company not financed with VC&PE.
9. Methodology of the study and statistical tables
35
Cuadro/Table 11Desglose de la muestra por años y fases/Breakdown of sample by years and phases.
Cuadro/Table 12Desglose de la por muestra por sectores/Breakdown of sample by sectors.
MuestraSampler
1995199619971998199920002001200220032004
Todas
65548994
1071589794
161116
1.035
Etapas inicialesInitial states
35213432427241536955
454
%
53,8%38,9%38,2%34,0%39,3%45,6%42,3%56,4%42,9%47,4%
43,9%
ExpansiónExpansion
23264543507047347446
458
%
35,4%48,1%50,6%45,7%46,7%44,3%48,5%36,2%46,0%39,7%
44,3%
Buyouts y sustituciónBuy-outs and Substitution
77
1019151697
1815
123
%
10,8%13,0%11,2%20,2%14,0%10,1%9,3%7,4%
11,2%12,9%
11,9%
AñoYear
Códigos NACE Rev 2NACE Rev 2 Codes
I+D/R&DSector Primario y Energía/Primary Sector & EnergyIndustria Manufacturera/Manufacturing
Comercio/TradeTransporte/TransportationHostelería y Ocio/Hotels, Catering & LeisureInformación y Comunicaciones/Information & CommunicationOtros Servicios/Other Services
Todas
EmpresasFirms
2342
436
1112749
165182
1.035
%
21,7201-09, 35, 36
10-39 (Excepto/Except 206)
45-4749-53
55-56, 90-9326, 58-63
41-43, 69-82 (Excepto/Except 72),
85-88, 94-96
Sector
2,2%4,1%
42,1%
10,7%2,6%4,7%
15,9%17,6%
100,0%
9. Metodología del estudio y cuadros estadísticos

Patrocinado por/Sponsored by:
Príncipe de Vergara, 55 4ºd • 28006 Madrid, EspañaTelf.: (34) 91 411 96 17 • Fax: (34) 91 562 65 71