csco q1fy10 presentation
TRANSCRIPT

8/14/2019 CSCO Q1FY10 Presentation
http://slidepdf.com/reader/full/csco-q1fy10-presentation 1/30
Conference Call
November 4, 2009

8/14/2019 CSCO Q1FY10 Presentation
http://slidepdf.com/reader/full/csco-q1fy10-presentation 2/30
GAAP RECONCILIATIONGAAP RECONCILIATIONDuring this presentation references to financial measures of Cisco w
references to non-GAAP financial measures. Cisco provides a recon
between GAAP and non-GAAP financial information on our website
www.cisco.com under “About Cisco” in the “Investor Relations” secti
http://investor.cisco.com/results.cfm
--This presentation contains projections and other forward-looking stat
regarding future events or the future financial performance of Cisco,
future operating results. These projections and statements are only
Actual events or results may differ materially from those in the proje
other forward-looking statements. Please see Cisco’s filings with the
including its most recent filing on Form 10-K, for a discussion of imp
factors that could cause actual events or results to differ materially fr
the projections or other forward-looking statements.
2
ill include
ciliation
t
n.
ements
including
redictions.
tions or
SEC,
rtant risk
om those in

8/14/2019 CSCO Q1FY10 Presentation
http://slidepdf.com/reader/full/csco-q1fy10-presentation 3/30
Opening Remarks
Financial Overvie
Business Overview
ra egy
Guidance
Summary Commen
3
nd
s

8/14/2019 CSCO Q1FY10 Presentation
http://slidepdf.com/reader/full/csco-q1fy10-presentation 4/30
Q1 FY’10 Highlight
Financial SummaryFinancial Summary Revenue of $9.0B (-13% vs -1
Non-GAAP EPS of $0.36
Solid expense management,
- Cash generated from operatio
Non-GAAP operating income
Product book to bill was abov
Services revenue up 7% y/y
5% to -17% guid
on-GAAP OpEx
ns of approx. $1.
ery strong at 29
1

8/14/2019 CSCO Q1FY10 Presentation
http://slidepdf.com/reader/full/csco-q1fy10-presentation 5/30
Q1 FY’10 Observati
Almost all of the financial seqQ4 FY’09 to Q1 FY’10 were awere aQ4 to Q1Q4 to Q1 in previous five ‘nor
We are starting to see solid isolid irecoveryrecovery in most geographie
adjacencies while reducing nexpenses by 10% y/y and red
Most markets starting to shoespecially pleased with the U.
approximately flat
ns
ential measuremt the high end ot the high end o
al’ years, FY’04
dications of ecdications of ecaround the wor
n-GAAP operatiucing headcount
signs of improsigns of improS., where y/y ord
8/14/2019 CSCO Q1FY10 Presentation
http://slidepdf.com/reader/full/csco-q1fy10-presentation 6/30
Q1 FY’10 Observati
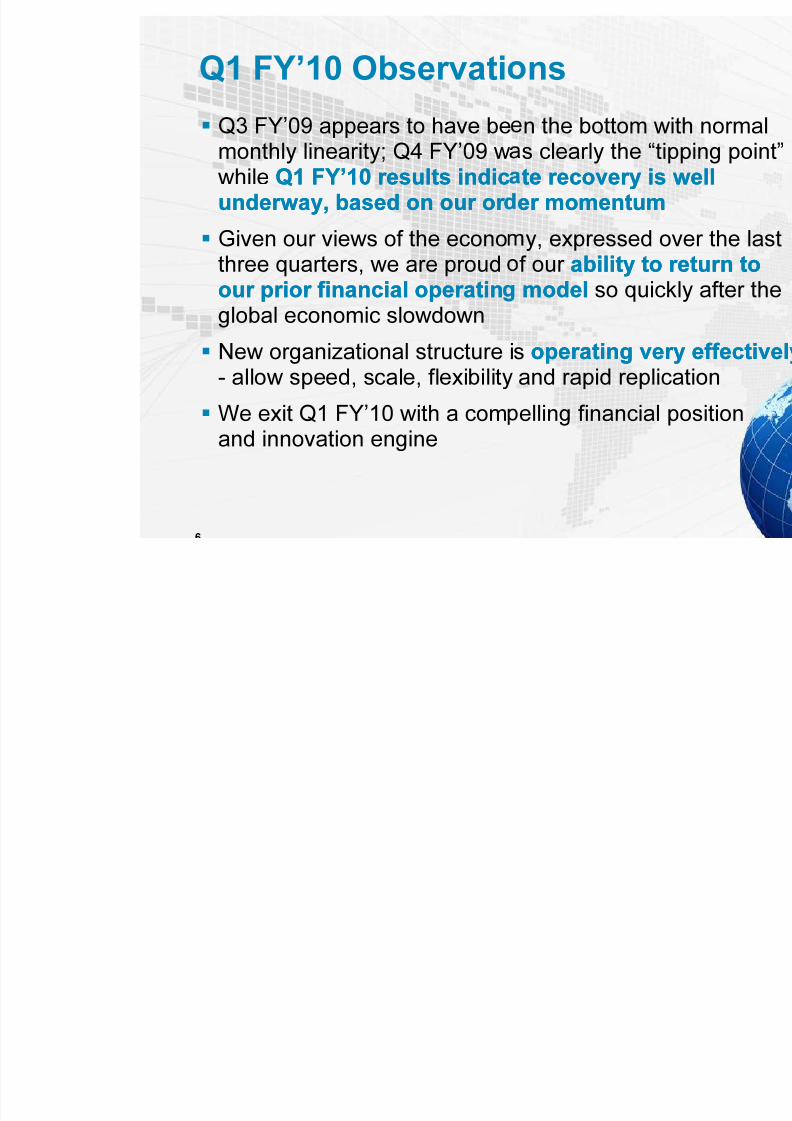
Q3 FY’09 appears to have bemonthly linearity; Q4 FY’09 wwhile Q1 FY’10 results indicQ1 FY’10 results indicunderway, based on our or underway, based on our or
Given our views of the econo
three quarters, we are proudour prior financial operatinour prior financial operatinglobal economic slowdown
New organizational structure i- allow speed, scale, flexibility
We exit Q1 FY’10 with a comand innovation engine
ns
n the bottom wis clearly the “tipte recovery is wte recovery is wer momentumer momentum
y, expressed ov
f our ability to rability to rmodelmodel so quick
s operating veryoperating veryand rapid replica
elling financial p

8/14/2019 CSCO Q1FY10 Presentation
http://slidepdf.com/reader/full/csco-q1fy10-presentation 7/30
Q1 FY’10 Observati
Internal start-ups, partnershipcontinue to fill out our archite
Believe that video architectuvideo architectuWeb 2.0 next generation plaWeb 2.0 next generation placompetitive advantages
EMC and VMware illustratesillustratespartner and acquire to catcpartner and acquire to catc
Key market transitions, relativvirtualization and video netvirtualization and video net
productivity and growth in net
ns
and our acquistural strategies
re is the most imre is the most imyy and is one of o
our ability to inour ability to inkey market trakey market tra
e to collaboratiocollaboratioorkingorking will drive
ork loads

8/14/2019 CSCO Q1FY10 Presentation
http://slidepdf.com/reader/full/csco-q1fy10-presentation 8/30
Opening Remarks
Financial Overvie
Business Overview
ra egy
Guidance
Summary Commen
nd
s

8/14/2019 CSCO Q1FY10 Presentation
http://slidepdf.com/reader/full/csco-q1fy10-presentation 9/30
Cisco Total Revenu
Q1 FY’10 Total RevenuQ1 FY’10 Total Revenu
.
1 Includes an approximate $50m benefit related to the adoption of new revenue r
e
Year / YGrow
Q1 FY
ee11
ecognition accounting guidance

8/14/2019 CSCO Q1FY10 Presentation
http://slidepdf.com/reader/full/csco-q1fy10-presentation 10/30
Q1 FY’10 Revenue
Q1Q1
RoutersRouters $$
SwitchesSwitches $$
Advanced Technolo iesAdvanced Technolo ies $$Other Other $$
ServicesServices $$
TotalTotal $$
1. As a result of rounding, figures may not total. For detailed results,Website at http://www.cisco.com/go/investors
ighlights
Y’10Y’1011 Year / YGrow
.6B.6B (17
.9B.9B (21
.3B.3B 15
.5B.5B 9
.8B.8B 7
.0B.0B (13
please see Cisco’s Investor Relation

8/14/2019 CSCO Q1FY10 Presentation
http://slidepdf.com/reader/full/csco-q1fy10-presentation 11/30

8/14/2019 CSCO Q1FY10 Presentation
http://slidepdf.com/reader/full/csco-q1fy10-presentation 12/30
Q1 FY’10 Non-GAA
Total non-GAAP Gross Margin
-
Service non-GAAP Gross Mar
-- Q1 FY’10 GAAP Total Gross Margin of 65.3%-- Q1 FY’10 GAAP Product Gross Margin of 65.5%-- Q1 FY’10 GAAP Service Gross Margin of 64.5%
Gross Ma
Q4 FY’09
65.3%65.3%
gin 67.5%67.5%

8/14/2019 CSCO Q1FY10 Presentation
http://slidepdf.com/reader/full/csco-q1fy10-presentation 13/30
Q1 FY’10 Gross Ma
U.S. & CanadaU.S. & Canada
EuropeEurope
Emerging MarketsEmerging Markets
Asia PacificAsia Pacific
JapanJapan
Theater TotalTheater Total
1. Gross margin by geography may fluctuate from period to period. Themay be due to factors other than underlying business trends.
gin by Geo
Gross Marg
66.1%
68.3%
62.8%
63.8%
72.6%
66.3%
e fluctuations

8/14/2019 CSCO Q1FY10 Presentation
http://slidepdf.com/reader/full/csco-q1fy10-presentation 14/30
Q1 FY’10 Non-GAAIncome Statement
$M (except per-share amounts and percentages) Q1Q1
Net SalesNet Sales 10,10,
Gross MarginGross Margin 6565
Operating ExpensesOperating Expenses 3,3,
OpexOpex (% of Revenue)(% of Revenue) 3535
Operating IncomeOperating Income (% of Revenue)(% of Revenue) 2929
Net IncomeNet Income 2,2,
Net IncomeNet Income (% of Revenue)(% of Revenue) 2424
EPSEPS (diluted)(diluted) $0$0
ighlights
Y’09Y’09 Q4 FY’09Q4 FY’09
331331 8,5358,535
.6%.6% 65.3%65.3%
9999 3,3493,349
.8%.8% 39.2%39.2%
.8%.8% 26.1%26.1%
9797 1,8391,839
.2%.2% 21.5%21.5%
.42.42 $0.31$0.31

8/14/2019 CSCO Q1FY10 Presentation
http://slidepdf.com/reader/full/csco-q1fy10-presentation 15/30
Q1 FY’10 GAAPIncome Statement
$M (except per-share amounts and percentages) Q1Q1
Net SalesNet Sales 10,10,
Gross MarginGross Margin 64.64.
pera ng xpensespera ng xpenses ,,
OpexOpex (% of Revenue)(% of Revenue) 40.40.
Operating IncomeOperating Income (% of Revenue)(% of Revenue) 24.24.
Net IncomeNet Income 2,2,
Net IncomeNet Income (% of Revenue)(% of Revenue) 21.21.
EPSEPS (diluted)(diluted) $0$0
ighlights
Y’09Y’09 Q4 FY’09Q4 FY’09
331331 8,5358,535
7%7% 64.0%64.0%
,,
6%6% 46.9%46.9%
0%0% 17.1%17.1%
0101 1,0811,081
3%3% 12.7%12.7%
.37.37 $0.19$0.19

8/14/2019 CSCO Q1FY10 Presentation
http://slidepdf.com/reader/full/csco-q1fy10-presentation 16/30
Q1 FY’10 Key Finan
Q1 FY’09Q1 FY’09
Cash and Cash EquivalentsCash and Cash Equivalentsand Investments ($M)and Investments ($M)
26,76326,763
Operating Cash Flow ($M)Operating Cash Flow ($M) 2,7182,718
Share Repurchase ProgramAmAm
PurchaPurcha
Q1 FY’10 Purchases $1
Cumulative Program Purchases*Cumulative Program Purchases* $58$58
*Since program inception in FY’02
Approx. $13.1B remaining authorized fundprogram, including $10B additional author on November 4 2009 by Cisco Board of Dir
cial Measu
2 FY’092 FY’09 Q3 FY’09Q3 FY’09
29,53129,531 33,55133,551
3,1983,198 1,9961,996
untunteded ($M)($M)
Number of Number of SharesShares (M)(M)
AvgAvg
,753 76
,932,932 2,8782,878
in repurchaseization approvedectors.

8/14/2019 CSCO Q1FY10 Presentation
http://slidepdf.com/reader/full/csco-q1fy10-presentation 17/30
Q1 FY’10 Key Finan
Q1 FY’09Q1 FY’09
Accounts Receivable ($M)Accounts Receivable ($M) 3,2783,278
Days Sales OutstandingDays Sales Outstanding 2929
Inventory ( M)Inventory ( M) 1,2091,209
NonNon--GAAP Inventory TurnsGAAP Inventory Turns 11.611.6
Purchase Commitments ($M)Purchase Commitments ($M) 2,8522,852
Deferred Revenue ($M)Deferred Revenue ($M) 8,8448,844
HeadcountHeadcount 67,64767,647
cial Measu
2 FY’092 FY’09 Q3 FY’09Q3 FY’09 QQ
2,8932,893 2,3922,392
2929 2727
1,1071,107 1,0231,023
11.311.3 10.710.7
2,6692,669 2,1962,196
9,3009,300 8,7738,773
67,31867,318 66,55866,558
8/14/2019 CSCO Q1FY10 Presentation
http://slidepdf.com/reader/full/csco-q1fy10-presentation 18/30
New accounting sta
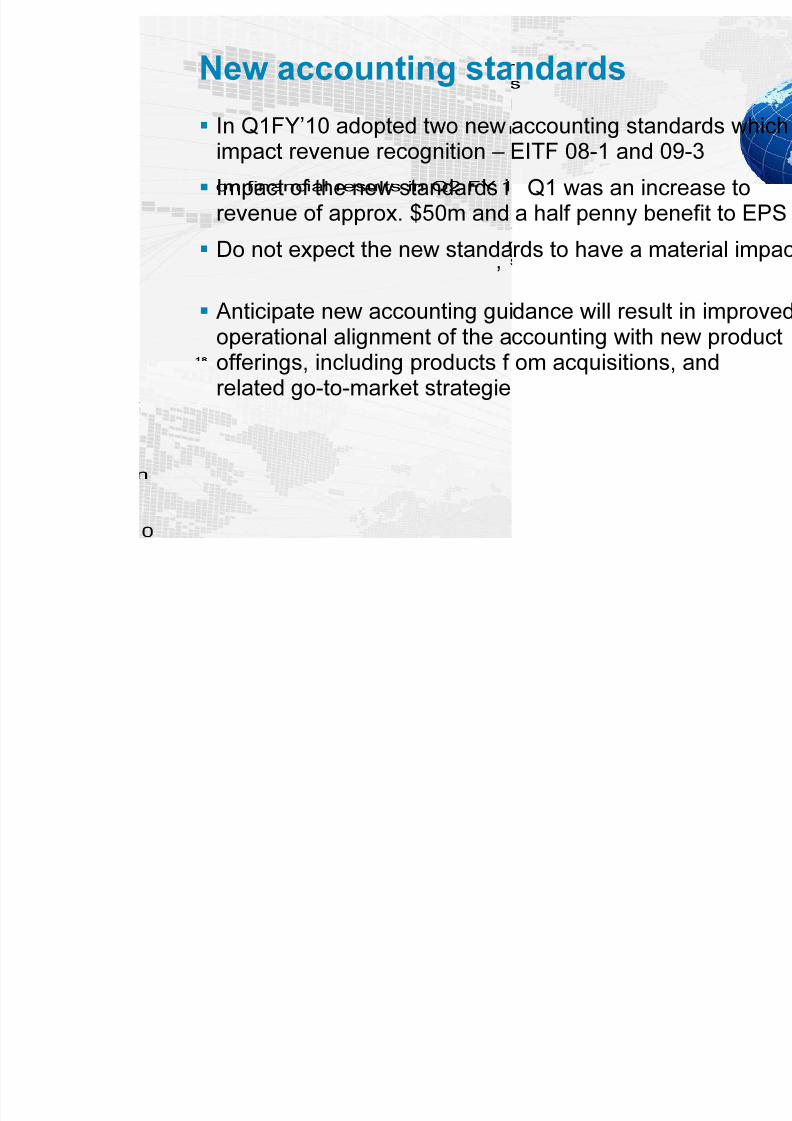
In Q1FY’10 adopted two newimpact revenue recognition –
Impact of the new standards irevenue of approx. $50m and
Do not expect the new standa
’ Anticipate new accounting gui
operational alignment of the aofferings, including products f related go-to-market strategie
ndards
accounting standEITF 08-1 and 09
Q1 was an incra half penny ben
rds to have a ma
dance will result ccounting with neom acquisitions,

8/14/2019 CSCO Q1FY10 Presentation
http://slidepdf.com/reader/full/csco-q1fy10-presentation 19/30
Financial summary
Pleased with our Q1 results awhich we can continue to focfocmarket transitionsmarket transitions
Ongoing efforts to improve eff allowed us to deliver strong p
make investments in innovmake investments in innovand our key growth opportuand our key growth opportu
d the strong fous on growth ans on growth an
iciency and prodrformance; we w
tion, operationation, operationanitiesnities

8/14/2019 CSCO Q1FY10 Presentation
http://slidepdf.com/reader/full/csco-q1fy10-presentation 20/30
Opening Remarks
Financial Overvie
Business Overview
ra egy
Guidance
Summary Commen
nd
s

8/14/2019 CSCO Q1FY10 Presentation
http://slidepdf.com/reader/full/csco-q1fy10-presentation 21/30
Strategy Review
Q1 continued the trend of baland operational effectiveness
The major results and commitvideovideo and collaborationcollaboration wer phases of our focus on marke
communications and IT
nce between inn
ents to virtualivirtualievident in almoadjacencies as

8/14/2019 CSCO Q1FY10 Presentation
http://slidepdf.com/reader/full/csco-q1fy10-presentation 22/30
Strategy Review
Virtualization
– Solid momentum driven by Nex
– UCS experiencing solid market
– VCE Coalition announcementrepresents an unprecedented l
Video – TelePresence revenues grew i
– TANDBERG, DVN and Pure Di
– Medianet architectural solution
Collaboration
– Collaboration driving the next winnovation and productivity
– TANDBERG also about integrabroader $30B+ collaboration m
– Intent to acquire Starent focuss
us 5000 and 7000 fa
reception
ith EMC and VMwavel of collaboration
excess of 100% y/y
ital announcements
ave of business gro
ion of video into therket
d on mobile subscr

8/14/2019 CSCO Q1FY10 Presentation
http://slidepdf.com/reader/full/csco-q1fy10-presentation 23/30
Q1 FY’10 Geograph
U.S. orders flat y/y– Enterprise up approx. 10% y/y
– Public sector up high single digi
– Service provider down high sing
– Commercial down in mid single
apan or ers up m s ng e
– Public sector up over 40% y/y
– Commercial down in mid teens
Asia Pac orders down low sin
– Public sector up over 30% y/y– Other sectors down between mi
Emerging Markets orders dow
Europe orders down low teen
ic Highligh
ts y/y
le digits y/y
digits y/y
s y y
/y
le digits y/y
d single and mid tee
n high twenties y
y/y

8/14/2019 CSCO Q1FY10 Presentation
http://slidepdf.com/reader/full/csco-q1fy10-presentation 24/30
Q1 FY’10 Product H
Product RevenueProduct Revenue Switching revenue down appr
Routing revenue down approx
Total Advanced Technologies
– Unified Communications down– Wireless up 7%
– Networked Home down 18%
– Security down 9%
– Storage down 19%
– Video down 29%
– ANS down 25%
– TelePresence revenue grew ov
ighlights
x. 21% y/y
. 17% y/y
down approx. 15
rox. 10%
r 100% y/y

8/14/2019 CSCO Q1FY10 Presentation
http://slidepdf.com/reader/full/csco-q1fy10-presentation 25/30
Vision, Strategy an
VisionVision of how the industry evvery much as we expected
Our differentiated strategydifferentiated strategy iCisco and our customers that
a customer partnership perspof our customers’ total comm
Execution
lving appears to
achieving the bwe thought were
ctive, market shnications and IT
8/14/2019 CSCO Q1FY10 Presentation
http://slidepdf.com/reader/full/csco-q1fy10-presentation 26/30
Opening Remarks
Financial Overvie
Business Overview
ra egy
Guidance
Summary Commen
nd
s

8/14/2019 CSCO Q1FY10 Presentation
http://slidepdf.com/reader/full/csco-q1fy10-presentation 27/30
Summary Commen
While no one knows for sure t
recovery, job creation opportuof another downturn, we will swe will sexecution assuming an optiexecution assuming an opti
Our customers are rapidly expCisco can help them achieve t
peers
In Q2 FY’10 we plan to aggreaggreand adjacent marketsand adjacent markets for the
On a global and U.S. basis we
we also continue to see somcontinue to see somuncertaintiesuncertainties from an econospending perspective
s
e strength of the
ities and the poset our strategy et our strategy istic viewistic view
anding their viewheir own producproduc
sively invest insively invest inlonger term
saw improveme
challenges anchallenges anic, political and c

8/14/2019 CSCO Q1FY10 Presentation
http://slidepdf.com/reader/full/csco-q1fy10-presentation 28/30
Summary Commen Clearly we saw a tipping poitipping poi
was very strong sequentiallwas very strong sequentially/y growth confirm that the ma
Still too early to know what thextent of job creation,extent of job creation, whichsustainability, will look like in 2
Expect a continued recovery iexpectat ons o not get a eexpectat ons o not get a e
Position Cisco to gain momenwhether they are industry coindustry cotransitions, market adjacentransitions, market adjaceneconomiceconomic
We believe our vision, stratevision, strateare in great shape and produprodu
s
t in Q4 FY’09, at in Q4 FY’09, a
, our expectationrket is recovering
rate of recoverrate of recoveris required for 010
to next year, impo mar et reao mar et rea
um in market trasolidation, prodsolidation, prody opportunitiesy opportunities
y, and executioy, and executioing resultsing results

8/14/2019 CSCO Q1FY10 Presentation
http://slidepdf.com/reader/full/csco-q1fy10-presentation 29/30

8/14/2019 CSCO Q1FY10 Presentation
http://slidepdf.com/reader/full/csco-q1fy10-presentation 30/30