utilidad del inmunofenotipo en las gammapatías ... · utilidad del inmunofenotipo en las...
TRANSCRIPT

Utilidad del inmunofenotipo en las gammapatías monoclonales (MGUS y mieloma múltiple)
Departamento de Medicina, Centro de Investigación del Cáncer y Servicio de Citometría. Universidad de Salamanca, Salamanca, España.
EuroFlowTM Consortium
Curso avanzado de Actualización en Onco Hematología. Buenos Aires, Mayo, 30 a Junio, 1, 2011

Normal B-cell diferentiation
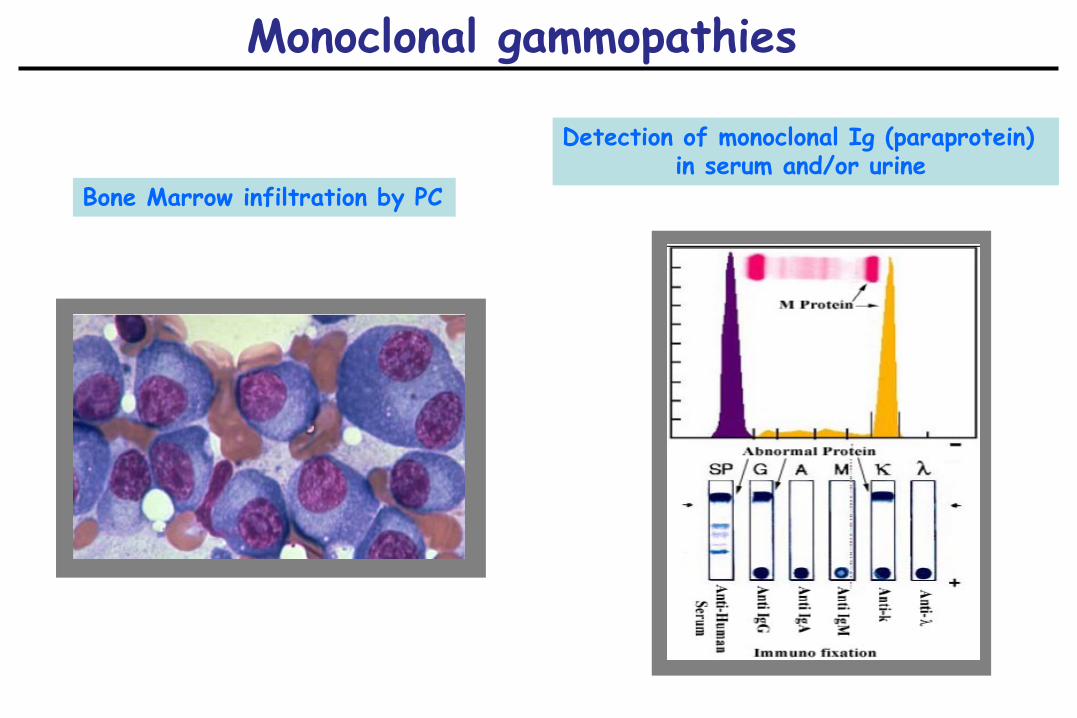
Monoclonal gammopathies
Bone Marrow infiltration by PC
Detection of monoclonal Ig (paraprotein) in serum and/or urine
Monoclonal gammopathies
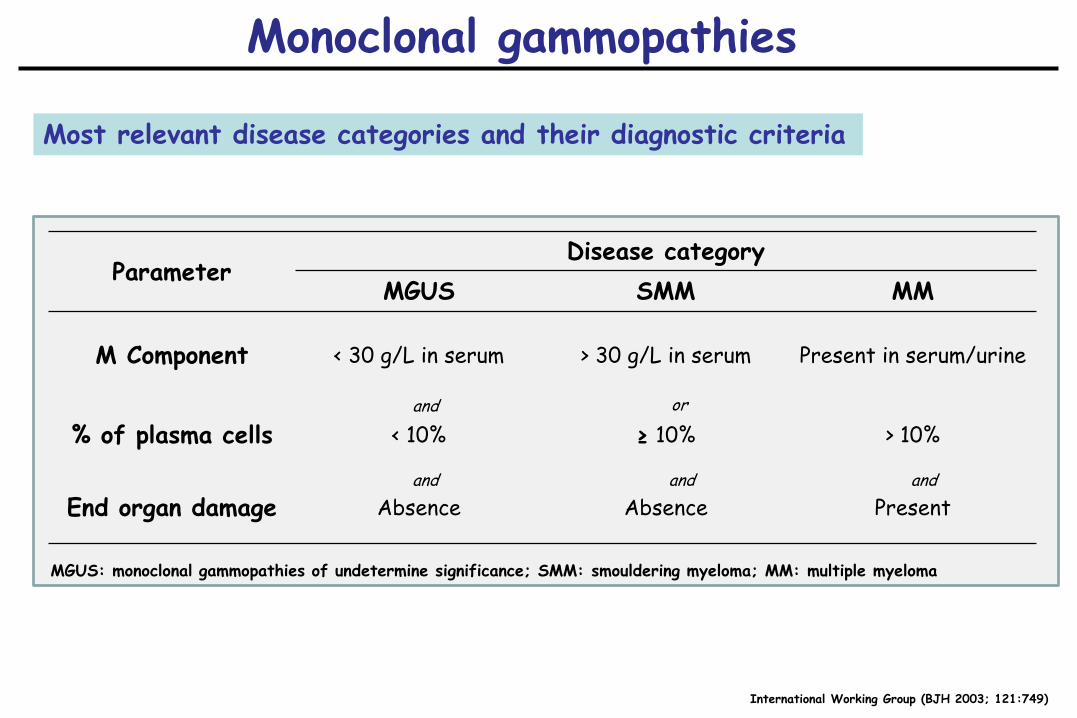
International Working Group (BJH 2003; 121:749)
Parameter Disease category
MGUS SMM MM
M Component < 30 g/L in serum > 30 g/L in serum Present in serum/urine
% of plasma cells < 10% ≥ 10% > 10%
End organ damage Absence Absence Present
Most relevant disease categories and their diagnostic criteria
and
and and
or
and
MGUS: monoclonal gammopathies of undetermine significance; SMM: smouldering myeloma; MM: multiple myeloma

Monoclonal gammopathies
Natural history ?
Time
MGUS Multiple myeloma
Germinal center B-cell
prevalence of 3.2%; ≥50y risk of transformation: 1 % per year MGUS to MM 1 0% per year SMM to MM
Kyle RA, et al. N Engl J Med. 2007;356:2582-90. Weiss BM, et al. Blood. 2009;113(22):5418-22
??
Smoldering myeloma

MM. Treatment
1848 1960 1970 1980 1990 2000 2003 2004 2011
Melphalan (1958, Blokhin)
Ann NY Acad Sci
Combination chemo Vincristine
Doxorubicin Dexamethasone
Thalidomide
Bortezomib
Melphalan Glucocorticoids
(1969)
High-dose chemo Stem cell transplantation
Bisphosphonates
Mr. McBean
1 848 Lenalidomide
?

MM. Treatment
Kumar SK et al. Blood. 2008
1971–76
1994–00 1989–94
1977–82
2001–06
1983–88
Time
0 20 40 60 80 100 120 140
Surv
ival
0.0
0.2
0.4
0.6
0.8
1.0 Su
rvival
OS from time of diagnosis in 6-year intervals based on date of diagnosis

FCM Immunophenotyping of PC
- Identification and characterization of PC • Prognostic influence of number of PC 1
• Prognostic influence of specific antigens 2
• Analysis of DNA ploidy and cell cycle 3
- Discrimination between normal vs. clonal PC: • Differential diagnosis of MGUS & MM 4,5
• Risk of transformation of MGUS & smoldering MM 6,7
• Favourable prognosis subgroup of symptomatic MM 8
• MRD investigations in MM 9-12
• Differential diagnosis of AL vs. other forms of amyloidosis 13
• Differential diagnosis of IgM monoclonal gammopathies
1. Paiva et al. Haematologica 2009;94(11):1599-1602. 2. Mateo et al. J.Clin.Oncol. 2008;26(16):2737-2744. 3. San Miguel et al. Blood 1995;85(2):448-455. 4. Ocqueteau et al. Am.J.Pathol. 1998;152(6):1655-1665. 5. Olteanu et al. BMC.Clin.Pathol. 2008;8:13.
11. Paiva et al. Blood 2008;112(10):4017-4023. 12. Paiva et al. J Clin Oncol. 2011 Apr 20;29(12):1627-33. 13. Paiva et al. Blood 2011 Epub ahed of print 14. Ocio et al. Clin Lymphoma Myeloma Leuk. 2011
6. Perez-Persona et al. Blood 2007;110(7):2586-2592. 7. Perez-Persona et al. Br J Haematol. 2010 Jan;148(1):110-4. 8. Paiva et al. Blood 2009;114(20):4369-72. 9. San Miguel et al. Blood 2002;99(5):1853-1856. 10. Rawstron et al. Blood 2002;100(9):3095-3100.

MONOCLONAL GAMMOPATHIES: IDENTIFICATION OF PLASMA CELLS
Specific positive identification. CD38/CD138 gating strategy

FCM Immunophenotyping of PC Identification and characterization of PC. Quantitation
% BMPC
MFC
100
80
60
40
20
0
CM
11%
40%
*
* P <.001
23%
Paiva et al. Haematologica 2009;94(11):1599-1602.
Differences in BMPC counts between CM and MFC in 765 MM patients at diagnosis

FCM Immunophenotyping of PC Identification and characterization of PC. Quantitation. Clinical impact
Paiva et al. Haematologica 2009;94(11):1599-1602.
< 30% BMPC (n=253) ≥ 30% BMPC (n=512)
PFS OS
P < 0.001
120 100 80 60 40 20
100
80
60
40
20
0
P < 0.001
125 100 75 50 25
100
80
60
40
20
0
Median: 48m
Median: 37m
Median: 97m
Median: 61m
< 15% BMPC (n=438) ≥ 15% BMPC (n=327)
P = 0.003
120 100 80 60 40 20
100 80 60 40 20
0
P < 0.001
125 100 75 50 25
100 80 60 40 20 0
Median: 43m
Median: 36m
Median: 97m
Median: 54m
PFS OS ≥ 15% BMPC by
MFC
≥ 30% BMPC by CM
Paiva et al. Haematologica 2009;94(11):1599-1602. ONLY BMPC QUANTIFICATION BY MFC IS OF INDEPENDENT PROGNOSTIC VALUE
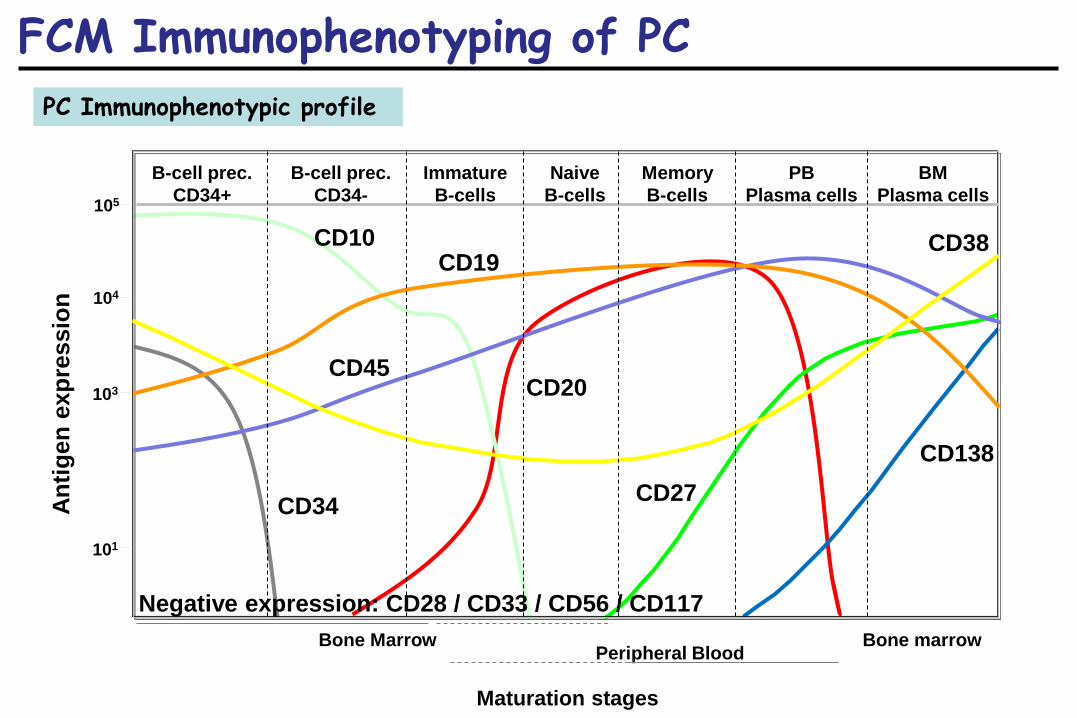
FCM Immunophenotyping of PC PC Immunophenotypic profile
Peripheral Blood Bone Marrow
103
104
105
B-cell prec. CD34+
Maturation stages
101
CD19
CD45 CD20
CD38
CD27 CD138
B-cell prec. CD34-
Immature B-cells
Naive B-cells
Memory B-cells
PB Plasma cells
BM Plasma cells
CD10
CD34
Negative expression: CD28 / CD33 / CD56 / CD117 Bone marrow
Antig
en e
xpre
ssio
n
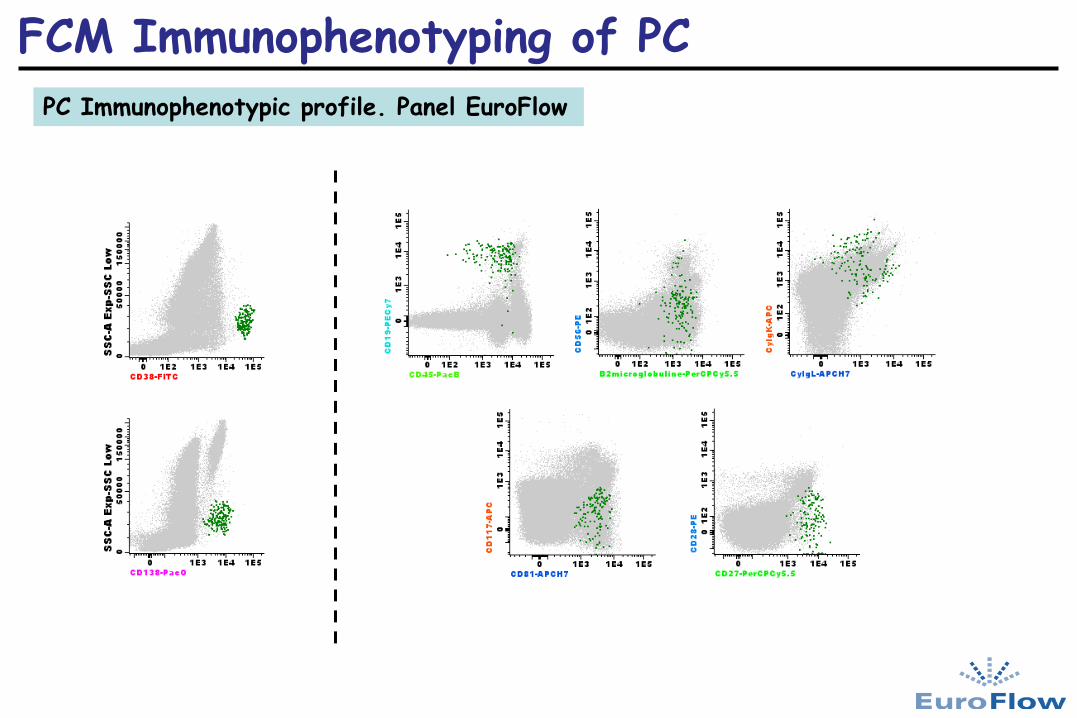
FCM Immunophenotyping of PC PC Immunophenotypic profile. Panel EuroFlow
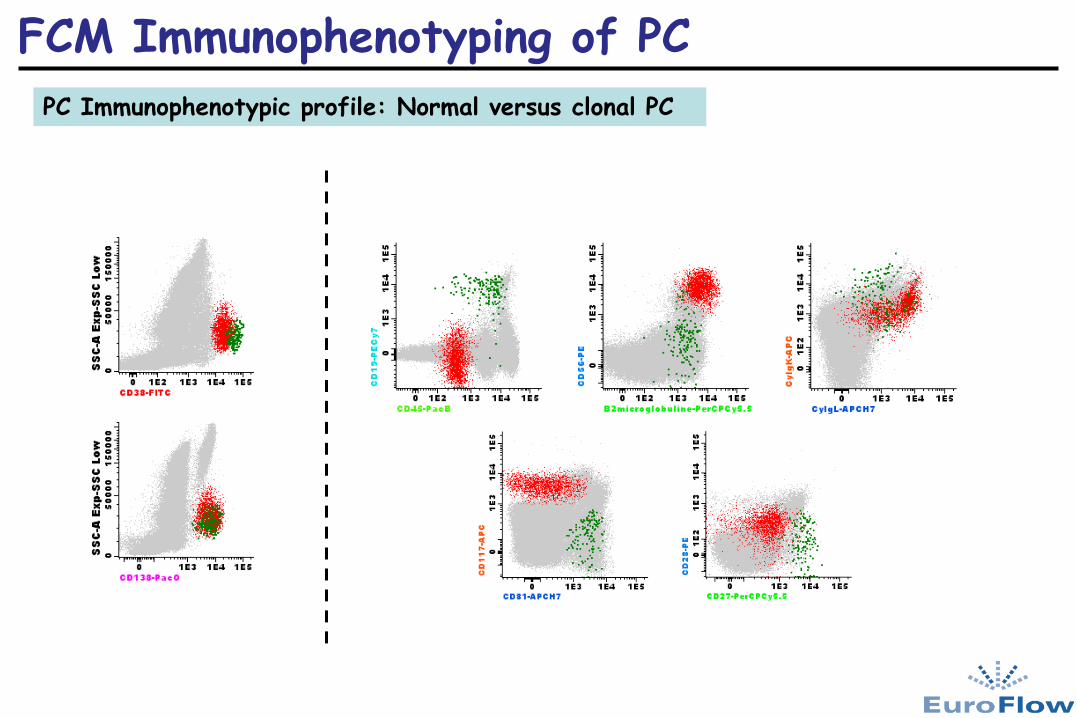
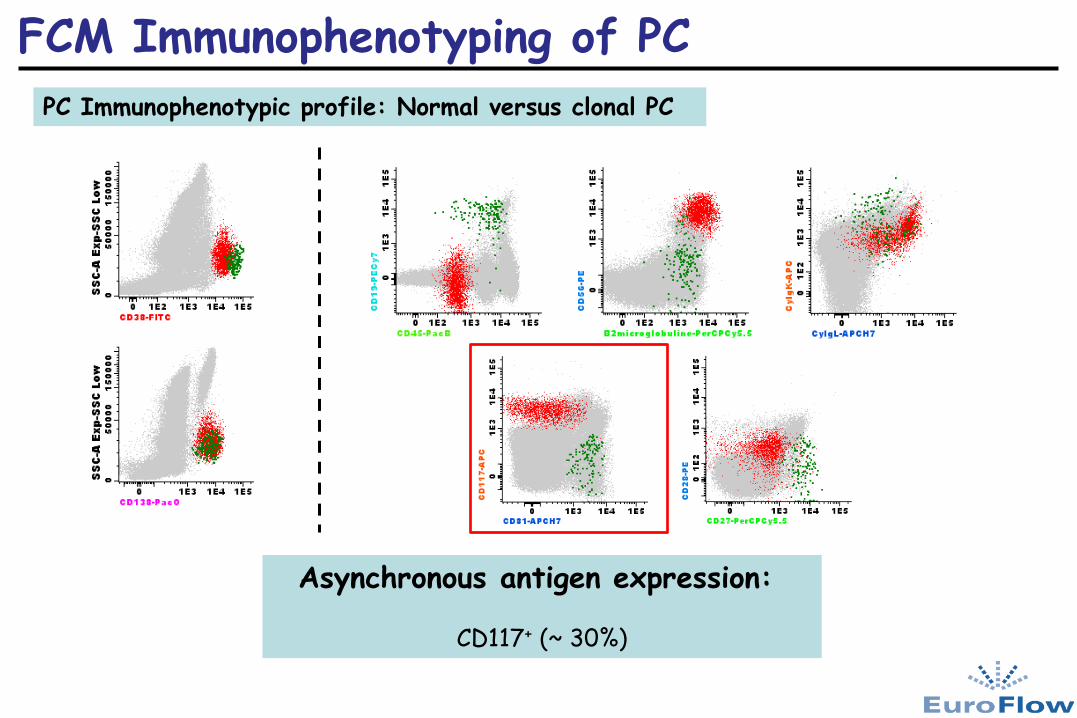
FCM Immunophenotyping of PC PC Immunophenotypic profile: Normal versus clonal PC

FCM Immunophenotyping of PC Normal versus clonal PC
Proportion of aPC referred to the total-PC (aPC/BMPC)
2nd step
PC compartment
.
.
.
. . .
.
.
.
.
. . .
.
. . . . . .
% aPC/BMPC
% nPC/BMPC
1st step Total cellularity
% PC within BM cellularity

FCM Immunophenotyping of PC Differential diagnosis
Vast majority of cases with 100% Pathological PC
Co-existence of Pathological and Normal PC
versus MM-PC
< 5% N-PC
MM-PC
>5% N-PC
Symptomatic MM MGUS/Smouldering MM
The most powerful single criteria for differential diagnosis
Ocqueteau et al, Am J Pathol 1998, 152: 1655
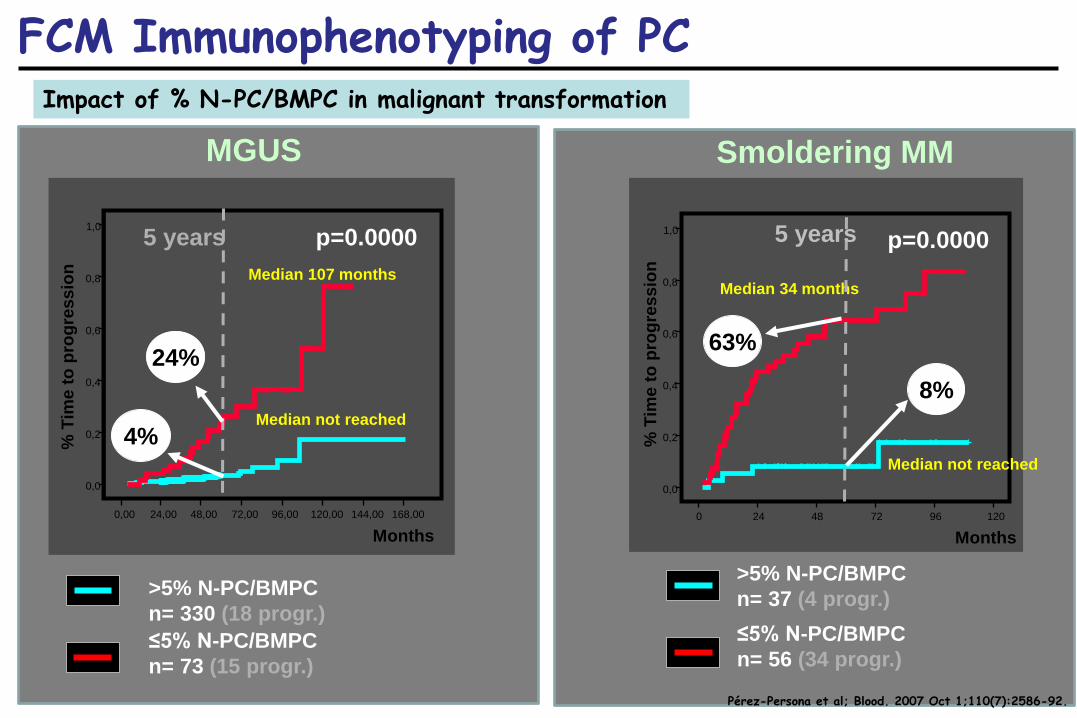
FCM Immunophenotyping of PC Impact of % N-PC/BMPC in malignant transformation
Pérez-Persona et al; Blood. 2007 Oct 1;110(7):2586-92.
>5% N-PC/BMPC n= 330 (18 progr.) ≤5% N-PC/BMPC n= 73 (15 progr.)
168,00 144,00 120,00 96,00 72,00 48,00 24,00 0,00
1,0
0,8
0,6
0,4
0,2
0,0
Median not reached
Median 107 months
p=0.0000
Months
% T
ime
to p
rogr
essi
on
5 years
4%
24%
MGUS
120 96 72 48 24 0
1,0
0,8
0,6
0,4
0,2
0,0
p=0.0000
Median not reached
Median 34 months
Months
% T
ime
to p
rogr
essi
on
63%
5 years
8%
>5% N-PC/BMPC n= 37 (4 progr.) ≤5% N-PC/BMPC n= 56 (34 progr.)
Smoldering MM
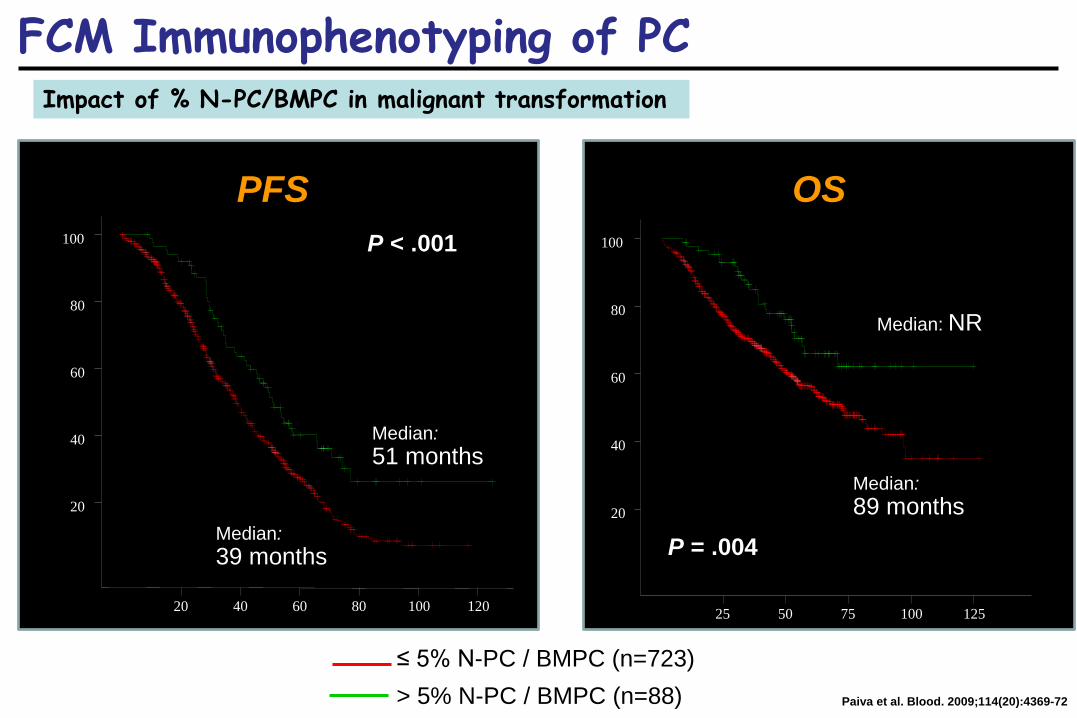
FCM Immunophenotyping of PC Impact of % N-PC/BMPC in malignant transformation
> 5% N-PC / BMPC (n=88) ≤ 5% N-PC / BMPC (n=723)
PFS OS
120 100 80 60 40 20
100
80
60
40
20
P < .001
Median: 39 months
Median: 51 months
125 100 75 50 25
100
80
60
40
20
Median: NR
P = .004
Median: 89 months
Paiva et al. Blood. 2009;114(20):4369-72

FCM Immunophenotyping of PC PC Immunophenotypic profile: Normal versus clonal PC
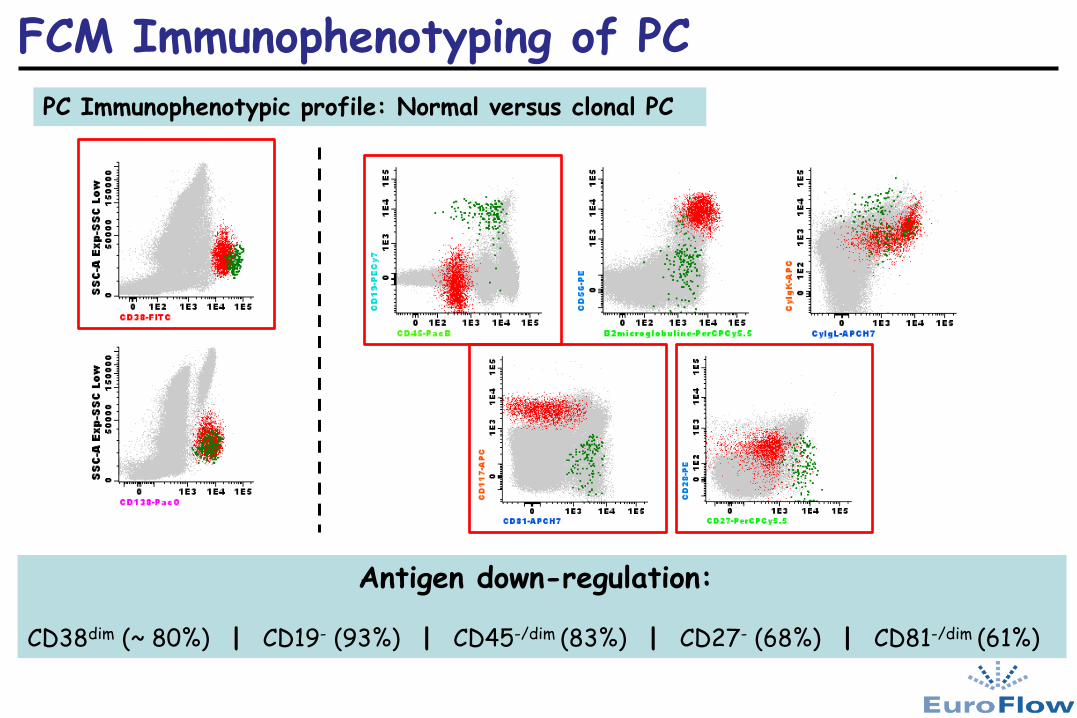
FCM Immunophenotyping of PC PC Immunophenotypic profile: Normal versus clonal PC
Antigen down-regulation: CD38dim (~ 80%) | CD19- (93%) | CD45-/dim (83%) | CD27- (68%) | CD81-/dim (61%)

FCM Immunophenotyping of PC PC Immunophenotypic profile: Normal versus clonal PC
Antigen up-regulation: CD56hi (57%) | CD28+ (25%)
FCM Immunophenotyping of PC PC Immunophenotypic profile: Normal versus clonal PC
Asynchronous antigen expression:
CD117+ (~ 30%)

FCM Immunophenotyping of PC PC Immunophenotypic profile: Normal versus clonal PC
CyLight chain restriction

FCM Immunophenotyping of PC PC Immunophenotypic profile: Aberrant phenotypes
0
10
20
30
40
50
60
70
80
90
100
CD19 CD38 CD45 CD56 CD28 CD33 CD117 CD20
96%
80%
73%
60%
36%
18%
32%
17%
Asynchronous expression Infra-expression
Mateo et al. J Clin Oncol; 2008;26:2737
Over-expression
N= 685 patients
92%

FCM Immunophenotyping of PC PC Immunophenotypic profile: Impact of CD19 expression
Mateo et al. J Clin Oncol; 2008;26:2737
Months from diagnosis 84 72 60 48 36 24 12 0
Prog
ress
ion
free
sur
viva
l
1,0
0,8
0,6
0,4
0,2
0,0
Months from diagnosis 84 72 60 48 36 24 12 0
Ove
rall
surv
ival
1,0
0,8
0,6
0,4
0,2
0,0
p= 0.04 p= 0.02
38 months n=655
PFS OS
26 months n=30
68 months n=655
40 months n=30
CD19 positive CD19 negative

FCM Immunophenotyping of PC PC Immunophenotypic profile: Impact of CD81 expression
OS
CD81 negative (n=139) CD81 positive (n=90)
68%
77%
50 40 30 20 10 0
100
80
60
40
20
0 P =.03
Median: NR
Median: NR
Paiva et al. Haematologica 2010; 95[suppl.2]:215, abs. 0528
P <.001
PFS
Median: NR
Median: 20m
50 40 30 20 10 0
100
80
60
40
20
0
30%
62%

FCM Immunophenotyping of PC PC Immunophenotypic profile: Impact of CD28 expression
Mateo et al. J Clin Oncol; 2008;26:2737
p= 0.04 p= 0.001
PFS OS
Months from diagnosis 84 72 60 48 36 24 12 0
Prog
ress
ion
free
sur
viva
l
1,0
0,8
0,6
0,4
0,2
0,0
Months from diagnosis 84 72 60 48 36 24 12 0
Ove
rall
surv
ival
1,0
0,8
0,6
0,4
0,2
0,0
31 months n=240
38 months n=420 43 months
n=240
NR months n=420
CD28 positive CD28 negative
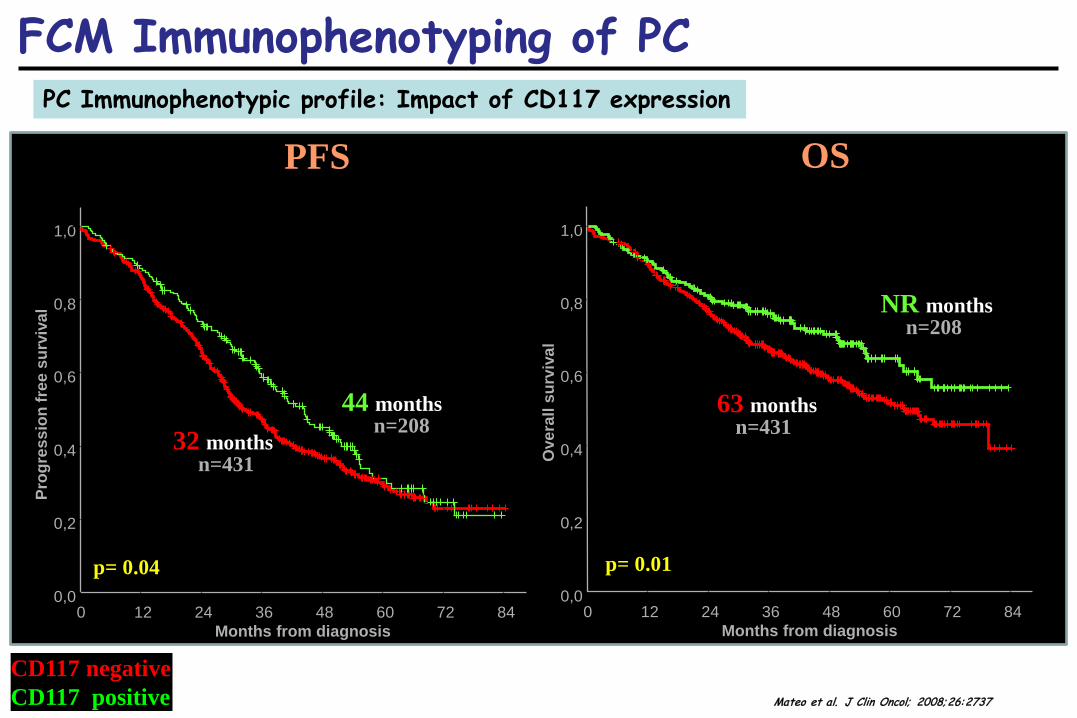
FCM Immunophenotyping of PC PC Immunophenotypic profile: Impact of CD117 expression
Mateo et al. J Clin Oncol; 2008;26:2737
p= 0.04 p= 0.01
PFS OS
Months from diagnosis 84 72 60 48 36 24 12 0
Prog
ress
ion
free
sur
viva
l
1,0
0,8
0,6
0,4
0,2
0,0
Months from diagnosis 84 72 60 48 36 24 12 0
Ove
rall
surv
ival
1,0
0,8
0,6
0,4
0,2
0,0
32 months n=431
44 months n=208
63 months n=431
NR months n=208
CD117 negative CD117 positive

FCM Immunophenotyping of PC PC Immunophenotypic profile: Impact of CD117 expression
p= 0.0001
PFS OS
p= 0.01
38% n=128
29% n=362
21% n=149
Months from diagnosis 84 72 60 48 36 24 12 0
Prog
ress
ion
free
sur
viva
l
1,0
0,8
0,6
0,4
0,2
0,0
Months from diagnosis 84 72 60 48 36 24 12 0
Ove
rall
surv
ival
1,0
0,8
0,6
0,4
0,2
0,0
72% n=128
57% n=362
43% n=149
CD117+ CD28- CD117- CD28- CD117- CD28+ CD117+ CD28+
Mateo et al. J Clin Oncol; 2008;26:2737

FCM Immunophenotyping of PC
PC Immunophenotypic profile: Association with underlaying molecular abnormalities
Mateo et al. J Clin Oncol; 2008;26:2737

FCM Immunophenotyping of PC Abnormal PC ploidy and S-phase analysis
Diploid DNA index =1
• Cell-cycle of PC:
Hypodiploid Hyperdiploid
G0/G1
S+G2M
Aneuploid DNA index ≠1

FCM Immunophenotyping of PC Abnormal PC ploidy and S-phase analysis. Clinical impact
120 100 80 60 40 20 0
100
80
60
40
20
0
Hyperdiploid (n=322) Non-hyperdiploid (n=318)
P =.001
PFS
120 100 80 60 40 20 0
100
80
60
40
20
0 P <.001
<1% PC in S-phase (n=263) ≥1% PC in S-phase (n=377)
PFS

FCM Immunophenotyping of PC PC-compartment changes after treatment
Myelomatous PC
Normal PC
Bone marrow plasma cell compartment
n-PC MM-PC
0,035 0,007
0,14
0,21
0 0,05
0,1 0,15
0,2 0,25
0,3
0,03 0
1 0.8 10
14 20
Diagnosis 3m post-Trx 12m post-Trx VBCMP/ VBAD (x6)
San Miguel et al Blood; 2002; 99:1853

FCM Immunophenotyping of PC MRD monitoring. Sensitivity. 4-color FCM
San Miguel et al Blood; 2002; 99:1853
10 10 10 10 10 0 1 2 3 4
CD38 ->
15% MM- PC
10 10 10 10 10 0 1 2 3 4
1.4% MM- PC
Gate CD38 ->
1:10
10 10 10 10 10 0 1 2 3 4
Gate CD38 ->
0.13% MM- PC
1:100
1:10000
10 10 10 10 10 0 1 2 3 4
Gate CD38 ->
CD
56 ->
. . . . . . . . .
. . . . . . . . . .
.
0.0014% MM- PC
10 10 10 10 10 0 1 2 3 4
Gate CD38 ->
. . . . .
. . . . . . . . . . .
. . . . . . . . .
. . . . .
. . . . . .
. . . . . . . . .
. . . . . . . . . .
. . . . .
. . . . .
. . . . .
. . . . . . . . .
. . . . . . . . . .
. 0.015% MM- PC
. . . . . . .
. . .
. . . . . . .
. .
. . . . .
.
. . .
.
. . . . .
.
. . .
. .
1:1
Sensitivity level: 10-4
1:1000

FCM Immunophenotyping of PC MRD monitoring. Clinical impact. Survival according to MRD by Immunophenotyping in BM obtained 3 months after ASCT (n=295)
0 25 50 75 100 125
0
20
40
60
80
100
p< 0.0001 Prog
ress
ion
Free
Sur
viva
l
Months
Median: 71 months
Median: 37 months
Median: Not reached
p= 0.002
Median: 89 months
Months
Ove
ral S
urvi
val
0 20 40 60 80 100 120 140
0
20
40
60
80
100
PFS OS
5y
82%
60%
5y
22%
60%
MRD negative (n=125) MRD positive (n=170) Paiva et al; Blood. 2008; 1 1 2: 401 7

FCM Immunophenotyping of PC
PCD panel Version
Tube Violet laser FL channels Blue laser FL channels Red laser FL channels
PacB AmCyan FITC PE PerCP Cy5.5
PECy7 APC APCCy7
1 1 CD45 CD19 CyIgλ CyIgκ CD38 CD56 CD27
2 CD45 CD19 β2 micro CD81 CD38 CD117 CD28
2 1 CD19 CD45 CyIgλ CyIgκ CD138 CD56 CD27
AF700 CD38
2 CD19 CD45 β2 micro CD81 CD138 CD117 CD28 CD38
3 1 CD19 CD45 β2 micro CyIgλ CD138 CD56 CyIgκ CD38
2 CD19 CD45 CD27 CD81 CD138 CD117 CD28 CD38
4 1 CD19 CD45 β2 micro CyIgλ CD138 CD56 CyIgκ
APCH7 CD38
2 CD19 CD45 CD27 CD81 CD138 CD117 CD28 CD38
5 1 CD19 CD45 CD138 CyIgλ β2 micro CD56 CyIgκ CD38
2 CD19 CD45 CD138 CD81 CD27 CD117 CD28 CD38
6 1 CD45
PacO CD38 CD56 β2 micro CD19 CyIgκ CyIgλ
CD138
2 CD45 CD138 CD38 CD28 CD27 CD19 CD117 CD81
The EuroFlow PCD panel

FCM Immunophenotyping of PC
Tube PacB PacO FITC PE PerCP Cy5.5 PECy7 APC APCH7
1 CD45 CD138 CD38 CD56 β2micro CD19 CyIgκ CyIgλ
2 CD45 CD138 CD38 CD28 CD27 CD19 CD117 CD81
The EuroFlow PCD panel

FCM Immunophenotyping of PC
Tube PacB PacO FITC PE PerCP Cy5.5 PECy7 APC APCH7
1 CD45 CD138 CD38 CD56 β2micro CD19 CyIgκ CyIgλ
2 CD45 CD138 CD38 CD28 CD27 CD19 CD117 CD81
The EuroFlow PCD panel
Backbone Markers

FCM Immunophenotyping of PC
Tube PacB PacO FITC PE PerCP Cy5.5 PECy7 APC APCH7
1 CD45 CD138 CD38 CD56 β2micro CD19 CyIgκ CyIgλ
2 CD45 CD138 CD38 CD28 CD27 CD19 CD117 CD81
The EuroFlow PCD panel. Modular design
Tube 1(mandatory) :
-Positive identification
-Accurate quantification of PC
-Diagnosis/assessment of clonality
-Most frequent aberrant phenotypes
-Potentially informative prognostic markers

FCM Immunophenotyping of PC
Tube PacB PacO FITC PE PerCP Cy5.5 PECy7 APC APCH7
1 CD45 CD138 CD38 CD56 β2micro CD19 CyIgκ CyIgλ
2 CD45 CD138 CD38 CD28 CD27 CD19 CD117 CD81
The EuroFlow PCD panel. Modular design
Tube 2 (complementary):
-Less frequent phenotypic aberrancyes
-Markers with prognostic impact

FCM Immunophenotyping of PC
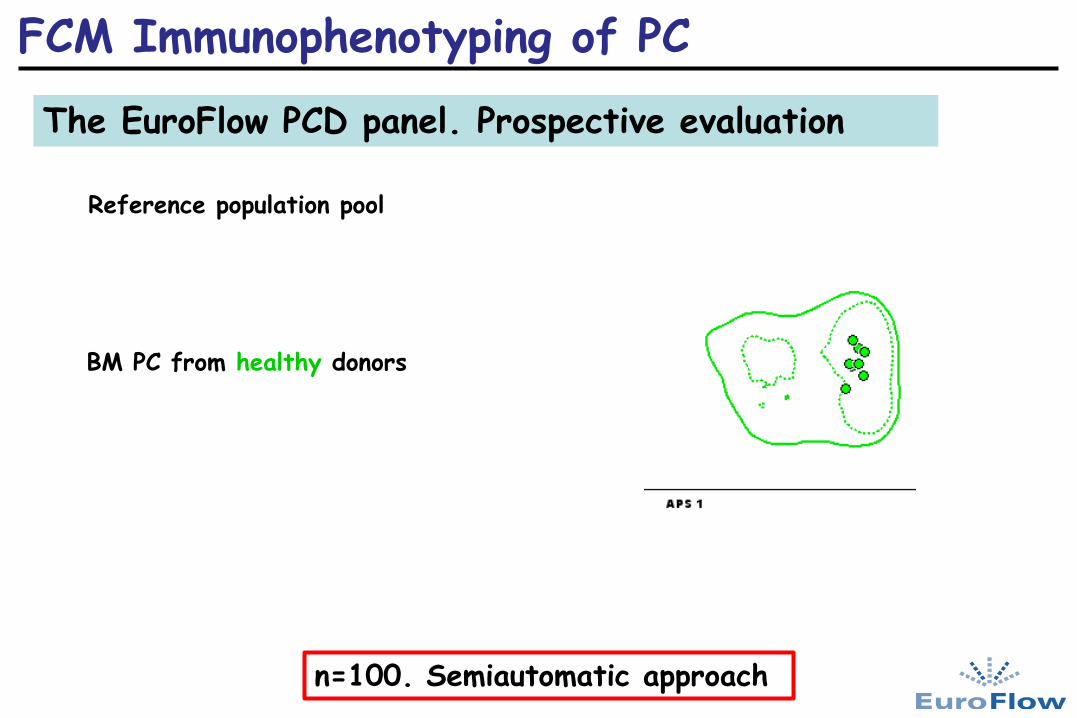
The EuroFlow PCD panel. Prospective evaluation
A B
n=100. Clasic approach
FCM Immunophenotyping of PC
The EuroFlow PCD panel. Prospective evaluation
n=100. Semiautomatic approach
Reference population pool
BM PC from healthy donors

FCM Immunophenotyping of PC
The EuroFlow PCD panel. Prospective evaluation
n=100. Semiautomatic approach
Reference population pool
BM PC from healthy, reactive and regenerative donnors

FCM Immunophenotyping of PC
The EuroFlow PCD panel. Prospective evaluation
n=100. Semiautomatic approach
Abnormal PC populations
CD19-PECy7 21.16
CD56-PE 18.97
CD81-APCH7 12.05
CyIgκ:APC 11.61
CD117-APC 11.33
CD27-PerCPCy5.5 8.30
CD56-PE 23.73
CD19-PECy7 21.28
CD117-APC 17.77
CD81-APCH7 9.52
CD45-PB 6.05
CyIgλ-APCH7 5.74

FCM Immunophenotyping of PC
Thank you

FCM Immunophenotyping of PC
Also thanks to: -EuroFlow group -Hematology department. University hospital of Salamanca. Prof. Jesús San Miguel Dr. M.B. Vidriales Lic. Bruno Paiva