uso de herramientas por la nutria marina
DESCRIPTION
Uso de herramientas por la nutria marina norteamericana Enhydra lutrisTRANSCRIPT
© The Author 2014. Published by Oxford University Press on behalf of the International Society for Behavioral Ecology. All rights reserved. For permissions, please e-mail: [email protected]
The official journal of the
ISBEInternational Society for Behavioral Ecology
Behavioral Ecology
Original Article
Ecological drivers of variation in tool-use frequency across sea otter populationsJessica A. Fujii,a Katherine Ralls,b and Martin Tim Tinkerc
aMonterey Bay Aquarium, Sea Otter Research and Conservation, 886 Cannery Row, Monterey, CA 93940, USA, bSmithsonian Conservation Biology Institute, National Zoological Park, 3001 Connecticut Avenue NW, Washington, DC 20008, USA, and cU.S. Geological Survey, Western Ecological Research Center, Long Marine Lab, 100 Shaffer Road, Santa Cruz, CA 95060, USAReceived 30 July 2014; revised 12 November 2014; accepted 17 November 2014; Advance Access publication 22 December 2014.
Sea otters are well-known tool users, employing objects such as rocks or shells to break open hard-shelled invertebrate prey. However, little is known about how the frequency of tool use varies among sea otter populations and the factors that drive these differences. We examined 17 years of observational data on prey capture and tool use from 8 sea otter populations ranging from southern California to the Aleutian Islands in Alaska. There were significant differences in the diets of these populations as well as variation in the frequency of tool use. Sea otters at Amchitka Island, Alaska, used tools on less than 1% of dives that resulted in the capture of prey compared with approximately 16% in Monterey, California. The percentage of individuals in the population that used tools ranged from 10% to 93%. In all populations, marine snails and thick-shelled bivalves were most likely to be associated with tool use, whereas soft-bodied prey items such as worms and sea stars were the least likely. The probability that a tool would be used on a given prey type varied across populations. The morphology of the prey item being handled and the prevalence of various types of prey in local diets were major ecological drivers of tool use: together they accounted for about 64% of the variation in tool-use frequency among populations. The remaining variation may be related to changes in the relative costs and benefits to an individual otter of learning to use tools effec-tively under differing ecological circumstances.
Key words: foraging specialization, learned behavior, sea otter, tool use.
IntroductIonTool use has been identified in a wide range of animals includ-ing primate (Nishida and Hiraiwa 1982) and nonprimate mammals (Smolker et al. 1997), birds (Orenstein 1972), fishes (Brown 2012), and insects (Pierce 1986) although the vast majority of species do not use tools (Bentley-Condit and Smith 2010). In some tool-using species, tool use occurs in only a subset of populations or individ-uals, or the rate of tool use drastically differs across populations or individuals (Humle and Matsuzawa 2002; Mann et al. 2008). These differences are presumed to be due to variation in genetics, ecological conditions, and/or cultural knowledge. The influence of genetics and learning is difficult to demonstrate conclusively because of numerous confounding effects (Whiten et al. 1999; Lycett et al. 2010; Langergraber et al. 2011), whereas the influence of ecological factors can often be identified through comparative studies (Collins and McGrew 1987; McGrew et al. 1997; Fox et al. 2004; Rutz and St Clair 2012).
Previous studies suggest that animals use tools to acquire dif-ficult-to-access resources that have high gains (i.e., a high cost/high reward situation), but only do so when under external pres-sures such as high inter- or intraspecific competition (Patterson and Mann 2011; Sanz and Morgan 2013) or limited resources dur-ing times of drought or other adverse environmental conditions (Tebbich et al. 2002). Others suggest that high encounter rates with difficult-to-access resources may lead to invention or maintenance of tool use (Sanz et al. 2012; Spagnoletti et al. 2012; Koops et al. 2013).
Sea otters (Enhydra lutris) provide an excellent model system for examining tool-use behaviors, their variation across popula-tions, and the ecological drivers that maintain these behaviors. Tool use in sea otters is unusually conspicuous and well devel-oped (Fisher 1939; Riedman and Estes 1990; Shumaker et al. 2011). This behavior occurs when foraging animals acquire a rock, empty shell, or other hard object and use it as either a ham-mer or an anvil to crack open invertebrate prey (Riedman and Estes 1990). Individuals will often keep the same tool for multiple dives by tucking it under their armpit (even if they do not use the tool each time they surface) and then drop it when it is no longer Address correspondence to J.A. Fujii. [email protected].
Behavioral Ecology (2015), 26(2), 519–526. doi:10.1093/beheco/aru220
at University of C
alifornia, Los A
ngeles on August 12, 2015
http://beheco.oxfordjournals.org/D
ownloaded from
Behavioral Ecology
needed (Hall and Schaller 1964). Tool use is readily observed because sea otters return to the surface and float on their backs while processing and handling prey items.
Sea otters are distributed over a wide range of latitudes in the northeast Pacific Ocean, from southern California to northern Japan (Figure 1). Alaskan and Californian populations are consid-ered morphologically and genetically distinct subspecies (Wilson et al. 1991; Scribner et al. 1997). Hall and Schaller (1964) and Riedman and Estes (1990) suggest that the Alaskan populations may use tools less frequently than the Californian ones. Both sub-species encompass similar habitats ranging from forests of giant kelp to sandy bays. Therefore, it is possible that any ecological dif-ferences seen at a population level would not be seen at the sub-species level. Sea otters consume a wide array of marine benthic invertebrates, some of which have soft bodies and others whose bodies are surrounded by shells, spines, or chitinous exoskeletons.
Thus, the edible portions of some species are well protected and difficult for sea otters to access. Sea otter populations in different locations often consume different diets because the assemblage of invertebrate species that are suitable prey varies with latitude and between rocky and sandy substrates (Riedman and Estes 1990).
Extensive observations on foraging and tool use have been con-ducted on populations throughout the sea otter range over the past 17 years, providing the opportunity for comparing the frequency of tool use in sea otter populations with similar and different genetics and ecological conditions. Our goal was to describe how the frequency of tool use varied across sea otter populations and identify the factors explaining variation in the frequency of tool use. We tested the hypothesis that different sea otter populations would exhibit different frequencies of tool use and that the propor-tion of hard-shelled prey in the diet would explain a large amount of any variation.
0 1,400 2,800700
Kilometers
0 170 34085
Kilometers
Legend
Study sites
Current sea otter range
Historic sea otter range
0 160 32080
Kilometers
Southeast Alaska
CaliforniaGlacierBay
Port Althorp
Monterey
Big Sur
PiedrasBlancas
San Nicolas I.
Amchitka I. Adak I.
Pacific Ocean
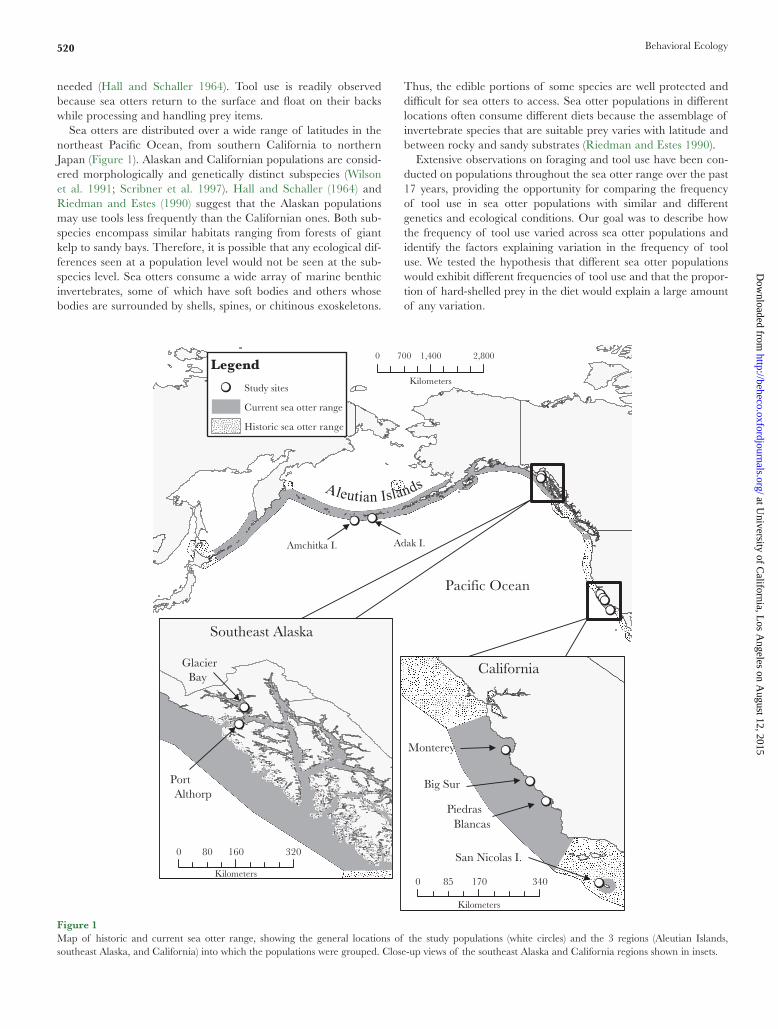
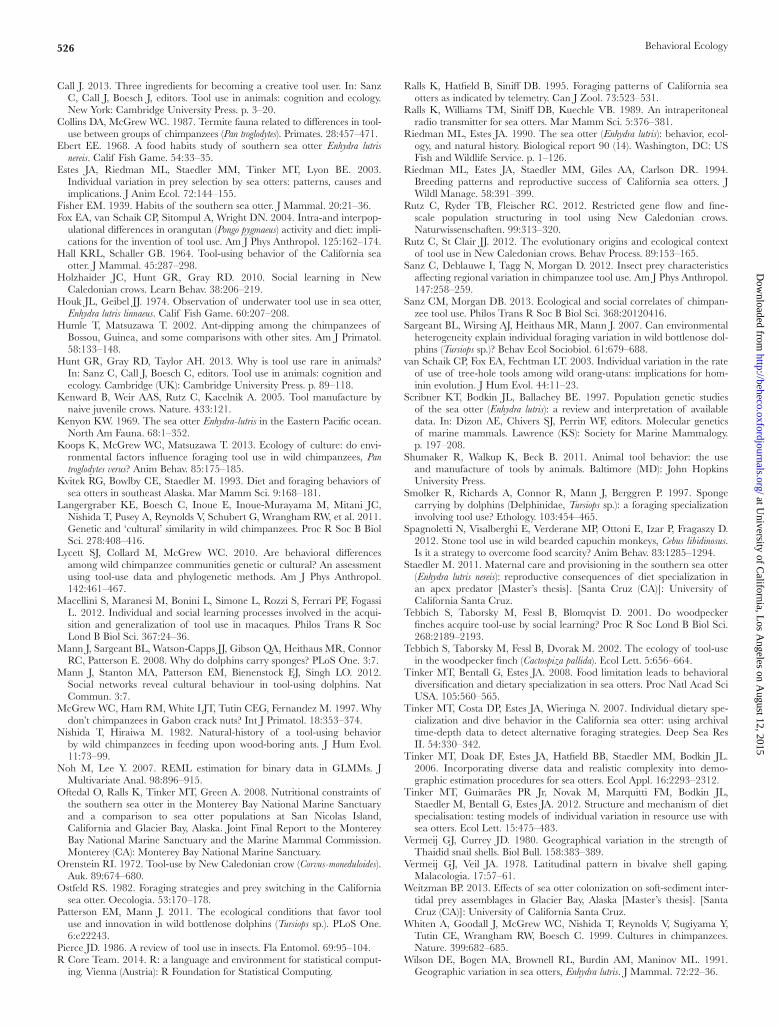
Figure 1Map of historic and current sea otter range, showing the general locations of the study populations (white circles) and the 3 regions (Aleutian Islands, southeast Alaska, and California) into which the populations were grouped. Close-up views of the southeast Alaska and California regions shown in insets.
520
at University of C
alifornia, Los A
ngeles on August 12, 2015
http://beheco.oxfordjournals.org/D
ownloaded from
Fujii et al. • Sea otter tool-use variation
MethodsStudy sites
We used foraging data collected between 1994 and 2011 at 8 loca-tions across the sea otter range in the northeast Pacific Ocean (Figure 1). The populations at these locations are geographically distinct with only occasional movement of individuals across some relatively nearby sites (Tinker et al. 2006). Each study site was characterized by a dominant substrate but encompassed a variety of habitats including rocky intertidal and subtidal substrates, kelp forests, sandy bottom areas, and mixed substrates of mud and silt. These diverse habitats provided a rich prey base for sea otters, with over 100 species of consumable benthic invertebrates (Riedman and Estes 1990).
Four studies took place along the California coast and 4 in Alaska (Table 1). For most analyses, we combine the California populations into a single group and the Alaskan populations into 2 regions, southeast Alaska (Glacier Bay and Port Althorp) and the Aleutian Islands (Adak and Amchitka Island). Although the Alaskan populations are considered one subspecies, the 2 regions in Alaska are separated by approximately 2600 km with no known movement between the two and are characterized by distinctly different habi-tats and prey assemblages.
With the exception of the 2 southeast Alaska populations, individ-ual sea otters were captured and tagged with colored plastic cattle tags on the hind flippers (Kvitek et al. 1993) and very high frequency (VHF) radio transmitters (Ralls et al. 1989). Thus, observations at most sites were on known individuals that could be identified by their tags and followed over time. All field work was conducted with authorization by the US Fish and Wildlife Service under permits issued to M.T. Tinker (California), J.A. Estes (southwest Alaska), and J.L. Bodkin (southeast Alaska) and with oversight by the Institutional Animal Care and Use Committee at University of California Santa Cruz. Standardized methods of data collection were used across the sites with only minor differences, as described below.
Foraging and tool use
Foraging data were collected opportunistically over the duration of each study. We used focal animal sampling (Altmann 1974) to record foraging data on individual otters. A focal sea otter was considered to be foraging when it was observed repeatedly diving underwater and returning to the surface to either consume prey or breathe before diving again. A series of continuous feeding dives by a given individual was considered one forage bout, with
a bout ending if the animal was not observed to dive again within 30 min (Ralls et al. 1995). Observational data on diet and forag-ing behavior were obtained with the aid of 10 × 50 binoculars and Questar 50 × 80 power spotting scopes (Questar Corporation, New Hope, PA), following methods previously described by Kvitek et al. (1993), Estes et al. (2003), and Tinker et al. (2008). Data collection on each forage bout continued as long as observers could clearly see the otter (n = 1–212 dives per forage bout). Foraging data on untagged otters in southeast Alaska were collected for a maximum of 25 dives before moving on to a new foraging individual. Physical appearance and relative location were used to minimize possible resampling of individuals.
After locating a feeding animal, we recorded information on age, sex, and female reproductive status (presence or absence of a pup). Age was categorized as subadult (<3 years) or adult (>3 years) based on body size, grizzle (lightening of fur color and degree of body coverage, which generally increases with age), and dentition. For each feeding dive, we recorded a standardized series of data: dive and surface interval durations, dive outcome (whether or not prey were captured), prey identification, number and size of the prey items, and the presence or absence of tool use. Prey items were identified to the lowest possible taxon during data collection (Supplementary Material). However, prey items were collapsed into 5 prey classes for data analysis (bivalves, crabs, snails, urchins, and soft-bodied prey). Type of feeding habitat (rocky, sandy, or mixed substrate) was not recorded in all studies and so could not be included as a factor. However, we observed that sea otters feed-ing in sandy or muddy habitats will use any hard object, including shells, other prey, and anthropogenic litter as a tool. This suggests that the presence of tool use is not limited by the prevalence of rocks in an area.
An otter was considered to be using a tool if it was observed at the surface using an external object (such as a rock or empty shell) to aid in prey consumption. Tools are also sometimes used under-water by sea otters to dislodge prey from the substrate (Hall and Schaller 1964; Houk and Geibel 1974). This behavior was partic-ularly common when an otter was attempting to capture abalone (Haliotis spp.), but we excluded abalone captures from prey-specific analyses because we could not consistently determine the frequency of underwater tool use (Ebert 1968).
Analyses
We used a prey capture event, defined as one or more individu-als of a given prey species brought to the surface for handling and
Table 1Summary of sample sizes for each sea otter population
Region Population YearsKnown individuals Forage dives Male Female Subadult Adult
California San Nicolas 2003–2006 Yes 2702 5 8 2 11California Piedras Blancas 2001–2004 Yes 25 873 16 34 8 42California Big Sur 2008–2011 Yes 8079 6 31 6 30California Monterey 2000–2011 Yes 34 717 28 80 15 93Southeast Alaska Port Althorp 2011 No 1205 17 65 13 67Southeast Alaska Glacier Bay 2011 No 1886 19 103 39 96Aleutian Islands Adak Is 1995–2008 Yes 11 188 58 369 21 406Aleutian Islands Amchitka Is 1992–1994 Yes 10 389 46 175 33 165
Total 96 612 195 865 137 910
In southeast Alaska populations, the number of individuals was based on number of forage bouts, which were presumed to represent a single individual.
521
at University of C
alifornia, Los A
ngeles on August 12, 2015
http://beheco.oxfordjournals.org/D
ownloaded from

Behavioral Ecology
consumption after a feeding dive, as the basic statistical unit for our analyses. If multiple prey species were retrieved during the same dive, each species was analyzed independently. Although successive prey captures by one animal may not be completely independent events in terms of tool use, we observed that individuals did not use a tool after every successful dive in a continuous series, suggesting that a decision is made as to whether or not to use a tool on each prey item.
In order to explore the prevalence of tool-using individuals among populations, we compared the proportion of tagged indi-viduals observed using tools at least once in each population. We used bootstrap resampling to estimate proportion of individuals in southeast Alaskan populations to account for the lack of repeated samples per individual.
To determine how tool use varied across populations, we devel-oped a series of generalized linear mixed models (GLMMs) fitted by Laplace approximation to examine the relative contributions of potential explanatory factors to the probability of tool use occur-ring across populations. The occurrence of tool use on each dive was treated as a binomial response variable (1 = presence of tool use and 0 = absence of tool use). The fixed effects we considered for inclusion in the GLMMs were region, sex, age class, and prey type (Table 2). We also explored potential interactions between region and prey type; however, not all prey types could be included due to small sample size in some regions. We used a nested model structure to account for potential autocorrelation among dives, with forage bouts nested within population and population nested within region (the nesting terms were treated as random effects). To exam-ine the role of interindividual variation, we also included models with and without an otter ID as a random effect nested in popula-tion and region. For models with otter ID, southeast Alaska data were excluded because they lacked repeated samples for known individuals.
We used variance components analysis (calculated using reduced maximum likelihood) to determine which factors played the largest role in predicting tool use (Noh and Lee 2007). Each predictor variable was tested for significance using Wald’s test. Akaike information criteria (AIC) corrected for finite sample size (AICc) were compared to determine the best-supported model (Burnham and Anderson 1998). All data manipulations and sta-tistical analyses were completed using R.3.1.1 (R Core Team 2014).
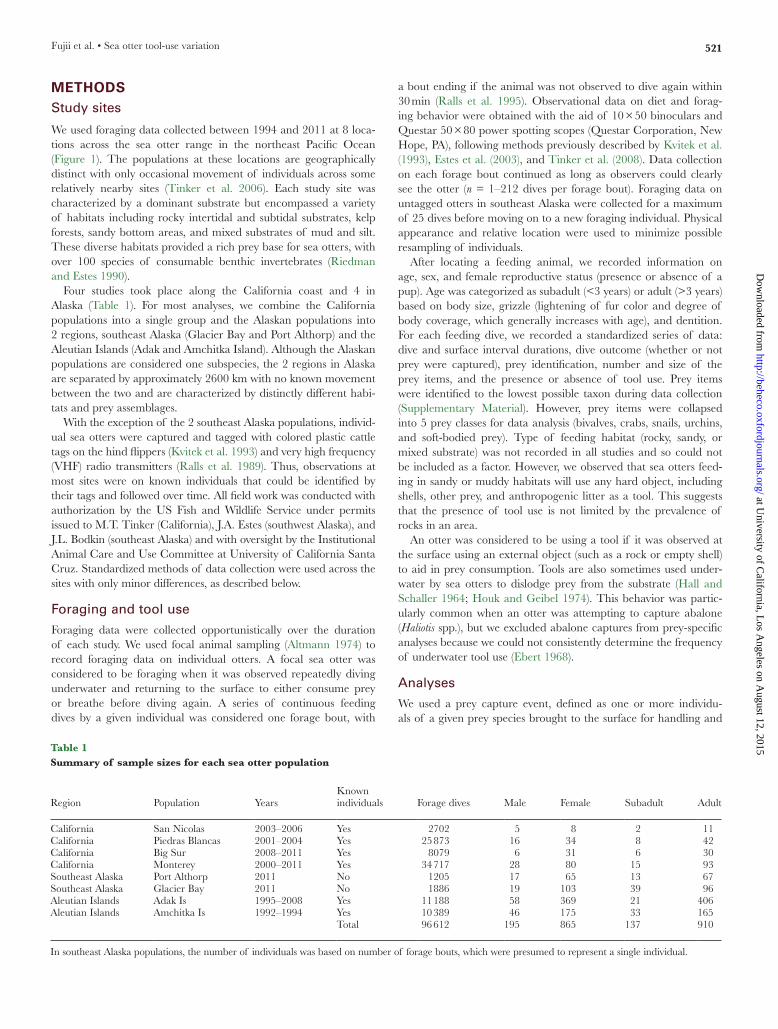
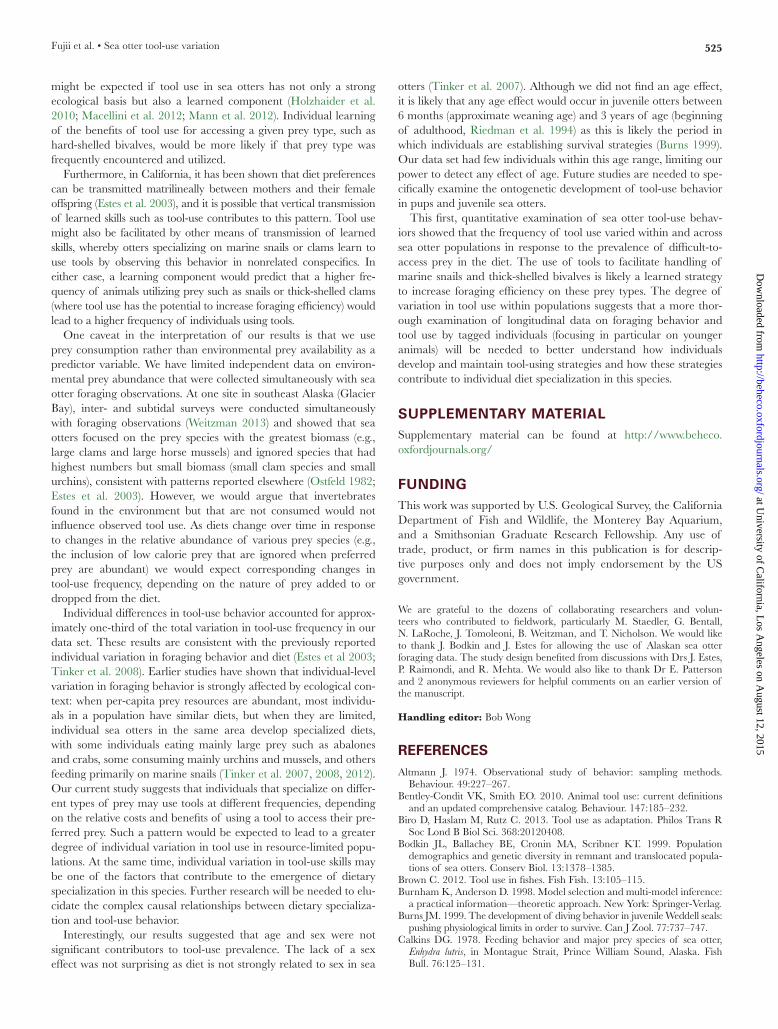
resultsA total of 6638 forage bouts and 96 612 dives were recorded for 1060 individuals over 17 years. The mean ± SE frequency of tool use varied across the 8 sea otter populations, ranging from 16.6 ± 0.2% of successful forage dives in Monterey to 0.28 ± 0.06% of forage dives in Amchitka (Figure 2a). The Aleutian Island popu-lations had the lowest frequency of tool use (0.28–1.45%) compared with southeast Alaska and California (9.8–16.5%). Within each region, the frequency of tool use did not vary significantly across populations. In each region, tool use was not universal among all individuals. In California, 65.8–92.8% of individuals used tools at least once compared with 10–20.5% in the Aleutian Islands and an estimated 26.3–29.9% in southeast Alaska (Figure 2b). These esti-mates of the proportion of individuals that used tools are underes-timates because we were unable to quantify underwater tool use.
The variance component analysis indicated that prey type and geographical region accounted for 45.39% and 18.04% of the total explained variation in tool use, respectively. In contrast, sex (0.73%) and age class (0.48%) explained little additional variation, leaving 35.37% of the total explained variation in tool use attributable to inter- and intraindividual variation. Age and sex parameters were subsequently dropped, and a model including population and prey type was determined to be the best fitting model for the complete data set (ΔAICc = 5.9, Table 3). Including individual ID (for the subset of data where this was possible) significantly improved the model fit (ΔAICc = 512.2, Table 3). Variation among individuals accounted for 23.85% of the explained variation, whereas intrain-dividual variation contributed about 15% of total variation.
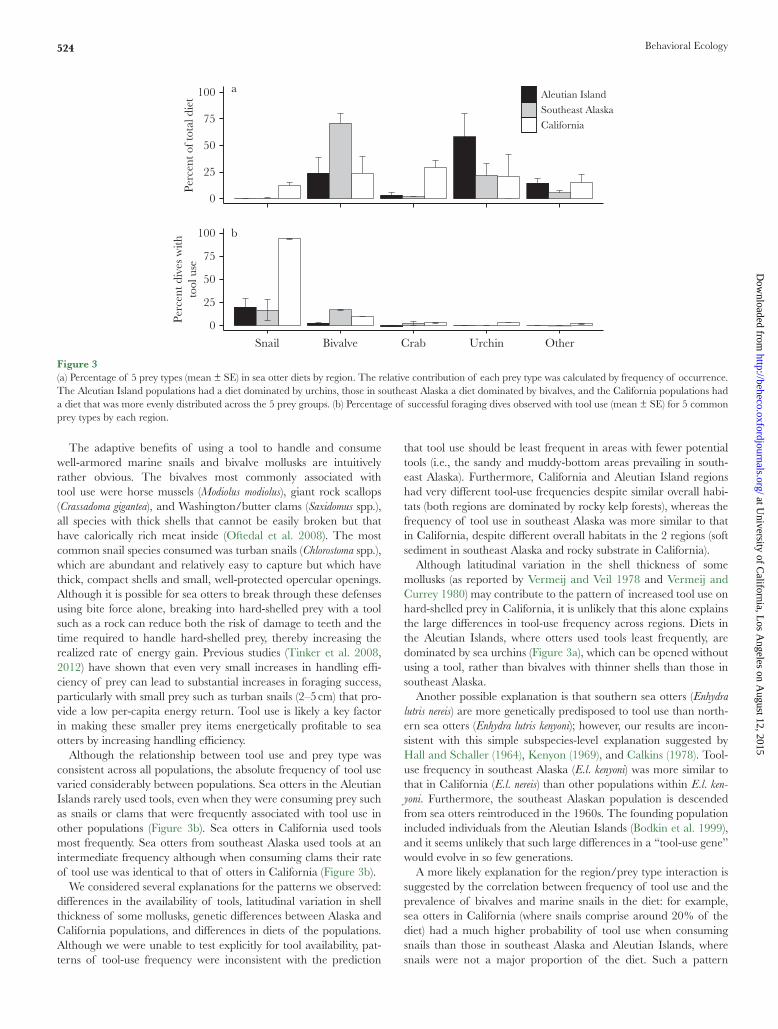
Marine snails and bivalves were most likely to be accessed with the aid of a tool across all populations. However, the probability of using a tool on a given prey type varied across regions (Figure 3b). In California, the probability of using a tool while consuming snails was 93.7 ± 0.32%. Although snails were still the prey type with the highest probability of tool use in the Aleutian Islands, the probability of tool use with snails was only 20 ± 9.1% (Figure 3b). Crabs and urchins were only occasionally associated with tool use in California and very rarely in both regions in Alaska. Adding an interaction between prey type and region improved our model fit (Table 3), with significant interactions found between all 3 regions when consuming bivalves (snails were excluded from our interac-tion models due to small sample size). In southeast Alaska, bivalves were the prey most likely to be consumed with tools (16.8 ± 0.9% of dives).
Overall diet composition varied substantially among Aleutian Islands, southeast Alaska, and California (Figure 3a). By frequency of occurrence, Californian populations had the highest percentage of marine snails in the diet (12.2 ± 2.6% of feeding dives), whereas the Aleutian Islands had the lowest (0.1 ± 0.07%). Sea urchins were most prevalent in the Aleutian diet (58.1 ± 21.9%), whereas southeast Alaskan populations had core diets composed mostly of bivalves (70.8 ± 9.4%).
dIscussIonOur results indicate that the probability of tool use in sea otters varies from dive to dive for a given individual, among individuals within a population, and between different populations. Patterns of variation in tool use can provide clues as to the proximate and ultimate mechanisms that underlie the observed behavior. As in some other tool-using species (Tebbich et al. 2002; van Schaik et al.
Table 2Best fit binomial GLMM showing the relationship between the odds of a tool being used during a dive and the geographical region and prey type captured
Factor Level β β SE OR P
Intercept −10.68 0.45 0.00002 0.0001Region Aleutian Is.a
Southeast Alaska 3.01 0.54 20.31 0.0001California 3.85 0.43 47.16 0.0001
Prey type Soft-bodied preya
Crab 0.87 0.15 2.38 0.0001Urchin 1.48 0.17 4.43 0.0001Bivalve 3.27 0.15 26.38 0.0001Snail 8.65 0.19 5735.40 0.0001
Forage bouts were nested within study populations, and populations were nested within geographical region. All nested terms were treated as random effects. OR, odds ratio.aReference term.
522
at University of C
alifornia, Los A
ngeles on August 12, 2015
http://beheco.oxfordjournals.org/D
ownloaded from
Fujii et al. • Sea otter tool-use variation
2003; Sargeant et al. 2007; Macellini et al. 2012; Rutz et al. 2012), not all individuals in our studies used tools; however, at least some individuals in every population used tools. Two types of tool-use behavior, which may represent the extremes of a continuum, have been described: stereotyped tool-use behavior that occurs in every individual of a species and appears to be genetically “hard-wired” to emerge in response to certain stimuli and flexible tool use that does not occur in every individual but appears to be learned and develops in some individuals in specific ecological contexts (Biro et al. 2013; Call 2013; Hunt et al. 2013). Tool use in sea otters falls toward the flexible end of this spectrum. If tool use was a fixed-behavioral response to the morphology of the prey item (i.e., shell armoring) captured during a given dive, we would expect individu-als in all regions to use tools with the same frequency on a given prey type.
Much like New Caledonian crows (Corvus moneduloides) and woodpecker finches (Camarhynchus pallidus), sea otters likely have a genetic predisposition to use tools (Tebbich et al. 2001; Kenward et al. 2005) but require the correct ecological context for this skill to become part of their regular foraging behavior. Captive sea otter pups have been observed to use tools without training or previous experience (Riedman and Estes 1990). In California, pups observed
in the wild played with objects such as empty shells, often pounding them on their chests, and first used a tool to open a prey item at about 14 weeks of age (Staedler 2011). Thus, although there does not appear to be a high cost for sea otters to learn to use tools, the benefit of doing so is likely only large enough under specific eco-logical conditions.
Much of the variation in the frequency of tool use was explained by a single ecological predictor: the type of prey being handled. Throughout their range, sea otters consume a wide array of inver-tebrate prey that encompass enormous taxonomic and morpho-logical diversity: soft-bodied taxa such as worms and cephalopod mollusks, prey with chitonous exoskeletons such as decapods, prey defended with spines such as urchins, and prey with thick, cal-cium carbonate shells such as gastropods and bivalve mollusks. We found that tool use was overwhelmingly associated with han-dling and consuming prey with thick, calcium carbonate shells and was very rarely associated with the other classes of prey. Although there were also differences in tool-use frequency between individu-als and among populations, the association of tool use with marine snails and bivalve mollusks was evident across all populations and explained the largest component (45%) of variation in tool-use frequency.
a
0
5
10
15
Perc
ent s
ucce
ssfu
ldi
ves
with
tool
use
b
0
25
50
75
AmchitkaIs.
AdakIs.
GlacierBay
PortAlthorp
Monterey BigSur
PiedrasBlancas
SanNicolas
Is.
Perc
ent i
ndiv
idua
lsus
ing
tool
s
Aleutian Island
Southeast Alaska
California
Figure 2(a) Observed frequency of tool use (mean ± SE) across 8 study populations. Populations are in order along the coastline from north to south. (b) Percentage of tagged individuals observed to use tools at least once across 8 populations. Estimates were used for populations without known individuals.
Table 3Summary of GLMMs examined
Fixed effects Random effects AICc ΔAICc χ2
GLMM of main effects Region + prey + age + sex Region/population/bout 14832.7 5.9 Region + prey Region/population/bout 14826.8 0 9.8Individual effect between California and Aleutian Island regionsa
Region + prey + age + sex Region/population/bout 13772.4 512.2 Region + prey + age + sex Region/population/otter/bout 13260.2 0 514.1Interaction effect between prey type and geographic regionb
Prey + region Region/population/bout 12345.2 7.4 Prey × region Region/population/bout 12337.8 0 19.3
aSoutheast Alaska region was excluded due to lack of repeated samples among individuals.bDue to small sample size, we removed snails to explore interaction models.
523
at University of C
alifornia, Los A
ngeles on August 12, 2015
http://beheco.oxfordjournals.org/D
ownloaded from
Behavioral Ecology
The adaptive benefits of using a tool to handle and consume well-armored marine snails and bivalve mollusks are intuitively rather obvious. The bivalves most commonly associated with tool use were horse mussels (Modiolus modiolus), giant rock scallops (Crassadoma gigantea), and Washington/butter clams (Saxidomus spp.), all species with thick shells that cannot be easily broken but that have calorically rich meat inside (Oftedal et al. 2008). The most common snail species consumed was turban snails (Chlorostoma spp.), which are abundant and relatively easy to capture but which have thick, compact shells and small, well-protected opercular openings. Although it is possible for sea otters to break through these defenses using bite force alone, breaking into hard-shelled prey with a tool such as a rock can reduce both the risk of damage to teeth and the time required to handle hard-shelled prey, thereby increasing the realized rate of energy gain. Previous studies (Tinker et al. 2008, 2012) have shown that even very small increases in handling effi-ciency of prey can lead to substantial increases in foraging success, particularly with small prey such as turban snails (2–5 cm) that pro-vide a low per-capita energy return. Tool use is likely a key factor in making these smaller prey items energetically profitable to sea otters by increasing handling efficiency.
Although the relationship between tool use and prey type was consistent across all populations, the absolute frequency of tool use varied considerably between populations. Sea otters in the Aleutian Islands rarely used tools, even when they were consuming prey such as snails or clams that were frequently associated with tool use in other populations (Figure 3b). Sea otters in California used tools most frequently. Sea otters from southeast Alaska used tools at an intermediate frequency although when consuming clams their rate of tool use was identical to that of otters in California (Figure 3b).
We considered several explanations for the patterns we observed: differences in the availability of tools, latitudinal variation in shell thickness of some mollusks, genetic differences between Alaska and California populations, and differences in diets of the populations. Although we were unable to test explicitly for tool availability, pat-terns of tool-use frequency were inconsistent with the prediction
that tool use should be least frequent in areas with fewer potential tools (i.e., the sandy and muddy-bottom areas prevailing in south-east Alaska). Furthermore, California and Aleutian Island regions had very different tool-use frequencies despite similar overall habi-tats (both regions are dominated by rocky kelp forests), whereas the frequency of tool use in southeast Alaska was more similar to that in California, despite different overall habitats in the 2 regions (soft sediment in southeast Alaska and rocky substrate in California).
Although latitudinal variation in the shell thickness of some mollusks (as reported by Vermeij and Veil 1978 and Vermeij and Currey 1980) may contribute to the pattern of increased tool use on hard-shelled prey in California, it is unlikely that this alone explains the large differences in tool-use frequency across regions. Diets in the Aleutian Islands, where otters used tools least frequently, are dominated by sea urchins (Figure 3a), which can be opened without using a tool, rather than bivalves with thinner shells than those in southeast Alaska.
Another possible explanation is that southern sea otters (Enhydra lutris nereis) are more genetically predisposed to tool use than north-ern sea otters (Enhydra lutris kenyoni); however, our results are incon-sistent with this simple subspecies-level explanation suggested by Hall and Schaller (1964), Kenyon (1969), and Calkins (1978). Tool-use frequency in southeast Alaska (E.l. kenyoni) was more similar to that in California (E.l. nereis) than other populations within E.l. ken-yoni. Furthermore, the southeast Alaskan population is descended from sea otters reintroduced in the 1960s. The founding population included individuals from the Aleutian Islands (Bodkin et al. 1999), and it seems unlikely that such large differences in a “tool-use gene” would evolve in so few generations.
A more likely explanation for the region/prey type interaction is suggested by the correlation between frequency of tool use and the prevalence of bivalves and marine snails in the diet: for example, sea otters in California (where snails comprise around 20% of the diet) had a much higher probability of tool use when consuming snails than those in southeast Alaska and Aleutian Islands, where snails were not a major proportion of the diet. Such a pattern
a
0
25
50
75
100
Perc
ent o
f tot
al d
iet Aleutian Island
Southeast AlaskaCalifornia
b
0
25
50
75
100
Snail Bivalve Crab Urchin Other
Perc
ent d
ives
with
tool
use
Figure 3(a) Percentage of 5 prey types (mean ± SE) in sea otter diets by region. The relative contribution of each prey type was calculated by frequency of occurrence. The Aleutian Island populations had a diet dominated by urchins, those in southeast Alaska a diet dominated by bivalves, and the California populations had a diet that was more evenly distributed across the 5 prey groups. (b) Percentage of successful foraging dives observed with tool use (mean ± SE) for 5 common prey types by each region.
524
at University of C
alifornia, Los A
ngeles on August 12, 2015
http://beheco.oxfordjournals.org/D
ownloaded from
Fujii et al. • Sea otter tool-use variation
might be expected if tool use in sea otters has not only a strong ecological basis but also a learned component (Holzhaider et al. 2010; Macellini et al. 2012; Mann et al. 2012). Individual learning of the benefits of tool use for accessing a given prey type, such as hard-shelled bivalves, would be more likely if that prey type was frequently encountered and utilized.
Furthermore, in California, it has been shown that diet preferences can be transmitted matrilineally between mothers and their female offspring (Estes et al. 2003), and it is possible that vertical transmission of learned skills such as tool-use contributes to this pattern. Tool use might also be facilitated by other means of transmission of learned skills, whereby otters specializing on marine snails or clams learn to use tools by observing this behavior in nonrelated conspecifics. In either case, a learning component would predict that a higher fre-quency of animals utilizing prey such as snails or thick-shelled clams (where tool use has the potential to increase foraging efficiency) would lead to a higher frequency of individuals using tools.
One caveat in the interpretation of our results is that we use prey consumption rather than environmental prey availability as a predictor variable. We have limited independent data on environ-mental prey abundance that were collected simultaneously with sea otter foraging observations. At one site in southeast Alaska (Glacier Bay), inter- and subtidal surveys were conducted simultaneously with foraging observations (Weitzman 2013) and showed that sea otters focused on the prey species with the greatest biomass (e.g., large clams and large horse mussels) and ignored species that had highest numbers but small biomass (small clam species and small urchins), consistent with patterns reported elsewhere (Ostfeld 1982; Estes et al. 2003). However, we would argue that invertebrates found in the environment but that are not consumed would not influence observed tool use. As diets change over time in response to changes in the relative abundance of various prey species (e.g., the inclusion of low calorie prey that are ignored when preferred prey are abundant) we would expect corresponding changes in tool-use frequency, depending on the nature of prey added to or dropped from the diet.
Individual differences in tool-use behavior accounted for approx-imately one-third of the total variation in tool-use frequency in our data set. These results are consistent with the previously reported individual variation in foraging behavior and diet (Estes et al 2003; Tinker et al. 2008). Earlier studies have shown that individual-level variation in foraging behavior is strongly affected by ecological con-text: when per-capita prey resources are abundant, most individu-als in a population have similar diets, but when they are limited, individual sea otters in the same area develop specialized diets, with some individuals eating mainly large prey such as abalones and crabs, some consuming mainly urchins and mussels, and others feeding primarily on marine snails (Tinker et al. 2007, 2008, 2012). Our current study suggests that individuals that specialize on differ-ent types of prey may use tools at different frequencies, depending on the relative costs and benefits of using a tool to access their pre-ferred prey. Such a pattern would be expected to lead to a greater degree of individual variation in tool use in resource-limited popu-lations. At the same time, individual variation in tool-use skills may be one of the factors that contribute to the emergence of dietary specialization in this species. Further research will be needed to elu-cidate the complex causal relationships between dietary specializa-tion and tool-use behavior.
Interestingly, our results suggested that age and sex were not significant contributors to tool-use prevalence. The lack of a sex effect was not surprising as diet is not strongly related to sex in sea
otters (Tinker et al. 2007). Although we did not find an age effect, it is likely that any age effect would occur in juvenile otters between 6 months (approximate weaning age) and 3 years of age (beginning of adulthood, Riedman et al. 1994) as this is likely the period in which individuals are establishing survival strategies (Burns 1999). Our data set had few individuals within this age range, limiting our power to detect any effect of age. Future studies are needed to spe-cifically examine the ontogenetic development of tool-use behavior in pups and juvenile sea otters.
This first, quantitative examination of sea otter tool-use behav-iors showed that the frequency of tool use varied within and across sea otter populations in response to the prevalence of difficult-to-access prey in the diet. The use of tools to facilitate handling of marine snails and thick-shelled bivalves is likely a learned strategy to increase foraging efficiency on these prey types. The degree of variation in tool use within populations suggests that a more thor-ough examination of longitudinal data on foraging behavior and tool use by tagged individuals (focusing in particular on younger animals) will be needed to better understand how individuals develop and maintain tool-using strategies and how these strategies contribute to individual diet specialization in this species.
suppleMentary MaterIalSupplementary material can be found at http://www.beheco.oxfordjournals.org/
FundIngThis work was supported by U.S. Geological Survey, the California Department of Fish and Wildlife, the Monterey Bay Aquarium, and a Smithsonian Graduate Research Fellowship. Any use of trade, product, or firm names in this publication is for descrip-tive purposes only and does not imply endorsement by the US government.
We are grateful to the dozens of collaborating researchers and volun-teers who contributed to fieldwork, particularly M. Staedler, G. Bentall, N. LaRoche, J. Tomoleoni, B. Weitzman, and T. Nicholson. We would like to thank J. Bodkin and J. Estes for allowing the use of Alaskan sea otter foraging data. The study design benefited from discussions with Drs J. Estes, P. Raimondi, and R. Mehta. We would also like to thank Dr E. Patterson and 2 anonymous reviewers for helpful comments on an earlier version of the manuscript.
Handling editor: Bob Wong
reFerencesAltmann J. 1974. Observational study of behavior: sampling methods.
Behaviour. 49:227–267.Bentley-Condit VK, Smith EO. 2010. Animal tool use: current definitions
and an updated comprehensive catalog. Behaviour. 147:185–232.Biro D, Haslam M, Rutz C. 2013. Tool use as adaptation. Philos Trans R
Soc Lond B Biol Sci. 368:20120408.Bodkin JL, Ballachey BE, Cronin MA, Scribner KT. 1999. Population
demographics and genetic diversity in remnant and translocated popula-tions of sea otters. Conserv Biol. 13:1378–1385.
Brown C. 2012. Tool use in fishes. Fish Fish. 13:105–115.Burnham K, Anderson D. 1998. Model selection and multi-model inference:
a practical information—theoretic approach. New York: Springer-Verlag.Burns JM. 1999. The development of diving behavior in juvenile Weddell seals:
pushing physiological limits in order to survive. Can J Zool. 77:737–747.Calkins DG. 1978. Feeding behavior and major prey species of sea otter,
Enhydra lutris, in Montague Strait, Prince William Sound, Alaska. Fish Bull. 76:125–131.
525
at University of C
alifornia, Los A
ngeles on August 12, 2015
http://beheco.oxfordjournals.org/D
ownloaded from
Behavioral Ecology
Call J. 2013. Three ingredients for becoming a creative tool user. In: Sanz C, Call J, Boesch J, editors. Tool use in animals: cognition and ecology. New York: Cambridge University Press. p. 3–20.
Collins DA, McGrew WC. 1987. Termite fauna related to differences in tool-use between groups of chimpanzees (Pan troglodytes). Primates. 28:457–471.
Ebert EE. 1968. A food habits study of southern sea otter Enhydra lutris nereis. Calif Fish Game. 54:33–35.
Estes JA, Riedman ML, Staedler MM, Tinker MT, Lyon BE. 2003. Individual variation in prey selection by sea otters: patterns, causes and implications. J Anim Ecol. 72:144–155.
Fisher EM. 1939. Habits of the southern sea otter. J Mammal. 20:21–36.Fox EA, van Schaik CP, Sitompul A, Wright DN. 2004. Intra-and interpop-
ulational differences in orangutan (Pongo pygmaeus) activity and diet: impli-cations for the invention of tool use. Am J Phys Anthropol. 125:162–174.
Hall KRL, Schaller GB. 1964. Tool-using behavior of the California sea otter. J Mammal. 45:287–298.
Holzhaider JC, Hunt GR, Gray RD. 2010. Social learning in New Caledonian crows. Learn Behav. 38:206–219.
Houk JL, Geibel JJ. 1974. Observation of underwater tool use in sea otter, Enhydra lutris linnaeus. Calif Fish Game. 60:207–208.
Humle T, Matsuzawa T. 2002. Ant-dipping among the chimpanzees of Bossou, Guinea, and some comparisons with other sites. Am J Primatol. 58:133–148.
Hunt GR, Gray RD, Taylor AH. 2013. Why is tool use rare in animals? In: Sanz C, Call J, Boesch C, editors. Tool use in animals: cognition and ecology. Cambridge (UK): Cambridge University Press. p. 89–118.
Kenward B, Weir AAS, Rutz C, Kacelnik A. 2005. Tool manufacture by naive juvenile crows. Nature. 433:121.
Kenyon KW. 1969. The sea otter Enhydra-lutris in the Eastern Pacific ocean. North Am Fauna. 68:1–352.
Koops K, McGrew WC, Matsuzawa T. 2013. Ecology of culture: do envi-ronmental factors influence foraging tool use in wild chimpanzees, Pan troglodytes verus? Anim Behav. 85:175–185.
Kvitek RG, Bowlby CE, Staedler M. 1993. Diet and foraging behaviors of sea otters in southeast Alaska. Mar Mamm Sci. 9:168–181.
Langergraber KE, Boesch C, Inoue E, Inoue-Murayama M, Mitani JC, Nishida T, Pusey A, Reynolds V, Schubert G, Wrangham RW, et al. 2011. Genetic and ‘cultural’ similarity in wild chimpanzees. Proc R Soc B Biol Sci. 278:408–416.
Lycett SJ, Collard M, McGrew WC. 2010. Are behavioral differences among wild chimpanzee communities genetic or cultural? An assessment using tool-use data and phylogenetic methods. Am J Phys Anthropol. 142:461–467.
Macellini S, Maranesi M, Bonini L, Simone L, Rozzi S, Ferrari PF, Fogassi L. 2012. Individual and social learning processes involved in the acqui-sition and generalization of tool use in macaques. Philos Trans R Soc Lond B Biol Sci. 367:24–36.
Mann J, Sargeant BL, Watson-Capps JJ, Gibson QA, Heithaus MR, Connor RC, Patterson E. 2008. Why do dolphins carry sponges? PLoS One. 3:7.
Mann J, Stanton MA, Patterson EM, Bienenstock EJ, Singh LO. 2012. Social networks reveal cultural behaviour in tool-using dolphins. Nat Commun. 3:7.
McGrew WC, Ham RM, White LJT, Tutin CEG, Fernandez M. 1997. Why don’t chimpanzees in Gabon crack nuts? Int J Primatol. 18:353–374.
Nishida T, Hiraiwa M. 1982. Natural-history of a tool-using behavior by wild chimpanzees in feeding upon wood-boring ants. J Hum Evol. 11:73–99.
Noh M, Lee Y. 2007. REML estimation for binary data in GLMMs. J Multivariate Anal. 98:896–915.
Oftedal O, Ralls K, Tinker MT, Green A. 2008. Nutritional constraints of the southern sea otter in the Monterey Bay National Marine Sanctuary and a comparison to sea otter populations at San Nicolas Island, California and Glacier Bay, Alaska. Joint Final Report to the Monterey Bay National Marine Sanctuary and the Marine Mammal Commission. Monterey (CA): Monterey Bay National Marine Sanctuary.
Orenstein RI. 1972. Tool-use by New Caledonian crow (Corvus-moneduloides). Auk. 89:674–680.
Ostfeld RS. 1982. Foraging strategies and prey switching in the California sea otter. Oecologia. 53:170–178.
Patterson EM, Mann J. 2011. The ecological conditions that favor tool use and innovation in wild bottlenose dolphins (Tursiops sp.). PLoS One. 6:e22243.
Pierce JD. 1986. A review of tool use in insects. Fla Entomol. 69:95–104.R Core Team. 2014. R: a language and environment for statistical comput-
ing. Vienna (Austria): R Foundation for Statistical Computing.
Ralls K, Hatfield B, Siniff DB. 1995. Foraging patterns of California sea otters as indicated by telemetry. Can J Zool. 73:523–531.
Ralls K, Williams TM, Siniff DB, Kuechle VB. 1989. An intraperitoneal radio transmitter for sea otters. Mar Mamm Sci. 5:376–381.
Riedman ML, Estes JA. 1990. The sea otter (Enhydra lutris): behavior, ecol-ogy, and natural history. Biological report 90 (14). Washington, DC: US Fish and Wildlife Service. p. 1–126.
Riedman ML, Estes JA, Staedler MM, Giles AA, Carlson DR. 1994. Breeding patterns and reproductive success of California sea otters. J Wildl Manage. 58:391–399.
Rutz C, Ryder TB, Fleischer RC. 2012. Restricted gene flow and fine-scale population structuring in tool using New Caledonian crows. Naturwissenschaften. 99:313–320.
Rutz C, St Clair JJ. 2012. The evolutionary origins and ecological context of tool use in New Caledonian crows. Behav Process. 89:153–165.
Sanz C, Deblauwe I, Tagg N, Morgan D. 2012. Insect prey characteristics affecting regional variation in chimpanzee tool use. Am J Phys Anthropol. 147:258–259.
Sanz CM, Morgan DB. 2013. Ecological and social correlates of chimpan-zee tool use. Philos Trans R Soc B Biol Sci. 368:20120416.
Sargeant BL, Wirsing AJ, Heithaus MR, Mann J. 2007. Can environmental heterogeneity explain individual foraging variation in wild bottlenose dol-phins (Tursiops sp.)? Behav Ecol Sociobiol. 61:679–688.
van Schaik CP, Fox EA, Fechtman LT. 2003. Individual variation in the rate of use of tree-hole tools among wild orang-utans: implications for hom-inin evolution. J Hum Evol. 44:11–23.
Scribner KT, Bodkin JL, Ballachey BE. 1997. Population genetic studies of the sea otter (Enhydra lutris): a review and interpretation of available data. In: Dizon AE, Chivers SJ, Perrin WF, editors. Molecular genetics of marine mammals. Lawrence (KS): Society for Marine Mammalogy. p. 197–208.
Shumaker R, Walkup K, Beck B. 2011. Animal tool behavior: the use and manufacture of tools by animals. Baltimore (MD): John Hopkins University Press.
Smolker R, Richards A, Connor R, Mann J, Berggren P. 1997. Sponge carrying by dolphins (Delphinidae, Tursiops sp.): a foraging specialization involving tool use? Ethology. 103:454–465.
Spagnoletti N, Visalberghi E, Verderane MP, Ottoni E, Izar P, Fragaszy D. 2012. Stone tool use in wild bearded capuchin monkeys, Cebus libidinosus. Is it a strategy to overcome food scarcity? Anim Behav. 83:1285–1294.
Staedler M. 2011. Maternal care and provisioning in the southern sea otter (Enhydra lutris nereis): reproductive consequences of diet specialization in an apex predator [Master’s thesis]. [Santa Cruz (CA)]: University of California Santa Cruz.
Tebbich S, Taborsky M, Fessl B, Blomqvist D. 2001. Do woodpecker finches acquire tool-use by social learning? Proc R Soc Lond B Biol Sci. 268:2189–2193.
Tebbich S, Taborsky M, Fessl B, Dvorak M. 2002. The ecology of tool-use in the woodpecker finch (Cactospiza pallida). Ecol Lett. 5:656–664.
Tinker MT, Bentall G, Estes JA. 2008. Food limitation leads to behavioral diversification and dietary specialization in sea otters. Proc Natl Acad Sci USA. 105:560–565.
Tinker MT, Costa DP, Estes JA, Wieringa N. 2007. Individual dietary spe-cialization and dive behavior in the California sea otter: using archival time-depth data to detect alternative foraging strategies. Deep Sea Res II. 54:330–342.
Tinker MT, Doak DF, Estes JA, Hatfield BB, Staedler MM, Bodkin JL. 2006. Incorporating diverse data and realistic complexity into demo-graphic estimation procedures for sea otters. Ecol Appl. 16:2293–2312.
Tinker MT, Guimarães PR Jr, Novak M, Marquitti FM, Bodkin JL, Staedler M, Bentall G, Estes JA. 2012. Structure and mechanism of diet specialisation: testing models of individual variation in resource use with sea otters. Ecol Lett. 15:475–483.
Vermeij GJ, Currey JD. 1980. Geographical variation in the strength of Thaidid snail shells. Biol Bull. 158:383–389.
Vermeij GJ, Veil JA. 1978. Latitudinal pattern in bivalve shell gaping. Malacologia. 17:57–61.
Weitzman BP. 2013. Effects of sea otter colonization on soft-sediment inter-tidal prey assemblages in Glacier Bay, Alaska [Master’s thesis]. [Santa Cruz (CA)]: University of California Santa Cruz.
Whiten A, Goodall J, McGrew WC, Nishida T, Reynolds V, Sugiyama Y, Tutin CE, Wrangham RW, Boesch C. 1999. Cultures in chimpanzees. Nature. 399:682–685.
Wilson DE, Bogen MA, Brownell RL, Burdin AM, Maninov ML. 1991. Geographic variation in sea otters, Enhydra lutris. J Mammal. 72:22–36.
526
at University of C
alifornia, Los A
ngeles on August 12, 2015
http://beheco.oxfordjournals.org/D
ownloaded from