treball final de grau - diposit.ub.edudiposit.ub.edu/dspace/bitstream/2445/60449/1/tfg_eq... ·...
TRANSCRIPT
Treball Final de Grau
Tutor/s
Dr. Joan Dosta Parras Departament d’Enginyeria Química
Dr. César Alberto Valderrama Angel Departament d’Enginyeria Química UPC
Phosphorus recovery as hydroxyapatite (HAP) from urban wastewaters using nanofiltration and reverse osmosis brines.
Recuperació del fòsfor en forma d’hidroxiapatita (HAP) de les aigües residuals municipals fent servir salmorres procedents de nanofiltració i osmosi inversa.
Gádor Indra Hidalgo López June 2014


Aquesta obra està subjecta a la llicència de: Reconeixement–NoComercial-SenseObraDerivada
http://creativecommons.org/licenses/by-nc-nd/3.0/es/

Primer de tot voldria agrair al meu tutor, el Dr. Joan Dosta Parras per donar-me la
possibilitat de realitzar aquest Treball Final de Grau sobre aquest tema d’investigació pioner,
així com per la seva tutoria, ja que ha estat per a mi un veritable mentor i model a seguir.
Tanmateix voldria agrair al Dr. José Luis Cortina Pallás i al Dr. César Alberto Valderrama Angel,
del departament d’Enginyeria Química de la UPC haver-me permès formar part del seu equip
de recerca i dotar-me de medis i material per poder dur a terme aquesta investigació.
Voldria agrair al Dr. Joan Mata Álvarez per haver-me no només introduït sinó despertat un
gran interès pel món del medi ambient i a tot el departament d’Enginyeria Química de la UB per
la seva tasca de formació en l’àmbit de l’Enginyeria Química, sense els quals no podria haver
realitzat aquest treball. Al meu tutor de grau Dr. Claudi Mans Teixidor, per la seva tasca durant
aquests quatre anys. Per acabar, voldria agrair a la persona que em va introduir al món de la
Química, transmetent els seus coneixements i la passió per aquesta ciència, Marta Segura i
Fàbregas, gràcies. Per últim, agrair als familiars i amics pel seu recolzament, empatia i afecte.


REPORT

Phosphorus recovery as hydroxyapatite (HAP) from urban wastewaters using nanofiltration and reverse osmosis brines 1
CONTENTS
1. SUMMARY 3
2. RESUM 5
3. INTRODUCTION 7
3.1. Phosphorus, a key element 7
3.1.1. Natural sources 8
3.1.2. Applications 8
3.1.3. Wastewaters and the problem of eutrophication 9
3.2. Phosphorus removal from wastewaters 10
3.2.1. Chemical precipitation 11
3.2.1.1. Magnesium phosphates. Struvite 12
3.2.1.2. Calcium phosphates. Hydroxyapatite 12
3.2.1.3. HAP Precipitation mechanism 13
4. JUSTIFICATION AND OBJECTIVES 14
5. MATERIALS AND METHODS 15
5.1. Experimental set up 15
5.2. Synthetic wastewater and brines 16
5.3. Experimental procedure 17
5.4. Analytical methods 18
5.4.1. UV spectrophotometry 19
5.4.2. Ion-exchange chromatography 20
5.5. Solid characterisation methods 22
6. RESULTS AND DISCUSSION 24
6.1. Phosphate precipitation using nanofiltration and reverse osmosis brines 24
6.1.1. Experiment 1. Nanofiltration brine (with Mg2+) at pH=10.5 25
2 Hidalgo López, Gádor Indra
6.1.2. Experiment 2. Nanofiltration brine at pH=10.5 28
6.1.3. Experiment 3. Reverse osmosis brine at pH=10.5 31
6.1.4. Experiment 4. Reverse osmosis brine (with Mg2+) at pH=10.5 32
6.1.5. Experiment 5. Nanofiltration brine (with Mg2+) at pH=12 34
6.1.6. Experiment 6. Nanofiltration brine at pH=12 35
6.1.7. Experiment 7. Reverse osmosis brine at pH=12 37
6.1.8. Experiment 8. Reverse osmosis brine (with Mg2+) at pH=12 38
6.2. Solid characterisation of the obtained precipitate 38
6.2.1. XRD 38
6.2.2. FTIR 40
6.2.3. SEM 42
6.3. Comparative study of the results obtained 45
6.3.1. Effect of Mg2+ 45
6.3.1.1. On the phosphate removal 46
6.3.1.2. On the solid obtained 47
6.3.2. Effect of pH 48
6.3.2.1. On the phosphate removal 48
6.3.2.2. On the solid obtained 48
6.3.3. Effect of the type of brine 50
7. CONCLUSIONS AND RECOMMENDATIONS 53
8. REFERENCES AND NOTES 55
9. ACRONYMS 57
APPENDICES 59
APPENDIX 1: PREPARATION OF SOLUTIONS 61
APPENDIX 2: ANALYTICAL METHODS 63
APPENDIX 3: SOLID CHARACTERISATION 65
Phosphorus recovery as hydroxyapatite (HAP) from urban wastewaters using nanofiltration and reverse osmosis brines 3
1. SUMMARY
The recovery of phosphorus from wastewater appears to be the best option to ensure the
recyclability of this product and save the fertiliser industry from losing its key element. Chemical
precipitation is an effective method to obtain calcium phosphate in the form of hydroxyapatite
(HAP), which can be applied to the soil as a fertiliser. In a Waste Water Treatment Plant
(WWTP), the liquid effluent from the secondary clarifier is rich in phosphorus. This effluent can
be introduced in an ion exchange unit that, when being regenerated, produces a solution with a
concentration up to 1,000 mg PO43-/L. This stream can undergo chemical precipitation thanks to
the addition of calcium ions with alkaline media. Concentrate or reject stream obtained from
nanofiltration (NF) or reverse osmosis (RO) processes can be used as a source of calcium,
valorising both wastewater and brines.
A laboratory scale study is conducted using a semi continuous stirred batch reactor to
precipitate phosphate of a solution that simulates the regenerated stream in the ion-exchange
unit of a WWTP, using nanofiltration and reverse osmosis brines with and without Mg2+ at
different pH. Results indicate that the presence of Mg2+ enhances phosphate removal, but does
not stimulate HAP formation. The conditions that achieve higher phosphate removal are the NF
and RO brines with Mg2+ at pH=10.5, representing almost a 100 % of removal. In all four types
of brines, higher removal is obtained at pH=10.5. The type of brine does not have as much
effect as other factors such as the presence of Mg2+ or pH. In less time, NF brine removes the
same amount of phosphate from the solution than RO brine when there is Mg2+.
Hydroxyapatite has been found at the two studied pH using both nanofiltration and reverse
osmosis brines without magnesium. It has also been found crystalline halite in these same
situations where HAP has been found. At pH=12, using reverse osmosis reject with Mg2+ only
crystalline halite has been found.

Phosphorus recovery as hydroxyapatite (HAP) from urban wastewaters using nanofiltration and reverse osmosis brines 5
2. RESUM
La recuperació del fòsfor de les aigües residuals es posiciona com la millor opció per
assegurar la reutilització d'aquest producte i salvar la indústria dels fertilitzants de la pèrdua del
seu element clau. La precipitació química és un mètode eficaç per obtenir fosfat de calci en
forma d'hidroxiapatita (HAP), que es pot aplicar al sòl com a fertilitzant. En una Estació
Depuradora d’Aigües Residuals (EDAR), l’efluent líquid procedent del sedimentador secundari
és ric en fòsfor. Aquest efluent pot ser introduït a una unitat d’intercanvi iònic que, en ser
regenerat, produeix una solució amb una concentració de fins a 1000 mg PO43-/L. Aquest
corrent pot sotmetre’s a una precipitació química gràcies a l’addició de ions calci en medi bàsic.
La corrent concentrada procedent de processos de nanofiltració (NF) o d’osmosi inversa (OI) es
pot utilitzar com una font de calci, valoritzant alhora les aigües residuals i les salmorres.
S’ha dut a terme un estudi a escala de laboratori fent servir un reactor tanc agitat semi
continu per precipitar el fosfat d’una solució que simula la corrent regenerada en la unitat
d’intercanvi iònic d’una EDAR, fent servir salmorres sintètiques amb o sense presència de Mg2+
a diferent pH. Els resultats indiquen que la presència de Mg2+ millora l'eliminació de fosfat, però
no promou la formació de HAP. Les condicions que ens permeten obtenir més eliminació del
fosfat són les salmorres de NF i OI amb Mg2+ a pH=10,5, representant gairebé un 100% de
eliminació. En els quatre tipus de salmorra, s’ha obtingut una eliminació més alta a pH=10,5. El
tipus de salmorra no té un efecte tan pronunciat com altres factors com la presencia de Mg2+ o
el pH. En un menor temps, la salmorra procedent de NF elimina la mateixa quantitat de fosfat
de la solució que la procedent de OI quan hi ha Mg2+.
S’ha trobat hidroxiapatita cristal·lina en els dos pHs estudiats utilitzant les salmorres sense
magnesi tant de nanofiltració com d'osmosi inversa. També s’ha trobat halita cristal·lina en
aquests casos on s’hi ha trobat HAP. A pH=12, usant el concentrat de osmosi inversa amb
Mg2+ només s’ha trobat halita cristal·lina.

Phosphorus recovery as hydroxyapatite (HAP) from urban wastewaters using nanofiltration and reverse osmosis brines 7
3. INTRODUCTION
At this stage phosphorus will be introduced as a chemical element and as an important
substance present in nature and its multiple applications. Its effect will be discussed when the
natural equilibrium is altered, such as the problem of eutrophication and its ecological impact
and the effects on the population. Phosphate recovery from wastewater appears to be the best
option to ensure the recyclability of this product and save the fertiliser industry from losing its
source compound. Chemical precipitation is an effective method of obtaining calcium phosphate
in a form which can be applied to the soil as a fertiliser.
3.1. PHOSPHORUS, A KEY ELEMENT
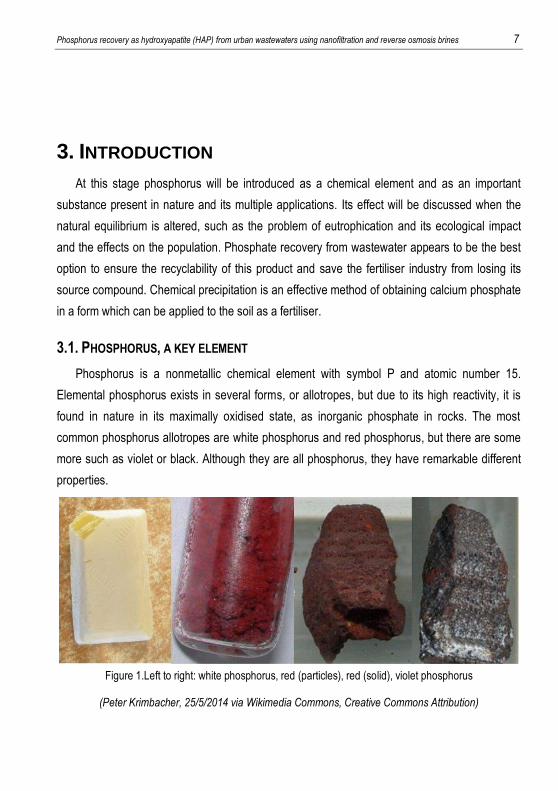
Phosphorus is a nonmetallic chemical element with symbol P and atomic number 15.
Elemental phosphorus exists in several forms, or allotropes, but due to its high reactivity, it is
found in nature in its maximally oxidised state, as inorganic phosphate in rocks. The most
common phosphorus allotropes are white phosphorus and red phosphorus, but there are some
more such as violet or black. Although they are all phosphorus, they have remarkable different
properties.
Figure 1.Left to right: white phosphorus, red (particles), red (solid), violet phosphorus
(Peter Krimbacher, 25/5/2014 via Wikimedia Commons, Creative Commons Attribution)
8 Hidalgo López, Gádor Indra
Phosphorus is a rare element in the lithosphere, composing a 0.1% of the total elemental
composition, with an average concentration of 1180 ppm (Fairbridge, 1972; Taylor, 1964).
It is an indispensable element for the normal biological functioning of living beings, as it is
necessary for a wide range of cellular functions.
3.1.1. Natural sources
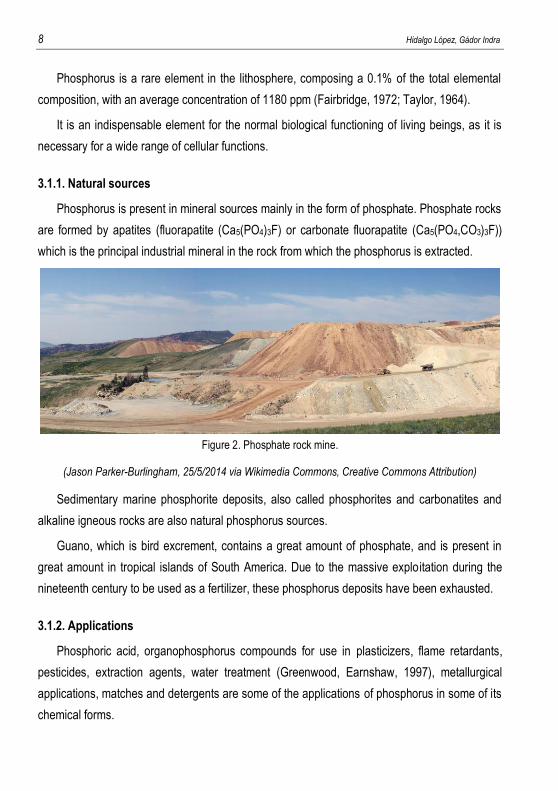
Phosphorus is present in mineral sources mainly in the form of phosphate. Phosphate rocks
are formed by apatites (fluorapatite (Ca5(PO4)3F) or carbonate fluorapatite (Ca5(PO4,CO3)3F))
which is the principal industrial mineral in the rock from which the phosphorus is extracted.
Figure 2. Phosphate rock mine.
(Jason Parker-Burlingham, 25/5/2014 via Wikimedia Commons, Creative Commons Attribution)
Sedimentary marine phosphorite deposits, also called phosphorites and carbonatites and
alkaline igneous rocks are also natural phosphorus sources.
Guano, which is bird excrement, contains a great amount of phosphate, and is present in
great amount in tropical islands of South America. Due to the massive exploitation during the
nineteenth century to be used as a fertilizer, these phosphorus deposits have been exhausted.
3.1.2. Applications
Phosphoric acid, organophosphorus compounds for use in plasticizers, flame retardants,
pesticides, extraction agents, water treatment (Greenwood, Earnshaw, 1997), metallurgical
applications, matches and detergents are some of the applications of phosphorus in some of its
chemical forms.
Phosphorus recovery as hydroxyapatite (HAP) from urban wastewaters using nanofiltration and reverse osmosis brines 9
The main application of extracted phosphorus is its use as artificial fertiliser, as nutrients are
necessary for the plant growth. Although ground naturally contains the necessary elements for
food production, not all the soils have the same quality, needing some extra addition of minerals
such as phosphorus, nitrogen or potassium.
Since the mid-20th century population growth concomitant with increased food demand and
urbanisation have resulted in a dramatic increase in the use of mined phosphate rock as
compared to other P sources. Phosphorus demand for food production is about 90% of the total
(Smit et al., 2009).
The use of fertilisers plays a critical role in increasing yields but some estimates indicate
that existing phosphate rock reserves may be depleted within 50–120 years (Cordell et al.,
2009; Fixen, 2009; Smit et al., 2009).
Humankind has increased the rate of phosphorus cycling on Earth by four times, mainly due
to agricultural fertiliser production and application. Between 1950 and 1995, an estimated
600,000,000 tonnes of phosphorus were applied to Earth's surface, primarily on croplands
(Carpenter et al., 1998). Annual application of 40–120 kg mineral P2O5 fertilizer per ha
(approximately 18–52 kg P/ha) are required to maintain agricultural productivity (Ott,
Rechberger, 2012).
3.1.3. Wastewaters and the problem of eutrophication
Wastewaters contain high concentrations of nutrients due to their nature. Living beings,
although processing food, do not use 100% of it, and therefore phosphorus and nitrogen are left
in the organic residues that form the excreta.
On the other hand, industrial wastewaters also have high amounts of nutrients, especially
those obtained in certain industries such as fertilisers, detergent and alimentary industries and
farming in general, due to the gathering effect of water when passing through an area. This
collects organic matter, fertilisers and other substances richly loaded with P and N.
Aquatic systems have an ideal stoichiometric Si:N:P nutrient ratio 16:16:1 which can be
easily altered if are poured untreated urban or industrial wastewaters (Redfield, 1958).
Excessive influx of phosphorus and/or nitrogen (usually in form of phosphates and nitrates)
into natural water effluents causes algae to overgrow due to the excessive amount of nutrients.
This is called eutrophication, or hypertrophication. This also causes oxygen in the water to
10 Hidalgo López, Gádor Indra
diminish due to the O2 consumed by bacteria when decomposing dead algae. Without oxygen,
fish and shellfish cannot survive. This fauna loss affects directly human population, as it alters
the food chain, decreasing the supply of food for people or other animals such as bears or
foxes.
Another problematic issue is the water treatment of these eutrophicated reservoirs to
produce drinking water. Health problems can appear if this altered water is consumed, due to
the presence of harmful algal blooms (HABs), which are algal bloom events involving toxic or
otherwise harmful phytoplankton such as dinoflagellates of the genus Alexandrium and Karenia,
or diatoms of the genus Pseudo-nitzschia (Kirkpatrick et al., 2004). Such blooms often take on a
red or brown hue and are known colloquially as red tides.
3.2. PHOSPHORUS REMOVAL FROM WASTEWATERS
There are many different techniques to remove the P in the wastewater such as chemical
precipitation, adsorption, reverse osmosis, biological removal, and constructed wetlands.
When treating wastewater effluents, there are points in the WWTPs (Waste Water
Treatment Plants) where the P concentration is higher, enabling a feasible separation and thus
recovering process.
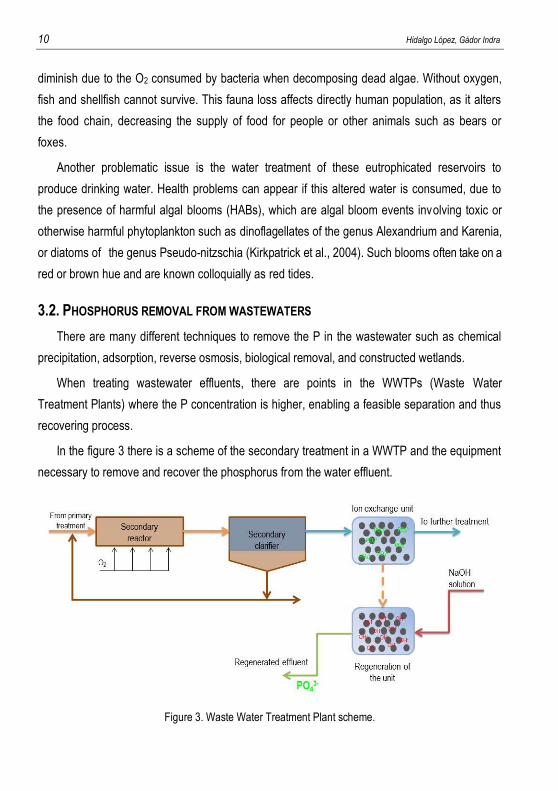
In the figure 3 there is a scheme of the secondary treatment in a WWTP and the equipment
necessary to remove and recover the phosphorus from the water effluent.
Figure 3. Waste Water Treatment Plant scheme.
Phosphorus recovery as hydroxyapatite (HAP) from urban wastewaters using nanofiltration and reverse osmosis brines 11
After the secondary clarifier, the water effluent can be treated with an ion exchange resin, to
capture the phosphate ions from the solution. By this method, the water can continue its treating
process in the WWTP as this treatment has decreased its phosphate concentration. If a larger
removal of the phosphate is necessary, further treatments can be applied until the effluent is apt
to be incorporated to natural water effluents.
When the exchange resin is saturated, it is regenerated using the ideal solution to replace
PO43- anions with other anions, so that the phosphate is released and can be recovered. The
ideal solution will depend on the type of resin used to retain the phosphate in this treatment. In
this scheme, NaOH is used to substitute PO43- ions with OH- from the basic solution. With this
method, up to 1,000 mg PO43-/L can be found in the obtained regenerated effluent. This stream
is then treated to recover the phosphate by chemical precipitation.
3.2.1. Chemical precipitation
The main process used in WWTPs for P removal from wastewater is chemical precipitation
with Fe, Al or Ca, which involves the addition of cationic salts to water containing phosphate, to
produce a precipitation of insoluble phosphate complexes, and allow the separation of
precipitates from the aqueous phase. Although some precipitates containing phosphorus can be
recycled as fertilisers through land application, this application is impossible when the salts
obtained contain metals which are not compatible with agricultural crops, as it would be a
serious health problem. Phosphate precipitated as Fe or Al salts is unrecoverable for potential
processing into fertilizer (Donnert, Salecker, 1999).
Phosphorus recovered from wastewater or leachates of P-containing solids may be further
utilised in industrial or agricultural applications. In particular, where P is sorbed to a mineral-
based material or precipitated as a phosphate mineral the resultant solid phase may be suitable
for use as a slow-release P fertilizer. The use of P-containing mineral-based materials as soil
amendments may be particularly advantageous where additional agronomic benefits are
conferred, such as improved soil moisture holding capacity or the provision of other essential
plant nutrients (Wendling et al., 2013).
Recovering (not only removing) the phosphorus from wastewaters has two elemental
benefits: it avoids the eutrophication problem and decreases the amount of phosphate extracted
from mineral sources by reusing the P which has already been mined.
12 Hidalgo López, Gádor Indra
Magnesium and calcium phosphates offer a plausible solution to recover phosphorus by
chemical precipitation.
3.2.1.1. Magnesium phosphates. Struvite
Research in the area of P recovery by chemical precipitation has largely focused on the
recovery of struvite (NH4MgPO4·6H2O), particularly in the case of domestic wastewater
treatment. Struvite has excellent properties as a slow release fertiliser without much risk to the
environment (Bridger et al., 1962; Lunt et al., 1964).
3.2.1.2. Calcium phosphates. Hydroxyapatite
Hydroxyapatite (HAP) Ca5(PO4)3(OH) is a mineral of the apatite group. This apatite is a
group of phosphate minerals which are characterised by having calcium and phosphate on their
structure. Ca/P molar ratio determines the type of calcium phosphate, and consequently, its
properties, such as solubility. Lower Ca/P molar ratios involve more soluble calcium
phosphates. Hydroxyapatite is the most stable form of the calcium phosphates, and the least
soluble.
The formula used to describe hydroxyapatite is Ca10(PO4)6(OH)2 due to the fact that the
crystal unit cell includes two Ca5(PO4)3(OH). Its name describes the fact that the end member of
the apatite group contains a hydroxyl group. These ions can be replaced by other anions, to
form other minerals such as fluorapatite or chlorapatite.
Hydroxyapatite crystal is colorless or has a slightly coloration (brown, green or yellowish) if it
has impurities, and pure powder is white.
The crystal structure of non-stoichiometric hydroxyapatite (common in nature) is hexagonal
di-pyramidal (crystal class), which is included in the hexagonal crystal system and crystal family.
Hydroxyapatite hardness is 5 according to Mohs scale of mineral hardness. There is another
type, which is monoclinic, more stable and corresponds to stoichiometric HAP (Leventouri,
2006).
It has attracted much attention as a substitute material for damaged teeth or bones over the
past several decades, because of its crystallographical and chemical similarity with various
calcified tissues of vertebrates (Suchanek W., Yoshimura M., Mater J., 1998), (Hench L.L.,
1991). HAP ceramics does not exhibit any cytotoxic effects. It shows excellent biocompatibility
with hard tissues and also with skin and muscle tissues. Moreover, HAP can directly bind to the
Phosphorus recovery as hydroxyapatite (HAP) from urban wastewaters using nanofiltration and reverse osmosis brines 13
bone, allowing posterior bone growth. Hydroxyapatite is the main mineral constituent of teeth
enamel.
3.2.1.3. HAP Precipitation mechanism
Supersaturation is the driving force for nucleation and crystal growth, which are the two
events of the precipitation mechanism, and they both take part simultaneously during a large
part of the time.
Nucleation needs supersaturation and minuscule solid particles: seed crystal or nuclei,
which act as starting point to which other particles add and form a stable aggregate that will
continue growing.
Nucleation can be primary or secondary. In primary nucleation, the formation of the new
solid phase is not influenced by the presence of the solid phase being formed. This type of
nucleation can be either homogeneous or heterogeneous.
Homogeneous nucleation. It is initiated by collisions between two molecules, which
sometimes result in stable embryos (small number of molecules), which can keep growing.
Heterogeneous nucleation. The nucleation process is usually enhanced by the presence of
impurity particles, ions or foreign surfaces. These lower the nucleation energy barrier.
Secondary nucleation is induced by the presence of macroscopic crystals of the
precipitate.
Crystal growth. Solute molecules from the supersaturated solution adhere to the crystal
created during nucleation.
HAP formation, which is a thermodynamically stable phase, is preceded by the formation of
less stable (metastable) phases with higher energy (kinetically favoured) like amouphous
calcium phosphate or octacalcium phosphate, depending on the experimental conditions. The
precipitation reaction should be carefully controlled if no other salts want to be obtained.
To obtain HAP by chemical precipitation, the Ca/P molar ratio should be the stoichiometric
one 1.67. This determines the initial phosphate and calcium concentration in the reactor to
achieve this specific calcium phosphate. Non-stoichiometric products are usually obtained when
executing chemical precipitation in a stirred batch reactor. To overcome homogeneity problems
in the distribution of supersaturation in the reactor, semi-batch configuration has been used.
14 Hidalgo López, Gádor Indra
Previous studies in the Chemical Engineering department of Universitat Politècnica de
Catalunya (UPC) have found the best conditions to recover phosphorus precipitating
hydroxyapatite using a stirred batch reactor operating at room temperature. CaCl2 solution was
added very slowly to enhance the formation of HAP. As the flow rate is smaller, more HAP is
formed, but the experiment is too long. The adequate stirring speed is 250-260 rpm and the
calcium flow rate 0.3 mL/min.
As buying CaCl2 to recover phosphorus in the WWTPs scale is very expensive, the
concentrate of nanofiltration or reverse osmosis processes can be used as a calcium source,
revaluing both waste waters and brines.
4. JUSTIFICATION AND OBJECTIVES
Phosphorus recovery is necessary to prevent its loss through wastewater streams and
sewage sludge landfill disposal. By recovering the phosphorus from wastewaters as calcium
phosphate, a fertiliser can be obtained, while eutrophication and finite phosphorus rock reserves
problems are overcome.
For this reason, the current study focuses on the recovery of phosphate from the
regenerated effluent through the chemical precipitation of hydroxyapatite using a synthetic
solution of salts to simulate nanofiltration and reverse osmosis brines. In this way, it can be
determined whether it is possible to obtain hydroxyapatite in the precipitated solid when there
are other salts in the brine other than CaCl2, as in real recycled brines.
More specifically, to reach this overall objective, several goals are pursued: to determine the
effect of Mg2+, pH and the type of brine in phosphate removal and the solid obtained; and to find
the best conditions to obtain HAP.
Phosphorus recovery as hydroxyapatite (HAP) from urban wastewaters using nanofiltration and reverse osmosis brines 15
5. MATERIALS AND METHODS
The experimental set up is schematised, as well as the types of brines and their
components. The experimental procedure is detailed for further research using this
methodology, and the analytical methods used to determine the amount of phosphate and
characterise the obtained precipitate are here summarised.
5.1. EXPERIMENTAL SET UP
The prepared brine solution, thanks to a peristaltic pump (Gilson MINIPULS 3), will be
continuously fed into the reactor at a flow rate of 0.3 mL/min when the experiment starts (see
figure 4). Another pump (Cole-Parmer 7520-67 Masterflex Console Drive) will supply the
necessary NaOH (1 M) to maintain the pH at the desired range, which is ±0.1 of the selected
pH value. This pump is connected to a pH controller (Crison PH 28) which regulates the
hydroxide supply depending on the pH detected by the pH probe (Mettler HA 405-DPA-SC-
S8/225 Combination pH). The pH controller is configured at this point but the pump left
disconnected to adjust the pH manually with NaOH 3 M at first to avoid diluting too much the
initial 1,000 ppm phosphate solution. When the pH is near the correct value, the pump will be
connected and the controller will adjust itself until the desired pH.
16 Hidalgo López, Gádor Indra
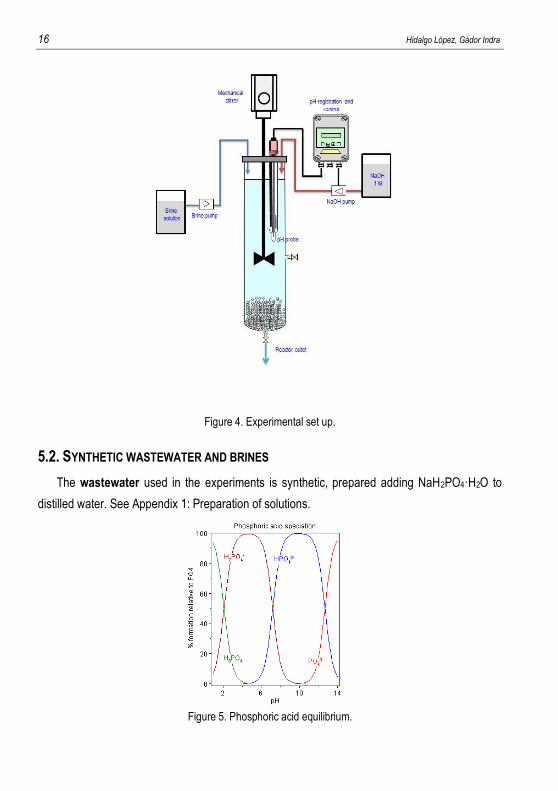
Figure 4. Experimental set up.
5.2. SYNTHETIC WASTEWATER AND BRINES
The wastewater used in the experiments is synthetic, prepared adding NaH2PO4·H2O to
distilled water. See Appendix 1: Preparation of solutions.
Figure 5. Phosphoric acid equilibrium.
Phosphorus recovery as hydroxyapatite (HAP) from urban wastewaters using nanofiltration and reverse osmosis brines 17
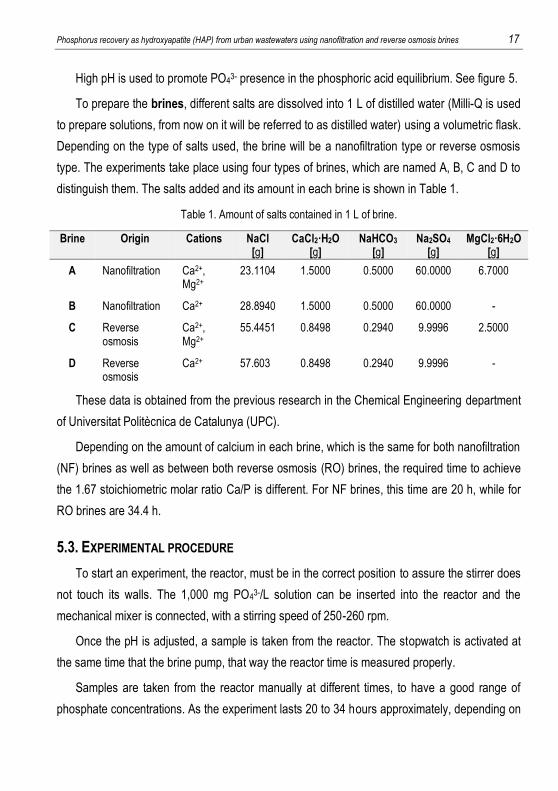
High pH is used to promote PO43- presence in the phosphoric acid equilibrium. See figure 5.
To prepare the brines, different salts are dissolved into 1 L of distilled water (Milli-Q is used
to prepare solutions, from now on it will be referred to as distilled water) using a volumetric flask.
Depending on the type of salts used, the brine will be a nanofiltration type or reverse osmosis
type. The experiments take place using four types of brines, which are named A, B, C and D to
distinguish them. The salts added and its amount in each brine is shown in Table 1.
Table 1. Amount of salts contained in 1 L of brine.
Brine Origin Cations NaCl [g]
CaCl2·H2O [g]
NaHCO3 [g]
Na2SO4 [g]
MgCl2·6H2O [g]
A Nanofiltration Ca2+, Mg2+
23.1104 1.5000 0.5000 60.0000 6.7000
B Nanofiltration Ca2+ 28.8940 1.5000 0.5000 60.0000 -
C Reverse osmosis
Ca2+, Mg2+
55.4451 0.8498 0.2940 9.9996 2.5000
D Reverse osmosis
Ca2+ 57.603 0.8498 0.2940 9.9996 -
These data is obtained from the previous research in the Chemical Engineering department
of Universitat Politècnica de Catalunya (UPC).
Depending on the amount of calcium in each brine, which is the same for both nanofiltration
(NF) brines as well as between both reverse osmosis (RO) brines, the required time to achieve
the 1.67 stoichiometric molar ratio Ca/P is different. For NF brines, this time are 20 h, while for
RO brines are 34.4 h.
5.3. EXPERIMENTAL PROCEDURE
To start an experiment, the reactor, must be in the correct position to assure the stirrer does
not touch its walls. The 1,000 mg PO43-/L solution can be inserted into the reactor and the
mechanical mixer is connected, with a stirring speed of 250-260 rpm.
Once the pH is adjusted, a sample is taken from the reactor. The stopwatch is activated at
the same time that the brine pump, that way the reactor time is measured properly.
Samples are taken from the reactor manually at different times, to have a good range of
phosphate concentrations. As the experiment lasts 20 to 34 hours approximately, depending on
18 Hidalgo López, Gádor Indra
the type of brine, and the reaction will not be stopped during night, no samples will be taken
during that period.
When the last sample is taken, the pumps and the stirring are stopped. The content of the
reactor is left there to allow the bulk precipitation. After 24 hours, the reactor is emptied and
cleaned, and the solution extracted is filtered using a Büchner funnel with filtering paper and a
Kitasato flask thanks to a water aspirator due to Venturi effect. As soon as the solid is dry, it is
weighted and kept in a plastic recipient to be later examined using different techniques such as
XRD, FTIR or SEM-EDS.
5.4. ANALYTICAL METHODS
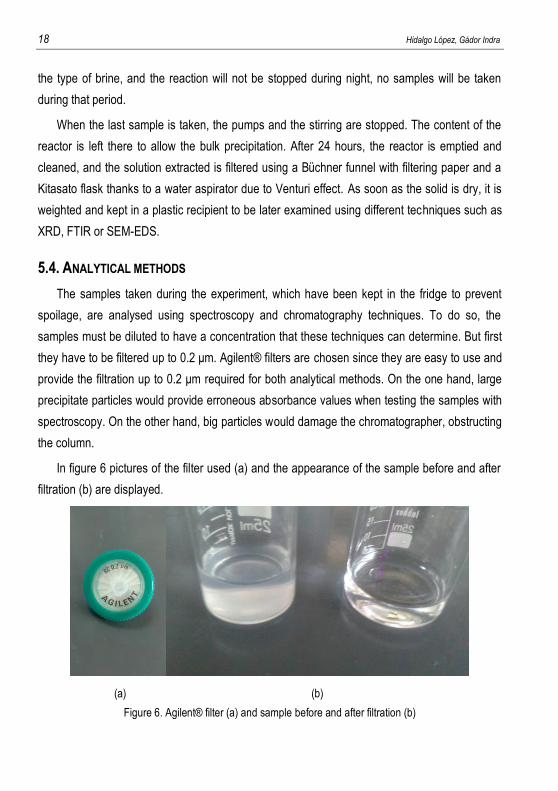
The samples taken during the experiment, which have been kept in the fridge to prevent
spoilage, are analysed using spectroscopy and chromatography techniques. To do so, the
samples must be diluted to have a concentration that these techniques can determine. But first
they have to be filtered up to 0.2 μm. Agilent® filters are chosen since they are easy to use and
provide the filtration up to 0.2 μm required for both analytical methods. On the one hand, large
precipitate particles would provide erroneous absorbance values when testing the samples with
spectroscopy. On the other hand, big particles would damage the chromatographer, obstructing
the column.
In figure 6 pictures of the filter used (a) and the appearance of the sample before and after
filtration (b) are displayed.
(a) (b)
Figure 6. Agilent® filter (a) and sample before and after filtration (b)
Phosphorus recovery as hydroxyapatite (HAP) from urban wastewaters using nanofiltration and reverse osmosis brines 19
5.4.1 UV spectrophotometry
Spectrophotometry is the quantitative measurement of the reflection or transmission
properties of a material as a function of wavelength. A spectrophotometer is used to measure
these properties of a solution, as well as of transparent, translucent or opaque solids.
For analysing the samples taken from the reactor, Ultraviolet-visible spectrophotometry is
used. This uses light in the visible and adjacent ranges.
In order to determine the concentration of substances, concretely of phosphate in the
samples examined, the light transmittance of the solution can be tested using
spectrophotometry. According to Beer-Lambert law, the amount of light that passes through the
solution (or, the one that the solution absorbs) is indicative of the concentration of phosphate in
the solution, which is the absorber.
It is necessary to know how the absorbance changes with concentration. This is determined
doing a calibration curve using patterns with known concentrations. Standard solutions of 2, 5,
10 and 25 mg PO43-/L are prepared, and then analysed with spectrophotometry. Within small
ranges, Beer-Lambert law is applicable and the relationship between absorbance and
concentration of absorber in the samples vary linearly. Once the calibration is done, the
wavelength at which the absorbance will be tested is determined, and it is found to be 400 nm
the best choice.
The absorbance at 400 nm is determined and a calibration curve is represented, absolute
absorbance (calculated as absorbance at 400 nm – matrix absorbance) on the y axis and
phosphate concentration on the x axis with equation y=bx+c. From this, parameters b and c are
extracted, and will be used to find the concentration of phosphate when the absorbance of a
sample is determined.
The methodology follows the Standard Methods. For this, a solution must be prepared with
the sample to analyse and the Vanadate-Molybdate reagent. The latter will provide coloration
once reacts with the phosphate contained in the sample. See Appendix 1: Preparation of
solutions, to check the procedure to prepare the reagent.
Solutions are placed in a transparent cell, known as cuvette. The one used is quartz glass,
and has a width of 1 cm, which is the path length, L, in the Beer-Lambert law. See figure 48 in
Appendix 2: Analytical methods.
20 Hidalgo López, Gádor Indra
The solutions are analysed in increasing order of phosphate concentration to avoid distorted
values when reusing the cuvette.
5.4.2. Ion-exchange chromatography. (Analysis of phosphate, calcium, magnesium,
sodium, sulphate and chloride)
Chromatography includes various laboratory techniques which may have preparative or
analytical purposes. The preparative ones separate different substances present in the sample,
while the analytical purpose is to determinate qualitatively and quantitatively the substances
present in the sample. In this research the main purpose is to analyse using ion exchange
chromatography (or ion chromatography) the samples taken from the reactor to determine
the ions present and their concentration in the samples.
The sample is the liquid analysed. It contains the substances which are going to be
separated, called analytes. The stationary phase in the chromatographer used is the solid
contained in the column. The mobile phase is the liquid formed by the eluent and the sample.
This liquid moves through the chromatography column (stationary phase) where the sample
interacts with the stationary phase and is separated. In ion-exchange chromatography, the
separation takes place due to coulombic (ionic) interactions.
This type of chromatography is further subdivided into cation exchange chromatography and
anion exchange chromatography. The stationary phase surface displays ionic functional groups
that interact with analyte ions of opposite charge.
Cation exchange chromatography retains positively charged cations because the stationary
phase contains a negatively charged functional group. The cation exchange column used is the
IonPac® CS16 and the used eluent is methanesulfonic acid (MSA). It operates at 40ºC.
Anion exchange chromatography retains anions using a positively charged functional group.
The anion exchange column used is the IonPac® AS23 and the used eluent is a buffer solution
made of Na2CO3 and NaHCO3. It operates at 30ºC.
The chromatogram is the visual output of the chromatograph. It is displayed on the screen
of the computer which is connected to the chromatograph. Thanks to Chromeleon pc program,
the sequence can be introduced and the results extracted once the analysis has been finished.
The sequence permits the program to know how many time must the analysis of each sample
last, how many samples are going to be analysed and what name they are given. A peak is a
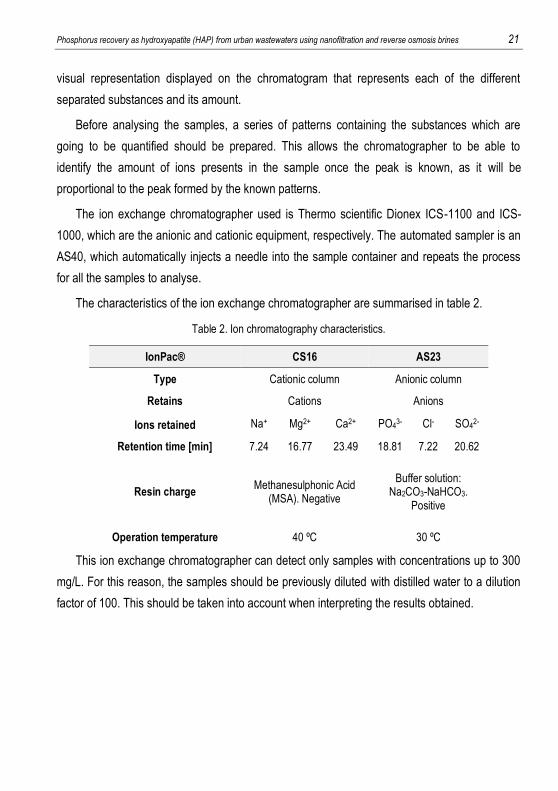
Phosphorus recovery as hydroxyapatite (HAP) from urban wastewaters using nanofiltration and reverse osmosis brines 21
visual representation displayed on the chromatogram that represents each of the different
separated substances and its amount.
Before analysing the samples, a series of patterns containing the substances which are
going to be quantified should be prepared. This allows the chromatographer to be able to
identify the amount of ions presents in the sample once the peak is known, as it will be
proportional to the peak formed by the known patterns.
The ion exchange chromatographer used is Thermo scientific Dionex ICS-1100 and ICS-
1000, which are the anionic and cationic equipment, respectively. The automated sampler is an
AS40, which automatically injects a needle into the sample container and repeats the process
for all the samples to analyse.
The characteristics of the ion exchange chromatographer are summarised in table 2.
Table 2. Ion chromatography characteristics.
IonPac® CS16 AS23
Type Cationic column Anionic column
Retains Cations Anions
Ions retained Na+ Mg2+ Ca2+ PO43- Cl- SO4
2-
Retention time [min] 7.24 16.77 23.49 18.81 7.22 20.62
Resin charge Methanesulphonic Acid
(MSA). Negative
Buffer solution: Na2CO3-NaHCO3.
Positive
Operation temperature 40 ºC 30 ºC
This ion exchange chromatographer can detect only samples with concentrations up to 300
mg/L. For this reason, the samples should be previously diluted with distilled water to a dilution
factor of 100. This should be taken into account when interpreting the results obtained.
22 Hidalgo López, Gádor Indra
5.5. SOLID CHARACTERISATION METHODS
The solid is analysed using different techniques that provide information about its
composition and crystallinity.
XRD or X-ray crystallography is a technique which determines the X-ray diffraction pattern
of a crystal, and thanks to it, its molecular and atomic structure can be described. For example,
in this particular case, this technique would identify crystalline hydroxyapatite in the solid
obtained if it were present. X-rays are applied to the sample with a known angle while it rotates.
The electrons in the atoms of the crystal scatter those rays in different directions, in what is
known as elastic scattering, therefore a regular array of electrons form a multitude of waves.
Destructive interferences make some waves cancel each other, while constructive
interferences, which take place only when Bragg’s Law is accomplished, cause a diffraction
pattern.
Infrared spectroscopy analysis is the spectroscopy that uses the infrared region of the
electromagnetic spectrum to generate IR spectra. When a compound is radiated with a
frequency that matches perfectly with the frequency of one of its vibrations, the molecule
absorbs energy. Absorption bands of the different functional groups constituting the molecule
studied appear at different frequencies (position), with different intensities (weak, medium or
strong) and shape (broad or sharp). Thanks to these characteristics, the molecule can be
identified. Fourier Transform Infrared Spectrometer (FTIR) radiates the sample with a beam
containing many frequencies of light at the same time, and measures the amount of it absorbed
by the sample.
FESEM (Field Emission Scanning Electron Microscope) produces images of a sample
when scanning it with a beam of electrons. The atoms in the sample interact physically with the
light beam and an image can be created with the signal received by the bouncing of the surface
irregularities. This provides a picture of the superficial texture. It also allows determining the
percentage of each substance in the superficial layer of the solid.
To prepare the samples that are later introduced into the microscope, the solids have to be
heated in the oven for 24 h. Then they are placed on a metal support which is coated by a
carbon sticker. This attracts the electron beam to the samples, allowing a high resolution vision.
But to ensure a complete conductivity of the material analysed, the sample is coated with a
platinum-palladium mixture. To do this, the plaque is introduced in the Cressington Sputter
Phosphorus recovery as hydroxyapatite (HAP) from urban wastewaters using nanofiltration and reverse osmosis brines 23
Coater 208 HR (see figure 65 and 66 in Appendix 2: Analytical methods), the void is done and
an argon blanketing takes place. On one pole there is a platinum-palladium piece of metal and a
voltage difference is applied. This causes this platinum and palladium ions to migrate from one
pole to the other pole. In their way, the sample is impeding this movement, causing it to be
coated by the two metals. The duration of this process determines the thickness of the metal
coat, which is at least 22 nm thick.
The Field Emission Scanning Electron Microscope used is JEOL JSM-7001F (see figure 67
in Appendix 2: Analytical methods), and the computer program used to operate it is INCA. By
this technique magnifications up to x 100,000 can be achieved. The microscope has two
chambers. The first one, which is in contact with the exterior, acts as a pressure regulator. The
pressure in the interior of the second chamber, where the sample is moved once the opening is
sealed is 6.5·10-4 Pa. The vacuum should be constant to take the best pictures and to avoid
distortion.
Other techniques to analyse solids are the following:
BET (Brunauer–Emmett–Teller) theory is the basis for the analyse technique that
measures the specific surface area of a material. Furthermore, this is a way to determine the
texture of the solid obtained.
Dynamic Laser Scattering (DLS) is used to characterize size of various particles including
proteins, polymers, micelles, carbohydrates, and nanoparticles. With this, the diameter of the
hydroxyapatite nanoparticles can be determined.
Differential Scanning Calorimetry (DSC) is widely used to determine the purity of the
solid, being related with its fusion point, which can be easily determined.
24 Hidalgo López, Gádor Indra
6. RESULTS AND DISCUSSION
Here the results obtained from the experiments will be shown. The phosphate removal and
the effect of different parameters on it will be discussed. The analysis of the solids obtained by
means of XRD, FTIR and SEM methods will be used to corroborate the hypothesis raised.
Finally a comparison of the experiments will take place, enabling the drawing of the conclusions.
6.1. PHOSPHATE PRECIPITATION USING NANOFILTRATION AND REVERSE OSMOSIS
BRINES
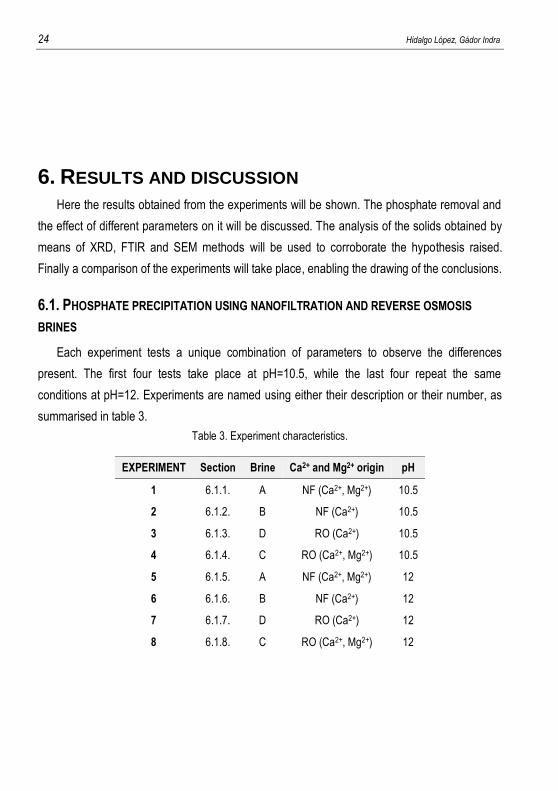
Each experiment tests a unique combination of parameters to observe the differences
present. The first four tests take place at pH=10.5, while the last four repeat the same
conditions at pH=12. Experiments are named using either their description or their number, as
summarised in table 3.
Table 3. Experiment characteristics.
EXPERIMENT Section Brine Ca2+ and Mg2+ origin pH
1 6.1.1. A NF (Ca2+, Mg2+) 10.5
2 6.1.2. B NF (Ca2+) 10.5
3 6.1.3. D RO (Ca2+) 10.5
4 6.1.4. C RO (Ca2+, Mg2+) 10.5
5 6.1.5. A NF (Ca2+, Mg2+) 12
6 6.1.6. B NF (Ca2+) 12
7 6.1.7. D RO (Ca2+) 12
8 6.1.8. C RO (Ca2+, Mg2+) 12
Phosphorus recovery as hydroxyapatite (HAP) from urban wastewaters using nanofiltration and reverse osmosis brines 25
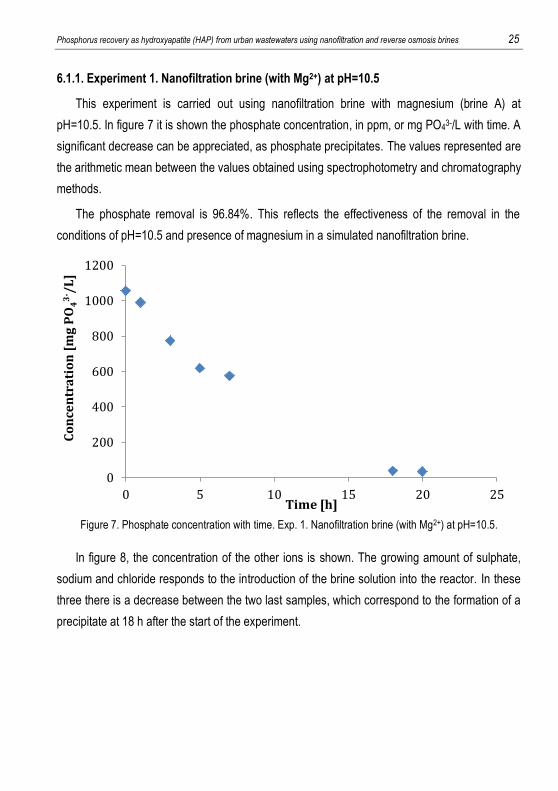
6.1.1. Experiment 1. Nanofiltration brine (with Mg2+) at pH=10.5
This experiment is carried out using nanofiltration brine with magnesium (brine A) at
pH=10.5. In figure 7 it is shown the phosphate concentration, in ppm, or mg PO43-/L with time. A
significant decrease can be appreciated, as phosphate precipitates. The values represented are
the arithmetic mean between the values obtained using spectrophotometry and chromatography
methods.
The phosphate removal is 96.84%. This reflects the effectiveness of the removal in the
conditions of pH=10.5 and presence of magnesium in a simulated nanofiltration brine.
Figure 7. Phosphate concentration with time. Exp. 1. Nanofiltration brine (with Mg2+) at pH=10.5.
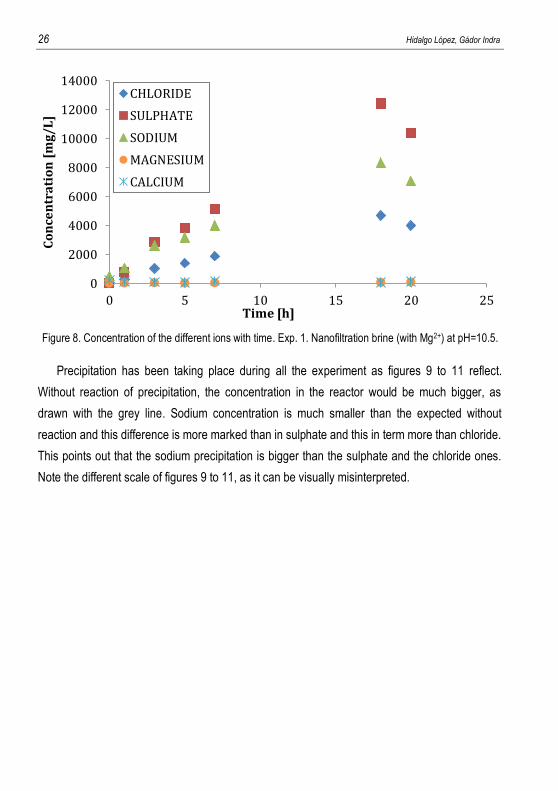
In figure 8, the concentration of the other ions is shown. The growing amount of sulphate,
sodium and chloride responds to the introduction of the brine solution into the reactor. In these
three there is a decrease between the two last samples, which correspond to the formation of a
precipitate at 18 h after the start of the experiment.
0
200
400
600
800
1000
1200
0 5 10 15 20 25
Co
nce
ntr
ati
on
[m
g P
O4
3- /
L]
Time [h]
26 Hidalgo López, Gádor Indra
Figure 8. Concentration of the different ions with time. Exp. 1. Nanofiltration brine (with Mg2+) at pH=10.5.
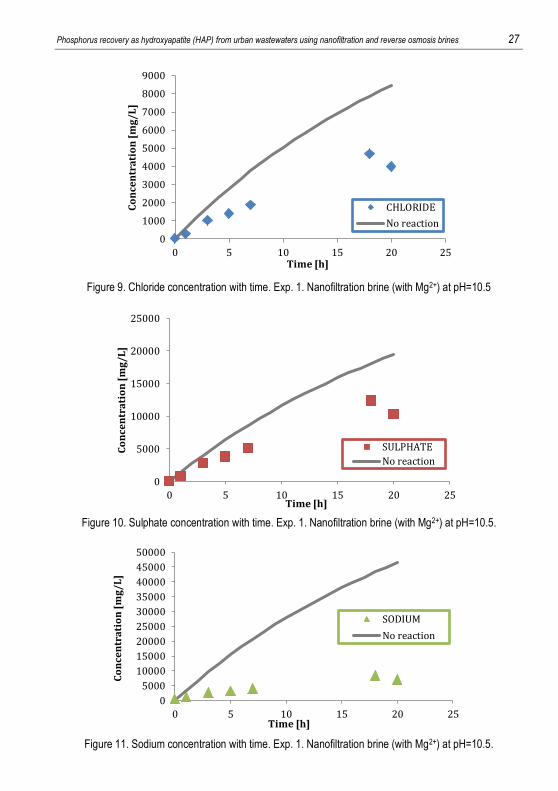
Precipitation has been taking place during all the experiment as figures 9 to 11 reflect.
Without reaction of precipitation, the concentration in the reactor would be much bigger, as
drawn with the grey line. Sodium concentration is much smaller than the expected without
reaction and this difference is more marked than in sulphate and this in term more than chloride.
This points out that the sodium precipitation is bigger than the sulphate and the chloride ones.
Note the different scale of figures 9 to 11, as it can be visually misinterpreted.
0
2000
4000
6000
8000
10000
12000
14000
0 5 10 15 20 25
Co
nce
ntr
ati
on
[m
g/L
]
Time [h]
CHLORIDE
SULPHATE
SODIUM
MAGNESIUM
CALCIUM
Phosphorus recovery as hydroxyapatite (HAP) from urban wastewaters using nanofiltration and reverse osmosis brines 27
Figure 9. Chloride concentration with time. Exp. 1. Nanofiltration brine (with Mg2+) at pH=10.5
Figure 10. Sulphate concentration with time. Exp. 1. Nanofiltration brine (with Mg2+) at pH=10.5.
Figure 11. Sodium concentration with time. Exp. 1. Nanofiltration brine (with Mg2+) at pH=10.5.
0
1000
2000
3000
4000
5000
6000
7000
8000
9000
0 5 10 15 20 25
Co
nce
ntr
ati
on
[m
g/L
]
Time [h]
CHLORIDE
No reaction
0
5000
10000
15000
20000
25000
0 5 10 15 20 25
Co
nce
ntr
ati
on
[m
g/L
]
Time [h]
SULPHATE
No reaction
0
5000
10000
15000
20000
25000
30000
35000
40000
45000
50000
0 5 10 15 20 25
Co
nce
ntr
ati
on
[m
g/L
]
Time [h]
SODIUM
No reaction
28 Hidalgo López, Gádor Indra
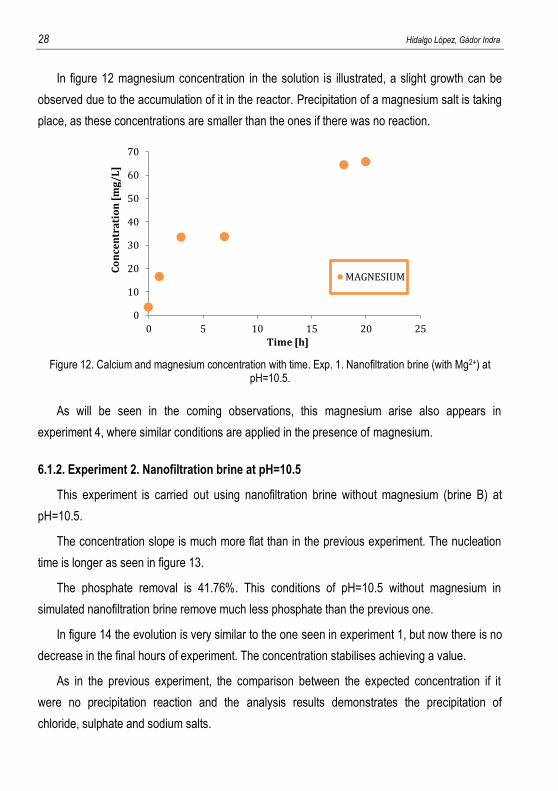
In figure 12 magnesium concentration in the solution is illustrated, a slight growth can be
observed due to the accumulation of it in the reactor. Precipitation of a magnesium salt is taking
place, as these concentrations are smaller than the ones if there was no reaction.
Figure 12. Calcium and magnesium concentration with time. Exp. 1. Nanofiltration brine (with Mg2+) at
pH=10.5.
As will be seen in the coming observations, this magnesium arise also appears in
experiment 4, where similar conditions are applied in the presence of magnesium.
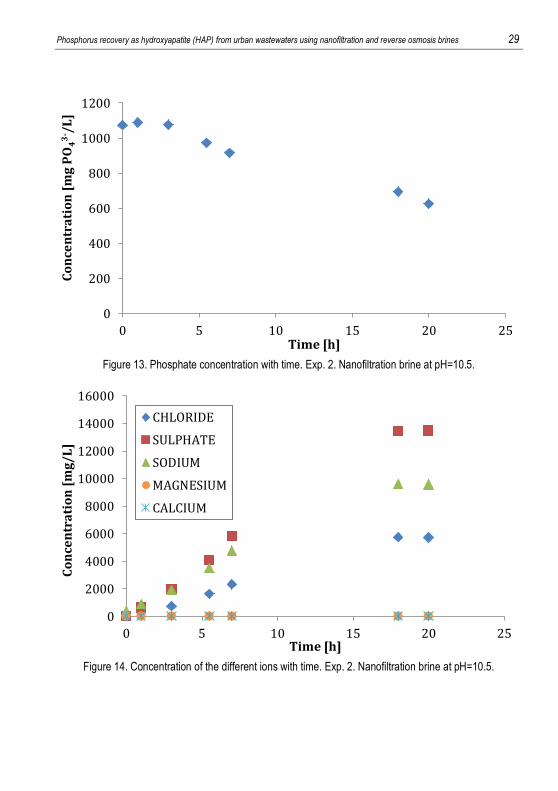
6.1.2. Experiment 2. Nanofiltration brine at pH=10.5
This experiment is carried out using nanofiltration brine without magnesium (brine B) at
pH=10.5.
The concentration slope is much more flat than in the previous experiment. The nucleation
time is longer as seen in figure 13.
The phosphate removal is 41.76%. This conditions of pH=10.5 without magnesium in
simulated nanofiltration brine remove much less phosphate than the previous one.
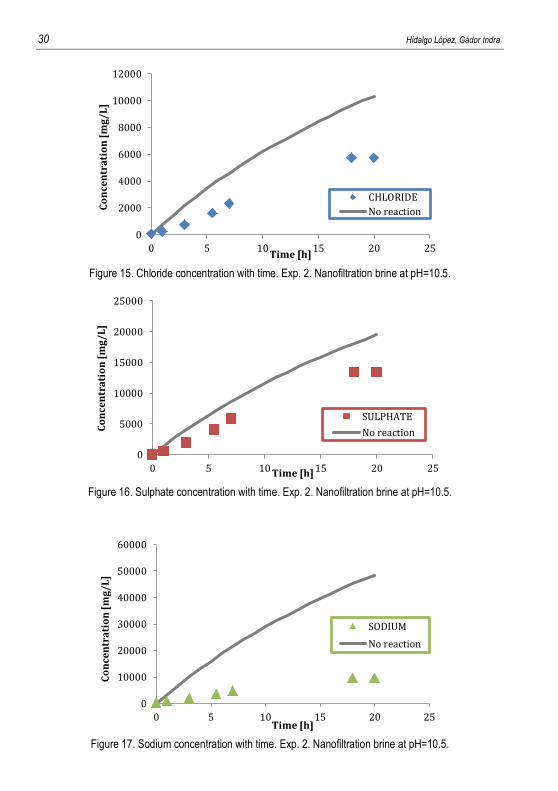
In figure 14 the evolution is very similar to the one seen in experiment 1, but now there is no
decrease in the final hours of experiment. The concentration stabilises achieving a value.
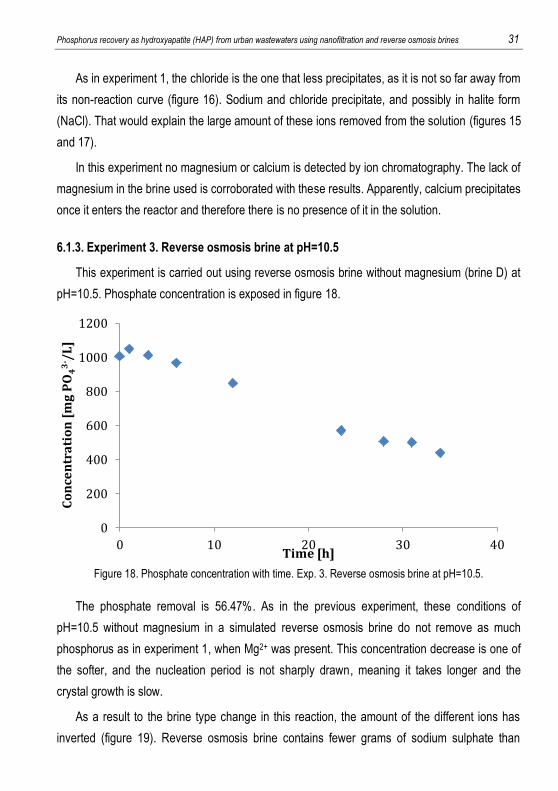
As in the previous experiment, the comparison between the expected concentration if it
were no precipitation reaction and the analysis results demonstrates the precipitation of
chloride, sulphate and sodium salts.
0
10
20
30
40
50
60
70
0 5 10 15 20 25
Co
nce
ntr
ati
on
[m
g/L
]
Time [h]
MAGNESIUM
Phosphorus recovery as hydroxyapatite (HAP) from urban wastewaters using nanofiltration and reverse osmosis brines 29
Figure 13. Phosphate concentration with time. Exp. 2. Nanofiltration brine at pH=10.5.
Figure 14. Concentration of the different ions with time. Exp. 2. Nanofiltration brine at pH=10.5.
0
200
400
600
800
1000
1200
0 5 10 15 20 25
Co
nce
ntr
ati
on
[m
g P
O4
3- /
L]
Time [h]
0
2000
4000
6000
8000
10000
12000
14000
16000
0 5 10 15 20 25
Co
nce
ntr
ati
on
[m
g/
L]
Time [h]
CHLORIDE
SULPHATE
SODIUM
MAGNESIUM
CALCIUM
30 Hidalgo López, Gádor Indra
Figure 15. Chloride concentration with time. Exp. 2. Nanofiltration brine at pH=10.5.
Figure 16. Sulphate concentration with time. Exp. 2. Nanofiltration brine at pH=10.5.
Figure 17. Sodium concentration with time. Exp. 2. Nanofiltration brine at pH=10.5.
0
2000
4000
6000
8000
10000
12000
0 5 10 15 20 25
Co
nce
ntr
ati
on
[m
g/L
]
Time [h]
CHLORIDE
No reaction
0
5000
10000
15000
20000
25000
0 5 10 15 20 25
Co
nce
ntr
ati
on
[m
g/L
]
Time [h]
SULPHATE
No reaction
0
10000
20000
30000
40000
50000
60000
0 5 10 15 20 25
Co
nce
ntr
ati
on
[m
g/L
]
Time [h]
SODIUM
No reaction
Phosphorus recovery as hydroxyapatite (HAP) from urban wastewaters using nanofiltration and reverse osmosis brines 31
As in experiment 1, the chloride is the one that less precipitates, as it is not so far away from
its non-reaction curve (figure 16). Sodium and chloride precipitate, and possibly in halite form
(NaCl). That would explain the large amount of these ions removed from the solution (figures 15
and 17).
In this experiment no magnesium or calcium is detected by ion chromatography. The lack of
magnesium in the brine used is corroborated with these results. Apparently, calcium precipitates
once it enters the reactor and therefore there is no presence of it in the solution.
6.1.3. Experiment 3. Reverse osmosis brine at pH=10.5
This experiment is carried out using reverse osmosis brine without magnesium (brine D) at
pH=10.5. Phosphate concentration is exposed in figure 18.
Figure 18. Phosphate concentration with time. Exp. 3. Reverse osmosis brine at pH=10.5.
The phosphate removal is 56.47%. As in the previous experiment, these conditions of
pH=10.5 without magnesium in a simulated reverse osmosis brine do not remove as much
phosphorus as in experiment 1, when Mg2+ was present. This concentration decrease is one of
the softer, and the nucleation period is not sharply drawn, meaning it takes longer and the
crystal growth is slow.
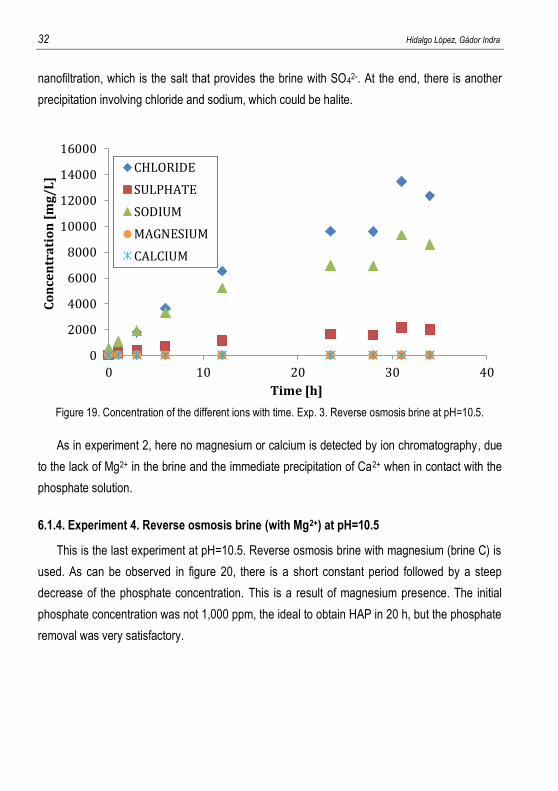
As a result to the brine type change in this reaction, the amount of the different ions has
inverted (figure 19). Reverse osmosis brine contains fewer grams of sodium sulphate than
0
200
400
600
800
1000
1200
0 10 20 30 40
Co
nce
ntr
ati
on
[m
g P
O4
3- /
L]
Time [h]
32 Hidalgo López, Gádor Indra
nanofiltration, which is the salt that provides the brine with SO42-. At the end, there is another
precipitation involving chloride and sodium, which could be halite.
Figure 19. Concentration of the different ions with time. Exp. 3. Reverse osmosis brine at pH=10.5.
As in experiment 2, here no magnesium or calcium is detected by ion chromatography, due
to the lack of Mg2+ in the brine and the immediate precipitation of Ca2+ when in contact with the
phosphate solution.
6.1.4. Experiment 4. Reverse osmosis brine (with Mg2+) at pH=10.5
This is the last experiment at pH=10.5. Reverse osmosis brine with magnesium (brine C) is
used. As can be observed in figure 20, there is a short constant period followed by a steep
decrease of the phosphate concentration. This is a result of magnesium presence. The initial
phosphate concentration was not 1,000 ppm, the ideal to obtain HAP in 20 h, but the phosphate
removal was very satisfactory.
0
2000
4000
6000
8000
10000
12000
14000
16000
0 10 20 30 40
Co
nce
ntr
ati
on
[m
g/L
]
Time [h]
CHLORIDE
SULPHATE
SODIUM
MAGNESIUM
CALCIUM
Phosphorus recovery as hydroxyapatite (HAP) from urban wastewaters using nanofiltration and reverse osmosis brines 33
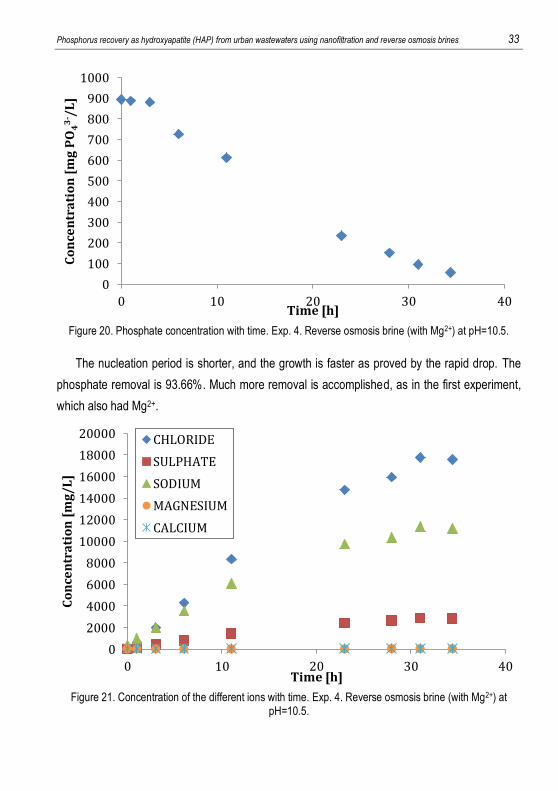
Figure 20. Phosphate concentration with time. Exp. 4. Reverse osmosis brine (with Mg2+) at pH=10.5.
The nucleation period is shorter, and the growth is faster as proved by the rapid drop. The
phosphate removal is 93.66%. Much more removal is accomplished, as in the first experiment,
which also had Mg2+.
Figure 21. Concentration of the different ions with time. Exp. 4. Reverse osmosis brine (with Mg2+) at
pH=10.5.
0
100
200
300
400
500
600
700
800
900
1000
0 10 20 30 40
Co
nce
ntr
ati
on
[m
g P
O4
3- /
L]
Time [h]
0
2000
4000
6000
8000
10000
12000
14000
16000
18000
20000
0 10 20 30 40
Co
nce
ntr
ati
on
[m
g/L
]
Time [h]
CHLORIDE
SULPHATE
SODIUM
MAGNESIUM
CALCIUM
34 Hidalgo López, Gádor Indra
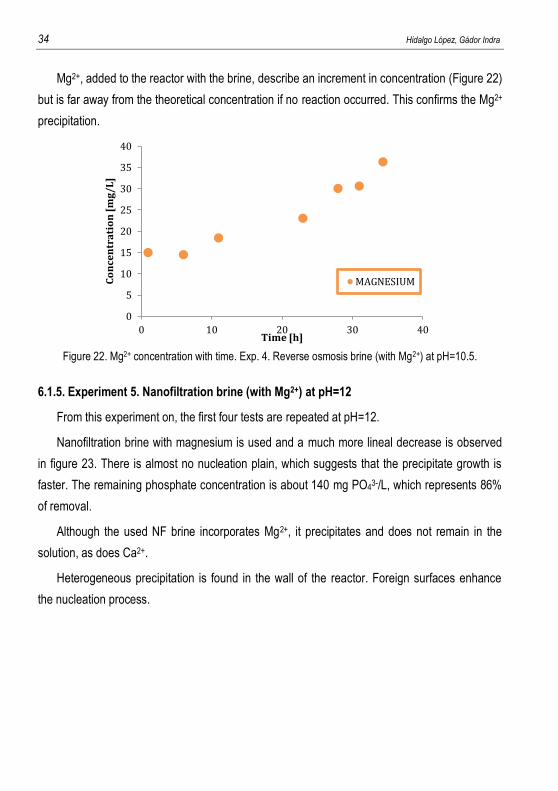
Mg2+, added to the reactor with the brine, describe an increment in concentration (Figure 22)
but is far away from the theoretical concentration if no reaction occurred. This confirms the Mg2+
precipitation.
Figure 22. Mg2+ concentration with time. Exp. 4. Reverse osmosis brine (with Mg2+) at pH=10.5.
6.1.5. Experiment 5. Nanofiltration brine (with Mg2+) at pH=12
From this experiment on, the first four tests are repeated at pH=12.
Nanofiltration brine with magnesium is used and a much more lineal decrease is observed
in figure 23. There is almost no nucleation plain, which suggests that the precipitate growth is
faster. The remaining phosphate concentration is about 140 mg PO43-/L, which represents 86%
of removal.
Although the used NF brine incorporates Mg2+, it precipitates and does not remain in the
solution, as does Ca2+.
Heterogeneous precipitation is found in the wall of the reactor. Foreign surfaces enhance
the nucleation process.
0
5
10
15
20
25
30
35
40
0 10 20 30 40
Co
nce
ntr
ati
on
[m
g/L
]
Time [h]
MAGNESIUM
Phosphorus recovery as hydroxyapatite (HAP) from urban wastewaters using nanofiltration and reverse osmosis brines 35
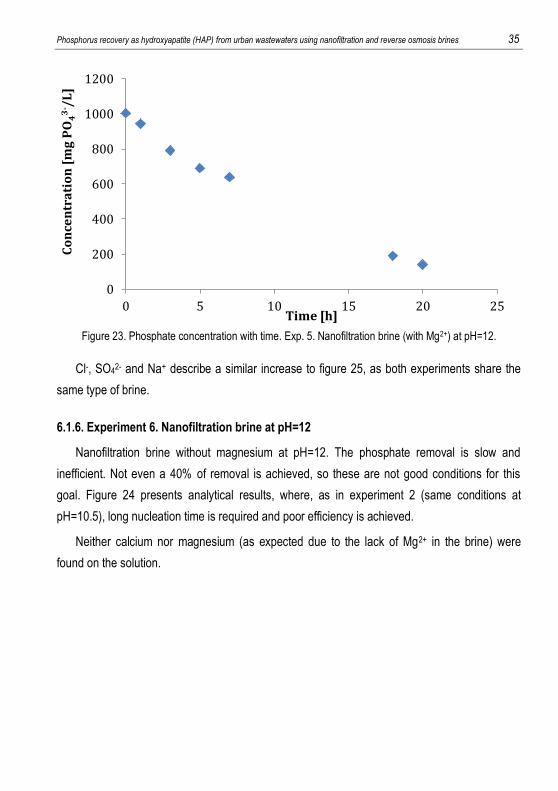
Figure 23. Phosphate concentration with time. Exp. 5. Nanofiltration brine (with Mg2+) at pH=12.
Cl-, SO42- and Na+ describe a similar increase to figure 25, as both experiments share the
same type of brine.
6.1.6. Experiment 6. Nanofiltration brine at pH=12
Nanofiltration brine without magnesium at pH=12. The phosphate removal is slow and
inefficient. Not even a 40% of removal is achieved, so these are not good conditions for this
goal. Figure 24 presents analytical results, where, as in experiment 2 (same conditions at
pH=10.5), long nucleation time is required and poor efficiency is achieved.
Neither calcium nor magnesium (as expected due to the lack of Mg2+ in the brine) were
found on the solution.
0
200
400
600
800
1000
1200
0 5 10 15 20 25
Co
nce
ntr
ati
on
[m
g P
O4
3- /
L]
Time [h]
36 Hidalgo López, Gádor Indra
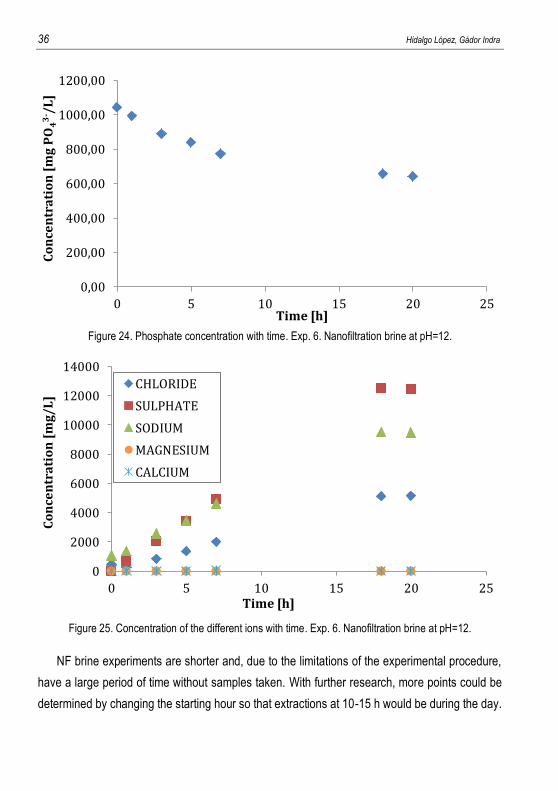
Figure 24. Phosphate concentration with time. Exp. 6. Nanofiltration brine at pH=12.
Figure 25. Concentration of the different ions with time. Exp. 6. Nanofiltration brine at pH=12.
NF brine experiments are shorter and, due to the limitations of the experimental procedure,
have a large period of time without samples taken. With further research, more points could be
determined by changing the starting hour so that extractions at 10-15 h would be during the day.
0,00
200,00
400,00
600,00
800,00
1000,00
1200,00
0 5 10 15 20 25
Co
nce
ntr
ati
on
[m
g P
O4
3- /
L]
Time [h]
0
2000
4000
6000
8000
10000
12000
14000
0 5 10 15 20 25
Co
nce
ntr
ati
on
[m
g/L
]
Time [h]
CHLORIDE
SULPHATE
SODIUM
MAGNESIUM
CALCIUM
Phosphorus recovery as hydroxyapatite (HAP) from urban wastewaters using nanofiltration and reverse osmosis brines 37
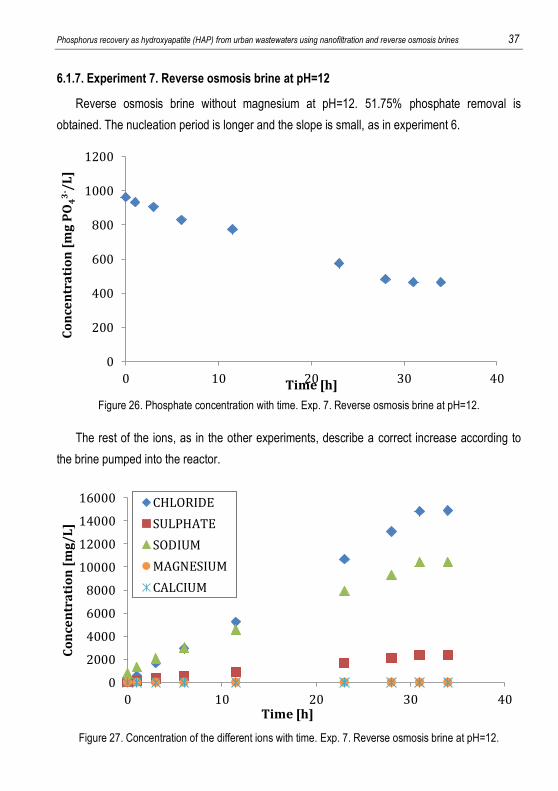
6.1.7. Experiment 7. Reverse osmosis brine at pH=12
Reverse osmosis brine without magnesium at pH=12. 51.75% phosphate removal is
obtained. The nucleation period is longer and the slope is small, as in experiment 6.
Figure 26. Phosphate concentration with time. Exp. 7. Reverse osmosis brine at pH=12.
The rest of the ions, as in the other experiments, describe a correct increase according to
the brine pumped into the reactor.
Figure 27. Concentration of the different ions with time. Exp. 7. Reverse osmosis brine at pH=12.
0
200
400
600
800
1000
1200
0 10 20 30 40
Co
nce
ntr
ati
on
[m
g P
O4
3- /
L]
Time [h]
0
2000
4000
6000
8000
10000
12000
14000
16000
0 10 20 30 40
Co
nce
ntr
ati
on
[m
g/L
]
Time [h]
CHLORIDE
SULPHATE
SODIUM
MAGNESIUM
CALCIUM
38 Hidalgo López, Gádor Indra
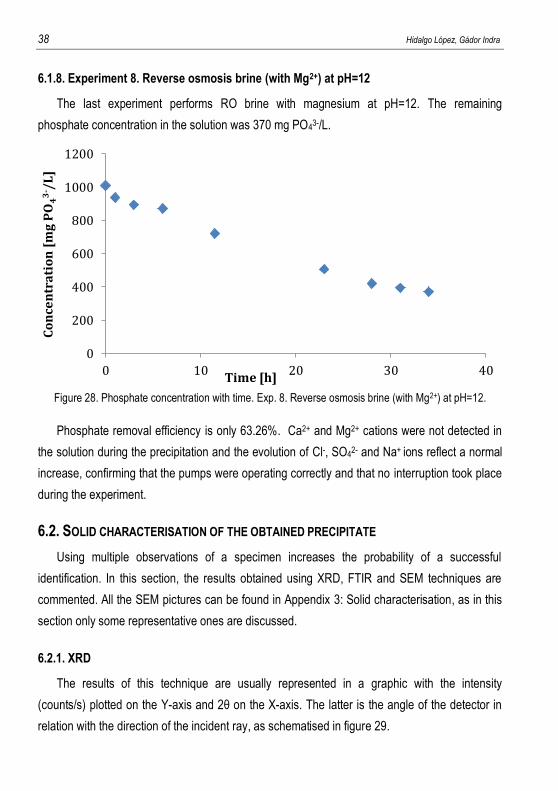
6.1.8. Experiment 8. Reverse osmosis brine (with Mg2+) at pH=12
The last experiment performs RO brine with magnesium at pH=12. The remaining
phosphate concentration in the solution was 370 mg PO43-/L.
Figure 28. Phosphate concentration with time. Exp. 8. Reverse osmosis brine (with Mg2+) at pH=12.
Phosphate removal efficiency is only 63.26%. Ca2+ and Mg2+ cations were not detected in
the solution during the precipitation and the evolution of Cl-, SO42- and Na+ ions reflect a normal
increase, confirming that the pumps were operating correctly and that no interruption took place
during the experiment.
6.2. SOLID CHARACTERISATION OF THE OBTAINED PRECIPITATE
Using multiple observations of a specimen increases the probability of a successful
identification. In this section, the results obtained using XRD, FTIR and SEM techniques are
commented. All the SEM pictures can be found in Appendix 3: Solid characterisation, as in this
section only some representative ones are discussed.
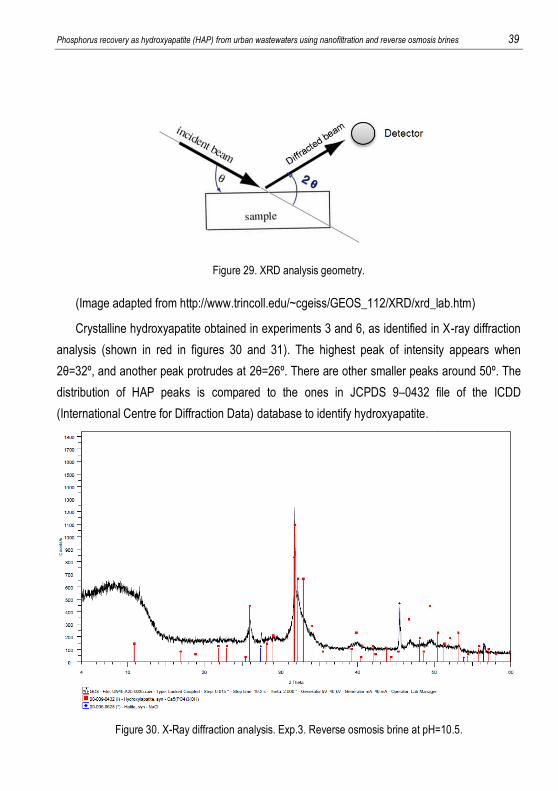
6.2.1. XRD
The results of this technique are usually represented in a graphic with the intensity
(counts/s) plotted on the Y-axis and 2θ on the X-axis. The latter is the angle of the detector in
relation with the direction of the incident ray, as schematised in figure 29.
0
200
400
600
800
1000
1200
0 10 20 30 40
Co
nce
ntr
ati
on
[m
g P
O4
3- /
L]
Time [h]
Phosphorus recovery as hydroxyapatite (HAP) from urban wastewaters using nanofiltration and reverse osmosis brines 39
Figure 29. XRD analysis geometry.
(Image adapted from http://www.trincoll.edu/~cgeiss/GEOS_112/XRD/xrd_lab.htm)
Crystalline hydroxyapatite obtained in experiments 3 and 6, as identified in X-ray diffraction
analysis (shown in red in figures 30 and 31). The highest peak of intensity appears when
2θ=32º, and another peak protrudes at 2θ=26º. There are other smaller peaks around 50º. The
distribution of HAP peaks is compared to the ones in JCPDS 9–0432 file of the ICDD
(International Centre for Diffraction Data) database to identify hydroxyapatite.
Figure 30. X-Ray diffraction analysis. Exp.3. Reverse osmosis brine at pH=10.5.
40 Hidalgo López, Gádor Indra
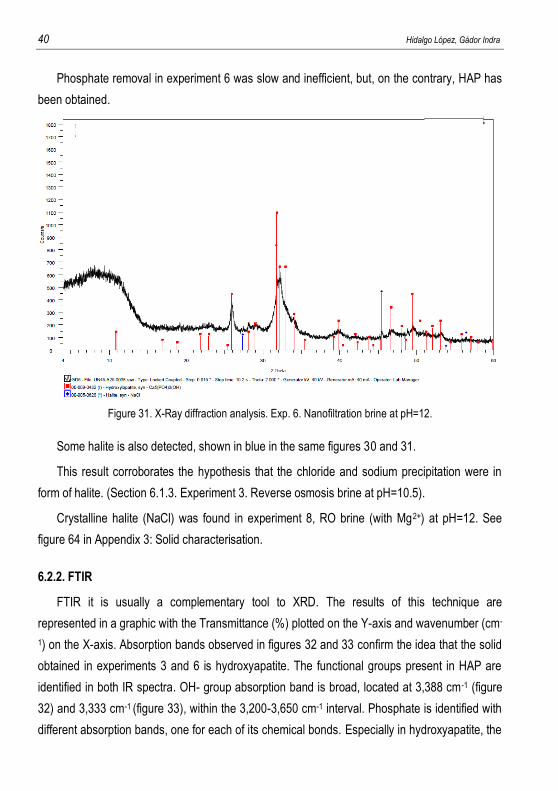
Phosphate removal in experiment 6 was slow and inefficient, but, on the contrary, HAP has
been obtained.
Figure 31. X-Ray diffraction analysis. Exp. 6. Nanofiltration brine at pH=12.
Some halite is also detected, shown in blue in the same figures 30 and 31.
This result corroborates the hypothesis that the chloride and sodium precipitation were in
form of halite. (Section 6.1.3. Experiment 3. Reverse osmosis brine at pH=10.5).
Crystalline halite (NaCl) was found in experiment 8, RO brine (with Mg2+) at pH=12. See
figure 64 in Appendix 3: Solid characterisation.
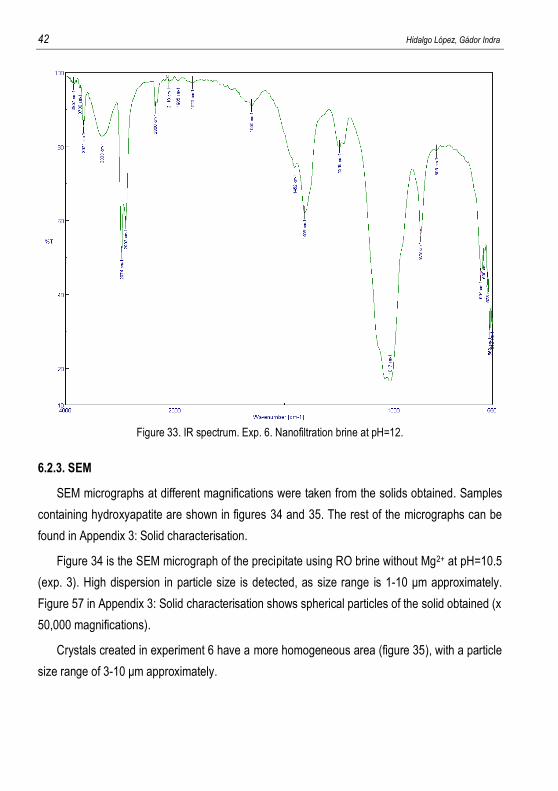
6.2.2. FTIR
FTIR it is usually a complementary tool to XRD. The results of this technique are
represented in a graphic with the Transmittance (%) plotted on the Y-axis and wavenumber (cm-
1) on the X-axis. Absorption bands observed in figures 32 and 33 confirm the idea that the solid
obtained in experiments 3 and 6 is hydroxyapatite. The functional groups present in HAP are
identified in both IR spectra. OH- group absorption band is broad, located at 3,388 cm-1 (figure
32) and 3,333 cm-1 (figure 33), within the 3,200-3,650 cm-1 interval. Phosphate is identified with
different absorption bands, one for each of its chemical bonds. Especially in hydroxyapatite, the
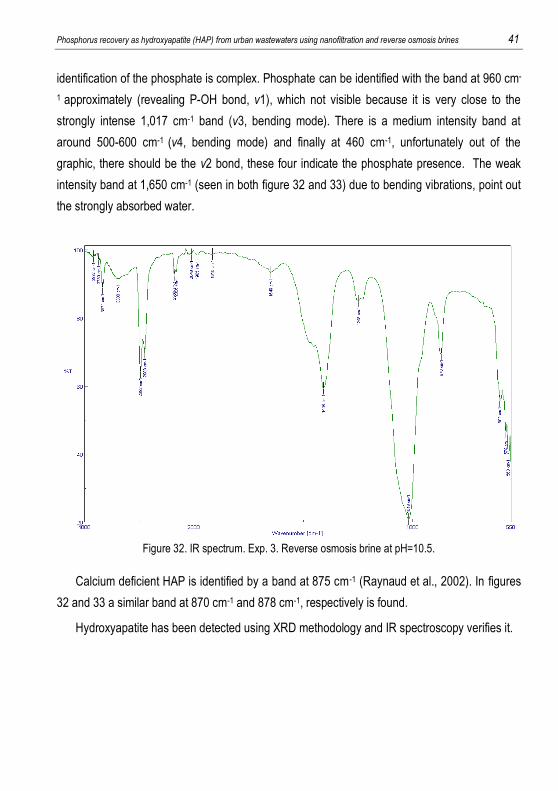
Phosphorus recovery as hydroxyapatite (HAP) from urban wastewaters using nanofiltration and reverse osmosis brines 41
identification of the phosphate is complex. Phosphate can be identified with the band at 960 cm-
1 approximately (revealing P-OH bond, v1), which not visible because it is very close to the
strongly intense 1,017 cm-1 band (v3, bending mode). There is a medium intensity band at
around 500-600 cm-1 (v4, bending mode) and finally at 460 cm-1, unfortunately out of the
graphic, there should be the v2 bond, these four indicate the phosphate presence. The weak
intensity band at 1,650 cm-1 (seen in both figure 32 and 33) due to bending vibrations, point out
the strongly absorbed water.
Figure 32. IR spectrum. Exp. 3. Reverse osmosis brine at pH=10.5.
Calcium deficient HAP is identified by a band at 875 cm-1 (Raynaud et al., 2002). In figures
32 and 33 a similar band at 870 cm-1 and 878 cm-1, respectively is found.
Hydroxyapatite has been detected using XRD methodology and IR spectroscopy verifies it.
42 Hidalgo López, Gádor Indra
Figure 33. IR spectrum. Exp. 6. Nanofiltration brine at pH=12.
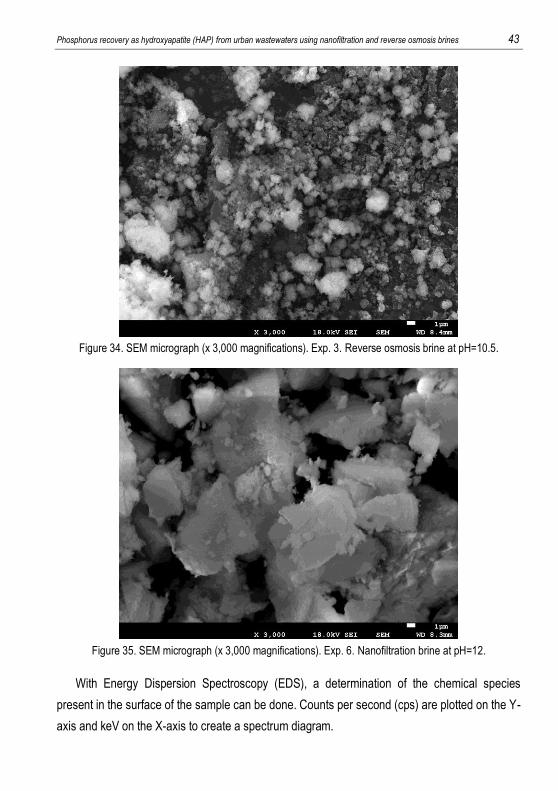
6.2.3. SEM
SEM micrographs at different magnifications were taken from the solids obtained. Samples
containing hydroxyapatite are shown in figures 34 and 35. The rest of the micrographs can be
found in Appendix 3: Solid characterisation.
Figure 34 is the SEM micrograph of the precipitate using RO brine without Mg2+ at pH=10.5
(exp. 3). High dispersion in particle size is detected, as size range is 1-10 μm approximately.
Figure 57 in Appendix 3: Solid characterisation shows spherical particles of the solid obtained (x
50,000 magnifications).
Crystals created in experiment 6 have a more homogeneous area (figure 35), with a particle
size range of 3-10 μm approximately.
Phosphorus recovery as hydroxyapatite (HAP) from urban wastewaters using nanofiltration and reverse osmosis brines 43
Figure 34. SEM micrograph (x 3,000 magnifications). Exp. 3. Reverse osmosis brine at pH=10.5.
Figure 35. SEM micrograph (x 3,000 magnifications). Exp. 6. Nanofiltration brine at pH=12.
With Energy Dispersion Spectroscopy (EDS), a determination of the chemical species
present in the surface of the sample can be done. Counts per second (cps) are plotted on the Y-
axis and keV on the X-axis to create a spectrum diagram.
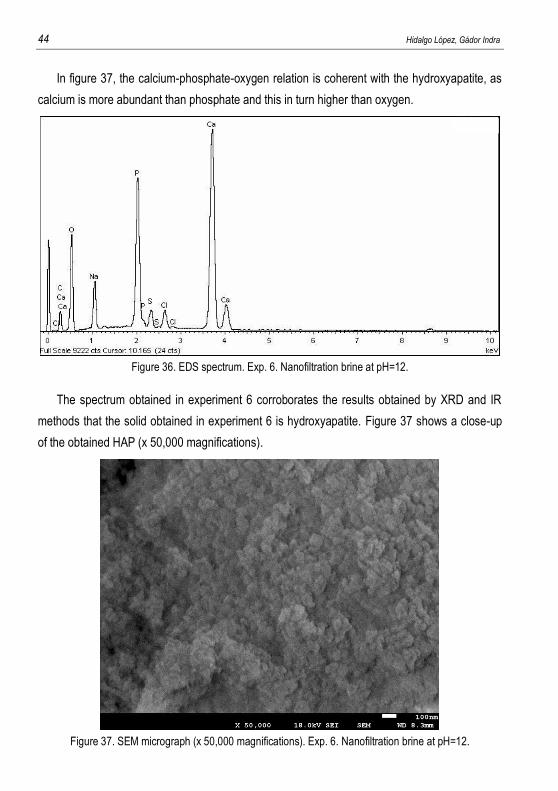
44 Hidalgo López, Gádor Indra
In figure 37, the calcium-phosphate-oxygen relation is coherent with the hydroxyapatite, as
calcium is more abundant than phosphate and this in turn higher than oxygen.
Figure 36. EDS spectrum. Exp. 6. Nanofiltration brine at pH=12.
The spectrum obtained in experiment 6 corroborates the results obtained by XRD and IR
methods that the solid obtained in experiment 6 is hydroxyapatite. Figure 37 shows a close-up
of the obtained HAP (x 50,000 magnifications).
Figure 37. SEM micrograph (x 50,000 magnifications). Exp. 6. Nanofiltration brine at pH=12.
Phosphorus recovery as hydroxyapatite (HAP) from urban wastewaters using nanofiltration and reverse osmosis brines 45
EDS semi-quantitative determination of the elemental composition in the surface of the
solids obtained confirms the presence of Cl, S, O, C, Na, P and Ca in all the solids. Mg only
detected in experiments 1, 4, 5 and 8, supporting the idea of the precipitation of the ions added
with the brine, and justifying the difference between the concentration in the solution if it were no
reaction and the experimental concentrations in the extracted samples.
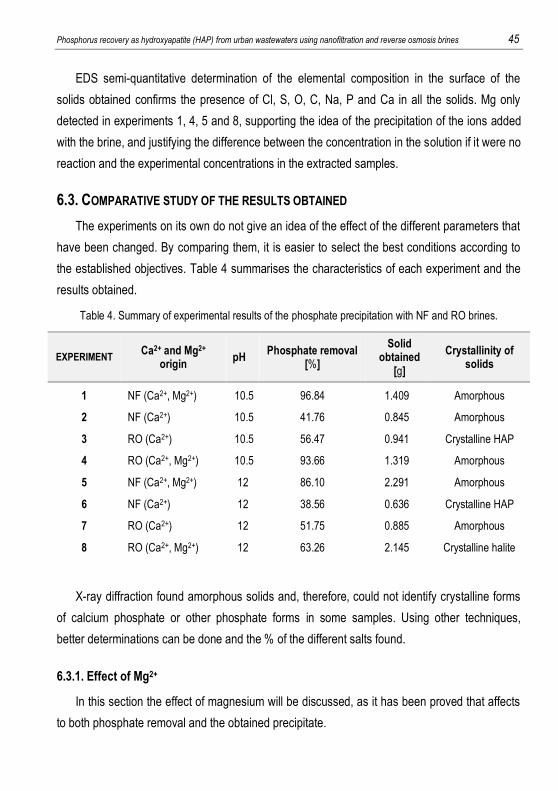
6.3. COMPARATIVE STUDY OF THE RESULTS OBTAINED
The experiments on its own do not give an idea of the effect of the different parameters that
have been changed. By comparing them, it is easier to select the best conditions according to
the established objectives. Table 4 summarises the characteristics of each experiment and the
results obtained.
Table 4. Summary of experimental results of the phosphate precipitation with NF and RO brines.
EXPERIMENT Ca2+ and Mg2+
origin pH
Phosphate removal [%]
Solid obtained
[g]
Crystallinity of solids
1 NF (Ca2+, Mg2+) 10.5 96.84 1.409 Amorphous
2 NF (Ca2+) 10.5 41.76 0.845 Amorphous
3 RO (Ca2+) 10.5 56.47 0.941 Crystalline HAP
4 RO (Ca2+, Mg2+) 10.5 93.66 1.319 Amorphous
5 NF (Ca2+, Mg2+) 12 86.10 2.291 Amorphous
6 NF (Ca2+) 12 38.56 0.636 Crystalline HAP
7 RO (Ca2+) 12 51.75 0.885 Amorphous
8 RO (Ca2+, Mg2+) 12 63.26 2.145 Crystalline halite
X-ray diffraction found amorphous solids and, therefore, could not identify crystalline forms
of calcium phosphate or other phosphate forms in some samples. Using other techniques,
better determinations can be done and the % of the different salts found.
6.3.1. Effect of Mg2+
In this section the effect of magnesium will be discussed, as it has been proved that affects
to both phosphate removal and the obtained precipitate.
46 Hidalgo López, Gádor Indra
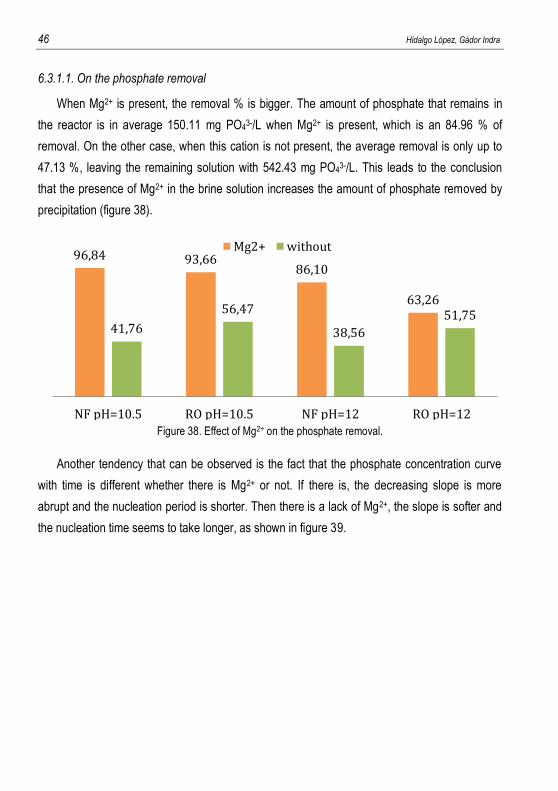
6.3.1.1. On the phosphate removal
When Mg2+ is present, the removal % is bigger. The amount of phosphate that remains in
the reactor is in average 150.11 mg PO43-/L when Mg2+ is present, which is an 84.96 % of
removal. On the other case, when this cation is not present, the average removal is only up to
47.13 %, leaving the remaining solution with 542.43 mg PO43-/L. This leads to the conclusion
that the presence of Mg2+ in the brine solution increases the amount of phosphate removed by
precipitation (figure 38).
Figure 38. Effect of Mg2+ on the phosphate removal.
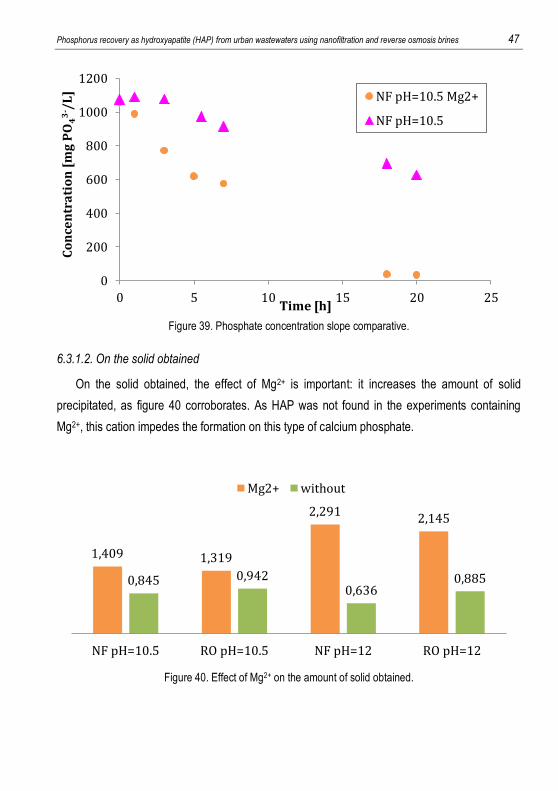
Another tendency that can be observed is the fact that the phosphate concentration curve
with time is different whether there is Mg2+ or not. If there is, the decreasing slope is more
abrupt and the nucleation period is shorter. Then there is a lack of Mg2+, the slope is softer and
the nucleation time seems to take longer, as shown in figure 39.
96,84 93,66 86,10
63,26
41,76
56,47
38,56
51,75
NF pH=10.5 RO pH=10.5 NF pH=12 RO pH=12
Mg2+ without
Phosphorus recovery as hydroxyapatite (HAP) from urban wastewaters using nanofiltration and reverse osmosis brines 47
Figure 39. Phosphate concentration slope comparative.
6.3.1.2. On the solid obtained
On the solid obtained, the effect of Mg2+ is important: it increases the amount of solid
precipitated, as figure 40 corroborates. As HAP was not found in the experiments containing
Mg2+, this cation impedes the formation on this type of calcium phosphate.
Figure 40. Effect of Mg2+ on the amount of solid obtained.
0
200
400
600
800
1000
1200
0 5 10 15 20 25
Co
nce
ntr
ati
on
[m
g P
O4
3- /
L]
Time [h]
NF pH=10.5 Mg2+
NF pH=10.5
1,409 1,319
2,291 2,145
0,845 0,942 0,636
0,885
NF pH=10.5 RO pH=10.5 NF pH=12 RO pH=12
Mg2+ without
48 Hidalgo López, Gádor Indra
6.3.2. Effect of pH
The alkalinity of the solution is important as is affects directly to the behaviour of the
different species in the system studied.
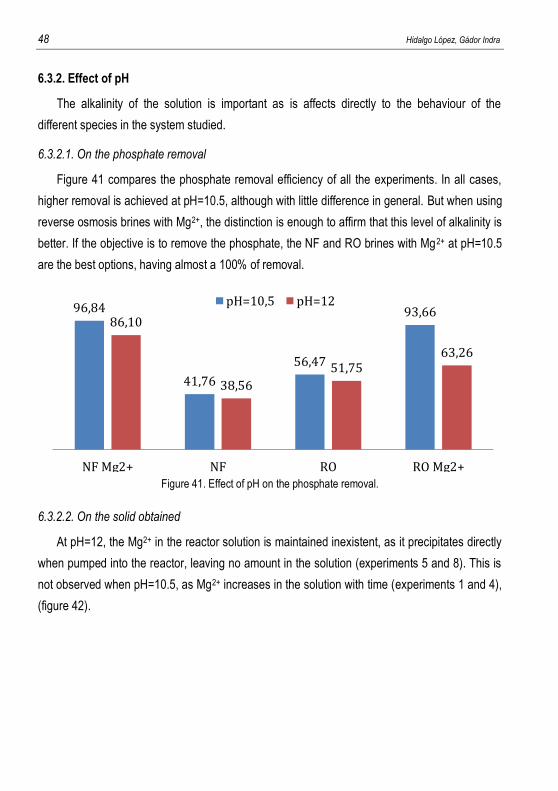
6.3.2.1. On the phosphate removal
Figure 41 compares the phosphate removal efficiency of all the experiments. In all cases,
higher removal is achieved at pH=10.5, although with little difference in general. But when using
reverse osmosis brines with Mg2+, the distinction is enough to affirm that this level of alkalinity is
better. If the objective is to remove the phosphate, the NF and RO brines with Mg2+ at pH=10.5
are the best options, having almost a 100% of removal.
Figure 41. Effect of pH on the phosphate removal.
6.3.2.2. On the solid obtained
At pH=12, the Mg2+ in the reactor solution is maintained inexistent, as it precipitates directly
when pumped into the reactor, leaving no amount in the solution (experiments 5 and 8). This is
not observed when pH=10.5, as Mg2+ increases in the solution with time (experiments 1 and 4),
(figure 42).
96,84
41,76
56,47
93,66 86,10
38,56
51,75 63,26
NF Mg2+ NF RO RO Mg2+
pH=10,5 pH=12
Phosphorus recovery as hydroxyapatite (HAP) from urban wastewaters using nanofiltration and reverse osmosis brines 49
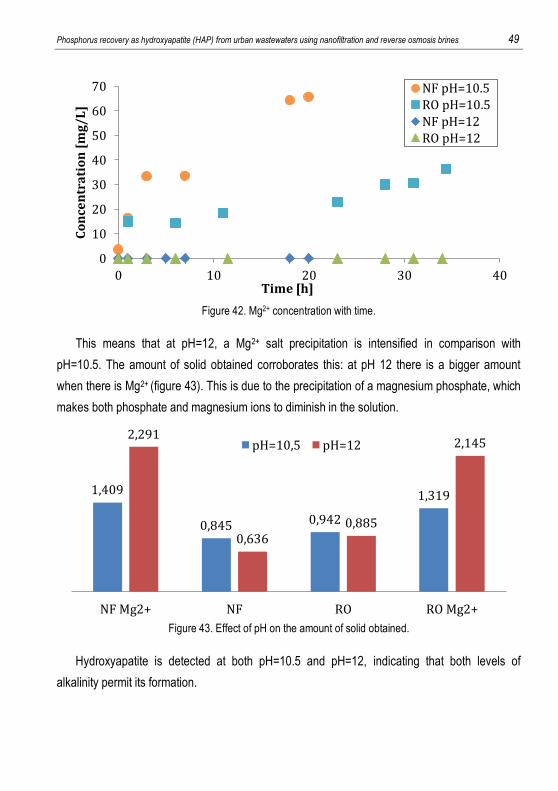
Figure 42. Mg2+ concentration with time.
This means that at pH=12, a Mg2+ salt precipitation is intensified in comparison with
pH=10.5. The amount of solid obtained corroborates this: at pH 12 there is a bigger amount
when there is Mg2+ (figure 43). This is due to the precipitation of a magnesium phosphate, which
makes both phosphate and magnesium ions to diminish in the solution.
Figure 43. Effect of pH on the amount of solid obtained.
Hydroxyapatite is detected at both pH=10.5 and pH=12, indicating that both levels of
alkalinity permit its formation.
0
10
20
30
40
50
60
70
0 10 20 30 40
Co
nce
ntr
ati
on
[m
g/L
]
Time [h]
NF pH=10.5
RO pH=10.5
NF pH=12RO pH=12
1,409
0,845 0,942
1,319
2,291
0,636 0,885
2,145
NF Mg2+ NF RO RO Mg2+
pH=10,5 pH=12
50 Hidalgo López, Gádor Indra
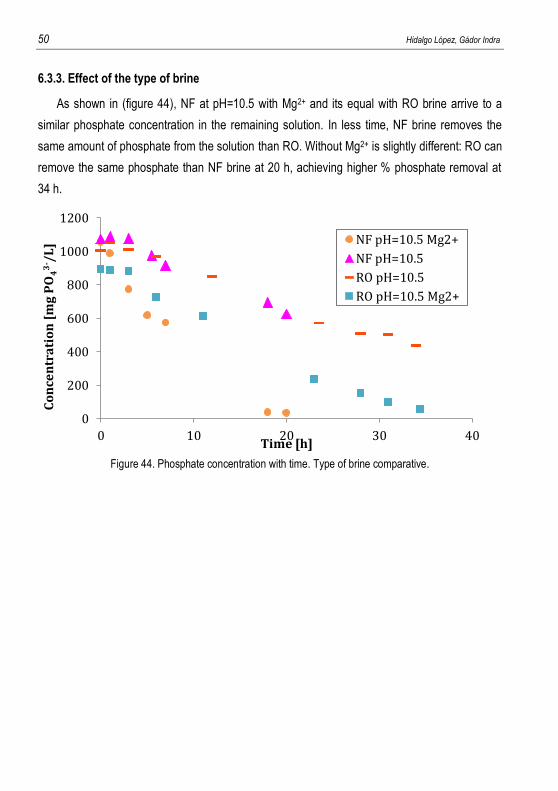
6.3.3. Effect of the type of brine
As shown in (figure 44), NF at pH=10.5 with Mg2+ and its equal with RO brine arrive to a
similar phosphate concentration in the remaining solution. In less time, NF brine removes the
same amount of phosphate from the solution than RO. Without Mg2+ is slightly different: RO can
remove the same phosphate than NF brine at 20 h, achieving higher % phosphate removal at
34 h.
Figure 44. Phosphate concentration with time. Type of brine comparative.
0
200
400
600
800
1000
1200
0 10 20 30 40
Co
nce
ntr
ati
on
[m
g P
O4
3- /
L]
Time [h]
NF pH=10.5 Mg2+
NF pH=10.5
RO pH=10.5
RO pH=10.5 Mg2+
Phosphorus recovery as hydroxyapatite (HAP) from urban wastewaters using nanofiltration and reverse osmosis brines 51
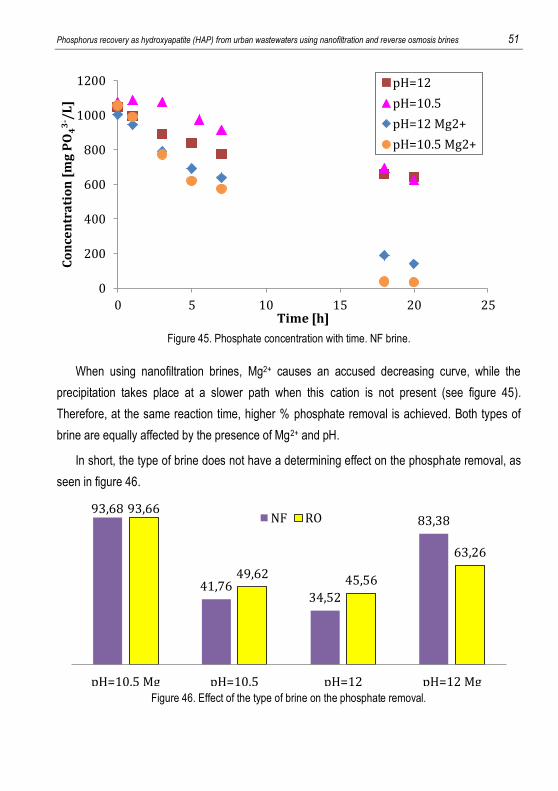
Figure 45. Phosphate concentration with time. NF brine.
When using nanofiltration brines, Mg2+ causes an accused decreasing curve, while the
precipitation takes place at a slower path when this cation is not present (see figure 45).
Therefore, at the same reaction time, higher % phosphate removal is achieved. Both types of
brine are equally affected by the presence of Mg2+ and pH.
In short, the type of brine does not have a determining effect on the phosphate removal, as
seen in figure 46.
Figure 46. Effect of the type of brine on the phosphate removal.
0
200
400
600
800
1000
1200
0 5 10 15 20 25
Co
nce
ntr
ati
on
[m
g P
O4
3- /
L]
Time [h]
pH=12
pH=10.5
pH=12 Mg2+
pH=10.5 Mg2+
93,68
41,76 34,52
83,38 93,66
49,62 45,56
63,26
pH=10.5 Mg pH=10.5 pH=12 pH=12 Mg
NF RO
52 Hidalgo López, Gádor Indra
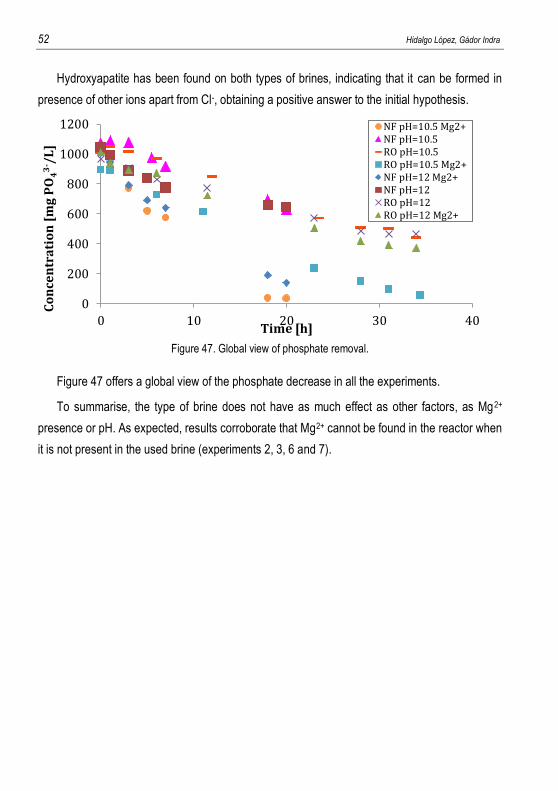
Hydroxyapatite has been found on both types of brines, indicating that it can be formed in
presence of other ions apart from Cl-, obtaining a positive answer to the initial hypothesis.
Figure 47. Global view of phosphate removal.
Figure 47 offers a global view of the phosphate decrease in all the experiments.
To summarise, the type of brine does not have as much effect as other factors, as Mg2+
presence or pH. As expected, results corroborate that Mg2+ cannot be found in the reactor when
it is not present in the used brine (experiments 2, 3, 6 and 7).
0
200
400
600
800
1000
1200
0 10 20 30 40
Co
nce
ntr
ati
on
[m
g P
O4
3- /
L]
Time [h]
NF pH=10.5 Mg2+NF pH=10.5RO pH=10.5RO pH=10.5 Mg2+NF pH=12 Mg2+NF pH=12RO pH=12RO pH=12 Mg2+
Phosphorus recovery as hydroxyapatite (HAP) from urban wastewaters using nanofiltration and reverse osmosis brines 53
7. CONCLUSIONS AND RECOMMENDATIONS
Phosphate removal was achieved by continuous chemical precipitation using a stirred batch
reactor. The effects of certain parameters have been successfully determined, as well as the
best conditions to obtain hydroxyapatite.
The presence of Mg2+ in the brine solution increases the amount of phosphate removed by
precipitation, as well as the amount of solid obtained, as magnesium phosphate precipitates.
Magnesium also affects the way phosphate is removed from the solution. The nucleation period
is longer, and the concentration slope less abrupt when operating without magnesium.
In all four types of brines, higher removal is obtained at pH=10.5. The type of brine does not
have as much effect as other factors such as the presence of Mg2+ or pH. In less time, NF brine
removes the same amount of phosphate from the solution than RO brine when there is Mg2+.
If the objective is to remove phosphate, the NF and RO brines with Mg2+ at pH=10.5 are the
best options, representing almost a 100 % of removal.
Analyses conducted on solids have found the presence of spherical hydroxyapatite particles
when using brines without magnesium, proving the hypothesis that HAP can be obtained in the
presence of SO42-, Na+ and Cl-. Slow and inefficient phosphate removal results in the formation
of hydroxyapatite.
In conclusion, hydroxyapatite has been found at the two studied pH using both nanofiltration
and reverse osmosis brines without magnesium.
Further studies could use real nanofiltration and reverse osmosis brines to check if it is
possible to obtain a fertiliser by the precipitation of calcium phosphate. The phosphate source
could be a synthetic solution as well but more diluted to simulate a less concentrated
regenerated stream from the ion exchange unit. Investment on better and newer techniques for
the determination of the solid obtained should allow the complete determination of the
substances that form the precipitate.

Phosphorus recovery as hydroxyapatite (HAP) from urban wastewaters using nanofiltration and reverse osmosis brines 55
8. REFERENCES AND NOTES Bridger, G.L.; Salutsky, M.L., Starostka, R.W. (1962). Metal Ammonium Phosphates as Fertilizers, Journal
of Agricultural and Food Chemistry, Vol.10 (3), pp.181-188. Carpenter, S.R.; Caraco, N.F.; Smith, V.H. (1998). Nonpoint pollution of surface waters with phosphorus
and nitrogen. Ecological Applications, Vol. 8, pp. 559–568. Cordell, D.; Drangert, J.-O.; White, S. (2009). The story of phosphorus: global food security and food for
thought. Global Environmental Change, Vol.19, pp. 292-305. Donnert, D.; Salecker, M. (1999). Elimination of phosphorus from municipal and industrial waste water.
Water Science and Technology, Vol. 40, pp. 195–202. Fixen, P.E. (2009). World fertilizer nutrient reserves–a view to the future. Better Crops With Plant Food,
Vol. 93, pp. 8-11. Forster, C. (2003). Waste water treatment and technology. Thomas Telfort Publishing. ISBN 0-7277-3229-
3. Goloshchapov,D.L.; Kashkarov, V.M.; Rumyantseva, N.A.; Seredinn P.V.; Lenshin, A.S.; Agapov, B.L.;
Domashevskaya, E.P. (2013). Synthesis of nanocrystalline hydroxyapatite by precipitation using hen’s eggshell. Ceramics International, Vol. 39, pp. 4539–4549.
Greenwood, N.; Earnshaw, A. (1997). Chemistry of the Elements. Oxford:Butterworth-Heinemann (2nd Edn.) ISBN 0-7506-3365-4.
Kirkpatrick, B.; Fleming, L:E.; Squicciarini, D.; Backer, L.C.; Clark, R.; Abraham, W.; Benson, J.; Cheng, Y.S.; Johnson, D.; Pierce, R.; Zaias, J.; Bossart, G.D.; Baden, D.G. (2004). Literature Review of Florida Red Tide: Implications for Human Health Effects. Harmful Algae, Vol. 3, pp. 99-115.
Mobasherpour, I.; Soulati Heshajin, M.; Kazemzadeha, A.; Zakeri, M. (2007). Synthesis of nanocrystalline hydroxyapatite by using precipitation method. Journal of Alloys and Compounds, Vol. 430, pp. 330–333.
Ott, C.; Rechberger, H. (2012). The European phosphorus balance. Resources, Conservation and Recycling, Vol. 60, pp. 159–172.
Raynaud, S.; Champion E.; Bernache-Assollant, D.; Thomas P. (2002). Calcium phosphate apatite with variable Ca/P atomic ratio I. Synthesis, characterisation and thermal stability of powders. Biomaterials, Vol. 23, pp. 1065–1072.
Redfield, A.C. (1958). The biological control of chemical factors in the environment. American Scientist, Vol. 46, pp. 205–222.
Rivera-Muñoz, E.M.; Velázquez-Castillo, R.; Huirache-Acuña, R.; Cabrera-Torres, J.L.; Arenas-Alatorre, J. (2012). Synthesis and Characterization of Hydroxyapatite-Based Nanostructures: Nanoparticles, Nanoplates, Nanofibers and Nanoribbons. Materials Science Forum, Vol. 706 - 709, pp. 589-594.
Smit, A.L.; Bindraban, P.S.; Schroder, J.J.; Conijn, J.G.; van der Meer, H.G. (2009). Phosphorus in agriculture: global resources, trends and developments. Plant Research International, Waginen, The Netherlands. Report 282.
Wang, L.; Nancollas G.H. (2008). Calcium Orthophosphates: Crystallization and Dissolution. Chemical Reviews, Vol.108 (11), pp. 4628–69.
Wendling. L.A.; Blomberg, P.; Sarlin, T.; Priha, O.; Arnold, M. (2013). Phosphorus sorption and recovery using mineral-based materials: Sorption mechanisms and potential phytoavailability. Applied Geochemistry, Vol. 37, pp. 157-169.

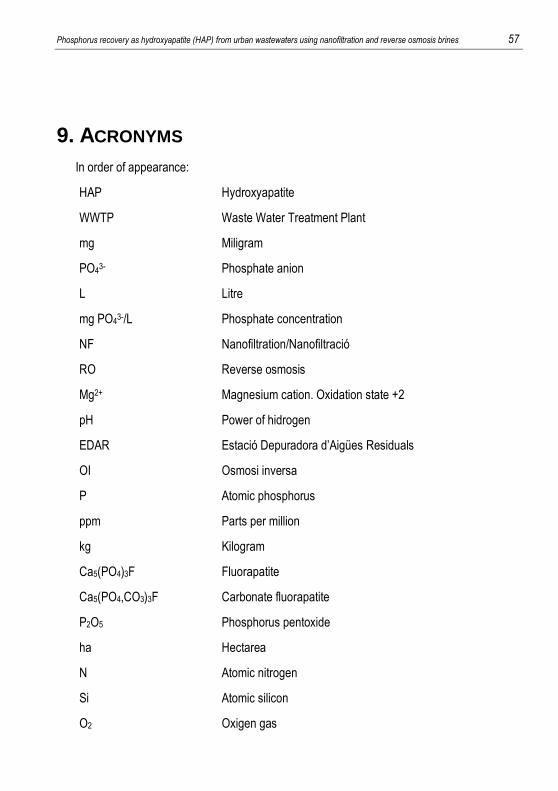
Phosphorus recovery as hydroxyapatite (HAP) from urban wastewaters using nanofiltration and reverse osmosis brines 57
9. ACRONYMS
In order of appearance:
HAP Hydroxyapatite
WWTP Waste Water Treatment Plant
mg Miligram
PO43- Phosphate anion
L Litre
mg PO43-/L Phosphate concentration
NF Nanofiltration/Nanofiltració
RO Reverse osmosis
Mg2+ Magnesium cation. Oxidation state +2
pH Power of hidrogen
EDAR Estació Depuradora d’Aigües Residuals
OI Osmosi inversa
P Atomic phosphorus
ppm Parts per million
kg Kilogram
Ca5(PO4)3F Fluorapatite
Ca5(PO4,CO3)3F Carbonate fluorapatite
P2O5 Phosphorus pentoxide
ha Hectarea
N Atomic nitrogen
Si Atomic silicon
O2 Oxigen gas
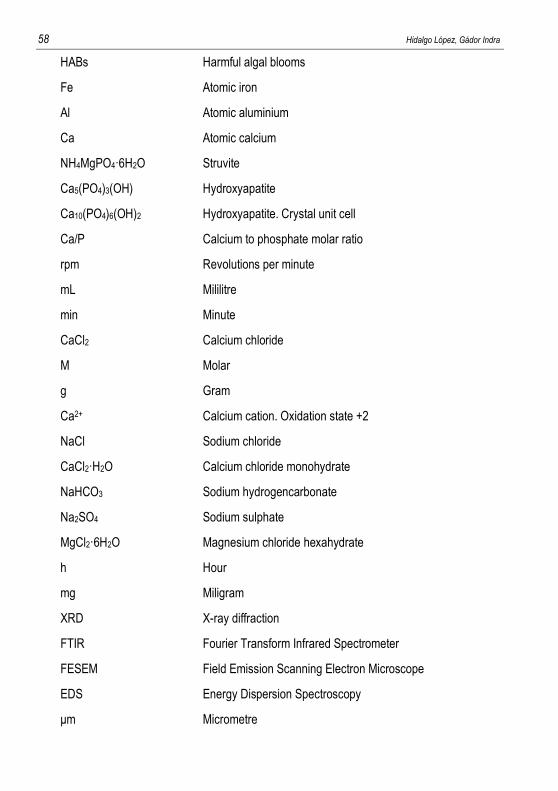
58 Hidalgo López, Gádor Indra
HABs Harmful algal blooms
Fe Atomic iron
Al Atomic aluminium
Ca Atomic calcium
NH4MgPO4·6H2O Struvite
Ca5(PO4)3(OH) Hydroxyapatite
Ca10(PO4)6(OH)2 Hydroxyapatite. Crystal unit cell
Ca/P Calcium to phosphate molar ratio
rpm Revolutions per minute
mL Mililitre
min Minute
CaCl2 Calcium chloride
M Molar
g Gram
Ca2+ Calcium cation. Oxidation state +2
NaCl Sodium chloride
CaCl2·H2O Calcium chloride monohydrate
NaHCO3 Sodium hydrogencarbonate
Na2SO4 Sodium sulphate
MgCl2·6H2O Magnesium chloride hexahydrate
h Hour
mg Miligram
XRD X-ray diffraction
FTIR Fourier Transform Infrared Spectrometer
FESEM Field Emission Scanning Electron Microscope
EDS Energy Dispersion Spectroscopy
μm Micrometre
Phosphorus recovery as hydroxyapatite (HAP) from urban wastewaters using nanofiltration and reverse osmosis brines 59
UV Ultraviolet
nm Nanometre
MSA Methanesulphonic acid
ºC Degree Celsius
Na+ Sodium cation
Cl- Chloride anion
SO42- Sulphate anion
IR Infrared
Pa Pascal
BET Brunauer-Emmett Teller
DLS Dynamic Laser Scattering
DSC Differential Scanning Calorimetry
Exp. Experiment
cps Intensity in counts/s
θ Theta angle
º Degree
ICDD International Centre for Diffraction Data
cm-1 Wavenumber
keV KiloelectronVolts
S Atomic sulphur
O Atomic oxigen
C Atomic carbon
NaH2PO4·H2O Sodium dihydrogen phosphate
NH4VO3 Ammonium metavanadate
(NH4)6Mo7O24·4H2O ammonium molybdate
HCl hydrochloric acid
Na2CO3 Sodium carbonate


Phosphorus recovery as hydroxyapatite (HAP) from urban wastewaters using nanofiltration and reverse osmosis brines 61
APPENDICES

Phosphorus recovery as hydroxyapatite (HAP) from urban wastewaters using nanofiltration and reverse osmosis brines 63
APPENDIX 1: PREPARATION OF SOLUTIONS
In this appendix the methodology used for the preparation of different solutions in detailed.
10,000 ppm phosphate “mother” solution.
14.525 g of NaH2PO4·H2O are weighted in an analytical balance and dissolved in a 1 L
volumetric flask with distilled water.
1,000 ppm phosphate solution.
25 mL and 50 mL volumetric flasks are filled with 10,000 ppm phosphate solution. Then, the
25 mL one is poured into a 250 mL one and filled with distilled water, and the same procedure
with the 50 mL one into a 500 mL volumetric flask. At this point 750 mL of 1,000 ppm phosphate
solution are prepared.
Vanadate-molybdate reagent. (According to Standard Methods for the determination of
inorganic non-metals, 4500-P PHOSPHORUS, approved by Standard Methods Committee,
1999).
Two solutions must be prepared separately, named A and B. Solution B is to be prepared
first. 1.25 g ammonium metavanadate NH4VO3 are dissolved in 300 mL distilled water contained
in a 500 mL beaker by heating to boiling using a combined hot-plate magnetic-stirrer device.
Once it is dissolved, the solution must be left to cool to room temperature. While this takes
place, solution A is prepared dissolving 25 g of ammonium molybdate (NH4)6Mo7O24·4H2O in
300 mL distilled water, using a 500 mL beaker and a magnetic stirrer device. When solution B is
cold, it is poured into a 1 L volumetric flask, and then added 330 mL of 37% hydrochloric acid
HCl, working inside the fume cupboard. The 330 mL are measured using 100 mL, 25 mL and 5
mL volumetric flasks. The solution B is let to cool again, still inside the fume cupboard, and then
solution A is poured into the 1 L volumetric flask where solution B is. Distilled water is added
until 1 L is achieved and then mixed to guarantee homogeneity.
Chromatography eluents.
A cationic eluent and an anionic eluent are prepared to operate the chromatograph. To
prepare the cationic eluent: dilute 3.9 mL of methanesulfonic acid into 2 L of distilled water using

64 Hidalgo López, Gádor Indra
a volumetric flask. To prepare the anionic eluent: dissolve 0.954 g of Na2CO3 in distilled water
and then add 0.134 g of NaHCO3 dissolve with distilled water in a 2 L volumetric flask.
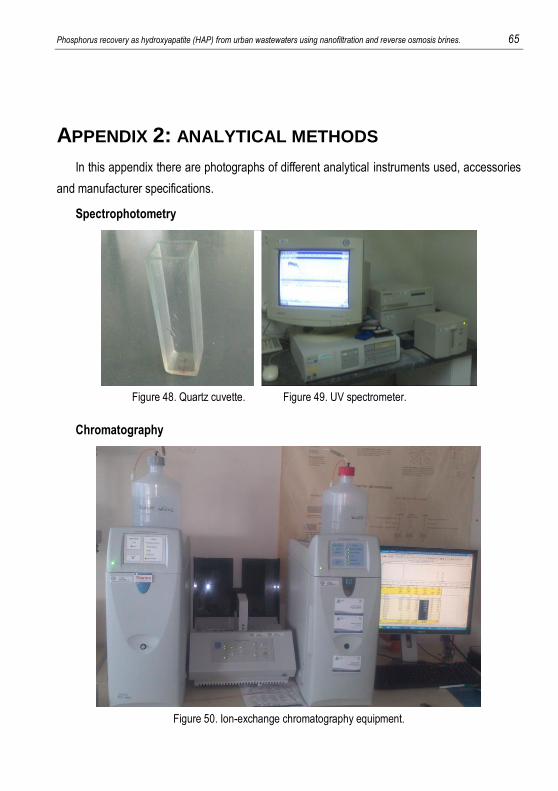
Phosphorus recovery as hydroxyapatite (HAP) from urban wastewaters using nanofiltration and reverse osmosis brines. 65
APPENDIX 2: ANALYTICAL METHODS
In this appendix there are photographs of different analytical instruments used, accessories
and manufacturer specifications.
Spectrophotometry
Figure 48. Quartz cuvette. Figure 49. UV spectrometer.
Chromatography
Figure 50. Ion-exchange chromatography equipment.
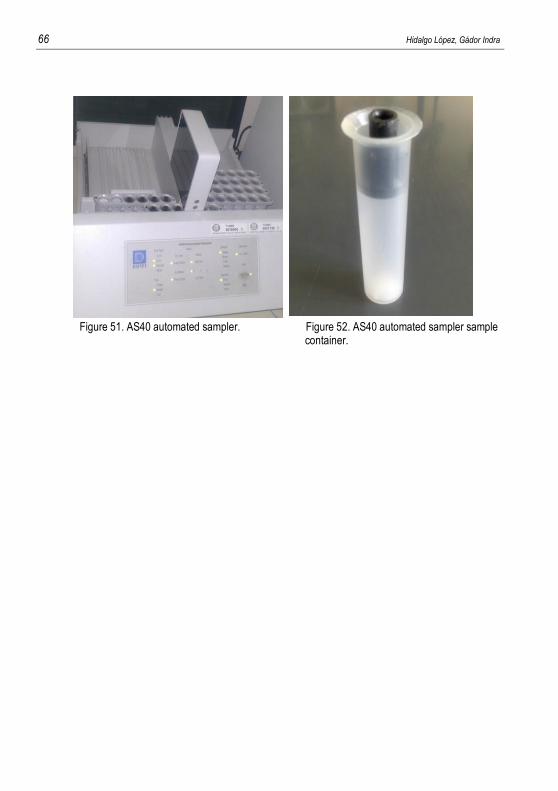
66 Hidalgo López, Gádor Indra
Figure 51. AS40 automated sampler. Figure 52. AS40 automated sampler sample
container.
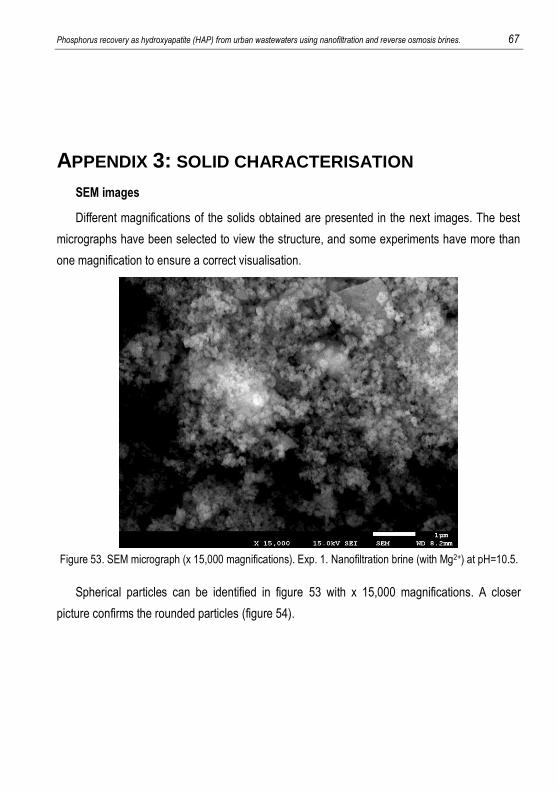
Phosphorus recovery as hydroxyapatite (HAP) from urban wastewaters using nanofiltration and reverse osmosis brines. 67
APPENDIX 3: SOLID CHARACTERISATION
SEM images
Different magnifications of the solids obtained are presented in the next images. The best
micrographs have been selected to view the structure, and some experiments have more than
one magnification to ensure a correct visualisation.
Figure 53. SEM micrograph (x 15,000 magnifications). Exp. 1. Nanofiltration brine (with Mg2+) at pH=10.5.
Spherical particles can be identified in figure 53 with x 15,000 magnifications. A closer
picture confirms the rounded particles (figure 54).
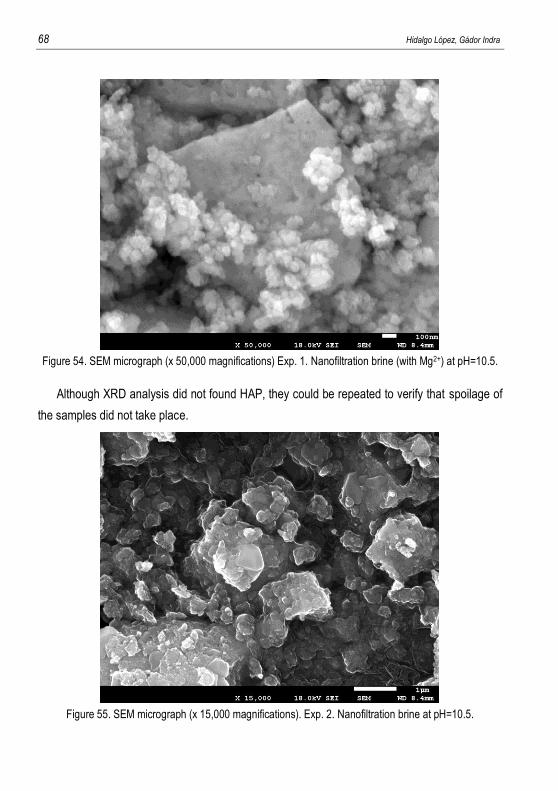
68 Hidalgo López, Gádor Indra
Figure 54. SEM micrograph (x 50,000 magnifications) Exp. 1. Nanofiltration brine (with Mg2+) at pH=10.5.
Although XRD analysis did not found HAP, they could be repeated to verify that spoilage of
the samples did not take place.
Figure 55. SEM micrograph (x 15,000 magnifications). Exp. 2. Nanofiltration brine at pH=10.5.
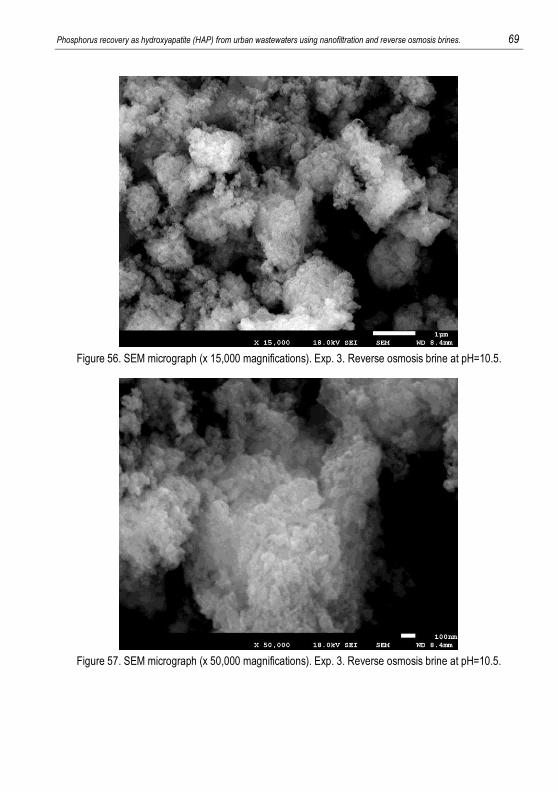
Phosphorus recovery as hydroxyapatite (HAP) from urban wastewaters using nanofiltration and reverse osmosis brines. 69
Figure 56. SEM micrograph (x 15,000 magnifications). Exp. 3. Reverse osmosis brine at pH=10.5.
Figure 57. SEM micrograph (x 50,000 magnifications). Exp. 3. Reverse osmosis brine at pH=10.5.
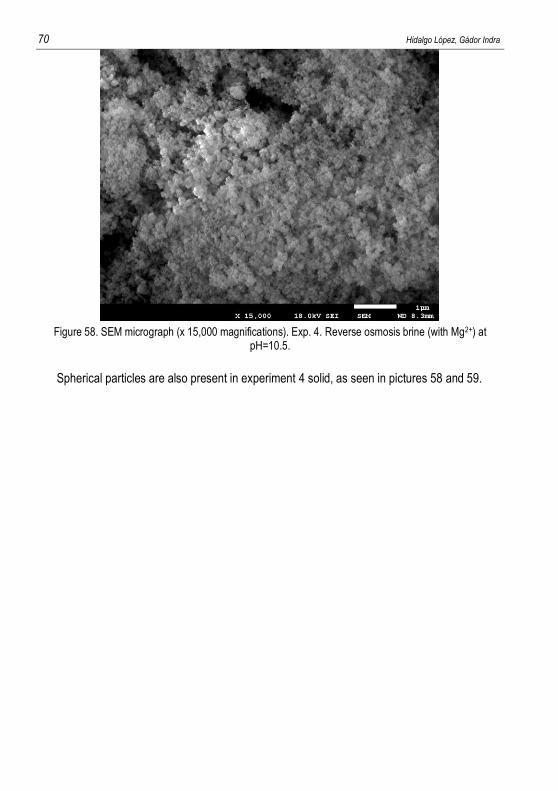
70 Hidalgo López, Gádor Indra
Figure 58. SEM micrograph (x 15,000 magnifications). Exp. 4. Reverse osmosis brine (with Mg2+) at
pH=10.5.
Spherical particles are also present in experiment 4 solid, as seen in pictures 58 and 59.
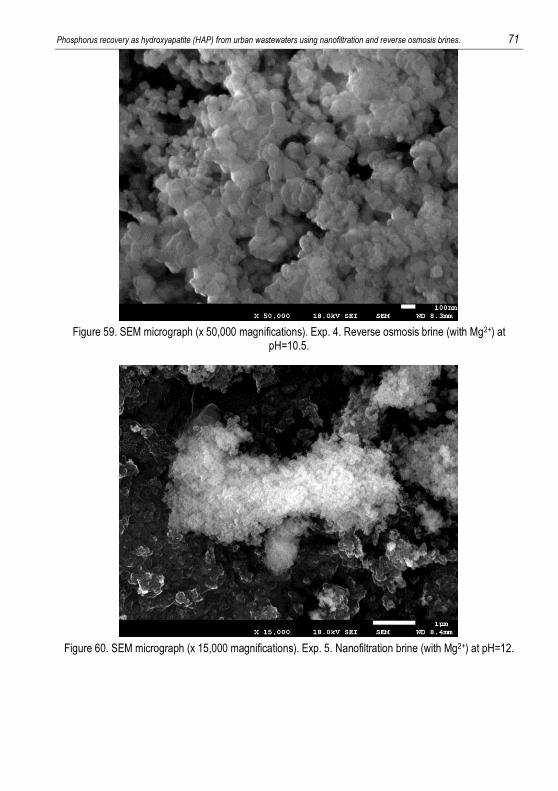
Phosphorus recovery as hydroxyapatite (HAP) from urban wastewaters using nanofiltration and reverse osmosis brines. 71
Figure 59. SEM micrograph (x 50,000 magnifications). Exp. 4. Reverse osmosis brine (with Mg2+) at
pH=10.5.
Figure 60. SEM micrograph (x 15,000 magnifications). Exp. 5. Nanofiltration brine (with Mg2+) at pH=12.
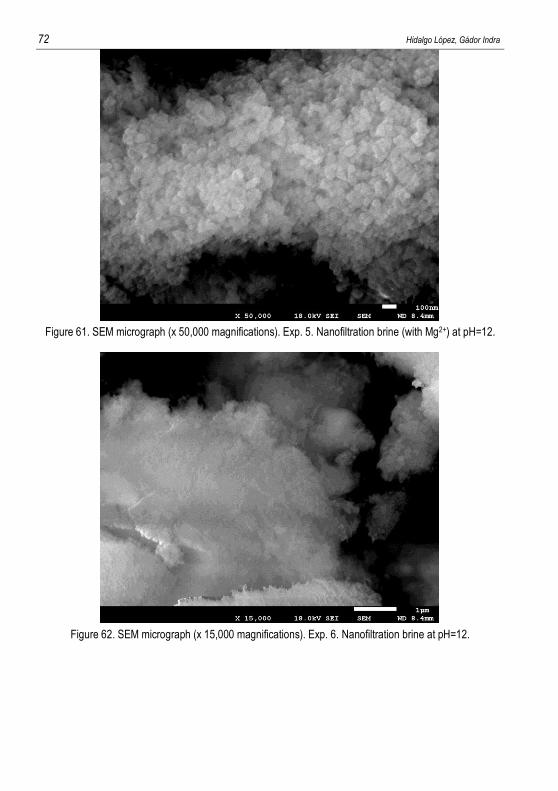
72 Hidalgo López, Gádor Indra
Figure 61. SEM micrograph (x 50,000 magnifications). Exp. 5. Nanofiltration brine (with Mg2+) at pH=12.
Figure 62. SEM micrograph (x 15,000 magnifications). Exp. 6. Nanofiltration brine at pH=12.
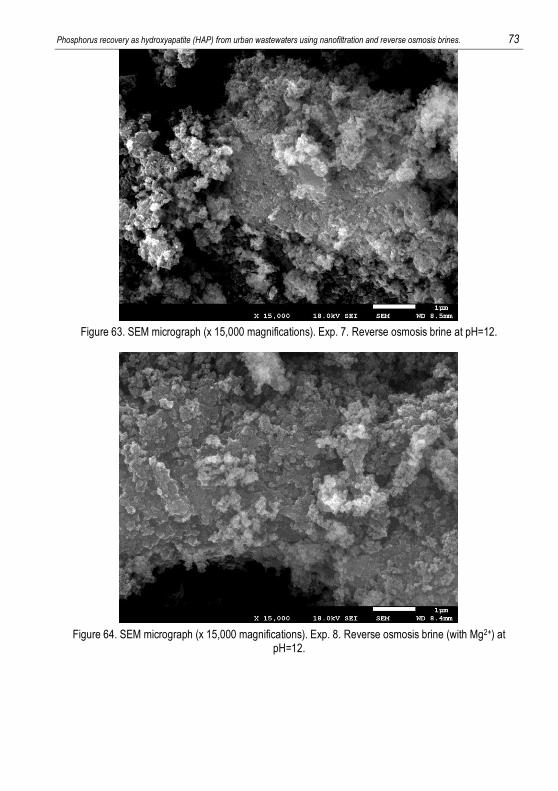
Phosphorus recovery as hydroxyapatite (HAP) from urban wastewaters using nanofiltration and reverse osmosis brines. 73
Figure 63. SEM micrograph (x 15,000 magnifications). Exp. 7. Reverse osmosis brine at pH=12.
Figure 64. SEM micrograph (x 15,000 magnifications). Exp. 8. Reverse osmosis brine (with Mg2+) at
pH=12.
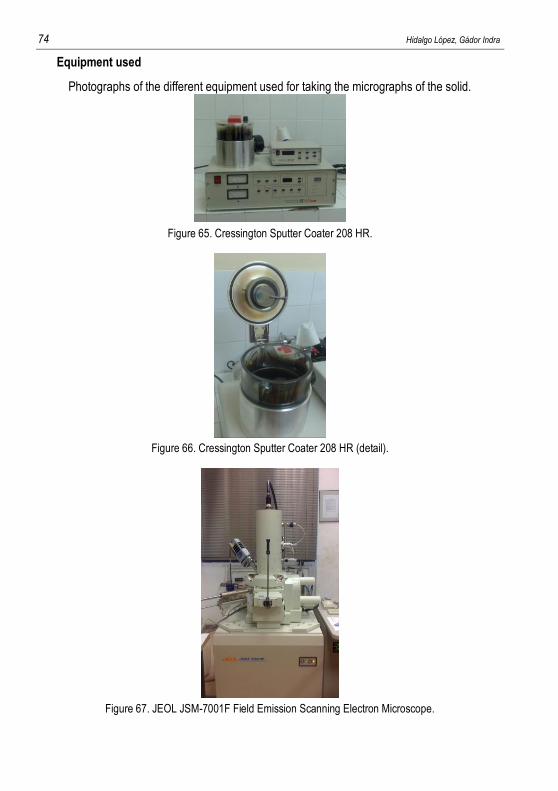
74 Hidalgo López, Gádor Indra
Equipment used
Photographs of the different equipment used for taking the micrographs of the solid.
Figure 65. Cressington Sputter Coater 208 HR.
Figure 66. Cressington Sputter Coater 208 HR (detail).
Figure 67. JEOL JSM-7001F Field Emission Scanning Electron Microscope.
