síntesis de catalizadores basados en óxidos de ón...
TRANSCRIPT

U
Departa
Síntesis de catalizadoremetales de transicipreferencial de mon
corrientes dcorrientes d
TESIS DOCTORALIrene López SuárezGrupo de Materiales PorospInstituto Nacional del Carbón2010
niversidad de Oviedo
mento de Ciencia de los Materiales e Ingeniería Metalúrgicae Ingeniería Metalúrgica
es basados en óxidos de ón para la oxidación nóxido de carbono en de hidrógenode hidrógeno
sos Funcionalesn


UNIVERSIDAD DE OVIEDO
Departamento de Ciencia de los Materiales
e Ingeniería Metalúrgica
SÍNTESIS DE CATALIZADORES BASADOS EN ÓXIDOS DE
METALES DE TRANSICIÓN PARA LA OXIDACIÓN
PREFERENCIAL DE MONÓXIDO DE CARBONO EN CORRIENTES
DE HIDRÓGENO
TESIS DOCTORAL
Irene López Suárez
2010


INSTITUTO NACIONAL DEL CARBÓN
(INCAR)
GREGORIO MARBÁN CALZÓN, INVESTIGADOR CIENTÍFICO DEL INSTITUTO
NACIONAL DEL CARBÓN, DEL CONSEJO SUPERIOR DE INVESTIGACIONES
CIENTÍFICAS,
CERTIFICA:
Que autorizo la inclusión en la Memoria de Tesis Doctoral presentada por la
Ingeniera Química Irene López Suárez “Síntesis de catalizadores basados en
óxidos de metales de transición para la oxidación preferencial de monóxido de
carbono en corrientes de hidrógeno” de los siguientes artículos de los que soy
co‐autor:
The synthesis of high surface area cerium oxide and cerium oxide/silica nanocomposites by the silica aquagel‐confined co‐precipitation technique. Irene López, Teresa Valdés‐Solís, Gregorio Marbán. Microporous and Mesoporous Materials, 127 (2010) 198‐204.
An attempt to rank copper‐based catalysts used in the CO‐PROX reaction. Irene López, Teresa Valdés‐Solís, Gregorio Marbán. International Journal of Hydrogen Energy, 33 (2008) 197‐205.
Preferential oxidation of CO by CuOx/CeO2 nanocatalysts prepared by SACOP. Mechanisms of deactivation under the reactant stream. Gregorio Marbán, Irene López, Teresa Valdés‐Solís. Applied Catalysis A: General, 361 (2009) 160‐169.
Copper manganite as a catalyst for the PROX reaction. Deactivation studies. Teresa Valdés‐Solís, Irene López, Gregorio Marbán. International Journal of Hydrogen Energy, 35 (2010) 1879‐1887.
Highly active cobalt based catalysts prepared by SACOP for the preferential oxidation of CO in excess hydrogen. Irene López, Teresa Valdés‐Solís, Gregorio Marbán. Artículo enviado a ChemCatChem.
Highly active structured catalyst made up of mesoporous Co3O4 nanowires supported on a metal wire mesh for the preferential oxidation of CO. Gregorio Marbán, Irene López, Teresa Valdés‐Solís, Antonio B. Fuertes. International Journal of Hydrogen Energy, 33 (2008) 6687‐6695.
INSTITUTO NACIONAL DEL CARBÓN
(INCAR)
TERESA VALDÉS‐SOLÍS IGLESIAS, CIENTÍFICA TITULAR DEL INSTITUTO NACIONAL
DEL CARBÓN, DEL CONSEJO SUPERIOR DE INVESTIGACIONES CIENTÍFICAS,
CERTIFICA:
Que autorizo la inclusión en la Memoria de Tesis Doctoral presentada por la
Ingeniera Química Irene López Suárez “Síntesis de catalizadores basados en
óxidos de metales de transición para la oxidación preferencial de monóxido de
carbono en corrientes de hidrógeno” de los siguientes artículos de los que soy
co‐autora:
The synthesis of high surface area cerium oxide and cerium oxide/silica nanocomposites by the silica aquagel‐confined co‐precipitation technique. Irene López, Teresa Valdés‐Solís, Gregorio Marbán. Microporous and Mesoporous Materials, 127 (2010) 198‐204.
An attempt to rank copper‐based catalysts used in the CO‐PROX reaction. Irene López, Teresa Valdés‐Solís, Gregorio Marbán. Int. J. Hydrogen Energy, 33 (2008) 197‐205.
Preferential oxidation of CO by CuOx/CeO2 nanocatalysts prepared by SACOP. Mechanisms of deactivation under the reactant stream. Gregorio Marbán, Irene López, Teresa Valdés‐Solís. Applied Catalysis A: General, 361 (2009) 160‐169.
Copper manganite as a catalyst for the PROX reaction. Deactivation studies. Teresa Valdés‐Solís, Irene López, Gregorio Marbán. International Journal of Hydrogen Energy, 35 (2010) 1879‐1887.
Highly active cobalt based catalysts prepared by SACOP for the preferential oxidation of CO in excess hydrogen. Irene López, Teresa Valdés‐Solís, Gregorio Marbán. Artículo enviado a ChemCatChem.
Highly active structured catalyst made up of mesoporous Co3O4 nanowires supported on a metal wire mesh for the preferential oxidation of CO. Gregorio Marbán, Irene López, Teresa Valdés‐Solís, Antonio B. Fuertes. International Journal of Hydrogen Energy, 33 (2008) 6687‐6695.


I
Índice general
Agradecimientos ....................................................................................................... VII
Resumen.........................................................................................................................IX
Abstract...........................................................................................................................XI
Introducción...................................................................................................................1
1. Economía del hidrógeno.........................................................................................1
2. Producción y purificación de hidrógeno a bordo del automóvil ............................6
3. Oxidación preferencial de CO (PROX).....................................................................9
4. Métodos de preparación de nanocatalizadores...................................................11
4.1. Nanoestructuras no soportadas: método SACOP.......................................11
4.2. Nanoestructuras soportadas: método de evaporación inducida de
amoniaco ................................................................................................... 13
Objetivos y planteamiento de la memoria......................................................17
1. Objetivos...............................................................................................................17
2. Organización de la Memoria.................................................................................18
3. Asistencia a congresos..........................................................................................19
Experimental................................................................................................................21
1. Materiales.............................................................................................................21
1.1. Nanoestructuras no soportadas .................................................................21
a) Método SACOP...........................................................................................21
b) Impregnación de sílice comercial...............................................................23
1.2. Nanoestructuras soportadas ......................................................................23
2. Caracterización de los materiales.........................................................................25
2.1. Difracción de rayos X ..................................................................................25
2.2. Isotermas de adsorción de N2.................................................................... 25

Índice general II
2.3. Microscopía electrónica de barrido (SEM) y análisis por energía
dispersiva de rayos X (EDX).........................................................................26
2.4. Microscopía electrónica de transmisión (TEM) ..........................................26
2.5. Espectroscopía infrarroja por transformada de Fourier (FTIR) ..................26
2.6. Espectroscopía fotoelectrónica de rayos X (XPS) .......................................26
2.7. Reducción a temperatura programada (TPR).............................................27
2.8. Termogravimetría (TG) ...............................................................................27
3. Análisis de actividad catalítica..............................................................................27
3.1. Reactores ....................................................................................................27
a) Reactor de cuarzo ......................................................................................27
b) Reactor de acero........................................................................................28
c) Reactor multicanal .....................................................................................28
3.2. Procedimiento experimental y tratamiento de datos ................................33
Artículos.........................................................................................................................37
Resumen Artículo I ......................................................................................................37
Artículo I: The synthesis of high surface area cerium oxide and cerium
oxide/silica nanocomposites by the silica aquagel‐confined co‐precipitation
technique, Irene López, Teresa Valdés‐Solís, Gregorio Marbán. Microporous and
Mesoporous Materials, 127 (2010) 198‐204. ............................................................ 41
Resumen Artículo II .................................................................................................... 57
Artículo II. An attempt to rank copper‐based catalysts used in the CO‐PROX
reaction. Irene López, Teresa Valdés‐Solís, Gregorio Marbán. International
Journal of Hydrogen Energy, 33 (2008) 197‐205 ....................................................... 61
Resumen Artículo III ................................................................................................... 81
Artículo III. Preferential oxidation of CO by CuOx/CeO2 nanocatalysts prepared by
SACOP. Mechanisms of deactivation under the reactant stream. Gregorio
Marbán, Irene López, Teresa Valdés‐Solís. Applied Catalysis A: General, 361
(2009) 160‐169........................................................................................................... 85
Artículo III. Información Suplementaria................................................................... 111
III
Resumen Artículo IV................................................................................................. 121
Artículo IV. Copper manganite as a catalyst for the PROX reaction. Deactivation
studies. Teresa Valdés‐Solís, Irene López, Gregorio Marbán. International Journal
of Hydrogen Energy, 35 (2010) 1879‐1887 .............................................................. 123
Resumen Artículo V.................................................................................................. 143
Artículo V. Highly active cobalt oxide catalysts prepared by SACOP for the
preferential oxidation of CO in excess hydrogen. Irene López, Teresa Valdés‐
Solís, Gregorio Marbán, enviado a ChemCatChem (cctc.201000351) ..................... 147
Resumen Artículo VI................................................................................................. 165
Artículo VI. Highly active structured catalyst made up of mesoporous Co3O4
nanowires supported on a metal wire mesh for the preferential oxidation of CO.
Gregorio Marbán, Irene López, Teresa Valdés‐Solís, Antonio B. Fuertes.
International Journal of Hydrogen Energy, 33 (2008) 6687‐6695 ........................... 167
Conclusiones generales .........................................................................................185
Bibliografía..................................................................................................................187


V
Índice de Figuras
Figura 1. Esquema de una pila de combustible alimentada por hidrógeno y oxígeno. ..... 2
Figura 2. Esquema de obtención de electricidad a partir de biomasa en la futura
economía del hidrógeno..................................................................................................... 7
Figura 3. Producción de hidrógeno a partir de bioalcoholes.............................................. 8
Figura 4. Esquema de método SACOP. ............................................................................. 22
Figura 5. (a) Aspecto de las mallas catalíticas en dos momentos distintos de su
obtención; (b) microfotografía SEM de la malla recubierta por las nanoestructuras
de Co3O4. En el inserto se puede observar la malla metálica sin recubrir. ...................... 24
Figura 6. Microrreactor de acero relleno de la malla catalítica........................................ 28
Figura 7. (a) Fotografía del sistema de reacción multicanal; (b) detalle de la parte
superior de los seis reactores; (c) captura de pantalla del programa de control del
sistema multicanal. ........................................................................................................... 29
Figura 8. Esquema de un reactor de acero del sistema multicanal.................................. 31
Figura 9. Despiece del tapón de doble muelle de un reactor de acero del sistema
multicanal. ........................................................................................................................ 31
Figura 10. Esquema del sistema de reacción multicanal.................................................. 32
Figura 11. Procedimiento experimental para las reacciones PROX.................................. 33
Índice de Tablas Tabla 1. Objetivos del DOE para el almacenamiento de hidrógeno en vehículos, incluida
la actualización realizada en 2009. ......................................................................................4


VII
Agradecimientos
Quiero expresar mi más sincero agradecimiento a los doctores D. Gregorio
Marbán Calzón y Dña. Teresa Valdés‐Solís Iglesias, bajo cuya dirección ha sido
realizada esta Memoria, por su dedicación y continuo asesoramiento durante el
desarrollo de los trabajos realizados.
Al Ministerio de Ciencia e Innovación por la concesión de una beca FPI para la
realización de esta tesis doctoral.
Al Consejo Superior de Investigaciones Científicas por permitir la realización de
este trabajo en el Instituto Nacional del Carbón, y especialmente al director del
centro, D. Carlos Gutiérrez Blanco.
A los doctores D. Narcís Homs y Dña. Pilar Ramírez de la Piscina por permitirme
realizar una estancia breve en la Universidad de Barcelona.
Al doctor D. Antonio Benito Fuertes por la ayuda proporcionada.
A Dña. Ana Mª López Iglesias del Departamento de Ciencia de los Materiales e
Ingeniería Metalúrgica por su amabilidad y buen hacer.
A mis compañeras de despacho del INCAR: Aida, Elena, Marta, Patri, Patricia y
Raquel.
A Goyo por estar conmigo en el laboratorio y por las estupendas hojas Excel con
macros. A Teresa por ayudarme en todo momento, incluso en la distancia. A los
dos porque siempre que he necesitado vuestra ayuda habéis estado ahí.
A mis compañeros del departamento de Química Inorgánica de la Universidad de
Barcelona, Raquel, Marcos, Luis, Valerio y Sonia, por hacerme más agradable la
estancia lejos de casa.
A mis amigos, y en concreto a Azucena, Patri Parolo y Bea por las quedadas de
los viernes tarde.

Agradecimientos VIII
En último lugar a mis padres, mi hermano Salvi, mi sobrino Diego y
especialmente a Roberto; gracias a todos por apoyarme estos años.

IX
Resumen
En este trabajo se han estudiado distintos catalizadores activos para la reacción de
oxidación preferencial de monóxido de carbono en presencia de hidrógeno (preferential
oxidation, PROX). Este proceso es en la actualidad el más sencillo y eficaz para disminuir
la concentración de CO residual de las corrientes de hidrógeno que alimentan las pilas
de combustible de membrana polimérica, evitando así el envenenamiento del
catalizador que se encuentra en el ánodo de dicha pila. Al tratarse de una reacción
heterogénea es conveniente que los catalizadores empleados presenten áreas
superficiales elevadas; de este modo se obtiene una mayor relación superficie/volumen
para la interacción gas‐sólido y, por consiguiente, mayores actividades catalíticas.
Se han preparado dos tipos de nanocatalizadores de elevada área superficial para su
posterior análisis en la reacción PROX: no soportados y soportados en una malla
metálica. Para la obtención de nanoestructuras no soportadas se utilizó como técnica de
síntesis la co‐precipitación confinada en hidrogeles de sílice (silica aquagel confined co‐
precipitation, SACOP), desarrollada por el Grupo de Materiales Porosos Funcionales del
INCAR. Este método permite obtener nanoestructuras de elevada área superficial
debido al colapso de la sílice sobre los hidróxidos metálicos durante la etapa de
precipitación. El método SACOP se optimizó para la obtención de nanoestructuras de
CeO2, lo cual permitió profundizar en el conocimiento de los mecanismos específicos de
la técnica. Posteriormente el método SACOP se empleó para preparar, entre otros,
óxidos basados en cobre (CuOx/CeO2 y CuMn2O4) tras un riguroso análisis comparativo
de los catalizadores de cobre empleados en la reacción PROX a lo largo de los años.
Estos catalizadores muestran una elevada actividad en la reacción PROX, si bien están
sujetos a cierto grado de desactivación, cuyos mecanismos se estudiaron en
profundidad. La formación de carbonatos superficiales es la causa principal de la pérdida
de actividad de los nanocatalizadores CuOx/CeO2, mientras que la desactivación de la
espinela de cobre y manganeso puede ser atribuida a la progresiva reducción del cobre
sobre la superficie del catalizador por acción del monóxido de carbono.
Mediante el método SACOP se obtuvieron los catalizadores basados en cobalto
(Co3O4/CoOOH) más activos para la reacción de oxidación preferencial de CO. Esta
técnica permitió obtener nanocatalizadores con concentraciones variables de CoOOH de

Resumen X
alta superficie en función del método de precipitación empleado. Este compuesto,
presente en las muestras frescas, es el responsable de las excelentes prestaciones de
estos catalizadores, puesto que en las condiciones reductoras de la reacción PROX se
transforma gradualmente en Co3O4 de elevada actividad catalítica.
Por último se sintetizaron nanoalambres de Co3O4 mesoporosos soportados en una
malla metálica de acero inoxidable mediante el método de evaporación inducida de
amoniaco. Estos catalizadores estructurados unen a sus conocidas ventajas sobre los
lechos catalíticos de partículas (mayor manejabilidad, baja caída de presión, excelentes
coeficientes de transmisión de calor, etc.) el hecho de presentar actividades catalíticas
muy elevadas y, lo que es más remarcable, una notable estabilidad en los ensayos de
larga duración en todo el intervalo de temperaturas analizado.

XI
Abstract
The aim of this work is to study different active catalysts for the preferential oxidation
(PROX) of CO in excess hydrogen. Nowadays this is the easiest and most efficient
process to reduce residual concentrations of CO in the streams fed into polymeric fuel
cells. It is well known that hydrogen streams need to be almost entirely CO‐free in order
to avoid platinum poisoning. As the reaction is heterogeneous, high surface area
catalysts are preferred, since this involves higher surface/volume ratios for the gas‐solid
interaction and, consequently, higher catalytic activities can be achieved.
Two types of high surface area nanocatalysts were prepared and analyzed in the PROX
reaction: unsupported nanostructures and metal wire supported nanostructures. The
silica confined co‐precipitation (SACOP) technique, developed by the Functional Porous
Materials Group at INCAR, was used as the reference method to obtain unsupported
nanostructures. This is a modified silica‐template route for obtaining high surface area
nanostructures due to the collapse of the silica surrounding the metallic hydroxides
during the precipitation stage. The SACOP procedure was optimized for the synthesis of
cerium oxide, which contributed to our knowledge of the mechanisms involved. The
procedure was then employed to prepare copper‐based catalysts (CuOx/CeO2 and
CuMn2O4), after a rigorous comparison of the activities of similar catalysts found in the
literature tested for the PROX reaction. The catalysts used in this study exhibit a high
activity for the PROX reaction but gradually undergo a slow deactivation during the
reaction. The deactivation of CuOx/CeO2 nanocatalysts is caused mainly by carbonates
formation, whereas for CuMn2O4 it seems to be produced by the progressive reduction
of copper via the action of carbon monoxide.
The SACOP method has produced the most active cobalt‐based catalyst for the PROX
reaction ever designed. The resulting nanocatalysts had a variable content in high
surface area CoOOH, depending on the type of precipitation used. This species which
was present in all the fresh samples and was the main contributor to catalyst
performance, was gradually reduced to highly active Co3O4 under PROX conditions.
Furthermore, supported Co3O4 mesoporous nanostructures were obtained by means of
a mild template‐free procedure known as the ammonia‐evaporation‐induced method. A

Abstract XII
stainless steel wire mesh was employed as the metallic support. Apart from the well‐
known advantages of employing these monoliths over catalytic beds of particles (easy
handling, low pressure drop and excellent heat transmission coefficients), these
structured catalysts exhibited a good catalytic activity and a remarkable stability over
the entire temperature range studied.

1
Introducción
1. ECONOMÍA DEL HIDRÓGENO
El modelo energético actual basado en el empleo de combustibles fósiles (carbón, gas
natural y petróleo) está en entredicho. Los problemas medioambientales asociados al
uso de dichos combustibles, esto es, la emisión de CO2 y otros gases de efecto
invernadero y sus consecuencias en el denominado cambio climático, han llevado a la
clase política a tomar conciencia de la necesidad de avanzar hacia otros modelos
energéticos. Al margen de los graves problemas medioambientales, cabe destacar que el
sistema energético actual está sometido a numerosas incertidumbres. Así, unos pocos
países, por lo general inestables políticamente, controlan el mercado del petróleo y el
gas natural, provocando continuas fluctuaciones en los precios. Si además se tiene en
cuenta la inclusión en la demanda energética de las economías emergentes, unido al
hecho de que los combustibles fósiles son un bien escaso, se concluye que esta situación
no resulta sostenible a medio plazo.
Es por ello que se están dando los primeros pasos hacia lo que se conoce como
Economía del Hidrógeno; un proyecto a largo plazo que podría definirse como un
esfuerzo de cambio en el panorama energético hacia un sistema limpio y sostenible que
pretende combinar la limpieza del hidrógeno como vector energético con la eficacia de
las pilas de combustible como sistema transformador de su energía en electricidad, calor
y movimiento [1]. Este concepto implicaría que el hidrógeno como fuente de energía
tendría que obtenerse a partir de recursos renovables o bien a partir de combustibles
fósiles como sucede en la actualidad, pero asociados a sistemas de captura y
almacenamiento de CO2.
Cabe preguntarse por qué basar el futuro energético en el hidrógeno. La energía másica
producida en la combustión del hidrógeno es la mayor existente entre todos los
combustibles, con un poder calorífico inferior 2.4, 2.8 y 4 veces superior al del metano,
gasolina y carbón, respectivamente; aunque como combustible sólo se usa en los
sistemas de propulsión de vehículos espaciales. La principal ventaja derivada del uso del
H2 como combustible es la ausencia de emisiones de CO2, así como de otro tipo de
contaminantes cuando se utiliza en pilas de combustible de baja temperatura [1].

Introducción 2
Una pila de combustible es un dispositivo electroquímico que convierte la energía
química de una reacción directamente en energía eléctrica, siendo alimentados los
reactivos de forma continua. Esta transformación electroquímica no está limitada por el
rendimiento del ciclo de Carnot, lo que permite conseguir eficacias relativamente altas
(50% aunque teóricamente podrían ser superiores). Existen diversos tipos de pilas de
combustible alimentadas por hidrógeno, siendo las más habituales las de membrana
polimérica (polymer electrolyte membrane fuel cell, PEMFC). En ellas, la temperatura de
funcionamiento está limitada por la estabilidad del polímero empleado, generalmente
Nafión, en torno a 70‐100°C. A temperaturas tan bajas sólo el platino posee la actividad
catalítica necesaria para impulsar las reacciones electroquímicas de la pila. En general el
hidrógeno (combustible) se alimenta al ánodo y el oxígeno (oxidante) al cátodo. El
hidrógeno suministrado a la pila se difunde a través del ánodo poroso y es activado por
un catalizador (Pt) reaccionando sobre la superficie del cátodo con los iones OH‐,
formando agua y liberando electrones según la siguiente reacción [2]:
H2 + 2OH‐ → 2 H2O + 2e
‐ (R1)
En la Figura 1 se presenta un esquema del funcionamiento de una pila de combustible
PEM.
‐ +e‐
H2O2
H2O
H+
Ánodo CátodoElectrolito
H2 → 2 H+ + 2e‐
O2 + 4 H+ + 4e‐ → 2 H2O
‐ +e‐
H2O2
H2O
H+
Ánodo CátodoElectrolito
H2 → 2 H+ + 2e‐
O2 + 4 H+ + 4e‐ → 2 H2O
Figura 1. Esquema de una pila de combustible alimentada por hidrógeno y oxígeno.
Evidentemente la implementación de este nuevo sistema energético habrá de
producirse paulatinamente a lo largo de las próximas décadas, exigiendo un gran
esfuerzo en investigación para solventar los distintos problemas que presenta este
modelo. Así, el hidrógeno, como vector energético, será tan limpio como lo sea su
proceso de obtención. En este sentido tienen un especial interés los sistemas de

3
producción basados en el empleo de alcoholes que se obtienen a partir de recursos
renovables (biomasa y residuos orgánicos) pero también a partir de fuentes fósiles en
caso de ser necesario (gas natural, principalmente), ya que permitirían una transición
suave desde un sistema energético basado en combustibles fósiles a la economía verde
de los combustibles renovables o biocombustibles.
El mayor reto en el campo de la producción de hidrógeno surge en las aplicaciones
móviles, y más en concreto en el sector del transporte. En el año 2005 y en el marco de
la Unión Europea, el 27% de las emisiones de CO2 de origen antropogénico se debieron a
este sector. El problema medioambiental del sector transporte reside en que los
vehículos son focos altamente dispersos de emisiones de CO2, en los que no pueden
implementarse sistemas de captura y almacenamiento, como ocurre en los focos
estacionarios.
Las opciones para utilizar hidrógeno en vehículos son fundamentalmente dos: (1) su
almacenamiento a bordo y (2) la producción en el propio vehículo del hidrógeno justo
antes de alimentarlo a la pila de combustible. El almacenamiento puede realizarse en
forma líquida, gaseosa, combinado químicamente o adsorbido en sólidos porosos,
mientras que la producción en el vehículo puede llevarse a cabo mediante reformado de
un combustible, renovable o no, como un alcohol rico en hidrógeno (p. ej. metanol o
etanol).
El almacenamiento de hidrógeno a bordo del automóvil es un proceso que suscita un
gran interés investigador con el fin de limitar tanto los costes como el peso y volumen
del depósito de hidrógeno, ya que la densidad volumétrica de energía en el hidrógeno es
muy baja. La densidad de la gasolina es 0.7 kg/L, mientras que la del H2 es 0.03, 0.06 y
0.07 kg/L a 350 atm, 700 atm y licuado (20 K), respectivamente, con lo que se necesitan
grandes volúmenes de hidrógeno para satisfacer los requisitos energéticos [1]. El
Departamento de Energía de los Estados Unidos (DOE, www.energy.gov) ha fijado unos
objetivos a corto plazo que se deberían cumplir en el almacenamiento de hidrógeno
para su uso en vehículos y que se toman como referencia para determinar la viabilidad
de los sistemas de almacenamiento de hidrógeno. Estos objetivos fueron revisados en
el año 2009 para tener en cuenta expectativas más realistas de almacenamiento. Los
objetivos del DOE se muestran en la Tabla 1.

Introducción 4
Tabla 1. Objetivos del DOE para el almacenamiento de hidrógeno en vehículos, incluida
la actualización realizada en 2009.
Densidad gravimétrica
Densidad energética
Coste
Objetivos 2010 0.06 kg H2/kg 1.5 kWh/L
(45 g/L) $4/kWh
Objetivos 2010
revisados 0.045 kg H2/kg
0.9 kWh/L
(27 g/L) por convenir
Objetivos 2015 0.09 kg H2/kg 2.7 kWh/L
(81 g/L) $2/kWh
Objetivos 2015
revisados 0.055 kg H2/kg
1.3 kWh/L
(39 g/L) por convenir
Existen diversas alternativas para almacenar hidrógeno de forma más compacta que
pugnan por lograr los objetivos del DOE: i) gas comprimido, ii) hidrógeno líquido, iii)
hidruros metálicos y iv) adsorción en materiales con elevada porosidad, como materiales
carbonosos. El almacenamiento de hidrógeno comprimido requiere el empleo de
tanques presurizados a 300 atm, si bien se está investigando el uso de tanques de fibra
de carbono recubiertos de material inerte que soportan presiones de hasta 700 atm. Sin
embargo estos tanques son muy caros y presentan riesgos, siendo de hecho la
compresión del gas en sí misma la parte más complicada y peligrosa del proceso,
además de tener un coste muy elevado [3]. Por otro lado, el almacenamiento de H2
licuado (‐251.8°C) precisa de tanques criogénicos, muy bien aislados, que suelen resultar
caros y pesados. Ambas opciones, hidrógeno comprimido o licuado, están penalizadas
energéticamente, esto es, se requiere una parte de la energía que contiene el hidrógeno
para presurizarlo o licuarlo (un 20% y un 40% respectivamente [4]).
La adsorción en sólidos de áreas superficiales elevadas, como las nanoestructuras de
carbono, es una alternativa en principio atractiva por resultar una forma sencilla y más
segura de manejar el hidrógeno. La capacidad de almacenamiento de H2 de los
materiales carbonosos se asocia generalmente a su área superficial y microporosidad,
aunque estudios más recientes apuntan al hecho de que la microporosidad estrecha
(menor de 0.7 nm) es el factor determinante que gobierna dicha capacidad de
almacenamiento [5]. Sin embargo, los mejores resultados de almacenamiento en estos
materiales (6.9% en peso) [6] se alcanzan a ‐196°C y 20 atm, por lo que de nuevo hay
que enfrentarse a la penalización energética que conlleva este proceso.

5
Por último, el almacenamiento en hidruros metálicos recargables está atrayendo
poderosamente la atención de la comunidad científica, y parece a priori el sistema mejor
posicionado para alcanzar los objetivos del DOE. Se fundamenta en la capacidad de
muchos metales y aleaciones de quimisorber reversiblemente hidrógeno, mediante una
reacción química que da lugar al correspondiente hidruro. Cuando se necesita, el
hidrógeno es liberado, lo que requiere un aumento de la temperatura y una disminución
de la presión [7]. Compuestos como el LiBH4 han demostrado tener una mayor densidad
de energía que el hidrógeno líquido. Sin embargo, los valores de presión y temperatura
empleados para la quimisorción y desorción del hidrógeno no están dentro de los
intervalos de aplicabilidad en dispositivos móviles, que son 0‐10 atm y 0‐100°C,
respectivamente. Además, la ciclabilidad de estos materiales puede verse afectada por
los cambios de volumen que experimentan durante la adsorción y desorción del
hidrógeno, favoreciendo la disgregación de los hidruros. El almacenamiento en hidruros
metálicos requiere mucha más investigación para conocer mejor los procesos físicos y
químicos que gobiernan tanto la quimisorción como la liberación del hidrógeno [4].
Evidentemente se está avanzando en la búsqueda de medios novedosos de
almacenamiento, pero la opción de producir el hidrógeno a bordo mediante reformado
de biocombustibles disfruta, en todo caso, de un desarrollo tecnológico más elevado. La
generación a bordo de hidrógeno también presenta inconvenientes, y precisa de
mejoras, como el desarrollo de convertidores portátiles más eficientes y baratos, pero se
eluden los problemas actuales asociados al almacenamiento de hidrógeno y los elevados
costes de su distribución hacia las estaciones de servicio. El método más interesante
para la producción de hidrógeno en vehículos es el reformado de un alcohol. El
reformado consiste en la reacción del alcohol con vapor de agua (con o sin oxígeno) para
producir H2 y CO2, además de una cierta cantidad de CO (subproducto no deseado).
Posteriormente el CO ha de eliminarse para evitar la contaminación del ánodo de Pt de
la pila de combustible polimérica, aplicándose usualmente una etapa de reacción de
desplazamiento de vapor de agua (water gas shift, WGS) seguida de otra etapa de
oxidación catalítica del CO residual a CO2 (preferential oxidation, PROX) para lograr
corrientes depuradas de H2.
Esta tesis forma parte del conjunto de investigaciones que se llevan a cabo en los
laboratorios del Grupo de Materiales Funcionales Porosos del INCAR, encaminados a la
puesta a punto de un sistema de producción de hidrógeno a partir de bioalcoholes a
bordo del automóvil. En concreto el presente trabajo tiene como objetivo el estudio de
distintos aspectos de la etapa de oxidación preferencial de CO empleando para ello

Introducción 6
nanocatalizadores no soportados sintetizados por un método propio de nanomoldeo y
nanocatalizadores soportados en mallas metálicas sintetizados por el método de
evaporación inducida de amoniaco.
2. PRODUCCIÓN Y PURIFICACIÓN DE HIDRÓGENO A BORDO DEL
AUTOMÓVIL
Actualmente, se producen alrededor de 0.1 Gton de H2 por año, el 98% a partir de
combustibles fósiles por procesos de reformado [1]. El H2 se utiliza principalmente en el
refino del petróleo y la producción de amoniaco y metanol. En un futuro sostenible el
hidrógeno habrá de obtenerse de otras fuentes de energía, en procesos en los que, al
menos a largo plazo, las emisiones de CO2 tendrán que ser minimizadas.
En este sentido, la biomasa constituye uno de los recursos renovables con perspectivas
más favorables y de mayor interés para la obtención de combustibles para el transporte.
A partir de la biomasa se pueden obtener combustibles líquidos, con lo que se
aprovecharía la red de distribución de combustibles fósiles líquidos ya existente y el
depósito de combustible no sufriría modificaciones significativas. Además, si se evita la
utilización de combustibles fósiles tanto durante el proceso de obtención del bioalcohol,
como en el de su transformación en hidrógeno se consigue un balance neto nulo de CO2.
Si durante la etapa de obtención de hidrógeno se aplican adicionalmente sistemas de
captura y almacenamiento de CO2 el balance global puede ser negativo, es decir el
proceso global constituiría un sumidero de CO2.
Cálculos recientes desarrollados en nuestro laboratorio muestran que la disponibilidad
estimada de biomasa en el año 2050 será suficiente para asegurar la producción de
hidrógeno para el transporte mediante el proceso biomasa ‐ biometanol ‐ hidrógeno,
representado en la Figura 2 [1]. Con otros biocombustibles, más populares hoy en día,
como el bioetanol de caña o maíz o el biodiésel de aceites vegetales, habría un claro
déficit de biomasa energética [1]. En este sentido, nuestro grupo de trabajo ha apostado
por el empleo del metanol frente al etanol por varios motivos además de su
disponibilidad: tiene una elevada densidad energética, es fácilmente biodegradable y
requiere menores temperaturas de reformado que el etanol. Además, al tratarse de un
compuesto más sencillo que el etanol, el número de reacciones que pueden tener lugar
es menor y por tanto se disminuye la formación de compuestos intermedios no

7
deseados. Pese a su toxicidad, el metanol es más seguro en su manejo que la propia
gasolina.
Distribución y suministro en faselíquida
Biomasa
Reformado
In situ
Ciclo de
l CO
2(emisione
s ne
tas cero)
Gasificación
(alta
eficacia)
PEMFC
ElectricidadHogar, transportes…
Producción centralizada
Procesos en localización de uso
Cultivos, residuos orgánicos…
WGS+PROX
Bio‐alcohol (líquido) Producción
Purificación
Utilización
Figura 2. Esquema de obtención de electricidad a partir de biomasa en la futura economía del hidrógeno.
La producción de hidrógeno a partir de alcoholes se lleva a cabo mediante procesos de
reformado catalítico. Como se ha indicado en el apartado anterior, el reformado
consiste en la reacción de un alcohol (metanol (R2) o etanol, principalmente) con vapor
de agua (reacción endotérmica) para producir H2 y CO2. Mediante la adición de O2 a la
reacción es posible alcanzar condiciones prácticamente autotérmicas (R3). A
continuación se detallan las reacciones para el metanol:
• Reformado
CH3OH + H2O CO←→ 2 + 3 H2; ΔH0298K=49.5 kJ∙mol‐1 (R2)
• Reformado oxidativo
CH3OH + (1‐2a) H2O + a O2 ←→ CO2 + (3‐2a) H2 ; a=0.125 ΔH0298K=‐11.0 kJ∙mol‐1 (R3)
Además de estas reacciones, otros dos procesos catalíticos producen hidrógeno a partir
de metanol, como son la oxidación parcial y la descomposición.

Introducción 8
• Oxidación parcial
CH3OH + 0.3 O2 ←→ 0.6 CO2 + 2 H2 +0.4 CO; ΔH0298K=‐79.2 kJ∙mol‐1 (R4)
• Descomposición
CH3OH ←→ CO + 2 H2 ; ΔH0298K=90.2 kJ∙mol‐1 (R5)
Las reacciones de reformado de metanol suelen llevarse a cabo empleando
catalizadores de cobre soportados sobre distintos materiales (ZnO, Cr2O3, CeO2) y
empleando diversos aditivos (Al2O3, grafito, etc). La presencia de CO en los gases de
salida ha de ser controlada estrictamente dado que su concentración ha de ser muy baja
(<1 ppm) para evitar la potencial desactivación del catalizador de la pila de combustible.
Por esta razón, la corriente rica en hidrógeno que sale del reformador ha de ser
posteriormente purificada. De forma global, el proceso de producción de hidrógeno a
partir de un bioalcohol se muestra en la Figura 3.
CO + H2O CO2 + H2O2
H2OCO
Bioalcohol Reformado
Oxidación parcial
WGS‐Alta T300‐500°C
200‐300°C
Reformado oxidativoCO2H2
WGS‐Baja T PROX
CO + ½ O2 → CO2
70‐250°C 70‐100°C
PEMFC
Q←→
Figura 3. Producción de hidrógeno a partir de bioalcoholes.
El proceso de purificación de la corriente de hidrógeno suele consistir habitualmente en
la reacción catalítica de desplazamiento de vapor de agua (WGS), para elevadas
concentraciones de CO (R6), seguida de una etapa de oxidación preferencial (o selectiva)
del CO residual (PROX) (R7). En la etapa PROX el monóxido de carbono residual se oxida
catalíticamente a dióxido de carbono. Las reacciones se muestran a continuación:
• Reacción de desplazamiento de vapor de agua
H2O + CO ←→ CO2 + H2 ; ΔH0298K=‐41.1 kJ∙mol‐1 (R6)
• Oxidación preferencial de CO
CO + ½ O2 → CO2 ; ΔH0298K=‐283 kJ∙mol‐1 (R7)

9
La reacción de desplazamiento de vapor de agua es un proceso bien conocido desde los
años 40. Se trata de una etapa intermedia en la fabricación de amoniaco, además de
emplearse en la producción de otros compuestos que se obtienen a partir del gas de
síntesis (mezcla de CO e H2). En el caso de la obtención de hidrógeno con pureza elevada
la reacción de desplazamiento de vapor de agua se lleva a cabo en dos etapas: la
primera a temperaturas altas (300‐500°C) con el empleo de catalizadores de Fe‐Cr (8‐
12% de Cr2O3) y la segunda a temperaturas más bajas (200‐300°C) utilizando
catalizadores de Cu‐Zn‐Al [8]. No obstante, en los últimos años se están investigando
diversas alternativas, como la incorporación de una membrana en el reactor WGS,
combinando así el proceso de reacción con el de separación del H2 [9].
3. OXIDACIÓN PREFERENCIAL DE CO (PROX)
La reacción de oxidación preferencial de CO consiste en la oxidación catalítica del CO
residual para producir CO2 (R7), en presencia de una gran cantidad de hidrógeno,
procurando minimizar la oxidación simultánea del hidrógeno a agua (R8). Esta reacción
suele llevarse a cabo a temperaturas comprendidas entre 70 y 250°C [10], las cuales
vienen determinadas por la temperatura a la salida de la unidad de WGS de baja
temperatura (∼250°C) y la temperatura de operación de la pila PEM (∼70‐100°C). La reacción es irreversible, exotérmica y entra en competencia con la oxidación del
hidrógeno para dar agua.
H2 + ½ O2 → H2O ; ΔH0298K=‐242 kJ∙mol‐1 (R8)
Los catalizadores sólidos empleados para la reacción de oxidación preferencial de CO
(R7) han de cumplir los siguientes requisitos: (i) elevada actividad catalítica en el
intervalo de temperatura convenido; (ii) elevada selectividad hacia la oxidación de CO
frente a la formación de H2O; (iii) tolerancia a la presencia de CO2 y H2O y (iv) conversión
estable con el tiempo.
Para lograr actividades catalíticas elevadas se emplean nanocatalizadores, es decir,
compuestos con tamaños de partícula en la escala nanométrica, por debajo de 100 nm.
Estos materiales tienen la ventaja de poseer una mayor relación superficie/volumen y
por tanto presentan una mayor superficie activa para el acceso del gas y así favorecer la
reacción. Los catalizadores inicialmente investigados para la reacción de oxidación
preferencial de CO estaban basados en metales nobles, en semejanza a los empleados
en la purificación de CO de la síntesis de amoniaco [11‐14]. Sin embargo, dado el

Introducción 10
elevado precio y escasa disponibilidad de los metales nobles, en los últimos años ha
surgido un gran interés en el desarrollo de nanocatalizadores basados en metales no
nobles. Así, el óxido de cobre ha recibido una amplia atención en los últimos años
porque presenta una actividad y selectividad elevadas [15]. Más recientemente el óxido
mixto de cobre y cerio, CuOx/CeO2, que se emplea en otras reacciones catalíticas, como
la reacción de desplazamiento de vapor de agua y el reformado de alcoholes, ha sido
propuesto como catalizador para la reacción PROX, dando lugar a numerosas
publicaciones en la literatura [16‐20]. Dada la repercusión de los catalizadores basados
en cobre, en el presente trabajo se ha efectuado una exhaustiva búsqueda bibliográfica
y se ha desarrollado un método que permite comparar la actividad catalítica de los
diferentes catalizadores con el propósito de conocer los factores que afectan a su
actividad catalítica (Artículo II).
Además de los óxidos de cobre y cerio se han utilizado otros óxidos metálicos para la
oxidación preferencial de CO, tales como CuMn2O4 y el Co3O4. La espinela de cobre y
manganeso (CuMn2O4), usada comúnmente en la oxidación de CO para protección
respiratoria, se ha analizado recientemente tanto en el reformado catalítico de metanol
[21] como, de forma lateral, en la oxidación de CO en exceso de hidrógeno [22],
encontrándose para este proceso actividades moderadas y elevadas selectividades a
temperaturas superiores a 100°C. En esta tesis se ha analizado la actividad en la reacción
de oxidación preferencial de CO de la espinela de cobre y manganeso sintetizada con la
técnica SACOP (Artículo IV).
Los óxidos de cobalto son compuestos de elevado interés industrial. La espinela de
cobalto, Co3O4, se emplea en baterías recargables, como material magnético [23] y en
sensores de CO [24]. Además, el Co3O4 se ha utilizado en la oxidación de CO a baja
temperatura [25, 26], y más recientemente en la oxidación preferencial de CO [27‐29].
Por su parte, el oxihidróxido de cobalto, CoOOH, también se emplea como sensor de CO
[30] o como aditivo en los electrodos de níquel para baterías recargables [31]. En la
presente Memoria se han sintetizado óxidos de cobalto mediante la técnica SACOP para
su posterior análisis de actividad catalítica en la reacción de oxidación preferencial de
CO (Artículo V).
El principal problema que presentan los catalizadores es su desactivación, es decir, la
pérdida de actividad catalítica con el tiempo de uso. En el caso de aplicaciones no
estacionarias, donde la vida del catalizador ha de ser similar a la del propio vehículo en
el que se instale, es clave disponer de catalizadores que no sufran un alto grado de
desactivación. Dicha pérdida de actividad puede deberse a distintas causas, como la

11
sinterización, el envenenamiento o la acumulación de especies carbonosas. La
sinterización se produce por la pérdida de superficie activa debido al crecimiento y
aglomeración de los cristales. Se habla de envenenamiento cuando determinadas
impurezas provenientes de la corriente de alimentación bloquean de forma irreversible
los centros activos del catalizador. Por otro lado, el bloqueo de dichos centros se puede
producir por la acumulación de especies carbonosas (por ejemplo carbonatos) que se
forman durante la reacción [8]. Debido a la importancia de esta problemática, en el
presente trabajo se han analizado las causas de la desactivación en dos tipos de
nanocatalizadores: CuOx/CeO2 (Artículo III) y CuMn2O4 (Artículo IV), ambos sintetizados
mediante la técnica SACOP.
4. MÉTODOS DE PREPARACIÓN DE NANOCATALIZADORES
4.1. Nanoestructuras no soportadas: método SACOP
En el ámbito de la catálisis, la obtención de nanopartículas o nanoestructuras de elevada
superficie específica es uno de los retos a los que se enfrenta actualmente la
investigación científica. Así, los procesos catalíticos que emplean catalizadores sólidos
de tamaño nanométrico están ampliamente extendidos y resultan indispensables para
llevar a cabo de forma económica la mayoría de las reacciones industriales [32]. En la
bibliografía se encuentra un gran número de trabajos que describen diversas técnicas
para sintetizar estos materiales con un elevado control de sus características texturales,
empleando para ello procedimientos de tipo sol‐gel [33], microemulsión [34] o las
llamadas técnicas de nanomoldeo [35].
Los métodos de nanomoldeo han tenido una amplia repercusión en los últimos años. Se
caracterizan por utilizar un material poroso, ya sean sílices mesoporosas amorfas u
ordenadas, o un carbón poroso como nanomolde en cuyos poros tiene lugar la síntesis
controlada del material. Al llevarse a cabo la síntesis en un espacio confinado el
crecimiento de las nanopartículas que tiene lugar durante el tratamiento térmico se ve
limitado por las paredes de los poros del molde. Así, tras la eliminación del molde, es
posible obtener materiales nanoparticulados o nanoestructurados. En el caso de las
nanopartículas su tamaño no podrá ser mayor que el tamaño de poro del nanomolde de
partida, mientras que en el caso de las nanoestructuras el tamaño de poro de las
mismas estará relacionado con el tamaño de las paredes entre poros del nanomolde
original. A pesar de su simplicidad se trata de un procedimiento laborioso que requiere
múltiples etapas de impregnación del nanomolde para obtener rendimientos

Introducción 12
significativos y que exige el control exhaustivo de una serie de parámetros: (i) grado de
llenado de los poros, (ii) homogeneidad de la impregnación y (iii) control de la etapa de
secado para evitar la migración capilar de los precursores introducidos en los poros.
Para intentar solventar los inconvenientes que presentan los métodos de nanomoldeo
convencionales se ha desarrollado un método, basado en las técnicas de nanomoldeo y
sol‐gel, denominado co‐precipitación confinada en hidrogel de sílice o SACOP [36] (silica
aquagel‐confined co‐precipitation) que permite obtener materiales de superficies más
elevadas que las de los preparados por el método convencional. El método SACOP
permite alcanzar rendimientos de óxidos más altos sin necesidad de múltiples etapas de
impregnación‐calcinación y con un elevado grado de homogeneidad. Además, no es
necesario llevar a cabo un control tan exhaustivo del secado puesto que los precursores
metálicos se encuentran durante esa etapa como precipitados de hidróxidos metálicos
[36].
El método SACOP parte de un procedimiento para la síntesis de xerogel de sílice de
porosidad controlada a partir de silicato sódico [37]. El precursor metálico se disuelve en
la disolución ácida utilizada para sintetizar la sílice de forma que se obtiene un hidrogel
en el que los cationes metálicos forman parte de la estructura, y por tanto existe un
contacto íntimo entre el molde de sílice y el precursor del metal. Los iones metálicos
confinados en el hidrogel se someten a un proceso de precipitación durante el cual son
transformados en hidróxidos para prevenir la pérdida de metal durante las etapas de
lavado y secado del gel. Una vez precipitados los hidróxidos del metal correspondiente,
la muestra seca se calcina para que se formen los óxidos de los metales confinados en la
microestructura del gel y por último se elimina el nanomolde de sílice mediante
disolución con NaOH, obteniéndose finalmente los óxidos nanoparticulados. Sin
embargo, todas las muestras preparadas por SACOP presentan cierta cantidad de sílice
residual (<10% peso). Este problema es inherente a todas las técnicas de moldeo con
sílice y se debe principalmente a la formación de silicatos de difícil solubilidad. Afecta a
metales como cerio, hierro o lantano, mientras que apenas tiene influencia en el caso
del cobre, manganeso o cobalto. Por este motivo la etapa de eliminación de la sílice fue
optimizada para la preparación de óxido de cerio.
En la literatura reciente existen métodos similares al método SACOP, conocidos como
one‐pot nanocasting techniques, en los cuales el precursor del óxido se mezcla con el
precursor del molde de sílice con el propósito de producir un hidrogel o alcogel en los
que el metal está homogéneamente distribuido [38, 39]. Sin embargo estos métodos
han sido desarrollados para la obtención de nanocomposites y no llevan a cabo etapas

13
de precipitación ni de disolución de la sílice. Además, una característica común de estos
trabajos es el uso de precursores de sílice de elevado coste, como el tetraetilortosilicato
(TEOS), que encarece el proceso de síntesis.
En esta tesis han sido sintetizados diversos compuestos mediante el método SACOP. Se
ha revelado como un método muy efectivo para producir óxidos de elevada superficie
específica en el caso de la espinela CuMn2O4 [40]. Se han preparado también otros
óxidos como Fe2O3, CuOx/CeO2 y CoFe2O4, presentando en todos los casos áreas
comprendidas entre los 230 y 300 m2∙g‐1 y estando formados por agregados de partículas
de entre 2 y 8 nm [36]. En este trabajo se ha optimizado el método SACOP para la
obtención de óxido de cerio además de estudiar los mecanismos implicados en las
distintas etapas de síntesis (Artículo I). El método SACOP se aplica como método de
referencia para la síntesis de los catalizadores empleados en la realización de este
trabajo.
4.2. Nanoestructuras soportadas: método de evaporación inducida de
amoniaco
La inmovilización de las nanopartículas o nanoestructuras en diversos soportes para su
posterior uso en reactores catalíticos presenta una serie de ventajas respecto a la
utilización directa de nanopartículas o nanoestructuras, por lo que la investigación en
este campo se está viendo impulsada. Los catalizadores estructurados son fácilmente
recuperados del medio de reacción, provocan caídas de presión prácticamente nulas y
en algunos casos pueden favorecer la transmisión de calor a lo largo del reactor. En la
literatura se describen distintos soportes, como placas metálicas [41], espumas
metálicas [42] o monolitos cerámicos [43]. Los métodos que se suelen utilizar para la
síntesis de catalizadores soportados en dichos materiales requieren numerosas etapas
para su preparación.
En la presente memoria se han obtenido nanoestructuras mesoporosas de Co3O4,
soportadas en una malla metálica de acero inoxidable, que fueron utilizadas en la
reacción de oxidación preferencial de CO (Artículo VI). Para ello se tomó como punto de
partida el método de evaporación inducida de amoniaco utilizado por Li y col. [44, 45]
en sus trabajos, que consta de una etapa de síntesis seguida de una etapa de calcinación
en aire del sustrato recubierto. Este sencillo procedimiento experimental es muy
interesante porque tanto la síntesis del catalizador como la inmovilización del mismo
tienen lugar en un solo paso. Este método permitió a sus autores el crecimiento de

Introducción 14
nanoalambres huecos de Co3O4 sobre distintos sustratos, como láminas de titanio o
silicio para su uso en baterías de Li‐ión. Las nanopartículas obtenidas por estos autores
presentaban áreas superficiales relativamente altas (∼74 m2∙g‐1). De acuerdo con Li y col.
la formación de Co3O4 es consecuencia de una reorganización topotáctica que ocurre en
presencia de oxígeno durante la transformación de Co(OH)2 en Co3O4 mesoporoso.
Sin embargo, entre el trabajo de Li y col. y el realizado en nuestro laboratorio existen
algunas diferencias significativas. En nuestro caso hemos empleado como soporte mallas
de acero inoxidable muy delgadas. Esto permite el fácil arrollamiento de las mismas una
vez depositada la fase activa, lo cual asegura su uso como relleno catalítico en reactores
tubulares con bajas caídas de presión y elevados coeficientes de transmisión de calor. Al
emplear como sustrato una malla metálica de acero inoxidable, el crecimiento de las
nanoestructuras de Co3O4 tuvo lugar en forma de nanoalambres sólidos, de lo que se
deduce que el sustrato empleado influye de manera significativa sobre la geometría final
de los nanoalambres. Además, el rendimiento obtenido fue de ∼7 mg de Co3O4 cada cm2
de malla. En cambio Li y col. obtuvieron un rendimiento de 2‐3 mg∙cm‐2 empleando
como sustratos láminas de titanio.
En un trabajo reciente de nuestro grupo el método de preparación de la espinela
soportada fue optimizado [46], obteniéndose resultados que contradicen parcialmente
los mostrados por Li y col. en sus artículos. Para estos autores, la formación de la
espinela mesoporosa de alta superficie tiene lugar durante la etapa de síntesis y no
durante la calcinación posterior. Sin embargo, en nuestro trabajo observamos que una
mayor presencia de Co(OH)2 en la muestra sin calcinar producía muestras calcinadas con
mayores superficies específicas, siendo la abundancia de Co(OH)2 inversamente
proporcional al tiempo empleado en la síntesis. Este comportamiento se debe a que
para largos tiempos de síntesis el Co(OH)2 se va transformando gradualmente en Co3O4
de baja superficie específica (tamaño de cristal de 26 nm), mientras que el Co3O4
producido durante la calcinación del Co(OH)2 tiene menores tamaños de cristal (~10 nm)
y es por tanto el responsable de una mayor área superficial en las muestras calcinadas.
Por esta razón es conveniente obtener la mayor cantidad de Co(OH)2 durante la etapa
de síntesis.
Para analizar la actividad catalítica en la reacción PROX de estos catalizadores se
construyó un microrreactor tubular de acero de 1/4´´ de diámetro externo, descrito en
detalle en el apartado Experimental. En este tubo se introdujo enrollada una malla de
5 cm × 3 cm recubierta de nanoestructuras de espinela de cobalto, para una altura final
del monolito metálico de 3 cm. Dada la cantidad media de fase activa en el monolito

15
(∼100 mg de Co3O4) y el volumen del mismo, se obtuvieron relaciones masa de
catalizador/volumen de reactor un orden de magnitud superiores a las obtenidas en
otros sistemas de reacción como algunos microrreactores acanalados.
Adicionalmente, las mallas metálicas recubiertas con Co(OH)2/Co3O4 han sido analizadas
por nuestro grupo en la reacción de descomposición de metanol [46] para producir H2 y
CO (R5). Para mejorar la actividad catalítica de este catalizador se empleó cobre como
agente dopante, obteniéndose los catalizadores basados en metales no nobles más
activos, selectivos y estables para la descomposición de metanol recogidos hasta el
momento en la bibliografía.


17
Objetivos y planteamiento de la memoria
1. OBJETIVOS
Como se ha puesto de manifiesto en la Introducción, los procesos de producción de
hidrógeno a partir de bioalcoholes suponen una alternativa razonable para realizar una
transición progresiva hacia la llamada Economía del Hidrógeno. La purificación de la
corriente de hidrógeno es una etapa fundamental a la hora de evitar el envenenamiento
del ánodo de platino perteneciente a la pila de combustible polimérica.
Por todo ello y conforme a lo anteriormente expuesto, la presente memoria tiene como
objetivo general la obtención de nanocatalizadores basados en óxidos de metales de
transición que sean activos, selectivos y estables en el proceso de purificación de
corrientes de hidrógeno mediante la oxidación preferencial de monóxido de carbono.
Para cumplir este objetivo general se han planteado distintos objetivos específicos, que
se detallan a continuación:
1. Estudio de la técnica de co‐precipitación confinada de hidrogeles de sílice, SACOP,
para la obtención de catalizadores de alta superficie específica. Optimización de la
técnica para la obtención de óxido de cerio.
2. Obtención de nanocatalizadores de óxido de cobre y óxido de cerio por el método
SACOP. Estudio de su actividad, selectividad y estabilidad catalítica en la reacción PROX.
3. Síntesis de manganita de cobre nanométrica por el método SACOP. Estudio de su
actividad, selectividad y estabilidad catalítica en la reacción PROX.
4. Preparación de nanoestructuras de óxido de cobalto por el método SACOP. Estudio de
su actividad, selectividad y estabilidad catalítica en la reacción PROX.
5. Obtención de nanocatalizadores mesoporosos de Co3O4 soportado sobre mallas
metálicas. Estudio de su actividad, selectividad y estabilidad catalítica en la reacción
PROX.

Objetivos 18
2. ORGANIZACIÓN DE LA MEMORIA
La consecución de los objetivos específicos mencionados anteriormente ha tenido como
resultado la publicación de cinco artículos más uno recientemente enviado para su
publicación en ChemCatChem. Por esta razón la presente Memoria se presenta como un
compendio de publicaciones. Además de la Introducción, esta Memoria consta de un
capítulo Experimental en el que se describen tanto los procedimientos de síntesis como
las técnicas de caracterización y los equipos empleados para analizar la actividad
catalítica de las muestras. La siguiente sección está compuesta por el compendio de
artículos, cada uno de los cuales va precedido de un breve resumen donde se recogen
los aspectos fundamentales de los mismos. Finalmente se presentan las principales
Conclusiones derivadas de la realización de este trabajo.
Los artículos incluidos en esta Memoria son los siguientes:
I. The synthesis of high surface area cerium oxide and cerium oxide/silica
nanocomposites by the silica aquagel‐confined co‐precipitation technique.
Irene López, Teresa Valdés‐Solís, Gregorio Marbán. Microporous and Mesoporous
Materials, 127 (2010) 198‐204.
II. An attempt to rank copper‐based catalysts used in the CO‐PROX reaction.
Irene López, Teresa Valdés‐Solís, Gregorio Marbán. International Journal of Hydrogen
Energy, 33 (2008) 197‐205.
III. Preferential oxidation of CO by CuOx/CeO2 nanocatalysts prepared by SACOP.
Mechanisms of deactivation under the reactant stream.
Gregorio Marbán, Irene López, Teresa Valdés‐Solís. Applied Catalysis A: General, 361
(2009) 160‐169.
IV. Copper manganite as a catalyst for the PROX reaction. Deactivation studies.
Teresa Valdés‐Solís, Irene López, Gregorio Marbán. International Journal of Hydrogen
Energy, 35 (2010) 1879‐1887.
V. Highly active cobalt based catalysts prepared by SACOP for the preferential oxidation
of CO in excess hydrogen.
Irene López, Teresa Valdés‐Solís, Gregorio Marbán. Artículo enviado a la revista
ChemCatChem.

19
VI. Highly active structured catalyst made up of mesoporous Co3O4 nanowires supported
on a metal wire mesh for the preferential oxidation of CO.
Gregorio Marbán, Irene López, Teresa Valdés‐Solís, Antonio B. Fuertes. International
Journal of Hydrogen Energy, 33 (2008) 6687‐6695.
Además, otro artículo ha sido publicado durante la ejecución de esta Memoria, aunque
no forma parte de ella por estar fuera del objetivo general de la misma.
A highly active, selective and stable copper/cobalt‐structured nanocatalyst for methanol
decomposition. Gregorio Marbán, Alba López, Irene López, Teresa Valdés‐Solís. Applied
Catalysis B: Environmental, 99 (2010) 257‐264.
3. ASISTENCIA A CONGRESOS
De forma complementaria a las publicaciones indicadas anteriormente han sido
aceptados para su comunicación en congresos los siguientes trabajos:
• Desactivación de catalizadores de cobre en la oxidación preferencial de CO.
I. López, G. Marbán, T. Valdés‐Solís, A. B. Fuertes. IX Reunión del Grupo Español
del Carbón, Teruel 22‐24 Octubre 2007 (póster).
• Reformado catalítico de metanol sobre catalizadores de CuMn2O4 preparados
mediante coprecipitación confinada en gel de sílice. T. Valdés‐Solís, I. López, G.
Marbán, A.B. Fuertes. IX Reunión del Grupo Español del Carbón, Teruel 22‐24
Octubre 2007 (póster).
• Síntesis hidrotermal de catalizadores para el reformado catalítico de metanol. G.
Marbán, I. López, T. Valdés‐Solís, A. B. Fuertes. IX Reunión del Grupo Español del
Carbón, Teruel 22‐24 Octubre 2007 (póster).
• Activity and causes of deactivation in CO‐PROX reaction of CuOx/CeO2
nanocatalysts prepared by SACOP. G. Marbán, I. López, T. Valdés‐Solís. Hyceltec
2008‐ I Simposium Ibérico de Hidrógeno, Pilas de Combustible y Baterías
Avanzadas, Bilbao, 1‐4 Julio (comunicación oral).
• Co3O4 catalyst prepared by inverse SACOP for the preferential oxidation of CO.
I. López, G. Marbán, T. Valdés‐Solís. Hyceltec 2009‐ II Iberian Symposium on
Hydrogen, Fuel Cells and Advanced Batteries, Vila Real, Portugal, 13‐17
Septiembre (comunicación oral).


21
Experimental
1. SÍNTESIS DE CATALIZADORES
1.1. Nanoestructuras no soportadas
a) Método SACOP
El método SACOP [36] (silica aquagel confined co‐precipitation), esquematizado en la
Figura 4, parte del procedimiento descrito por Fuertes [37] para la preparación de
xerogel de sílice utilizando silicato sódico como precursor. Para obtener el hidrogel de
sílice con los iones metálicos incorporados en su fase acuosa, se disolvió el precursor (el
nitrato del metal correspondiente) en una disolución 4 M de HCl o HNO3 con
proporciones molares SiO2/H+/H2O =1/6.54/193.9 y Si/Metal=4 o 1.5. La formación del
hidrogel con los metales dispersos tiene lugar en dos etapas, como ocurre con el
hidrogel de sílice. En la primera etapa, de hidrólisis, la mezcla se agitó a temperatura
ambiente durante 24 h para obtener el ácido silícico a partir del silicato de sodio. En la
segunda etapa la mezcla hidrolizada se sometió a una etapa de condensación que tuvo
lugar a 100°C durante 24 h en condiciones hidrotermales (autoclave cerrado).
Tras la etapa de condensación se obtuvo un gel en cuya fase acuosa se encontraban
disueltos los iones metálicos. Para evitar el lixiviado de los cationes durante el lavado del
gel, se precipitaron previamente en forma de hidróxidos. Para ello fue necesario
aumentar el pH del hidrogel mediante el uso de un agente básico. Dependiendo del
catión metálico se empleó amoniaco en fase vapor o NaOH (directamente en polvo o
bien en disolución). En el caso del óxido de cerio se utilizó amoniaco en fase vapor, para
lo cual se borboteó el agente a través de un tubo en U en el que se encontraba el gel,
hasta la precipitación del hidróxido de cerio. Para el óxido mixto de cobre y cerio,
CuOx/CeO2, y la manganita, CuMn2O4 se empleó NaOH en polvo, para lo cual se fue
vertiendo el agente básico poco a poco sobre el gel controlando la subida del pH. En el
caso de las muestras conteniendo Co3O4/CoOOH se analizaron dos tipos de
precipitación: (i) por vertido del gel sobre una disolución 1.25 M de NaOH y (ii) por
adición de una disolución 3.5 M de NaOH gota a gota sobre el hidrogel.

Experimental 22
NaOH∙SiO2HCl o HNO3
+ nitratos de metal
Hidrólisis y condensación (recipiente cerrado) Hidróxidos no
solubles (lavado, secado y
calcinación)
Adición de un agente básico
Compuestos inorgánicos nanométricos o
nanoestructurados Nanocomposite
Los hidróxidos del metal están confinados en la estructura de la sílice
H2O
Eliminación de la sílice
Figura 4. Esquema del método SACOP.
Una vez llevada a cabo la precipitación de los cationes metálicos en forma de hidróxido,
la pasta resultante se sometió a tres etapas de lavado con agua y centrifugado
(7500 rpm, 3 min), para eliminar las especies solubles. El agua que forma parte del
hidrogel se intercambió posteriormente con acetona en un procedimiento en dos etapas. En la primera de ellas se mantuvo el gel disperso en acetona durante una hora.
Posteriormente el precipitado se filtró y se volvió a verter en acetona donde se mantuvo
durante el tiempo necesario para asegurar el intercambio completo (de 24 a 48 h). Este
procedimiento aseguró la completa sustitución del agua estructural por acetona, lo que
permitió llevar a cabo el secado del gel a temperatura ambiente durante 24h. La sílice
con el hidróxido metálico embebido en su matriz se calcinó en una mufla a la
temperatura correspondiente durante 4 horas (1‐5°C∙min‐1), obteniéndose el composite
óxido metálico/sílice.
La última etapa del procedimiento consistió en la eliminación del molde de sílice para
recuperar las nanoestructuras del óxido metálico. Como procedimiento estándar el
composite de sílice/óxido metálico (~1‐2 g) se dispersó en 50 mL de una disolución de
NaOH (2 M) bajo agitación mecánica a 30°C durante ~48 h, cambiando la disolución a las
24 horas y finalizando con un lavado en agua destilada. Posteriormente el
procedimiento de lavado se optimizó mediante el uso de NaOH 3.5M en un vaso aislado
térmicamente, bajo agitación mecánica y durante 6 h.

23
b) Impregnación de sílice comercial
Adicionalmente se sintetizaron nanocatalizadores de idénticas composiciones a las
obtenidas por SACOP, empleando para ello un método de nanomoldeo convencional
(hard template) con una sílice mesoporosa comercial. Las sales hidratadas de los
metales (nitratos) se disolvieron en etanol. Con esta solución se impregnó hasta
humedad incipiente una sílice comercial (Aldrich, SBET=340 m2∙g‐1, Vp=0.89 cm
3∙g‐1,
δKJS=12.4 nm). La muestra impregnada se secó en estufa a 100°C durante 2 h. El ciclo de
impregnación‐secado se repitió un número de veces (generalmente 5‐6) hasta que toda
la disolución precursora fue impregnada en la sílice. La muestra impregnada final se
calcinó en aire en una mufla en las condiciones adecuadas de tiempo y temperatura
para obtener los óxidos embebidos en la matriz de sílice. La recuperación de las
nanoestructuras se llevó a cabo por eliminación del molde mediante disolución de la
sílice con una etapa estándar de lavado en NaOH (2 M).
1.2. Nanoestructuras soportadas
El método de síntesis de la espinela de cobalto (Co3O4) soportada en una malla metálica
se basó en el utilizado por Li y col [45] para la obtención de este óxido en soportes de
titanio, sílice, etc. La técnica, denominada evaporación inducida de amoniaco
(Ammonia‐evaporation‐induced method), consistió en la mezcla de 35 g de agua y 15 g
de amoniaco al 30% en peso en un vaso de teflón en el que previamente se habían
introducido 10 mmol de Co(NO3)2 y 5 mmol de NH4NO3. La mezcla se agitó
magnéticamente durante media hora al aire y una vez retirado el imán se introdujo en
su seno la malla de acero inoxidable limpia, de dimensiones 5 cm x 3 cm (diámetro de
alambre=29 μm y 45 μm de luz de malla). El recipiente se cubrió con un vidrio de reloj y
la malla permaneció en la disolución a 90°C durante 17 horas. Después la malla se
sometió a un lavado con abundante agua destilada y se secó a 50°C en una estufa de
vacío. Por último, se calcinó en aire a 250°C durante 2 horas. En la Figura 5a se muestran
dos mallas, la de la derecha es la malla limpia sin recubrir y a la izquierda se muestra el
aspecto final de la malla recubierta de nanoestructuras de Co3O4. Una microfotografía
de estas nanoestructuras se reproduce en la Figura 5b.

Experimental 24
200 μm
a
b
200 μm200 μm
a
b
Figura 5. (a) Aspecto de las mallas catalíticas en dos momentos distintos de su obtención; (b) microfotografía SEM de la malla recubierta por las nanoestructuras de Co3O4. En el inserto se puede observar la malla metálica sin recubrir.
Para el análisis de la actividad catalítica de las mallas, éstas se enrollaron y se
introdujeron en reactores tubulares de acero de 1/4´´ de diámetro externo. Durante
esta operación resultó inevitable el desprendimiento de algunas partículas. Para
minimizar estas pérdidas, la malla hubo de ser previamente recubierta con una capa de
alcohol polivinílico (polyvinyl alcohol, PVA). Para ello, se sumergió en una disolución
acuosa de PVA (9000‐10000 g∙mol‐1) al 2% en peso, después se eliminó el exceso de PVA
soplando suavemente con aire y por último la malla se secó a vacío a 40°C durante
20 min. Una vez insertada en el reactor, el conjunto se sumergió nuevamente en un
baño de agua durante algunas horas para eliminar la capa protectora por disolución del
PVA. Para finalizar el conjunto reactor/malla se secó a vacío a 50°C.

25
2. CARACTERIZACIÓN DE LOS MATERIALES
2.1. Difracción de rayos X
La determinación de las fases activas de los catalizadores se llevó a cabo mediante
difracción de rayos X. Para obtener los difractogramas de las muestras preparadas se
utilizó un equipo Siemens D5000, provisto de un ánodo de cobre con radiación CuKα
(λ=0.15406 nm). El equipo trabaja a 40 kV y 20 mA y dispone de los programas Diffrac At
y Eva para interpretar los espectros. El ángulo de barrido 2θ se varió entre 10 y 90°. Las
muestras se prepararon por el método de polvo soportado en un portamuestras de
polimetilmetacrilato.
El tamaño de cristal se obtuvo aplicando la ecuación de Scherrer a picos seleccionados
de los espectros de difracción [47]:
θ⋅βλ⋅
=cosk
dXRD (E1)
Donde dXRD es el diámetro de cristal en nm, λ es la longitud de onda de la radiación, 0.15406 nm, θ es el ángulo de difracción del pico analizado, k es la constante de Scherrer, que toma un valor medio de 0.89, y β es la anchura a media altura del pico
expresada en radianes.
2.2. Isotermas de adsorción de N2
Las isotermas de adsorción física de N2 a ‐196°C se obtuvieron en dos equipos
Micromeritics ASAP 2010 y 2020. El área superficial (SBET) se dedujo del análisis de la
isoterma en el intervalo de presión relativa de 0.04 a 0.20. El volumen total de poros (Vp)
se calculó a partir de la cantidad de N2 adsorbido a una presión relativa de 0.99. El
diámetro efectivo de partícula (dBET) se calculó a partir del valor del área superficial y
considerando partículas esféricas de igual tamaño, según la siguiente expresión:
BETóxidoBET S
6d
⋅ρ= (E2)
Donde ρóxido es la densidad real del óxido metálico. La distribución de tamaños de poro
(pore size distribution, PSD) se determinó aplicando el método de Kruk‐Jaroniec‐Sayari
(KJS) a la rama de adsorción [48], y se consideró como tamaño medio de poro (δKJS) el correspondiente al máximo de la curva PSD.

Experimental 26
2.3. Microscopía electrónica de barrido (SEM) y análisis por energía
dispersiva de rayos X (EDX)
La microscopía electrónica de barrido (SEM) permite la observación y caracterización
superficial de materiales sólidos, tanto inorgánicos como orgánicos. En este trabajo se
empleó un microscopio Zeiss DSM 942 equipado con un analizador Oxford Link‐Isis de
energía dispersiva de rayos X (EDX) para establecer la composición superficial de la
muestra analizada.
2.4. Microscopía electrónica de transmisión (TEM)
La microscopía electrónica de transmisión permite observar la aglomeración y el tamaño
efectivo y la forma de las nanopartículas y de los materiales nanoestructurados
obtenidos. Las micrografías se obtuvieron en un microscopio electrónico de transmisión
JEOL 2000 EX‐II, operando a 160 kV y con un poder de resolución de 3.4 Å entre líneas.
2.5. Espectroscopía infrarroja por transformada de Fourier (FTIR)
La espectroscopía infrarroja es una técnica muy extendida en la caracterización
cualitativa y cuantitativa de la superficie de materiales sólidos. Se utilizó un
espectrofotómetro Nicolet Magna‐IR System 560 para obtener los espectros IR. El sólido
fue dispersado en una matriz de KBr con una proporción de 1 mg de material en 100 mg
de KBr. Se prepararon tres pastillas por muestra.
2.6. Espectroscopía fotoelectrónica de rayos X (XPS)
La espectroscopía fotoelectrónica de rayos X es una técnica analítica de superficies
ampliamente utilizada en la actualidad. Los espectros XPS se obtuvieron en un equipo
Specs Phoibos 100 que emplea una fuente de radiación de rayos X con doble ánodo de
MgKα (1253.6 eV) trabajando a 50W. Los espectros obtenidos fueron corregidos
empleando la energía de enlace del carbono adventicio (284.6 eV) en la región C1s.
Todas las regiones analizadas fueron sometidas a desconvoluciones de tipo mixto
Gaussiana‐Lorentziana (90:10). Para los análisis cuantitativos se emplearon los factores
de sensibilidad disponibles en la base de datos del programa CasaXPS (v2.3.12Dev6).

27
2.7. Reducción a temperatura programada (TPR)
La reducción a temperatura programada de las muestras se llevó a cabo en un
analizador AutoChem II equipado con un detector TCD y un espectrómetro de masas. En
un experimento estándar se emplearon aproximadamente 25 mg de muestra por la que
se hizo pasar un flujo de 50 mL∙min‐1 de una corriente compuesta por un 10% de
hidrógeno diluido en Ar. Las muestras se calentaron hasta 600 u 850°C a 5°C∙min‐1.
2.8. Termogravimetría (TG)
Los experimentos de termogravimetría permiten determinar la variación de masa que
experimenta una muestra durante su calentamiento en atmósfera controlada. Los
análisis se llevaron a cabo en una termobalanza CI Electronics, tratándose la muestra en
un flujo continuo de N2 de 100 mL∙min‐1 con una velocidad de calentamiento de
5°C∙min‐1 hasta 700°C.
3. ANÁLISIS DE ACTIVIDAD CATALÍTICA
3.1. Reactores
Los análisis de actividad PROX se llevaron a cabo en tres dispositivos experimentales
diferentes, que se detallan a continuación.
a) Reactor de cuarzo
Se empleó un reactor de cuarzo de 7 mm de diámetro interno insertado en un horno
eléctrico vertical de temperatura programada. La muestra (15‐30 mg) se diluyó con
carburo de silicio (285‐275 mg) y se colocó entre dos capas de fibra de vidrio, para evitar
gradientes de temperatura en el lecho y trabajar en condiciones de flujo de pistón. La
temperatura de la muestra se midió mediante un termopar situado encima del lecho
catalítico. El análisis de los gases de salida del reactor se realizó mediante un
cromatógrafo de gases HP 6890 equipado con un detector TC.

Experimental 28
b) Microrreactor de acero
Para analizar la actividad catalítica de las nanopartículas de Co3O4 soportadas en la malla
metálica se construyó un reactor de acero con un diámetro de 1/4’’ y 3 cm de altura, tal
y como se muestra en la Figura 6. La malla metálica se enrolló para introducirla dentro
del tubo y una vez colocada se procedió a retirar la capa protectora de alcohol
polivinílico mediante un lavado con agua destilada, como se indicó en el apartado 1.2 de
esta sección Experimental. Después de esta operación se unieron sendas tuberías de
acero de 1/8’’ por ambos extremos del reactor para la entrada y salida de gases y el
conjunto se insertó en el horno vertical descrito en el apartado anterior. La temperatura
de la muestra se midió por medio de un termopar situado en el microrreactor. La mezcla
de gases de reacción se obtuvo a partir de botellas patrón empleando controladores de
flujo másico. El análisis de los gases de salida del reactor se realizó mediante un
cromatógrafo de gases HP 6890 equipado con un detector TC.
Malla enrrollada
Tubo de 3/8’’ con racores
Malla enrrollada
Tubo de 3/8’’ con racores
Malla enrollada
Tubo de 1/4’’ con racores
Figura 6. Microrreactor de acero relleno de la malla catalítica.
c) Reactor multicanal
Por último, para llevar a cabo las reacciones PROX en la etapa final de la tesis, se empleó
un sistema de reacción multicanal diseñado en nuestro laboratorio. El equipo consta de:
(a) un sistema de entrada de gases; (b) un sistema de direccionamiento y división de las
corrientes de fluidos, consistente en una zona de válvulas y controladores de presión
automatizados para regular la presión y entrada de flujo hacia los distintos reactores;
(c) un sistema de 6 reactores insertos en un horno eléctrico de temperatura
programable y (d) un sistema de análisis que comprende una válvula de multiposición

29
para seleccionar el reactor cuyo gas de salida va a ser analizado y un espectrómetro de
masas.
En la Figura 7a se observa una fotografía del sistema de reacción multicanal, con la
estufa en la parte superior y el sistema de direccionamiento de flujo en la parte inferior.
En la imagen 7b se muestra en detalle la parte superior de los seis reactores metálicos y
la localización del termopar de control, mientras que en la Figura 7c se ofrece una
captura de pantalla del programa de control del sistema de reacción multicanal.
Figura 7. (a) Fotografía del reacción multicanal; (b) detalle desuperior de los seis reactores; (c) pantalla del programa de control demulticanal.
sistema de la parte
captura de l sistema
R-1R-6 T1 control
a b
c
Las principales características de este sistema se enumeran a continuación:
‐ Permite analizar simultáneamente la actividad catalítica de hasta 6 muestras.
‐ Permite operar a temperaturas de hasta ∼400°C, con control programado de múltiples
etapas de calentamiento por medio de una resistencia eléctrica. Un termopar insertado
en dicha resistencia eléctrica controla la temperatura de reacción (Fig. 7b), mientras que
dos termopares adicionales situados cada dos reactores permiten conocer las
diferencias de temperatura entre los reactores.

Experimental 30
‐ Se pueden emplear presiones de trabajo de hasta 16 atmósferas.
‐ Se pueden alimentar dos corrientes de fluidos de forma automatizada: el fluido test
para el análisis de actividad de los catalizadores y el fluido inerte (He) para llevar a cabo
pretratamientos y para mantener la presión del sistema. La composición del fluido test
se regula por medio de controladores de flujo, mientras que el flujo de la corriente que
entra a cada reactor se controla de forma individualizada por medio de un conjunto de
controladores analógicos de flujo másico.
‐ Todo el sistema de alimentación y reacción se encuentra calefactado, bien con hilo
térmico o en estufa, para poder introducir y analizar tanto corrientes gaseosas como de
vapores.
‐ El análisis de la concentración de los fluidos de entrada y salida del reactor se lleva a
cabo por medio de un espectrómetro de masas (Modelo Omnistar 300O de Baltzers)
operando en línea.
‐ La selección del reactor cuya corriente de salida ha de ser analizada se lleva a cabo por
medio de una válvula de multiposición automatizada.
‐ El control de las válvulas de todo o nada, de la válvula de multiposición, de los
controladores de presión, del calentamiento/enfriamiento de los reactores y del
espectrómetro de masas se lleva cabo por medio de un programa de control (en
entorno Windows, Fig. 7c), lo cual permite la operación desatendida del reactor durante
largos períodos de tiempo.
Una parte fundamental de este equipo es el conjunto de reactores de acero. Cada uno
tiene un diámetro interno de 3.86 mm y el catalizador se sitúa entre dos zonas de fibra
de vidrio, como se indica en la Figura 8. La fibra de vidrio de la zona inferior se apoya en
un tubo de 1/8’’ situado dentro del reactor. El sistema de cierre de los reactores de
acero, por medio de juntas tóricas de vitón, permite la inserción y extracción de los
mismos mediante tapones de doble muelle que se enroscan y desenroscan de forma
manual, asegurando la completa estanqueidad del sistema a la mayor presión de
operación (16 atm). En la Figura 9 se muestran las distintas piezas de un tapón de doble
muelle (uno de los muelles está situado en el interior del cuerpo cilíndrico que aparece
en el centro de la figura).

31
Muestra
Tubo de 1/8” Reactor 1/4”
Fibra de vidrio
Entrada de gases
Muestra
Tubo de 1/8” Reactor 1/4”
Fibra de vidrio
Entrada de gases
Salida de gasesSalida de gases
Muestra
Tubo de 1/8” Reactor 1/4”
Fibra de vidrio
Entrada de gases
Muestra
Tubo de 1/8” Reactor 1/4”
Fibra de vidrio
Entrada de gases
Salida de gasesSalida de gases
Figura 8. Esquema de un reactor de acero del sistema multicanal.
Figura 9. Despiece del tapón de doble muelle de un reactor de acero del sistema multicanal.
En cada ensayo estándar con nanoestructuras sin soportar se emplearon 5.5 mg de
catalizador diluidos en 75 mg de carburo de silicio, y se hizo pasar un flujo de
∼35 mL∙min‐1 de mezcla gaseosa por cada uno de los 6 reactores, obteniéndose
velocidades espaciales muy elevadas, de aproximadamente 39000 h‐1.
En la Figura 10 se muestra un esquema general del sistema de reacción multicanal.

Experimental 32
Fluido testFluido inerte
Controladores
MF MF MF MF MF MF
Espectrómetro de masas (Omnistar 300O)
U3
U1-3
Controladoresde presión
MF Microfiltros
Sistema de reactores
Válvula multiposición
U12-28Válvulasantirretorno(rosa = 1/3 psi, blanco = 2 psi)
Válvulas on-off (v1-30)
U13
Entrada de gases externa(sistema de 6 controladores de flujo)
200‐500 mL/min, 1 atm
200‐500 mL/min, 1 atm
Hasta ~16 atm
U4 U5 U6 U7 U8 U9
U10 U11
Controladores de flujomásico (U4-11)
Capilar
R1 R2 R3 R4 R5 R6
LEYENDA
Elementos en estufa
Líneascalefactadas
U21 U23 U25U15 U17 U19
U16 U18 U20 U22 U24
U27
U28
BPC BPC U2U1
U26
v24v23
v22v21
v20v19
v18v17
v16v15
v14v13
v12v11
v10v9
v8v7
v6v5
v4v3
v2v1
v25
v27
v26
28 v30
VenteoU12
Válvula FPC
U14v29
(0-100)
(0-100)
(0-100)
(0-100)
(0-100)
(0-100)
(0-100)
(0-500)Manometro
Venteo
Fluido testFluido inerte
Controladores
MF MF MF MF MF MF
Espectrómetro de masas (Omnistar 300O)
U3U3
U1-3U1-3
Controladoresde presión
MF Microfiltros
Sistema de reactores
Válvula multiposición
U12-28Válvulasantirretorno(rosa = 1/3 psi, blanco = 2 psi)
Válvulas on-off (v1-30)
U13
Entrada de gases externa(sistema de 6 controladores de flujo)
200‐500 mL/min, 1 atm
200‐500 mL/min, 1 atm
Hasta ~16 atm
U4 U5 U6 U7 U8 U9
U10 U11
Controladores de flujomásico (U4-11)
Capilar
R1 R2 R3 R4 R5 R6
LEYENDA
Elementos en estufa
Líneascalefactadas
U21 U23 U25U15 U17 U19
U16 U18 U20 U22 U24
U27
U28
BPC BPC U2U2U1U1
U26
v24v24v23v23
v22v22v21v21
v20v20v19v19
v18v18v17v17
v16v16v15v15
v14v14v13v13
v12v12v11v11
v10v10v9v9
v8v8v7v7
v6v6v5v5
v4v4v3v3
v2v2v1v1
v25v25
v27v27
v26v26
2828 v30v30
VenteoU12
Válvula FPC
U14v29v29
(0-100)
(0-100)
(0-100)
(0-100)
(0-100)
(0-100)
(0-100)
(0-500)Manometro
Venteo
Figura 10. Esquema del sistema de reacción multicanal

33
3.2. Procedimiento experimental y análisis de datos
La metodología seguida en la determinación de la actividad catalítica de los
catalizadores preparados fue independiente del reactor utilizado. En la Figura 11 se
representa esquemáticamente el modo de operación. Durante el pretratamiento de las
muestras se realizó el calibrado del equipo detector (cromatógrafo de gases o
espectrómetro de masas) haciendo pasar el gas patrón o la mezcla de gases patrones
directamente al analizador por el circuito alternativo al reactor (bypass).
R e a c c i ó n
Calibrado
Pre‐tratamiento
Calibrado
Pre‐tratamiento
R e a c c i ó n
Calibrado
Pre‐tratamiento
Calibrado
Pre‐tratamiento
Figura 11. Procedimiento experimental para las reacciones PROX.
En función del analizador utilizado se modificó el procedimiento para hacer los
calibrados. Con el cromatógrafo de gases el calibrado se realizó pasando hacia el
analizador la mezcla de reacción mientras que en el caso del espectrómetro de masas se
hizo pasar primero cada gas por separado y después la mezcla de reacción.
Posteriormente, durante la etapa de reacción, se hizo pasar la mezcla de gases por el
reactor y se tomaron los datos en continuo. Tras las etapas de reacción se finalizó el
experimento con un nuevo calibrado. Para considerar la deriva de las señales obtenidas
por medio del espectrómetro de masas en experimentos de larga duración, se llevaron a
cabo calibrados intermedios durante las etapas de enfriamiento de dichos
experimentos. Tanto al emplear el cromatógrafo de gases como el espectrómetro de
masas se inició la etapa de reacción sólo tras haber obtenido una señal estable de la
mezcla de gases en la etapa de calibrado.
El pretratamiento de las muestras se llevó a cabo siempre con una corriente de He, a
temperaturas en torno a 200°C. En los reactores de cuarzo y acero conectados al
cromatógrafo de gases se utilizaron dos tipos de mezcla durante la etapa de reacción
PROX; de baja y alta concentración. La mezcla de baja concentración (low concentration,
LC) estuvo compuesta por 300 ppm CO, 300 ppm O2 y 10000 ppm H2 (resto helio),
mientras que la de alta concentración (high concentration, HC) estuvo formada por 5000
ppm CO, 5000 ppm O2 y 25% H2 (resto helio). En el caso del sistema de reacción

Experimental 34
multicanal se utilizó la siguiente mezcla gaseosa: 4000 ppm CO, 4000 ppm O2 y 15% H2
en helio.
La conversión de CO obtenida durante la reacción PROX se evaluó a partir de los datos
de composición de gases ofrecidos por los analizadores como:
[ ][ ]in
outCO CO
CO1X −= (E3)
Donde [CO]in y [CO]out son las concentraciones de CO a la entrada y a la salida del
reactor.
Un parámetro importante en la reacción PROX es la selectividad, S, es decir, la
proporción de oxígeno que oxida el CO a CO2 frente al que se consume en la indeseada
oxidación del hidrógeno para formar agua. Este parámetro se evaluó mediante la
siguiente expresión:
[ ] [ ]( )[ ] [ ]out2in2
outin
OO
COCO5.0S
−−⋅
= (E4)
[O2]in y [O2]out son las concentraciones de oxígeno a la entrada y a la salida del reactor.
La cantidad de oxígeno estequiométrica necesaria para oxidar todo el CO a CO2 es la
mitad en moles del CO alimentado. Sin embargo, dado que la reacción simultánea de
oxidación del hidrógeno se produce en cierta extensión, conviene alimentar un exceso
de oxígeno para poder obtener conversiones totales de CO. El exceso de oxígeno
respecto del estequiométrico viene definido por el parámetro de operación λ:
[ ][ ]out
in2
CO
O2 ⋅=λ (E5)
En la mayoría de los experimentos llevados a cabo para la realización de este trabajo, el
parámetro λ adoptó el valor de 2, es decir, se alimentó el doble de la cantidad
estequiométrica requerida.
Por otra parte, con el propósito de comparar los catalizadores preparados en nuestro
laboratorio con los publicados en la literatura, se calculó su actividad catalítica
asumiendo un mecanismo tipo Langmuir‐Hinshelwood para la oxidación de CO sobre
catalizadores de cobre y cerio descrito por Liu y Flytzani‐Stephanopoulos [15], cuyas
expresiones matemáticas se muestran a continuación:

35
COL
mOCOLL
CO PK1
PPKkr 2
+= (E6)
( )RT/EexpAk L,aLL −= (E7)
( )RT/QexpBK LL = (E8)
Donde PCO y PO2 son las presiones parciales de CO y O2; KL es la constante de equilibrio
de adsorción de CO y kL es la velocidad de reacción superficial de CO, que se asume
como la actividad catalítica intrínseca. Para el cálculo de kL (molCO∙gcat‐1∙s‐1∙bar‐m) se
tomaron en consideración los valores de m y KL determinados por Sedmak y col. [49]
para catalizadores CuOx/CeO2 nanoestructurados (m=0.15; KL=7.53 exp[8700/RT] [=]
bar‐1; R [=] J∙mol‐1K‐1). Asumiendo reactor integral y flujo de pistón, se obtuvo la
siguiente expresión para kL:
( )
⎪⎪⎪
⎭
⎪⎪⎪
⎬
⎫
⎪⎪⎪
⎩
⎪⎪⎪
⎨
⎧
⎥⎥
⎦
⎤
⎢⎢
⎣
⎡
⎟⎟⎠
⎞⎜⎜⎝
⎛−−
−+
⎟⎟⎠
⎞⎜⎜⎝
⎛−−
= ∫−
X
0
m1
CO0O
0CO
0OL
m
0O
0CO
CO
COm0
O0COL
cat
0CO
L XP
P5.011
m15.0
PK
P
P5.01)X1(
dX
PPK
wF
k2
2
2
2
(E9)
En esta ecuación los superíndices 0 indican las propiedades de la corriente de gas a la
entrada del reactor; XCO es la conversión de CO a CO2; FCO es el flujo molar de CO
(mol∙s‐1) y wcat es la masa de catalizador (g).
De modo análogo, para comparar la selectividad de los catalizadores se definió el
parámetro TS=0.8 como la temperatura a la cual la selectividad hacia la formación de CO2
es mayor o igual que 0.8.


37
Resumen artículo I.
THE SYNTHESIS OF HIGH SURFACE AREA CERIUM OXIDE AND CERIUM
OXIDE/SILICA NANOCOMPOSITES BY THE SILICA AQUAGEL‐CONFINED
CO‐PRECIPITATION TECHNIQUE
Síntesis de óxido de cerio y nanocomposites óxido de cerio/sílice de
elevada superficie específica mediante la técnica de co‐precipitación
confinada en hidrogel de sílice.
La obtención de nanopartículas o nanoestructuras de elevada superficie específica es
objeto de una extensa investigación. En el ámbito de la catálisis es bien conocida la
relación entre tamaño de partícula y actividad catalítica, por lo que resulta indispensable
sintetizar catalizadores con una elevada área superficial activa. Con la intención de
obtener óxidos metálicos de elevada área superficial, en nuestro laboratorio se ha
desarrollado recientemente la técnica de co‐precipitación confinada en hidrogeles de
sílice (SACOP, silica aquagel confined co‐precipitation), técnica basada en la
precipitación de hidróxidos altamente dispersos en un hidrogel de sílice, descrita en
detalle en la parte Experimental. En el presente trabajo se han optimizado diversos
parámetros del método SACOP para la obtención de óxido de cerio con elevada
superficie específica. El CeO2 es un compuesto con un gran interés industrial debido a
sus propiedades redox, su capacidad de almacenamiento de oxígeno y a que mejora la
dispersión de los metales cuando se emplea como soporte de catalizadores. Debido a
estas características en los últimos años ha sido extensamente investigado en mezclas
con óxido de cobre para la oxidación preferencial de CO.
Dado que el método SACOP es un procedimiento reciente resulta indispensable
optimizar las distintas variables de síntesis, teniendo en cuenta los mecanismos de
interacción de los cationes metálicos con el hidrogel de sílice. Estos mecanismos se han
analizado comparando las características del xerogel de sílice, los nanocomposites
SiO2‐CeO2 y las nanoestructuras de CeO2. Se ha estudiado la influencia de los distintos
precursores así como de las condiciones de proceso sobre la formación de óxido de
cerio: (i) tipo de ácido (HCl o HNO3) y relación molar sílice/ácido (Si/H+);
(ii) concentración de cerio en la solución precursora (Ce/Si); (iii) tiempo de
envejecimiento del hidrogel y (iv) procedimiento de eliminación del molde de sílice. Las
principales conclusiones de este estudio han sido las siguientes:

Artículo I 38
‐Tipo de ácido y relación molar Si/H+: los xerogeles de sílice preparados con HNO3
presentan áreas superficiales ligeramente superiores a los preparados con HCl,
aumentando dichas áreas con el incremento de la relación molar Si/H+. Las
correspondientes nanoestructuras de CeO2 presentan elevadas áreas superficiales
(140‐200 m2∙g‐1) y tamaños de cristal de 2‐3 nm. Sin embargo, las características
texturales de las partículas de CeO2 no reflejan la estructura de sus xerogeles homólogos
debido a que la estructura de la sílice colapsa durante el proceso de precipitación. Para
las siguientes etapas de la optimización del método se escogió la relación Si/H+=0.15
porque permite la obtención del xerogel con el volumen de poro mayor, lo cual favorece
el empleo de mayores cargas de cerio durante la síntesis. Asimismo se optó por el uso
de HNO3 para evitar posibles contaminaciones por trazas de productos clorados.
‐Relación molar Ce/Si: el aumento de la cantidad de cerio en los composites da lugar a
una disminución del área superficial y del volumen de poros de los mismos,
disminuyendo asimismo su tamaño medio de poro. En el caso de las nanoestructuras de
CeO2, el aumento de la cantidad de cerio desde una relación molar Ce/Si de 0.25 hasta
1.00 da lugar a un incremento del tamaño efectivo de partícula de 4.6 a 6.4 nm, aunque
siempre por debajo del tamaño medio de poro de la sílice original (11.4 nm). Los valores de superficie específica de las muestras preparadas con una elevada concentración de
cerio siguen siendo muy altos (130‐180 m2∙g‐1). En este trabajo se propone un
mecanismo de formación de las nanopartículas en el que el proceso de precipitación
produce el colapso de la microestructura interna del hidrogel de sílice sobre los
hidróxidos metálicos, siendo este fenómeno el responsable de las variaciones texturales
observadas.
‐Tiempo de envejecimiento del hidrogel: el tiempo de envejecimiento tiene una escasa
influencia sobre el área superficial de los xerogeles de sílice. En cambio sí que se observa
cierta tendencia tanto en el volumen de poros como en el tamaño medio de poro, que
experimentan una disminución a los 5 días para después aumentar a los 20 días de
tratamiento. Por lo observado, el envejecimiento tiene lugar de forma análoga a la
descrita por Okkerse (Physical and chemical aspects of adsorbents and catalysts.
Academic Press, Londres, 1970), en dos etapas: (1) reforzamiento de la estructura y (2)
disolución‐reprecipitación de las partículas más pequeñas de sílice sobre otras partículas
de sílice (mecanismo “Ostwald ripening”).
Los nanocomposites presentan valores del área superficial muy similares para los
distintos tiempos de envejecimiento (334‐360 m2∙g‐1). Se observa en dichos materiales
cierta tendencia por la cual el volumen y tamaño medio de poros aumentan ligeramente

39
hasta llegar a un máximo para tiempos de envejecimiento en torno a 5‐10 días, a partir
del cual dichos parámetros comienzan a disminuir. Las tendencias observadas son
consecuencia de complejas relaciones entre la estructura de gel envejecido antes de
llevarse a cabo la precipitación y la del composite una vez producida dicha precipitación.
El resultado de estas interacciones se explica mediante una combinación del mecanismo
de envejecimiento del hidrogel de sílice con el de disolución‐reprecipitación de la sílice
durante el proceso de precipitación. Sin embargo, ninguno de estos mecanismos se ve
reflejado en el tamaño de cristal obtenido para el CeO2, lo que indica que las
características finales de las nanoestructuras obtenidas están principalmente
influenciadas por la carga de cerio en la solución precursora y el colapso de la estructura
de la sílice durante la precipitación.
‐Eliminación del molde de sílice: todas las muestras de CeO2 presentan una cierta
cantidad de sílice residual (4‐10% en peso). Durante la eliminación de sílice de los
nanocomposites CeO2/SiO2 se encontró que el empleo de NaOH 3.5 M, en vez de 2 M o
5 M, mejoraba la eficacia del proceso. Por otro lado, se observó una proporcionalidad
directa entre la cantidad de sílice residual y el tamaño de partícula. Las partículas más
pequeñas (obtenidas con relaciones bajas Ce/Si) presentan una mayor relación de
superficie externa a volumen de partícula y por lo tanto la interacción superficial de
dichas partículas con la sílice es mayor, dificultándose así su eliminación. Se comprobó
que una relación elevada entre el volumen de disolución de NaOH y la masa de
nanocomposite, así como un número adecuado de etapas de lavado permitía alcanzar
bajos contenidos en sílice residual (∼4% en peso).
En conclusión, las nanoestructuras de CeO2 obtenidas mediante el método SACOP
presentan áreas superficiales en el intervalo 140‐200 m2∙g‐1, con tamaños de partícula
que oscilan entre los 4‐6 nm, dependiendo de las condiciones de preparación. El tamaño
de partícula de CeO2 se puede controlar modificando la concentración de cerio en la
solución precursora. Las elevadas áreas superficiales obtenidas mediante el método
SACOP se deben al colapso de la sílice sobre los hidróxidos metálicos durante la etapa de
precipitación. Asimismo, el envejecimiento del hidrogel no produce variaciones
significativas en el tamaño final de las partículas de óxido de cerio.


41
Artículo I.
1. Introduction
The preparation of high surface area
metal oxide is currently the subject of
extensive research due to their multiple
applications in different areas (elec‐
tronic devices, sensing, biomedicine,
catalysis, etc.). In the field of catalysis,
the well‐known relationship between
particle size and catalytic activity [1] is
evidence of the importance of develop‐
ing techniques to fabricate nanoparticles
with tailored sizes. Furthermore, when
conveniently immobilised in the appro‐
priate supports [2, 3], catalyst nanopar‐
ticles present clear advantages over
conventional catalysts in terms of en‐
hanced active phase distribution [4] and
catalytic activity [5].
High surface area metal oxide can be
obtained by various methods, including
precipitation [6‐9], hydrothermal syn‐
thesis [10‐12], solvothermal synthesis
[13], sol‐gel [14‐16], microemulsion [17‐
22], template procedures [23‐26], pyro‐
lysis [27], etc. These methods are espe‐
cially suitable for the preparation of
nanometric metal oxide particles (below
~100 nm). Recently we developed a
novel template procedure (silica
aquagel ‐ confined co ‐ precipitation
(SACOP)) to synthesise (mixed) metal
oxides with surface area values that are

Artículo I 42
considerably higher than those obtained
by most of the other techniques re‐
ferred to above [28]. SACOP is a modi‐
fied silica‐template route that is based
on the forced precipitation of metal
hydroxides (MOH) in a silica aquagel
medium. Subsequent thermal treatment
of the dried composite (MOH‐SiO2)
causes metal oxide nanoparticles to
form in the silica mesopores. This
method results in a better metal distri‐
bution on the silica matrix than that
achieved by the conventional hard‐
template route and allows higher metal
oxide to silica mass ratios to be achieved
in one single step. The final removal of
the silica matrix produces either metal
oxide nanoparticles or nanostructures,
depending on the type of oxide used
[28]. As SACOP is a novel procedure, it is
necessary to perform a systematic inves‐
tigation of the synthesis parameters that
influence the final surface area (or parti‐
cle size) of the oxides. This is the aim of
this work. This information may also
serve to clarify the mechanisms that
cause SACOP to produce nanostructures
with a lower effective particle size than
those obtained by the conventional sil‐
ica‐template route [29].
Out of the numerous metal oxides that
could have been employed to perform
this investigation, we selected cerium
oxide due its unique redox and oxygen
storage properties [30], which make it
highly suitable for a variety of catalytic
applications. For example, ceria is an
additive in automobile exhaust catalysts
(three way catalysts) and is also com‐
monly used as a support in a large num‐
ber of different catalysts because of its
ability to facilitate the dispersion of base
metals [31].
In this work we have analysed the effect
of different synthesis parameters on the
surface area (or effective particle size) of
cerium oxide nanostructures prepared
by SACOP, and we have tried to clarify
the synthesis mechanisms of the nanos‐
tructures obtained. To this end we fo‐
cused our attention on the following
parameters: (i) the type of acid, (ii) the
silica/acid molar ratio (Si/H+), (iii) the
cerium concentration in the synthesis
suspension (Ce/Si), (iv) the aquagel age‐
ing time and (v) the silica removal pro‐
cedure.
2. Experimental
2.1. Preparation of materials
Cerium oxide was prepared by the
silica aquagel‐confined co‐precipitation
method as reported elsewhere [28].
Cerium nitrate hexahydrate was dis‐
solved in an acid solution (HCl or HNO3
in water, 4 M) which was then added
dropwise to the sodium silicate suspen‐
sion under stirring (final Si/H2O molar
ratio = 0.005). Hydrolysis was carried out
at RT for 24 h in an autoclave, and then

López et al. Microp. Mesop. Mat 127 (2010) 198‐204 43
the solution was heated in an oven at
100°C for 24 hours (condensation step).
After cooling, the metallic cations in the
gel were subjected to precipitation with
NH3 vapour. During this process pH in‐
creases from very acid values (pH~0) to pH=8. The so formed cerium hydroxide
is not dissolved during the subsequent
washing steps. The slurry was repeat‐
edly washed with water and dispersed in
acetone. The sample was then filtered,
dried at RT and calcined at 550°C
(1°C∙min‐1). To analyse the effect of the
synthesis process on the final properties
of the nanostructures, the following
parameters were taken into account:
(i) the acidity of the medium: Si/H+ mo‐
lar ratio = 1.00, 0.33 and 0.15; (ii) the
amount of cerium: Ce/Si molar ratio =
0.25, 0.50 and 1.00; (iii) the aquagel
ageing time (0‐30 days) and (iv)
the procedure used to remove the silica
matrix. The initial procedure for remov‐
ing the silica matrix was by dissolution in
aqueous NaOH (2 M) at ~30°C for two days.
The effect of the metallic ions on the gel
was indirectly evaluated by comparing
the nanocomposites (SiO2‐CeO2) and
nanoparticles (CeO2) with the samples of
cerium‐free silica xerogels (SiO2). These
samples were prepared like the nano‐
composites, except that there was no
cerium nitrate in the precursor solution,
which eliminated the need for the pre‐
cipitation step.
2.2. Characterisation of materials
The nitrogen adsorption and desorption
isotherms were evaluated at ‐196°C on a
Micromeritics ASAP 2010 volumetric
adsorption system. The BET surface area
was inferred from the isotherm analysis
in the relative pressure range of 0.04 to
0.20. The Pore Size Distributions (PSD)
were calculated by means of the Kruk‐
Jaroniec‐Sayari method [32], and char‐
acterised by the average pore size (δKJS). An effective particle size for the result‐
ing particles was evaluated from the
values of the BET surface area and the
true density of the oxides by assuming
spherical geometry (dBET). The metal
distributions and silica contents of the
samples were studied by means of a
Scanning Electron Microscope (Mod.
DSM 942, Zeiss) and an attached Energy
Dispersive X Ray Detector (EDX). X‐ray
diffraction (XRD) patterns were obtained
in the wide‐angle range (2θ=10‐90°) on a
Siemens D5000 instrument operating at
40 kV and 20 mA, using Cu Kα radiation
(λ=0.15406 nm). The crystal size values
were estimated from the XRD patterns
by applying Scherrer’s equation (dXRD). In
the case of the XRD spectra all the re‐
ported peak areas, positions and widths
were the result of Gaussian‐Lorentzian
fittings. The structure of the prepared
oxides was characterised by Transmis‐
sion Electron Microscopy (TEM‐JEOL
1010).

Artículo I 44
3. Results and discussion
3.1. Acid type and concentration in the
precursor suspension
Samples of cerium‐free silica xerogels
and cerium oxide were obtained by us‐
ing two different acids, HCl and HNO3, at
different concentrations in the synthesis
suspension (Si/H+ = 1.00, 0.33 and 0.15).
The structural characteristics of these
samples are summarized in Table 1.
The porous structure of the silica xe‐
rogels is clearly influenced by the Si/H+
molar ratio used during their synthesis
[33] as is shown in Table 1. It can be
seen that the xerogels prepared with
HNO3 have slightly higher BET surface
areas than those obtained with HCl. This
demonstrates the feasibility of synthe‐
sizing the gel with HNO3 and avoids pos‐
sible chlorine contamination arising
from the use of HCl. As already reported
for similar materials [33], the BET sur‐
face area values of the cerium‐free xe‐
rogels increase with the Si/H+ molar
ratio. For all the silica samples these
values are higher than 500 m2∙g‐1. How‐
ever, although the CeO2 oxide samples
present elevated surface areas (140‐
200 m2∙g‐1) their dimensions do not re‐
flect the pore structure of their cerium‐
free silica counterparts.
Table 1. Structural characteristics of calcined cerium‐free silica samples and CeO2 sam‐
ples (Ce/Si molar ratio = 0.25).
Cerium‐free silica xerogel CeO2
Acid Si/H+ SBET(m2/g)
Vp (cm3/g)
δKJS(nm)
SBET(m2/g)
dBET
(nm) dXRD
(nm) SiO2
(wt.%) 1.00 707 0.60 3.0 173 4.9 2.0 7.6 0.33 650 0.93 6.6 158 5.3 2.4 8.2 HNO3
0.15 517 1.10 11.4 181 4.6 2.5 6.8 1.00 617 0.60 2.8 140 6.0 2.5 6.5 0.33 606 0.88 5.9 170 4.9 2.5 4.7 HCl 0.15 507 1.11 10.1 198 4.2 2.8 7.3
Fig. 1 shows a TEM image of a SiO2‐CeO2
nanocomposite, with agglomerates of
CeO2 nanoparticles of <10 nm, embed‐
ded in a silica frame. An XRD spectrum
of a sample of CeO2 nanoparticles
(HNO3, Si/H+=0.15, Ce/Si=0.25) is shown
in Fig. 2. Applying Scherrer’s equation to
this spectrum yields a particle size of
2‐3 nm. For all the samples described in
Table 1, the particle size values evalu‐
ated from the BET surface areas (dBET =
4‐6 nm) were in all cases higher than
those estimated by XRD analysis (dXRD =
2‐3 nm).

López et al. Microp. Mesop. Mat 127 (2010) 198‐204 45
Fig. 1. TEM image of a SiO2‐CeO2 nano‐composite (HNO3, Si/H
+=0.15, Ce/Si=0.25).
This finding suggests that the CeO2 sam‐
ples are formed by aggregates of 2‐
6 crystals. As already mentioned, the
crystal/particle size of the CeO2 samples
does not seem to be influenced by the
structural characteristics of the equiva‐
lent (in synthesis conditions) cerium‐free
silica xerogel, as can be seen in Table 1.
Thus, when the suspension acidity is
increased the average pore size of the
xerogel grows from 3 to 11 nm, whereas
the dBET values for the cerium oxide
samples are more or less randomly dis‐
tributed in the 4‐6 nm range. This may
be attributed to one of two causes: (1)
the silica structure collapsed onto the
cerium hydroxide nanoparticles during
precipitation; (2) the cerium hydroxide
only filled the smaller silica pores (theo‐
retically, for a Ce/Si molar ratio of 0.25
such as that used for the samples de‐
scribed in Table 1, the cerium oxide
should occupy between 9% and 17% of
the total pore volume of silica, depend‐
ing on the Si/H+ ratio). As will be shown
in next section, the first assessment
must be taken as being the correct one.
10 20 30 40 50 60 70
Inte
nsity
(a.u
.)
2θ
(111)
(200)
(220)
(311)
Fig. 2. XRD pattern of a CeO2 sample (HNO3, Si/H
+=0.15, Ce/Si=0.25).
20 nm

Artículo I 46
A Si/H+ molar ratio of 0.15 produces
samples of cerium‐free silica xerogel
with the highest pore volume values.
This silica/acid ratio was therefore cho‐
sen for the next stage of the optimisa‐
tion of the SACOP method. During this
stage the effect of increasing the cerium
load on the final properties of the ce‐
rium oxide was analysed. HNO3 was
used rather than HCl in order to avoid
potential contamination by chlorides.
3.2. Cerium concentration in the precur‐
sor mixture (Ce/Si molar ratio)
The samples were prepared using differ‐
ent Ce/Si molar ratios for the precursor
mixture (0.25, 0.50 and 1.00) in order to
analyse the influence of this parameter
on the structural characteristics of the
nanocomposites and cerium oxide sam‐
ples. The N2 adsorption isotherms of the
SiO2‐CeO2 nanocomposites are shown in
Fig. 3 and the values of their structural
characteristics are presented in Table 2.
The nanocomposites display a type IV
isotherm, corresponding to meso‐
porous materials with quite a uniform
pore size in the 12‐16 nm range (Ta‐
ble 2). As was expected, the samples
obtained by increasing the Ce/Si molar
ratios show decreasing values for sur‐
face area, pore volume and average
pore size. The average pore sizes of the
three nanocomposites are higher than
those of the equivalent cerium‐free sil‐
ica xerogel (12.5‐15.2 nm for SiO2‐CeO2
nanocomposites versus 11.4 nm for the
silica xerogel). This apparently contra‐
dictory result can be explained by the
schematic tentative mechanism pro‐
posed in Fig. 4.
1 10 100 10000.00
0.25
0.50
0.75
1.00 Ce/Si=1.00 Ce/Si=0.50 Ce/Si=0.25
dV/d
logD
(cm
3 /g)
Pore size (nm)
0.0 0.2 0.4 0.6 0.8 1.00
100
200
300
400
Adso
rbed
vol
ume
(cm
3 STP
/g)
Relative pressure (p/p0)
Ce/Si=1.00 Ce/Si=0.50 Ce/Si=0.25
Fig. 3. (a) N2 adsorption isotherms and (b) pore size distribution plots of the SiO2‐CeO2 nanocomposites, obtained for different cerium loads (HNO3, Si/H+=0.15).
It was observed that the precipitation
process caused the collapse of the mac‐
roscopic structure of the aquagel, which
turned into a slurry. In the mechanism

López et al. Microp. Mesop. Mat 127 (2010) 198‐204 47
proposed, the porous microstructures of
the slurry resemble those of the original
aquagel. The smallest silica particles of
these microstructures (represented by
the different images in Fig. 4) tend to
dissolve in the basic medium, as the pH
is increased during the precipitation
process, and then reprecipitate onto the
cerium hydroxide particles. This is at‐
tributed to flocculation of the reprecipi‐
tated silica aggregates caused by the
cerium cations being adsorbed on silanol
groups, in accordance with a mechanism
in which these cations neutralise the
negative charges on the surface of the
silica aggregates [34]. The collapse of
the internal silica microstructure on the
surface of the cerium hydroxide parti‐
cles helps to explain two former obser‐
vations: (a) the average pore size of the
nanocomposites is higher than that of
the cerium‐free silica xerogel (as can be
inferred from Fig. 4) and (b) the values
of surface area obtained by the SACOP
method are higher than those of the
conventional silica‐based hard‐template
methods, where silica collapse does not
occur. Needless to say the effective par‐
ticle size of CeO2 increases with the in‐
crease in cerium load as a result of
which the average nanocomposite pore
size decreases, as illustrated in Fig. 4.
Thus, a higher cerium concentration in
the precursor mixture produces an in‐
crease in the final crystal (particle) size
of CeO2, from 2.5 (4.6) nm for
Ce/Si=0.25 to 4.4 (6.4) nm for
Ce/Si=1.00, and a concomitant decrease
in the specific surface area, from
181 m2∙g‐1 to 132 m2∙g‐1. Fig. 5 shows a
TEM image of the resulting CeO2 aggre‐
gates (Ce/Si=1.00) after the silica is re‐
moved. It can be seen that the remain‐
ing sample is composed of nanoparticles
of around 5 nm.
Table 2. Structural characteristics of synthesised SiO2‐CeO2 nanocomposites and CeO2 samples prepared with different Ce/Si ratios (Si/H+=0.15).
SiO2‐CeO2 nanocomposites CeO2Ce/Si (molar) SBET
(m2/g) Vp
(cm3/g)δKJS(nm)
SiO2
(wt.%) SBET
(m2/g) dBET
(nm) dXRD
(nm) SiO2
(b)
(wt.%)
0.25 350 1.01 15.2 63.6(a) 58.2(b) 181 4.6 2.5 6.8
0.50 285 0.58 13.9 43.1(a) 42.6(b) 160 5.3 3.5 6.4
1.00 209 0.40 12.5 28.4(a) 23.9(b) 132 6.4 4.4 4.3
(a) Theoretical value obtained from the initial Ce/Si molar ratio.
(b) Data from EDX analyses.

Artículo I 48
Fig. 4. Proposed mechanism for the precipitation process of nanocomposites for differ‐ent Ce/Si molar ratios.
Fig. 5. TEM image of a CeO2 sample with a residual SiO2 content of 4.3 wt.% (HNO3,Si/H
+=0.15, Ce/Si=1.00).
3.3. Aquagel ageing time
20 nm
In the case of the cerium‐free silica
aquagels, the ageing time is the period
between the end of the condensation
step at 100°C and the point at in which
the gel is washed with acetone. This
period varied between 0 and 20 days.
The variation of this parameter did not
have any influence on the BET surface
area of the cerium‐free xerogels, as can
be appreciated from the data summa‐
rized in Table 3. However it did have a
noticeable effect on the values of the
pore volume and average pore size; i.e.
a decrease after 5 days of ageing time

López et al. Microp. Mesop. Mat 127 (2010) 198‐204 49
and subsequent increase after 20 days.
This trend apparently differs from what
is reported in the literature [35‐37]; i.e.
the silica pore volume increases in the
first hours of ageing and then decreases
or becomes stable. We attribute this
discrepancy to the less reactive condi‐
tions under which the gel is aged in this
work (a very acid mother liquor and
room temperature) as compared to the
conditions used in the literature (alcohol
or ammonia and/or higher temperatures
are employed), which may have the
effect of accelerating the dissolution–
precipitation processes. A tentative age‐
ing mechanism for the cerium‐free silica
aquagels is schematized in Fig. 6a. Here
ageing takes place in a two step process
similar to that described by Okkerse
[38]. During the first 5 days, the gel
structure is reinforced through a reac‐
tion between the smallest (more reac‐
tive) silica aggregates in the silica micro‐
structures (Fig. 6a), as a result of which
the gel structure contracts (the average
pore size and total pore volume de‐
crease). After this period, the gradual
increase in the amount of silica in the
solution (mainly as a result of the disso‐
lution of the smallest silica particles)
ends with the silica reprecipitating onto
the larger aggregates [39], via Ostwald
ripening. This process allows the ap‐
proximate recovery of the original struc‐
ture of the silica aquagel (Fig. 6a).
In the case of the SiO2‐CeO2 aquagel,
ageing is the room temperature stage
between the end of the condensation
step at 100°C and the precipitation of
the cerium hydroxide. The ageing time
varies between 0 and 30 days. The struc‐
tural characteristics of the resulting
SiO2‐CeO2 nanocomposites and the CeO2
samples are presented in Table 3. It can
be observed that the nanocomposites
show large surface areas like the cerium‐
free silica xerogels, are not significantly
affected by the ageing process. On the
other hand, the average pore size of the
nanocomposites increases after 5‐
10 days and decreases after longer peri‐
ods. This behaviour is the opposite to
that observed for the cerium‐free silica
xerogels (Table 3 and Fig. 6a) and is ten‐
tatively attributed to a combination of
mechanisms occurring during the ageing
(Fig. 6a) and precipitation steps (Fig. 4).
Thus, cerium‐containing aquagels with
microstructures such as those depicted
in Fig. 6a (for cerium‐free aquagels) can
be expected to yield precipitated nano‐
composites with microstructures similar
to those shown in Fig. 6b.

Artículo I 50
Fig. 6. (a) Proposed mechanism of the ageing process for cerium‐free silica aquagels. (b) Tentative structure of the nanocomposites after the precipitation of cerium‐containing silica aquagels aged for different periods of time.
In the proposed combined mechanism,
the cerium‐containing silica aquagel
after 5 days of ageing has a reinforced
structure due to the formation of silox‐
ane bonds between the smallest and
most reactive silica particles. The inner
walls are therefore thinner than those of
the non‐aged microstructure and the
aquagel after 20 days of ageing, at which
point the walls thicken due to the Ost‐
wald ripening phenomenon. Conse‐
quently, the inner walls of the 5‐day‐old
aquagel are more easily dissolved during
precipitation due to selective etching. As
a result the silica is reorganised (repre‐
cipitation) around the cerium hydroxide
nanoparticles. This gives rise to a higher
average pore size for the precipitated
nanocomposite than in the less and
more aged samples (Fig. 6b). However
none of these behaviours is reflected in
the final CeO2 particle size, which is
quite similar for all the samples (Table
3), thus confirming that the particle size
obtained by SACOP is mainly influenced
by the cerium load and silica collapse
during precipitation.

López et al. Microp. Mesop. Mat 127 (2010) 198‐204 51
Table 3. Textural characteristics of the cerium‐free silica xerogels (not calcined) and structural characteristics of the nanocomposites and CeO2 samples prepared for differ‐ent ageing times (Ce/Si=0.25, Si/H+=0.15).
Cerium‐free silica xerogel Ageing period
(days) SBET
(m2/g) Vp
(cm3/g) δKJS(nm)
0 604 1.37 12.5 5 604 1.14 9.0 20 598 1.45 15.7
SiO2‐CeO2 nanocomposites Ageing period
(days) SBET
(m2/g) Vp
(cm3/g) δKJS(nm)
SiO2(a)
(wt.%) 0 350 1.01 15.2 63.6 1 339 0.92 15.5 63.7 5 339 1.13 21.1 64.1 10 334 1.09 21.2 59.7 20 339 0.87 15.4 60.4 30 360 0.90 15.2 59.3
CeO2
Ageing period (days)
SBET(m2/g)
dBET
(nm) dXRD
(nm) SiO2
(b)
(wt.%) 0 181 4.6 2.5 6.8 1 194 4.3 2.4 8.3 5 176 4.8 2.8 7.9 10 181 4.6 2.6 9.2 20 173 4.9 2.3 7.7 30 177 4.8 2.1 8.8
(a) Values obtained from mass balances.
(b) Data from EDX analyses.
3.4. Silica matrix removal
A certain amount of residual silica (5‐
10 wt.%) remains in the ceria samples
after the removal of the silica (NaOH,
2 M, ~30°C, 2 days, Tables 1‐3). This is a detrimental factor for the application of
silica template techniques. It was found
that a NaOH concentration of 3.5 M was
more effective than lower or higher
NaOH concentrations for removing silica
(Table 4). From the same table it can
also be appreciated that the extent of
silica removal appears to be related to
the size of the ceria particle. The smaller
particles (obtained by using lower Ce/Si
ratios) present higher Sext/Vp aspect ra‐
tios so that the surface interaction be‐
tween the CeO2 nanoparticles and the

Artículo I 52
silica is stronger, making it more difficult
to remove the silica.
Table 4. Structural characteristics of the
samples washed with different NaOH
solutions (Si/H+=0.15).
Ce/Si NaOH
(M) SBET
(m2/g) SiO2
(wt.%) dXRD
(nm) 0.25 5 217 8.3 2.5 0.25 3.5 216 7.8 2.8 0.25 2 192 14.1 2.3 0.50 2 160 7.7 3.5 1.00 2 132 5.5 4.4
Modifications to temperature, stirring
and the number and duration of the
washing steps were tested for washing
the samples (Ce/Si=0.25) using NaOH
3.5 M. These treatments are summa‐
rized in Fig. 7, where the residual SiO2
content is plotted against the W0/V ra‐
tio, W0 being the initial weight of the
nanocomposite (g) and V the volume of
NaOH dissolution (mL). As can be ob‐
served from this figure, neither stirring
nor temperature has any significant
influence on the final SiO2 content. The
figure shows that the main controlling
factors in the stage of silica removal are
the W0/V ratio and the number of wash‐
ing steps. Very low SiO2 contents (~4 %) can be achieved by using low W0/V ra‐
tios and three short washing steps in
NaOH 3.5 M.
0
4
8
12
16
20
0.000 0.004 0.008 0.012 0.016 0.020
Wo/V (g/mL)
Res
idua
l SiO
2 co
nten
t (w
t%)
1 washing
3 washings (2 hours each)
S-84°C-18h
WS-100ºC-16.5h
S-20ºC-18h
S-84°C-6h
S-20ºC-2h
S-20ºC-2hS-84ºC-6h
S: stirringWS: without stirring
Res
idua
l SiO
2 con
tent
(wt%
)
Fig. 7. Residual SiO2 content (wt.%) versus W0/V ratio for the different silica removal treatments (samples with Ce/Si=0.25).

López et al. Microp. Mesop. Mat 127 (2010) 198‐204 53
4. Conclusions
The silica aquagel confined co‐
precipitation (SACOP) technique is able
to produce CeO2 nanostructures with
crystal (particle) sizes in the 2‐5 (4‐6) nm
range, and very high surface area values
(140‐200 m2∙g‐1). The effective particle
size of CeO2 can be controlled by modi‐
fying the cerium load in the synthesis
suspension, and is independent of the
textural properties of the equivalent
cerium‐free silica xerogel. It was found
that the SACOP technique produces very
high surface areas because of a silica
flocculation mechanism around the ce‐
rium hydroxide nanoparticles during the
precipitation stage. Ageing of the silica
aquagel does not produce any signifi‐
cant variation in the final ceria particle
size.
Very low residual silica contents can be
achieved by reducing the ratio of nano‐
composite weight to NaOH solution
(3.5 M) volume.
Acknowledgments
Funding through the Spanish National
Project MAT2008‐00407 and the FICYT
Regional Project (IB05‐001) is acknowl‐
edged. IL thanks the Ministerio de Cien‐
cia e Innovación of Spain for her FPI
grant and TVS thanks the Junta General
del Principado de Asturias for the award
of a Clarín postdoctoral contract.
References
[1] G. Evans, I. V. Kozhevnikov, E. F. Kozhevnikova, J. B. Claridge, R. Vaidhyanathan, C. Dickinson, C. D. Wood, A. I. Cooper, M. J. Rosseinsky, J. Mater. Chem. 18 (2008) 5518.
[2] T. Sanders, P. Papas, G. t. Veser, Chem. Eng. J. 142 (2008) 122.
[3] H. Koga, T. Kitaoka, H. Wariishi, Chem. Comm. (2008) 5616.
[4] R. Rinaldi, A. d. M. Porcari, T. C. R. Rocha, W. H. Cassinelli, R. U. Ribeiro, J. M. C. Bueno, D. Zanchet, J. Mol. Catal. A‐Chem. 301 (2009) 11.
[5] J. M. Nadgeri, M. M. Telkar, C. V. Rode, Cat. Comm. 9 (2008) 441.
[6] C. Delacourt, P. Poizot, M. Morcrette, J. M. Tarascon, C. Masquelier, Chem. Ma‐ter. 16 (2004) 93.
[7] Y. I. Kim, D. Kim, C. S. Lee, Physica B 337 (2003) 42.
[8] R. Takahashi, S. Sato, T. Sodesawa, N. Nakamura, S. Tomiyama, T. Kosugi, S. Yo‐shida, J. Nanosci. Nanotechno. 1 (2001) 169.
[9] M. S. Tsai, Mat. Sci. Eng. B 110 (2004) 132.
[10] M. Zawadzki, J. Alloy Compd. 454 (2008) 347.

Artículo I 54
[11] Q. Liu, H. Liu, Y. Liang, Z. Xu, G. Yin, Mater. Res. Bull. 41 (2006) 697.
[12] D. H. Chen, D. R. Chen, X. L. Jiao, Y. T. Zhao, M. S. He, Powder Technol. 133 (2003) 247.
[13] D. S. Bae, B. Lim, B. I. Kim, K. S. Han, Mater. Lett. 56 (2002) 610.
[14] B. Ksapabutr, E. Gulari, S. Wongkasemjit, Mater. Chem. Phys. 99 (2006) 318.
[15] X. F. Dong, H. B. Zou, W. M. Lin, Int. J. Hydrogen Energy 31 (2006) 2337.
[16] X. Zheng, X. Zhang, Z. Fang, X. Wang, S. Wang, S. Wu, Cat. Comm. 7 (2006) 701.
[17] J. S. Lee, J. S. Lee, S. C. Choi, Mater. Lett. 59 (2005) 395.
[18] J.Zhang, X.Ju, Z.Y.Wu, T.Liu, T.D.Hu, Y.N.Xie, Chem. Mater 13 (2001) 4192.
[19] N. Laosiripojana, W. Sutthisripok, S. Assabumrungrat, Chem. Eng. J. 127 (2007) 31.
[20] J. Rebellato, M. M. Natile, A. Glisenti, Appl. Catal. A: Gen. 339 (2008) 108.
[21] I. Ritzkopf, S. Vukojevic, C. Weidenthaler, J. D. Grunwaldt, F. Schuth, Appl. Catal. A: Gen. 302 (2006) 215.
[22] R. D. K. Misra, A. Kale, R. S. Srivastava, O. N. Senkov, Mater. Sci. Techn. 19 (2003) 826.
[23] S. C. Laha, R. Ryoo, Chem. Comm. (2003) 2138.
[24] E. Rossinyol, J. Arbiol, F. Peiro, A. Cornet, J. R. Morante, B. Tian, T. Bo, D. Zhao, Sensor Actuat. B‐Chem. 109 (2005) 57.
[25] W. H. Shen, X. P. Dong, Y. F. Zhu, H. R. Chen, J. L. Shi, Microp. Mesop. Mat. 85 (2005) 157.
[26] J. Roggenbuck, H. Schafer, T. Tsoncheva, C. Minchev, J. Hanss, M. Tiemann, Mi‐crop. Mesop. Mat. 101 (2007) 335.
[27] J. D. Hu, Y. X. Li, X. Z. Zhou, M. X. Cai, Mater. Lett. 61 (2007) 4989.
[28] G. Marbán, A. B. Fuertes, T. Valdés‐Solís, Microp. Mesop. Mat. 112 (2008) 291.
[29] T. Valdés‐Solís, G. Marban, A. B. Fuertes, Chem. Mater. 17 (2005) 1919.
[30] B. M. Reddy, G. Thrimurthulu, P. Saikia, P. Bharali, J. Mol. Catal. A‐Chem. 275 (2007) 167.
[31] X. C. Zheng, X. L. Zhang, X. Y. Wang, S. H. Wu, React. Kinet. Catal. Lett. 92 (2007) 195.
[32] M. Kruk, M. Jaroniec, A. Sayari, Langmuir 13 (1997) 6267.
[33] A. B. Fuertes, Chem. Mater. 16 (2004) 449.
[34] R.K.Iler, The chemistry of silica. John Wiley and sons, New York, 1979, p. 622.

López et al. Microp. Mesop. Mat 127 (2010) 198‐204 55
[35] A. Fidalgo, L. M. Ilharco, Microp. Mesop. Mat. 84 (2005) 229.
[36] S. Smitha, P. Shajesh, P. R. Aravind, S. Rajesh Kumar, P. Krishna Pillai, K. G. K. Warrier, Microp. Mesop. Mat. 91 (2006) 286.
[37] J. Estella, J. C. Echeverria, M. Laguna, J. J. Garrido, Microp. Mesop. Mat. 102 (2007) 274.
[38] C.Okkerse, Physical and chemical aspects of adsorbents and catalysts. Academic Press, Londres, 1970.
[39] C.J.Brinker, G.W.Scherer, Sol‐gel science: the physics and chemistry of sol‐gel processing. Academic Press, Boston, 1990.


57
Resumen artículo II.
AN ATTEMPT TO RANK COPPER‐BASED CATALYSTS USED IN THE CO‐
PROX REACTION
Un intento de clasificación de catalizadores de cobre utilizados en la
reacción CO‐PROX
En la literatura se describen un gran número de catalizadores para la oxidación
preferencial de CO que son activos en un amplio intervalo de temperaturas (100‐250°C). Estos catalizadores pueden clasificarse en cuatro grupos: (i) metales nobles (p. ej. Au,
Pd, Pt), (ii) perovskitas (p. ej. LaFeO3), (iii) espinelas (p. ej. CuMn2O4), y (iv) dispersiones
sólidas/soluciones de óxidos de metales de transición (CuOx/CeO2). De todos ellos, los
catalizadores que incluyen cobre en su formulación se revelan como los de mayor
interés por su elevada actividad y bajo coste. Sin embargo, la disparidad de condiciones
experimentales en las cuales se han analizado los catalizadores basados en cobre
(distintas velocidades espaciales), hace muy difícil la comparación de su actividad
catalítica. Por esta razón, el objetivo del presente artículo consiste en recopilar la
información sobre los catalizadores basados en cobre que han sido descritos en la
bibliografía e intentar ordenarlos en función de su actividad catalítica en la reacción
PROX. A partir del mecanismo de tipo Langmuir‐Hinshelwood, propuesto por Liu y
Flytzani‐Stephanopoulos (J. Catal. 153 (1995) 317) para la oxidación de CO sobre
catalizadores de CuOx/CeO2, es posible deducir una ecuación cinética que permite
calcular la actividad catalítica, considerando que la constante kL100 representa la
actividad catalítica intrínseca a 100°C. Sólo en unos pocos de los artículos considerados
la falta de datos impidió calcular la constante de actividad catalítica.
Además de la actividad catalítica, se tabuló la selectividad (S) de los catalizadores hacia
la oxidación de CO. Para ello se empleó el parámetro TS=0.8, definido como la
temperatura a la cual la selectividad es mayor de 0.8 (S≤1.0).
Los catalizadores analizados se dividieron en cuatro grupos según su composición:
(i) cobre‐óxido de cerio, (ii) cobre‐óxido de cerio soportados en alúmina, (iii) cobre‐óxido
de cerio con la adición de modificadores y (iv) catalizadores basados en cobre sin óxido
de cerio.
Analizada la actividad catalítica de los cuatro grupos de catalizadores se puede concluir
que tanto el empleo de soportes de alúmina como la adición de modificadores (Zr, Sm,

Artículo II 58
Sn, Co o Fe) o la eliminación del óxido de cerio de la formulación del catalizador no
favorecen su actuación en la reacción PROX, sino que más bien disminuyen la actividad
de los catalizadores.
Una vez comprobado que los mejores catalizadores eran los de cobre‐óxido de cerio, se
estudió el efecto de diversos parámetros que a priori deberían afectar a la actividad
catalítica, como son el área superficial específica, el tamaño de partícula y el contenido
en cobre. Ninguno de estos tres parámetros muestra una correlación con la actividad
catalítica, como tampoco parece afectar la temperatura de calcinación del catalizador.
El mejor catalizador encontrado en la bibliografía fue el preparado por Liu y col. (J. Mol.
Catal. A‐Chem. 267 (2007) 137) mediante el método sol‐gel con bromuro de
cetiltrimetilamonio, seguido del sintetizado por Marbán y Fuertes (Appl. Catal. B:
Environ. 57 (2005) 43) mediante citratos. Cabe destacar que Liu y col. (J. Mol. Catal. A‐
Chem. 255 (2006) 103) obtienen un catalizador prácticamente igual al mejor con el
método de co‐precipitación. Por lo tanto, no se pueden extraer conclusiones generales
sobre la influencia del método de obtención en la actividad catalítica.
Al analizar la selectividad de estos catalizadores hacia la oxidación de CO se obtienen
resultados similares, sin que se observen tendencias claras. El catalizador más selectivo
de los analizados, en el mayor intervalo de temperaturas, es el descrito por
Avgouropoulos y col. (Catal. Today 75 (2002) 157).
Puesto que el modo de preparación y las características de los catalizadores no se
correlacionaron con el grado de actividad catalítica, ésta ha de estar influida por las
condiciones experimentales. Los datos disponibles no siempre son suficientes para
determinar la velocidad espacial en el sistema. Es por ello que en la mayoría de los
artículos es imposible discernir si los valores de actividad catalítica están siendo
enmascarados por la resistencia a la difusión externa o por la existencia de dispersión
axial, para lo que necesitaríamos conocer al menos el tamaño de partícula del
catalizador, las dimensiones del reactor y la presencia/ausencia de diluyentes inertes.
Un catalizador, además de activo y selectivo, ha de ser estable durante el tiempo de uso.
En la mayoría de los artículos analizados no se incluyeron ensayos de estabilidad. En los
trabajos restantes, los experimentos de estabilidad se realizaron en un intervalo de
temperaturas comprendido entre 80‐175°C y con duraciones entre 12 y 200 h. Conviene
destacar el hecho de que estos ensayos de estabilidad fueron llevados a cabo en
condiciones experimentales (masa de catalizador, temperatura, flujo total de gases y
presiones parciales) que permitieron en casi todos los casos alcanzar conversiones

59
superiores al 90%. Al realizar los experimentos en condiciones de conversión total, la
desactivación puede no verse reflejada en los valores de conversión durante un largo
periodo de tiempo pese a estar sucediendo. De este modo los catalizadores probados
podrían no ser tan estables como se concluye en los trabajos.
En conclusión, de los catalizadores basados en cobre analizados en este trabajo, los más
activos resultaron ser los de cobre y óxido de cerio. La adición de modificadores o el uso
de soportes en estos materiales no supusieron una mejora en la actividad catalítica. Los
mejores catalizadores se obtuvieron mediante el empleo de agentes quelantes como
ácido cítrico o bromuro de cetiltrimetilamonio.


61
Artículo II.
In future vehicles powered by low tem‐
perature H2‐fed fuel‐cells, hydrogen
must be supplied with less than 100
ppm of CO, due to its deactivating effect
on the fuel cell electrocatalysts [1]. Two
major solutions for feeding the H2 fuel
are envisaged: (i) Onboard storage of
ultrapure H2 and (ii) Onboard H2 produc‐
tion from hydrocarbons. The second
option offers several advantages from
the point of view of fuel distribution and
supply, safety and cost, especially when
bio‐methanol is the source of H2 via an
onboard steam reforming process [2].
However, the production of H2 from
hydrocarbons results in the undesired
generation of CO as a byproduct and
consequently a purification step must be
introduced prior to the fuel cell stage.
The purification process usually consists
of a water‐gas shift reaction (required
only for a high CO concentration) fol‐
lowed by preferential CO oxidation
(PROX) [3], a process by which the re‐
sidual CO is catalytically oxidised to CO2
while the simultaneous oxidation of H2
to water is minimised. There are basi‐
cally two approaches to PROX catalysts.
Initially, noble metal catalysts (Au, Ag,
Pt, Ru, etc.) were employed as in the

Artículo II 62
case of the catalysts developed for CO
purification in the ammonia synthesis
process [4]. Later on it was observed
that cheaper copper‐based catalysts
appeared to be equally active and much
more selective [5] given the high tem‐
peratures required for the onboard
process between the H2 production
stage (∼250°C for bio‐methanol steam
reforming) and the fuel cell stage
(70‐100°C). Different compositions of
copper‐based catalysts have been pre‐
pared and tested for producing the
PROX reaction in the 100‐250°C tem‐
perature range, and have been reported
in a considerable number of papers.
However, other testing conditions re‐
flect a certain degree of diversity be‐
tween different research works, espe‐
cially with respect to gas flow rate and
amount of catalyst (spatial velocity),
thus making it difficult to compare the
reported catalytic activities (usually ex‐
pressed in standard CO conversion val‐
ues). Consequently there is only a lim‐
ited number of articles that provide such
a comparison [6, 7]. In the majority of
works the catalytic activities of a num‐
ber of different catalysts prepared by
the same authors and tested under
identical conditions are compared [8‐
10]. The main reason for the lack of
comparative works might be the diffi‐
culty in finding a common basis of com‐
parison regarding the activity, selectivity
and stability of the copper‐based cata‐
lysts. In addition, in many cases it is dif‐
ficult to perform a comparison from the
literature in which the experimental
data provided are clearly insufficient
(lack of data such as flow velocity, cata‐
lyst mass, etc). Finally, the stability of
the catalyst, a very important parame‐
ter, apart from being rarely reported, is
usually tested at conditions in which
complete conversion is achieved. As a
consequence the reaction rate and its
real variation trend cannot be extracted
from the information provided.
In this work we present a critical com‐
parison of the performance of the ma‐
jority of those copper‐based catalysts
whose activities in the PROX process
have been reported up to date in an
attempt to situate each catalyst in its
proper place. To achieve this the first
task is to find a common basis of com‐
parison.
The activity of the catalysts can be calcu‐
lated by means of the Langmuir‐
Hinshelwood mechanism used by Liu
and Flytzani‐Stephanopoulos [11] (LF
mechanism) for CO oxidation over cop‐
per‐ceria catalysts. This is described by
the following reaction rate expression:
COL
mOCOLL
CO PK1
PPKkr 2
+= (R1)
( )RT/EexpAk L,aLL −= (R2)
( )RT/QexpBK LL = (R3)

López et al. Int. J. Hydrog. Energy 33 (2008) 197‐205 63
where PCO and PO2 are CO and O2 partial
pressures and KL and kL can be taken as
the CO adsorption equilibrium and sur‐
face reaction rate constants, respec‐
tively. In this work it is assumed that the
constant kL (molCO∙g‐1cat∙s
‐1∙bar‐m) repre‐
sents the intrinsic catalytic activity. To
calculate this constant we considered
the values of m and KL reported by Sed‐
mak et al. [12] for a nanostructured
CuOx/CeO2 catalyst (m=0.15; KL=7.53
exp[8700/RT] [=] bar‐1; R[=] J∙mol‐1K‐1). In
the work by Sedmak et al. [12], a rate
expression derived from a Mars‐van
Krevelen (MVK) mechanism was also
analysed and was found to fit the reac‐
tion rate values for the CuOx/CeO2 cata‐
lysts equally well. However, when we
applied this expression in the present
work we found many inconsistencies in
the evaluated reaction rates for some of
the reviewed catalysts, including nega‐
tive values. Added to this, in a recent
study by Vannice [13] the original ex‐
pression of the MVK mechanism for
heterogeneous oxidation reactions was
found to be wrong. Therefore we se‐
lected the LF expression (R1) in order to
estimate the normalised values of the
reaction rates (kL). Although the expres‐
sion R1 was originally used to fit reac‐
tion rate data obtained at differential
conditions [11, 12], it was also proven to
be valid at high conversion values (inte‐
gral reactor) [11].
The surface reaction rate kL can be then
calculated by assuming the integral re‐
actor and plug flow behaviour (an as‐
sumption taken for granted in all pub‐
lished works) as follows:
( )
⎪⎪⎪
⎭
⎪⎪⎪
⎬
⎫
⎪⎪⎪
⎩
⎪⎪⎪
⎨
⎧
⎥⎥
⎦
⎤
⎢⎢
⎣
⎡
⎟⎟⎠
⎞⎜⎜⎝
⎛−−
−+
⎟⎟⎠
⎞⎜⎜⎝
⎛−−
= ∫−X
0
m1
0O
0CO
0OL
m
0O
0CO
m0O
0COL
cat
0CO
L XP
P5.011
m15.0
PK
P
P5.01)X1(
dX
PPK
wF
k2
2
2
2
(R4)
In this equation superscript 0 represents
the properties of the gas stream enter‐
ing the reactor, X signifies CO conversion
to CO2, FCO is the molar flow of CO
(mol/s) and wcat is the catalyst mass (g).
We explored the current literature on
copper‐based catalysts for PROX, and
selected the papers that afford kinetic
data to solve equation R4. Around 40
catalysts from a similar number of pa‐
pers are compared in this work. In some
cases kL could not be evaluated by equa‐
tion R4 due to lack of data, such as cata‐
lyst mass or total flow (used to calculate
FCO) [14‐16]. In those works where dif‐
ferent catalysts were tested, only the

Artículo II 64
most active catalysts were generally
considered.
In the PROX reaction, CO competes with
H2 for the available oxygen. The selectiv‐
ity (S) of the catalysts towards CO oxida‐
tion is an important parameter, but no
kinetic data of H2 oxidation in the pres‐
ence of CO are available, and therefore
comparison of the selectivity values
must be performed in a semi‐
quantitative way. A review of the PROX
literature reveals that in most catalysts
the selectivity towards CO oxidation is 1
or close to 1 (0 ≤ S ≤ 1) at low tempera‐
tures and starts to decrease at a given
temperature, usually over 100°C. In the
present work a new parameter is intro‐
duced, TS=0.8, which represents the tem‐
perature for which S=0.8 (S>0.8 for
lower temperatures and S<0.8 for higher
temperatures). Only in six reports [17‐
22] was the selectivity of the catalyst
found to be below 0.8 for all the tested
temperatures. In these cases the tem‐
perature at the highest selectivity was
used for the comparison.
In the reviewed works the conversion
and selectivity values are usually offered
in graph format, with temperature on
the X axis. To extract the numerical val‐
ues of X and S from the plots a Visual
Basic program fed with bmp‐formatted
scanned images of the graphs was used
[6].
Ranking of catalytic activities
The catalytic activities of the different
catalysts can be ranked in terms of kL, as
evaluated by equation R4. Fig. 1 offers
the Arrhenius plots for selected copper‐
ceria catalysts, including the most (A)
and least (G) active catalysts, in terms of
kL, found in the literature. References to
the original works and preparation con‐
ditions for catalysts A to G can be found
in Table 1. The catalytic activity rate
constants for the most and least active
copper‐based catalysts differ by three
orders of magnitude, although this
range is significantly reduced if catalysts
F and G are ignored. These two catalysts
were tested in the presence of water
(see Table 1), whereas the rest of the
catalysts were analysed only with CO/H2
mixtures carried by an inert gas. A
common feature to many of the Ar‐
rhenius plots in Fig. 1 is the change in
slope (activation energy) at high tem‐
peratures, as a result of a sharp de‐
crease in selectivity. For the zone of high
selectivity (low temperature zone) the
slopes have similar values for most cata‐
lysts, indicating comparable values of
activation energies. Only catalyst F has a
very different slope, which is caused by
the inhibiting effect of water at low
temperatures. For this catalyst, a much
higher activity can be expected at low
temperatures in the absence of water.

López et al. Int. J. Hydrog. Energy 33 (2008) 197‐205 65
1.E-08
1.E-07
1.E-06
1.E-05
1.E-04
1.E-03
1.E-02
0.0017 0.0020 0.0023 0.0026 0.0029 0.0032
1/T (K-1)
kL [m
ol/(g
·s·b
ar0.15
)]
(A)
(B)
(C)
(D)
(E)
(F)(G)
kL100
T<100°CT>100°C
Fig. 1. Arrhenius plots for kL constants evaluated for selected copper‐ceria catalysts: A [6], B [24], C (this work), D [7], E [10], F [29] and G [19] (descriptions of these catalysts can be found in Table 1).
The values of kL at 100°C (kL100), situated
in the zone of high selectivity for all
catalysts, were evaluated by inter / ex‐
trapolation (Fig. 1) and used to rank
their absolute catalytic activities. The
results are listed in Tables 1 to 4, to‐
gether with the references to the origi‐
nal works, preparation and testing con‐
ditions and selectivity values (TS=0.8). The
catalysts have been grouped according
to their composition: (i) copper‐ceria
catalysts (Table 1), (ii) alumina sup‐
ported copper‐ceria catalysts (Table 2),
(iii) modified copper‐ceria catalysts (Ta‐
ble 3) and (iv) non‐ceria based copper
catalysts (Table 4). Within each table the
catalysts are ranked in descending order
of catalytic activity (kL100 value), allowing
the most active catalysts to be recog‐
nised at a glance.
For this work our group tested the same
catalyst at an initial CO partial pressure
of 5×10‐3 bar, within the applicability range of the LF equation, and at the
highest spatial velocity (FCO0/wcat) ever
used for any of the reported catalysts
(Table 1). A decrease in the kL100 value by
~3.5 times was observed although the
catalyst was still one of the most active,
only surpassed in activity by the cata‐

Artículo II 66
lysts prepared by Liu et al. [23, 24] (Fig.
1 and Table 1).
There appears to be agreement be‐
tween members of the scientific com‐
munity that activity in the PROX reaction
is favoured by a high interdispersion of
Cu(II) on Ce(IV), as this permits the for‐
mation of oxygen vacancies in the cop‐
per‐ceria boundaries and improves the
reducibility of copper [25]. For this rea‐
son segregation of copper oxide into
clusters is considered to be detrimental
for the activity of the catalysts. This seg‐
regation, detected by XRD analysis, usu‐
ally takes place for copper contents of
over ~5‐6 wt% [6, 25]. Thus, there must
be a relationship between catalytic ac‐
tivity and parameters such as specific
surface area, copper content and disper‐
sion (preparation method), at least for
the copper‐ceria catalysts (Table 1).
However, trying to extract information
from Tables 1 to 4 to help identify pa‐
rameters which may be considered key
to preparing an active catalyst is a dis‐
couraging task. Copper content, specific
surface area and calcination conditions
are parameters whose values are ran‐
domly distributed over the entire range
of catalysts, when plotted against their
catalytic activity values. Supporting the
copper‐ceria catalysts on alumina does
not produce any significant catalytic
improvement (Table 2). Neither does
adding to the copper‐ceria mixtures
specific modifiers, such as Zr, Sm, Sn, Co
or Fe (Table 3). Even worse results are
obtained when dealing with copper‐
based catalysts where ceria does not
form part of the composition (Table 4).
Considering the previously mentioned
catalytic synergy between ceria and
copper, this result is far from surprising.
On some occasions the catalysts were
thermally pre‐treated under oxidising or
reducing conditions prior to their testing
(see symbols included in the calcination
column in Tables 1‐4). As can be ob‐
served in the tables, it seems that these
treatments may have a negative effect
on the resulting catalytic activity values,
since they are generally associated to
the least active catalysts (Table 1). Oxi‐
dative treatments, which are the most
abundant together with inert or non‐
performed pre‐treatments, may accel‐
erate catalyst deactivation, as has been
reported to occur with copper‐based
methanol reforming catalysts [26], al‐
though a closer evaluation of this possi‐
ble contribution is required before a
final conclusion can be drawn. Thus, as a
counterbalance to our former observa‐
tion, the least active catalyst reported in
Table 1 was that subjected to a reducing
pre‐treatment.
Chelating methods such as citrates [6] or
sol‐gel with cetyltrimethylammonium
bromide [24], which are known to pro‐
voke an excellent dispersion of copper in
ceria, seem to be the most effective
methods for fabricating active catalysts

López et al. Int. J. Hydrog. Energy 33 (2008) 197‐205 67
(Table 1). In light of the above discussion
on citrate catalysts [6], the catalyst pre‐
pared by Liu et al. [24] must be consid‐
ered the most active catalyst reported in
this review. However, an apparently
simple procedure i.e. the co‐
precipitation of the metal precursors in
a solution of K2CO3/KOH, as reported by
Liu et al. [23], produces a catalyst which
is almost identical in activity to the most
active catalyst obtained by the same
authors [24] using the sol‐gel technique
(Table 1). According to these authors,
the addition of KOH to the basic solution
inhibits the growth of the CuO‐CeO2
particles and yields nano‐structured
catalysts (dXRD=5‐8 nm) which are highly
active in the PROX process. Yet, crystal
size does not seem to be the most im‐
portant parameter affecting the catalytic
activity of the reported materials. The
catalysts with the smallest crystallite
sizes are those reported by Luo et al.
[27] (slightly over 3 nm) and Avgouro‐
poulos et al. [10] (4 nm), but none of
these catalysts are ranked among the
most active catalysts (Table 1). The cata‐
lyst by Luo et al. [27] was even prepared
by a sol‐gel method so that the disper‐
sion of copper ought to be optimal, add‐
ing further mystery to what is already a
puzzling problem.
The parameter of selectivity selected in
this work (TS=0.8) has an average value for
all the catalysts of 142 ± 23°C. For the unmodified copper‐ceria catalysts, in‐
cluding the alumina‐supported ones,
this value is 148 ± 26°C. Again this pa‐rameter seems to be unrelated to any
characteristic property of the catalysts,
although in this case it is clearly de‐
pendent on the testing conditions,
which may alter the relative kinetics of
the CO and H2 oxidation reactions. The
catalyst which is selective towards CO
oxidation in the widest temperature
range is that prepared by Avgouropou‐
los [9], with a value of TS=0.8 = 182°C.
Experimental artifacts might be the rea‐
son for the apparent absence of trends
between the preparation parameters
and catalytic activities. Most of the re‐
viewed works employed micro‐reactors
with internal diameters in the 4‐15 mm
range, though reactor dimensions are
not reported in about half of the re‐
viewed papers. In these reactors, sam‐
ples with weights in the range of 15‐
500 mg were tested. Only in a couple
works were sample weights over 1 g
used [19, 28]. The majority also em‐
ployed total flow rates in the 30‐
300 mL/min range. With the available
data, it is difficult to determine whether
it is resistance to external diffusion
and/or the existence of axial dispersion
that are masking the reported values of
the reaction rates. In order to determine
this, values for parameters such as parti‐
cle size, reactor dimensions or weight of
inert particles (when dilution is per‐
formed) are also needed. Applying stan‐

Artículo II 68
dard assumptions for the bed porosity
and apparent density of the catalysts
and inert materials, only in the case of
seven works [12, 19, 24, 27, 29‐31] was
it possible to evaluate the existence or
absence of diffusion restrictions by
standard correlations [32]. External dif‐
fusion resistances were absent in all the
analysed works (Carberry number below
0.05 [32]), whereas axial dispersion,
evaluated by means of the Peclet num‐
ber [32], was found to be a potentially
occurring factor in four [12, 19, 24, 27]
out of the seven analysed works.
In addition, dilution of the catalyst sam‐
ple in a bed of inert particles was not
always performed. This procedure al‐
lows the heat produced during the reac‐
tion to dissipate more easily, thus avoid‐
ing the generation of hot spots in the
bed. Therefore, catalysts in which dilu‐
tion was not performed might be ex‐
pected to reflect the difference between
the actual temperature of the bed and
the temperature measured by the ther‐
mocouple, which is always placed close
to but outside the bed. In Tables 1 to 4
the works in which catalyst dilution was
performed are identified by a symbol in
the column of spatial velocity (FCO0/wcat).
As can be observed, fewer than half of
the catalysts were tested under dilution
conditions. Nevertheless, this argument
must be regarded as merely speculative,
with no specific weight unless meas‐
urements of the actual differences be‐
tween the control and bed tempera‐
tures are also reported.

López et al. Int. J. Hydrog. Energy 33 (2008) 197‐205 69
T S=0.8
(°C)
194
188
107
122
140
143
131
182
171
S=0.7
100°C
n.i.
135
k L10
0
×106
181.0
165.0
103.0
97.0
51.1
44.4
42.6
38.0
25.2
33.0
29.9
28.2
Metho
d
CIT
CIT
SG‐CBr
CP (K
2CO
3/
KOH)
CIT
CP(NaO
H)
CeO
2: M
E Cu
O: IW
SG‐PR
UNC
CeO
2: M
E Cu
O: IW
CeO
2: P
CuO: IW
SG‐PR
P H20 /
P CO0
33
33
50
50
50
50
50
50
50
50
25
50
P O20 /
P CO0
1.00
1.00
1.00
1.00
1.00
1.00
1.25
1.25
1.25
1.25
1.00
1.25
P CO0
(bar)
3×10
‐4
3×10
‐4
1×10
‐2
1×10
‐2
5×10
‐3
1×10
‐2
1×10
‐2
1×10
‐2
1×10
‐2
1×10
‐2
1×10
‐2
1×10
‐2
F CO0 /w
cat
(mol/g∙s)
4.1×10
‐6♣
4.1×10
‐6♣
1.4×10
‐5♣
1.4×10
‐5♣
2.3×10
‐5♣
1.4×10
‐5♣
7.4×10
‐5
1.4×10
‐5
1.5×10
‐5
7.4×10
‐5
1.4×10
‐5
6.8×10
‐6♣
S BET
(m/g)
2 40
50
99
138
40
n.i.
107
20
39
n.i.
80
23
Calcination
(air)
550°C‐4h
550°C‐4h
500°C‐2h
500°C‐3h
550°C‐4h
500°C‐5h
500°C‐2h
§
650°C‐4h
§
550°C‐1h
§
500°C‐2h
§
300°C‐5h
§
650°C‐1h
§
Supp
ort
Non
e
Non
e
Non
e
Non
e
Non
e
Non
e
CeO
2
Non
e
Non
e
CeO
2
CeO
2
Non
e
Cu
(wt%
)
10.66
6.02
5.00
5.00
10.66
8.27
1.00
1.90
6.02
1.00
3.99
3.90
Table 1. Catalyic activ
ity of un
supp
orted or CeO
2‐supp
orted Cu
O‐CeO
2 catalysts (m
etal con
tents refer to the
catalyst in‐
clud
ing the supp
ort).
Ref. a
Marbán [6](A)
Marbán [6]
Liu [2
4] (B
)
Liu [23]
This work (C)
Kim [4
4]
Gam
arra [2
5]
Avgou
ropo
ulos
[9]
Avgou
ropo
ulos
[45]
Martín
ez‐Arias
[21]
Manzoli [7]b
(D)
Sedm
ak [1
2]

Artículo II 70
T S=0.8
(°C)
106
S=0.7
100°C
n.i.
130
188
161
100
158
146
146
139
S=0.7
150°C
k L10
0
×106
27.8
c
27.1
26.8
23.2
17.9
16.0
13.9
1.5
12.4
12.3
9.4
3.4d
Metho
d
CP(NaO
H)
CeO
2: M
E Cu
O: IW
CeO
2: P
CuO: IW
CeO
2:com
CuO: EI
CeO
2:com
CuO: IW
Urea‐
gelatio
n CP
CP NaO
H
SG‐CBr‐P
UNC
UNC
CeO
2 : P
CuO: D
P (K
2CO
3)
CP(Na 2CO
3)
P H20 /
P CO0
10
50
50
100
35
50
80
50
50
50
50
90
P O20 /
P CO0
1.00
1.25
1.00
1.00
0.50
1.00
1.00
1.00
1.25
1.25
1.25
0.95
P CO0
(bar)
1×10
‐2
1×10
‐2
1×10
‐2
5×10
‐3
2×10
‐2
1×10
‐2
1×10
‐2
1×10
‐2
1×10
‐2
1×10
‐2
1×10
‐2
8×10
‐3
F CO0 /w
cat
(mol/g∙s)
6.8×10
‐6♣
7.4×10
‐6
1.4×10
‐5
6.8×10
‐6
1.4×10
‐5
4.5×10
‐6♣
6.8×10
‐6
1.4×10
‐5♣
2.8×10
‐6
2.8×10
‐6
2.8×10
‐6
3.4×10
‐6
S BET
(m2 /g)
128
92
80
50
25
90‐
100
148
150
39
n.i.
22
n.i.
Calcination
(air)
300°C
500°C‐2h
§
300°C‐5h
§
450°C‐2h
450°C‐4h
§
650°C‐4h
100°C
400°C‐4h
550°C‐1h
§
500°C‐1h
400°C‐2h
§
700°C
Supp
ort
Non
e
CeO
2
CeO
2
CeO
2
CeO
2
Non
e
Non
e
Non
e
Non
e
Non
e
CeO
2
Non
e
Cu
(wt%
)
8.27
1.00
3.99
4.31
1.00
3.90
8.27
4.70
6.02
6.02
2.40
5.10
Table 1 (con
t.)
Ref. a
Ko [8
]
Martín
ez‐Arias
[22] (B)
Manzoli [7] b
Capu
to [3
3] b
Mariño [3
7]
Liu [36]
Ko [8
]
Luo [27]
Avgorou
poulos
[40]
Papavasiliou
[41]
Avgorou
poulos
[10] )(E)
Jung
[20]

López et al. Int. J. Hydrog. Energy 33 (2008) 197‐205 71
T S=0.8
(°C)
135
174
S=0.4
150°C
k L10
0
×106
2.3
0.4e
0.2f
Metho
d
CP(Na 2CO
3)
CP(NaO
H)
CP(KOH)
P H20 /
P CO0
65
71
151
P O20 /
P CO0
1.50
1.00
1.25
P CO0
(bar)
1×10
‐2
1×10
‐2
5×10
‐3
F CO0 /w
cat
(mol/g∙s)
2.3×10
‐6♣
1.4×10
‐5♣
9.3×10
‐8
S BET
(m2 /g)
n.i.
109
124
Calcination
(air)
500°C‐4h
§
500°C‐5h
500°C‐5h
§§
Supp
ort
Non
e
Non
e
Non
e
Cu
(wt%
)
7.99
8.27
4.00
Table 1 (con
t.)
Ref. a
Zou [46]
Bae [29] (F
Ratnasam
y [19]
(G)
n.i.: not in
dicated; P: P
recipitatio
n; IW
: Incipient wetne
ss; C
om: C
ommercial; E
I: Excess im
pregnatio
n; CP: co‐precipita
tion; UNC: urea ni‐
trate combu
stion; DP: dep
osition
‐precipitatio
n. CIT: citrates; SG
: Sol‐gel (CB
r: cetyltrim
ethylammon
ium bromide, PR: Peroxo‐route); ME:
Micro‐emulsion
.
§ The
catalyst w
as sub
jected
to oxidatio
n treatm
ent w
ith O
2/inert g
as prior to
the activity
test.
♣: C
atalyst d
iluted in inert p
articles for activity
tests.
§§The catalyst was sub
jecte to a red
uctio
n treatm
ent w
ith H
2/inert g
as prio
r to th
e activity
test
a Letters in
brackets refer to plots in Fig. 1.
b The
se autho
rs also prep
ared
CuO
x/Ce
O2 sam
ples with
zircon
ia and
foun
d no
ben
eficial effect o
n catalytic
activity
. c C
atalytic activity
test perform
ed in
the presen
ce of 0
.02 bar H2O.
d Catalytic activity
test perform
ed in
the presen
ce of 0.0235
bar CO
2.
e Catalytic activity
test perform
ed in
the presen
ce of 0
.14 bar H2O
+ 0.135
bar CO
2.
f Catalytic activity
test perform
ed in
the presen
ce of 0
.26 bar H2O
+ 0.23 bar CO
2.

Artículo II 72
T S=0.8
(°C)
S=0.8
150°C
140
175
k L10
0
×106
4.7
4.2
3.5
Metho
d
Supp
ort: SG
CuO: EI
CeO
2: EI
UNC
EI
P H20 /
P CO0
50
50
60
P O20 /
P CO0
1.00
1.25
1.00
P CO0
(bar)
6×10
‐3
1×10
‐2
1×10
‐2
F CO0 /w
cat
(mol/g∙s)
1.2×10
‐6
8.1×10
‐7
6.8×10
‐6♣
S BET
(m2 /g)
200
n.i.
n.i.
Calcination
(air)
500°C‐3h
§
500°C‐1h
500°C‐4h
Supp
ort
Al 2O
3/
CeO
2
Al foam
γ‐Al 2O
3
Ce
(wt%
)
15.36
21.49
16.00
Cu
(wt%
)
5.00
1.72
4.00
Table 2. Catalytic activity
of alum
ina‐supp
orted Cu
Ox/Ce
O2 catalysts (m
etal con
tents refer to the
catalyst includ
ing the sup‐
port).
Ref.
Moretti
[18]
Papava‐
siliou [41]
Park [3
0,
31,47]
n.i.: not indicated; EI: Excess im
pregnatio
n; UNC: urea nitrate combu
stion; SG: Sol‐gel.
§ The
catalyst w
as sub
jected
to oxidatio
n treatm
ent w
ith O
2/inert g
as prior to
the activity
test.
♣: C
atalyst d
iluted in inert p
articles for activity
tests.

López et al. Int. J. Hydrog. Energy 33 (2008) 197‐205 73
T S=0.8
(°C)
127
125
123
112
171
141
157
k L10
0
×106
23.6
18.3
15.5
13.6
10.5
4.6
0.5b
Metho
d
Supp
ort C
P (NH4OH)
CuO:EI
Supp
ort C
P (NH4OH)
CuO:IW
Supp
ort com
Cu
O: IW
EI
UNC
CP (N
a 2CO
3)
P H20 /
P C
O0
97
50
50
35
60
40
65
P O20 /
P C
O0
2.00
1.00
1.00
0.50
1.00
1.00
1.00
P CO0
(bar)
1×10
‐2
1×10
‐2
1×10
‐2
2×10
‐2
1×10
‐2
1×10
‐2
1×10
‐2
F CO0 /w
cat
(mol/g∙s)
1.7×10
‐5♣
1.1×10
‐6
1.1×10
‐6
1.4×10
‐5
6.8×10
‐6♣
3.4×10
‐5
2.3×10
‐5♣
S BET
(m2 /g)
94
84
78
43
n.i.
34
n.i.
Calcination
(air)
250°C‐1.5h
+
500°C‐3.5h
650°C‐4h
§
650°C‐4h
§
450°C‐4h
§
500°C‐4h
550°C‐4h
§
500°C‐4h
Supp
ort
SDC
a
Ce0.9Sn 0
.1O
2
Ce0.9Zr 0
.1O
2
Ce0.63Zr0 .
37O
2
γ‐Al 2O
3
Non
e
Non
e
Mod
ifier
(wt%
)
Sm (8
.20)
Sn (6
.49)
Zr (5
.07)
Zr (2
1.64)
Co (0
.20)
&
Fe (2
3.09)
Zr (5
.21)
Cu
(wt%
)
4.76
5.59
5.59
1.00
4.00
8.20
3.63
Table 3. Catalytic activity
of m
odified
CuO
x/Ce
O2 catalysts (m
etal con
tents refer to th
e catalyst includ
ing the supp
ort).
Ref.
Wang [39]
Chen
[43]
Chen
[42]
Mariño [37]
Park [3
0, 31,
47]
Sirichaip‐
rasert [3
8]
Don
g [34]
§ The
catalyst w
as sub
jected
to oxidatio
n treatm
ent w
ith O
2/inert g
as prio
r to th
e activity
test.
♣ Catalyst d
iluted in inert p
articles for activity
tests
& 15.8 wt%
Ce.
n.i.: not indicated; CP: co‐precipita
tion; EI: excess im
pregnatio
n; IW
: incipient wetne
ss; C
om: com
mercial; U
NC: urea nitrate combu
stion.
a Sam
aria dop
ed ceria.
b Catalytic activity
test perform
ed in
the presen
ce of 0.25
bar CO
2.

Artículo II 74
T S
=0.8
(°C)
n.i
120
S=0.3
80°C
k L10
0
×106
2.9a
2.3b
0.6
Metho
d
CP (N
H4OH)
SG‐EG
PG‐APTS
P H20 /
P CO0
30
74
45
P O20 /
P CO0
1.00
0.98
1.00
P CO0
(bar)
1.3×10
‐2
1×10
‐2
1×10
‐2
F CO0 /w
cat
(mol/g∙s)
7.3×10
‐7
§§§
3.4×10
‐6
2.3×10
‐6
S BET
(m2 /g)
118
160
569
Calcination
(air)
500°C‐3h
§§
400°C‐5h
§
500°C‐4h
§§
Supp
ort
Non
e
Non
e
SBA‐15
Mod
ifier
(wt%
)
Zn
(24.10
) Al (21
.17)
Mn
(55.59)
Non
e
Cu
(wt%
)
30.00
16.08
4.70
Table 4. Catalytic activity
of n
on‐ceria based
CuO
x catalysts (m
etal con
tents refer to th
e catalyst includ
ing the supp
ort).
Ref.
Tanaka
[28]
Kram
er
[35]
Tu [1
7]
§ The catalyst was sub
jected
to oxidatio
n treatm
ent w
ith O
2/inert g
as prio
r to th
e activity
test.
§§ The
catalyst w
as sub
jected
to red
uctio
n treatm
ent w
ith H
2/inert g
as prio
r to th
e activity
test.
§§§ A packing
den
sity of 1
.25 g/cm
3 was assum
ed fo
r the
catalyst.
n.i. no
t ind
icated
; CP: co‐precipita
tion; SG‐EG: sol‐gel with
ethylen
glycol; PG‐APTS: post g
rafting with
silane
APTS.
a Catalytic activity
test perform
ed in
the presen
ce of 0
.25 bar H2O
+ 0.125
bar CO
2.
b Catalytic activity
test perform
ed in
the presen
ce of 0
.2 bar CO
2 .

López et al. Int. J. Hydrog. Energy 33 (2008) 197‐205 75
Catalyst stability
The stability of the catalysts is a prop‐
erty of great importance affecting their
applicability. Deactivation during the
PROX reaction of copper‐ceria catalysts
is not usually attributed to coke deposi‐
tion but to the accumulation of hydroxyl
species on active interfacial sites and/or
to copper sintering [21]. The articles
reviewed here show quite different re‐
sults for stability. In most of the cases
stability tests were not performed [7, 8,
17, 20‐22, 25, 27, 29, 33‐39]. In the re‐
maining works, stability tests were con‐
ducted for time durations ranging from
12 to 200 hours, at temperatures in the
80‐175ºC range. However, in most pub‐
lished works the experiments were per‐
formed under conditions (catalyst mass,
temperature, total flow of reactants and
partial pressures) that allowed the com‐
plete or almost complete conversion of
CO (X>0.9 [9, 14, 18, 19, 23, 24, 40‐43];
0.8<X<0.9 [15, 28]). Under complete
conversion conditions the catalysts may
experience deactivation so that the con‐
version value may not be affected for a
long period of time. This would affect
the assessment of the real effect of
time‐on‐stream on catalytic activity. In
addition, the value of the kinetic con‐
stant is subject to greater uncertainty
when it is evaluated for conversion val‐
ues close to 1. In some cases the authors
consider the deactivation produced by
CO2 and H2O simultaneously [9, 31, 40].
Only a few authors [6, 12, 16, 44] have
analysed the deactivation of the PROX
catalysts in experimental conditions in
which X<0.6 or under drastic experimen‐
tal conditions (high gas hourly space
velocities). The experimental conditions
of these works are summarised in Table
5. The last two rows include the deacti‐
vation data reported by Tanaka and
coworkers [28] under experimental con‐
ditions that in principle cannot be con‐
sidered as very appropriate for perform‐
ing a deactivation analysis for the PROX
process, such as low spatial velocity
(FCO0/wcat), high temperature and high
initial conversion (X=0.89). In these less
severe conditions, the effect of the
method of preparation can be clearly
seen, since two catalysts of identical
composition and tested under the same
experimental conditions exhibit a totally
different behaviour: one of the catalysts
undergoes almost complete deactiva‐
tion, while the other remains stable.

Artículo II 76
k L
100 ×106
(X)
t=TO
Sb
22.9
(0.30)
7.2
(0.31)
836.0
(0.74)
n.a.
(0.20)
0.2
(0.07)
4.4
(0.89)
k L10
0 ×106
(X) t=0
a
48.9
(0.60)
10.0
(0.40)
1450
.0
(0.93)
n.a.
(0.25)
4.4 (0.89)
4.4 (0.89)
T (°C)
170
80
174
100
150
150
TOS
(h)
504
55
42
28
18
17
F CO0 /w
cat
(mol/g∙s)
1.4×10
‐5♣
6.8×10
‐6♣
4.1×10
‐6♣
n.i. ♣
7.3×10
‐7§§§
7.3×10
‐7 §§§
Metho
d
CP (N
aOH)
Sg‐PR
CIT
CD
EI
CP (N
H4OH)
P H20 /
P C
O0
50
50
33
23
30
30
P O20 /
P CO0
1.00
1.25
1.00
0.50
1.00
1.00
P CO0
(bar)
1×10
‐2
1×10
‐2
3×10
‐4
2×10
‐2
1.3×10
‐2
1.3×10
‐2
S BET
(m2 /g)
n.i.
23
40
n.i.
118
118
Calcina‐
tion
(air)
500°C‐5h
650°C‐1h
§
550°C‐4h
300°C‐2h
500°C‐3h
§§
500°C‐3h
§§
Cu
(wt%
)
8.27
3.90
10.66
3.99
5.00
30.0
Table 5. Deactivation expe
rimen
ts fo
r differen
t catalysts.
Ref. (C
atalyst)
Kim [4
4]
(CuO
/CeO
2)
Sed,al [1
2]
(CuO
/CeO
2)
Marbán [6]
(CuO
/CeO
2)
Usachev [1
6]
(CuO
/CeO
2)
Tanaka [2
8]
(CuO
/ZnO
/Al 2O
3)
Tanaka [2
8]
(CuO
/ZnO
/Al 2O
3)
§ The catalyst was sub
jected
to oxidatio
n treatm
ent w
ith O
2/inert g
as prio
r to th
e activity
test.
§§ The
catalyst w
as sub
jected
to red
uctio
n treatm
ent w
ith H
2/inert g
as prio
r to th
e activity
test.
§§§ A packing
den
sity of 1
.25 g/cm
3 was assum
ed fo
r the
catalyst.
♣: C
atalyst d
iluted in inert p
articles for activity
test.
n.i. no
t ind
icated
; n.a. not available; CIT: citrates; C
P: co‐precipita
tion; SG: sol‐gel; Sol‐PR: sol‐gel peroxo‐route; CD: com
bine
d de
compo
‐
sotio
n of nitrates from
solution; EI: excess im
pregnatio
n.
a Data at t=
0.
b Data at t=
final TOS.

López et al. Int. J. Hydrog. Energy 33 (2008) 197‐205 77
In the rest of the works referred to in
Table 5 deactivation always takes place.
The occurrence of deactivation adds
more uncertainty to the activity data (kL)
reported in Tables 1‐4. The assessment
of CO conversion values is always per‐
formed by means of experiments at
increasing or decreasing temperatures,
which last for several hours. Even if cata‐
lyst stability is not analysed, deactiva‐
tion may take place anyway, which
might affect the conversion values ob‐
tained at the end of the activity tests.
For instance, the catalyst prepared via
excess impregnation by Tanaka et al.
[28] undergoes almost complete deacti‐
vation at 150°C in a period as short as
2 hours. This phenomenon can be also
observed in the hysteresis loop of con‐
version that often occurs when the test‐
ing experiments are performed at in‐
creasing and then decreasing tempera‐
tures [6]. In conclusion, for the PROX
experiments it is very important to spec‐
ify the time‐on‐stream at which the con‐
version values are obtained, and stabil‐
ity tests should be always performed
and reported.
In summary, the catalytic activities of
the different catalysts reported in the
literature, which the LF equation places
put on a common basis, seem to display
a certain degree of uncertainty, caused
either by the dubious selection of condi‐
tions during some of the reported activ‐
ity tests or by the occurrence of catalyst
deactivation during such tests. In any
case, it is clear that the addition of
modifiers does not improve the catalytic
activity of the copper‐ceria catalysts,
and that chelating methods are the most
appropriate procedures for the prepara‐
tion of copper‐based catalysts for CO‐
PROX.
Acknowledgments
Funding by the Spanish National Project
MAT2005‐00262 and the FICYT Regional
Project (IB05‐001) is acknowledged.
Irene López thanks the Ministerio de
Educación y Ciencia of Spain for her FPI
grant.
References
[1] H. F. Oetjen, V. M. Schmidt, U. Stimming, F. Trila, J. Electrochem. Soc. 143 (1996) 3838.
[2] G. Marbán, T. Valdés‐Solís, Int. J. Hydrogen Energy 32 (2007) 1625.
[3] D. L. Trimm, Appl. Catal. A: Gen. 296 (2005) 1.

Artículo II 78
[4] M. J. Kahlich, H. A. Gasteiger, R. J. Behm, J. Catal. 171 (1997) 93.
[5] G. Avgouropoulos, T. Ioannides, H. K. Matralis, J. Batista, S. Hocevar, Cat. Lett. 73 (2001) 33.
[6] G. Marbán, A. B. Fuertes, Appl. Catal. B: Environ. 57 (2005) 43.
[7] M. Manzoli, R. Di Monte, F. Boccuzzi, S. Coluccia, J. Kaspar, Appl. Catal. B: Envi‐ron. 61 (2005) 192.
[8] E. Y. Ko, E. D. Park, K. W. Seo, H. C. Lee, D. Lee, S. Kim, Catal. Today 116 (2006) 377.
[9] G. Avgouropoulos, T. Ioannides, C. Papadopoulou, J. Batista, S. Hocevar, H. K. Matralis, Catal. Today 75 (2002) 157.
[10] G. Avgouropoulos, J. Papavasiliou, T. Tabakova, V. Idakiev, T. Ioannides, Chem. Eng. J. 124 (2006) 41.
[11] W. Liu, M. Flytzani‐Stephanopoulos, J. Catal. 153 (1995) 317.
[12] G. Sedmak, S. Hocevar, J. Levec, J. Catal. 213 (2003) 135.
[13] M. A. Vannice, Catal. Today 123 (2007) 18.
[14] P. K. Cheekatamarla, W. S. Epling, A. M. Lane, J. Power Sources 147 (2005) 178.
[15] T. Utaka, T. Takeguchi, R. Kikuchi, K. Eguchi, Appl. Catal. A: Gen. 246 (2003) 117.
[16] N. Y. Usachev, I. A. Gorevaya, E. P. Belanova, A. V. Kazakov, O. K. Atal'yan, V. V. Kharlamov, Russ. Chem. Bull. 53 (2004) 538.
[17] C. H. Tu, A. Q. Wang, M. Y. Zheng, X. D. Wang, T. Zhang, Appl. Catal. A: Gen. 297 (2006) 40.
[18] E. Moretti, M. Lenarda, L. Storaro, A. Talon, R. Frattini, S. Polizzi, E. Rodriguez‐Castellon, A. Jimenez‐Lopez, Appl. Catal. B: Environ. 72 (2007) 149.
[19] P. Ratnasamy, D. Srinivas, C. V. V. Satyanarayana, P. Manikandan, R. S. S. Kuma‐ran, M. Sachin, V. N. Shetti, J. Catal. 221 (2004) 455.
[20] C. R. Jung, J. Han, S. W. Nam, T.‐H. Lim, S.‐A. Hong, H.‐I. Lee, Catal. Today 93‐95 (2004) 183.
[21] A. Martinez‐Arias, A. B. Hungria, G. Munuera, D. Gamarra, Appl. Catal. B: Envi‐ron. 65 (2006) 207.
[22] A. Martinez‐Arias, A. B. Hungria, M. Fernandez‐Garcia, J. C. Conesa, G. Munuera, J. Power Sources 151 (2005) 32.
[23] Z. Liu, R. Zhou, X. Zheng, J. Mol. Catal. A‐Chem. 255 (2006) 103.
[24] Z. Liu, R. Zhou, X. Zheng, J. Mol. Catal. A‐Chem. 267 (2007) 137.

López et al. Int. J. Hydrog. Energy 33 (2008) 197‐205 79
[25] D. Gamarra, A. Hornés, Zs. Koppany, Z. Schay, G. Munuera, J. Soria, A. Martínez‐Arias, J. Power Sources 169 (2007) 110.
[26] P. H. Matter, D. J. Braden, U. S. Ozkan, J. Catal. 223 (2004) 340.
[27] M. F. Luo, J. M. Ma, J. Q. Lu, Y. P. Song, Y. J. Wang, J. Catal. 246 (2007) 52.
[28] Y. Tanaka, T. Utaka, R. Kikuchi, K. Sasaki, K. Eguchi, Appl. Catal. A: Gen. 238 (2003) 11.
[29] C. M. Bae, J. B. Ko, D. H. Kim, Cat. Comm. 6 (2005) 507.
[30] J. W. Park, J. H. Jeong, W. L. Yoon, H. Jung, H. T. Lee, D. K. Lee, Y. K. Park, Y. W. Rhee, Appl. Catal. A: Gen. 274 (2004) 25.
[31] J. W. Park, J. H. Jeong, W. L. Yoon, Y. W. Rhee, J. Power Sources 132 (2004) 18.
[32] J. A. Moulijn, A. Tarfaoui, F. Kapteijn, Catal. Today 11 (1991) 1.
[33] T. Caputo, R. Pirone, G. Russo, Kinetics and Catalysis 47 (2006) 756.
[34] X. F. Dong, H. B. Zou, W. M. Lin, Int. J. Hydrogen Energy 31 (2006) 2337.
[35] M. Kramer, T. Schmidt, K. Stowe, W. F. Maier, Appl. Catal. A: Gen. 302 (2006) 257.
[36] Y. Liu, Q. Fu, M. F. Stephanopoulos, Catal. Today 93‐95 (2004) 241.
[37] F. Mariño, C. Descorme, D. Duprez, Appl. Catal. B: Environ. 58 (2005) 175.
[38] K. Sirichaiprasert, A. Luengnaruemitchai, S. Pongstabodee, Int. J. Hydrogen En‐ergy 32 (2007) 915.
[39] J. B. Wang, S. Ch. Lin, T. J. Huang, Appl. Catal. A: Gen. 232 (2002) 107.
[40] G. Avgouropoulos, T. Ioannides, Appl. Catal. A: Gen. 244 (2003) 155.
[41] J. Papavasiliou, G. Avgouropoulos, T. Ioannides, Appl. Catal. B: Environ. 66 (2006) 168.
[42] Y. Z. Chen, B. J. Liaw, H. C. Chen, Int. J. Hydrogen Energy 31 (2006) 427.
[43] Y. Z. Chen, B. J. Liaw, C. W. Huang, Appl. Catal. A: Gen. 302 (2006) 168.
[44] D. H. Kim, J. A. Cha, Cat. Lett. 86 (2003) 107.
[45] G. Avgouropoulos, T. Ioannides, H. K. Matralis, Appl. Catal. B: Environ. 56 (2005) 87.
[46] H. B. Zou, X. F. Dong, W. M. Lin, Appl. Surf. Sci. 253 (2006) 2893.
[47] J. W. Park, J. H. Jeong, W. L. Yoon, C. S. Kim, D. K. Lee, Y. K. Park, Y. W. Rhee, Int. J. Hydrogen Energy 30 (2005) 209.


81
Resumen artículo III.
PREFERENTIAL OXIDATION OF CO BY CUOX/CEO2 NANOCATALYSTS
PREPARED BY SACOP. MECHANISMS OF DEACTIVATION UNDER THE
REACTANT STREAM
Oxidación preferencial de CO por nanocatalizadores CuOx/CeO2
preparados por SACOP. Mecanismos de desactivación en la corriente
de reacción.
Los catalizadores de óxido de cobre y óxido de cerio destacan por su alta actividad y
selectividad en la reacción de oxidación preferencial de CO. Sin embargo, es bien sabido
que estos materiales se desactivan de forma gradual durante la reacción, lo que limita su
aplicación práctica. Este trabajo tuvo como objetivo el estudio de las causas de dicha
desactivación, para lo cual se empleó un catalizador CuOx/CeO2 sintetizado mediante
co‐precipitación confinada en hidrogeles de sílice (SACOP).
El análisis de actividad de este catalizador se realizó bajo dos condiciones de reacción
distintas, alta y baja concentración (HC: 5000 ppm CO, 5000 ppm O2 y 25% H2 y LC:
300 ppm CO, 300 ppm O2 y 10000 ppm H2), durante largos periodos de tiempo para
analizar su estabilidad. En ambos casos las velocidades espaciales fueron muy elevadas,
de 0.4×10‐5 y 2.3×10‐5 molCO∙gcat‐1∙s‐1, respectivamente. Estos ensayos de estabilidad
demostraron que las condiciones de alta concentración eran más desactivantes que las
de baja concentración.
De forma adicional se llevaron a cabo experimentos de respuesta a escalón con distintas
mezclas de gases (CO/He, CO+H2/He y CO2+H2/He) con el propósito de determinar el
potencial desactivante de los distintos gases implicados en la reacción PROX. Estos
ensayos consistieron en una primera etapa PROX en condiciones de baja concentración
durante 1 hora, tras la cual se introdujo un escalón de CO/He, CO+H2/He o CO2+H2/He
por un tiempo de ∼18 horas. Finalmente, en una tercera etapa, se volvió a someter al
catalizador a condiciones PROX para evaluar el efecto del escalón de la etapa anterior.
En los ensayos de respuesta a escalón se comprobó que la adición de CO/He, CO+H2/He
o CO2/He producía sólo un pequeño cambio en la actividad del catalizador, cifrado en
una disminución media de la conversión de CO de ∼10%. De hecho, las condiciones

Artículo III 82
PROX ejercieron el mayor efecto desactivante en el catalizador, con una disminución en
la conversión en el mismo intervalo de ∼30%, lo cual se atribuyó a la presencia de oxígeno, ausente en el resto de escalones. Analizando la diferencia entre el consumo de
CO y la formación de CO2 fue posible deducir que las condiciones PROX tenían un claro
efecto promotor en la formación de especies carbonosas superficiales. En cualquier
caso, estas no parecieron afectar de forma significativa a la actividad de los
nanocatalizadores en las condiciones de baja concentración.
Se llevaron a cabo análisis XPS y FTIR ex situ sobre muestras sometidas a reacción PROX
a 175°C a distintos tiempos (1 y 20 h) y sobre la muestra de partida. Combinando los
resultados obtenidos de los análisis XPS y FTIR se postuló un mecanismo de
desactivación a temperaturas inferiores a 250°C compuesto de dos sub‐mecanismos
distintos, la formación de carbonatos superficiales y la agregación de Cu2+ disperso, cuya
importancia relativa es función del tiempo de reacción, la temperatura y la
concentración de CO.
Los resultados de XPS sugirieron la formación de depósitos de coque, lo que provocaría
la disminución de la concentración superficial de cerio. Sin embargo, creemos que esto
no debería afectar a la desactivación puesto que de ser así, se detectaría de forma más
patente en los experimentos de larga duración en condiciones de alta concentración de
CO. Además, la concentración de carbono grafítico en la primera hora de reacción no
varió sustancialmente, siendo este periodo el de mayor desactivación.
Se demostró que el catalizador fresco contenía carbonatos superficiales lábiles
producidos por exposición atmosférica. A temperaturas bajas y condiciones de baja
concentración, durante los primeros instantes de la reacción PROX los carbonatos
iniciales se eliminaron mediante descomposición oxidativa, mientras que
simultáneamente se formaban de manera progresiva carbonatos asociados a los iones
Ce3+. En condiciones de alta concentración y baja temperatura (175°C) la formación de
dichos carbonatos fue mucho más rápida que en condiciones de baja concentración, sin
afectar en ninguno de los dos casos a las especies Cu2+.
Para temperaturas más elevadas (∼200°C) y concentraciones bajas de CO la sinterización del Cu2+ disperso fue más patente, pero se vio compensada por una menor formación de
carbonatos, lo que provocó que la velocidad de desactivación fuera menor que a 175°C.
En condiciones HC se formaron más carbonatos superficiales a 200°C que en condiciones
LC, pero en menor medida que a 175°C.

83
En la Tabla 1 se resumen los dos mecanismos de desactivación que operan a
temperaturas inferiores a 250°C, así como el efecto que provoca el incremento de las
variables de interés (temperatura, concentración de CO y tiempo) en los distintos
mecanismos.
Tabla 1. Mecanismos de desactivación a temperaturas menores de 250°C.
Influencia del incremento de las variables Tipo de
desactivación
Especie metálica
involucrada Temperatura
Concentración de CO
Tiempo
Formación de carbonatos (mecanismo mayoritario de desactivación)
Ce3+ formado durante la reacción PROX (en contacto con clústeres de CuO)
La desactivación
disminuye
La velocidad de desactivación aumenta
Ocurre en las primeras 1‐5 horas en condiciones HC y lentamente en condiciones LC
Por agregación de Cu2+ disperso en clústeres de CuO (sinterización)
Cu2+ disperso
Aumenta. Es dudosamente significativa a 175°C
Aparentemente no afecta
Ocurre hasta desaparición de Cu2+ disperso
La principal causa de desactivación del catalizador para temperaturas superiores a 300°C
fue la sinterización de las especies de cobre, tanto para baja como alta concentración de
CO.
Estos mecanismos explicarían además el fenómeno de histéresis en los ciclos PROX no
isotérmicos que depende de las concentraciones de gases empleadas. En el ciclo en
condiciones LC, la conversión de CO es mayor a temperaturas crecientes que la obtenida
a temperaturas decrecientes, lo contrario que ocurre cuando se utilizan condiciones de
alta concentración HC. En condiciones LC la desactivación empieza a notarse a alta
temperatura por sinterización de las especies de cobre, por lo que el tramo de
temperaturas crecientes ofrece una mayor reactividad. Por el contrario, en condiciones
HC la elevada concentración de CO hace que la desactivación por formación de
carbonatos superficiales sea conspicua a baja temperatura. Estos carbonatos
desaparecen cuando se eleva la temperatura, por lo que en el tramo de temperaturas
decrecientes se observa una reactivación del catalizador.


85
Artículo III.
1. Introduction
There is widespread interest in the de‐
velopment of catalysts based on non‐
noble metals for mass‐scale processes
such as those involved in the production
and conversion of hydrogen in fuel‐cell
powered cars [1, 2]. One of these proc‐
esses is the purification of the hydrogen
stream produced onboard by the steam
reforming of a liquid fuel (e.g. metha‐
nol), so that residual CO, which is an
active poison for electrocatalysts, can be
quantitatively eliminated. The preferred
method of elimination is the preferential
(selective) catalytic oxidation of CO
(PROX reaction). One of the most active
and selective metal oxides in this proc‐
ess is copper oxide, whose activity is
significantly increased by the inclusion
of cerium oxide in the catalyst composi‐
tion. This mixture (CuO/CeO2) has been
extensively studied in the PROX reaction
at 100‐250°C, as recently reviewed by
López et al. [3]. However, it is well
known that these catalysts suffer pro‐

Artículo III 86
gressive deactivation during the PROX
reaction [4‐13] which limits their use
under practical conditions although not
much interest has been shown in the
study of the causes of this phenomenon,
as pointed out in the above mentioned
review [3]. In this study the PROX activ‐
ity of CuOx/CeO2 catalysts prepared by
silica‐aquagel confined precipitation
(SACOP [14, 15]) is discussed for the first
time. However, the main objective of
this study is to determine the causes of
the slow deactivation of these catalysts
during the reaction. As CuOx/CeO2 cata‐
lysts are widely used in other catalytic
processes such as water gas shift reac‐
tion and steam reforming, in which the
same reactants appear, the observations
reported in this work might be of inter‐
est also for people studying these reac‐
tions.
1.1. Antecedents
One of the few detailed mechanisms of
CO oxidation on CuO/CeO2 catalysts was
offered by Martínez‐Arias et al. [16]. They proposed a reaction scheme ac‐
cording to which Ce4+‐O2‐‐Cu2+ pairs are
rapidly reduced by CO to produce CO2
(R1 reaction in scheme shown below).
The subsequent reactions R2 to R5,
adapted from Martínez‐Arias mecha‐
nism, take place in order to restore the
oxidation state of the catalyst.
2 Ce4+‐O2‐‐Cu2+ + 2 CO 2 Ce←→3+‐�‐Cu+ + 2 CO2 (R1)
2 Ce3+‐�‐Cu+ + 2 CO 2 Ce←→3+‐�‐Cu+‐CO (R2)
Ce3+‐�‐Cu+‐CO + O2 Ce←→4+‐O2
‐‐Cu+‐CO (R3)
Ce4+‐O2‐‐Cu+‐CO Ce←→
4+‐O22‐‐Cu2+ + CO (R4)
Ce4+‐O22‐‐Cu2+ + Ce3+‐�‐Cu+‐CO ←→ 2 Ce4+‐O2‐‐Cu2+ + CO (R5)
A similar Mars‐van‐Krevelen (MvK)
mechanism was proposed by Sedmak et
al. [5]. According to these authors CO
(and H2) molecules are adsorbed on the
copper‐ceria interfacial region of the
catalyst and react with the lattice oxy‐
gen to produce CO2 (and H2O), as a re‐
sult of which the copper ion Cu2+ is re‐
duced to Cu+. The cerianite lattice then
supplies the lost oxygen anion to the
copper‐ceria interface so that finally the
vacancies are refilled by gaseous oxy‐
gen.
In a subsequent work by Martínez‐Arias
et al. [17], exhaustive analyses using
Operando‐DRIFT, XPS and EPR tech‐
niques were carried out to establish the
reaction mechanism and the causes of
deactivation of a CuOx/CeO2 catalyst.

Marbán et al. Appl. Catal. A: Gen. 361 (2009) 160‐169 87
They found that, although H2 and CO
oxidation takes place on the same active
centres (basically CuO/CeO2 pairs in
interfacial positions), there is a higher
selectivity towards CO oxidation at
intermediate temperatures (<200°C),
which is due to a higher reducibility of
CuO by CO than by H2 (confirmed in a
subsequent work [18]). The deactivation
observed was attributed to both an ac‐
cumulation of hydroxyls in interfacial
active centres and to a certain degree of
sintering.
Manzoli et al. [19] suggested that the
reactivity of CuOx/CeO2 catalysts is de‐
termined by the presence of surface
CuO clusters in the vicinity of ceria sites,
through a MvK mechanism similar to
that represented by R1 (Cu2+‐O2−‐Ce4+
←→Cu+‐�‐Ce3+). These authors attribute
deactivation to the reduction of the
catalysts during non‐isothermal treat‐
ments. Kim and Cha [19] consider that
catalyst deactivation is produced by the
accumulation of surface carbonates
during long duration reaction experi‐
ments in the presence of CO2 and H2O,
so that activity can be restored by ther‐
mal treatment under different atmos‐
pheres (10% O2, 50% H2 and He). These
authors synthesized their CuO/CeO2
catalysts by means of co‐precipitation
followed by air calcination at 500°C, so
that presumably sintering did not occur
during the reaction. On the other hand
Sedmak et al. [5] observed a fast, small
but irreversible deactivation which was
attributed to the redistribution of cop‐
per species on the catalyst surface.
It seems clear that there is not much
agreement regarding the causes of de‐
activation, partly because numerous
different causes are able to provoke
similar results (e.g. both sintering and
the accumulation of carbonates may
cause a decrease in the copper surface)
and also because of the inherent diffi‐
culty in interpreting correctly the spec‐
troscopic results (mainly XPS and FTIR
spectra). In this work an attempt will be
made to shed some light on all of these
issues.
2. Experimental
2.1. Catalyst synthesis and characteriza‐
tion
The CuO/CeO2 catalysts were prepared
by silica aquagel confined co‐
precipitation (SACOP) as reported else‐
where and thoroughly described in the
Supporting Information file. The main
characteristic of this synthetic procedure
it that calcination of the active phase
takes place inside the pores of the silica
template so that sintering is restricted
during the heating process. The synthe‐
sis parameters, final composition and
textural properties of the prepared cata‐
lysts are shown in Table 1. The composi‐
tion of the catalyst was evaluated by
SEM‐EDX analysis (DSM 942, Zeiss). The
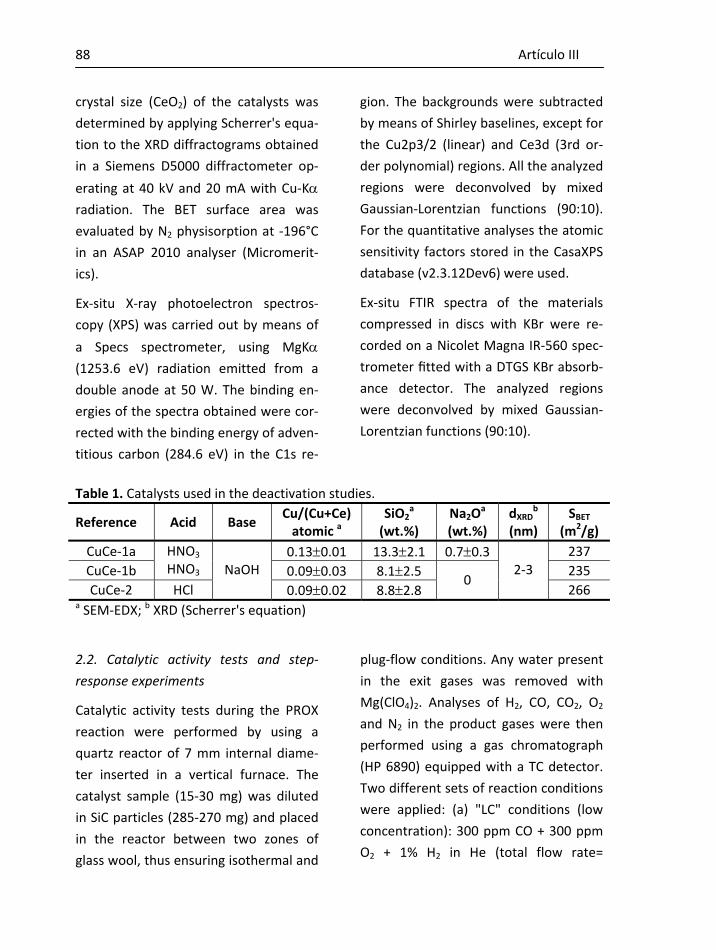
Artículo III 88
crystal size (CeO2) of the catalysts was
determined by applying Scherrer's equa‐
tion to the XRD diffractograms obtained
in a Siemens D5000 diffractometer op‐
erating at 40 kV and 20 mA with Cu‐Kα radiation. The BET surface area was
evaluated by N2 physisorption at ‐196°C
in an ASAP 2010 analyser (Micromerit‐
ics).
Ex‐situ X‐ray photoelectron spectros‐
copy (XPS) was carried out by means of
a Specs spectrometer, using MgKα (1253.6 eV) radiation emitted from a
double anode at 50 W. The binding en‐
ergies of the spectra obtained were cor‐
rected with the binding energy of adven‐
titious carbon (284.6 eV) in the C1s re‐
gion. The backgrounds were subtracted
by means of Shirley baselines, except for
the Cu2p3/2 (linear) and Ce3d (3rd or‐
der polynomial) regions. All the analyzed
regions were deconvolved by mixed
Gaussian‐Lorentzian functions (90:10).
For the quantitative analyses the atomic
sensitivity factors stored in the CasaXPS
database (v2.3.12Dev6) were used.
Ex‐situ FTIR spectra of the materials
compressed in discs with KBr were re‐
corded on a Nicolet Magna IR‐560 spec‐
trometer fitted with a DTGS KBr absorb‐
ance detector. The analyzed regions
were deconvolved by mixed Gaussian‐
Lorentzian functions (90:10).
Table 1. Catalysts used in the deactivation studies.
Reference Acid Base Cu/(Cu+Ce) atomic a
SiO2a
(wt.%) Na2O
a (wt.%)
dXRDb
(nm) SBET
(m2/g) CuCe‐1a 0.13±0.01 13.3±2.1 0.7±0.3 237 CuCe‐1b
HNO3
HNO3 0.09±0.03 8.1±2.5 235 CuCe‐2 HCl
NaOH 0.09±0.02 8.8±2.8
0 2‐3
266 a SEM‐EDX; b XRD (Scherrer's equation)
2.2. Catalytic activity tests and step‐
response experiments
Catalytic activity tests during the PROX
reaction were performed by using a
quartz reactor of 7 mm internal diame‐
ter inserted in a vertical furnace. The
catalyst sample (15‐30 mg) was diluted
in SiC particles (285‐270 mg) and placed
in the reactor between two zones of
glass wool, thus ensuring isothermal and
plug‐flow conditions. Any water present
in the exit gases was removed with
Mg(ClO4)2. Analyses of H2, CO, CO2, O2
and N2 in the product gases were then
performed using a gas chromatograph
(HP 6890) equipped with a TC detector.
Two different sets of reaction conditions
were applied: (a) "LC" conditions (low
concentration): 300 ppm CO + 300 ppm
O2 + 1% H2 in He (total flow rate=

Marbán et al. Appl. Catal. A: Gen. 361 (2009) 160‐169 89
300 mL/min, STP) and (b) "HC" condi‐
tions (high concentration: 0.5 vol% CO +
0.5 vol% O2 + 25% H2 in He (total flow
rate=200 mL/min, STP). In both cases
the values of the spatial velocities were
very high (LC: 0.4×10‐5 molCO∙gcat‐1∙s‐1,
HC: 2.3×10‐5 molCO∙gcat‐1∙s‐1). Before the
reactions each sample was pre‐treated
in a helium flow at 200°C for 1 h. Long
duration isothermal experiments were
generally performed, though for specific
samples non‐isothermal experiments
under decreasing temperatures were
also carried out at pseudo‐steady state
conditions (~1‐2 h per temperature
point).
Conversion of CO was evaluated as:
[ ][ ]in
outCO CO
CO1X −= (R6)
Where in and out refer to the inlet and
outlet gaseous stream respectively,
whereas the selectivity towards CO oxi‐
dation was estimated as:
[ ] [ ]( )[ ] [ ]out2in2
outin
OO
COCO5.0S
−−⋅
= (R7)
The reaction rate can be calculated by
means of the Langmuir‐Hinselwood
mechanism proposed by Liu and Flyt‐
zani‐Stephanopoulos [20] for CO oxida‐
tion over copper‐ceria catalyst, as thor‐
oughly described elsewhere [3].
Moreover, step‐response experiments
were performed in the quartz reactor
using different gas mixtures (CO/He,
CO+H2/He and CO2+H2/He) with the
purpose of assessing the deactivating
potential of the gases involved in the
PROX reaction over the diluted catalysts.
XPS and FTIR analyses were carried out
over catalyst samples labelled as:
(1) "Fresh": fresh sample (as synthesised
catalyst), (2) "PROX‐1h": catalyst sub‐
jected to He pre‐treatment at 200°C
followed by PROX reaction at 175°C for
1h (under LC and HC conditions) and
(3) "PROX‐20h": the sample pre‐treated
and subjected to the PROX reaction at
175°C for 20h (HC). To avoid external
influences between sample preparation
and analysis, the catalysts after the reac‐
tion were cooled down in helium flow
and quickly recovered from the glass
wool. All samples were stored in a vac‐
uum vessel until the XPS and FTIR analy‐
ses were performed.
3. Results and discussion
3.1. Catalytic activity
Fig. 1 shows the temporal variations of
CO conversion and selectivity for two
CuOx/CeO2 catalysts with different re‐
sidual silica contents (8.1 and 13.3 wt.%)
at different experimental conditions
(low/high concentration conditions, 175‐
208°C). In spite of their high activity, the
slow deactivation of the catalysts is con‐
spicuous, especially at the lowest tem‐
perature. At 208°C deactivation seems
to produce a slight increase in selectiv‐
ity. However, at lower temperatures

Artículo III 90
selectivity remains practically constant
during the reaction.
At 175°C the decay in activity is fast dur‐
ing the initial few hours of reaction and
then it becomes gradually less marked
and steadier. On the other hand, at
208°C the initial decay in CO conversion
is altogether absent and the subsequent
deactivation is less pronounced.
0.2
0.4
0.6
0.8
1.0
CO
con
vers
ion
(XC
O)
175°C, 8.1 wt% (LC)
208°C, 8.1 wt% (LC)
175°C, 13.3 wt% (LC)
175°C, 8.1 wt% (HC)
0.6
0.8
1.0
0 5 10 15 20 25Time (h)
Sele
ctiv
ity (S
)
175°C, 8.1 wt% (LC)
208°C, 8.1 wt% (LC)
175°C, 13.3 wt% (LC)
175°C, 8.1 wt% (HC)
Fig. 1. Catalytic activity (XCO) and selectivity (S) values of CuOx/CeO2 catalysts with differ‐ent amounts of residual silica, 8.1 wt.% (CuCe‐1b) y 13.3 wt.% (CuCe‐1a) evaluated at different temperatures and concentration conditions (LC and HC).

Marbán et al. Appl. Catal. A: Gen. 361 (2009) 160‐169 91
It can also be seen from Fig. 1 that the
residual silica content has a negative
effect on the catalytic activity. This could
be attributed to silica that is difficult to
dissolve [15]. The silica in this catalyst
seems to be interacting with the active
phase in such a way that it is difficult to
remove completely, because of the large
amount of residual silica still present
after two days of alkaline washing
(>8 wt.%). Techniques for obtaining a
higher degree of silica removal are being
currently studied.
A comparison of the slopes of conver‐
sion curves shown in Fig. 1 proves that
the initial deactivation rate at
175°C is higher under HC conditions
than under LC conditions. As can be
seen in the figure, for short reaction
times (1‐2h) the difference in activity is
already significant. The constant selec‐
tivity values through the reaction at
175°C (Fig. 1) is another argument in
support of the fact that both CO oxida‐
tion and H2 oxidation take place at the
same active centres [17]. It seems clear
that the lower selectivity at HC condi‐
tions is due to the effect of the gas com‐
position on the oxidation kinetics of CO
and H2.
In the light of these results, the follow‐
ing sections will focus on the causes of
the deactivation of the CuCe‐1b catalyst.
3.2. Deactivation
3.2.1. Step− response experiments
Fig. 2 shows the results of the step‐
response experiments carried out with
the CuCe‐1b catalyst at 175°C. After
helium pre‐treatment at 200°C, the first
stage consists of a 1‐h‐long PROX reac‐
tion at LC conditions in order to deter‐
mine the initial conversion degree
reached by each sample and to assure
that all the step response experiments
are carried out under similar experimen‐
tal conditions. The second stage consists
of an 18‐h‐long treatment with a gas
mixture that may be the PROX stream,
CO in He, CO+H2 in He or CO2+H2 in He.
Finally, the third stage consists of a
PROX reaction lasting 2‐3 h to determine
the degree of deactivation after the
different treatments of the previous
stage. As can be observed in the figure
all the non‐PROX steps in the second
stage produce only a slight decrease in
the activity of the catalyst in stage 3,
which corresponds to a ~10% reduction of the CO conversion obtained at the
end of stage 1. The PROX step in stage 2
provokes a reduction in CO conversion
of around 30%. This must be ascribed to
the presence of oxygen in the reaction
mixture, which is absent in the other
steps of stage 2. When CO2 is passed
through the catalyst bed in stage 2, no
consumption of this gas is observed so
that CO2, by itself, is unable to oxidise
the catalyst surface or to form surface
carbon species. On the other hand,

Artículo III 92
4.7 molCO/molcat (molcat = molCu + molCe)
were consumed in step 2 when the mix‐
ture of 303 ppm of CO in He was passed
through the reactor (3.1 molCO/molcat
in the presence of H2) and
4.3 molCO2/molcat were formed
(2.8 molCO2/molcat in the presence of H2).
If CO were reducing the oxidation state
of the catalyst the maximum amount of
CO2 formed should be below
2 molCO2/molcat, so that at least part of
the CO2 detected must be originated by
other reaction. Since the molar ratio of
CO consumed per CO2 formed is close to
one, the formation of the latter must be
ascribed to insignificant and unavoidable
oxygen inlets (<15 ppm) through the
silicone‐quartz soft joints in the reactor,
as a result of which a small fraction of
CO is oxidized. However, the higher con‐
sumption of CO with respect to forma‐
tion of CO2 suggests the potential occur‐
rence of some coke deposits via the
Boudouard equilibrium (2CO C+CO←→ 2)
and/or the formation of surface carbon‐
ates. The imbalance between CO con‐
sumption and CO2 formation [(molCO‐
molCO2)/molcat] in stage 2 can be quanti‐
fied as: 0.24 mol/molcat (CO+H2),
0.39 mol/molcat (CO) and 1.42 mol/molcat
(PROX). It seems clear that the forma‐
tion of carbon deposits as coke or car‐
bonates is enhanced under PROX condi‐
tions.
0.0
0.2
0.4
0.6
0.8
1.0
0 5 10 15 20Time (h)
XCO
PROX (300 ppm CO + 300 ppm O2 + 1%H2)303 ppm CO
300 ppm CO + 1%H2308 ppm CO2 + 1%H2
Stage 3(PROX)
Stage 2
Stage 1 (PROX)
175°C
Fig. 2. Step‐response experiments at 175°C with the CuCe‐1b catalyst.
Fig. 3 shows the reaction rate curves, at
200°C (LC), of a catalyst (CuCe2) sub‐
jected to different initial and intermedi‐
ate treatments. In the first group of pre‐

Marbán et al. Appl. Catal. A: Gen. 361 (2009) 160‐169 93
treatments (a‐c), carried out at T≤300°C over different samples of the same cata‐
lyst, the reaction rate curves are similar,
with slight variations as a function of
time, temperature and gas concentra‐
tion during the pre‐treatment. In the
second group of treatments the catalyst
is first heated in air at 400°C (d) and
then subsequently subjected to increas‐
ing temperature treatments (e)‐(g) un‐
der H2. The results clearly show that pre‐
treatment in air at 400°C (d) has a nega‐
tive effect on the reaction rate, as com‐
pared to treatments at lower tempera‐
tures, that might be attributed to active
phase sintering, this effect being even
more noticeable in the final treatment
(g) at 500°C. It should be reminded that
the catalysts were prepared by a silica‐
template technique, so that sintering of
the nanoparticles during the synthesis
was prevented by the silica template, in
spite of the relatively high calcination
temperature (550°C) employed. There‐
fore, once the silica was removed the
resulting nanoparticles became prone to
suffer sintering at temperatures lower
than the calcination temperature.
0.0E+00
2.0E-06
4.0E-06
6.0E-06
8.0E-06
1.0E-05
1.2E-05
1.4E-05
1.6E-05
0 10 20 30 40 50 60 70 80 90
time (h)
rPR
OX,
mol
·g-1
·s-1
CuCe2PROX at 200°C(LC conditions)
(a) 300°C-5%H2-1h
(d) 400°C-Air-1h + (e) 300°C-5%H2-1h + (f) 400°C-5%H2-1h + (g) 500°C-5%H2-1h
(c) 200°C-5%H2-6h
(b) 200°C-He-1h
Fig. 3. Reaction rate at 200°C for the CuCe2 catalyst after it has been subjected to differ‐ent treatments.
The treatments at 300°C in 5% H2 for 1h
(a,e) seem to produce a temporary en‐
hancement of the reaction rate com‐
pared to similar treatments at lower
(b,c) or higher (f) temperatures, al‐
though for high reaction times the
curves obtained after treatments at
T≤300°C tend to equalize, regardless of

Artículo III 94
the type of pre‐treatment (a‐c). The use
of hydrogen at this specific temperature
(300°C) might either reduce the active
phase to some extent or clean the sur‐
face of detrimental species (e.g. carbon‐
ates), without promoting the sintering
that might be occurring at higher tem‐
peratures. Discussion of the surface
analyses of the samples subjected to the
PROX reaction will enable us to
re‐examine Fig. 3 in the light of the new
data presented below.
3.2.2. Surface analysis (XPS and FTIR)
As described in the experimental section
XPS and FTIR were performed ex‐situ.
The samples to be analysed were pro‐
tected from external influences by keep‐
ing them in a vacuum vessel between
reaction and analysis. Ex‐situ FTIR per‐
mits the analysis of the stable species
formed on the surface of the catalysts
(deactivating agents) when in‐situ tech‐
niques, such as DRIFTS, are not avail‐
able. The raw curves obtained from XPS
and FTIR analyses were subjected to
deconvolution procedures as described
in the experimental section to deter‐
mine the contribution of different spe‐
cies to the global curve, as usually done
for XPS. Fig. 4 shows an example of the
deconvolution procedures performed
with the XPS spectra (O1s spectral re‐
gion for the PROX‐1h samples). In order
to determine the surface composition of
the samples, peak assignments were
performed as indicated in the figure and
exhaustively discussed in the Supporting
Information, based on literature data.
Briefly, in the C1s region, peaks at 286.9‐
287.3 eV (peak maxima for all samples)
are attributed to C–O, C–OH and C–O–C
bonds [21‐23], whereas peaks at 288.3‐
288.9 eV are associated to C=O bonds of
varying strength [23‐25]. In the case of
adventitious carbon (284.6 eV), although
different approaches can be found in
literature (see Supplementary informa‐
tion) we believe that when the analytical
conditions are identical, the variations in
peak areas between different samples
should be ascribed to real differences in
the samples rather than different de‐
grees of contamination. In the O1s re‐
gion, the peak at ~529.5 eV is attributed to oxygen in copper or cerium oxides
[26‐29], whereas the peak at 531.6 eV
can be ascribed to Si–O [30, 31], C=O
[21, 32] and C–O [21] bonds. The as‐
signments of the Ce3d region are taken
from Qiu et al. [33] and permit to calcu‐
late the amount of Ce4+ in the sample as
indicated in the Supplementary Informa‐
tion. For the Cu2p3/2 region the peak at
~933 eV is associated to Cu+ species, whereas the peak at 933.6‐934.3 eV is
attributed to Cu2+ species [20, 34].
A peak located at 930 eV is attributed to
highly dispersed Cu2+ ions from surface
Ce4+‐O2‐‐Cu2+ pairs (see SI).

Marbán et al. Appl. Catal. A: Gen. 361 (2009) 160‐169 95
524 526 528 530 532 534 536B.E. (eV)
Inte
nsity
(a.u
.)HC (O1s)HC (peaks)LC (O1s)LC (peaks)
O1sPROX-1h
Metaloxides
C–OC=OSiO2
Charge effect
Fig. 4. XPS deconvolution results for O1s spectral region (PROX‐1h samples).
Based on the described strategy, Table 2
shows the surface composition of
CuCe‐1b catalysts after each reaction
stage. The combined analysis of FTIR
and XPS results will help to identify the
causes of deactivation, that is suspected
to be due to the formation of coke and
other carbon compounds (analysed by
means of surface carbon analysis) or
active phase sintering and oxidation
states modification (studied by the
analysis of metallic phases and concen‐
tration).
Surface carbon (combined XPS and FTIR
results): As can be observed in Table 2
the surface concentration of adventi‐
tious carbon is very high in all the ana‐
lyzed samples (a large proportion of this
may be from contamination during the
analysis) and follows a regular trend,
clearly increasing after 20 h of PROX
reaction at HC. The possible formation
of coke deposits during the reaction has
already been suggested in the discussion
on the step‐response experiments at LC
conditions. It seems logical to assume
that at HC conditions the formation of
coke deposits via the Boudouard equilib‐
rium is even more likely. This might ex‐
plain the higher deactivation rate ob‐
served at HC conditions (Fig. 1) although
this is not the most probable explana‐
tion as will be discussed below.

Artículo III 96
Table 2. Summary of XPS surface composition of samples (atom%).
Sample
Species
* %Ce4+ in total cerium
** Oxygen concentration evaluated from peak at ~532 eV in O1s region, once corrected for oxygen in SiO2. Carbon concentration corresponds to non adventitious carbon (C–O and C=O)
The fresh sample also displays a small
amount of non adventitious carbon in
the form of C–O and C=O type species,
whose surface concentration clearly
increases after 20h of PROX reaction at
HC conditions but decreases after only
1 h of PROX reaction at LC conditions.
Such behaviour should be reflected in
the FTIR spectra obtained for the differ‐
ent samples (Fig. 5, HC conditions).
Thus, the major peaks of Fig. 5 should be
attributed to monodentate [35‐37] and
bidentate carbonates [17, 37, 38] and
carboxylates [35‐37] as summarised in
Table 3, although an unambiguous iden‐
tification of the peaks is difficult to ob‐
tain since several compounds share
peaks with the same frequencies.
(B.E., eV)
Fresh PROX 1h
(HC)
PROX 1h
(LC)
PROX
20h (HC)
CARBON (C1s)
Adventitious Carbon 30.43 30.97 29.32 36.40
Non advent. Carbon; C–O 1.43 1.38 0.26 2.50
Non advent. Carbon; C=O 0.72 0.69 0.13 1.30
COPPER (total)(Cu2p3/2) 2.28 1.79 2.19 1.45
Cu+ 0.56 0.09 0.00 0.05
Dispersed Cu2+ 0.36 0.49 0.50 0.16
CuO clusters 1.36 1.19 1.65 1.21
CERIUM (total)(Ce3d) 7.71 7.85 8.26 4.74
Ce4+6.24
(81.0%)*
6.32
(80.4%)*
7.90
(95.7%)*
3.33
(70.3%)*
Oxygen to non adventitious carbon
atom ratio, O/C ** 2.9 3.7 2.9 2.9
Copper to metals atom ratio,
Cu/[Ce+Cu] 0.23 0.19 0.21 0.23

Marbán et al. Appl. Catal. A: Gen. 361 (2009) 160‐169 97
1200 1300 1400 1500 1600 1700Wavenumber (cm-1)
Inte
nsity
(a.u
.) .
PROX 1h
1263
13011369
1384
1415
1453
1511 1588
400 800 1200 1600 2000 2400 2800 3200 3600 4000
Wavenumber (cm-1)
Inte
nsity
(a.u
.)
PROX-20hPROX-1hFresh
Bid
enta
te c
arbo
nate
s
Si-O
Carbonates SiO-H
Formates
Fig. 5. Infrared spectra for CuCe‐1b after the different reaction stages at HC (Inset: de‐convolution example).
Copper carbonates (or hydroxides) were
not detected by XPS on any of the ana‐
lyzed samples (Table 2), therefore both
carboxylates and/or carbonates must
have been formed on the cerium oxide
surface. The small peaks located at
1263 cm‐1 and in the ~2850‐2950 cm‐1
range (Fig. 5) are attributed to asym‐
metric strecthing C–O–C vibration [39,
40] and cerium formates (both biden‐
tate and bridged) [41, 42] respectively.
No metallic hydroxyls (isolated bands
between 3600 and 3700 cm‐1), carbonyls
(2100 cm‐1 [17]) or molecular water (in‐
tense peak at 1640 cm‐1 [43]) were de‐
tected on the samples.
The evolution of the peaks associated to
carbonates and carboxylates can be
followed in Fig. 5 (a mathematical ap‐
proach can also be found in the supple‐
mentary information). The fresh sample
exhibits peaks that are characteristic of
monodentate and bidentate carbonates
(850, 1370 cm‐1). A small fraction of
carboxylates cannot be disregarded,
although their most representative fre‐
quencies (1305, 1510 cm‐1) are also dis‐
played by carbonates and, furthermore,
the O/C ratio for the fresh sample (see
SI) takes the value of 2.9, close to that
expected for carbonates (~3). After 1 h under PROX at HC conditions, the areas
of these peaks are slightly affected and

Artículo III 98
only small changes can be detected by
FTIR (Fig. 5 and SI), although a clear in‐
crease is observed after PROX‐20h. The
origin of carbonates on the fresh sample
must be in the action of atmospheric
gases on the surface of the catalyst after
calcination. In principle, they could sur‐
vive both the pre‐treatment in helium at
200°C and the PROX reaction at 175°C,
according to several authors [36, 44]. On
the other hand, carboxylates do not
survive under PROX conditions [36],
which could explain the initial decrease
of the areas of some peaks partly origi‐
nated by this species (~1510 and
~1305 cm‐1). The values of Table 2 show
that the PROX‐1h sample obtained at
low concentration conditions (LC) pre‐
sents very small surface amounts of C–O
and C=O functionalities, as shown in
Table 2 and Fig. 4. This suggests that at
the beginning of the PROX reaction a
fraction of the carbonates and all car‐
boxylates which are initially present on
the surface of the fresh sample are re‐
moved, at least under LC conditions.
However, this is not in conflict with the
postulates of the above mentioned au‐
thors [36, 44], since they used HC condi‐
tions in their works. Obviously the re‐
moved carbonates are of a more labile
nature than those formed during the
reaction otherwise, they would have
survived the reaction conditions.
Table 3. FTIR peak assignment (placed in cells in descending order of intensity).
Potential assignment Our values* Literature values
Monodentate carbonate 1370
1450
~1510 **
1351‐1367 [35, 37]
1464 [36]
1517 [35]
Bidentate carbonate 850
~1305 1588
854 [17], 850 [38]
1297 [17]
1586 [17]
Carboxylate ~1305 ~1510
1316 [37]
1510 [37] [36]
* The values of the peaks in this work correspond to the values of the individual deconvolved curves, while the literature values correspond to the apparent maximum in the spectrum. ** In italics the peaks that can be shared by different species.
This seems to indicate that there is an
equilibrium of formation and decompo‐
sition of the different species involved
(monodentate and bidentate carbonates
and carboxylates).
To summarise, the surface of the fresh
sample contains monodentate carbon‐
ates, bidentate carbonates and carboxy‐
lates. In view of the similar intensities of
the most intense peaks corresponding to

Marbán et al. Appl. Catal. A: Gen. 361 (2009) 160‐169 99
the bidentate (1588 cm‐1) and monoden‐
tate (1370 and 1510 cm‐1) carbonates,
both types of species should be present
on the ceria surface in similar propor‐
tions. Either during the pre‐treatment or
under the PROX‐conditions the carboxy‐
lates are removed. The labile surface
carbonates initially produced from at‐
mospheric exposure, probably on iso‐
lated ceria sites, that survive the helium
pre‐treatment at 200°C [36, 44], are
eliminated at the beginning of the PROX
reaction at LC conditions. Afterwards, at
HC conditions new carbonates are
formed on the catalyst surface. How‐
ever, at LC conditions the low CO con‐
centration in the stream limits the for‐
mation of new carbonates, which there‐
fore takes place more slowly than under
HC conditions (Table 2). Consequently,
the deactivating effect of carbonates at
the beginning of reaction is less con‐
spicuous than under HC conditions (Fig.
1). The carbonates formed during reac‐
tion are more strongly held on the cata‐
lyst surface than those produced by
atmospheric exposure on the fresh
sample, so that they are not removed as
they are formed. As will be shown later
these carbonates are produced from CO
chemisorption on interfacial cerium sites
in close contact with copper sites, this
being the potential cause for their
higher stability. The removal of the car‐
bonates at the start of the reaction may
take place by oxidative decomposition, a
common occurrence with cerium for‐
mates and cerium monodentate car‐
bonates at low temperature (180°C), as
described by Karpenko et al. [45]. These
authors associated the presence of car‐
bonates with that of Ce3+. The oxidative
removal of the carbonates produced
Ce4+ and CO2. The same association can
be observed in the CuCe‐1b catalyst. Fig.
6 shows the relation between the con‐
centration of surface carbonates (C=O
species evaluated by XPS; Table 2) and
the concentration of surface Ce+3, both
relative to total cerium concentration.
As can be observed, the relation is clear.
The [C=O]/Ce3+ molar ratio for all the
samples is in the 0.36‐0.92 range, below
the value which one might expect for
pure cerium(III) carbonate (1.5) but rep‐
resenting an important fraction of sur‐
face coverage.
As described above, the FTIR shoulder at
1263 cm‐1 (Fig. 5), corresponds to the
C–O–C vibration (Table 3). This peak was
not detected in the FTIR spectrum of the
fresh sample, so its origin might be the
oxidation of coke deposits generated
during the reaction. The peaks associ‐
ated to cerium formates (both bidentate
and bridged, ~2850‐2950 cm‐1) increase
continuously during reaction. These
compounds were identified as interme‐
diates in the PROX reaction in former
works, as they are products specific to
the reaction between CO and surface
hydroxyls [36]. The absence of hydroxyls

Artículo III 100
(bands in the 3600‐3700 cm‐1 region)
explains the insignificant presence of
formates on the catalyst surface. Hy‐
droxyls have been detected by
Martínez‐Arias et al. [17] via in‐situ
DRIFT analyses so that they should be
attributed to reaction intermediates
rather than to deactivating species. Ad‐
ditionally, a certain amount of water is
present during the reaction (selectivity
< 1), which is known to slow down the
formation of formates on the ceria sur‐
face [46].
0.00
0.05
0.10
0.15
0.20
0.25
0.30
0.35
0.00 0.10 0.20 0.30surface C=O / total Ce
Ce3+
/ to
tal C
e
PROX-1h (LC)
Fresh
PROX-1h (HC)
PROX-20h (HC)
Fig. 6. Ratio of Ce3+ concentration (rela‐tive to total Ce) to concentration of C=O type surface species (relative to total Ce).
Metallic species. The surface copper
concentration in the fresh sample is very
similar to that of the PROX‐1h sample
obtained under LC conditions, although
significantly higher than the surface
copper concentration of the PROX‐1h
sample achieved under HC conditions
(Table 2). In this case, the loss of surface
copper cannot be due to thermal sinter‐
ing, as this would also affect the catalyst
under LC conditions. The higher concen‐
tration of surface cerium carbonates in
the sample obtained at HC conditions
would seem to be a more logical expla‐
nation for its lower surface copper con‐
centration. Furthermore, this diminution
of surface copper must be associated to
the CuO clusters and not to the highly
dispersed Cu2+ species, whose concen‐
tration is independent of the reaction
conditions, as can be observed in Table
2 for both PROX‐1h samples. The pro‐
moting effect of CuO on the formation
of carbonates in interfacial CuO/CeO2
sites has already been suggested by
Martínez‐Arias et col. [47].
From Table 2 it can be seen that the
fresh catalyst has a significant Cu+ con‐
tent (~25% of total copper) and a smaller content of dispersed Cu2+ spe‐
cies (~16%), the rest being small CuO
clusters distributed over the ceria sur‐
face. From precedent discussion and the
results presented in Table 2 it can be
deduced that during the pre‐treatment
in helium at 200°C most of the dispersed
Cu2+ species are aggregated into small
CuO clusters (partial sintering), whereas
the Cu+ species remain stable (the re‐
duced copper species are stable on the

Marbán et al. Appl. Catal. A: Gen. 361 (2009) 160‐169 101
ceria surface without forming solid solu‐
tions [26]). Thus, aggregation of dis‐
persed Cu2+ during pre‐treatment is
inferred from the fact that it already
takes place at a lower temperature
(175°C), as proven (a) by the diminution
of dispersed Cu2+ concentration during
the reaction and (b) by the increased
concentration of CuO clusters in the
PROX‐1h sample (LC), in which the ef‐
fects of carbonate formation on the
copper concentration are minimal. Tak‐
ing into consideration the mechanisms
reported by Martínez‐Arias et al. [16]
and Manzoli et al. [19], a redox equilib‐
rium is established at the beginning of
the reaction at 175°C so that dispersed
Cu+ is transformed by oxidation with
lattice oxygen into dispersed Cu2+
(Ce4+‐O2‐‐Cu2+; reaction R5). In fact, the
sum of the concentrations of both spe‐
cies (dispersed Cu+ and Cu2+) in the
PROX‐1h samples is practically equal to
the Cu+ concentration in the fresh sam‐
ple (0.50‐0.56 vs. 0.57 atom%). Assum‐
ing that after 1 h's reaction the concen‐
trations of surface species are at equilib‐
rium [19], then reaction R1 must be the
slowest step in the mechanism, taking
into account the low concentration of
reduced copper in the PROX‐1h samples.
Both highly dispersed Cu2+ species and
CuO clusters in close contact with ce‐
rium oxide participate in the equilibrium
(R1). These data suggest that R1 reac‐
tion is the controlling step of the PROX
mechanism. The decrease in reduced
copper is more evident at LC conditions,
under which Cu+ completely disappears
after 1 hour's reaction (Table 2). This is
in agreement with a lower CO concen‐
tration in the gas stream and, therefore,
a lower reaction rate for R1.
Fig. 7 shows Wagner's diagram for cop‐
per [48], which plots the binding energy
of maximum intensity in the Cu2p3/2
region versus the kinetic energy of
maximum intensity in the CuLMM region
(Auger spectrum). Briefly, this diagram
allows us to visualize the degree of elec‐
tronic interaction / dispersion of the
copper species with / on the ceria lattice
(which increases when we descend par‐
allel to the dashed lines) and of the oxi‐
dation state of the copper species
(which increases when we move to the
left and perpendicular to the dashed
lines). Fig. 7 shows the data obtained in
this work (black squares) and the data
points taken from a work by Gamarra et
al. [18], which are used as references. As
can be observed in the diagram, the
point corresponding to the fresh sample
is situated in an intermediate zone be‐
tween the lines representative of Cu2+
and Cu+, confirming the high content of
reduced copper in this sample. On the
other hand, the points for the PROX‐1h
samples are situated right on the Cu2+
line, in agreement with their highly oxi‐
dized state (Table 2). The rather eccen‐
tric location of the point corresponding

Artículo III 102
to the PROX‐20h sample (it should be a
priori on the Cu2+ line) might have been
caused by a certain oxygen defect in the
surface CuO clusters (CuO1‐x), and it is
directly related to the shift of the bind‐
ing energy for the Cu2+ peak in the
Cu2p3/2 region to a lower value
(933.6 eV in the PROX‐20h sample with
respect to 934.0‐934.3 eV in the PROX‐
1h samples).
913
914
915
916
917
918
919
932933934935936
B.E. (Cu2p3/2) (eV)
E.K
. (C
u LM
M) (
eV)
Cu(0) bulk
Cu2O bulk
CuO bulk5%CuO/CeO2
(IW of CeO2 prepared by microemulsion,
Gamarra et al., 2007)
Cu+ line
Cu2+ line
Cu2+ ZSM-5
Cu+ ZSM-5
Fresh
PROX-1h (HC)
PROX20h(HC)
PROX-1h (LC)
Fig. 7. Wagner's diagram showing the evolution of copper species during the PROX reac‐tion. Circles represent data taken from a work by Gamarra et al. [18].
The point corresponding to the fresh
sample is located in a zone of the dia‐
gram considerably lower than the point
for bulk CuO. This implies that there is a
high degree of electronic interaction of
copper with the cerium oxide as a con‐

Marbán et al. Appl. Catal. A: Gen. 361 (2009) 160‐169 103
sequence of the high dispersion of spe‐
cies (dispersed Cu+ + dispersed Cu2+ +
small CuO clusters). The point for the
PROX‐1h sample (HC) has a similar ordi‐
nate to that of the fresh sample, con‐
firming that the dispersed Cu+ in the
fresh sample has been transformed into
dispersed Cu2+. Thus these species must
be responsible for the high degree of
electronic interaction between copper
and cerium oxide. The point for the
PROX‐1h sample (LC) is in a somewhat
higher position, as a consequence of the
higher concentration of "visible" CuO
clusters (unaffected by the interfacial
carbonates), which interact more weakly
than dispersed Cu2+ with cerium oxide.
Finally the point for the PROX‐20h sam‐
ple is located in a higher zone of the
diagram, consistent with the presence of
CuO clusters and, especially, with the
lower concentration of dispersed Cu2+.
Even so, this point lies below those cor‐
responding to the cerium oxide
nanoparticles prepared by microemul‐
sion that have been wet impregnated
with copper salts [18]. This evidences
the high dispersion of copper obtained
by the SACOP technique.
Cerium oxide undergoes some reduction
during the reaction under HC conditions
(the percentage of Ce4+ decreases from
~80% in the PROX‐1h sample to ~70% in
the PROX‐20h sample). As mentioned
before the reduced cerium species are
related to the formation of surface car‐
bonates during the reaction. On the
other hand, the surface concentration of
cerium diminishes notably for 20 h in
the PROX reaction (from 7.8 to
4.7 atom%), which is coincident with a
parallel increase in adventitious carbon
in ~6 atom%. It is thus evident that coke
deposits have accumulated on the ceria
surface during the reaction, since the
decrease in surface copper concentra‐
tion is less conspicuous and its causes
have been clearly established in the
preceding discussion. Besides, it has
recently been observed that the amount
of coke deposited on CuO/CeO2 catalysts
during the steam reforming of methanol
is inversely related to their copper con‐
tent [49].
3.3. Deactivation mechanism
In light of the results obtained in this
work we postulate a deactivation
mechanism during PROX at tempera‐
tures below 250°C comprising two dif‐
ferent sub‐mechanisms whose relative
importance is a function of (1) the time
on stream, (2) the temperature and (3)
the reaction conditions (LC or HC). Table
4 lists the different mechanisms, and
shows how they affected by these pa‐
rameters.

Artículo III 104
Table 4. Deactivation mechanisms at T<250°C in CuCe‐1b.
Deactivation
mode
Metallic spe‐
cies involved Temperature* Time on stream*
CO
concen‐
tration *
Carbonate forma‐
tion (main cause of
deactivation)
Ce3+ formed
during reac‐
tion (in con‐
tact with CuO
clusters)
Decreases
Takes place in 1‐5
h at HC and more
slowly at LC
Increases
deactiva‐
tion rate
Aggregation of
dispersed Cu2+ to
CuO clusters (par‐
tial sintering)
Dispersed
Cu2+
Increases. It is
hardly signifi‐
cant at 175°C
Takes place until
disappearance of
dispersed Cu2+
Appar‐
ently not
affected
*Variation of extent of deactivation with the increase in each variable
3.3.1. Coke effect
In our opinion, although the formation
of coke deposits revealed by XPS analy‐
sis (Table 2) provokes a decrease in the
surface concentration of ceria, it does
not really contribute to a higher deacti‐
vation of the catalyst. If this were the
case, it would affect more clearly the
shape of the CO conversion curve at HC
conditions displayed in Fig. 1. In this
experiment about half of the lost cata‐
lytic activity took place in the first hour
of reaction, during which the value of kL
decreased ~25% (from 1.94×10‐4 to
1.47×10‐4 molCO∙gcat‐1∙s‐1∙bar‐0.15),
whereas after 20 h the value of kL was
~52% of the initial one
(1.01×10‐4 molCO∙gcat‐1∙s‐1∙bar‐0.15). How‐
ever, the surface concentration of coke
in the first hour of reaction did not sub‐
stantially vary (Table 2). It is well known
that the transport of oxygen towards
the interfacial centres of reaction
(Cu/Ce) occurs by a MvK mechanism
through the crystal lattice of cerium
oxide [19], so that as long as there is
some free surface ceria to link the gase‐
ous oxygen, its subsequent ionic trans‐
port through the lattice should not be
seriously affected by the presence of
coke.
3.3.2. Deactivation by carbonates
Carbonates are the main cause of deac‐
tivation and they are also behind the
differences apparent in Fig. 1 between
the CO conversion curves at different
concentration conditions (LC and HC)
during the first hours of reaction. Ini‐
tially the fresh sample holds some labile
carbonates which are associated to the

Marbán et al. Appl. Catal. A: Gen. 361 (2009) 160‐169 105
reduced cerium species (Ce3+) on the
catalyst surface. During the first mo‐
ments of reaction at 175°C there is a
rearrangement of the cerium oxide sur‐
face, caused by the oxidative elimination
of carbonates. Parallel to this fact, the
PROX reaction starts to take place and,
simultaneously, deactivation by newly
formed carbonates helps to slow it
down. Since the results of the step re‐
sponse experiments indicate that both
oxygen and CO are needed to form the
interfacial carbonates, we postulate the
following deactivation sub‐mechanism
(R3b) to be added to the reaction
scheme proposed by Martínez‐Arias et
al. [16]:
Ce4+‐O2‐‐Cu+‐CO Ce→ 3+‐CO3
‐‐Cu2+ (R3b)
Thus, at high CO concentration condi‐
tions, equilibrium R4 is shifted to the left
(formation of Ce4+‐O2‐‐Cu+‐CO), so that
reaction R3b is favoured from the be‐
ginning, whereas at low CO concentra‐
tion conditions, reaction R4 is initially
favoured over R3b. Nevertheless, as R3b
is irreversible, a sufficient reaction time
must lead to a similar amount of surface
carbonates under both reaction condi‐
tions (Fig. 1). Thus, carbonates prevent
or delay the oxygen activation per‐
formed by reactions R3‐R4, as already
suggested by Manzoli et al. [19].
These carbonates provoke also a loss of
surface CuO clusters, as well as a small
loss of surface cerium [~0.4 mol% in the
first hour of reaction, estimated by the
difference in the amount of surface ce‐
rium between the PROX‐1h samples (LC
and HC; Table 2)], though the main
cause of diminution of surface cerium
during the reaction continues to be the
accumulation of coke deposits.
Obviously an increase in temperature
produces a decrease in the formation of
surface carbonates, not only due to their
enhanced lability, but also because of
the reduced availability of CO as a con‐
sequence of the PROX reaction. This
explains the lower deactivation slope of
the CO conversion curve at ~200°C (Fig. 1).
3.3.3. Deactivation by aggregation of
dispersed Cu2+ (partial sintering)
The slow sintering (aggregation) of
highly dispersed Cu2+ to form CuO clus‐
ters at 175°C is evident in the Wagner's
diagram (Fig. 7), and in the conspicuous
decrease of its concentration during the
reaction (Table 2), which, like the de‐
crease in the surface concentration of
CuO clusters, is unrelated to the parallel
formation of carbonates. Extended sin‐
tering of these clusters is possibly be‐
hind the high degree of deactivation
observed at temperatures over ~300°C (Fig. 3). Thus, the highly dispersed Cu2+
ions must be the only protagonists of
the potential deactivation ascribed to
sintering at T<300°C. However, it is
doubtful that the sintering of this spe‐

Artículo III 106
cies influences the PROX reaction at
175°C. In the step‐response experiments
at 175°C it was concluded that the pres‐
ence of oxygen was needed in order to
provoke catalyst deactivation through
the formation of surface carbonates.
Consequently, the deactivation pro‐
duced during stage 2 (Fig. 2) in the ab‐
sence of oxygen must be mainly as‐
cribed to the sintering of dispersed Cu2+
species (although the small leak of oxy‐
gen might contribute to the formation of
some deactivating carbonates). Thus,
the results in Fig. 2 show that under low
concentration conditions the loss of
conversion produced by deactivation in
19 h of reaction at 175°C is 29% of the
initial conversion value, to which sinter‐
ing contributes no more than ~10% and carbonate formation no less than ~19%. On the other hand, under high concen‐
tration conditions (Fig. 1) sintering
causes the same degree of deactivation
as under LC conditions, whereas the
formation of carbonates causes a loss of
CO conversion, after 19 h, of no less
than 25% of the initial value of conver‐
sion. Therefore, at 175°C after 19 h of
reaction, carbonate formation contrib‐
utes to deactivation at least between 2
(LC) and 2.5 (HC) times more than the
sintering of dispersed Cu2+ species.
At 200°C the sintering of dispersed Cu2+
can be expected to be more obvious,
though in any case it is compensated for
a decrease in the formation of carbon‐
ates, which results in a lower net deacti‐
vation rate than that observed at 175°C
(Fig. 1). It should also be taken into ac‐
count that the highest catalytic burden
is carried by the CuO clusters, and not
by the dispersed Cu2+ ions, whose lower
reducibility makes them a priori a less
active species [18].
Another unexplained phenomenon is
the hysteresis observed in non‐
isothermal PROX cycles, whose trend
varies as a function of the reaction con‐
ditions. Thus, under low concentration
conditions (LC), the curve of the CO con‐
version at increasing temperatures is
formed by higher conversion values than
that obtained at decreasing tempera‐
tures [8]. Exactly the opposite is the case
at high CO concentration conditions (HC)
[19]. This opposite behaviour can be
better visualised in Fig. 8. The cause of
hysteresis under LC conditions reported
previously [8] was of a kinetic nature, so
that copper oxide reduction (the cause
of deactivation according to Marbán et
al. [8]) proceeded more rapidly at de‐
creasing temperatures. Surprisingly,
catalyst reduction was also the cause
advanced by Manzoli et al. [19] to ex‐
plain the opposite hysteresis in the
PROX cycle at HC conditions, in which
the increase and subsequent decrease in
temperature led to higher CO conver‐
sion values being observed during the
cooling down.

Marbán et al. Appl. Catal. A: Gen. 361 (2009) 160‐169 107
XCO
XCO
Temperature
a bLC conditions
b aHC conditions
Manzoli et al. (2005)
Marbán et al. (2005)
XCO
XCO
Temperature
a bLC conditions
b aHC conditions
Manzoli et al. (2005)
Marbán et al. (2005)
Fig. 8. Schematic hysteresis cycles of conversion found during PROX reaction under LC [8] and HC [19] conditions.
We believe that the deactivation
mechanisms described in this work ex‐
plain the different hysteresis trends
reasonably well. The sintering of dis‐
persed copper species is the most prob‐
able cause of hysteresis in the PROX
cycle at LC [8], since under these condi‐
tions carbonate formation is much
slower and therefore it would produce
the opposite hysteresis only if each
point of the reaction cycle were evalu‐
ated after a sufficiently long reaction
time (several hours), a precaution that
was not taken in the previous work by
Marbán et al. [8]. Thus, the sintering of
part of the active phase, which occurs
mainly at the highest temperatures,
explains the hysteresis in the PROX cycle
at LC conditions. On the other hand, at
HC conditions the formation of carbon‐
ates is quite fast, the effect of which will
be more apparent at the lowest tem‐
peratures.
On reaching a temperature of around
250°C (highest temperature in the PROX
cycles analyzed by Manzoli et al. [19])
the surface carbonates decompose,
favouring higher CO conversion values
during the subsequent cooling down
phase compared to those obtained dur‐
ing the heating up part of the cycle.
The combined deactivation mechanisms
also contribute to an understanding of
the influence that some of the treat‐
ments have on the activity curves, at
200°C, displayed in Fig. 3. Thus, treat‐
ment (a) (300°C‐5%H2‐1h) causes a cer‐
tain reduction of the catalyst which in
turns leads to an enhancement of its
initial reactivity (higher concentration of
Cu+/Ce3+ pairs). However, the slow but
continuous formation of carbonates
during the first 40 h of reaction allows
the activity curve to converge with that
of the catalyst subjected to the standard
pre‐treatment (b) (200°C‐He‐1h). In the
case of pre‐treatment with H2 at a lower
temperature [(c) (200°C‐5%H2‐6h)] the
reducing strength of this gas is minimal
(unlike CO [17], this being the key for
the high selectivity of these catalysts), so
that the lower initial reactivity with re‐
spect to that observed after the stan‐
dard pre‐treatment (b) occurs only be‐
cause the copper is subjected to a

Artículo III 108
longer period of sintering during pre‐
treatment.
4. Conclusions
We have analyzed the catalytic activity,
in the PROX process, of CuOx/CeO2 cata‐
lysts prepared by silica aquagel confined
co‐precipitation. At low concentration
conditions their catalytic activity is simi‐
lar to some of the most active catalysts
described in the literature. However
these catalysts suffer a certain degree of
deactivation when subjected to high
concentration conditions. We have ana‐
lyzed the surface composition of the
catalysts and identified the different
species on them during the reaction as a
previous step to formulating a deactiva‐
tion mechanism. Although coke deposi‐
tion occurs during the reaction, this
does not affect catalytic activity. Deacti‐
vation at temperatures below 250°C is
produced mainly by carbonate forma‐
tion, and is inversely dependent on
temperature, unlike the other deactiva‐
tion mechanism, which is simply the
aggregation of dispersed Cu2+ to CuO
clusters (partial sintering). At tempera‐
tures over 300°C deactivation is proba‐
bly produced by extended sintering of
the active phase of the catalyst. These
mechanisms can also be applied to other
CuO/CeO2 systems and may help to ex‐
plain the hysteresis commonly observed
with conversion in non‐isothermal activ‐
ity experiments.
Acknowledgements
Funding through the Spanish National
Project MAT2005‐00262 and the FICYT
Regional Project (IB05‐001) is acknowl‐
edged. IL thanks the Ministerio de Cien‐
cia e Innovación of Spain for her FPI
grant and TVS thanks the Junta General
del Principado de Asturias for the award
of a Clarín postdoctoral contract funded
by PCTI 2006‐2009.
References [1] G. Marbán, T. Valdés‐Solís, Int. J. Hydrogen Energy 32 (2007) 1625.
[2] G. Marbán, T. Valdés‐Solís, Int. J. Hydrogen Energy 33 (2008) 927.
[3] I. López, T. Valdés‐Solís, G. Marbán, Int. J. Hydrogen Energy 33 (2008) 197.
[4] D. H. Kim, J. A. Cha, Cat. Lett. 86 (2003) 107.
[5] G. Sedmak, S. Hocevar, J. Levec, J. Catal. 213 (2003) 135.
[6] N. Y. Usachev, I. A. Gorevaya, E. P. Belanova, A. V. Kazakov, O. K. Atalyan, V. V. Kharlamov, Russ. Chem. Bull. 53 (2004) 538.

Marbán et al. Appl. Catal. A: Gen. 361 (2009) 160‐169 109
[7] Y. Tanaka, T. Utaka, R. Kikuchi, K. Sasaki, K. Eguchi, Appl. Catal. A: Gen. 238 (2003) 11.
[8] G. Marbán, A. B. Fuertes, Appl. Catal. B: Environ. 57 (2005) 43.
[9] Z. Liu, R. Zhou, X. Zheng, J. Mol. Catal. A‐Chem. 255 (2006) 103.
[10] Z. Liu, R. Zhou, X. Zheng, J. Mol. Catal. A‐Chem. 267 (2006) 137.
[11] P. K. Cheekatamarla, W. S. Epling, A. M. Lane, J. Power Sources 147 (2005) 178.
[12] Y. Z. Chen, B. J. Liaw, H. C. Chen, Int. J. Hydrog. Energy 31 (2006) 427.
[13] G. Avgouropoulos, T. Ioannides, Appl. Catal. B: Environ. 67 (2006) 1.
[14] G. Marbán, T. Valdés‐Solís, A. B. Fuertes, Cat. Lett. 118 (2007) 8.
[15] G. Marbán, A. B. Fuertes, T. Valdés‐Solís, Microp. Mesop. Mat. 112 (2008) 291.
[16] A. Martinez‐Arias, M. Fernandez‐Garcia, O. Galvez, J. M. Coronado, J. A. Ander‐son, J. C. Conesa, J. Soria, G. Munuera, J. Catal. 195 (2000) 207.
[17] A. Martinez‐Arias, A. B. Hungria, G. Munuera, D. Gamarra, Appl. Catal. B: Envi‐ron. 65 (2006) 207.
[18] D. Gamarra, A. Hornés, Zs. Koppany, Z. Schay, G. Munuera, J. Soria, A. Martínez‐Arias, J. Power Sources 169 (2007) 110.
[19] M. Manzoli, R. Di Monte, F. Boccuzzi, S. Coluccia, J. Kaspar, Appl. Catal. B: Environ. 61 (2005) 192.
[20] W. Liu, M. Flytzani‐Stephanopoulos, J. Catal. 153 (1995) 317.
[21] H. Darmstadt, C. Roy, S. Kaliaguine, Carbon 32 (1994) 1399.
[22] L. Q. Chu, X. N. Zou, W. Knoll, R. Forch, Surf. Coat. Technol. 202 (2008) 2047.
[23] M. P. Casaletto, L. Lisi, G. Mattogno, P. Patrono, G. Ruoppolo, Appl. Catal. A: Gen. 267 (2004) 157.
[24] D. G. Georgiev, R. J. Baird, G. Newaz, G. Auner, R. Witte, H. Herfurth, Appl. Surf. Sci. 236 (2004) 71.
[25] W. Wang, J. Zhang, H. Huang, Z. Wu, Z. Zhang, Appl. Surf. Sci. 253 (2007) 5393.
[26] B. Skarman, D. Grandjean, R. E. Benfield, A. Hinz, A. Andersson, L. R. Wallenberg, J. Catal. 211 (2002) 119.
[27] X. W. Yu, G. Q. Li, J. Alloy Compd. 364 (2004) 193.
[28] Q. Yang, P. X. Yan, J. B. Chang, J. J. Feng, G. H. Yue, Phys. Lett. A 361 (2007) 493.
[29] E. Cano, C. L. Torres, J. M. Bastidas, Mater. Corros. 52 (2001) 667.
[30] M. Wang, B. Gong, X. Yao, Y. Wang, R. N. Lamb, Thin Solid Films 515 (2006) 2055.

Artículo III 110
[31] M. Annaka, C. Yahiro, K. Nagase, A. Kikuchi, T. Okano, Polymer 48 (2007) 5713.
[32] J. Kiss, K. Revesz, F. Solymosi, Surf. Sci. 207 (1988) 36.
[33] L. M. Qiu, F. Liu, L. Z. Zhao, Y. Ma, J. N. Yao, Appl. Surf. Sci. 252 (2006) 4931.
[34] E. S. Bickford, S. Velu, C. S. Song, Catal. Today 99 (2005) 347.
[35] O. S. Alexeev, S. Krishnamoorthy, C. Jensen, M. S. Ziebarth, G. Yaluris, T. G. Ro‐berie, M. D. Amiridis, Catal. Today 127 (2007) 189.
[36] O. Pozdnyakova, D. Teschner, A. Wootsch, J. Krohnert, B. Steinhauer, H. Sauer, L. Toth, F. C. Jentoft, A. Knop‐Gericke, Z. Paal, R. Schlogl, J. Catal. 237 (2006) 1.
[37] C. Li, Y. Sakata, T. Arai, K. Domen, K. Maruya, T. Onishi, J. Chem. Soc. , Faraday Trans. 1 Phys. Chem. Condensed Phases 85 (1989) 929.
[38] Y. Denkwitz, A. Karpenko, V. Plzak, R. Leppelt, B. Schumacher, R. J. Behm, J. Ca‐tal. 246 (2007) 74.
[39] C. Zhang, J. Wyatt, D. H. Weinkauf, Polymer 45 (2004) 7665.
[40] J. Lichtenberger, M. D. Amiridis, Catal. Today 98 (2004) 447.
[41] C. Li, Y. Sakata, T. Arai, K. Domen, K. Maruya, T. Onishi, J. Chem. Soc. , Faraday Trans. 1 Phys. Chem. Condensed Phases 85 (1989) 1451.
[42] T. Shido, Y. Iwasawa, J. Catal. 136 (1992) 493.
[43] A. Fidalgo, L. M. Ilharco, J. Non‐Cryst. Solids 347 (2004) 128.
[44] F. Gu, Z. Wang, D. Han, C. Shi, G. Guo, Mater. Sci. Eng. , B 139 (2007) 62.
[45] A. Karpenko, R. Leppelt, J. Cai, V. Plzak, A. Chuvilin, U. Kaiser, R. J. Behm, J. Catal. 250 (2007) 139.
[46] K. G. Azzam, I. V. Babich, K. Seshan, L. Lefferts, J. Catal. 251 (2007) 153.
[47] A. Martinez‐Arias, A. B. Hungria, M. Fernandez‐Garcia, J. C. Conesa, G. Munuera, J. Power Sources 151 (2005) 32.
[48] G. Moretti, J. Electron. Spectrosc. Relat. Phenom. 95 (1998) 95.
[49] Y. Men, H. Gnaser, R. Zapf, V. Hessel, C. Ziegler, G. Kolb, Appl. Catal. A: Gen. 277 (2004) 83.

111
Artículo III. Información suplementaria
Silica Aquagel Confined Co‐
Precipitation technique (SACOP)
The silica source (sodium silicate, Al‐
drich, 27% SiO2+14% NaOH) and deion‐
ised water were poured under stirring
into a Teflon® autoclave. In a different
vessel the metallic nitrates (15mol% Cu
and 85mol% Ce) were dissolved in a 4 M
HNO3 (or HCl) solution and the resulting
mixture was added dropwise to the Tef‐
lon® autoclave containing the sodium
silicate suspension under stirring. The
amounts of each precursor were ad‐
justed in order to establish the following
molar compositions in the synthesis
suspension: SiO2/H+/H2O = 1/6.54/193.9
and Si/M = 4 (M = total moles of metals
in the final metallic oxides). The closed
autoclave was left under stirring for 24h
at RT (hydrolysis step), and then placed
in an oven at 100°C for 24h in order to
produce the gel (condensation step). Co‐
precipitation of the metallic cations con‐
fined in the water phase of the resulting
gel was carried out with powdered
NaOH. The slurry formed after the co‐
precipitation stage was subsequently
subjected to several water washing and
centrifugation steps, and finally it was
dispersed in acetone to replace the re‐
maining water, vacuum filtered and left
to dry at RT overnight. The resulting
silica‐metal hydroxide composites were
calcined in air at 550°C for 4h. Finally,
the silica matrix was removed by disso‐
lution in NaOH (2M) in an autoclave at
~30°C over a period of 1‐2 days.
Identification of peaks in the XPS
spectra
Figure SI‐1 shows some examples of the
deconvolution procedures performed
with the different XPS spectral regions.
In order to determine the surface com‐
position of the samples peak assign‐
ments were performed as indicated in
the figure.
C1s region. All XPS peaks were success‐
fully identified except those situated at
281‐283 eV (binding energies) in the C1s
region. These peaks are commonly as‐
signed to carbide species [1‐3], and in‐
deed were thus assigned by Men et al.
[4] in a work on methanol reforming
(SRM) by CuO/CeO2/γ‐Al2O3 catalysts.
However, in our work these peaks (one
or two) appeared in all the samples, at a
constant ratio of about 19% of surface
atoms. Some carbide species might have
been formed during the PROX reaction,
as Men et al. [4] suggested for SRM, but
there is no sound explanation for their

Artículo III‐ SI 112
presence in the fresh sample. Reassign‐
ing these peaks to adventitious carbon
(284.6) would cause an unacceptable
shift in the binding energies of the other
spectral regions of more than 2‐3 eV
with respect to the literature values. The
presence of these peaks might have
been originated by a charging effect [5],
though this explanation is too often
taken as valid without any experimental
support. In this situation we decided not
to consider these peaks, since their con‐
stant contribution to the surface com‐
position leaves the relative concentra‐
tions of the rest of species practically
unaffected. In this region the possible
overlapping of the Ce4s peak at ~290 eV should always be taken into account
(Figure SI‐1). Otherwise the carbon spe‐
cies might be overestimated, as might
already have occurred in certain revised
works [6, 7]. The adventitious carbon
peak (reference peak at 248.6 eV) is
often arbitrarily assumed to be pro‐
duced by secondary causes such as con‐
tamination from the oil pump (which
does not form a part of our equipment)
or by carbon deposits, either elemental
or hydrocarbons, that were originally
present on the samples. This is why not
everybody agrees on its use as a refer‐
ence [8]. We believe that when the ana‐
lytical conditions are identical, the varia‐
tions in peak areas between different
samples should be ascribed to real dif‐
ferences in the samples rather than dif‐
ferent degrees of contamination. Peaks
at 286.9‐287.3 eV (range of peak
maxima for all samples) are attributed
to C–O, C–OH and C–O–C bonds [9‐11],
whereas peaks at 288.3‐288.9 eV are
associated to C=O bonds of varying
strength [11‐13].
O1s region. The shoulder at ~526.5 eV (figure SI‐1) has a binding energy that is
too low to be assigned a priori to any
oxygen species. In the literature it has
been attributed to a variety of causes:
charging effect [14, 15]; a satellite of the
X ray source [16]; speculative "active"
oxygen atoms associated to ions in a
high oxidation state [17]; oxygen ions in
crystal lattices with a high electronic
density [18] or sub‐surface oxygen in
K2O multilayers [19]. The supporting
evidence for attributing this peak to
oxygen species is very weak, so we share
the most widely accepted view i.e. that
of the charging effect. The peak at
~529.5 eV is attributed to oxygen linked to copper or cerium [20‐23], whereas
the peak at 531.6 eV can be ascribed to
Si–O bonds [24, 25], C=O bonds (car‐
bonates, C=O or COOR) [9, 26] and
Ce–OH [21] or Cu–OH [27] bonds. C–O
bonds (C–OH, C–O–C) appear at some‐
what higher binding energies (around
533.5 eV [9]), so that they must be in‐
cluded in the wide peak at a high bind‐
ing energy (Figure SI‐1).

Marbán et al. Appl. Catal. A: Gen. 361 (2009) 160‐169 113
277 280 283 286 289 292 295B.E. (eV)
Inte
nsity
(a.u
.)C1sPROX-20h(HC)
Ce4s
Chargeeffect
C–O
C=O
C–CC–H
524 526 528 530 532 534 536B.E. (eV)
Inte
nsity
(a.u
.)
LC (O1s)LC (peaks)HC (O1s)HC (Peaks)
C–OC=OSiO2
Metaloxides
Charge effect
O1sPROX-1h
924 928 932 936 940 944 948B.E. (eV)
Inte
nsity
(a.u
.)
Cu2O
Satellites
Cu2p3/2PROX-1h(HC)
CuO
Unknown Cu species
Dispersed Cu2+
Figure SI‐1. Examples of XPS spectral regions analyzed to determine the position of the samples.
surface com‐
876 881 886 891 896 901 906 911 916 921B.E. (eV
Ce3PROX-1h
v0u1
v1
v 0
u'1v 1
Ce3d5/2 (u0, u1, v0, v1,v2) Ce3d3/2 (u'0, u'1 v'0, v'1,v'2)
u0
u´0
v2
v´2
( )
)
total
24
A14.0vA
100Ce⋅′
⋅=+Inte
nsity
(a.u
.)
%

Artículo III‐ SI 114
The O/C ratio can be estimated from the
XPS peaks placed at ~287 eV (C–O in C1s), 288‐289 eV (C=O in C1s) and
531.6 eV (O1s, after subtraction of the
SiO2 oxygen)
Ce3d region. Complete peak assign‐
ments in the Ce3d region are depicted in
Figure SI‐1 and can be found in a work
by Qiu et al. [28]. In our analysis the
most interesting peak is v’2, situated at
~917 eV, because it is completely iso‐
lated from the other peaks and there‐
fore the evaluation of its area is unam‐
biguous (Figure SI‐1). For pure CeO2
particles the value of this area amounts
to 14% of the total area of the Ce3d
region, whereas it is zero for pure
Ce2O3 [20, 29]. Thus, the percentage of
Ce4+ in a sample (with respect to total
cerium) can be estimated as indicated in
Figure SI‐1.
Cu2p3/2 region. This region displays
four main peaks and two satellites at
high binding energies (Figure SI‐1). The
peak at 932.4‐933.1 eV is assigned ei‐
ther to Cu+ species [30, 31] or to ele‐
mental copper [30]. According to some
authors [32, 33] these oxidation states
can be distinguished from each other by
the modified Auger parameter (sum of
binding and kinetic energies), whose
value is 1850.8 eV for Cu and 1848.3 eV
for Cu2O. For the CuCe‐1b catalyst, the
modified Auger parameter has values in
the 1848.1‐1848.8 eV range, so that the
peak at ~933 eV must be associated to
Cu+ species.
The peak at 933.6‐934.3 eV is attributed
to Cu2+ species [30, 34]. The small peak
situated at 936.0‐937.3 eV has no spe‐
cific assignment. It could be CuF2 [35],
but this species is absent in our cata‐
lysts. Furthermore the Cu(OH)2 or CuCO3
species present peaks at lower values of
B.E. (935 eV [36]). Since the proportion
of this peak is insignificant we have de‐
cided to leave it unassigned. Information
on the copper‐ceria interaction can also
be obtained via XPS. Thus the ratio of
the satellite peak areas to the main peak
areas is Is/Im = 0.55 for pure CuO,
whereas it is in the range of 0.35‐0.40
for solid solutions of Cu2+ in ceria [34]
(this is only applicable when the sample
is free of Cu(0) or Cu+ species, whose
presence also causes a diminution of
Is/Im [20]).
The peak at 930 eV is the cause of the
main interpretation difficulty. According
to the literature it could be produced
either by a charging effect [14], related
to the O1s peak at ~527 eV, or by the presence of Cu2+ species which are
highly dispersed on the ceria surface
[30]. In our spectra the peaks at 930 and
527 eV do not seem to show any clear
relation (peak area ratios [527 eV]/
[930 eV] = ~13, ~2 and ~10 for the fresh, PROX‐1h and PROX‐20h samples,
respectively). Nevertheless, assuming

Marbán et al. Appl. Catal. A: Gen. 361 (2009) 160‐169 115
that the charge effect gives rise to the
peak at 930 eV, then the values of the
Is/Im ratio would be 0.24 (for the fresh
sample), 0.34 (for the PROX samples at
HC) and 0.55 (for the PROX samples at
LC). The low Is/Im value for the fresh
sample, with respect to pure CuO, may
be due to its high Cu+ content (Table S‐1;
~30% of total copper) [20], but what could be the reason for the low Is/Im
ratio in the PROX samples (HC)? This
might be due to the fact that some of
the copper forms a solid solution with
ceria, but this would also provoke a
diminution of FWHM [34] (which is
3.6 eV for the PROX samples, the same
as that reported for pure CuO [34]). In
addition, considering that the
Cu/(Cu+Ce) atom ratio in the fresh sam‐
ple is higher when evaluated by XPS
(~0.20; Table 2 in the paper, Table S‐1) than by EDX (0.09; Table 1 in the paper)
it must be concluded that copper oxide
is concentrated on the catalyst surface,
which is normally the case for catalysts
with Cu/(Ce+Cu) ratios below 0.25 [37].
Finally, the presence of surface Ce4+‐O2‐‐
Cu2+ pairs from the highly dispersed Cu2+
ions would lead to a similar decrease in
the Is/Im value. It was decided therefore
that the peak at 930 eV should be at‐
tributed to highly dispersed Cu2+ ions
and not to any charging effect.

Artículo III‐ SI 116
Table S‐1. XPS surface composition of samples (atom %).
Sample
Species
* %Ce4+ in total cerium
Identification of peaks in the FTIR spec‐
tra
An example of the deconvolution proce‐
dure performed with the different FTIR
peaks is given in Figure 5. The evolution
of the peaks from the Fresh sample to
the samples subjected to PROX (1h and
20h) is given in Figure S‐2. Major peaks
are attributed to carbonates (monoden‐
tate and bidentate) as well as to car‐
boxylates as indicated in Table S‐2. Mi‐
nor peaks in the ~2800‐2950 cm‐1 range
(B.E., eV) Fresh
PROX 1h (HC)
PROX 1h (LC)
PROX 20h (HC)
CARBON (C1s)
Adventitious Carbon 30.43 30.97 29.32 36.40
Non adventitious carbon
C‐O 1.43 1.38 0.26 2.50
C=O 0.72 0.69 0.13 1.30
OXYGEN (total) 46.54 48.82 50.68 43.59
Oxygen to metals atom ratio, (O1s, 529.5 eV) O/[Ce+Cu]
1.9 2.5 3.0 2.0
Oxygen to non‐adventitious carbon atom ratio, (O1s, 531.6 ‐ 2×SiTotal) O/Cna
2.9 3.7 2.9 2.9
SILICON (total) (Si2s) 10.90 8.50 9.16 10.03
COPPER (total) (Cu2p3/2) 2.28 1.79 2.19 1.45
Cu+ 0.56 0.09 0.00 0.05
Dispersed Cu2+ 0.36 0.49 0.50 0.16
CuO clusters 1.36 1.19 1.65 1.21
Cu compound? 0.00 0.02 0.05 0.04
Is/Im 0.20 0.25 0.42 0.30
CERIUM (total)(Ce3d) 7.71 7.85 8.26 4.74
Ce4+ 6.24 (81.0%)*
6.32 (80.4%)*
7.90 (95.7%)*
3.33 (70.3%)*
Copper to metals atom ra‐tio, Cu/[Ce+Cu]
0.23 0.19 0.21 0.23
TOTAL (C+O+Si+Cu+Ce) 100 100 100 100

Marbán et al. Appl. Catal. A: Gen. 361 (2009) 160‐169 117
are attributed to bridged and bidentate
formates. As the values of the peaks of
this work are related to the individual
peaks that form the curve there are
small discrepancies between the values
of the apparent maximum (that is the
peak usually employed for identifica‐
tion) and the deconvolved peak.
0
2
4
6
8
10
12
14
16
18
20
Con
volv
ed a
rea
(n.u
.)
848
849 85
01302
1301 13
08
1369
1369
1514
1511
1509
1588
1588
1588
Major peaks
1452
1370
1453 14
690.0
0.2
0.4
0.6
Fresh PROX-1h PROX-20h
Sample
Con
volv
ed a
rea
(n.u
.)
1409
1421
1415
1263
1628
2854
1608
1660
2962
Minor peaks
1384
1384
1627
1263
1263
1384
1660
1649
2853
2853
2925
2925
2925
2961
2960
Figure SI‐2. Evolution of the peak area from FTIR of samples Fresh, PROX‐1h (HC) and PROX‐20h. The numbers in the figure indicate the position of the maximum of each peak.

Artículo III‐ SI 118
Table S‐2. FTIR peak assignment (placed in cells in descending order of intensity).
Major peaks
(cm‐1)
Minor peaks
(cm‐1) Potential assignment Peaks and ref.
Monodentate carbonate 1517 [38] ~1510 ‐ Carboxylate 1514 [7]* 1510 [39]
Bidentate carbonate 1586 [40]* ~1625 1588
~1660 Carboxylate 1598 [38]
Bidentate carbonate 1297 [40]* ~1305 ‐
Carboxylate 1316 [7]* [39]
1450 ‐ Monodentate carbonate 1464 [7]*
~1415 1370 Monodentate carbonate 1367 [38], 1358 [7]*
~1384 850 Bidentate carbonate 854 [40]*, 850 [41]*
1263 ‐ C‐O‐C vibration 1263 [42], 1260 [43]
Formate 2920[44]*
(C‐H vibration) ‐ 2925
Bidentate formate 2936 [7]*
Bridged formate 2933 [41]*
Formate 2960 [44]*
~2960 (C‐H vibration) ‐
Bridged formate 2950 [7]*
Formate 2850 [44]*, 2848
[45]*, 2856 [46]* (C‐H vibration)
Bidentate formate 2848[7]*, ‐ 2853
2845 [41]*
Bridged formate 2844[7]*
*Studies over cerium oxide
References
[1] I. Dontas, S. Kennou, Diamond Relat. Mater. 10 (2001) 13.
[2] A. C. Anacleto, N. Blasco, A. Pinchart, Y. Marot, C. Lachaud, Surf. Coat. Technol. 201 (2007) 9120.
[3] M. Xiang, D. Li, H. Qi, W. Li, B. Zhong, Y. Sun, Fuel 86 (2007) 1298.

Marbán et al. Appl. Catal. A: Gen. 361 (2009) 160‐169 119
[4] Y. Men, H. Gnaser, R. Zapf, V. Hessel, C. Ziegler, G. Kolb, Appl. Catal. A: Gen. 277 (2004) 83.
[5] M. M. Titirici, A. Thomas, S. H. Yu, J. O. Muller, M. Antonietti, Chem. Mater. 19 (2007) 4205.
[6] S. Patel, K. K. Pant, J. Power Sources 159 (2006) 139.
[7] O. Pozdnyakova, D. Teschner, A. Wootsch, J. Krohnert, B. Steinhauer, H. Sauer, L. Toth, F. C. Jentoft, A. Knop‐Gericke, Z. Paal, R. Schlogl, J. Catal. 237 (2006) 1.
[8] P. Swift, Surf. Interface Anal. 4 (1982) 47.
[9] H. Darmstadt, C. Roy, S. Kaliaguine, Carbon 32 (1994) 1399.
[10] L. Q. Chu, X. N. Zou, W. Knoll, R. Forch, Surf. Coat. Technol. 202 (2008) 2047.
[11] M. P. Casaletto, L. Lisi, G. Mattogno, P. Patrono, G. Ruoppolo, Appl. Catal. A: Gen. 267 (2004) 157.
[12] D. G. Georgiev, R. J. Baird, G. Newaz, G. Auner, R. Witte, H. Herfurth, Appl. Surf. Sci. 236 (2004) 71.
[13] W. Wang, J. Zhang, H. Huang, Z. Wu, Z. Zhang, Appl. Surf. Sci. 253 (2007) 5393.
[14] C. Lamonier, A. Bennani, A. DHuysser, A. Aboukais, G. Wrobel, J. Chem. Soc. , Faraday Trans. 92 (1996) 131.
[15] M. Yousuf, A. Mollah, T. R. Hess, Y. N. Tsai, D. L. Cocke, Cem. Concr. Res. 23 (1993) 773.
[16] B. E. Koel, G. Praline, H.‐I. Lee, J. M. White, R. L. Hance, J. Electron. Spectrosc. Relat. Phenom. 21 (1980) 31.
[17] F. Solymosi, J. Rasko, E. Papp, A. Oszko, T. Bansagi, Appl. Catal. A: Gen. 131 (1995) 55.
[18] J. M. Sohn, M. R. Kim, S. I. Woo, Catal. Today 83 (2003) 289.
[19] B. Lamontagne, F. Semond, D. Roy, J. Electron. Spectrosc. Relat. Phenom. 73 (1995) 81.
[20] B. Skarman, D. Grandjean, R. E. Benfield, A. Hinz, A. Andersson, L. R. Wallenberg, J. Catal. 211 (2002) 119.
[21] X. W. Yu, G. Q. Li, J. Alloy Compd. 364 (2004) 193.
[22] Q. Yang, P. X. Yan, J. B. Chang, J. J. Feng, G. H. Yue, Phys. Lett. A 361 (2007) 493.
[23] E. Cano, C. L. Torres, J. M. Bastidas, Mater. Corros. 52 (2001) 667.
[24] M. Wang, B. Gong, X. Yao, Y. Wang, R. N. Lamb, Thin Solid Films 515 (2006) 2055.
[25] M. Annaka, C. Yahiro, K. Nagase, A. Kikuchi, T. Okano, Polymer 48 (2007) 5713.

Artículo III‐ SI 120
[26] J. Kiss, K. Revesz, F. Solymosi, Surf. Sci. 207 (1988) 36.
[27] I. Louis‐Rose, C. Methivier, J. C. Vedrine, C. M. Pradier, Appl. Catal. B: Environ. 62 (2006) 1.
[28] L. M. Qiu, F. Liu, L. Z. Zhao, Y. Ma, J. N. Yao, Appl. Surf. Sci. 252 (2006) 4931.
[29] J. Z. Shyu, K. Otto, W. L. H. Watkins, G. W. Graham, R. K. Belitz, H. S. Gandhi, J. Catal. 114 (1988) 23.
[30] W. Liu, M. Flytzani‐Stephanopoulos, J. Catal. 153 (1995) 317.
[31] Y. Z. Chen, B. J. Liaw, C. W. Huang, Appl. Catal. A: Gen. 302 (2006) 168.
[32] X. M. Liu, G. Q. Lu, Z. F. Yan, Appl. Catal. A: Gen. 279 (2005) 241.
[33] W. L. Dai, Q. Sun, J. F. Deng, D. Wu, Y. H. Sun, Appl. Surf. Sci. 177 (2001) 172.
[34] E. S. Bickford, S. Velu, C. S. Song, Catal. Today 99 (2005) 347.
[35] C.D.Wagner, W.M.Riggs, L.E.Davis, J.F.Moulder, G.E.Muilenberg, Handbook of X‐Ray Photoelectron Spectroscopy. Perkin Elmer Coorporation, Eden Prairie, Minn., 1979.
[36] B. Li, J. H. Qu, H. J. Liu, C. Z. Hu, Chemosphere 68 (2007) 2153.
[37] D. Gamarra, A. Hornés, Zs. Koppany, Z. Schay, G. Munuera, J. Soria, A. Martínez‐Arias, J. Power Sources 169 (2007) 110.
[38] O. S. Alexeev, S. Krishnamoorthy, C. Jensen, M. S. Ziebarth, G. Yaluris, T. G. Roberie, M. D. Amiridis, Catal. Today 127 (2007) 189.
[39] C. Li, Y. Sakata, T. Arai, K. Domen, K. Maruya, T. Onishi, J. Chem. Soc. , Faraday Trans. 1 Phys. Chem. Condensed Phases 85 (1989) 929.
[40] A. Martinez‐Arias, A. B. Hungria, G. Munuera, D. Gamarra, Appl. Catal. B: Envi‐ron. 65 (2006) 207.
[41] Y. Denkwitz, A. Karpenko, V. Plzak, R. Leppelt, B. Schumacher, R. J. Behm, J. Catal. 246 (2007) 74.
[42] J. Lichtenberger, M. D. Amiridis, Catal. Today 98 (2004) 447.
[43] C. Zhang, J. Wyatt, D. H. Weinkauf, Polymer 45 (2004) 7665.
[44] S. F. Maria, L. M. Russell, B. J. Turpin, R. J. Porcja, Atmos. Environ. 36 (2002) 5185.
[45] T. Tabakova, F. B. Boccuzzi, M. Manzoli, D. Andreeva, Appl. Catal. A: Gen. 252 (2003) 385.
[46] K. G. Azzam, I. V. Babich, K. Seshan, L. Lefferts, J. Catal. 251 (2007) 153.

121
Resumen artículo IV.
COPPER MANGANITE AS A CATALYSTS FOR THE PROX REACTION.
DEACTIVATION STUDIES
Manganita de cobre como catalizador para la reacción PROX.
Estudios de desactivación
Como se ha mencionado con anterioridad, la estabilidad de un catalizador con el tiempo
de reacción es un parámetro de gran importancia a la hora de su aplicación práctica. En
este trabajo nos planteamos el análisis de las causas de la desactivación de la manganita
de cobre, CuMn2O4, sintetizada por el método de co‐precipitación confinada en
hidrogeles de sílice, en la reacción de oxidación preferencial de CO. Para tal fin, además
de los experimentos de reacción PROX de larga duración, se llevaron a cabo ensayos de
respuesta a escalón (CO/He, CO+H2/He, CO2+H2/He) para determinar el efecto
desactivante de los distintos gases implicados en la reacción PROX, de la misma manera
en la que se procedió con el catalizador CuOx/CeO2.
En condiciones de alta concentración la espinela de cobre y manganeso mostró una
mayor actividad en la reacción PROX que el catalizador CuOx/CeO2. Para CuMn2O4 todos
los tratamientos de respuesta a escalón dieron lugar a una desactivación superior a la
que se produjo en condiciones PROX, al contrario de lo que ocurría con el catalizador
CuOx/CeO2. La secuencia de gases de mayor a menor poder desactivante resultó ser:
CO/He > CO+H2/He > CO2+H2/He > PROX. Los balances de materia llevados a cabo con
los datos de los experimentos de respuesta a escalón mostraron la formación de
especies carbonosas en la superficie del catalizador, formación que se vio favorecida por
la presencia de oxígeno en la mezcla de gases. Sin embargo, la influencia de estas
especies carbonosas en la actividad de la manganita de cobre no fue significativa.
Los resultados de FTIR mostraron que durante la reacción PROX a 175°C se producía la
evolución de los carbonatos desde formas menos estables a más estables. El análisis
conjunto con los balances de CO2 indicó que, además de esta evolución, se formó una
fracción significativa de nuevos carbonatos. La formación de carbonatos monodentados
fue corroborada por los resultados de XPS, la relación O/C se incrementó de valores ∼1 (valor esperado para los carbonatos bidentados) a ∼2.5 (valores esperados para carbonatos monodentados). Aunque estos carbonatos no afectaron a la desactivación, sí
influyeron en la concentración relativa de los distintos estados de oxidación del

Artículo IV 122
manganeso. Por otro lado, los análisis XPS descartaron la presencia de carbonatos de
cobre.
Combinando todos los resultados obtenidos, se observó que al comienzo de la reacción
el manganeso se reducía en una mayor proporción que el cobre, si bien el manganeso se
reoxidaba parcialmente a lo largo de la reacción. La reducción inicial no podía estar
provocada por la corriente gaseosa, ya que el cobre, siendo más susceptible de ser
reducido que el manganeso, se reducía en menor grado. Este resultado sugirió que la
reducción inicial del manganeso estaba relacionada con la presencia de carbonatos
bidentados y de tipo puente en la muestra fresca. Estos carbonatos casi desaparecieron
después de 1 h de reacción en las condiciones de reacción PROX, un proceso que
sucedió paralelamente a la reducción del manganeso. Por esta razón se propuso un
mecanismo para la descomposición reductiva de los carbonatos tipo puente y
bidentados de manganeso que explicaría la disminución de los carbonatos y la evolución
de los estados de oxidación del manganeso.
Por otro lado, considerando las concentraciones relativas de Mn2+, Mn3+ y Mn4+,
Cu+/Cu2+ después de 20 h de reacción PROX, la desactivación de la espinela de cobre y
manganeso podría ser atribuida a la progresiva reducción del cobre en la superficie del
catalizador por la acción del CO, como ya sugirieron otros autores con anterioridad.

123
Artículo IV.
1. Introduction
Hydrogen streams for fuelling PEM fuel
cells need to be almost totally CO‐free in
order to avoid platinum poisoning. For
this reason purification processes, such
as preferential CO oxidation, need to be
included in the H2 production process in
order to achieve CO concentrations be‐
low 20 ppm. Copper‐based catalysts
have shown good catalytic activity and
selectivity for CO oxidation in rich hy‐
drogen streams (PROX reaction) [1, 2].
Recent works on the PROX reaction with
copper‐based catalysts show that the
use of nanosized catalysts improves the
activity and selectivity of the reaction [1,
3, 4]. CuMn2O4, technically known as
hopcalite, is a well known oxidation
catalyst [5‐7] which is employed to re‐
move air pollutants such as carbon
monoxide and nitrous oxide from ex‐
haust gas. In CO oxidation, its high activ‐
ity is usually attributed to the resonance
system Cu2+Mn3+/Cu+Mn4+ and the high

Artículo IV 124
adsorption of CO on Cu2+/Mn4+ and of O2
on Cu+/Mn3+ [8, 9]. Recently, CuMn2O4
has been applied in the catalytic steam
reforming of methanol [10, 11] and pre‐
ferential oxidation processes [12], with
moderate activity and high selectivity at
temperatures over 100°C. Recently de‐
veloped template methods for synthe‐
sising high surface area nanocatalysts
have been used to promote a significant
increase in their catalytic activity com‐
pared to that of their low surface area
counterparts. In this area of research,
we have demonstrated that the silica
aquagel confined co‐precipitation
method (SACOP) is a useful tool for syn‐
thesizing high surface‐area CuMn2O4
nanocatalysts providing improved cata‐
lytic activity for the methanol steam
reforming process [13].
In this work we analyse the activity and
stability of nanosized CuMn2O4 synthe‐
sised by SACOP for the PROX reaction.
The stability of the catalyst is a parame‐
ter that is often disregarded in PROX
studies [1], and yet it is of paramount
importance for long‐term on‐board ap‐
plications. We have also conducted sur‐
face studies to unravel the causes of the
slow deactivation appreciated in the
catalytic tests performed.
2. Experimental
2.1. Catalysts synthesis
CuMn2O4 nanocatalysts were synthe‐
sised following the SACOP procedure
[14]. Basically, Cu(NO3)2∙3 H2O and
Mn(NO3)2∙6 H2O at a 1:2 molar ratio
were dissolved in HNO3. This solution
was added dropwise to a mixture of
sodium silicate and water at a final con‐
centration of SiO2:H+:H2O= 1: 6.54: 193.9
and Si/(Cu+Mn)=4. After hydrolysis (24 h
at room temperature) and condensation
(24 h at 100°C) a silica aquagel contain‐
ing widely dispersed metallic cations
was formed. To prevent the cations
from leaching during washing, precipita‐
tion inside the gel was performed using
powdered NaOH. The slurry was repeat‐
edly washed and dispersed in acetone,
then filtered, dried at RT and calcined at
550°C (5°C/min, 4h). As calcination takes
place inside the pores of the silica matrix
(confined process) growth of the nano‐
materials is restricted and consequently
high values of surface area can be
achieved [10]. The silica matrix was fi‐
nally removed by NaOH dissolution (2M)
at ~30°C over a period of two days.
For comparison reasons, CuO/CeO2 cata‐
lysts were synthesized following the
same procedure. A detailed description
of the characteristics and the behaviour
of these catalysts under PROX reaction
can be found elsewhere [4].

Valdés‐Solís et al. Int. J. Hydrog. Energy 35 (2010) 1879‐1887 125
2.2. Catalysts Characterization
The composition of the catalyst was
evaluated by SEM‐EDX analysis (DSM
942, Zeiss). XRD was performed in a
Siemens D5000 diffractometer to obtain
the phase composition. The crystal size
of the catalysts was determined by ap‐
plying Scherrer’s equation. The BET sur‐
face area was evaluated by N2 phy‐
sisorption at ‐196°C in an ASAP 2010
analyser (Micromeritics).
Ex‐situ X‐ray photoelectron spectros‐
copy (XPS) was carried out by means of
a Specs spectrometer, using Mg‐Kα (1253.6 eV) radiation emitted from a
double anode at 50 W. The binding en‐
ergies of the spectra obtained were cor‐
rected using the binding energy of ad‐
ventitious carbon (284.6 eV) in the C1s
region. The backgrounds were sub‐
tracted by means of Shirley baselines,
except for the Cu2p3/2 region (linear
baseline). All the analyzed regions were
deconvolved by mixed Gaussian‐
Lorentzian functions (90:10). For the
quantitative analyses the atomic sensi‐
tivity factors stored in the CasaXPS da‐
tabase (v2.3.12Dev6) were used.
Ex‐situ FTIR spectra of the materials
compressed in discs with KBr were re‐
corded on a Nicolet Magna IR‐560 spec‐
trometer fitted with a DTGS KBr absorb‐
ance detector. The analyzed regions
were deconvolved by mixed Gaussian‐
Lorentzian functions (90:10).
2.3. Catalytic activity tests and step‐
response experiments
Catalytic activity tests were performed
during the PROX reaction by using a
quartz reactor of 7 mm internal diame‐
ter inserted inside a vertical furnace.
The catalyst sample (15‐30 mg) was
diluted in inert SiC particles (285‐
270 mg) and placed in the reactor be‐
tween two zones of glass wool, thus
ensuring isothermal and plug‐flow con‐
ditions. Any water present in the exit
gases was removed with Mg(ClO4)2.
Analyses of H2, CO, CO2, O2 and N2 in the
product gases were then carried out
using a gas chromatograph (HP 6890)
equipped with a TC detector.
Two different sets of reaction conditions
were applied: (a) "LC" conditions (low
concentration): 300 ppm CO + 300 ppm
O2 + 1% H2 in He (total flow rate=
300 mL/min, STP) and (b) "HC" condi‐
tions (high concentration: 0.5 vol% CO +
0.5 vol% O2 + 25% H2 in He (total flow
rate=200 mL/min, STP). In both cases
the values of the spatial velocities were
very high (LC: 0.4×10‐5molCO∙gcat‐1∙s‐1,
HC: 2.3×10‐5 molCO∙gcat‐1∙s‐1). Before the
reactions each sample was pre‐treated
in a helium flow at 200°C for 1 h. Long
duration isothermal experiments were
performed for all samples, but in specific
cases non‐isothermal experiments at
decreasing temperatures and pseudo‐

Artículo IV 126
steady state conditions (~1‐2 h per tem‐
perature point) were also carried out.
The conversion of CO was evaluated as:
[ ][ ]in
outCO CO
CO1X −= (R1)
where in and out refer to the inlet and
outlet gaseous stream respectively. The
selectivity towards CO oxidation was
estimated as:
[ ] [ ]( )[ ] [ ]out2in2
outin
OO
COCO5.0S
−−⋅
= (R2)
The reaction rate was calculated by
means of the Langmuir‐Hinselwood
mechanism proposed by Liu and Flyt‐
zani‐Stepahopoulus [15] for CO oxida‐
tion over a copper‐ceria catalyst, as de‐
scribed elsewhere [1].
Additionally, step ‐response experi‐
ments (LC conditions) were performed
in the quartz reactor using different gas
mixtures (300 ppm CO/He, 300 ppm CO+
1% H2/He and 300 ppm CO2+ 1% H2/He)
in order to assess the deactivating po‐
tential of the gases involved in the PROX
reaction over the diluted catalysts.
XPS and FTIR analyses were carried out
on the catalyst samples which were la‐
belled as: (1) "Fresh": the fresh sample
(as synthesised catalyst), (2) “Pre‐
treated”: the catalyst subjected to He
pre‐treatment at 200°C (3) "PROX‐1h":
the catalyst subjected to He pre‐
treatment at 200°C followed by the
PROX reaction at 175°C for 1h (HC con‐
ditions) and (4) "PROX‐20h": the sample
pre‐treated and subjected to the PROX
reaction at 175°C for 20h (HC). To avoid
external influences between the prepa‐
ration of each sample and its analysis,
the catalysts were cooled down after
the reaction in a helium flow and quickly
retrieved from the glass wool. All the
samples were stored in a vacuum vessel
until the XPS and FTIR analyses were
performed. Ex‐situ techniques permit to
determine the presence of stable spe‐
cies formed on the surface of the cata‐
lysts that are the cause of deactivation,
although no information for intermedi‐
ate reaction species is given. Ex‐situ
techniques for the study of deactivation
have been successfully employed in a
previous work [4].
3. Results and discussion
As mentioned in previous papers [13,
14], the SACOP technique is a simple
procedure that employs low‐cost pre‐
cursors for obtaining metal oxides with a
high specific surface area. Under the
synthesis conditions reported above,
CuMn2O4 is the predominant phase as
observed by XRD [13]. A crystallite size
(dXRD) of 4 nm was obtained by applying
Scherrer’s equation. The N2 isotherm
gives a surface area value of
SBET=296 m2/g. The EDX of this sample
shows that the silica content is negligi‐
ble. TEM images of the CuMn2O4 nano‐

Valdés‐Solís et al. Int. J. Hydrog. Energy 35 (2010) 1879‐1887 127
materials can be found elsewhere [13].
These images show that the manganites
exhibit a peculiar structure made up of
thin sheets (of thickness <3nm), some of
which are rolled up. The catalytic activity
of CuMn2O4 in conditions of high con‐
centration (HC) and decreasing tem‐
peratures is plotted in Fig. 1, and com‐
pared to the activity of CuO/CeO2 which
was also synthesised by SACOP. It can be
observed that CuMn2O4 is more active
than CuO/CeO2 throughout the whole
temperature range. However, these
catalysts suffer from a slow but clearly
visible deactivation. In Fig. 2 the results
of the long term PROX experiments at
175°C and high concentration conditions
are plotted for both the CuMn2O4 and
CuO/CeO2 catalysts. The deactivation of
CuO/CeO2 catalysts in the PROX reaction
has been thoroughly analysed elsewhere
[4] and, at low temperature (175°C), is
mainly caused by the formation of car‐
bonates on the surface of the catalysts.
0.0
0.2
0.4
0.6
0.8
1.0
50 100 150 200 250
T, ºC
XCO
0
0.2
0.4
0.6
0.8
1
S
CuOx/CeO2
CuMn2O4
T (°C)
Fig. 1. Values of CO conversion (circles) and selectivity (squares) under HC conditions and decreasing temperatures for CuOx/CeO2 (empty symbols) and CuMn2O4 (solid sym‐bols) synthesised by SACOP.
Step‐response experiments were carried
out over the CuMn2O4 catalysts at
175°C in order to obtain more detailed
information about the deactivation
mechanism. As indicated in the experi‐
mental section, after a pre‐treatment

Artículo IV 128
and the first PROX step (low concentra‐
tion: 300 ppm CO+ 300 ppm O2 + 1% H2)
for 1 h (stage 1) the catalysts were sub‐
jected to different gas streams for a
~18 h period (stage 2). Finally a standard PROX stream (LC) was passed through
the catalysts to evaluate the activity of
the catalysts after stage 2. The results of
these experiments are plotted in Fig. 3.
It is immediately clear that all the treat‐
ments employed in stage 2 are more
deactivating than the PROX conditions,
deactivation following the sequence:
CO > CO+H2 > CO2+H2 > PROX.
0.0
0.2
0.4
0.6
0.8
1.0
0 10 20 30 4
TOS (h)
X CO
CuOx/CeO2
CuMn2O4
0
Fig. 2. Long‐term catalytic activity at 175°C of CuOx/CeO2 (triangles) and CuMn2O4 (cir‐cles) catalysts at high concentration (HC) conditions.
In the absence of oxygen, the presence
of CO has a negative effect on the activ‐
ity of the catalysts. Although no oxygen
was originally added to the gas streams
we detected small leakage of oxygen
entering through the junctions of the
reactor. It is this oxygen that is partly
responsible for the formation of CO2
during stage 2. Thus, the formation of
CO2 may proceed via any one of the
following reactions:
CO + ½ O2 → CO2 (R3)
CO + Mox‐O → CO2 + Mred (R4)
2 CO → C + CO2 (R5)
where Mox and Mred are oxidised and
reduced forms of the metals present on
the catalyst surface.

Valdés‐Solís et al. Int. J. Hydrog. Energy 35 (2010) 1879‐1887 129
0.0
0.2
0.4
0.6
0.8
1.0
0 5 10 15 20 25
TOS (h)
XCO
PROX
COCO + H2
CO2 + H2
1
3
2
Fig. 3. Step response experiments with CuMn2O4 nanocatalysts at 175°C [stage 1: PROX; stage 2: CO (squares), CO+H2 (triangles), CO2+H2 (stars); stage 3: PROX].
Table 1 contains the mass balances to
CO and CO2 for all the step‐response
experiments. For the experiments per‐
formed in the absence of CO2, the vari‐
able “CO2 to balance” represents the
imbalance of CO2 due to the fact that all
the CO consumed was used to produce
CO2 in accordance with reactions (R3)
and (R4). This imbalance is indicative of
the formation of carbonaceous species
(either elemental carbon, R5, or carbon‐
ates) on the surface of the catalyst. The
“CO2 to balance” observed during the
PROX process is at least 10 times higher
than that of the step‐response experi‐
ments. This indicates that the formation
of surface carbonaceous species is fa‐
voured when oxygen is present in the
reaction stream, as in the case of the
CuOx/CeO2 catalysts [4]. The main dif‐
ference between the CuOx/CeO2 and
CuMn2O4 nanocatalysts seems to be
related to the deactivation caused by
the formation of carbonaceous species
on the surface. As stated before, the
presence of carbonates in CuOx/CeO2

Artículo IV 130
leads to a significant deactivation [4]
whereas for CuMn2O4 the formation of
carbonaceous species produces hardly
any deactivation. Thus, there is no doubt
that during PROX the formation of car‐
bonaceous species is promoted (Table 1)
but deactivation occurs to a lesser ex‐
tent than in the case of the other treat‐
ments (Fig. 3). In short, the results in
Table 1 and Fig. 3 lead to the conclusion
that the deactivation of the CuMn2O4
nanocatalysts is due to the effect of CO,
but not through the formation of carbo‐
naceous species. In addition, the pres‐
ence of hydrogen in stage 2 does not
seem to increase deactivation. On the
contrary it has a beneficial effect on
catalytic activity (Fig. 3). From Table 1, it
can be seen that, when H2 is introduced
together with CO, a smaller amount of
CO2 is formed than when only CO is in‐
troduced. It must therefore be assumed
that hydrogen competes with CO for
adsorption on the active centers prone
to be deactivated by CO (possibly via
reaction R4). Indeed it is well known
that the reduction ability of CO is
greater than that of H2 at moderate
temperatures [16].
Table 1. Mass balance of CO and CO2 during the step response experiments (PROX, LC Conditions: 300 ppm CO, 300 ppm O2, 1% H2).
Stage 2 CO inlet (mol)
CO outlet (mol)
CO con‐sumed (mol)
CO2 inlet (mol)
CO2 outlet (mol)
CO2 to balance (mol)
PROX (LC) 9.41×10‐3 1.32×10‐3 8.09×10‐3 0 7.35×10‐3 7.4×10‐4*
300 ppm CO 4.07×10‐3 3.58×10‐3 4.82×10‐4 0 4.13×10‐4 6.9×10‐5*
300 ppm CO +
1% H2
3.73×10‐3 3.40×10‐3 3.28×10‐4 0 3.15×10‐4 1.3×10‐5*
300 ppm CO2
+ 1% H2
0 0 0 4.93×10‐3 4.88×10‐3 5.0×10‐5
* Assuming that all the CO consumed forms CO2 in accordance with reaction R3
Fig. 4 shows the FTIR spectra of the
CuMn2O4 nanocatalysts after the suc‐
cessive treatments described in the
experimental section. Here it can be
seen that there is a broad band in the
2800‐3600 cm‐1 range whose area de‐
creases during the pretreatment and
subsequent PROX reaction. This band
can be attributed to non‐stable hydrox‐
yls (usually around 3600‐3700 cm‐1 with
associated bands in 3000‐3800 cm‐1)
[17]. The peaks in the 400‐550 cm‐1
range are attributed to MnO6 octahe‐
dral units and those at ~600 cm‐1 to
CuO4 units [18]. None of the peaks can
be attributed to carbonyls (2000‐
2100 cm‐1).

Valdés‐Solís et al. Int. J. Hydrog. Energy 35 (2010) 1879‐1887 131
400 800 1200 1600 2000 2400 2800 3200 3600 4000
Wavenumber (cm-1)
I (a.
u.)
Fresh
Pre-treated
PROX-1h
PROX-20h
Fresh
1100 1200 1300 1400 1500 1600 1700 1800
PROX-20h
PROX-1h
FreshPre-treated
Fig. 4. FTIR spectra of CuMn2O4 fresh, pretreated under Helium, after 1h PROX and after 20 h PROX.
The main differences between the dif‐
ferent spectra appear in the 1200‐
1800 cm‐1 region, which is amplified in
the inset of Fig. 4. As the FTIR measure‐
ments were conducted under identical
conditions, for an equal period of time,
and on tablets with the same mass of
catalyst, we may apply a semi‐
quantitative analysis of the peaks in this
spectral zone, by a deconvolution pro‐
cedure of the type usually employed
with XPS and FTIR [4]. The relative varia‐
tions of the FTIR peaks in the 1200‐
1800 cm‐1 range are plotted in Fig. 5. The
peaks located at around 1340‐1363,
1418‐1421 and 1484‐1488 cm‐1 increase
continuously during the reaction and are
to be attributed to monodentate car‐
bonates [17, 19, 20]. The small peak at
~1384 cm‐1 can be assigned to bridged
carbonates [17, 19], whereas the peaks
located at 1550‐1565 and 1632‐
1639 cm‐1 which decrease during the
reaction are usually attributed to biden‐
tate carbonates [17‐22]. This assignment
seems to be the most plausible one
since the thermal stability of carbonates
shows the following order: bridged car‐
bonates < bidentate carbonates <
monodentate carbonates [19], the latter
being stable at the working temperature
used in these experiments [23, 24]. Ad‐

Artículo IV 132
ditionally, the different gaseous compo‐
sitions may also modify the stability of
the surface compound [25, 26].
1340-1363 1384 1418-1421 1484-1488 1550-1565 1632-1639
Main peaks position, cm-1
Pea
k ar
ea, r
elat
ive
units
FreshPre-treatedPROX-1hPROX-20h
Fig. 5. Relative intensity evolution of the deconvolved FTIR peaks.
These assignments suggest that at the
beginning of the reaction bidentate and
bridge carbonates disappear (at least
partially) while at the same time other
species are formed as the reaction pro‐
gresses (especially those located at
~1350 cm‐1) either as a result of the CO
in the gaseous stream or as a result of
the evolution of bridge or bidentate
carbonates into new species. As can be
observed in Table 1 there is a high
amount of carbonaceous species that
are formed (“CO2 to balance”) on the
catalyst surface during the PROX reac‐
tion at 175°C. This seems to indicate
that at least a fraction of the carbonates
formed are due to the effect of the
gaseous stream on the surface and not
to the conversion of the less stable car‐
bonate species to more stable ones.

Valdés‐Solís et al. Int. J. Hydrog. Energy 35 (2010) 1879‐1887 133
Table 2. XPS surface composition (PROX experiments performed under HC conditions). Fresh Pre‐treated PROX 1h PROX 20h C1s % a % a % a % a
Peak C‐O (288.3‐288.9 eV)
21.7 22.6 12.8 13.1
O1s O (C‐O b)/C (C‐O) 1.1 1.0 2.5 2.4 Peak M‐O/MOx
c
(529.3‐529.6 eV) 1.1 1.1 1.0 1.0
Cu2p3/2 % d % d % d % d
Peak 1 (Cu+Oh) (929.5‐930.8 eV)
2.9 0.7 4.8 0.6
Peak 2 (Cu+Th) (932.2 eV)
‐ ‐ 23.7 72.3
Peak 3 (Cu2+Oh) (933.5‐934.4 eV)
97.1 99.3 71.4 27.1
Mn2p3/2 % d % d % d % d
Peak 1 (Mn2+) (640.3‐641 eV)
‐ ‐ 36.3 16.5
Peak 2 (Mn3+) (641.7‐642.3 eV)
82.8 82.8 51.1 69.1
Peak 3 (Mn4+) (644.1‐644.5 eV)
17.2 17.2 12.6 14.5
Cu/(Cu+Mn) 0.28 0.25 0.21 0.22 a Atom percentage on surface (adventitious carbon free). b After the subtraction of oxygen from SiO2. c Ratio of oxygen evaluated in O1s (~529.5 eV) to stoichiometric oxygen in metals (Cu2p3/2 and Mn2p3/2). Used to certify oxygen balance. d Atom percentage on a metal basis (copper or manganese).

Artículo IV 134
0.00E+00
2.00E-02
4.00E-02
6.00E-02
8.00E-02
1.00E-01
1.20E-01
1.40E-01
1.60E-01
1.80E-01
2.00E-01
928 931 934 937 940 943 946
0.00E+00
2.00E-02
4.00E-02
6.00E-02
8.00E-02
1.00E-01
1.20E-01
1.40E-01
1.60E-01
1.80E-01
2.00E-01
928 931 934 937 940 943 946
0.00E+00
2.00E-02
4.00E-02
6.00E-02
8.00E-02
1.00E-01
1.20E-01
1.40E-01
1.60E-01
1.80E-01
2.00E-01
928 931 934 937 940 943 946
0.00E+00
2.00E-02
4.00E-02
6.00E-02
8.00E-02
1.00E-01
1.20E-01
1.40E-01
1.60E-01
1.80E-01
2.00E-01
2.20E-01
928 931 934 937 940 943 946
0E+00
0E-02
0E-02
0E-02
0E-02
0E-01
0E-01
0E-01
0E-01
0E-01
0E-01
637 639 641 643 645 647 649
PROX 20h
0E+00
0E-02
0E-02
0E-02
0E-02
0E-01
0E-01
0E-01
0E-01
0E-01
0E-01
637 639 641 643 645 647 649
0E+00
0E-02
0E-02
0E-02
0E-02
0E-01
0E-01
0E-01
0E-01
0E-01
0E-01
637 639 641 643 645 647 649
Fresh
PROX 1h
Pretreated
E+00
0E-02
0E-02
0E-02
0E-02
0E-01
0E-01
0E-01
0E-01
0E-01
0E-01
637 639 641 643 645 647 649B.E. (eV)
B.E. (eV)
637 639 641 643 645 647 649
B.E. (eV)
934 937 940 943 946
Mn2p3/2 Cu2p3/2
928 931
640.3
641.7
644.2
641.0
642.3
644.5
641.8
644.2
641.8
644.1
929.5
932.2
934.4
930.8
932.2
933.9
930.4
933.5
930.0
933.6
0.00E+00
2.00E-02
4.00E-02
6.00E-02
8.00E-02
1.00E-01
1.20E-01
1.40E-01
1.60E-01
1.80E-01
2.00E-01
928 931 934 937 940 943 946
0.00E+00
2.00E-02
4.00E-02
6.00E-02
8.00E-02
1.00E-01
1.20E-01
1.40E-01
1.60E-01
1.80E-01
2.00E-01
928 931 934 937 940 943 946
0.00E+00
2.00E-02
4.00E-02
6.00E-02
8.00E-02
1.00E-01
1.20E-01
1.40E-01
1.60E-01
1.80E-01
2.00E-01
928 931 934 937 940 943 946
0.00E+00
2.00E-02
4.00E-02
6.00E-02
8.00E-02
1.00E-01
1.20E-01
1.40E-01
1.60E-01
1.80E-01
2.00E-01
2.20E-01
928 931 934 937 940 943 946
0E+00
0E-02
0E-02
0E-02
0E-02
0E-01
0E-01
0E-01
0E-01
0E-01
0E-01
637 639 641 643 645 647 649
PROX 20h
0E+00
0E-02
0E-02
0E-02
0E-02
0E-01
0E-01
0E-01
0E-01
0E-01
0E-01
637 639 641 643 645 647 649
0E+00
0E-02
0E-02
0E-02
0E-02
0E-01
0E-01
0E-01
0E-01
0E-01
0E-01
637 639 641 643 645 647 649
Fresh
PROX 1h
Pretreated
E+00
0E-02
0E-02
0E-02
0E-02
0E-01
0E-01
0E-01
0E-01
0E-01
0E-01
637 639 641 643 645 647 649B.E. (eV)
B.E. (eV)
637 639 641 643 645 647 649
B.E. (eV)
934 937 940 943 946
Mn2p3/2 Cu2p3/2
928 931 0.00E+00
2.00E-02
4.00E-02
6.00E-02
8.00E-02
1.00E-01
1.20E-01
1.40E-01
1.60E-01
1.80E-01
2.00E-01
928 931 934 937 940 943 946
0.00E+00
2.00E-02
4.00E-02
6.00E-02
8.00E-02
1.00E-01
1.20E-01
1.40E-01
1.60E-01
1.80E-01
2.00E-01
928 931 934 937 940 943 946
0.00E+00
2.00E-02
4.00E-02
6.00E-02
8.00E-02
1.00E-01
1.20E-01
1.40E-01
1.60E-01
1.80E-01
2.00E-01
928 931 934 937 940 943 946
0.00E+00
2.00E-02
4.00E-02
6.00E-02
8.00E-02
1.00E-01
1.20E-01
1.40E-01
1.60E-01
1.80E-01
2.00E-01
2.20E-01
928 931 934 937 940 943 946
0E+00
0E-02
0E-02
0E-02
0E-02
0E-01
0E-01
0E-01
0E-01
0E-01
0E-01
637 639 641 643 645 647 649
PROX 20h
0E+00
0E-02
0E-02
0E-02
0E-02
0E-01
0E-01
0E-01
0E-01
0E-01
0E-01
637 639 641 643 645 647 649
0E+00
0E-02
0E-02
0E-02
0E-02
0E-01
0E-01
0E-01
0E-01
0E-01
0E-01
637 639 641 643 645 647 649
Fresh
PROX 1h
Pretreated
E+00
0E-02
0E-02
0E-02
0E-02
0E-01
0E-01
0E-01
0E-01
0E-01
0E-01
637 639 641 643 645 647 649B.E. (eV)
B.E. (eV)
637 639 641 643 645 647 649
B.E. (eV)
637 639 641 643 645 647 649
B.E. (eV)
934 937 940 943 946
Mn2p3/2 Cu2p3/2
928 931
640.3
641.7
644.2
641.0
642.3
644.5
641.8
644.2
641.8
644.1
929.5
932.2
934.4
930.8
932.2
933.9
930.4
933.5
930.0
933.6
Fig. 6. Evolution of Mn2p 3/2 and Cu2p 3/2 XPS spectra of CuMn2O4 subjected to differ‐ent treatments (Fresh, pretreated, PROX‐1h, PROX‐20h).

Valdés‐Solís et al. Int. J. Hydrog. Energy 35 (2010) 1879‐1887 135
The surface of the catalysts was also
analysed by means of XPS in order to
elucidate the surface composition of the
metal oxides and to obtain a detailed
picture of the chemical state of the
cations and anions during the reaction.
Fig. 6 shows the XPS spectra in the cop‐
per and manganese 2p3/2 regions of the
catalysts after being subjected to differ‐
ent treatments. From the areas of the
peaks it was possible to evaluate the
surface compositions at different stages.
The results of this evaluation are dis‐
played in Table 2.
The formation of monodentate carbon‐
ates on the sample during the reaction is
corroborated by an increase in the O/C
ratio, [O1s ~531 eV, peak C‐O after sub‐tracting the oxygen of the residual SiO2;
C1s ~288 eV, peak C‐O] from values of
around 1 (a value that might be ex‐
pected for bidentate carbonates given
the fraction of the oxygen in the car‐
bonate associated to the metal) to val‐
ues of about 2.5 which is similar to the
values that might be expected for
monodentate carbonates.
The deconvolution of the Cu2p3/2 signal
reveals the states of the copper on the
surface of the catalyst. The peak located
at around 934 eV is attributed to Cu(II)
[18, 27], which is generally assumed to
be octahedrally coordinated. The peak
located at 932 eV is usually associated to
the presence of Cu(I) or Cu(0), species
that can be distinguished from each
other by the modified Auger parameter
[28, 29]. However, other authors [9, 11,
30, 31] consider that there is a negative
shift in the binding energy and attribute
the peak located at ~930 eV to Cu(I) in a tetrahedral position [9, 31] and the
peaks at ~932 and ~934 eV to Cu(II) octahedrally and tetrahedrally coordi‐
nated respectively [9]. This negative
chemical shift has been attributed by
some authors to differences in the
Madelung potential [7, 8]. Additionally,
other authors have associated the peaks
at ~930 to the presence of Cu(I) in an octahedral environment [8, 32]. From
the results of our step‐response experi‐
ments we deduce that it is the CO that is
reducing the catalyst. This assumption,
together with the assignments provided
by the majority of the works reported
above, incline us to assign the peak lo‐
cated at ~932 eV to Cu(I). As no Cu(0) was detected in the Auger spectrum, we
believe that the shoulder at ~930 eV is probably due to the presence of Cu(I) in
an octahedral position [8, 32], whereas
the peak at around 932 eV is due to
Cu(I) in tetrahedral position. This would
imply a negative shift of around 1 eV
[27] which is much lower than the pre‐
vious shift (~2 eV [9, 30]). Finally the peak at 934 eV is assigned to Cu(II) [18,
27]. No peaks related to copper carbon‐
ates (~935 eV [33]) were detected.

Artículo IV 136
The deconvolution of the Mn2p3/2 sig‐
nal reveals the manganese valences.
According to the literature, the
Mn2p3/2 signal is useful for distinguish‐
ing between the states of Mn(II), Mn(III)
and Mn(IV). Studies performed on pure
manganese oxides provide binding en‐
ergy values of around 640.7‐640.9 eV for
MnO [34‐36], 641.7‐641.9 eV for Mn2O3
[34, 35] and 642.4‐643.4 eV for MnO2
[34, 35]. Several authors however, have
found a shift towards higher values for
certain manganites, including nickel
manganites [37], copper‐nickel
manganites [30] and copper‐zinc
manganites [38] for which three peaks
located at 641.3‐641.6 eV; 642.4‐
642.7 eV and 643.7‐644.9 eV can be
found. Assignments of these peaks dif‐
fer. In some cases, the first peak is at‐
tributed to Mn(III) and the others to
Mn(IV) depending on the coordination
environments [38]. Other authors, how‐
ever, consider that the first peak should
be assigned to Mn(II) [30]. For CuMn2O4
synthesised in air most of the copper
can be expected to be Cu(II) whereas
most of the manganese can be expected
to be Mn(III) [6]. In our fresh samples,
we detected a preponderance of Cu(II)
so we assume that the peak located at
around 642 eV is associated to Mn(III)
and the peak located at ~644 eV to Mn(IV). During the first few moments of
the reaction, a new peak appears at
~641 eV which we attribute to Mn(II). In
the fresh and pretreated samples the
amount of Mn(IV) detected could be
ascribed to a deficiency of Cu on the
surface of the catalysts (Cu/(Cu+Mn)<
0.33, Table 2). At the beginning of the
PROX reaction an intense reduction of
the catalysts seems to be occurring.
During the reaction Mn(II) appears,
which is probably tetrahedrally coordi‐
nated since the most likely cation distri‐
bution for CuMn2O4, according to the
literature, is Cu+ and Mn2+ on tetrahe‐
dral sites and Cu2+, Mn3+ and Mn4+ on
octahedral sites, giving the following
ionic configuration [18]:
(Cu+αMn2+1‐α)Th (Cu2+1‐α Mn3+αMn4+)Oh O
2‐4
(R6)
As can be seen from Table 2, during the
reaction the peak located at ~933 eV decreases, while a peak located at
~932 eV appears and progressively in‐creases. This indicates the progressive
reduction of Cu2+ to Cu+. At the begin‐
ning of the PROX reaction Mn3+ is par‐
tially reduced to Mn2+, while at the same
time Mn4+ is partially reduced to Mn3+.
However, the amount of Mn2+ is slightly
higher than that of Cu+ after 1h PROX,
indicating an excessive reduction of
manganese. For longer reaction times
these non‐steady valences of manga‐
nese evolve into a more oxidised state,
and the reduction of Cu2+ to Cu+ be‐
comes more significant.

Valdés‐Solís et al. Int. J. Hydrog. Energy 35 (2010) 1879‐1887 137
To the best of our knowledge, there is
no mechanistic study on CO oxidation in
the presence of H2 in copper‐manganese
systems. However, in the absence of H2
it is generally assumed that the reaction
proceeds as follows [8]:
CO + Mn4+ → CO+ads + Mn3+ (R7)
½ O2 + Cu+ → O‐
ads + Cu2+ (R8)
CO+ads + O
‐ads → CO2 (R9)
Cu2++ Mn3+ ←Cu→
+ + Mn4+ (R10)
As stated before, the presence of carbo‐
naceous species does not seem to lead
to deactivation. However, such species
may affect the relative concentrations of
the different oxidation states of manga‐
nese. At the beginning of the reaction
manganese is reduced to a higher extent
than copper (Table 2), whereas during
the reaction manganese is partially re‐
oxidised. The initial reduction cannot
have been produced by the gaseous
stream since the copper, which is more
prone to reduction [5], is less reduced
than the manganese at this stage. In our
search for an alternative explanation we
suspect that the initial reduction of
manganese might be related to the
presence of bidentate/bridge carbon‐
ates in the fresh sample. These have
almost disappeared after 1h under PROX
conditions, a process that occurs parallel
to the reduction of manganese. A possi‐
ble mechanism for the reductive de‐
composition of the bidentate/bridge
carbonates is suggested by reactions
R11 and R12, which may also explain the
concomitant reduction of manganese:
Mn Mn
O
O O
C
O
O O
3+ 3++ CO/H2
Mn Mn
OO O
2+ 2++ CO2/H2O + CO2
Mn Mn
O
O O
C
O
O O
3+ 3++ CO/H2
Mn Mn
OO O
2+ 2++ CO2/H2O + CO2
(R11)
Mn Mn
O
O O
C
O
O
O
3+ 3+
+ CO/H2Mn Mn
OO O
2+ 2++ CO2/H2O + CO2
(R12)
During the reaction new carbonates are
formed, as implied from the step re‐
sponse experiments, the FTIR analyses
and the evolution of the O/C ratio (Ta‐

Artículo IV 138
ble 2). As already indicated, the forma‐
tion of these carbonates is enhanced by
the presence of oxygen. Simultaneously
the oxidation of Mn2+ to Mn3+ takes
place (Table 2). A possible explanation
for this could be that of reactions R13
(oxidation of Mn2+) and R14 (formation
of new carbonates) in which CO+ads
comes from reaction R7 [8]:
Mn Mn
OO O
2+ 2+ + O2 Mn Mn
OO O
3+ 2+
O2-
Mn Mn
OO O
2+ 2+ + O2 Mn Mn
OO O
3+ 2+
O2-
(R13)
Mn Mn
OO O
3+ 2+
O2-
Mn Mn
OO O
3+ 2+
C
O O
+ CO+ads
O
Mn Mn
OO O
3+ 2+
O2-
Mn Mn
OO O
3+ 2+
C
O O
+ CO+ads
O
(R14)
Thus, considering the relative concen‐
trations of Mn2+, Mn3+ and Mn4+ and
Cu+/Cu2+ after 20 h under PROX condi‐
tions (CO+H2+O2), the loss of activity
should be attributed to the progressive
reduction of copper on the surface of
the catalyst through the action of CO.
This is corroborated by the results of the
step‐response experiments (see above).
It is not yet clear how the reduction of
CuO can have a negative effect on the
reaction mechanism (R7‐R10 for non‐
preferential CO oxidation). In fact, the
presence of Cu+ seems to be necessary
for adsorbing gaseous oxygen, according
to the standard CO oxidation mecha‐
nism (R8). Veprek et al. [8] found a high
proportion of Cu+ on the catalyst surface
of “deactivated” hopcalite catalysts
(catalysts subjected to heat‐treatment
at 550°C), although these authors did
not offer any mechanistic explanation.
Dollimor and Tonge [39] suggested that
Cu+ forms stable CO omplexes that may
block the surface, causing lower activity.
However, we detected no such com‐
plexes with FTIR. The exact role of Cu+ in
the deactivation process of these PROX
catalysts must remain a subject for fu‐
ture research.

Valdés‐Solís et al. Int. J. Hydrog. Energy 35 (2010) 1879‐1887 139
4. Conclusions
We have shown that CuMn2O4 synthe‐
sised by SACOP is an active catalyst for
the preferential oxidation of CO at mod‐
erate temperature, even at high spatial
velocities. However, this catalyst under‐
goes slow deactivation in long‐term
experiments. Although carbonates are
formed under reaction conditions in the
manganese phase present on the cata‐
lyst surface, they are not the cause of
deactivation. In the analysis conditions
employed in this work deactivation ap‐
pears to be produced by the progressive
reduction of Cu(II) to Cu(I) through the
action of CO.
References [1] I. López, T. Valdés‐Solís, G. Marbán, Int. J. Hydrogen Energy 33 (2008) 197.
[2] A. Gurbani, J. L. Ayastuy, M. P. González‐Marcos, J. E. Herrero, J. M. Guil, M. A. Gutiérrez‐Ortiz, Int. J. Hydrogen Energy 34 (2009) 547.
[3] G. Marbán, A. B. Fuertes, Appl. Catal. B: Environ. 57 (2005) 43.
[4] G. Marbán, I. López, T. Valdés‐Solís, Appl. Catal. A: Gen. 361 (2009) 160.
[5] F. C. Buciuman, F. Patcas, T. Hahn, Chem. Eng. Proc. 38 (1999) 563.
[6] P. Porta, G. Moretti, M. Musicanti, A. Nardella, Catal. Today 9 (1991) 211.
[7] C. Yoon, D. L. Cocke, J. Catal. 113 (1988) 267.
[8] V. Veprek, D. L. Cocke, S. Kehl, H. R. Oswald, J. Catal. 100 (1986) 250.
[9] G. Fortunato, H. R. Oswald, A. Reller, J. Mater. Chem. 11 (2001) 905.
[10] T. Valdés‐Solís, G. Marbán, A. B. Fuertes, Catal. Today 116 (2006) 354.
[11] J. Papavasiliou, G. Avgouropoulos, T. Ioannides, J. Catal. 251 (2007) 7.
[12] M. Kramer, T. Schmidt, K. Stowe, W. F. Maier, Appl. Catal. A: Gen. 302 (2006) 257.
[13] G. Marbán, T. Valdés‐Solís, A. B. Fuertes, Cat. Lett. 118 (2007) 8.
[14] G. Marbán, A. B. Fuertes, T. Valdés‐Solís, Microp. Mesop. Mat. 112 (2008) 291.
[15] W. Liu, M. Flytzani‐Stephanopoulos, J. Catal. 153 (1995) 317.
[16] D. Gamarra, A. Hornés, Zs. Koppany, Z. Schay, G. Munuera, J. Soria, A. Martínez‐Arias, J. Power Sources 169 (2007) 110.
[17] A. Martinez‐Arias, A. B. Hungria, G. Munuera, D. Gamarra, Appl. Catal. B: Envi‐ron. 65 (2006) 207.
[18] B. Gillot, S. Buguet, E. Kester, J. Mater. Chem. 7 (1997) 2513.

Artículo IV 140
[19] C. Li, Y. Sakata, T. Arai, K. Domen, K. Maruya, T. Onishi, J. Chem. Soc. , Faraday Trans. 1 Phys. Chem. Condensed Phases 85 (1989) 929.
[20] M. Manzoli, A. Chiorino, F. Boccuzzi, Appl. Catal. B: Environ. 52 (2004) 259.
[21] O. Seiferth, K. Wolter, B. Dillmann, G. Klivenyi, H.‐J. Freund, D. Scarano, A. Zec‐china, Surface Science 421 (1999) 176.
[22] R. Xu, Z. y. Ma, C. Yang, W. Wei, W. h. Li, Y. H. Sun, J. Mol. Catal. A‐Chem. 218 (2004) 133.
[23] W. M. Shaheen, M. M. Selim, Thermochim. Acta 322 (1998) 117.
[24] R. L. Frost, Z. Ding, J. T. Kloprogge, W. N. Martens, Thermochim. Acta 390 (2002) 133.
[25] O. Pozdnyakova, D. Teschner, A. Wootsch, J. Krohnert, B. Steinhauer, H. Sauer, L. Toth, F. C. Jentoft, A. Knop‐Gericke, Z. Paal, R. Schlogl, J. Catal. 237 (2006) 17.
[26] O. Pozdnyakova, D. Teschner, A. Wootsch, J. Krohnert, B. Steinhauer, H. Sauer, L. Toth, F. C. Jentoft, A. Knop‐Gericke, Z. Paal, R. Schlogl, J. Catal. 237 (2006) 1.
[27] M. Lenglet, A. D'Huysser, J. Kasperek, J. P. Bonnelle, J. Durr, Mater. Res. Bull. 20 (1985) 745.
[28] X. M. Liu, G. Q. Lu, Z. F. Yan, Appl. Catal. A: Gen. 279 (2005) 241.
[29] W. L. Dai, Q. Sun, J. F. Deng, D. Wu, Y. H. Sun, Appl. Surf. Sci. 177 (2001) 172.
[30] J. Töpfer, A. Feltz, D. Gräf, B. Hackl, L. Raupach, P. Weissbrodt, Phys. Status Solidi A 134 (1992) 405.
[31] V. A. M. Brabers, F. Van Setten, J. Phys. D‐Appl. Phys. 16 (1983) L169‐L172.
[32] A. D'Huysser, B. Lerebours‐Hannoyer, M. Lenglet, J. P. Bonnelle, J. Solid State Chem. 39 (1981) 246.
[33] C.D.Wagner, W.M.Riggs, L.E.Davis, J.F.Moulder, G.E.Muilenberg, Handbook of X‐Ray Photoelectron Spectroscopy. Perkin Elmer Coorporation, Eden Prairie, Minn., 1979.
[34] G. C. Allen, S. J. Harris, J. A. Jutson, J. M. Dyke, Appl. Surf. Sci. 37 (1989) 111.
[35] L. M. Ioffe, P. Bosch, T. Viveros, H. Sanchez, Y. G. Borodko, Mater. Chem. Phys. 51 (1997) 269.
[36] P. Z. Si, E. Bruck, Z. D. Zhang, O. Tegus, W. S. Zhang, K. H. J. Buschow, J. C. P. Klaasse, Mater. Res. Bull. 40 (2005) 29.
[37] J. Töpfer, A. Feltz, Solid State Ionics 59 (1993) 249.
[38] F. Li, L. Zhang, D. G. Evans, X. Duan, Colloid Surf. A‐Physicochem. Eng. Asp. 244 (2004) 169.

Valdés‐Solís et al. Int. J. Hydrog. Energy 35 (2010) 1879‐1887 141
[39] D. Dollimor, K. H. Tonge, J. Chem. Soc. A (1970) 1728‐1731.


143
Resumen artículo V.
HIGHLY ACTIVE COBALT OXIDE CATALYSTS PREPARED BY SACOP FOR
THE PREFERENTIAL OXIDATION OF CO IN EXCESS HYDROGEN
Catalizadores de óxido de cobalto preparados por SACOP con elevada
actividad en la oxidación preferencial de CO en exceso de hidrógeno
Los óxidos de cobalto son compuestos de elevado interés industrial y recientemente han
sido empleados en la reacción de oxidación preferencial de CO en exceso de hidrógeno.
El presente trabajo tiene como objeto la síntesis de óxidos de cobalto mediante el
método SACOP y su posterior análisis PROX en un sistema de reacción multicanal.
Los óxidos de cobalto fueron obtenidos utilizando dos métodos de precipitación, bien
vertiendo el gel sobre una disolución de NaOH (método A) o bien echando gota a gota la
disolución de NaOH sobre el gel (método B). Por motivos de comparación además de los
nanocatalizadores preparados por SACOP, se sintetizaron otros dos catalizadores de
Co3O4, uno obtenida mediante impregnación de sílice comercial y otro por precipitación
con NaOH.
El método SACOP permitió la obtención de nanocatalizadores de Co3O4/CoOOH con
áreas superficiales de hasta 120 m2∙g‐1. La proporción de ambos óxidos varió en función
del método de precipitación, siendo el método B el que produjo una mayor proporción
de CoOOH (∼80%). Mediante la precipitación A se obtuvieron catalizadores con un
contenido de CoOOH de aproximadamente el 50%. El análisis textural de las muestras
precipitadas por el método A indujo a pensar que una parte de los iones de cobalto
habían migrado fuera de las microestructuras de la sílice durante la etapa de
precipitación, produciendo Co3O4 de baja superficie en la etapa de calcinación posterior.
Esta migración indeseable se minimizó mediante el empleo del método B. El contacto
entre las especies de cobalto y los grupos silanoles de las paredes de la sílice produjo un
silicato básico de cobalto que en la etapa de eliminación de la sílice se transformó en
CoOOH, siendo éste el compuesto responsable de la elevada área superficial de los
catalizadores sintetizados por SACOP.
En los catalizadores sintetizados utilizando el método de precipitación A se estudió la
influencia de la temperatura de calcinación y de la concentración de cobalto en la
disolución precursora. Las muestras calcinadas a 200°C presentaron valores del área
superficial más pequeños que los de los catalizadores calcinados a temperaturas más

Artículo V 144
altas. Este comportamiento es debido a la calcinación incompleta de Co(OH)2 hacia
CoOOH, ya que para su transformación posterior a Co3O4 se necesitan temperaturas
superiores a 200°C. Por ello se puede asumir que el CoOOH proveniente de la
calcinación incompleta del Co(OH)2 presenta áreas superficiales menores que el Co3O4
obtenido tras la calcinación total. Por consiguiente, las muestras calcinadas a 200°C
están compuestas por CoOOH de elevada área superficial proveniente de las
interacciones cobalto‐sílice, CoOOH de menor área superficial producido a partir de la
calcinación incompleta de Co(OH)2 y diferentes fracciones de Co3O4. En las muestras
calcinadas a temperaturas por encima de 200°C se observó una ligera tendencia de
disminución del área superficial con el incremento de la temperatura. Este fenómeno se
puede explicar considerando la sinterización de las partículas de Co3O4 formadas fuera
de la matriz de sílice.
Por otro lado, bajas concentraciones de cobalto en la disolución precursora produjeron
nanocatalizadores con áreas superficiales ligeramente más altas, aunque las diferencias
no fueron significativas, lo que puede ser debido a la presencia de Co3O4 formado fuera
de la matriz de sílice. Se estimó que la cantidad de Co3O4 que se formó dentro de la
matriz de sílice representaba entre el 30 y el 45% del total de Co3O4 producido.
Los espectros de difracción indujeron a pensar que una gran parte de las muestras
estaban formadas por material amorfo. Cuanto mayor era la fracción amorfa, más
contenido en CoOOH tenía la muestra y más área superficial presentaba, de lo que se
dedujo que la especie CoOOH estaba en estado amorfo y era la responsable de la
elevada superficie específica de estos catalizadores.
El sistema de reacción multicanal se puso a punto para el análisis de reactividad de los
óxidos de cobalto preparados en este trabajo. Este sistema permite analizar
simultáneamente la actividad catalítica de hasta seis catalizadores, utilizando
aproximadamente 5.5 mg de catalizador en cada experimento y velocidades espaciales
muy elevadas (GHSV∼39000 h‐1). La mayoría de los catalizadores mostraron una elevada
estabilidad, con pérdidas de actividad en 20 h inferiores al 15%. Todos ellos presentaron
selectividades por encima del 0.7. Las pequeñas diferencias de actividad entre las
muestras se pueden atribuir a pequeñas diferencias en su reducibilidad.
El catalizador más activo resultó ser el preparado mediante la precipitación tipo B y
calcinado a 400°C (121 m2∙g‐1), con una actividad 1.5 veces superior al segundo
(434.7×10‐7 y 281.4×10‐7 molCO∙gcat‐1∙s‐1, respectivamente). Además, presentó una
selectividad de 0.81 y una estabilidad muy elevada, perdiendo solo un 4.5% de su
actividad desde las 5 h hasta las 20 h de reacción. Su gran actividad es debida a la

145
presencia de CoOOH de elevada área superficial que en condiciones PROX se reduce a
Co3O4.
Los nanocatalizadores Co3O4/CoOOH preparados por SACOP presentaron actividades
catalíticas más elevadas que los catalizadores de Co3O4 más activos descritos en la
literatura. Este hecho demuestra que la técnica SACOP es un método válido para la
obtención de catalizadores de cobalto con elevada actividad catalítica, selectividad y
estabilidad para la reacción de oxidación preferencial de CO.


147
Artículo V
Highly active cobalt oxide catalysts prepared by SACOP for
the preferential oxidation of CO in excess hydrogen
Irene López, Teresa Valdés‐Solís, Gregorio Marbán
Abstract
Cobalt based catalysts synthesized by the silica aquagel confined co‐precipitation method (SACOP) and analysed at high spatial velocities (∼39,000 h‐1) for the preferential oxidation of CO in the presence of hydrogen showed the highest values of catalytic activity of all the cobalt‐based catalysts described in the literature together with good values of selectivity and stability. Co3O4/CoOOH nanocatalysts had specific surface areas of up to 120 m2∙g‐1 depending on the type of precipitation used. SACOP samples precipitated by pouring aquagel into the NaOH solution (method A) gave rise to samples with less CoOOH than when the NaOH solution was poured over the aquagel (method B). This difference is ascribed to the migration of cobalt out of the aquagel microstructure during precipitation by method A. Precipitation type B produced the most active catalyst due the larger amount of amorphous CoOOH in the fresh sample, which was formed via the removal of silica from the cobalt silicate hydroxide. The CoOOH is gradually reduced to high surface area Co3O4 in the presence of H2 during the PROX reaction. The mechanisms of formation of CoOOH and Co3O4 via SACOP are also discussed.
Keywords: PROX, hydrogen, CO, cobalt oxide, cobalt spinel, cobalt oxyhydroxide, catalytic activity, stability
1. Introduction
With the increasing social demand for a cleaner energy system there is mounting
pressure for a gradual transition to hydrogen powered vehicles in order to mitigate CO2
emissions to the atmosphere. To achieve this goal a reliable hydrogen fuelling system
needs to be developed. Taking into account the current problems associated with on‐
board hydrogen storage (high cost, low mass density, the need for a generation/
distribution network, etc.), on‐board hydrogen production via the steam reforming of
bioalcohols seems to be a most reasonable and best developed option. The steam
reforming of bioalcohols (e.g. methanol) produces a hydrogen stream with a variable CO
Artículo V 148
content which must be almost completely removed to prevent the platinum anode in
the PEMFC from being poisoned. In order to purify the hydrogen stream, a water gas
shift reaction (for high CO concentrations) followed by preferential oxidation of any
residual CO (PROX) is commonly applied.
The PROX reaction consists of the catalytic oxidation of residual CO to CO2 in the
100‐250°C temperature range, while at the same time avoiding the oxidation of
hydrogen to water. From the economic point of view there is increasing interest in the
development of non‐noble metal catalysts for this application. Several transition metal
oxides are potential candidates for use in this process. CuOx/CeO2 is one of the most
investigated catalysts for the PROX reaction [1]. However, this catalyst is prone to
gradual deactivation [2]. In the search for more stable catalytic formulations, the cobalt
spinel Co3O4 has recently been proved to be a highly active, selective and stable catalyst
[3‐5], although in some cases the methanation of CO does occur, even at temperatures
below 200°C [4].
The use of nanoscaled catalysts improves catalytic activity because of their very high
surface to volume ratio. In this work we employed the silica aquagel confined co‐
precipitation (SACOP) method [6, 7] to synthesize cobalt oxide based nanostructures.
The SACOP technique is based on the coagulation – precipitation processes that occur
when the metallic cations of salts dissolved in a medium of silica aquagel are made to
precipitate by introducing basic reagents. This synthesis strategy gives rise to high
surface area nanosized metallic oxides, and has been successfully applied in the
preparation of CuOx/CeO2, CoFe2O4, CuMn2O4 [6], and CeO2 [7]. In the present work the
activity and stability of cobalt oxide catalysts prepared by the SACOP technique have
been tested for the preferential oxidation of CO. Our findings demonstrate that the
SACOP method endows the resulting catalysts with properties that make them more
active than those produced by applying other nanotechnological synthetic procedures.
2. Experimental
Catalyst synthesis
The cobalt based catalysts were prepared by the SACOP procedure [6]. First
Co(NO3)2∙6H2O was dissolved in HCl. Then this solution was added dropwise to a mixture
of sodium silicate and water using molar compositions of SiO2/H+/H2O = 1/6.54/193.9
and Co/Si = 0.25 or 0.67. After hydrolysis (24h at RT) and condensation (24h at 100°C) a
silica aquagel containing widely dispersed cobalt cations was formed. Precipitation

López et al. Enviado a ChemCatChem 149
inside the gel was performed via two different approaches. In method A the aquagel was
slowly poured into a solution of NaOH (1.25 M); in method B a solution of NaOH (3.5 M)
was poured into the aquagel in order to cause the cobalt ions to precipitate. In both
cases the non‐poured component was subjected to vigorous magnetic stirring. The
slurry formed after the precipitation stage was repeatedly washed and dispersed in
acetone, then vacuum filtered and left to dry at RT overnight. The resulting silica‐metal
composites were calcined in air at different calcination temperatures (200‐500°C) for 4h
(1°C∙min‐1). As calcination takes place inside the pores of the silica matrix (confined
process) growth of the nanomaterials is restricted and consequently high values of
surface area can be achieved (template technique). Finally, the silica matrix was
removed by dissolution in NaOH (3.5 M) in an isolated stirred beaker at ~85°C for 6 hours. Taking into account the negative effect of residual silica and sodium on catalytic
activity (as reported in a previous paper [2] and confirmed experimentally in this work),
all the samples were prepared with low amounts of silica and sodium (below 2.0 and
0.3 wt.%, respectively). At these values no effect on catalytic activity was evidenced.
The samples synthesised by SACOP were labelled STCo‐P, where S indicates SACOP
method, T the calcination temperature (200, 300, 400, 500°C), Co the amount of cobalt
in the synthesis mixture (L for low concentration, Co/Si=0.25; H for high concentration
Co/Si=0.67) and P the precipitation method (A for the samples prepared by pouring the
gel into the NaOH solution and B for the samples obtained by adding the NaOH solution
to the gel). Thus, S300H‐B refers to the sample synthesised by SACOP at 300°C and
Co/Si=0.67, where precipitation was triggered by adding NaOH to the gel.
For comparison purposes, Co3O4 nanoparticles were prepared by a hard silica template
method, as reported elsewhere [8] and calcined at 400°C (T400). Co3O4 particles were
also obtained via the precipitation of Co(OH)2 with NaOH powders from a solution with
the same composition as the aquagel precursor solution (except for the absence of
sodium silicate) followed by calcination at 200 and 400°C. These samples were named
P200 and P400, respectively.
Catalyst characterization
Nitrogen adsorption isotherms were performed at ‐196°C using a Micromeritics ASAP
2020 volumetric adsorption system. The BET surface area was deduced from an analysis
of the isotherms in the relative pressure range of 0.04 to 0.20. The Pore Size Distribution
(PSD) was calculated by the Kruk‐Jaroniec‐Sayari method [9]. Transmission electron

Artículo V 150
micrographs (TEM) were taken on a JEOL (JEM‐2000 EX II) microscope operating at
16 kV. XRD spectra were obtained in a Siemens D5000 diffractometer operating at 40 kV
and 20 mA with Cu‐Kα radiation. The degree of crystallinity (DOC) was calculated as the ratio between the height of the main Co3O4 peak (2θ =36.7°) (subtracting the baseline) and the total height including the background of the XRD diffractogram. TPR analyses
were performed in a chemisorption analyzer (Autochem II) equipped with a TCD reactor
and a Mass Spectrometer (OmniStar 300O). For each analysis approximately 25 mg of
sample was treated with a 50 mL∙min‐1 stream of 10% H2 in Argon from 100°C to 850°C
at 5°C∙min‐1. TG experiments were performed in a CI Electronics device from RT to 700°C
at a heating rate of 5°C∙min‐1 under a continuous flow of N2 (100 mL∙min‐1). TG reduction
experiments were carried out at 175°C under a continuous flow of 15% H2 in N2.
Catalytic activity tests
Catalytic activity tests on the cobalt‐based nanoparticles were performed using a
six‐reactor system. A computer‐controlled multiposition valve fitted to the mass
spectrometer permitted simultaneous analysis of the outlet streams. In the standard
PROX reaction 5.5 mg of nanocatalyst was diluted in 75 mg of SiC particles and placed in
the stainless‐steel reactor between two layers of glass wool. This ensured plug‐flow and
isothermal conditions within the bed. The samples were heated in a flow of He at 195°C
for 60 min. The reactant stream was then passed through the catalyst and its catalytic
activity and selectivity were sequentially evaluated at decreasing temperatures (175,
150 and 125°C) for long periods of time. The reactant gas feed contained 15 vol.% H2,
0.4 vol.% CO and 0.4 vol.% O2 in He. The outlet streams were analyzed on‐line by mass
spectrometry (Omnistar 300O). O2, H2, CO, CO2 and CH4 were quantitatively analyzed
with the help of pre‐reaction and post‐reaction calibration steps. In all the PROX
experiments only traces of methane (below 0.004%) were detected at the reaction
conditions used in this work
The conversion was evaluated as follows:
[ ][ ]in
outCO CO
CO1X −= [E1]
where the in and out subscripts refer to the inlet and outlet gaseous streams,
respectively. Selectivity towards CO oxidation was calculated as follows:

López et al. Enviado a ChemCatChem 151
[ ] [ ]( )[ ] [ ]out2in2
outin
OO
COCO5.0S
−−⋅
= [E2]
The reaction rate (molCO∙gcat∙s‐1) was determined by means of the Langmuir‐Hinselwood
mechanism proposed by Liu and Flytzani‐Stepahopoulus [10] for CO oxidation over a
copper–ceria catalyst, as described elsewhere [1].
To characterize the stability of the catalysts, the following parameter was employed:
5hC175
5hC175
20hC175
r
rr100r%Δ
°
°° −×= [E3]
where rtT is the reaction rate at time t and temperature T. This parameter measures the
variation of the PROX reaction rate between 5 and 20 hours of reaction at 175°C. Slightly
negative, zero or positive values of %Δr indicate a high degree of stability in the PROX reaction rate.
3. Results and discussion
3.1. Structural features
By means of the SACOP procedure it is possible to obtain cobalt oxide‐based
nanostructures with high surface area values. The presence of cobalt spinel (Co3O4) and
cobalt oxyhydroxide (CoOOH) in the catalysts was confirmed by XRD, as can be seen in
Figure 1. The amount of CoOOH in selected samples was evaluated by means of
thermogravimetric analysis in a nitrogen atmosphere [11]. Table 1 summarizes the
structural characteristics and the catalytic activity values of the prepared samples.

Artículo V 152
(f)
0.7
0.7
0.8
0.8
0.8
0.8
0.8
0.8
0.8
0.4
0.8
%Δr
(e)
‐14
‐12
‐16
‐12
‐14
‐19
7.5
3.8
‐4.5
6.3
‐7.4
r20h
175°C× 107
(d)
(mol
CO∙g
cat∙s
‐1)
281
263
195
208
245
202
195
206
435
8.3
268
DOC
(c)
27
25
37
37
34
40
33
39
14
86
48
S BET
(m2 ∙g‐
1 )
77.0
92.8
88.8
72.6
67.1
84.3
82.2
83.2
121.3
27.5
97.0
CoOOH(a)
(wt.%)
n.e.
(b)
n.e.
n.e.
n.e.
55.2
n.e.
n.e.
43
80.3
0 24
(d) P
ROX reactio
n rate at 1
75°C after 20h
(mol
CO∙g
cat∙s
‐1)
(e) V
ariatio
n of th
e PR
OX reactio
n rate at 1
75°C between 5
and 20h (equ
ation E3)
(f) Selectiv
ity at 1
75°C after 20h
reaction (equ
ation E2)
T calc (°C)
200
300
400
500
200
300
400
500
400
400
400
Co/Si
(molar)
0.3
0.3
0.3
0.3
0.7
0.7
0.7
0.7
0.3 ‐ 0.3
Type
of p
recipitatio
n
A‐ G
el over NaO
H
B‐NaO
H over gel
NaO
H over dissolution
‐
Table 1. Structural characteristics and catalytic
activity
of the
cob
alt n
anocatalysts prepared in th
is work.
Ref.
S200
L‐A
S300
L‐A
S400
L‐A
S500
L‐A
S200
H‐A
S300
H‐A
S400
H‐A
S500
H‐A
S400
L‐B
P400
T400
(a) T
GA analyses
(b) N
ot evaluated
(c) D
egree of crystallinity
calculated at 2
θ =36.7° (p
eak correspo
nding to th
e Co
3O4 p
hase) as indicated in th
e expe
rimen
tal sectio
n
h20
h20
C175
S°C
175
S°

López et al. Enviado a ChemCatChem 153
15 20 25 30 35 40 45 50 55 60 65 70
2θ
Inte
nsity
(a.u
.)
∗a∗
∗
∗
■■
■
■
∗
■■∗ ■
b
c
d
∗ ■
* Co3O4
■ CoOOH
Figure 1. XRD profiles of (a) S400L‐B, (b) S200L‐A, (c) T400 and (d) P400 samples.
The isotherms of the SACOP samples, the main examples of which are displayed in
Figure 2, indicate the presence of a tiny fraction of small mesopores (2‐3 nm) associated
to a high fraction of structural porosity (~0.3‐0.4 cm3∙g‐1). The average pore size of this
porosity ranges from 55 to 80 nm for the samples prepared via method A and has a
value of 17 nm for the sample prepared via method B. These values enable us to form an
initial impression of the mode of formation of CoOOH and Co3O4 when applying the
SACOP technique. The sample obtained by method B (S400L‐B), which has the highest
specific surface area (Table 1; 121 m2∙g‐1), displays a small average pore size for
structural porosity (17 nm), which is of a similar order to that of the silica‐CeO2
nanocomposites obtained by SACOP in a previous work [7]. This suggests that the
structural porosity in this case is made up of intraparticle porosity and the space
occupied by the silica walls of the nanocomposite formed during the precipitation
procedure. S400L‐B, therefore, must have been formed as a result of very close contact
between the cobalt species and the silanol groups on the silica walls. As S400L‐B is
mainly formed by CoOOH (Table 1; 80.3 wt.%) it can be concluded that this species is the
product of interaction between the cobalt ions and the silica walls, and is responsible for
the high surface area of this sample (hereafter this CoOOH fraction will be referred to as
“h‐CoOOH”, meaning high surface area CoOOH). In contrast, the samples prepared by
method A present higher average pore sizes in their structural porosity (55‐80 nm),

Artículo V 154
lower values of specific surface area, and are composed of smaller amounts of h‐CoOOH
(Table 1). These data are consistent with a picture in which part of the cobalt ions
migrate out of the silica microstructure during the precipitation process and produce
bulk Co3O4 in the subsequent calcination step. The structural porosity of these samples
therefore receives an additional contribution from the interparticle voids (of high
average size) in the Co3O4 nanoparticles resulting from the migration of cobalt ions
(hereafter “bulk Co3O4”). This composite porosity can be appreciated in the pore size
distribution curve of S400L‐A (inset of Figure 2), in the shoulder in the 10‐20 nm range
(contributed by h‐CoOOH) and the maximum at 55 nm (contributed by the interparticle
voids of bulk Co3O4). If this interpretation is correct, then method B appears to be the
most suitable precipitation procedure, since it allows the migration of cobalt from the
aquagel media to be minimized. However, this high surface area h‐CoOOH fraction is not
able to survive the calcination step in most of the samples (the TGA experiments
showed that it was transformed into cobalt oxide during the 150‐500°C temperature
interval, the maximum rate of decomposition occurring in the 250‐300°C range). This
product must, therefore, have been formed in the step following calcination, namely the
silica removal step. Wide peaks corresponding to cobalt silicate hydroxide,
Co3(OH)4Si2O5, were appreciated in the XRD spectrum performed on a Co‐SiO2
nanocomposite obtained by SACOP, where the wavy baseline of amorphous silica was
also evident. This kind of silicate is known to be produced by the deposition‐
precipitation of cobalt onto a silica matrix [12], and is able to survive even at the highest
calcination temperature (500°C) [13]. It seems clear that the silica removal step
transforms this silicate into high surface area CoOOH. A long‐run TG experiment in a
continuous flow of H2 (15%) demonstrated that the h‐CoOOH present in the S400L‐B
nanocatalyst was gradually reduced to a Co3O4 at 175°C, making this the predominant
species under PROX reaction conditions for all the analysed catalysts.
There are no great differences in the BET surface areas of the SACOP catalysts
precipitated by method A (67‐93 m2∙g‐1), which indicates that the calcination
temperature has little influence on the properties of the samples. Surprisingly the
samples calcined at 200°C present lower values of specific surface area than those
calcined at higher temperatures (Table 1). This is ascribed to the partial calcination of
Co(OH)2 at 200°C. It is known that bulk Co(OH)2 is converted to Co3O4 in two steps [14]:
first it is transformed to CoOOH at temperatures below 200°C; then the CoOOH is
converted to Co3O4 in the temperature range of 200‐300°C. It can therefore be assumed
that the CoOOH formed by the partial calcination of bulk Co(OH)2 has a lower surface
area than the Co3O4 phase formed after complete calcination. This CoOOH phase is

López et al. Enviado a ChemCatChem 155
therefore different to the h‐CoOOH phase and hereafter will be termed l‐CoOOH,
signifying low surface area CoOOH. In conclusion l‐CoOOH is only present in the samples
calcined at 200°C, and accompanies the fraction of h‐CoOOH formed by the silica‐cobalt
interaction, as well as the different fractions of Co3O4 (see below).
0
50
100
150
200
250
0.0 0.2 0.4 0.6 0.8 1.0
Relative pressure (p/po)
Ads
orbe
d vo
lum
e, (c
m 3 S
TP·g
-1)
.
S400L-B
S400L-A
0.0
0.1
0.2
0.3
0.4
1 10 100 1000Pore size (D), nm
dV/d
log(
D),
cm 3 ·g
-1 S400L-B
S400L-A
Figure 2. N2 physisorption isotherms and pore size distribution curves for S400L‐A and S400L‐B.
After calcination at temperatures equal to or above 300°C, when bulk Co(OH)2 is
completely transformed into bulk Co3O4, the specific surface area values follow a slightly
decreasing trend with calcination temperature. This might be due to the sintering of the
bulk Co3O4 particles. In general, the samples prepared with a lower Co/Si ratio present
slightly higher values of specific surface area, as can be seen in Table 1. This behaviour is
consistent with the SACOP mechanisms reported in a previous work [7], although it is
not as marked as might be expected due again to the formation of some bulk Co3O4
outside the silica matrix.
Certain specific features of the XRD spectra (i.e. high baselines, wide peaks, etc) suggest
that a high fraction of the SACOP samples is formed by amorphous material. Therefore,
for comparative purposes, we have related the amorphous material fraction in the
SACOP samples to the degree of crystallinity (DOC) evaluated (vide supra Experimental

Artículo V 156
section). The resulting values are summarized in Table 1. Figure 3 shows the variation of
the CoOOH concentration (wt.%) and the BET surface area with DOC for different
samples. As can be seen, there is a conspicuous inverse relation between the
concentration of CoOOH and DOC, which means that this species occurs in an
amorphous state in these samples. Furthermore, CoOOH (which is only h‐CoOOH for the
samples calcined at T>200°C) is the main contributor to the specific surface area of the
samples, as is deduced from the variation of BET surface area with DOC (Figure 3).
However, two samples do not fully conform to this trend (S200H‐A and T400).
0
15
30
45
60
75
90
0 20 40 60 80 100
DOC
CoO
OH
(wt.%
)
0
20
40
60
80
100
120
140
SBE
T (m
2 ·g-1)
CoOOHBET surface area
T400
S200H-A
S500H-A
S400L-B
P400
Figure 3. Variation of CoOOH concentration (wt.%) and BET surface area with DOC for different samples.
The lower than expected surface area of S200H‐A is due to the presence, in this sample,
of a certain amount of l‐CoOOH produced by the partial calcination of bulk Co(OH)2. The
higher than expected surface area for the T400 sample has a somewhat more
complicated explanation. This sample was obtained by the hard silica templating
method. In this method there are fewer silanol groups available for the formation of
h‐CoOOH [6] (and therefore the DOC is higher than that of S400L‐B). However the Co3O4
fraction is mainly formed inside the silica pores and contributes more to the total
specific surface area than the bulk Co3O4 fraction of the samples prepared via method A
(i.e. S500H‐A). This fraction is either partially or totally formed by the migration of cobalt
ions away from the silica aquagel. In order to clarify this point TPR analyses were carried
out to determine whether any of the spinel phase had been formed inside the silica

López et al. Enviado a ChemCatChem 157
50 150 250 350 450 550
Temperature (ºC)
P200CoOOH →Co3O4
Co3O4→CoO
CoO→Co
S300L-A
1. CoOOH →Co3O4
2. Co3O4(ex-CoOOH)→CoO
12
3 4
3. Co3O4(in-SiO2)→CoO4. Co3O4(out-SiO2)→CoO
CoO→Co
S400L-B
1
2
3
4
S200H-A
Nor
mal
ized
H2
cons
umpt
ion
Figure 4. TPR profiles of S400L‐B, S200H‐A, S300L‐A and P200 catalysts.

Artículo V 158
matrix during the precipitation procedure. As can be seen in Figure 4, two zones stand
out in the TPR profiles. According to some literature reports [11, 15, 16] the zone at low
temperature (<270°C) should be attributed to the reduction of CoOOH and Co3O4 to
Co2+, whereas the second zone, in the temperature range 270‐520°C, should be ascribed
to the reduction of Co2+ to Co0.
However, mass balance calculations for the samples whose composition was known (in
terms of CoOOH and Co3O4 content; see Table 1) show that the reduction of the cobalt
species to Co2+ in the first zone is incomplete. A small shoulder at the beginning of the
second zone is situated in a region which is close to that where reduction of bulk Co3O4
to CoO occurs in P200. We may, therefore, assume that this shoulder is produced by the
reduction of bulk Co3O4 (out‐SiO2) to CoO. Hence, by considering the composition of the
catalysts, we can apply a deconvolution procedure that allows the first zone in the TPR
profiles to be thoroughly characterized. In this way the amount of Co3O4 which was
formed inside the silica matrix (in‐SiO2) can be estimated. This is shown in the TPR
profiles of S400L‐B and S200H‐A, the CoOOH contents of which are known (around 80
and 55 wt.%, respectively). The first peak (#1) corresponds to the reduction of CoOOH to
Co3O4. The second peak (#2) represents the reduction of this Co3O4 (ex‐CoOOH) to CoO.
Peak #3 is ascribed to the reduction of the spinel phase formed inside the silica matrix
(in‐SiO2) to CoO, whereas peak #4 represents, as already mentioned, the reduction of
bulk Co3O4 (out‐SiO2) to CoO. The rest of the high temperature zone corresponds to the
reduction of CoO to Co, as is indicated in the figure. This deconvolution procedure was
performed for S200H‐A, S400L‐B (both shown in Figure 4), and S500H‐A. A small
increase in the peak temperatures with the calcination temperature (15‐30°C) was
observed, while the percentage of total Co3O4 that formed inside the silica matrix (in‐
SiO2) was observed to range between 30 and 45%, the rest being bulk Co3O4 reduced
over the temperature range of peak #4. It is worth pointing out that P200 shows a small
peak at low temperature which is ascribed to the reduction of l‐CoOOH. This peak is
much wider than those obtained for the SACOP samples calcined at 300 or 400°C
(Figure 4), but similar to that obtained for the SACOP sample calcined at 200°C
(S200H‐A), possibly due to the higher average particle size in P200 and S200H‐A. This
proves that the CoOOH in the samples calcined at 200°C is the sum of the h‐CoOOH
fraction and a small fraction of l‐CoOOH resulting from the partial calcination of
Co(OH)2.
Close inspection of specific samples by TEM corroborates to some extent the above
picture. Figure 5a shows a TEM image of the S200L‐A catalyst. As can be seen, the

López et al. Enviado a ChemCatChem 159
sample is composed of amorphous agglomerates of nanoparticles (h‐CoOOH and Co3O4
formed inside the silica matrix) and more isolated needle‐shaped nanostructures of
length ~100 nm and width 3‐6 nm (l‐CoOOH and bulk Co3O4 produced by the migration
of cobalt ions out of the silica matrix).
The increase in the calcination temperature applied to the samples prepared by method
A produced catalysts with the same morphology though some agglomeration of nano‐
needles was also observed (Fig. 5b). As expected, the amount of bulk Co3O4 nano‐
needles diminished dramatically in the case of the SACOP B sample (Fig. 5c; S400L‐B). In
the case of the sample synthesized by direct precipitation (Fig. 5c; P400) the amount and
size of bulk Co3O4 nano‐needles increased, some to lengths of almost 200 nm. The
formation of the nano‐needles therefore must have been the result of the free
precipitation of Co(OH)2 into the alkaline solution, unlike the amorphous h‐CoOOH
which was produced after direct interaction between the silica matrix and the cobalt
ions.
40 nm 100 nm
200 nm
b
40 nm
d
a
c
100 nm
40 nm 100 nm
200 nm
b
40 nm
d
a
c
40 nm 100 nm
200 nm
b
40 nm
40 nm40 nm 100 nm100 nm
200 nm
b
40 nm200 nm
b
200 nm
b
40 nm40 nm
d
a
c
100 nm
Figure 5. TEM images of the catalyst: (a): S200L‐A, (b): S400L‐A, (c): S400L‐B, (d): P400.
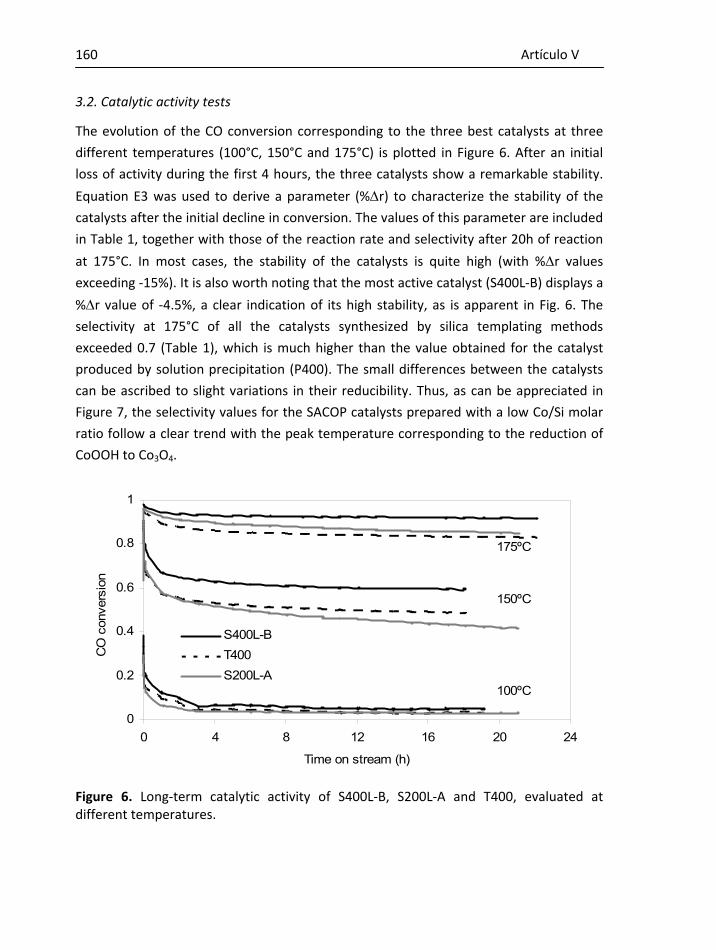
Artículo V 160
3.2. Catalytic activity tests
The evolution of the CO conversion corresponding to the three best catalysts at three
different temperatures (100°C, 150°C and 175°C) is plotted in Figure 6. After an initial
loss of activity during the first 4 hours, the three catalysts show a remarkable stability.
Equation E3 was used to derive a parameter (%Δr) to characterize the stability of the catalysts after the initial decline in conversion. The values of this parameter are included
in Table 1, together with those of the reaction rate and selectivity after 20h of reaction
at 175°C. In most cases, the stability of the catalysts is quite high (with %Δr values exceeding ‐15%). It is also worth noting that the most active catalyst (S400L‐B) displays a
%Δr value of ‐4.5%, a clear indication of its high stability, as is apparent in Fig. 6. The selectivity at 175°C of all the catalysts synthesized by silica templating methods
exceeded 0.7 (Table 1), which is much higher than the value obtained for the catalyst
produced by solution precipitation (P400). The small differences between the catalysts
can be ascribed to slight variations in their reducibility. Thus, as can be appreciated in
Figure 7, the selectivity values for the SACOP catalysts prepared with a low Co/Si molar
ratio follow a clear trend with the peak temperature corresponding to the reduction of
CoOOH to Co3O4.
0
0.2
0.4
0.6
0.8
1
0 4 8 12 16 20 24
Time on stream (h)
CO
con
vers
ion
S400L-BT400S200L-A
175ºC
150ºC
100ºC
Figure 6. Long‐term catalytic activity of S400L‐B, S200L‐A and T400, evaluated at different temperatures.

López et al. Enviado a ChemCatChem 161
0.70
0.75
0.80
0.85
175 180 185 190 195 200 205
Temperature of TPR peak #1 (ºC)
Sel
ectiv
ity
SACOP (A)SACOP (B)
Figure 7. Variation of selectivity with the temperature of the TPR peak # 1 (see Fig. 4) for the SACOP catalysts prepared at Co/Si=0.25.
The SACOP samples prepared by method A presented PROX reaction rates between
2.0×10‐5 and 2.8×10‐5 molCO∙gcat‐1∙s‐1 (Table 1). The samples calcined at 200°C exhibited
the highest reaction rate values, even though their specific surface areas were
significantly lower. As already mentioned, these samples include a small fraction of
l‐CoOOH produced by the partial calcination of bulk Co(OH)2. However, under the
reductive atmosphere of the PROX reaction, the l‐CoOOH fraction (Figure 4; peak #1 in
P200 and part of peak #1 in S200H‐A) is readily transformed into higher surface area
Co3O4. In view of the low degree of crystallinity of these samples (Table 1), this final
transformation may have increased the active surface area of these catalysts to values
of over 90 m2∙g‐1 (see point corresponding to S200H‐A in Fig. 3) which would explain
their high catalytic activity. If these catalysts are excluded, a clear relation between
catalytic activity and the specific surface area of the fresh catalysts is appreciated (Figure
8). The most active catalyst prepared in this work was that obtained by method B and
calcined at 400°C (S400L‐B), its r20h175°C value being 4.3×10‐5 molCO∙gcat‐1∙s‐1. This is also
the catalyst with the highest surface area, which, as mentioned in the preceding section,
is because of its high amorphous h‐CoOOH content resulting from the removal of silica
from cobalt silicate hydroxide, a characteristic feature of the SACOP procedure.

Artículo V 162
0
100
200
300
400
500
0 20 40 60 80 100 120 14
SBET (m2·g-1)
r20h 17
5°C
x107 (m
ol co·g
cat-1
·s-1)
0
Figure 8. Variation of r20h175°C with SBET for all catalysts calcined at temperatures over 200°C.
Structured Co3O4 nanocatalysts recently prepared by hydrothermal synthesis [3] have
proved to be the most active cobalt‐based catalysts for the PROX reaction until now.
Such catalysts have PROX reaction rates of around 1.5×10‐5 molCO∙gcat‐1∙s‐1 at 175°C
(spatial velocity: 33,000 h‐1). However, the cobalt based SACOP samples described in this
work have been shown to be more active in the PROX reaction, even though they were
tested at a higher spatial velocity (~39,000 h‐1). There can be no doubt that SACOP is a
reliable technique for synthesizing highly active, selective and stable cobalt oxide
catalysts for the preferential oxidation of CO.
4. Conclusions
We have analyzed the catalytic activity in the PROX reaction of a series of Co3O4/CoOOH
catalysts, prepared by silica aquagel confined co‐precipitation. The influence of the
precipitation step was studied by using two different methods. Pouring the gel into the
NaOH dissolution (method A) produced cobalt based nanostructures with BET surface
areas between 70 and 90 m2∙g‐1, and a balanced mixture of Co3O4 and CoOOH phases.
Slowly pouring the alkaline solution into the gel (method B) gave rise to a sample
composed mainly of amorphous CoOOH with a high surface area (120 m2∙g‐1). Most of
the Co3O4 formed in the fresh samples via SACOP is low surface area Co3O4 produced by
the migration of cobalt ions outside the silica matrix during precipitation, a phenomenon
that is therefore minimized by applying method B. On the other hand, high surface area
amorphous CoOOH is produced by removing the silica from the cobalt silicate hydroxide

López et al. Enviado a ChemCatChem 163
that is formed during precipitation. Under PROX conditions, CoOOH is gradually reduced
to high surface area Co3O4, which is the main contributor to the catalytic activity of
SACOP catalysts. The catalysts obtained showed excellent stability and selectivity in the
PROX reaction and the highest values of catalytic activity of all the cobalt‐based catalysts
reported in literature to date.
Acknowledgements
Funding through the FICYT Regional Project IB08‐103 is acknowledged. IL thanks the
Ministerio de Ciencia e Innovación of Spain for her FPI grant.
References
[1] I. López, T. Valdés‐Solís, G. Marbán, Int. J. Hydrogen Energy 33 (2008) 197.
[2] G. Marbán, I. López, T. Valdés‐Solís, Appl. Catal. A: Gen. 361 (2009) 160.
[3] G. Marbán, I. López, T. Valdés‐Solís, A. B. Fuertes, Int. J. Hydrogen Energy 33 (2008) 6687.
[4] E. Y. Ko, E. D. Park, K. W. Seo, H. C. Lee, D. Lee, S. Kim, Catal. Today 116 (2006) 377.
[5] Z. Zhao, M. M. Yung, U. S. Ozkan, Cat. Comm. 9 (2008) 1465.
[6] G. Marbán, A. B. Fuertes, T. Valdés‐Solís, Microp. Mesop. Mat. 112 (2008) 291.
[7] I. López, T. Valdés‐Solís, G. Marbán, Microp. Mesop. Mat. 127 (2010) 198.
[8] T. Valdés‐Solís, G. Marban, A. B. Fuertes, Chem. Mater. 17 (2005) 1919.
[9] M. Kruk, M. Jaroniec, A. Sayari, Langmuir 13 (1997) 6267.
[10] W. Liu, M. Flytzani‐Stephanopoulos, J. Catal. 153 (1995) 317.
[11] C. W. Tang, C. B. Wang, S. H. Chien, Thermochim. Acta 473 (2008) 68.
[12] T. Vrålstad, H. K. Magnusson, J. Sjöblom, Microp. Mesop. Mat. 106 (2007) 155.
[13] B. C. Dunn, P. Cole, D. Covington, M. C. Webster, R. J. Pugmire, R. D. Ernst, E. M. Eyring, N. Shah, G. P. Huffman, Appl. Catal. A: Gen. 278 (2005) 233.
[14] T. N. Ramesh, J. Solid State Chem. 183 (2010) 1433.
[15] H. Wang, H. Zhu, Z. Qin, G. Wang, F. Liang, J. Wang, Cat. Comm. 9 (2008) 1487.
[16] L. Xue, C. Zhang, H. He, Y. Teraoka, Appl. Catal. B: Environ. 75 (2007) 167.


165
Resumen artículo VI.
HIGHLY ACTIVE STRUCTURED CATALYST MADE UP OF MESOPOROUS
CO3O4 NANOWIRES SUPPORTED ON A METAL WIRE MESH FOR THE
PREFERENTIAL OXIDATION OF CO
Catalizadores estructurados constituidos por nanoalambres de
Co3O4 mesoporoso soportados en una malla metálica con elevada
actividad en la oxidación preferencial de CO
En este trabajo se analizó la actividad catalítica de óxido de cobalto soportado en una
malla metálica de acero inoxidable en la oxidación preferencial de CO. La característica
más sobresaliente de este material es que, al estar ya inmovilizadas las nanopartículas
en un soporte, se manejan con más facilidad y, dadas las propiedades de la malla, su uso
en un microrreactor produce una caída de presión casi nula además de mejorarse la
transmisión de calor.
Para la obtención de este catalizador se empleó el método de evaporación inducida por
amoniaco, que ya se explicó en la sección Experimental. Este procedimiento permite
obtener tanto la espinela de cobalto soportada en la malla como agregados de
partículas no adheridas a la superficie metálica. La espinela de cobalto soportada
presentó un área superficial de 71 m2∙g‐1 y el rendimiento logrado fue de ∼7 mg de
espinela por cm2 de malla. Mediante microscopía electrónica de barrido se observó que
las partículas soportadas crecían en forma de ramilletes de nanoalambres mesoporosos.
Dichos alambres tienen una longitud de ∼30 μm y una anchura de ∼500 nm. Las
partículas no adheridas presentaron tamaños de cristal de ∼11 nm y un área superficial
de 93.5 m2∙g‐1.
Para evitar la disgregación de las partículas de espinela adheridas a la malla metálica
durante su manipulación, ésta se recubrió con una capa de alcohol polivinílico. Una vez
protegida, se enrolló y se introdujo en un reactor de acero de 1/4´´. El conjunto se lavó
con abundante agua para eliminar la capa protectora. Por último se unieron sendas
tuberías para la entrada y salida de gases. En el caso de las nanopartículas sueltas se
utilizó un reactor de cuarzo de 7 mm de diámetro interno en el que se introdujeron
30 mg de catalizador diluido en 270 mg de SiC, entre dos tapones de fibra de vidrio. Las
condiciones experimentales empleadas fueron las mismas en ambos sistemas de

Artículo VI 166
reacción, a excepción de la masa de catalizador, que en el caso del catalizador soportado
fue función del tamaño de la malla. Por esta razón las velocidades espaciales empleadas
(F0CO/wcat) fueron 6.8×10‐6 mol∙gcat
‐1∙s‐1 para las mallas y 2.2×10‐6 mol∙gcat‐1∙s‐1 para las
partículas sueltas.
La actividad catalítica de la espinela de cobalto soportada en la malla metálica dobló la
actividad obtenida para las partículas sueltas, además de resultar muy estable en el
intervalo de temperaturas analizado (100‐175°C). La formación de metano, que es una
de las desventajas de los catalizadores basados en cobalto, solo se observó en el caso de
la espinela no soportada. La selectividad hacia la formación de metano con respecto a la
producción de CO2 fue del 0.005 %.
La actividad catalítica de estos catalizadores se comparó con la de nanocatalizadores de
espinela de cobalto sintetizados mediante un método estándar de nanomoldeo,
observándose una mayor actividad catalítica en las partículas sintetizadas en este
trabajo, tanto soportadas como en forma nanoparticulada.
La comparación de la actividad de las muestras preparadas para este trabajo con otras
descritas en la literatura, permitió establecer una correlación entre la temperatura de
calcinación y la actividad de las muestras. A menor temperatura de calcinación, más
reducible resultó ser la muestra y por tanto mayor fue su actividad catalítica en la
reacción PROX.

167
Artículo VI
1. Introduction
Hydrogen streams for fuel‐cell powered
cars need to be almost completely free
of CO poisoning [1, 2]. To achieve this
requirement, hydrogen produced by
onboard steam reforming of a liquid fuel
(e.g. methanol) must be subjected to the
preferential (selective) catalytic oxida‐
tion of CO (PROX reaction). Among the
transition metal oxides that are poten‐
tial candidates for use in this process are
cobalt oxide catalysts which are known
to be active catalysts in the low tem‐
perature oxidation of CO [3‐6], although
it is only recently that some authors
have analyzed the performance of these

Artículo VI 168
oxides in the PROX reaction, either
alone [7], supported [8, 9] or accompa‐
nied by other active phases, such as Au
and CeO2 [10, 11]. Some of these cata‐
lysts are described in Table 1. The lim‐
ited number of studies on these cata‐
lysts might be due to their apparently
low activity compared to other more
commonly studied catalysts such as
CuO/CeO2 mixtures [11], or to the ten‐
dency of these catalysts to produce the
undesired methanation of CO, even at
temperatures below 200°C [7]. Recently
Li et al. [12, 13] developed a very simple
synthetic procedure to produce arrays
of Co3O4 nanowires with excellent prop‐
erties for use as anodes in Li ion batter‐
ies. The nanoparticles obtained have a
relatively high surface area (~74 m2/g)
and a mesoporous texture with an aver‐
age pore size of 3.3 nm. The above men‐
tioned authors fabricated the nanoparti‐
cles on different holding media (Ti foils,
Si wafers, etc) with satisfactory adhesion
properties. In principle all these charac‐
teristics make the nanowires suitable
candidates for use in the PROX reaction.
In the present work we employed this
synthetic approach to fabricate arrays of
nanowires on a metal wire mesh for use
as a catalytic filler in a structured micro‐
reactor. In this kind of microreactor,
which is based on similar commercial
systems [14], the metal wire mesh pro‐
vides a high geometric surface area for
holding the Co3O4 nanowires with a neg‐
ligible pressure drop and it also allows a
good heat transfer through the reactor.
The synthetic procedure simultaneously
produces unsupported mesoporous
Co3O4 particles with slightly different
characteristics to those of the supported
system. Both systems (loose particles
and structured microreactor) were
tested in this work in the PROX reaction
at temperatures below 200°C.
2.Experimental
2.1. Catalyst synthesis and fabrication of
the structured reactor
The method used to synthesize the cata‐
lysts is based on that reported by Li et
al. [13]. It is a mild template‐free me‐
thod known as Ammonia‐evaporation‐
induced method. During a standard
preparation 35 g of H2O and 15 g of
30 wt.% ammonia solution were con‐
secutively poured without agitation into
a Teflon vessel containing 10 mmol
Co(NO3)2 and 5 mmol NH4NO3. The mix‐
ture was then magnetically stirred for
half an hour in air. The magnet was then
removed from the vessel and a rectan‐
gular piece (5×3 cm) of stainless steel
wire mesh [29 μm wire diameter and
45 μm screen opening] that had been
previously washed in HNO3 (4M) at 60°C
for several hours was introduced into
the reaction solution. The vessel with
the solution and the mesh was covered
by a watch glass and heated in an oven
at 90°C for 17 hours in order that the

Marbán et al. Int. J. Hydrog. Energy 33 (2008) 6687‐6695 169
nanowires could grow. After the synthe‐
sis the metal wire mesh was taken out of
the solution and the particles remaining
in the solution were filtered and thor‐
oughly washed with deionized water
and vacuum dried at 50°C. The wire
mesh was also washed and dried in the
same manner. Finally the samples were
calcined in air at 250°C for 2 hours. The
acronyms for the loose (unsupported)
Co3O4 particles and the metal wire
mesh‐supported Co3O4 particles will be
LP‐Co3O4 and WMS‐Co3O4, respectively.
For the construction of the microreactor
the wire mesh must be first rolled and
inserted in a stainless steel tube. A priori
it seemed more appropriate to load the
mesh into the tube before proceeding
with the synthesis step. This procedure
prevented the nanowire arrays from
growing on the metallic wire mesh sur‐
face during the synthesis step, probably
due to mass transfer limitations within
the tubes filled with the mesh. For this
reason the unfolded wire mesh was first
coated outside the tube during the syn‐
thesis step and then inserted into the
tube.
In order to fill the stainless steel tube
(¼" i.d., 3 cm height) with the coated
metal wire mesh, it was rolled up tightly
by hand. This operation dislodged many
of the particles from the wire mesh. To
prevent this from occurring the unfolded
mesh was previously immersed in a
2 wt.% aqueous solution of poly(vinyl
alcohol) (9,000‐10,000 g/mol, 80% hy‐
drolyzed), then air blown to eliminate
the excess of solution and vacuum dried
at 40°C for 20 minutes. This procedure
formed a protective coating of poly(vinyl
alcohol) (PVA) on the supported parti‐
cles which allowed the mesh to be rolled
up without undermining the adhesion of
the particles to the metal wires. Once
inside the tube, the mesh was immersed
in a water bath for several hours in or‐
der to remove the water soluble PVA
coating and vacuum dried at 50°C .
For the purpose of comparison a sample
of Co3O4 nanoparticles was prepared by
a silica template method as reported
elsewhere [15]. These particles have a
BET specific surface area of 97 m2/g, a
particle size of 10.4 nm (obtained by
applying Scherrer's equation to the XRD
spectrum) and a very low residual silica
content (2.2 wt.%). The acronym for this
sample is ST‐Co3O4.
2.2. Catalyst characterization
Nitrogen adsorption isotherms were
performed at ‐196°C on a Micromeritics
ASAP 2020 volumetric adsorption sys‐
tem. The BET surface area was deduced
from the isotherm analysis applied in
the relative pressure range of 0.04 to
0.20. The Pore Size Distribution (PSD)
was calculated by means of the Kruk‐
Jaroniec‐Sayari method [16]. Micro‐
scopic images of the samples were ob‐

Artículo VI 170
tained using a Scanning Electron Micro‐
scope (Mod. DSM 942, Zeiss). X‐ray dif‐
fraction (XRD) analysis was carried out in
a Bruker instrument (D8 Advance) oper‐
ating at 40 kV and 40 mA and using
CuKα radiation (λ=0.15406 nm). TPR
analyses were performed in a chemi‐
sorption analyzer (Autochem II)
equipped with a TCD reactor and a Mass
Spectrometer (OmniStar 300O). In a
given analysis approximately 25 mg of
sample was treated with a 50 mL/min
stream of 10%H2 in Argon from 100°C to
850°C at 5°C/min.
2.3. Catalytic activity tests
Catalytic activity tests were performed
on the loose particles by using a quartz
catalyst particles was diluted in 270 mg
of SiC particles and placed in the reactor
between two zones of glass wool. This
ensured plug‐flow and isothermal condi‐
tions reactor of 7 mm internal diameter
inserted into a vertical furnace. 30 mg of
within the bed. At the gas flow rate used
in the experiments (200 mL/min) this
configuration resulted in a high space
velocity of ~55,000h‐1. The bed tempera‐
ture was controlled by means of a ce‐
ramic‐protected thermocouple inserted
into the reactor. The samples were
heated under a He flow at 200°C for
60 min. The reactant stream was then
passed through the catalyst and its cata‐
lytic activity and selectivity were evalu‐
ate at de creasing temperatures from
175°C to 100°C. The reactant gas feed
contained 25 vol.% H2, 0.5 vol.% CO and
0.5 vol.% O2 in He. After removing the
water with Mg(ClO4)2, the product gases
were analyzed for H2, CO, CO2, CH4, O2
and N2 by means of a gas chromato‐
graph (HP 6890) equipped with a TC
detector. The conversion of CO was eva‐
luated as X = 1‐[CO]out/[CO]in and the
selectivity of oxygen to form CO2 was
calculated as:
S = 0.5×([CO]in‐[CO]out)/([O2]in‐[O2]out).
To test the PROX performance of the
structured microreactor (a 3 cm‐high
tube filled with the metal wire mesh‐
supported Co3O4 nanowires) the quartz
reactor was removed and replaced by
the structured unit, which was attached
to the system by means of Swagelock
fittings. Except for the weight of the
catalyst, which was a function of the
wire mesh surface area, all testing con‐
ditions were identical to those used to
test the loose particles (total flow rate
and gas composition). The conditions
employed for both systems are summa‐
rized in Table 1.

Marbán et al. Int. J. Hydrog. Energy 33 (2008) 6687‐6695 171
T S=0.8
(°C) b
114
S max=0.35
at 50°C
140
152
135
S max=0.52
at 140°C
143
140
125
125
r PRO
X ×107
a
1.6
0.2
1.4
4.6
1.7
7.4
c
4.6
7.0
14.6
14.5
P H20 /
P CO
60 80
93.5
50
50
50
P O20 /
P CO0
1.0
1.0
0.5
1.0
1.0
1.5
P CO0
(bar)
1×10
‐2
1×10
‐2
1×10
‐2
5×10
‐3
5×10
‐3
F CO0 /w
cat
[mol/(g∙s)]
1.9×10
‐6
7.4×10
‐6
1.9×10
‐4
2.2×10
‐5 d
6.8×10
‐6 f
S BET
(m2 /g)
193
176
59
38
7 87
n.i.
94
71 e
Active ph
ase
(calcina
tion
)
Co3O
4 (Air‐
500°C‐5h
)
CoO
(H2‐20
0°C)
n.i.
(Air‐450
°C)
Co3O
4 (Air‐
250°C‐3h
)
Co3O
4 (Air‐
250°C‐3h
)
Supp
ort
SiO
2
γ‐Al 2O
4
TiO
2
ZrO
2
CeO
2
‐
SrCO
3
none
metal wire
mesh
Metho
d
IW
P (NaO
H)
EI
NH3‐EIM
Coba
lt con
tent
(wt.%)
10
78.6
(pure oxide)
1.3
73.4
(pure oxide)
18.4 (M
esh=
75wt.%)
Table 1. Prope
rties of cob
alt‐based catalysts synthe
sized by differen
t metho
ds and
a com
parison of th
eir catalytic
activity
during PR
OX.
Ref.
Zhao
et a
l. [8]
Ko et a
l. [7]
Omata et al. [9]
LP‐Co 3O
4
Mon
olith
WMS‐
Co3O
4
n.i. no
t ind
icated
; P: p
recipitatio
n; IW
: incipient wetne
ss; W
I: excess im
pregnatio
n; NH3‐EIM: ammon
ia evapo
ratio
n indu
ced metho
d.
a PR
OX reactio
n rate at 1
00°C (m
olCO∙g
cat‐1∙s
‐1).
b Tempe
rature abo
ve which S>0.8 [w
hen S<0.8 over th
e who
le te
mpe
rature range th
en th
e maxim
un value
of selectivity
(Smax) is
show
n].
c Catalytic
activiy te
st perform
ed in
the presen
ce of 2
×10‐
2 bar H
2O.
d Spatial velocity=55,000 h‐
1 .
e Surface of th
e Co
3O4 p
articles (m
esh exclud
ed).
f The
catalyst w
eight is considered
to be that of C
o 3O
4 (mesch exclude
d). Spatia
l velocity
=33,000 h‐
1 .

Artículo VI 172
To test the PROX performance of the
structured microreactor (a 3 cm‐high
tube filled with the metal wire mesh‐
supported Co3O4 nanowires) the quartz
reactor was removed and replaced by
the structured unit, which was attached
to the system by means of Swagelock
fittings. Except for the weight of the
catalyst, which was a function of the
wire mesh surface area, all testing con‐
ditions were identical to those used to
test the loose particles (total flow rate
and gas composition). The conditions
employed for both systems are summa‐
rized in Table 1.
3. Results and discussion
3.1. Structural properties of the unsup‐
ported mesoporous Co3O4 particles
The synthesis process produced unsup‐
ported particles of a black color, typical
of Co3O4 spinel, with 36‐40% yields of
the cobalt that was originally present in
the precursor solution. XRD analysis
clearly confirms the formation of spinel,
as observed in Fig. 1. The application of
Scherrer's equation to the main peaks of
the XRD spectrum yields a crystal size of
~11 nm. The BET surface area of the
particles was found to be 93.5 m2/g,
higher than that obtained in the original
work by Li et al. [13] (74 m2/g). Calcula‐
tion of the effective particle size from
the BET surface area, assuming spherical
geometry, gives a value of 10.6 nm,
which implies that the porosity of the
microparticles is made up of single
(non‐agglomerated) crystals, thereby
confirming previous results [12]. The
porosity of the particles prepared in this
work is made up of mesopores of a rela‐
tively uniform size within the 2‐7 nm
range. This is illustrated in Fig. 2 which
shows the nitrogen sorption isotherm
and PSD (inset) of this material. The
pore size distribution shows a peak at
4.1 nm which is a bit higher than the
mean mesopore size obtained in the
work by Li et al. [13] (3.3 nm).

Marbán et al. Int. J. Hydrog. Energy 33 (2008) 6687‐6695 173
10 20 30 40 50 60 70
2θ (°)
Inte
nsity
(a.u
.)
(111)
(511)
(422)(400)(222)
(311)
(220) (440)
Fig. 1. XRD spectrum of loose Co3O4 particles. The hkl indexes indicated in the plot corre‐spond to the Co3O4 spinel structure.
0
10
20
30
40
50
60
70
80
0.0 0.2 0.4 0.6 0.8 1.0Relative pressure (p/po)
Ads
orbe
d vo
lum
e, (c
m3
STP/
g)
LP-Co3O4
Co3O4 in WMS-Co3O4
0.0
0.1
0.2
0.3
1 10 100Pore size (D), nm
dV/d
log(
D),
cm3 /g
3.4
nm
4.1 nm
Fig. 2. Nitrogen sorption isotherms and pore size distributions (inset) of loose Co3O4 particles and metal wire mesh supported‐Co3O4 (on a spinel mass basis).
Fig. 3 shows SEM images of the me‐
soporous Co3O4 particles. As can be seen
in Fig. 3A and 3B, the particles have a
size of around 100 μm and are formed
by a nucleus coated with the nanowires.
In Fig. 3A and 3B most of the mass of

Artículo VI 174
each particle seems to be concentrated in the nucleus.
Fig. 3. SEM images of loose (unsupported) Co3O4 particles.
Li et al. [12] obtained a homogeneous
pink solution when mixing the precur‐
sors but they did not report the produc‐
tion of loose particles at the end of the
synthesis. In our case, as we mixed the
precursors, we were careful not to agi‐
tate the mixture. We thus obtained a
reddish solution which readily produced
a black solid of low density. Some of this
floated and was clearly visible during the
magnetic stirring. We believe this pre‐
cipitate to be the origin of the nuclei
that provide additional free surface for
the growth of the nanowires (Fig. 3C and
3D). The XRD results (Fig. 1) show that
these nuclei have the same composition
as the nanowires (Co3O4), and must
therefore be responsible for the at‐
tenuation of the intensity of peak (111),
compared to that of the nanowires [12,

Marbán et al. Int. J. Hydrog. Energy 33 (2008) 6687‐6695 175
13]. What is more, the nuclei must be at
least as porous as the nanowires, oth‐
erwise the specific surface area of the
composite material (nucleus + nano‐
wires) would be much lower than that
reported by Li et al. [13] for the individ‐
ual nanowires. The porosity in the nuclei
might have been created during the
thermal treatment at 90°C via the same
mechanism that produces the porosity
in the nanowires [12]. This mechanism
involves a solid reaction between the
precipitated brucite (β‐Co(OH)2) and the dissolved oxygen in the solution, giving
rise to the Co3O4 spinel and the topotac‐
tic reorganization of the solid material
that originates the mesopores.
The nanowires that have grown on the
surface of the nuclei have diverse orien‐
tations, from random to almost parallel
to the nucleus axis (Fig. 3B and 3C). The
nanowires have a length which varies
from ~10 to ~40 μm (some of the small‐
est wires seem to have been produced
by breakage during handling) and a di‐
ameter of ~500 nm (Fig. 3D). The growth
of the nanowires seems to be a result of
the accumulation of brucite scales of
size ~300 nm (Fig. 3D).
3.2. Structural characteristics of meso‐
porous Co3O4 nanowires supported on a
metal wire mesh
As explained in the experimental sec‐
tion, a clean stainless steel wire mesh
was inserted into the precursor solution
in order to produce simultaneously the
loose Co3O4 particles (see former sec‐
tion) and the metal wire mesh sup‐
ported‐Co3O4 particles. Fig. 4 shows an
image of the metal wire meshes before
(Fig. 4A) and after (Fig. 4B) the synthesis
process. As can be seen the coating of
the metal wire mesh is very homogene‐
ous. A mesh of 5×3 cm2 could hold
124 mg of Co3O4 particles, weighed after
calcination at 250°C. After coating the
mesh with PVA, inserting it into the tube
and washing the PVA coating off, the
final weight of the supported Co3O4 was
found to be ~100 mg, with a yield of
~7 mg/cm2, which compares favorably
with the 2‐3 mg/cm2 obtained on Ti foils
by Li et al. [13], although in their case
the geometric surface area was smaller
than that of the metal wire mesh em‐
ployed in this study.

Artículo VI 176
Fig. 4. Illustration of the process of fabrication of the catalytic microreactor. (A) Metal wire mesh; (B) Metal wire mesh coated with Co3O4 nanowires; C) Reactor scheme and image. 1) Synthesis of Co3O4 nanowires and calcination; 2) Rolling and insertion of the Co3O4 nanowires/ Metal wire mesh composite into a stainless steel tube.
Fig. 2 shows the nitrogen sorption iso‐
therm and the PSD of the Co3O4 particles
in the WMS‐Co3O4 sample (support ex‐
cluded). The specific surface area of the
supported particles was found to be
71 m2/g. As expected, this value is very
similar to that obtained by Li et al. [13]
(74 m2/g). The mean pore diameters for
the WMS‐Co3O4 sample and the sample
prepared by Li et al. are also almost
equal (3.4 vs. 3.3 nm). Fig. 5 presents
SEM images of both the clean metal
wire mesh and the supported Co3O4
particles. As can be seen, the spinel par‐
ticles are arranged in flower‐like
nanowire arrays that are evenly spaced
on the metal wire mesh (Figs. 5A and
5B) in the manner represented by the
equivalent rhomboids shown in Fig.s 5A
and 5B. Each array is composed of
nanowires with a length of ~30 μm
(Fig. 5C) and a width of ~500 nm (Fig.
5D). The nanowires prepared by Li et al.
[12, 13] are hollow, unlike the nano‐
wires grown on the metal wire mesh,
which are solid (inset in Fig. 5D). This
implies that the growing substrate must
have a specific effect on the final ge‐
ometry of the nanowires. As observed in
Fig.s 3D and 5D, the nanowires grown
on the metal surface are identical to
those formed on the surface of the loose
Co3O4 particles.

Marbán et al. Int. J. Hydrog. Energy 33 (2008) 6687‐6695 177
Fig. 5. SEM images of the clean metal wire mesh (A) and the supported Co3O4 particles (B‐C‐D).
No PVA coating was detected by SEM on
the surface of the nanowire arrays,
though its effect was clearly established:
passing one’s finger gently over the un‐
protected metal wire mesh covered with
the spinel had the effect of dislodging
many black particles from its surface.
After the mesh had been protected with
a PVA coating, no particles were dis‐
lodged from the mesh surface. We be‐
lieve that the PVA tends to concentrate
at the junctions of the metal wire mesh
and the nanowire arrays, thus reinforc‐
ing their adhesion, although being in a
blind zone, the PVA remains undetected
by SEM.
3.3. Catalytic activity tests
Fig. 6 shows the catalytic activity results
for the unsupported Co3O4 particles
prepared by the ammonia‐evaporation‐
induced method. The formation of
methane was observed only at the high‐

Artículo VI 178
est temperature (175°C) and then only
to an insignificant extent (the conver‐
sion of CO to CO2 was 0.99 whereas the
conversion of CO to CH4 was just 0.005).
The selectivity was relatively low at
175°C (S~0.5) but increased significantly at temperatures equal to or below
150°C (S>0.7). However, at these tem‐
peratures the stability of the catalyst
was not as good as that achieved at
175°C. Fig. 6 also shows the results ob‐
tained with the catalyst prepared by a
silica template method [15] (ST‐Co3O4)
at 175°C. Although this catalyst has very
similar structural properties to LP‐Co3O4
(97 m2/g vs. 93.5 m2/g and 10.4 nm vs.
11 nm crystal size) its catalytic activity at
175°C is considerably lower, as can be
observed in Fig. 6.
0.0
0.2
0.4
0.6
0.8
1.0
CO
con
vers
ion,
X
175°C 150°
C
125°C 100°
C
LP-Co3O4
ST-Co3O4
0.0
0.2
0.4
0.6
0.8
1.0
0 10 20 30 40
time on stream (h)
CO
sel
ectiv
ity, S
175°C 150°
C
125°C 100°
50
C
LP-Co3O4
ST-Co3O4
Fig. 6. Evolution of the CO conversion and selectivity of the LP‐Co3O4 catalyst at decreas‐ing temperatures and of the ST‐Co3O4 catalyst at 175°C for long‐run experiments.
TPR analyses were performed on both
samples in order to determine the rea‐
son for the difference in catalytic activ‐
ity. Fig. 7 shows the H2‐TPR profiles for
LP‐Co3O4 and ST‐Co3O4. Two peaks are
clearly observed in the TPR profile of LP‐
Co3O4 (α and β). The same peaks are
observed for the ST‐Co3O4 sample,
though they have shifted ~30°C to high‐er temperatures and the spectrum now

Marbán et al. Int. J. Hydrog. Energy 33 (2008) 6687‐6695 179
displays a broad feature from ~350 to ~500°C (maximum at 420°C). Peak α is attributed to the Co3+ → Co2+ transition,
whereas peak β and the broad high temperature feature are attributed to
the reduction of Co2+ to Co0 [10, 17].
100 150 200 250 300 350 400 450 500 550 600
261°C (α)324°C (β)
420°C
ST-Co3O4
232°C (α)
295°C (β)LP-Co3O4
Nor
mal
ized
H2
cons
umpt
ion
Temperature, °C
150
250
350
450
0 200 400 600Calcination temperature (°C)
Pea
k te
mpe
ratu
re (°
C
Polynomial fits
Peak β
Peak αKo et al., 2006
LP-Co3O4
ST-Co3O4
Wang et al., 2008
Pea
k te
mpe
ratu
re(°
C)
Calcination temperature (°C)
100 150 200 250 300 350 400 450 500 550 600
261°C (α)324°C (β)
420°C
ST-Co3O4
232°C (α)
295°C (β)LP-Co3O4
Nor
mal
ized
H2
cons
umpt
ion
Temperature, °C
100 150 200 250 300 350 400 450 500 550 600
261°C (α)324°C (β)
420°C
ST-Co3O4
232°C (α)
295°C (β)LP-Co3O4
Nor
mal
ized
H2
cons
umpt
ion
Temperature, °C
150
250
350
450
0 200 400 600Calcination temperature (°C)
Pea
k te
mpe
ratu
re (°
C
Polynomial fits
Peak β
Peak αKo et al., 2006
LP-Co3O4
ST-Co3O4
Wang et al., 2008
Pea
k te
mpe
ratu
re(°
C)
Calcination temperature (°C)
Fig. 7. H2‐TPR profiles of the LP‐Co3O4 and ST‐Co3O4 catalysts. In the inset, effect of the calcination temperature on the temperature of the reduction peaks for the LP‐Co3O4 and ST‐Co3O4 catalysts and two selected Co3O4 samples described in the literature [7, 10].
The same peaks were also observed by
Ko et al. [7], but in their catalyst the low
temperature peaks (α and β) were situ‐ated at 207 and 257°C, well below those
obtained with our catalyst (232 and
295°C; Fig. 7). The Co3O4 particles syn‐
thesized by Ko et al. [7] by precipitation
with NaOH (1 M) at pH=8, were not cal‐
cined but aged at 80°C (1 h) and dried at
100°C (overnight). A similar profile to
that of the upper plot in Fig. 7 was ob‐
tained by Wang et al. [10] for Co3O4

Artículo VI 180
particles prepared by sol‐gel precipita‐
tion followed by calcination at 500°C
(18.3 nm crystal size), but the two char‐
acteristic peaks α and β have shifted to higher temperatures (315 and 425°C).
Thus, there seems to be a connection
between the calcination temperature
and the reducibility of the catalyst,
which can be clearly observed in the
inset in Fig. 7.
Among the catalysts used to construct
this plot, LT‐Co3O4, ST‐Co3O4 and the
catalyst of Ko et al. [7] were also tested
in the PROX reaction, revealing the fol‐
lowing order of activity: Ko et al. [7] >
LT‐Co3O4 > ST‐Co3O4 (Table 1 and Fig. 6).
Although the active phase of the catalyst
of Ko at al. [7] is CoO (the catalyst was
pre‐reduced in H2 at 200°C) there is a
clear relation between the catalytic ac‐
tivity and the reducibility of the sample,
which is in turn dependent on the calci‐
nation temperature.
0.0
0.2
0.4
0.6
0.8
1.0
CO
con
vers
ion,
X
175°C 150°C 125°
C
100°C 175°
C
= 1.0P0
O2
P0CO
0.0
0.2
0.4
0.6
0.8
0 10 20 30 40 50 60
time on stream (h)
CO
sel
ectiv
ity, S
175°C 150°C 125°
C
100°C 175°
C
175°C 150°
C100°C12
5°C
175°
C
= 1.5P0
O2
P0CO
0 8 16 24 32
time on stream (h)
175°C 150°
C
100°C125°
C
175°
C
Fig. 8. Evolution of the CO conversion and selectivity of the microreactor filled with the wire mesh supported Co3O4 particles during a long run experiment at decreasing tem‐peratures and at P0O2/P
0CO = 1 (left) and P
0O2/P
0CO = 1.5 (right).
Fig. 4 shows an illustration of the fabri‐
cation process of the catalytic microre‐
actor (photograph in Fig. 4C). As men‐
tioned above, the catalyst was fabri‐

Marbán et al. Int. J. Hydrog. Energy 33 (2008) 6687‐6695 181
cated by filling the ¼" stainless steel
tube with a roll of the coated metal wire
mesh (WMS‐Co3O4). Fig. 8 shows the
catalytic activity results obtained with
the microreactor (WMS‐Co3O4). Com‐
pared to the unsupported particles (Fig.
6) the structured catalyst displays a
lower activity at high temperatures but
a higher performance at low tempera‐
tures. This can be more easily appreci‐
ated from the Arrhenius plot in Fig. 9.
1.0E-07
1.0E-06
1.0E-05
1.0E-04
0.0018 0.002 0.0022 0.0024 0.0026 0.0028 0.003
1/T (K-1)
r PR
OX (
mol
CO·g
cat-1
·s-1)
LP-Co3O4 (P0O2/P
0CO=1.0)
WMS-Co3O4 (P0O2/P
0CO=1.0)
WMS-Co3O4 (P0O2/P
0CO=1.5)
X close to 1X < 0.8
Fig. 9. Arrhenius plots of the PROX reaction rate (rPROX) evaluated for the LP‐Co3O4 and WMS‐Co3O4 samples.
The lower activity at high temperatures
is partially explained by the limited
availability of oxygen. In fact, at 175°C
and P0O2/P0CO = 1 there is not enough
oxygen to burn all the CO, because of
the high catalyst mass and its low selec‐
tivity at this temperature (S~0.45). When the partial pressure of O2 was
increased to P0O2/P0CO = 1.5 there was a
clear increase in CO conversion at 175°C,
although this failed to reach the value of
1 (Fig. 8), possibly due to a small bypass‐
ing through the central hole of the rolled
wire mesh. Thus the points of Fig. 9 situ‐
ated in the zone of conversion close to 1
cause an unnatural change in the slope
of the Arrhenius curve because they are
biased by the high catalyst mass em‐
ployed in the analyses, whereas the
points situated in the zone of X<0.8 ex‐
press the intrinsic activity of the catalyst
more accurately. Table 1 shows that the
WMS‐Co3O4 sample is the most active
catalyst out of all those listed. Its activity
is, in general, one order of magnitude
higher than that of the catalysts pre‐
pared by Zhao et al. [8] and 2‐3 times
higher than that of the catalysts pre‐

Artículo VI 182
pared by Ko et al. [7] and by Omata et
al. [9]. However, the most remarkable
feature of the structured catalyst is its
stability for reaction periods of several
hours under most of the conditions
studied in this work, as can be clearly
observed in Fig. 8. The catalyst was sub‐
jected to the PROX reaction at decreas‐
ing temperatures from 175°C. After‐
wards, when the temperature was in‐
creased again to 175°C, the initial con‐
version was recovered. In conclusion,
the structured catalyst demonstrated an
unprecedented catalytic activity during
the PROX reaction together with a high
stability.
4. Conclusions
A novel and simple synthetic procedure
for preparing particulate and metal wire
mesh supported mesoporous Co3O4
nanoparticles by a simple one‐step pro‐
cedure is presented. The unsupported
mesoporous Co3O4 particles are formed
by a nucleus coated with solid nano‐
wires. These particles exhibit a catalytic
activity in the PROX reaction similar to
that of the most active Co3O4 catalysts
reported in the literature, although at
temperatures below 175°C they experi‐
ence some deactivation. A comparison
with other Co3O4 particles prepared at
different calcination temperatures
showed that there is an inverse relation‐
ship between the calcination tempera‐
ture and the reducibility of the spinel,
which in turn seems to be proportional
to the catalytic activity of the particles.
The structured catalytic system made up
of mesoporous Co3O4 nanowires sup‐
ported over a metal wire‐mesh exhibits
several important properties: a) a high
heat exchange rate and a low pressure
drop, b) a remarkable stability over the
whole temperature range analyzed
(100‐175°C) and c) a good catalytic activ‐
ity which doubles that of the unsup‐
ported Co3O4 particles.
Acknowledgements
Funding through the Spanish National
Project MAT2005‐00262 and the FICYT
Regional Project (IB05‐001) is acknowl‐
edged. IL thanks the Ministerio de Cien‐
cia e Innovación of Spain for her FPI
grant and TVS thanks the Junta General
del Principado de Asturias for the award
of a Clarín postdoctoral contract.
Reference [1] G. Marbán, T. Valdés‐Solís, Int. J. Hydrogen Energy 32 (2007) 1625.
[2] G. Marbán, T. Valdés‐Solís, Int. J. Hydrogen Energy 33 (2008) 927.
[3] D. Perti, R. L. Kabel, AIChE J. 31 (1985) 1420.

Marbán et al. Int. J. Hydrog. Energy 33 (2008) 6687‐6695 183
[4] E. Gulari, C. Güldür, S. Srivannavit, S. Osuwan, Appl. Catal. A: Gen. 182 (1999) 147.
[5] J. Jansson, A. Palmqvist, E. Fridell, M. Skoglundh, L. Österlund, P. Thormählen, V. Langer, J. Catal. 211 (2002) 387.
[6] J. Jansson, M. Skoglundh, E. Fridell, P. Thormählen, Top. Catal. 16/17 (2001) 385.
[7] E. Y. Ko, E. D. Park, K. W. Seo, H. C. Lee, D. Lee, S. Kim, Catal. Today 116 (2006) 377.
[8] Z. Zhao, M. M. Yung, U. S. Ozkan, Cat. Comm. 9 (2008) 1465.
[9] K. Omata, Y. Kobayashi, M. Yamada, Catal. Today 117 (2006) 311.
[10] H. Wang, H. Zhu, Z. Qin, G. Wang, F. Liang, J. Wang, Cat. Comm. 9 (2008) 1487.
[11] G. Marbán, A. B. Fuertes, Appl. Catal. B: Environ. 57 (2005) 43.
[12] Y. Li, B. Tan, Y. Wu, J. Am. Chem. Soc. 128 (2006) 14258.
[13] Y. Li, B. Tan, Y. Wu, Nano Lett. 8 (2008) 265.
[14] M. Lyubovsky, S. Roychoudhury, Appl. Catal. B: Environ. 54 (2004) 203.
[15] T. Valdés‐Solís, G. Marban, A. B. Fuertes, Chem. Mater. 17 (2005) 1919.
[16] M. Kruk, M. Jaroniec, A. Sayari, Langmuir 13 (1997) 6267.
[17] L. Xue, C. Zhang, H. He, Y. Teraoka, Appl. Catal. B: Environ. 75 (2007) 167.


185
Conclusiones generales
En la presente memoria se han sintetizado y analizado distintos catalizadores en la
reacción de oxidación preferencial de CO en presencia de elevadas concentraciones de
hidrógeno. A continuación se muestran las principales conclusiones derivadas de este
trabajo.
• Se ha analizado la actividad catalítica en la oxidación preferencial de CO de
catalizadores basados en óxido de cobre descritos en la literatura. Se ha
comprobado que los catalizadores más activos son aquellos que incluyen óxido
de cerio en su formulación. El método más efectivo para la síntesis de
catalizadores activos se basa en el método sol‐gel con la adición de agentes
quelantes.
• El método de co‐precipitación confinada en hidrogeles de sílice o SACOP es una
ruta sintética que permite obtener nanoestructuras con elevadas áreas
superficiales debido al colapso de la sílice sobre los hidróxidos metálicos durante
la etapa de precipitación. Este método ha sido utilizado con éxito para la síntesis
tanto de nanoestructuras de CeO2 como de nanocatalizadores CuO/CeO2 y
CuMn2O4 que muestran una elevada actividad en la reacción PROX, si bien están
sujetos a cierto grado de desactivación cuyas causas han sido estudiadas en
profundidad.
• Los nanocatalizadores CuOx/CeO2, a temperaturas inferiores a 250°C se
desactivan principalmente debido a la formación de carbonatos superficiales.
Además de este mecanismo se produce la sinterización parcial de las especies
Cu2+ disperso para formar clústeres de CuO. El aumento de la temperatura
incrementa la importancia de la desactivación producida por la sinterización de
las especies de cobre, a la vez que disminuye la formación de carbonatos.
• La desactivación de la espinela de cobre y manganeso, CuMn2O4, puede ser
atribuida a la progresiva reducción del cobre en la superficie del catalizador por
la acción del CO.
Conclusiones 186
• El método SACOP permite obtener los catalizadores basados en cobalto más
activos para la reacción PROX, con una notable selectividad y gran estabilidad.
Este hecho se debe a que el método SACOP produce nanocatalizadores con una
elevada concentración de CoOOH de alta superficie que en condiciones PROX se
transforma en Co3O4 de gran actividad catalítica.
• Se han sintetizado nanocatalizadores de espinela de cobalto soportados en
mallas de acero inoxidable mediante el método de evaporación inducida de
amoniaco. La fase activa de estos nanocatalizadores posee una estructura de
nanoalambres de espinela de cobalto (SBET=71 m2∙g‐1), con una longitud de
∼30 μm y una anchura de ∼500 nm. Estos catalizadores estructurados presentan
actividades catalíticas elevadas y una notable estabilidad en los ensayos de larga
duración en la reacción PROX.

187
Bibliografía [1] G.Marbán, T.Valdés‐Solís. Towards the Hydrogen Economy?, Int. J. Hydrogen
Energy 32 (2007) 1625‐1637.
[2] G.San Miguel, J.Dufour, J.A.Calles, J.A.Botas. La economía del hidrógeno ‐ una visión global sobre la revolución energética del siglo XXI. 2. Aplicaciones convencionales del hidrógeno y pilas de combustible, Acta Científica y Tecnológica. Revista de la Asociación Española de Científicos 10 (2006) 21‐27.
[3] L.Schlapbach, A.Zuttel. Hydrogen‐storage materials for mobile applications, Nature 414 (2001) 353‐358.
[4] A.Sartbaeva, V.L.Kuznetsov, S.A.Wells, P.P.Edwards. Hydrogen nexus in a sustainable energy future, Energy & Environmental Science 1 (2008) 79‐85.
[5] M.Sevilla, N.Alam, R.Mokaya. Enhancement of Hydrogen Storage Capacity of Zeolite‐Templated Carbons by Chemical Activation, The Journal of Physical Chemistry C 114 (2010) 11314‐11319.
[6] Z.Yang, Y.Xia, R.Mokaya. Enhanced Hydrogen Storage Capacity of High Surface Area Zeolite‐like Carbon Materials, J. Am. Chem. Soc. 129 (2007) 1673‐1679.
[7] E.Tzimas, C.Filiou, S.D.Peteves, J.‐B.Veyret. Hydrogen storage: state‐of‐the‐art and future perspective, http://setris. jrc. ec. europa. eu/docs/files/H2 storage report. pdf (2010).
[8] J.M.Thomas, W.J.Thomas. Principles and practice of heterogeneous catalysis, Wiley‐VCH, 1997.
[9] O.Iyoha, R.Enick, R.Killmeyer, B.Howard, B.Morreale, M.Ciocco. Wall‐catalyzed water‐gas shift reaction in multi‐tubular Pd and 80wt%Pd‐20wt%Cu membrane reactors at 1173 K, J. Membr. Sci. 298 (2007) 14‐23.
[10] G.Marbán, A.B.Fuertes. Highly active and selective CuOx/CeO2 catalyst prepared by a single‐step citrates method for preferential oxidation of carbon monoxide, Appl. Catal. B: Environ. 57 (2005) 43‐53.
[11] M.J.Kahlich, H.A.Gasteiger, R.J.Behm. Kinetics of the selective CO oxidation in H2‐rich gas on Pt/Al2O3, J. Catal. 171 (1997) 93‐105.
[12] F.Mariño, C.Descorme, D.Duprez. Noble metal catalysts for the preferential oxidation of carbon monoxide in the presence of hydrogen (PROX), Appl. Catal. B: Environ. 54 (2004) 59‐66.

Bibliografía 188
[13] M.Watanabe, H.Uchida, K.Ohkubo, H.Igarashi. Hydrogen purification for fuel cells: selective oxidation of carbon monoxide on Pt‐Fe/zeolite catalysts, Appl. Catal. B: Environ. 46 (2003) 595‐600.
[14] R.J.H.Grisel, C.J.Weststrate, A.Goossens, M.W.J.Crajé, A.M.van der Kraan, B.E.Nieuwenhuys. Oxidation of CO over Au/MOx/Al2O3 multi‐component catalysts in a hydrogen‐rich environment, Catal. Today 72 (2002) 123‐132.
[15] W.Liu, M.Flytzani‐Stephanopoulos. Total oxidation of carbon monoxide and methane over transition metal‐fluorite oxide composite catalysts II. Catalyst characterization and reaction kinetics, J. Catal. 153 (1995) 317‐332.
[16] Z.Liu, R.Zhou, X.Zheng. Comparative study of different methods of preparing CuO‐CeO2 catalysts for preferential oxidation of CO in excess hydrogen, J. Mol. Catal. A‐Chem. 267 (2006) 137‐142.
[17] D.H.Kim, J.A.Cha. A CuO‐CeO2 mixed‐oxide catalyst for CO clean‐up by selective oxidation in hydrogen‐rich mixtures, Cat. Lett. 86 (2003) 107‐112.
[18] D.Gamarra, A.Hornés, Zs.Koppany, Z.Schay, G.Munuera, J.Soria, A.Martínez‐Arias. Catalytic processes during preferential oxidation of CO in H2‐rich streams over catalysts based on copper‐ceria, J. Power Sources 169 (2007) 110‐116.
[19] G.Avgouropoulos, T.Ioannides, C.Papadopoulou, J.Batista, S.Hocevar, H.K.Matralis. A comparative study of Pt/γ‐Al2O3, Au/α‐Fe2O3 and CuO‐CeO2 catalysts for the selective oxidation of carbon monoxide in excess hydrogen, Catal. Today 75 (2002) 157‐167.
[20] M.Manzoli, R.Di Monte, F.Boccuzzi, S.Coluccia, J.Kaspar. CO oxidation over CuOx‐CeO2‐ZrO2 catalysts: Transient behaviour and role of copper clusters in contact with ceria, Appl. Catal. B: Environ. 61 (2005) 192‐205.
[21] T.Valdés‐Solís, G.Marbán, A.B.Fuertes. Nanosized catalysts for the production of hydrogen by methanol steam reforming, Catal. Today 116 (2006) 354‐360.
[22] M.Kramer, T.Schmidt, K.Stowe, W.F.Maier. Structural and catalytic aspects of sol‐gel derived copper manganese oxides as low‐temperature CO oxidation catalyst, Appl. Catal. A: Gen. 302 (2006) 257‐263.
[23] S.A.Makhlouf. Magnetic properties of Co3O4 nanoparticles, J. Magn. Magn. Mater. 246 (2002) 184‐190.

189
[24] H.Yamaura, K.Moriya, N.Miura, N.Yamazoe. Mechanism of sensitivity promotion in CO sensor using indium oxide and cobalt oxide, Sensor Actuat. B‐Chem. 65 (2000) 39‐41.
[25] J.Jansson, A.Palmqvist, E.Fridell, M.Skoglundh, L.Österlund, P.Thormählen, V.Langer. On the catalytic activity of Co3O4 in Low‐temperature CO oxidation, J. Catal. 211 (2002) 387‐397.
[26] F.Grillo, M.M.Natile, A.Glisenti. Low temperature oxidation of carbon monoxide: the influence of water and oxygen on the reactivity of a Co3O4 powder surface, Appl. Catal. B: Environ. 48 (2004) 267‐274.
[27] E.Y.Ko, E.D.Park, K.W.Seo, H.C.Lee, D.Lee, S.Kim. A comparative study of catalysts for the preferential CO oxidation in excess hydrogen, Catal. Today 116 (2006) 377‐383.
[28] K.Omata, Y.Kobayashi, M.Yamada. Artificial neural network‐aided design of Co/SrCO3 catalyst for preferential oxidation of CO in excess hydrogen, Catal. Today 117 (2006) 311‐315.
[29] Z.Zhao, M.M.Yung, U.S.Ozkan. Effect of support on the preferential oxidation of CO over cobalt catalysts, Cat. Comm. 9 (2008) 1465‐1471.
[30] R.J.Wu, J.G.Wu, T.K.Tsai, C.T.Yeh. Use of cobalt oxide CoOOH in a carbon monoxide sensor operating at low temperatures, Sensor Actuat. B‐Chem. 120 (2006) 104‐109.
[31] X.Li, T.Xia, H.Dong, Y.Wei. Study on the reduction behavior of CoOOH during the storage of nickel/metal‐hydride battery, Mater. Chem. Phys. 100 (2006) 486‐489.
[32] G.A.Somorjai, Y.G.Borodko. Research in nanosciences ‐ Great opportunity for catalysis science, Catal. Lett 76 (2001) 1‐5.
[33] J.Livage, M.Henry, C.Sanchez. Sol‐Gel Chemistry of Transition‐Metal Oxides, Prog. Solid State Chem. 18 (1988) 259‐341.
[34] J.Agrell, G.Germani, S.G.Jaras, M.Boutonnet. Production of hydrogen by partial oxidation of methanol over ZnO‐supported palladium catalysts prepared by microemulsion technique, Appl. Catal. A: Gen. 242 (2003) 233‐245.
[35] S.Zhu, H.Zhou, M.Hibino, I.Honma, M.Ichihara. Synthesis of MnO2 Nanoparticles Confined in Ordered Mesoporous Carbon Using a Sonochemical Method, Adv. Funct. Mater. 15 (2005) 381‐386.

Bibliografía 190
[36] G.Marbán, A.B.Fuertes, T.Valdés‐Solís. Templated synthesis of high surface area inorganic oxides by silica aquagel‐confined co‐precipitation, Microp. Mesop. Mat. 112 (2008) 291‐298.
[37] A.B.Fuertes. Low‐cost synthetic route to mesoporous carbons with narrow pore size distributions and tunable porosity through silica xerogel templates, Chem. Mater. 16 (2004) 449‐455.
[38] M.Kurmoo, J.L.Rehspringer, A.Hutlova, C.D'Orléans, S.Vilminot, C.Estournès, D.Niznansky. Formation of nanoparticles of ε‐Fe2O3 from yttrium iron garnet in a silica matrix: An unusually hard magnet with a morin‐like transition below 150 K, Chem. Mater. 17 (2005) 1106‐1114.
[39] E.L.Pires, U.Arnold, U.Schuchardt. Amorphous silicates containing cerium: selective catalysts for the oxidation of cyclohexane, J. Mol. Catal. A‐Chem. 169 (2001) 157‐161.
[40] G.Marbán, T.Valdés‐Solís, A.B.Fuertes. High surface area CuMn2O4 prepared by silica aquagel‐confined co‐precipitation. Characterization and testing in steam reforming of methanol., Cat. Lett. 118 (2007) 8‐14.
[41] C.Galletti, S.Specchia, G.Saracco, V.Specchia. Development of a lab scale catalytic metal plate‐channels reactor for CO preferential oxidation, Chem. Eng. J. 154 (2009) 246‐250.
[42] P.Chin, X.Sun, G.W.Roberts, J.J.Spivey. Preferential oxidation of carbon monoxide with iron‐promoted platinum catalysts supported on metal foams, Appl. Catal. A: Gen. 302 (2006) 22‐31.
[43] C.Gu, S.Lu, J.Miao, Y.Liu, Y.Wang. Meso‐macroporous monolithic CuO‐CeO2/γ/α‐Al2O3 catalysts for CO preferential oxidation in hydrogen‐rich gas: Effect of loading methods, Int. J. Hydrogen Energy 35 (2010) 6113‐6122.
[44] Y.Li, B.Tan, Y.Wu. Freestanding Mesoporous Quasi‐Single‐Crystalline Co3O4 Nanowire Arrays, J. Am. Chem. Soc. 128 (2006) 14258‐14259.
[45] Y.Li, B.Tan, Y.Wu. Mesoporous Co3O4 nanowire arrays for lithium ion batteries with high capacity and rate capability, Nano Lett. 8 (2008) 265‐270.
[46] G.Marbán, A.López, I.López, T.Valdés‐Solís. A highly active, selective and stable copper/cobalt‐structured nanocatalyst for methanol decomposition, Appl. Catal. B: Environ. 99 (2010) 257‐264.

191
[47] P.Scherrer. Bestimmung der Größe und der inneren Struktur von Kolloidteilchen mittels Röntgenstrahlen, Göttinger Nachrichten 2 (1918) 98‐100.
[48] M.Kruk, M.Jaroniec, A.Sayari. Application of large pore MCM‐41 molecular sieves to improve pore size analysis using nitrogen adsorption measurements, Langmuir 13 (1997) 6267‐6273.
[49] G.Sedmak, S.Hocevar, J.Levec. Kinetics of selective CO oxidation in excess of H2 over the nanostructured Cu0.1Ce0.9O2‐y catalyst, J. Catal. 213 (2003) 135‐150.

Instituto Nacional d2010
del Carbón