liquidity risk and stock return in latin american …
TRANSCRIPT
UPB - INVESTIGACIÓN & DESARROLLO, Vol. 20, No. 2: 57 – 74 (2020) 57 DOI: 10.23881/idupbo.020.2-4e
INVESTIGACIÓN & DESARROLLO, Vol. 20, No. 2: 57 – 74 (2020) ISSN 2518-4431
LIQUIDITY RISK AND STOCK RETURN IN LATIN AMERICAN EMERGING MARKETS
RIESGO DE LIQUIDEZ Y RENTABILIDAD DE LAS ACCIONES EN LOS MERCADOS EMERGENTES DE AMÉRICA LATINA
Francisco Javier Vasquez-Tejos1 y Prosper Lamothe Fernandez2
1Escuela de Negocios, Universidad Mayor de Chile 2Departamento de Financiación e Investigación Comercial, Universidad Autónoma de Madrid
[email protected] (Recibido el 14 de septiembre 2020, aceptado para publicación el 26 de noviembre 2020)
ABSTRACT
This study analyzes the impact of liquidity risk on stock returns in four Latin American markets (Chile, Columbia, Mexico, and Peru) between January 1998 and July 2018. Several previous studies have focused on measuring this effect in developed markets and a few in emerging markets, such as Latin American stock markets. In the present study, five liquidity risk measures with a multiple regression model; three have been widely used in previous studies and two were from recently proposed measures. We found evidence of an inverse relationship between liquidity risk and stock performance, which indicates that there exist rewards for investing in less liquid positions and therefore originate new investment strategies. In general, lesser developed or smaller markets have a disadvantage for this type of study, due to lack of access to historical information on stock purchase and sales.
Keywords: Liquidity Risk, Stock Returns, Emerging Markets, Latin America, Liquidity Risk Measurements. RESUMEN
Este estudio analiza el impacto del riesgo de liquidez y la rentabilidad de las acciones en cuatro mercados latinoamericanos (Chile, Colombia, México y Perú), entre enero de 1998 y julio de 2018. Varios estudios anteriores se han centrado en la medición de este efecto en los mercados desarrollados y unos pocos en los mercados emergentes, como lo son mercados de valores de América Latina. En el presente estudio se utiliza un modelo de regresión, el cual incorpora cinco medidas de riesgo de liquidez; tres se han utilizado ampliamente en estudios anteriores y dos proceden de medidas propuestas recientemente. Se encontraron pruebas de una relación inversa entre el riesgo de liquidez y el rendimiento de las acciones, lo que indica que existen recompensas por invertir en posiciones menos líquidas y por tanto originar nuevas estrategias de inversión. En general, los mercados menos desarrollados o más pequeños tienen una desventaja para este tipo de estudio, debido a la falta de acceso a la información histórica sobre la compra y venta de acciones.
Palabras Clave: Riesgo de Liquidez, Rentabilidad de las Acciones, Mercados Emergentes, América Latina, Medidas del Riesgo de Liquidez.
1. INTRODUCTION
Liquidity risk has become an important element for investors since it allows them to assess the speed with which an investment can be offered to the market and convert into cash, as well as the cost associated with accelerating this transition. The first liquid market concepts were introduced by Black [1], who indicated that a stock market should contain constant supply and demand of shares, minor differences in the range of prices (Bid-ask spreads), and sale and/or purchase of large quantities of shares with a low impact on the price. Another specification of a liquid market was given by Kyle [2], who maintains that the market must be in a constant equilibrium of auctions, which must contain the possibility of taking and closing positions in a short time, market depth and price resilience. Subsequently, based on the seminal article by Amihud and Mendelson [3] on the relationship between stock return and liquidity risk, several studies were initiated in developed markets on this subject, and more recently in emerging markets as well. The importance for investors of a liquid market has become more relevant since the crisis of 2008, since these markets present a necessary condition for efficiency [4].
Financial and liquidity risks are defined respectively as losses produced by adverse movements in market prices, and as the cost or inopportunity of undoing a position [5]. Three other definitions of liquidity risk can be highlighted: i) the ability to convert shares into cash (or vice versa) with the lowest transaction cost [6]. ii) the impossibility of being able to undo a position or investment at a competitive market price and with sufficient speed after the decision was made [7]. iii) the risk involved when selling the assets to meet financial obligations, which are minor and may be caused by various factors, such as the ability to make certain assets liquid or turn them into cash, delays in the sale process or having to accept prices below the market value of said assets [8].

VASQUEZ-TEJOS AND LAMOTHE
58 UPB - INVESTIGACIÓN & DESARROLLO, Vol. 20, No. 2: 57 – 74 (2020)
On the other hand, six factors are identified that influence the liquidity of shares [9]: transaction costs, asymmetric information, demand, financial market development, investment horizon, and dividend payment date. Many of these factors leave their mark on historical transaction data, such as return, volume, number of businesses, and transaction days. Historical transaction data is easier to obtain in emerging markets, which is why this study focuses on them.
Therefore, the questions posed by this study (hypothesis) are the following: Do the different liquidity risk indicators measure their relationship with the return of shares the same way in different Latin American countries? What is the relationship between liquidity and return? This investigation is organized as follows: in section 2, there is a bibliographic review including emerging and developed markets; in section 3, the data and methodology; in section 4, the results; and finally, in section 5, the conclusions.
2. BIBLIOGRAPHIC REVIEW
2.1 Studies focused on an emerging market from a single country
Using the liquidity adjusted capital asset pricing model (LCAPM) developed by Acharya and Pederson [10] in the Portuguese market, authors Miralles, Miralles, and Oliveira [11] found evidence that the most liquid assets, such as those with higher transaction levels, showed higher returns. The latter is contrary to evidence that has been found in other markets, i.e., a negative liquidity risk premium. In the Jordanian market, a study by Bataineh, Mohamad Ali and Hanna Alrabadi [12] found that the Amihud illiquidity measure [13] and the turnover ratio proposed by Datar, Naik, and Radcliffe [14] are the methods that produce the best results and provide evidence of an effect of liquidity on shareholder returns.Another study by Leirvik, Fiskerstrand, & Fjellvikas [15] found no evidence of a relationship between stock returns and liquidity in the Norwegian market. The authors used three liquidity measures, including the turnover rate, and none yielded significant results.
A study of the Indian market in the year 2016 on trading activity and liquidity risk concluded that there is a liquidity risk premium in the Indian stock market [16].
Studies performed on the Chilean market have found evidence of a positive relationship between liquidity risk and stock returns in the period from 2000-2008 [17] and during the period from 2000-2018 [18].
2.2 Studies that focus on emerging markets in a group of countries
The work of Gniadkowska-Szymańska [9] uses a methodology similar to what was described by Datar, Naik, and Radcliffe [14], but modified for emerging markets, using monthly returns from companies listed on the Polish and Baltic stock exchanges between the periods of January 2006 and October 2015, and found significance between the number of transactions and stock returns, but not with the turnover ratio. In another study of the seven emerging markets of Argentina, Brazil, Indonesia, Mexico, Russia, South Korea, and Thailand, Levy Yeyati, Schmukler, & Van Horen [19] used Amihud ratio indices, bid-ask spread, and weekly volume logarithms to study liquidity in two periods, pre- and post-crisis from 1994-2004. The methodology used was twofold. First, they compared their pre- and post-crisis deviations and then an econometric analysis was performed. The authors concluded that the discouragements of the market are positively correlated with volume and negatively correlated with transaction costs. There is also a strong relationship between liquidity measures and periods of crisis, and no evidence was found of market paralysis with the onset of the crisis. Another study to consider was performed on stock markets in Croatia, Slovenia, Hungary, Serbia, Bulgaria, Poland and Germany, in which two groups of liquidity measures were used: one-dimensional (Size of the firm-related liquidity measures, volume-related liquidity measures, time-related liquidity measures, and spread-related liquidity measures) and multi-dimensional (Amivest ratio and Amihud’s illiquidity ratio, ILLIQ). This study found that the countries of Germany, Poland, and Hungary had a high level of liquidity, while Croatia, Slovenia, Serbia, and Bulgaria had a high level of illiquidity compared with the first group. They conclude that the Amihud Illiquidity (ILLIQ) is not an appropriate measure for emerging markets [20]. They also consider that liquidity is impossible to capture with a single index, given its multi-dimensional characteristics. The study by Vidović, Poklepović, & Aljinović [21] tested two measures of illiquidity in emerging markets of Europe, in addition to a new proposed measure, Relative Change in Volume (RCV), which used 12 continuously listed shares in seven markets (Poland, Czech Republic, Hungary, Bulgaria, Romania, Croatia, and Germany). They found that the ILLIQ and Turnover measures are not appropriate since the return of these shares did not increase with rises in illiquidity. The study by Bekaert, Harvey & Lundblad [22], which considers 18 emerging markets, including 5 Latin American markets (Argentina, Brazil, Chile, Colombia, and Mexico), concludes that the Zero Rate Return (ZRR) Index as a monthly ratio, is a good predictor of profitability. In addition, the ZRR index is negatively related to turnover. They find that the ZRR measure captures an aspect of liquidity that is not present in turnover.

LIQUIDITY RISK AND STOCK RETURN IN LATIN AMERICAN EMERGING MARKETS
UPB - INVESTIGACIÓN & DESARROLLO, Vol. 20, No. 2: 57 – 64 (2020) 59
The work of Perobelli, Famá, & Sacramento [23], found a positive relationship between market risk and turnover, this along other results indicates a negative premium for market liquidity in the Brazilian market
Ahn, Cai, & Yang [24] studied 21 emerging markets, including 6 Latin American markets (Argentina, Brazil, Chile, Mexico, Peru, and Venezuela). They used two groups of liquidity indices: one with a spread and the other with a price impact. The latter used the ILLIQ indices, Amivest and the Pastor index proposed by Pastor and Stambaugh [25]. The results show that these three indices are close substitutes and that the ILLIQ index is the most effective in some cases.
2.3 Studies focused on developed markets
Several classic studies show that liquidity risk is a factor in stock returns [26], [14], [25]. In a study on the liquidity of the German market from 2006-2010, in which Amihud's ILLIQ index was used, as well as a study based on the prices of quoted funds, it was concluded that periods of illiquidity were compensated with returns, as also confirmed by the relationship between illiquidity and market return [27].
Between 2006-2014, a study using the LCAPM methodology proposed by Acharya & Pedersen [10], which considered a sample of more than 2500 shares listed on NASDAQ, concluded that liquidity risk and liquidity level are not always positively correlated. A negative relationship was also found between return and market illiquidity [28]. Another study based on the Japanese market between 1983 and 2016, which analyzed the LCAPM using different illiquidity proxies: Amihud's ILLIQ, the turnover ratio and "y" developed by Pastor and Stambaugh [25], concludes that the results support the use of LCAPM and that, to a certain extent, liquidity risk is quoted on the Tokyo Stock Exchange [29].A study of the Chinese market performed from 1995-2016 shows that market liquidity and trading activity increase over time [30].
Among the recent studies in developed markets that found evidence of a relationship between return and liquidity risk on 7 developed markets (USA, Japan, Canada, France, Germany, Italy, and United Kingdom), liquidity risk, and abnormal returns [31].
Studies of the North American market for shares listed on the FTSE 100 Index from 2005-2007 found a relationship between the frictions of liquidity risk and share returns [32]. Of shares listed on the New York Stock Exchange from 1993-2005, those who used a new index that even exceeds Amihud’s ILLIQ also showed evidence of a relationship between return and liquidity risk [33].Finally, a study on a group of 45 international markets, 19 emerging markets, and 26 developed markets over a period of 22 years, found that the premium for illiquidity is higher in emerging markets than in developed markets, concluding a positive significance of return on liquidity premium in international markets [34].
3. DATA AND METHODOLOGY 3.1 Sample construction This data was obtained from Economatica and considered shares that had an average presence equal to or greater than 70% from July 1998 to July 2018 in the stock markets of Chile, Mexico, and Peru. For Colombia, the period from August 2002 to July 2018 was considered. Monthly statistics were obtained from this data and are summarized in tables 1 and 2. From these shares, the variables of daily closing price, volume, number of businesses, number of daily securities traded, and number of shares outstanding were selected.
TABLE 1 - AVERAGE MONTHLY RETURNS AND STANDARD DEVIATION
Item Chile Mexico Peru Colombia
Number of Shares 39 31 19 7
Average 0.83% 0.85% 0.89% 1.13%
Average standard deviation 9.18% 11.07% 11.69% 10.02%
Source: Prepared by the authors. We chose a total amount of 96 stocks, which met the stock market presence requirements of at least 70% during the analysis period of this investigation.

VASQUEZ-TEJOS AND LAMOTHE
60 UPB - INVESTIGACIÓN & DESARROLLO, Vol. 20, No. 2: 57 – 74 (2020)
TABLE 2 - MONTHLY RETURNS AND STANDARD DEVIATION PER SHARE
Share Country Return (%)
Standard deviation
(%) Share Country Return
(%) Standard deviation
(%) Share Country Return
(%) Standard deviation
(%)
CUPRUM Chile 1,62 8,88 FALABELLA Chile 1,32 7,69 SIMECB México 0,80 16,33
HABITAT Chile 1,77 6,84 SM-CHILE B Chile 1,37 6,64 SORIANAB México 0,57 9,06
PROVIDA Chile 1,39 6,48 ORO BLANCO Chile 1,11 11,29 TLEVISACPO México 0,70 9,75
AESGENER Chile 0,60 9,87 SQM-B Chile 1,48 10,06 AZTECACPO México -0,23 13,10
AGUAS-A Chile 1,15 6,98 CONCHATORO Chile 0,85 7,53 VITROA México 0,85 12,50
BANMEDICA Chile 1,44 7,66 VSPT Chile 0,60 7,38 WALMEX México 1,28 7,20
BESALCO Chile 1,17 12,48 ZOFRI Chile 1,35 8,46 ALICORC1 Perú 1,38 9,16
CAP Chile 1,14 14,11 ALFAA México 0,98 11,95 BVN Perú 0,62 12,26
CEMENTOS Chile 0,79 8,55 ALSEA México 1,41 8,71 CASAGRC1 Perú 0,53 16,25
CENCOSUD Chile 0,49 6,27 AMXL México 1,07 6,87 CPACASC1 Perú 1,06 9,51
COLBUN Chile 0,83 6,74 ARA México 0,49 9,81 CORAREI1 Perú 0,92 13,78
CCU Chile 0,97 7,04 AC México 1,08 6,04 BAP Perú 1,37 9,48
VAPORES Chile 0,66 12,17 ASURB México 1,53 8,47% BROCALC1 Perú 0,30 16,51
ANDINA-A Chile 0,63 7,69 AUTLANB México 0,69 20,26 ENGEPEC1 Perú 1,12 7,63
ANDINA-B Chile 0,76 7,59 BACHOCOB México 1,25 8,53 FERREYC1 Perú 0,84 11,01
ENTEL Chile 0,98 7,68 BIMBOA México 0,94 7,90 GRAMONC1 Perú 0,61 14,79
CMPC Chile 1,05 7,00 GCC México 1,22 8,65 LUSURC1 Perú 1,46 6,28
COPEC Chile 1,13 6,96 CEMEXCPO México 0,51 11,63 MILPOC1 Perú 1,35 11,12
IANSA Chile -0,23 12,92 KOFL México 0,94 8,39 MINSURI1 Perú 0,85 11,70

LIQUIDITY RISK AND STOCK RETURN IN LATIN AMERICAN EMERGING MARKETS
UPB - INVESTIGACIÓN & DESARROLLO, Vol. 20, No. 2: 57 – 64 (2020) 61
NUEVAPOLAR Chile -1,00 14,74 ELEKTRA México 1,56 15,51 RELAPAC1 Perú -0,31 12,17
ENELAM Chile 0,16 7,89 FEMSAUBD México 1,60 8,03 CVERDEC1 Perú 1,93 13,49
ENELGXCH Chile 0,83 7,43 GCARSOA1 México 1,28 8,81 TELEFBC1 Perú -0,27 13,38
ECL Chile 1,24 11,24 GEOB México -1,16 21,03 BACKUSI1 Perú 1,75 7,90
GASCO Chile 1,07 8,07 GMEXICOB México 1,54 11,87 UNACEMC1 Perú 0,45 8,51
SECURITY Chile 1,20 6,90 GRUMAB México 1,13 12,38 VOLCABC1 Perú 0,90 17,15
INVERCAP Chile 1,06 14,97 KUOB México 0,55 10,06 CEMARGOS Colombia 1,64 9,56
INVEXANS Chile -1,22 12,27 ICHB México 0,96 11,30 ETB Colombia 0,19 8,22
LTM Chile 1,12 11,06 KIMBERA México 0,92 6,98 EXITO Colombia 1,09 9,59
MASISA Chile 0,03 11,31 MEXCHEM México 1,91 10,46 ISA Colombia 1,42 6,64
NORTEGRAN Chile 0,59 12,98 PE&OLES México 1,23 13,00 MINEROS Colombia 2,01 10,32
PARAUCO Chile 1,17 7,53 PINFRA México 0,88 16,31 NUTRESA Colombia 1,47 8,78
QUINENCO Chile 0,94 8,72 SAREB México -2,10 12,16 FABRICATO Colombia 0,11 17,03 Source: Prepared by the authors.
VASQUEZ-TEJOS AND LAMOTHE
62 UPB - INVESTIGACIÓN & DESARROLLO, Vol. 20, No. 2: 57 – 74 (2020)
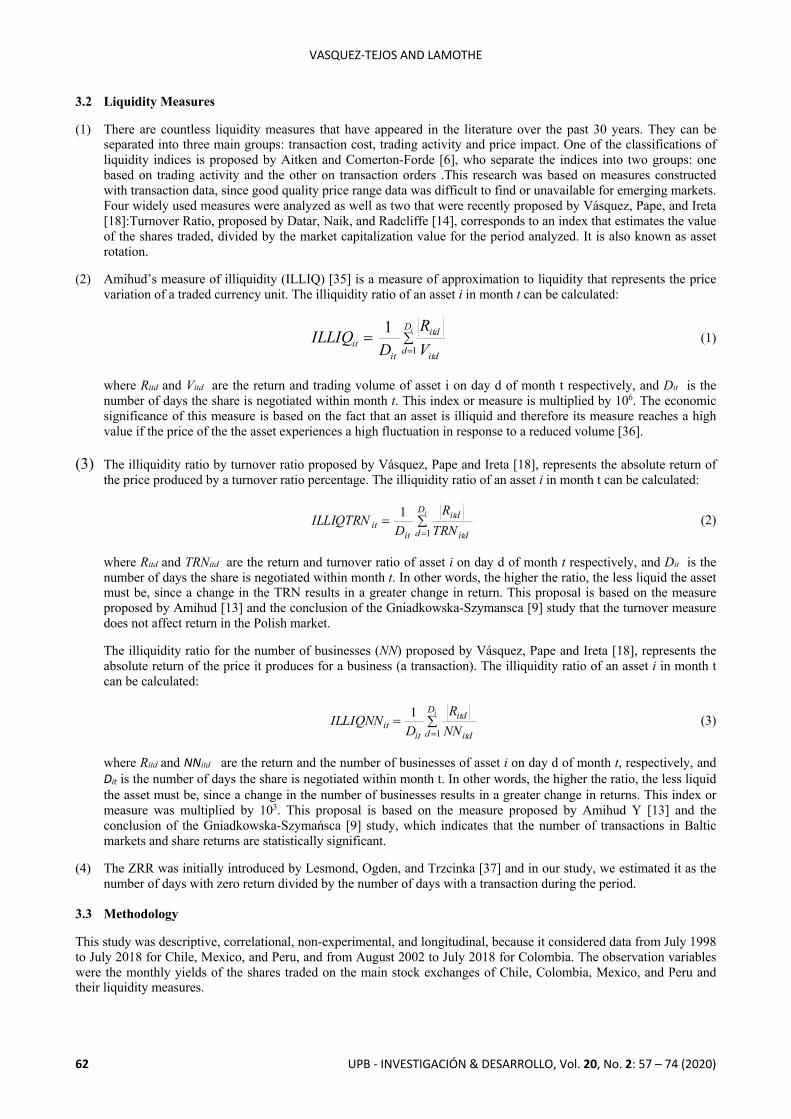
3.2 Liquidity Measures (1) There are countless liquidity measures that have appeared in the literature over the past 30 years. They can be
separated into three main groups: transaction cost, trading activity and price impact. One of the classifications of liquidity indices is proposed by Aitken and Comerton-Forde [6], who separate the indices into two groups: one based on trading activity and the other on transaction orders .This research was based on measures constructed with transaction data, since good quality price range data was difficult to find or unavailable for emerging markets. Four widely used measures were analyzed as well as two that were recently proposed by Vásquez, Pape, and Ireta [18]:Turnover Ratio, proposed by Datar, Naik, and Radcliffe [14], corresponds to an index that estimates the value of the shares traded, divided by the market capitalization value for the period analyzed. It is also known as asset rotation.
(2) Amihud’s measure of illiquidity (ILLIQ) [35] is a measure of approximation to liquidity that represents the price
variation of a traded currency unit. The illiquidity ratio of an asset i in month t can be calculated:
(1)
where Ritd and Vitd are the return and trading volume of asset i on day d of month t respectively, and Dit is the number of days the share is negotiated within month t. This index or measure is multiplied by 106. The economic significance of this measure is based on the fact that an asset is illiquid and therefore its measure reaches a high value if the price of the the asset experiences a high fluctuation in response to a reduced volume [36].
(3) The illiquidity ratio by turnover ratio proposed by Vásquez, Pape and Ireta [18], represents the absolute return of
the price produced by a turnover ratio percentage. The illiquidity ratio of an asset i in month t can be calculated:
(2)
where Ritd and TRNitd are the return and turnover ratio of asset i on day d of month t respectively, and Dit is the number of days the share is negotiated within month t. In other words, the higher the ratio, the less liquid the asset must be, since a change in the TRN results in a greater change in return. This proposal is based on the measure proposed by Amihud [13] and the conclusion of the Gniadkowska-Szymansca [9] study that the turnover measure does not affect return in the Polish market.
The illiquidity ratio for the number of businesses (NN) proposed by Vásquez, Pape and Ireta [18], represents the absolute return of the price it produces for a business (a transaction). The illiquidity ratio of an asset i in month t can be calculated:
(3)
where Ritd and NNitd are the return and the number of businesses of asset i on day d of month t, respectively, and Dit is the number of days the share is negotiated within month t. In other words, the higher the ratio, the less liquid the asset must be, since a change in the number of businesses results in a greater change in returns. This index or measure was multiplied by 103. This proposal is based on the measure proposed by Amihud Y [13] and the conclusion of the Gniadkowska-Szymańsca [9] study, which indicates that the number of transactions in Baltic markets and share returns are statistically significant.
(4) The ZRR was initially introduced by Lesmond, Ogden, and Trzcinka [37] and in our study, we estimated it as the
number of days with zero return divided by the number of days with a transaction during the period.
3.3 Methodology This study was descriptive, correlational, non-experimental, and longitudinal, because it considered data from July 1998 to July 2018 for Chile, Mexico, and Peru, and from August 2002 to July 2018 for Colombia. The observation variables were the monthly yields of the shares traded on the main stock exchanges of Chile, Colombia, Mexico, and Peru and their liquidity measures.
å=
=iD
d itd
itd
itit V
RD
ILLIQ1
1
å==
iD
d itd
itd
itit TRN
RD
ILLIQTRN1
1
å==
iD
d itd
itd
itit NN
RD
ILLIQNN1
1

LIQUIDITY RISK AND STOCK RETURN IN LATIN AMERICAN EMERGING MARKETS
UPB - INVESTIGACIÓN & DESARROLLO, Vol. 20, No. 2: 57 – 64 (2020) 63
The shares are grouped into three portfolios from higher to lower average returns over the period (table 3), with the aim of determining the differences in the impact of liquidity at different levels of return. To achieve this objective, the study focused on Portfolio 1 with the highest returns and on Portfolio 3 with the lowest returns. For the selected portfolios, monthly statistics were estimated and monthly liquidity risk indicators were constructed from the indices in the previous section. Portfolios 2 with medium profitability will not be included in the final analysis so as to check the relationship of a portfolio with a high and another with low profitability with liquidity risk. Portfolios 1 and 2 will be made up of 13, 3, 10, and 6 shares respectively for Chile, Colombia, Mexico, and Peru.
TABLE 3 - PORTFOLIO COMPOSITION BY COUNTRY
CHILE Porfolio 1 Porfolio 3 HABITAT CEMENTOS
CUPRUM ANDINA-B
SQM-B ANDINA-A
BANMEDICA VSPT
PROVIDA AESGENER
SM-CHILE B NORTEGRAN
ZOFRI CENCOSUD
FALABELLA ENELAM
ECL MASISA
SECURITY IANSA
PARAUCO VAPORES
BESALCO NUEVAPOLAR
AGUAS-A INVEXANS
COLOMBIA Porfolio 1 Porfolio 3 MINEROS EXITO
CEMARGOS ETB
NUTRESA FABRICATO
MEXICO Porfolio 1 Porfolio 3 MEXCHEM SIMECB
FEMSAUBD TLEVISACPO
ELEKTRA AUTLANB
GMEXICOB SORIANAB
ASURB KUOB
ALSEA CEMEXCPO
GCARSOA1 ARA
WALMEX AZTECACPO
BACHOCOB GEOB
PE&OLES SAREB
PERU Porfolio 1 Porfolio 3
CVERDEC1 GRAMONC1
BACKUSI1 CASAGRC1
LUSURC1 UNACEMC1
ALICORC1 BROCALC1

VASQUEZ-TEJOS AND LAMOTHE
64 UPB - INVESTIGACIÓN & DESARROLLO, Vol. 20, No. 2: 57 – 74 (2020)
BAP TELEFBC1
MILPOC1 RELAPAC1 Source: Prepared by the authors.
The objective of this study was to determine whether or not there is a relationship between the liquidity and stock return of the companies listed in these four Latin American stock markets. According to the available data, a regression model following the methodology of Leirvik, Fiskerstrand, & Fjellvikas [15], who uses this model to evaluate the relationship between equity profitability and liquidity risk in Norway, an economy that, despite being developed in size, is very similar to the Latin American ones. The model contained a dependent variable that represented the share return and two independent variables: the monthly return of the market portfolio and the liquidity indicator.
(4) where ri,t is the monthly return of month t of action i, β1 is the beta of market return, rm,t is the return of the market in month t, β2 is the beta of the liquidity index, LIQi,t is the liquidity index of asset i in the month t and ε is the error of the model. We used a stock index representative of each country as a proxy for market return; IPSA for Chile, COLPAP for Colombia, MEXBOL for Mexico and SPBLPGPT for Peru. Several tests will be carried out for these types of regression models, presenting the results in the results tables. Amongst them to assess the specification of the model, heteroscedasticity, self-relationship, normality of errors, among others. 4. RESULTS Table 4 describes the monthly statistics for the different variables. Tables 5, 6, 7 and 8 show a good fit for all of the models, the generally high R2s, most of the Durbin-Watson statistic close to 2, all "F" tests were significant and the condition indices were less than 30; the latter indicated that there were no autocorrelation or multicollinearity problems. The above represents a good overall fit of the models.
TABLE 4 – MONTHLY DESCRIPTIVE STATISTICS BY VARIABLE, PORTFOLIO AND COUNTRY
Chile
Portafolio 1 (Ch1) Portafolio 3 (Ch3)
Variable Obs Mean Std. Dev. Min Max Obs Mean Std. Dev. Min Max
Rm 241 0,01 0,05
- 0,35 0,15
241
0,01 0,05
- 0,35 0,15
Rmes 241 0,01 0,05
- 0,25 0,25
241
0,00 0,06
- 0,28 0,21
ILLIQ 241 0,08 0,23
0,00 2,58
241
0,06 0,16
0,00 1,67
TRN 241 0,67 6,38
0,01 99,28
241
0,02 0,02
0,00 0,08
ILLIQTRN 241 24,47 169,74
0,54 2.619,08
241
12,05 32,89
0,52 304,74
ILLIQNN 241 0,05 0,08 - 0,69
241
0,05 0,09 - 1,14
ZR 241 0,32 0,13
0,10 0,62
241
0,26 0,09
0,04 0,53
Colombia
Portafolio 1 (Col1) Portafolio 3 (Col3)
Variable Obs Mean Std. Dev. Min Max Obs Mean Std. Dev. Min Max
Rm 192 0,01 0,06
- 0,21 0,16
192
0,01 0,06
- 0,21 0,16
Rmes 192 0,02 0,06
- 0,15 0,25
192
0,00 0,09
- 0,46 0,26
ILLIQ 192 0,00 0,01
0,00 0,07
192
0,00 0,01
0,00 0,11
TRN 192 0,01 0,00
0,00 0,03
192
0,81 1,29
0,00 9,13
Ttitmti LIQrr ebba +++= ,2,1,

LIQUIDITY RISK AND STOCK RETURN IN LATIN AMERICAN EMERGING MARKETS
UPB - INVESTIGACIÓN & DESARROLLO, Vol. 20, No. 2: 57 – 64 (2020) 65
ILLIQTRN 192 7,07 5,15
1,15 32,31
192
5,20 7,07
0,00 54,49
ILLIQNN 192 0,05 0,05
0,01 0,38
192
0,05 0,08
0,00 0,75
ZR 192 0,28 0,12
0,05 0,68
192
0,31 0,14
0,03 0,73
Mexico
Portafolio 1 (Mx1) Portafolio 3 (Mx3)
Variable Obs Mean Std. Dev. Min Max Obs Mean Std. Dev. Min Max
Rm 241 0,01 0,06
- 0,35 0,18
241
0,01 0,06
- 0,35 0,18
Rmes 241 0,01 0,05
- 0,25 0,28
241
0,01 0,07
- 0,38 0,20
ILLIQ 241 4,98 19,52
0,02 190,36
241
3,12 15,58
0,02 171,82
TRN 241 0,03 0,02
0,01 0,15
241
0,02 0,01
0,01 0,05
ILLIQTRN 241 15,09 67,22
0,41 904,95
241
20,75 112,00
0,94 1.229,22
ILLIQNN 241 0,16 0,38
0,00 4,12
241
0,06 0,17
0,00 1,83
ZR 241 0,23 0,17
0,01 0,62
241
0,18 0,14
0,00 0,56
Peru
Portafolio 1 (Pe1) Portafolio 3 (Pe3)
Variable Obs Mean Std. Dev. Min Max Obs Mean Std. Dev. Min Max
Rm 241 0,01 0,08
- 0,47 0,33
241
0,01 0,08
- 0,47 0,33
Rmes 241 0,02 0,06
- 0,34 0,20
241
0,00 0,09
- 0,43 0,27
ILLIQ 241 115,24 598,27
0,45 6.428,98
241
35,39 132,03
0,97 1.238,91
TRN 241 0,01 0,01
0,00 0,17
241
0,03 0,08
0,00 0,77
ILLIQTRN 241 30,42 68,70
0,40 830,42
241
29,30 54,84
0,51 721,29
ILLIQNN 241 0,41 2,17
0,02 31,71
241
0,36 1,45
0,02 19,70
ZR 241 0,40 0,13
0,19 0,74
241
0,45 0,16
0,17 0,83
Rm corresponds to the return of the market and R(month) is the average return of the shares that make up the sample. Source: Prepared by the authors.
The results of the Ramsey reset test show that, in general, the models are well specified, except for Portfolio 1 in Mexico and Peru. No autocorrelation is seen in the models using the Durbin Watson and Breusch-Godfrey tests, except for Mexico in portfolio 3. Several models showed the presence of heteroscedasticity, which is corrected with White's adjustment (major errors) shown in Table 9. We also carried out normality tests of the errors with the Shapiro-Wilk test.

VASQUEZ-TEJOS AND LAMOTHE
66 UPB - INVESTIGACIÓN & DESARROLLO, Vol. 20, No. 2: 57 – 74 (2020)
TABLE 5 - RESULTS FOR CHILE OF THE MODELS WITH THE DEPENDENT VARIABLE "PORTFOLIO RETURN"
Variable Ch1_ILLIQ Ch1_TRN Ch1_ILLIQTRN Ch1_ILLIQNN Ch1_ZR Ch3_ILLIQ Ch3_TRN Ch3_ILLIQTRN Ch3_ILLIQNN Ch3_ZR
Rm 0,78543041*** 0,77668752*** 0,77855081*** 0,77924542*** 0,77507331*** 0,96758123*** 0,96717694*** 0,96515915*** 0,96764299*** 0,96526942***
ILLIQ -0,02227191** -0,03452718**
TRN 0,00007241 0,14905447
ILLIQTRN -0,00001817 -,00014823*
ILLIQNN -,06531537** -0,04168631
ZR -,03606373* -0,03706036
_cons ,00927094*** ,00760804*** ,00808689*** ,01069495*** ,01919101*** -0,00411875 -,00955294** -,00440293* -0,00420143 0,00357943
N 241 241 241 241 241 241 241 241 241 241
r2 0,6587611 0,64809203 0,65186345 0,65796408 0,65644378 0,72428981 0,71745094 0,72276889 0,7202844 0,7192008
r2_a 0,65589354 0,64513482 0,64893793 0,65508983 0,65355675 0,72197291 0,71507657 0,72043922 0,71793385 0,71684115
F 229,72929 219,15659 222,8199 228,91668 227,37708 312,61262 302,16579 310,24476 306,43212 304,79039
Ramsey RESET
F 0,45 0,44 0,43 0,42 0,7 3,41 3,63 3,27 3,36 3,7
Prob 0,7157 0,7247 0,7345 0,7423 0,552 0,0182 0,0137 0,0219 0,0196 0,0124
Durbin-Watson 2,031316 1,989431 2,011375 2,013856 1,982902 2,008005 2,026911 2,019409 2,020097 1,993503
Breusch-Godfrey
F 0,209 0,032 0,09 0,117 0,017 0,095 0,211 0,381 0,327 0,112
Prob 0,648 0,8587 0,764 0,7324 0,8964 0,7584 0,6466 0,5376 0,5683 0,7386
White's test chi2 19,81 14,69 16,52 15,96 10,35 9,39 15,33 8,91 8,6 10,8
Prob 0,0014 0,0118 0,0055 0,007 0,066 0,0945 0,009 0,1128 0,1261 0,0556
Breusch-Pagan chi2 8,11 12,13 12,1 16,73 7,61 1,21 1,73 1,38 0,51 2,5
Prob 0,0044 0,0005 0,0005 0 0,0058 0,2715 0,189 0,24 0,4736 0,114
Shapiro-Wilk 0,00001 0,00001 0,00001 0 0,00001 0,00399 0,00534 0,00657 0,00237 0,00405
* p<0.05; ** p<0.01; *** p<0.001 Source: Prepared by the authors.
LIQUIDITY RISK AND STOCK RETURN IN LATIN AMERICAN EMERGING MARKETS
UPB - INVESTIGACIÓN & DESARROLLO, Vol. 20, No. 2: 57 – 64 (2020) 67
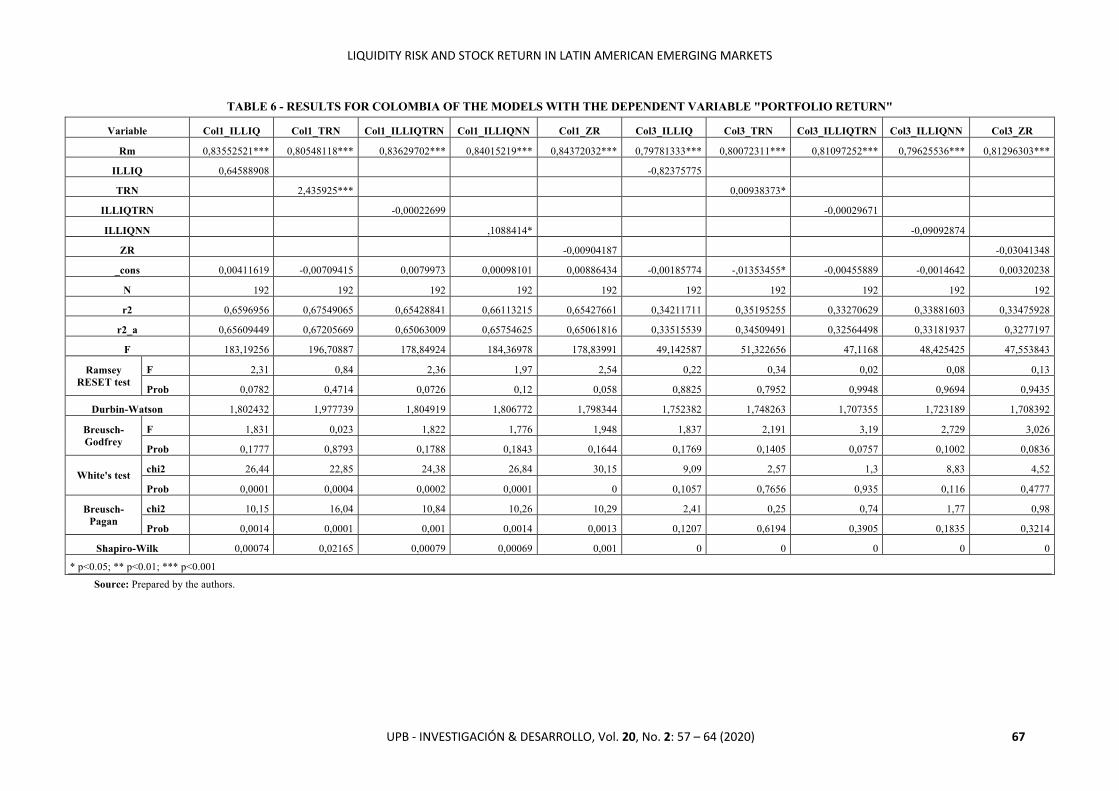
TABLE 6 - RESULTS FOR COLOMBIA OF THE MODELS WITH THE DEPENDENT VARIABLE "PORTFOLIO RETURN"
Variable Col1_ILLIQ Col1_TRN Col1_ILLIQTRN Col1_ILLIQNN Col1_ZR Col3_ILLIQ Col3_TRN Col3_ILLIQTRN Col3_ILLIQNN Col3_ZR
Rm 0,83552521*** 0,80548118*** 0,83629702*** 0,84015219*** 0,84372032*** 0,79781333*** 0,80072311*** 0,81097252*** 0,79625536*** 0,81296303***
ILLIQ 0,64588908 -0,82375775
TRN 2,435925*** 0,00938373*
ILLIQTRN -0,00022699 -0,00029671
ILLIQNN ,1088414* -0,09092874
ZR -0,00904187 -0,03041348
_cons 0,00411619 -0,00709415 0,0079973 0,00098101 0,00886434 -0,00185774 -,01353455* -0,00455889 -0,0014642 0,00320238
N 192 192 192 192 192 192 192 192 192 192
r2 0,6596956 0,67549065 0,65428841 0,66113215 0,65427661 0,34211711 0,35195255 0,33270629 0,33881603 0,33475928
r2_a 0,65609449 0,67205669 0,65063009 0,65754625 0,65061816 0,33515539 0,34509491 0,32564498 0,33181937 0,3277197
F 183,19256 196,70887 178,84924 184,36978 178,83991 49,142587 51,322656 47,1168 48,425425 47,553843
Ramsey RESET test
F 2,31 0,84 2,36 1,97 2,54 0,22 0,34 0,02 0,08 0,13
Prob 0,0782 0,4714 0,0726 0,12 0,058 0,8825 0,7952 0,9948 0,9694 0,9435
Durbin-Watson 1,802432 1,977739 1,804919 1,806772 1,798344 1,752382 1,748263 1,707355 1,723189 1,708392
Breusch-Godfrey
F 1,831 0,023 1,822 1,776 1,948 1,837 2,191 3,19 2,729 3,026
Prob 0,1777 0,8793 0,1788 0,1843 0,1644 0,1769 0,1405 0,0757 0,1002 0,0836
White's test chi2 26,44 22,85 24,38 26,84 30,15 9,09 2,57 1,3 8,83 4,52
Prob 0,0001 0,0004 0,0002 0,0001 0 0,1057 0,7656 0,935 0,116 0,4777
Breusch-Pagan
chi2 10,15 16,04 10,84 10,26 10,29 2,41 0,25 0,74 1,77 0,98
Prob 0,0014 0,0001 0,001 0,0014 0,0013 0,1207 0,6194 0,3905 0,1835 0,3214
Shapiro-Wilk 0,00074 0,02165 0,00079 0,00069 0,001 0 0 0 0 0
* p<0.05; ** p<0.01; *** p<0.001 Source: Prepared by the authors.

VASQUEZ-TEJOS AND LAMOTHE
68 UPB - INVESTIGACIÓN & DESARROLLO, Vol. 20, No. 2: 57 – 74 (2020)
TABLE 7 - RESULTS FOR MEXICO OF THE MODELS WITH THE DEPENDENT VARIABLE "PORTFOLIO RETURN"
Variable Mx1_ILLIQ Mx1_TRN Mx1_ILLIQTRN Mx1_ILLIQNN Mx1_ZR Mx3_ILLIQ Mx3_TRN Mx3_ILLIQTRN Mx3_ILLIQNN Mx3_ZR
Rm 0,64836036*** 0,65255824*** 0,65363932*** 0,65435141*** 0,65303929*** 0,94382074*** 0,93641571*** 0,94328056*** 0,94379239*** ,94488277***
ILLIQ -0,00015884 -0,00007154
TRN -0,01352936 0,46775092
ILLIQTRN -0,00003634 -3,987E-08
ILLIQNN -,02352712*** -0,00508261
ZR -,03556101* -0,0187611
_cons 0,00484692 0,00447515 0,00455019 ,0077446** ,01224061** -0,00348407 -,01300282* -0,00370128 -0,00340259 -0,00036854
N 241 241 241 241 241 241 241 241 241 241
r2 0,52639071 0,52318212 0,52517195 0,55081092 0,53574877 0,70889161 0,71151225 0,70862077 0,70878889 0,71017909
r2_a 0,5224108 0,51917525 0,5211818 0,54703622 0,5318475 0,70644532 0,70908798 0,70617221 0,70634174 0,70774362
F 132,26196 130,57118 131,61704 145,92184 137,32673 289,78245 293,49585 289,40248 289,63826 291,5984
Ramsey RESET test
F 5,68 7,61 7,25 3,75 3,08 1,52 2,24 1,56 1,52 1,2
Prob 0,0009 0,0001 0,0001 0,0117 0,0282 0,2089 0,0838 0,1996 0,2111 0,3088
Durbin-Watson 1,73064 1,67802 1,692148 1,835333 1,733059 1,858792 1,858573 1,852397 1,860323 1,871133
Breusch-Godfrey
F 4,307 6,104 5,604 1,53 4,193 1,137 1,161 1,245 1,113 0,934
Prob 0,039 0,0142 0,0187 0,2173 0,0417 0,2874 0,2824 0,2656 0,2926 0,3349
White's test chi2 8,5 14,52 7,65 6,38 9,22 1,92 4,33 1,42 12,61 3,63
Prob 0,131 0,0126 0,1768 0,2706 0,1005 0,8603 0,5032 0,9216 0,0273 0,6032
Breusch-Pagan
chi2 1,11 2,98 3,21 0,01 0,11 0,12 0,04 0,13 0,09 0,01
Prob 0,2928 0,0845 0,0731 0,9171 0,7413 0,7301 0,8408 0,7178 0,7612 0,9229
Shapiro-Wilk 0 0 0 0 0 0,01077 0,01114 0,01034 0,00788 0,00379
* p<0.05; ** p<0.01; *** p<0.001 Source: Prepared by the authors.

LIQUIDITY RISK AND STOCK RETURN IN LATIN AMERICAN EMERGING MARKETS
UPB - INVESTIGACIÓN & DESARROLLO, Vol. 20, No. 2: 57 – 64 (2020) 69
TABLE 8 - RESULTS FOR PERU OF THE MODELS WITH THE DEPENDENT VARIABLE "PORTFOLIO RETURN"
Variable Pe1_ILLIQ Pe1_TRN Pe1_ILLIQTRN Pe1_ILLIQNN Pe1_ZR Pe3_ILLIQ Pe3_TRN Pe3_ILLIQTRN Pe3_ILLIQNN Pe3_ZR
Rm 0,64025352*** 0,64031352*** 064025366*** 0,63885914*** 0,63646107*** 0,84478812*** 0,83693779*** 0,84450527*** 0,846183*** 0,84560362***
ILLIQ -0,000002864 -0,00008308***
TRN 0,03358699 0,06356914
ILLIQTRN -0,00001024 -0,00012186*
ILLIQNN -0,00102571 -,005149*
ZR -,03842953* -,0434506*
_cons 0,00901579*** 0,00841281*** ,0089971*** ,00911834*** ,02418853*** -0,00370013 -,00864684* -0,00306592 -0,00479331 0,01297781
N 241 241 241 241 241 241 241 241 241 241
r2 0,71495993 0,71427763 0,7143417 0,71546853 0,72057908 0,69060187 0,67762707 0,68023049 0,68176044 0,6803517
r2_a 0,71256463 0,71187661 0,71194121 0,71307751 0,71823101 0,68800189 0,67491806 0,67754335 0,67908616 0,67766558
F 298,48516 297,48822 297,58163 299,23142 306,88079 265,61771 250,1377 253,14305 254,93214 253,28416
Ramsey RESET test
F 9,28 9,28 9,23 9,23 9,23 2,59 2,09 2,22 2,72 2,7
Prob 0 0 0 0 0 0,0537 0,1017 0,0866 0,0451 0,0467
Durbin-Watson 2,034212 2,028557 2,030529 2,036552 2,049029 2,024984 1,969943 2,008754 2,000131 2,00894
Breusch-Godfrey
F 0,073 0,051 0,058 0,083 0,149 0,054 0,03 0,015 0,005 0,017
Prob 0,7878 0,8214 0,8097 0,7734 0,6995 0,8166 0,8619 0,9031 0,9442 0,8963
White's test chi2 25,3 28 29,13 24,83 26,65 7,86 6,04 16,59 32,35 8,16
Prob 0,0001 0 0 0,0002 0,0001 0,1641 0,3021 0,0054 0 0,1475
Breusch-Pagan chi2 7,03 6,56 6,5 6,77 5,43 3,4 4,01 4,49 2,66 1,8
Prob 0,008 0,0104 0,0108 0,0093 0,0198 0,0654 0,0452 0,0342 0,1026 0,1797
Shapiro-Wilk 0,00939 0,01058 0,01135 0,00918 0,00897 0,01308 0,01041 0,01077 0,00993 0,00878
* p<0.05; ** p<0.01; *** p<0.001 Source: Prepared by the authors.

VASQUEZ-TEJOS AND LAMOTHE
70 UPB - INVESTIGACIÓN & DESARROLLO, Vol. 20, No. 2: 57 – 74 (2020)
TABLE 9 - RESULTS OF THE MODELS WITH SETTING WHITE (ROBUST STD. ERR.) AND WITH THE DEPENDENT VARIABLE "PORTFOLIO RETURN"
Variable Ch1_ILLIQ Ch1_TRN Ch1_ILLIQTRN Ch1_ILLIQNN Ch1_ZR Ch3_ILLIQ Ch3_TRN Ch3_ILLIQTRN Ch3_ILLIQNN Ch3_ZR
Rm 0,78543041*** 0,77668752*** 0,77855081*** 0,77924542*** 0,77507331*** 0,96758123*** 0,96717694*** 0,96515915*** 0,96764299*** 0,96526942***
ILLIQ -0,02227191 -0,03452718***
TRN 0,00007241 0,14905447
ILLIQTRN -0,00001817*** -,00014823*
ILLIQNN -0,06531537*** -,04168631*
ZR -0,03606373* -0,03706036
_cons 0,00927094*** 0,00760804*** 0,00808689*** 0,01069495*** ,01919101*** -0,00411875 -0,00955294* -0,00440293* -0,00420143 0,00357943
N 241 241 241 241 241 241 241 241 241 241
r2 0,6587611 0,64809203 0,65186345 0,65796408 0,65644378 0,72428981 0,71745094 0,72276889 0,7202844 0,7192008
r2_a 0,65589354 0,64513482 0,64893793 0,65508983 0,65355675 0,72197291 0,71507657 0,72043922 0,71793385 0,71684115
F 166,30898 157,44531 168,14809 162,84779 161,90476 159,02406 142,19968 150,13438 158,36345 140,16336
Variable Col1_ILLIQ Col1_TRN Col1_ILLIQTRN Col1_ILLIQNN Col1_ZR Col3_ILLIQ Col3_TRN Col3_ILLIQTRN Col3_ILLIQNN Col3_ZR
Rm 0,83552521*** 0,80548118*** 0,83629702*** 0,84015219*** 0,84372032*** 0,79781333*** 0,80072311*** 0,81097252*** 0,79625536*** 0,81296303***
ILLIQ 0,64588908 -0,82375775
TRN 2,435925** 0,00938373
ILLIQTRN -0,00022699 -0,00029671
ILLIQNN 0,1088414 -0,09092874
ZR -0,00904187 -0,03041348
_cons 0,00411619 -0,00709415 0,0079973 0,00098101 0,00886434 -0,00185774 -,01353455* -0,00455889 -0,0014642 0,00320238
N 192 192 192 192 192 192 192 192 192 192
r2 0,6596956 0,67549065 0,65428841 0,66113215 0,65427661 0,34211711 0,35195255 0,33270629 0,33881603 0,33475928
r2_a 0,65609449 0,67205669 0,65063009 0,65754625 0,65061816 0,33515539 0,34509491 0,32564498 0,33181937 0,3277197
F 102,07844 143,54103 99,460657 98,783632 101,66407 40,347982 40,077172 39,304604 39,753776 39,949384
Variable Mx1_ILLIQ Mx1_TRN Mx1_ILLIQTRN Mx1_ILLIQNN Mx1_ZR Mx3_ILLIQ Mx3_TRN Mx3_ILLIQTRN Mx3_ILLIQNN Mx3_ZR
Rm ,64836036*** ,65255824*** ,65363932*** ,65435141*** ,65303929*** ,94382074*** ,93641571*** ,94328056*** ,94379239*** ,94488277***
ILLIQ -0,00015884 -0,00007154
TRN -0,01352936 0,46775092

LIQUIDITY RISK AND STOCK RETURN IN LATIN AMERICAN EMERGING MARKETS
UPB - INVESTIGACIÓN & DESARROLLO, Vol. 20, No. 2: 57 – 64 (2020) 71
ILLIQTRN -0,00003634* -3,987E-08
ILLIQNN -,02352712** -0,00508261
ZR -,03556101* -0,0187611
_cons 0,00484692 0,00447515 0,00455019 ,0077446** ,01224061*** -0,00348407 -,01300282* -0,00370128 -0,00340259 -0,00036854
N 241 241 241 241 241 241 241 241 241 241
r2 0,52639071 0,52318212 0,52517195 0,55081092 0,53574877 0,70889161 0,71151225 0,70862077 0,70878889 0,71017909
r2_a 0,5224108 0,51917525 0,5211818 0,54703622 0,5318475 0,70644532 0,70908798 0,70617221 0,70634174 0,70774362
F 61,507468 60,239882 60,136488 68,312346 63,981129 237,67123 216,64381 242,96565 240,21801 240,60595
Variable Pe1_ILLIQ Pe1_TRN Pe1_ILLIQTRN Pe1_ILLIQNN Pe1_ZR Pe3_ILLIQ Pe3_TRN Pe3_ILLIQTRN Pe3_ILLIQNN Pe3_ZR
Rm 0,64025352*** 0,64031352*** 0,64025366*** 0,63885914*** 0,63646107*** 0,84478812*** 0,83693779*** 0,84450527*** 0,846183*** 0,84560362***
ILLIQ -0,000002864 -,00008308**
TRN 0,03358699 0,06356914
ILLIQTRN -0,00001024 -,00012186*
ILLIQNN -0,00102571** -0,005149
ZR -0,03842953** -0,0434506*
_cons 0,00901579*** 0,00841281*** 0,0089971*** 0,00911834*** 0,02418853*** -0,00370013 -0,00864684* -0,00306592 -0,00479331 0,01297781
N 241 241 241 241 241 241 241 241 241 241
r2 0,71495993 0,71427763 0,7143417 0,71546853 0,72057908 0,69060187 0,67762707 0,68023049 0,68176044 0,6803517
r2_a 0,71256463 0,71187661 0,71194121 0,71307751 0,71823101 0,68800189 0,67491806 0,67754335 0,67908616 0,67766558
F 133,82078 135,24845 144,15884 162,63603 140,11885 184,7777 179,64419 187,49843 181,208 176,45097
* p<0.05; ** p<0.01; *** p<0.001 Source: Prepared by the authors.

VASQUEZ-TEJOS AND LAMOTHE
72 UPB - INVESTIGACIÓN & DESARROLLO, Vol. 20, No. 2: 57 – 74 (2020)
Table 5 and 9 demonstrates that in the case of Chile, the turnover (TRN) was not significant for portfolio 1 and 3, whereas for both portfolios, the beta of ILLITRN were negative and significant at 99% and 95%, respectively. This is consistent with the inverse expected relationship between return and liquidity risk. In the case of the ILLIQ is only significant in portfolio 3, while for portfolio 1, the ILLIQNN and ZR measures were also significant. In the case of Colombia (Table 7), the turnover was positive and significant (portafolio 1), which indicates that the Colombian market rewards greater liquidity of assets. The ILLIQ, ILLIQTRN, ILLIQNN and ZR were not significant. These results may be influenced by the low number of shares of each portfolio. The low number of actions that met the requirements lead us to be cautious with these results. In Mexico (Table 7), almost all the indicators were not significant, except in the most profitable portfolio, the ILLIQNN and ZR indices, which resulted in negative and significant betas at 99% and 95%, respectively. This shows the expected relationship between return and liquidity risk. The Table 8 and 9 shows the results for Peru. In the case of the most profitable portfolio (1), the ILLIQNN and ZRR measures were negative and significant. In the case of the least profitable portfolio, only the ZR index had not significant beta. This suggests that the Peruvian market liquidity risk is relevant in the case of less profitable investments (portfolios).
5. CONCLUSIONS This study analyzed the relationship of liquidity risk on return in 96 shares of companies that trade on stock exchanges in Latin America (Chile, Colombia, Mexico, and Peru) within the period from January 1998 to July 2018. Five liquidity risk measures were used: three of which were widely used in previous studies and two that were recently proposed. The results with the turnover ratio in three out of four countries were not significant, with the exception of Colombia, which is consistent with the conclusion of Lesmond [38], that it is not a viable method for measuring liquidity in emerging markets, and Zhao [39], that it does not efficiently measure liquidity in the Chinese stock market. The foregoing is contrary to what Datar, Naik, & Radcliffe [14] indicated, who found a negative relationship between return and turnover.
The ILLIQ measure [13] does not present good results, opposite to expectations due to the good results of this measure in studies in other markets. In relation to the proposed ILLIQTRN and ILLIQNN measures [18], the former was significant in the lower-yielding portfolios in Chile and Peru, it was also significant in Chile's high-profitability portfolio. The second one (ILLIQNN) was significant in the high-yield portfolios of Chile, Mexico, and Peru, and the low-yield portfolio of Peru.
The ZR measure turned out to be significant in the Chilean, Mexico and Peruvian portfolios in the most profitable portfolio. In both portfolios of high and low profitability of Peru, this measure was significant. However, the ZR did not show good results in the other countries under study.
All the indices that were statistically significant in Chile, Mexico, and Peru showed an inverse relationship with return, which is consistent with the theory. In Colombia on the other hand, a mostly direct relationship was observed, which indicates the need to perform new tests with a larger sample.
The new proposal by Vásquez-Tejos et al., [18], ILLIQTRN and ILLIQNN, were the best performers. However, in terms of which index best captures the relationship between return and liquidity risk, the results of the present study are consistent with [17] and [40], which indicate that liquidity is multidimensional, that it can be measured by different indices, and that they will adapt differently in markets with different microstructures. Therefore, this question will remain open for future research. Considering that the ILLIQ and ILLIQNN measures delivered statistically significant results in several portfolios in different Latin American countries when applied to the Leirvik, Fiskerstrand, and Fjellvikas model [15], we can conclude that liquidity risk has an impact on shareholder return in the Latin American market. The original hypothesis is therefore accepted. This is consistent with other studies in emerging markets where there is evidence that returns increase with liquidity risk [12], [11]. In studies on developed markets, similar conclusions can be found for the German market [28], the American NASDAQ [27], the Indian market [16], and in the market of the G7 countries [31]. A future line of research should construct a price range using indicators with information from the stock supply and demand book. This study’s limitations included restricted access to databases of this type, so another option for future studies is to analyze of the resilience of stock prices or portfolios as a proxy for liquidity.
6. BIBLIOGRAPHY [1] F. Black, “Toward a Fully Automated Stock Exchange,” Financ. Anal. J., vol. 27, no. 4, pp. 28–35, 1971. [2] A. Kyle, “Continuous auctions and insider trading,” Econometrica, pp. 1315–1335, 1985.

LIQUIDITY RISK AND STOCK RETURN IN LATIN AMERICAN EMERGING MARKETS
UPB - INVESTIGACIÓN & DESARROLLO, Vol. 20, No. 2: 57 – 64 (2020) 73
[3] Y. Amihud and H. Mendelson, “Asset pricing and the bid-ask spread,” J. financ. econ., vol. 17, pp. 223–249, 1986.
[4] C. J. Garcia, B. Herrero, and A. M. Ibanez, “El papel de la liquidez en el efecto de la nueva informacion. El caso del Latibex. (With English summary.),” Trimest. Econ., vol. 77, no. 3, pp. 651–682, 2010.
[5] J. I. Peña, La Gestión de Riesgos Financieros de Mercado y Crédito. Madrid, 2002. [6] M. Aitken and C. Comerton-Forde, “How should liquidity be measured?,” Pacific Basin Financ. J., vol. 11, no. 1,
pp. 45–59, 2003. [7] J. P. Zorrilla Salgador, “Globalización, incertidumbre y riesgo,” Intang. Cap., vol. 1, no. 3, pp. 86–102, 2005. [8] R. Hernández, “Los riesgos de las entidades aseguradoras en el marco del Enterprise Risk Management ( ERM ) y
el control interno Gestión Financiera y Globalización,” Innovar J., vol. 25, pp. 61–70, 2015. [9] A. Gniadkowska-Szymańska, “The impact of trading liquidity on the rate of return on emerging markets: the
example of Poland and the Baltic countries,” e-Finanse, vol. 13, no. 4, pp. 136–148, 2017. [10] V. V. Acharya and L. H. Pedersen, “Asset pricing with liquidity risk,” J. financ. econ., vol. 77, no. 2, pp. 375–410,
2005. [11] M. del M. Miralles-Quirós, J. L. Miralles-Quirós, and C. Oliveira, “The role of liquidity in asset pricing: the
special case of the Portuguese Stock Market,” J. Econ. Financ. Adm. Sci., vol. 22, no. 43, pp. 191–206, 2017. [12] D. W. Bataineh, Mohamad Ali; Hanna Alrabadi, “he Effect of Liquidity Risk on Stock Returns: The Case of
Amman Stock Exchange during (2004-2013),” Arab J. Adm., vol. 37, no. 1, pp. 247–265, 2017. [13] Y. Amihud, “Illiquidity and Stock Returns: Cross-Section and Time-Series Effects,” J. Financ. Mark., vol. 5, pp.
31–56, 2002. [14] V. T. Datar, N. Y. Naik, and R. Radcliffe, “Liquidity and stock returns: An alternative test,” J. Financ. Mark., vol.
1, no. 2, pp. 203–219, 1998. [15] T. Leirvik, S. R. Fiskerstrand, and A. B. Fjellvikas, “Market liquidity and stock returns in the Norwegian stock
market,” Financ. Res. Lett., vol. 21, pp. 272–276, 2017. [16] N. K. Cheriyan and D. Lazar, “Liquidity-adjusted Capital Asset Pricing Model In Indian Stock Market,” SCMS J.
Indian Manag., no. December, pp. 25–30, 2017. [17] L. Lamothe-Fernández and F. J. Vásquez-Tejos, “Asset Pricing and Liquidity Risk in the Chilean Stock Market,”
Aestimatio, IEB Int. J. Financ., pp. 126–149, 2011. [18] F. Vasquez-Tejos, H. Pape-Larre, and J. M. Ireta-Sanchez, “STOCK RETURNS AND LIQUIDITY RISK IN
CHILE,” Dimens. Empres., vol. 18, no. 2, pp. 1–30, 2019. [19] E. Levy Yeyati, S. L. Schmukler, and N. Van Horen, “Emerging Market Liquidity and Crises,” J. Eur. Econ.
Assoc., vol. 6, no. December, pp. 668–682, 2008. [20] V. Benic and I. Franic, “Stock Market Liquidity: Comparative Analysis of Croatian and Regional Markets,”
Financ. Theory Pract., vol. 32, no. 4, pp. 477–498, 2008. [21] J. Vidović, T. Poklepović, and Z. Aljinović, “How to Measure Illiquidity on European Emerging Stock Markets?,”
Bus. Syst. Res. J., vol. 5, no. 3, pp. 67–82, 2014. [22] G. Bekaert, C. R. Harvey, and C. Lundblad, “Liquidity and expected returns: Lessons from emerging markets,”
Rev. Financ. Stud., vol. 20, no. 6, pp. 1783–1831, 2007. [23] F. Perobelli, R. Famá, and L. C. Sacramento, “Return and Liquidity Relationships on Market and Accounting
Levels in Brazil,” Rev. Contab. Finanças, vol. 27, no. 71, pp. 259–272, 2016. [24] H. Ahn, J. Cai, and C.-W. Yang, “Which Liquidity Proxy Measures Liquidity Best in Emerging Markets ? *,” Sch.
Business, Sungkyunkwan Univ. Jong. Seoul, Korea, pp. 1–29, 2018. [25] R. F. Pastor, L; Stambaugh, “Liquidity risk and expected stock returns,” J. Polit. Econ., pp. 642–685, 2003. [26] H. Amihud, Yakov & Mendelson, “Liquidity and Stock Returns,” Financ. Anal. J., no. June, pp. 43–48, 1986. [27] K. Czauderna, C. Riedel, and N. Wagner, “Liquidity and conditional market returns: Evidence from German
exchange traded funds,” Econ. Model., vol. 51, pp. 454–459, 2015. [28] J. L. Fall, M., Louhichi, W., & Viviani, “Empirical tests on the asset pricing model with liquidity risk: An
unobserved components approach,” Econ. Model., 2018. [29] X. Zhong and H. Takehara, “Pricing Liquidity Risk on the Tokyo Stock Exchange : Empirical Analysis Using
Multiple Liquidity Measures Xin Zhong,” pp. 1–39, 2018. [30] R. Ma, H. D. Anderson, and B. R. Marshall, “Stock market liquidity and trading activity: Is China different?,” Int.
Rev. Financ. Anal., vol. 56, no. June 2017, pp. 32–51, 2018. [31] T. C. Chiang and D. Zheng, “Liquidity and stock returns: Evidence from international markets,” Glob. Financ. J.,
vol. 27, no. APRIL 2015, pp. 73–97, 2015. [32] S. Darolles, G. Le Fol, and G. Mero, “Measuring the liquidity part of volume,” J. Bank. Financ., vol. 50, pp. 92–
105, 2015. [33] R. Y. Goyenko, C. W. Holden, and C. A. Trzcinka, “Do liquidity measures measure liquidity?,” J. financ. econ.,
vol. 92, no. 2, pp. 153–181, 2009. [34] Y. Amihud, A. Hameed, W. Kang, and H. Zhang, “The illiquidity premium: International evidence,” J. financ.
econ., vol. 117, no. 2, pp. 350–368, 2015.

VASQUEZ-TEJOS AND LAMOTHE
74 UPB - INVESTIGACIÓN & DESARROLLO, Vol. 20, No. 2: 57 – 74 (2020)
[35] J. Chen and M. Sherif, “Illiquidity premium and expected stock returns in the UK: A new approach,” Phys. A Stat. Mech. its Appl., vol. 458, pp. 52–66, 2016.
[36] J. E. Farinós, C. J. García, and A. M. Ibáñez, “Riesgo de iliquidez y rendimientos anormales a largo plazo en las empresas cotizadas que realizan una OPV *,” Cuad. Econ. y Dir. la Empres., vol. 12, no. 38, pp. 119–141, 2008.
[37] D. A. Lesmond, C. A. Trzcinka, and J. P. Ogden, “A New Measure of Transaction Costs,” vol. 12, no. 5, p. 57, 1996.
[38] D. A. Lesmond, “Liquidity of emerging markets,” J. financ. econ., vol. 77, no. 2, pp. 411–452, 2005. [39] H. Zhao and D. Jin, “Dynamic measurement of the liquidity level of the stock market based on the LA-CAPM
model,” J. Intell. Fuzzy Syst., vol. 35, no. 3, pp. 3021–3034, 2018. [40] D. Chai, R. Faff, and P. Gharghori, “New evidence on the relation between stock liquidity and measures of trading
activity,” Int. Rev. Financ. Anal., vol. 19, no. 3, pp. 181–192, 2010.