informe de mercado oficinas e inversiÓn 1t 2014
DESCRIPTION
La estabilidad de las rentas prime en 24,25 €/m²/ mes se va contagiando lentamente hacia otros submercados, especialmente en las rentas máximas de Satélite y Secundaria. La estabilización de rentas parece que será la tendencia de los próximos meses en el mercado de oficinas de Barcelona.TRANSCRIPT

2ÀFLQDV���2IÀFHV ,QIRUPH�GH�0HUFDGR���0DUNHW�UHSRUW0DGULG��%DUFHORQD1T. 2014 / 1Q. 2014
jll.es

Índice
2¿FLQDV�0DGULG�� 3ULQFLSDOHV�,QGLFDGRUHV�� �
�� 5HQWDV�� �
�� 2IHUWD�� �
�� 7UDQVDFFLRQHV�� �
2¿FLQDV�%DUFHORQD�� 3ULQFLSDOHV�,QGLFDGRUHV�� ��
�� 5HQWDV�� �
�� 2IHUWD�� ��
�� 7UDQVDFFLRQHV�� ��
,QYHUVLyQ�� 0DGULG�� ��
�� %DUFHORQD�� ��

6 · Oficinas - Informe de Mercado Madrid y Barcelona 1T. 2014
����
����
��������
�� �
��!�
������
����������
��������� ������������������ ���������� �������
���� ����
� ��� �����������
���������������
����������� ������������
��� ����� �
�����������������
��!�"�
Tasa de Disponibilidad / Vacancy Rate 12,26%
CBD / CBD 8,88%
Secundaria / Secondary 6,86%
Periferia / Periphery 15,49%
Satélite / Satellite 27,32%
4T / 4Q 2013 1T / 1Q 2014
Tendencia a 12
meses /
12 Month Outlook
Stock / Stock (m2) 15.041.381 15.043.461
Tasa de disponibilidad / Vacancy Rate 11,91% 12,26%
Contratación / Take up * (m2) 105.989 101.550
* incluyendo High-Tech / including Hi-Tech
Principales Indicadores Madrid
Fuente / Source: Jones Lang LaSalle 1 T/Q 2014

Oficinas - Informe de Mercado Madrid y Barcelona 1T. 2014 · 7
Rentas en €/m2/mes /
Rents in €/m2/month
4T / 4Q 20131T / 1Q 2014Tendencia a 12 meses /
12 Month OutlookMin. Max. Min. Max.
CBD / CBD 12,50 24,25 12,50 24,25
Secundaria / Secondary 9,00 14,75 8,75 14,75
Periferia / Periphery 5,50 13,00 5,25 12,50
Satélite / Satellite 4,25 10,00 4,25 10,00
Oficinas Madrid
Renta Prime / Prime Rent
0,00 �
0,01 �
0,02 �
0,03 �
0,04 �
0,05 �
2003 2004 2005 2006 2007 2008 2009 2010 2011 2012 2013 Dis
poni
bilid
ad /
Vaca
cny
‘000
m� Renta Prime / Prime Rents
Sin incluir hi tech / Hi tech not included Fuente/ Source: Jones Lang LaSalle 1T/Q 2014
Renta Prime / Prime Rent
0 � 5 �
10 � 15 � 20 � 25 � 30 � 35 � 40 � 45 �
1993 1995 1997 1999 2001 2003 2005 2007 2009 2011 2013
�/m�/m
es /
�/m�/m
onth
CBD
Secundaria
Periferia
Satélite
Fuente/ Source: Jones Lang LaSalle 1T/Q 2014
Fuente / Source: Jones Lang LaSalle 1 T/Q 2014
La estabilidad de las rentas prime en 24,25 €/m²/mes se va contagiando lentamente hacia otros submercados, especialmente en las rentas máximas de Satélite y Secundaria.
En la Periferia, la sobreoferta de producto de calidad y los precios
tan atractivos del CBD siguen provocando presión a la baja
Esto supone un 4,5% de disminución frente al trimestre pasado.
Para el conjunto del mercado los incentivos siguen estando en máximos históricos, en los edificios prime ya se comienza a ver una ligera reducción tanto en los meses de carencia ofrecidos como en el resto de contribuciones.
Rentas

8 · Oficinas - Informe de Mercado Madrid y Barcelona 1T. 2014
OfertaLa desocupación sigue manteniendo la senda de la estabilización de manera general y con un ligero aumento de la tasa de oficinas hasta el 12,2%.
La desocupación de los edificios de Vodafone ha sido el detonante del incremento de la tasa de disponibilidad de la Periferia, aumentando del 14,17% hasta el 15,49% en este primer trimestre del año.
Por su parte, el Icex todavía no liberará superficie a causa de la necesidad de reforma de las nuevas oficinas. Así, a falta de otras desocupaciones a corto plazo, se espera que durante el segundo trimestre del año disminuya la disponibilidad mientras que después de los meses estivales, el abandono de los edificios de CEPSA, fundamentalmente en Campo de las Naciones, volverá a presionar al alza este indicador.
Este primer trimestre tan solo se ha terminado un edificio de pequeño
tamaño y para uso propio
Las oficinas terminadas durante el 2014-2016 siguen la misma tendencia que durante periodos anteriores con tan solo un ligero aumento en 2016 por un único proyecto nuevo de tamaño medio que parece que podría arrancar su construcción en breve.
El resto de proyectos que parecía que se podrían terminar en el 2017, se han ido retrasando en el futuro a la espera de una estabilización en la economía.
Oferta Futura / Future Supply
Fuente/ Source: Jones Lang LaSalle 1T/Q 2014
0
50
100
150
200
250
300
350
400
2007 2008 2009 2010 2011 2012 2013 2014 2015 2016
‘000 m
�
Oficinas / Offices High-Tech / Hi-Tech
Detalle Oferta Futura / Future Supply Detail
0 10 20 30 40 50 60 70 80 90
100
Oficina / Office High-Tech / Hi-Tech Oficina / Office Oficina / Office
2014 2015 2016
Milla
res Ocupación propia / Owner Occupation
Especulativo / Spec
Disponibilidad / Vacancy
0
500
1.000
1.500
2.000
2003 2004 2005 2006 2007 2008 2009 2010 2011 2012 2013 Dis
poni
bilid
ad /
Vaca
cny
‘000
m� Disponibilidad / Vacancy
Sin incluir hi tech / Hi tech not included Fuente/ Source: Jones Lang LaSalle 1T/Q 2014
Oficinas Madrid

Oficinas - Informe de Mercado Madrid y Barcelona 1T. 2014 · 9
Fuente/ Source: Jones Lang LaSalle 1T/Q 2014
0 100 200 300 400 500 600 700 800 900
2003 2004 2005 2006 2007 2008 2009 2010 2011 2012 2013 1T/Q 2014
‘000
m�
Alquiler / Lease Pre-alquiler / Pre-letting Ocupación Propia / Owner Occupation High-Tech / Hi-Tech
Contratación Anual / Annual Take up
TransaccionesEl 2014 ha comenzado con una cifra de contratación relativamente alta, superando los 100.000 m2.
Es el primer trimestre desde el 2010 en que se supera el umbral de los
100.000 metros sin el sesgo de una gran operación como las de Vodafone o
Cepsa
Vodafone y Cepsa, con más de 30.000 m2, representaban cerca de un tercio de la contratación del trimestre. Destaca la franja de operaciones de entre 1.000 y 3.000 m2, que suponen cerca del 35% de la superficie contratada en el trimestre.
Manteniendo esta tendencia de mercado y a la espera de que se confirmen operaciones de un rango de volumen superior (del entorno de los 10.000), que podrían suponer un cambio de ritmo en el take up, se prevé un año que ronde la cifra de los 400.000 m2, recuperando los niveles del 2010.
Como en anteriores trimestres, los mercados protagonistas han sido los de la Periferia y el CBD, en los que se ha concentrado más del 80% de la superficie objeto de contratación.
En el CBD destaca el prealquiler por parte del Icex, del antiguo edificio de Repsol en el Pº de la Castellana 278, que será ocupado una vez concluidas las obras de rehabilitación. La mayor operación de mercado en Periferia ha sido la protagonizada por Alstom en Martínez Villergas 49, con intermediación de JLL.
Oficinas Madrid
Castellana 278 - 15.295 m2
Francisca Delgado 9 - 5.496 m2 ITP
Martínez Villergas 49 - 5.775 m2
Alfonso XII, 62 - 3.657 m2 CONFIDENCIAL
OP
ER
AC
IÓN
ASESORAD
A P
OR
JLL
OP
ER
AC
IÓN
ASESORAD
A P
OR
JLL

10 · Oficinas - Informe de Mercado Madrid y Barcelona 1T. 2014
Principales Indicadores Barcelona
*Incluyendo high-tech / including high tech
A-2
B-23
B-10
B-10
B-10
PRAT DE LLOBREGAT
HOSPITALETDE LLOBREGAT
CORNELLÁDE LLOBREGAT
SANT JOAN DESPÍ
ESPLUGUES DE LLOBREGAT
SANT JUST DESVENT
SANT CUGATDEL VALLÈS
BADALONA
RONDA DALT
RONDA LITORAL
GRAN VIA CORTS CATALANES
DIAGONAL
AP-7
4T / 4Q 2013 1T / 1Q 2014
Tendencia a 12
meses /
12 Month Outlook
Stock / Stock (m2) 6.000.817 6.004.037
Tasa de disponibilidad / Vacancy Rate 14,58% 14,18%
Contratación / Take up (m2) 63.677 60.581
Tasa de Disponibilidad / Vacancy Rate 14,18 %
Pº de Gracia- Diagonal / Pº de Gracia- Diagonal 11,71 %
Centro Ciudad / City Center 8,89 %
Nuevas Áreas de Negocio / New Business Areas 18,00 %
Periferia / Periphery 19,18 %
Fuente/ Source: Jones Lang LaSalle 1T/Q 2014

Oficinas - Informe de Mercado Madrid y Barcelona 1T. 2014 · 11
Oficinas Barcelona
La estabilización de rentas parece que será la tendencia de los próximos meses en el mercado de oficinas de Barcelona.
Las rentas Prime permanecen en 17,50 €/m²/mes y los máximos del
resto de zonas se mantienen estables
Creemos que de cara a finales de año podremos empezar a ver repuntes de rentas debido sobre todo a la falta de oferta de calidad, a una tasa de disponibilidad claramente en descenso y a una reactivación de la actividad económica.
Aunque seguiremos viendo carencias de renta y contribuciones atractivas, éstas irán en disminución conforme avance el año sobre todo en aquellos inmuebles de mejor calidad ya que los propietarios empiezan a ser conscientes de la escasez de oferta en este segmento.
0 �
5 �
10 �
15 �
20 �
25 �
30 �
2003 2004 2005 2006 2007 2008 2009 2010 2011 2012 2013 1T 2014
Rent
a Pr
ime
/ Prim
e Re
nt �
/m�/m
0 �
5 �
10 �
15 �
20 �
25 �
30 �
1993 1995 1997 1999 2001 2003 2005 2007 2009 2011 2013
�/m�/m
es /
�/m�/m
onth
Rentas por Submercados Submarket Rents
Paseo de Gracia/Diagonal Centro Ciudad Nueva Areas de Negocio Periferia
Renta Prime / Prime Rent
Rentas por submercados / Submarkets Rents
Fuente/ Source: Jones Lang LaSalle 1T/Q 2014
Fuente/ Source: Jones Lang LaSalle 1T/Q 2014
Rentas en €/m2/mes
Rents in €/m2/month
4T / 4Q 2013 1T / 1Q 2014 Tendencia a 12
meses /
12 Month OutlookMin. Max. Min. Max.
Pº de Gracia- Diagonal / Pº de Gracia- Diagonal 13,00 17,50 13,00 17,50
Centro Ciudad / City Center 8,75 14,75 8,75 14,75
Nuevas Áreas de Negocio / New Business Areas 8,25 14,50 8,25 14,50
Periferia / Periphery 5,50 8,00 5,50 8,00
Fuente/ Source: Jones Lang LaSalle 1T/Q 2014
Rentas
12 · Oficinas - Informe de Mercado Madrid y Barcelona 1T. 2014
Fuente/ Source: Jones Lang LaSalle 1T/Q 2014
0
200
400
600
800
1.000
2003 2004 2005 2006 2007 2008 2009 2010 2011 2012 2013 1T 2014
Dis
poni
bilid
ad /
Vaca
cny
‘000
m� Disponibilidad / Vacancy
Disponibilidad Anual / Annual Vacancy
Fuente/ Source: Jones Lang LaSalle 1T/Q 2014
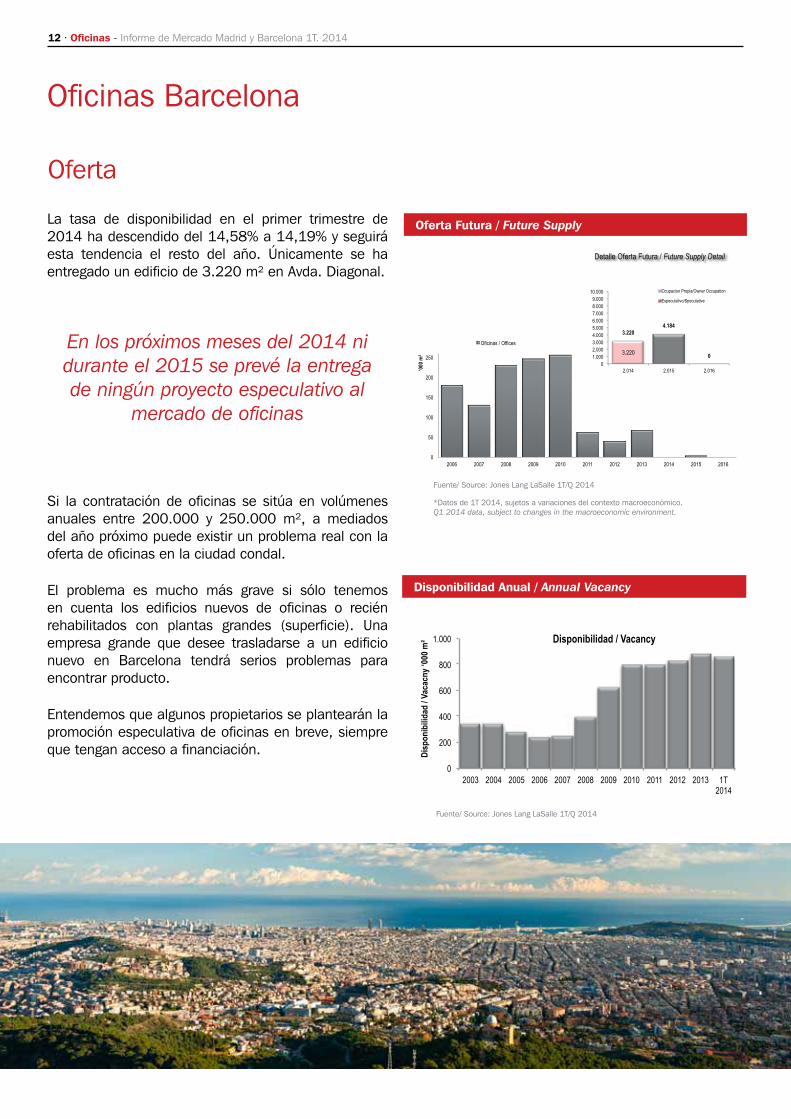
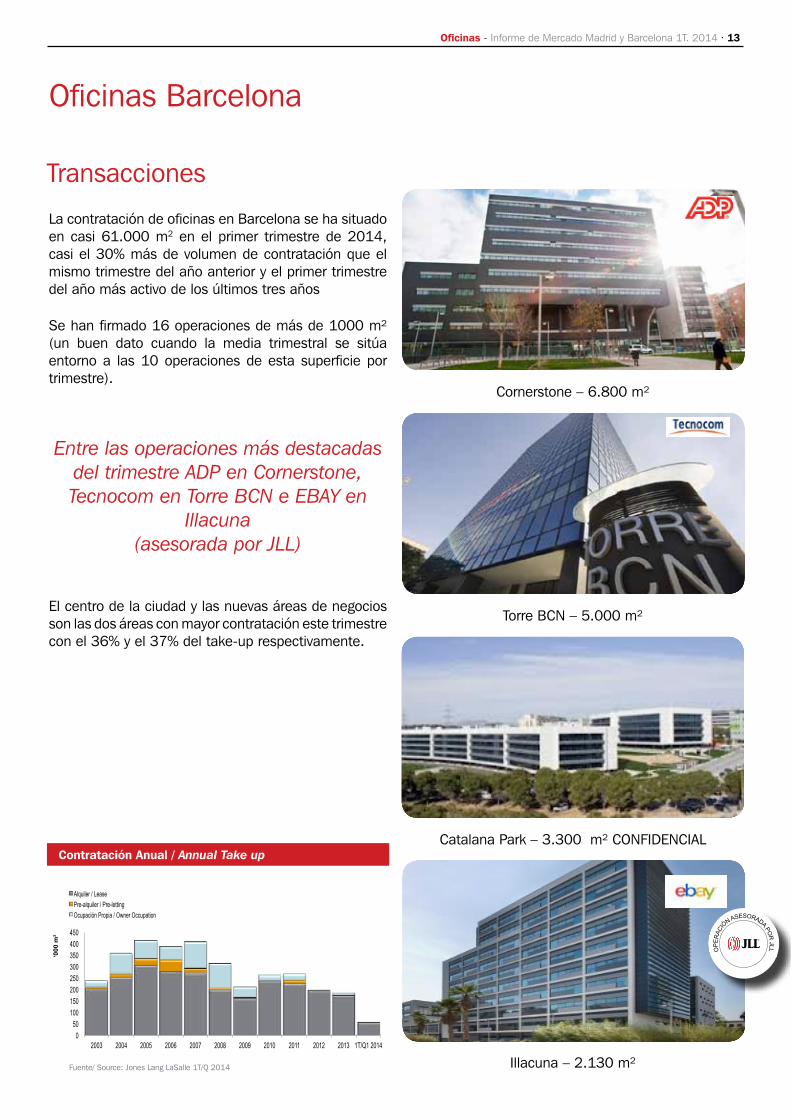
La tasa de disponibilidad en el primer trimestre de 2014 ha descendido del 14,58% a 14,19% y seguirá esta tendencia el resto del año. Únicamente se ha entregado un edificio de 3.220 m² en Avda. Diagonal.
En los próximos meses del 2014 ni durante el 2015 se prevé la entrega de ningún proyecto especulativo al
mercado de oficinas
Si la contratación de oficinas se sitúa en volúmenes anuales entre 200.000 y 250.000 m², a mediados del año próximo puede existir un problema real con la oferta de oficinas en la ciudad condal.
El problema es mucho más grave si sólo tenemos en cuenta los edificios nuevos de oficinas o recién rehabilitados con plantas grandes (superficie). Una empresa grande que desee trasladarse a un edificio nuevo en Barcelona tendrá serios problemas para encontrar producto.
Entendemos que algunos propietarios se plantearán la promoción especulativa de oficinas en breve, siempre que tengan acceso a financiación.
Oferta
0
50
100
150
200
250
2006 2007 2008 2009 2010 2011 2012 2013 2014 2015 2016
‘000 m
�
Oficinas / Offices
*Datos de 1T 2014, sujetos a variaciones del contexto macroeconómico.Q1 2014 data, subject to changes in the macroeconomic environment.
Oferta Futura / Future Supply
Detalle Oferta Futura / Future Supply Detail
3.220
3.220 4.184
0 0
1.000
2.000
3.000
4.000
5.000
6.000
7.000
8.000
9.000
10.000
2.014 2.015 2.016
Ocupacion Propia/Owner Occupation
Especulativo/Speculative
Oficinas Barcelona
Oficinas - Informe de Mercado Madrid y Barcelona 1T. 2014 · 13
0 50
100 150 200 250 300 350 400 450
2003 2004 2005 2006 2007 2008 2009 2010 2011 2012 2013 1T/Q1 2014
‘000
m�
Alquiler / Lease Pre-alquiler / Pre-letting Ocupación Propia / Owner Occupation
Contratación Anual / Annual Take up
Fuente/ Source: Jones Lang LaSalle 1T/Q 2014
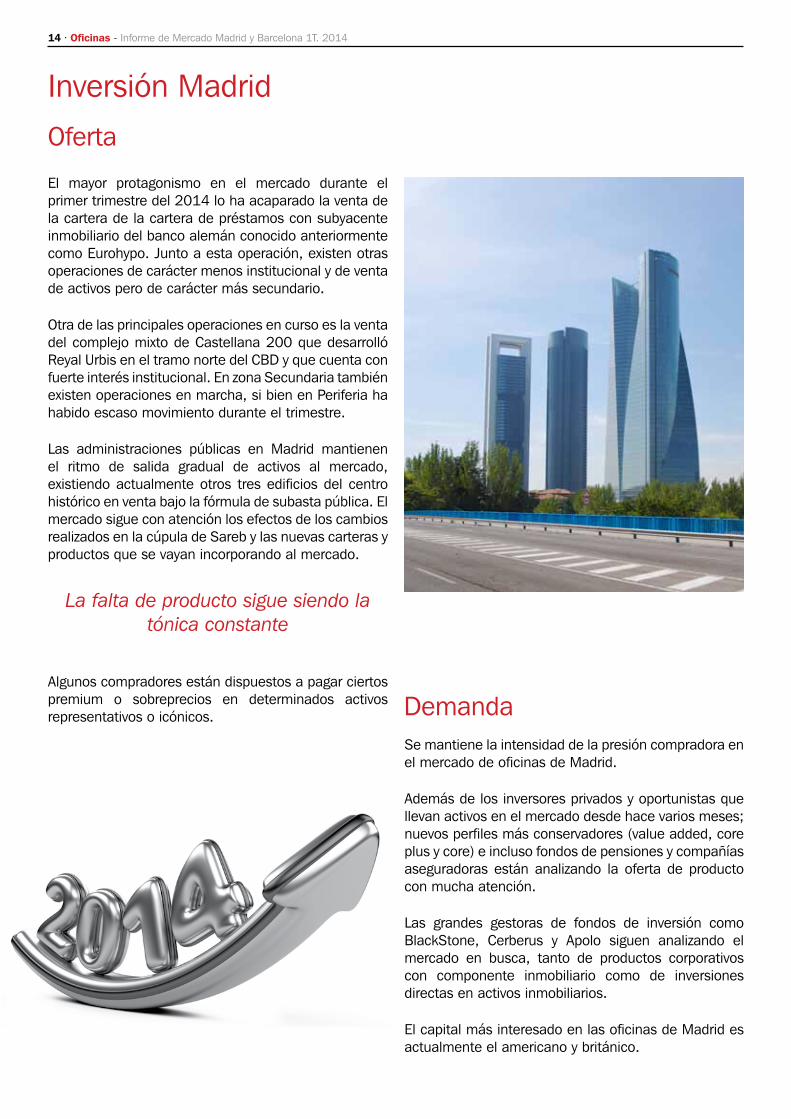
La contratación de oficinas en Barcelona se ha situado en casi 61.000 m2 en el primer trimestre de 2014, casi el 30% más de volumen de contratación que el mismo trimestre del año anterior y el primer trimestre del año más activo de los últimos tres años
Se han firmado 16 operaciones de más de 1000 m² (un buen dato cuando la media trimestral se sitúa entorno a las 10 operaciones de esta superficie por trimestre).
Entre las operaciones más destacadas del trimestre ADP en Cornerstone, Tecnocom en Torre BCN e EBAY en
Illacuna(asesorada por JLL)
El centro de la ciudad y las nuevas áreas de negocios son las dos áreas con mayor contratación este trimestre con el 36% y el 37% del take-up respectivamente.
Transacciones
Oficinas Barcelona
Cornerstone – 6.800 m²
Torre BCN – 5.000 m²
Catalana Park – 3.300 m² CONFIDENCIAL
Illacuna – 2.130 m²
OP
ER
AC
IÓN
ASESORAD
A P
OR
JLL
14 · Oficinas - Informe de Mercado Madrid y Barcelona 1T. 2014
Inversión Madrid
El mayor protagonismo en el mercado durante el primer trimestre del 2014 lo ha acaparado la venta de la cartera de la cartera de préstamos con subyacente inmobiliario del banco alemán conocido anteriormente como Eurohypo. Junto a esta operación, existen otras operaciones de carácter menos institucional y de venta de activos pero de carácter más secundario.
Otra de las principales operaciones en curso es la venta del complejo mixto de Castellana 200 que desarrolló Reyal Urbis en el tramo norte del CBD y que cuenta con fuerte interés institucional. En zona Secundaria también existen operaciones en marcha, si bien en Periferia ha habido escaso movimiento durante el trimestre.
Las administraciones públicas en Madrid mantienen el ritmo de salida gradual de activos al mercado, existiendo actualmente otros tres edificios del centro histórico en venta bajo la fórmula de subasta pública. El mercado sigue con atención los efectos de los cambios realizados en la cúpula de Sareb y las nuevas carteras y productos que se vayan incorporando al mercado.
La falta de producto sigue siendo la tónica constante
Algunos compradores están dispuestos a pagar ciertos premium o sobreprecios en determinados activos representativos o icónicos.
Oferta
Se mantiene la intensidad de la presión compradora en el mercado de oficinas de Madrid.
Además de los inversores privados y oportunistas que llevan activos en el mercado desde hace varios meses; nuevos perfiles más conservadores (value added, core plus y core) e incluso fondos de pensiones y compañías aseguradoras están analizando la oferta de producto con mucha atención.
Las grandes gestoras de fondos de inversión como BlackStone, Cerberus y Apolo siguen analizando el mercado en busca, tanto de productos corporativos con componente inmobiliario como de inversiones directas en activos inmobiliarios.
El capital más interesado en las oficinas de Madrid es actualmente el americano y británico.
Demanda

Oficinas - Informe de Mercado Madrid y Barcelona 1T. 2014 · 15
Inversión Madrid
Se han producido dos operaciones de inversión de oficinas en Madrid: Av. América 115 fue vendida por Solvia al fondo británico London & Regional Properties por 117 M€.
Pramérica ha vendido a Coivisa el edificio Titán 13 por cerca de 28 M€.
Este volumen del inversión en un primer trimestre es el más alto desde 2009, sin tener en cuenta la venta de
la Torre Picasso
Dado que el nivel de rentas sigue muy bajo, los inversores continúan analizando las operaciones que hay con la atención más centrada en los valores €/m² que las rentabilidades.
En productos prime, las rentabilidades muestran tendencia bajista en la se refleja la escasez oportunidades de inversión.
0 1 2 3 4 5 6 7
London
Paris
Hamburg
Frankfurt/M
Milan
Amsterdam
Madrid
Rotterdam
Brussels
Barcelona
Rentabilidades Prime Europeas / European Prime Yields
Fuente/ Source: Jones Lang LaSalle 1T/Q 2014
Transacciones y rentabilidades
Rental Growth Slowing
Rents Falling
Rental Growth Accelerating
Rents Bottoming Out
Athens, Lisbon, Rome Prague
Istanbul
Barcelona, Bucharest, Budapest, Brussels, Copenhagen, Kiev, Madrid, Paris CBD
Oslo, Stuttgart
Amsterdam, Helsinki
London City, London West End
Geneva
Berlin, Dusseldorf, Frankfurt, Hamburg
Luxembourg, Stockholm Warsaw
Edinburgh, Manchester
Munich
St. Petersburg
Zurich Lyon
Dublin
Cologne, Moscow
Milan
Ciclo de Rentas / Property Clock
Fuente/ Source: Jones Lang LaSalle 1T/Q 2014
Note
This diagram illustrates where JLL esti-mate each prime office market is within its individual rental cycle as at end of March 2014
Markets can move around the clock at different speeds and directions
The diagram is a convenient method of comparing the relative position of mar-kets in their rental cycle
Their position is not necessarily repre-sentative of investment or development market prospects
Their position refers to Prime Face Rental Values

16 · Oficinas - Informe de Mercado Madrid y Barcelona 1T. 2014
Inversión Barcelona
La actividad por parte de los inversores está siendo muy intensa este primer trimestre del año. Parece haber inversor para cada oportunidad que aparece en el mercado. Como siempre, las posiciones deberán encontrarse en cuanto a precio.
Estamos viendo una gran agresividad por parte de inversores que quieren hacerse con activos en el centro de
Barcelona
La normativa flexible que tiene gran parte del centro hace que los inversores analicen los activos desde diferentes ángulos.
Pese a que la prioridad es el centro, también la zona del 22@ está siendo estudiada con interés por parte de los inversores, especialmente por parte de inversores internacionales.
La presión por invertir en España y por ende en Barcelona, es tan fuerte que auguramos la continuidad del interés por parte de nuevos inversores en entrar en el mercado y la continuidad de la participación de los clásicos inversores institucionales, así como de los family offices tradicionales.
El inversor tiene claro que el ciclo ha cambiado en lo que respecta a la parte de inversión y es el momento idóneo para las compras.
Demanda
0
500
1.000
1.500
2.000
2.500
3.000
3.500
4.000
4.500
2002
2003
2004
2005
2006
2007
2008
2009
2010
2011
2.01
2
2.01
3
1T/Q
2.0
14
Mill �
Total
Madrid
Barcelona
Volumen de Inversión Total / Total Investment Volume
Fuente/ Source: Jones Lang LaSalle 1T/Q 2014
Sin cambio en la tendencia histórica de Barcelona. Poca oferta de calidad en el mercado. Prácticamente inexistente en el centro de la ciudad, lo que hace que los inversores estén planteando ofertas off-market por los edificios de oficinas céntricos.
Oficialmente en el mercado, destaca el portfolio en venta de la Generalitat, compuesto por 13 edificios, con el uso
de oficinas y equipamientos
El cierre de esta operación produciría una importante palanca en la cifra final del volumen de inversión que se alcance al finalizar el 2014 y dará una imagen muy clara de cuál es el apetito real de los inversores y en qué niveles de precio se mueven.
En breve, se producirán también salidas oficiales a mercado de activos en las nuevas áreas de negocio. Estos activos podrán saciar parte del apetito inversor.
Claramente, los activos de oficinas que forman parte de las grandes carteras de préstamos en venta, también estarán presentes como dinamizadores del mercado de inversión.
Oferta
Oficinas - Informe de Mercado Madrid y Barcelona 1T. 2014 · 17
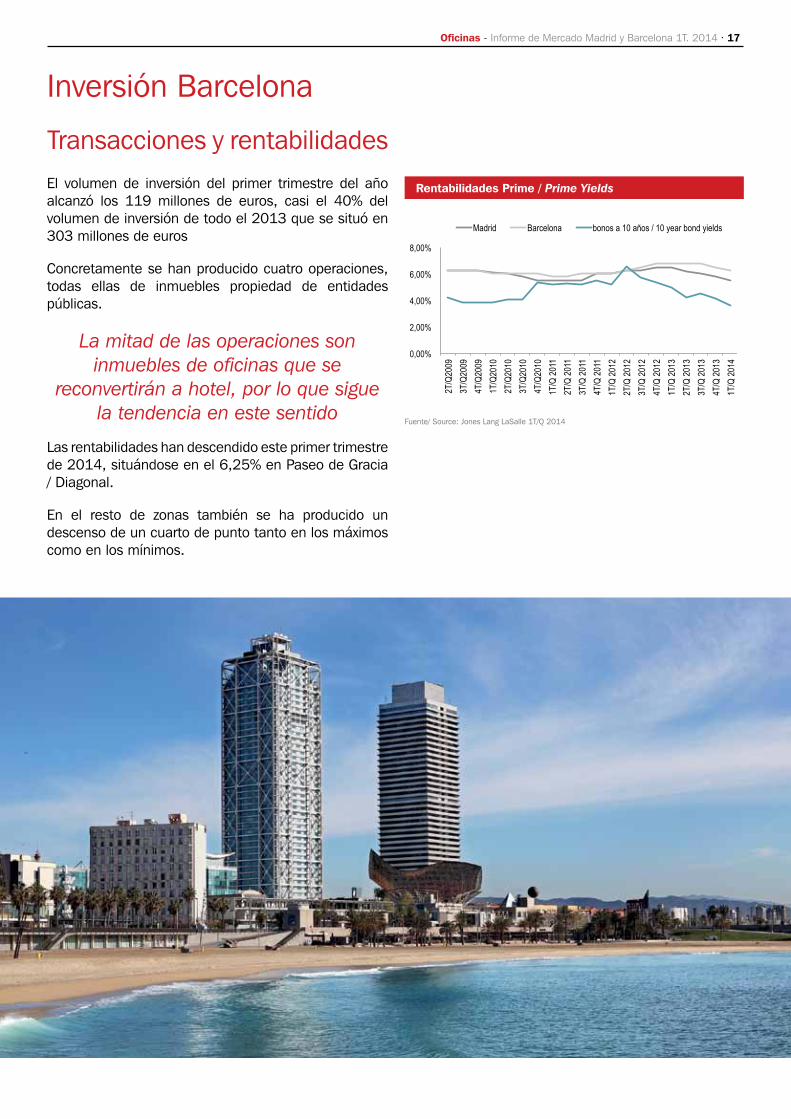
El volumen de inversión del primer trimestre del año alcanzó los 119 millones de euros, casi el 40% del volumen de inversión de todo el 2013 que se situó en 303 millones de euros
Concretamente se han producido cuatro operaciones, todas ellas de inmuebles propiedad de entidades públicas.
La mitad de las operaciones son inmuebles de oficinas que se
reconvertirán a hotel, por lo que sigue la tendencia en este sentido
Las rentabilidades han descendido este primer trimestre de 2014, situándose en el 6,25% en Paseo de Gracia / Diagonal.
En el resto de zonas también se ha producido un descenso de un cuarto de punto tanto en los máximos como en los mínimos.
Transacciones y rentabilidades
0,00%
2,00%
4,00%
6,00%
8,00%
2T/Q
2009
3T/Q
2009
4T/Q
2009
1T/Q
2010
2T/Q
2010
3T/Q
2010
4T/Q
2010
1T/Q
201
1
2T/Q
201
1
3T/Q
201
1
4T/Q
201
1
1T/Q
201
2
2T/Q
201
2
3T/Q
201
2
4T/Q
201
2
1T/Q
201
3
2T/Q
201
3
3T/Q
201
3
4T/Q
201
3
1T/Q
201
4
Madrid Barcelona bonos a 10 años / 10 year bond yields
Rentabilidades Prime / Prime Yields
Fuente/ Source: Jones Lang LaSalle 1T/Q 2014
Inversión Barcelona

Index
�0DGULG�2I¿FHV�� 0DGULG�PDLQ�,QGLFDWRUV� ��
�� 5HQWDO�OHYHOV� � � ��
�� 6XSSO\� � � � ��
�� 7UDQVDFWLRQV� � � ��
%DUFHORQD�2I¿FHV�� %DUFHORQD�PDLQ�,QGLFDWRUV� ��
�� 5HQWDO�OHYHOV� � � ��
�� 6XSSO\��� � � ��
�� 7UDQVDFWLRQV� � � ��
�,QYHVWPHQW�� 0DGULG��� � � ��
�� %DUFHORQD� � � ��

20 · Offices - Market Report Madrid & Barcelona 1Q 2014
����
����
��������
�� �
��!�
������
����������
��������� ������������������ ���������� �������
���� ����
� ��� �����������
���������������
����������� ������������
��� ����� �
�����������������
��!�"�
Tasa de Disponibilidad / Vacancy Rate 12,26%
CBD / CBD 8,88%
Secundaria / Secondary 6,86%
Periferia / Periphery 15,49%
Satélite / Satellite 27,32%
4T / 4Q 2013 1T / 1Q 2014
Tendencia a 12
meses /
12 Month Outlook
Stock / Stock (m2) 15.041.381 15.043.461
Tasa de disponibilidad / Vacancy Rate 11,91% 12,26%
Contratación / Take up * (m2) 105.989 101.550
* incluyendo High-Tech / including Hi-Tech
Madrid main Indicators
Fuente / Source: Jones Lang LaSalle 1 T/Q 2014

Offices - Market Report Madrid & Barcelona 1Q 2014 · 21
Rentas en €/m2/mes /
Rents in €/m2/month
4T / 4Q 20131T / 1Q 2014Tendencia a 12 meses /
12 Month OutlookMin. Max. Min. Max.
CBD / CBD 12,50 24,25 12,50 24,25
Secundaria / Secondary 9,00 14,75 8,75 14,75
Periferia / Periphery 5,50 13,00 5,25 12,50
Satélite / Satellite 4,25 10,00 4,25 10,00
Madrid Offices
Renta Prime / Prime Rent
0,00 �
0,01 �
0,02 �
0,03 �
0,04 �
0,05 �
2003 2004 2005 2006 2007 2008 2009 2010 2011 2012 2013 Dis
poni
bilid
ad /
Vaca
cny
‘000
m� Renta Prime / Prime Rents
Sin incluir hi tech / Hi tech not included Fuente/ Source: Jones Lang LaSalle 1T/Q 2014
Renta Prime / Prime Rent
0 � 5 �
10 � 15 � 20 � 25 � 30 � 35 � 40 � 45 �
1993 1995 1997 1999 2001 2003 2005 2007 2009 2011 2013
�/m�/m
es /
�/m�/m
onth
CBD
Secundaria
Periferia
Satélite
Fuente/ Source: Jones Lang LaSalle 1T/Q 2014
Fuente / Source: Jones Lang LaSalle 1 T/Q 2014
The stability of the rental levels in the prime area at around 24.25 €/m²/month is slowly spreading to other sub-markets, especially in the maximum rental levels of the satellite and secondary areas.
While in the periphery, the oversupply of quality products persists and the very
attractive prices in the CBD are still exercising downward pressure on rental
levels
With a fall of 4.5% with respect to the previous quarter.
While incentives remain at all-time highs in the market as a whole, in prime buildings the incentives are beginning to wane slightly, both in terms of rent-free periods offered and other contributions.
Rental levels

22 · Offices - Market Report Madrid & Barcelona 1Q 2014
SupplyBroadly speaking, vacancies are still gradually stabilising with a slight increase in vacant offices up to 12.2%.
The vacancy of the former Vodafone buildings has triggered an increase in the vacancy rate in the periphery, climbing from 14.17% to 15.49% in the first quarter of 2014. ICEX has still not vacated its current offices due to the need to renovate their new facilities. In view of the lack of other relocations in the short term, the vacancy rate is expected to fall slightly in the second quarter of the year. However, after the summer, the vacancy of CEPSA buildings, mainly in Campo de la Naciones, will once again put upward pressure on this indicator.
Only one small owner-occupied building was completed in the first
quarter of the year,
Increasing stock by around 2,000 m². Offices planned for completion in the period 2014-2016 follow the same trend as in previous periods with only a slight increase scheduled for 2016 in the form of a single new medium-sized project, construction of which should start shortly. Other projects which were expected to be completed in 2017 have been delayed until a future date, awaiting a stabilisation of the economy.
Oferta Futura / Future Supply
Fuente/ Source: Jones Lang LaSalle 1T/Q 2014
0
50
100
150
200
250
300
350
400
2007 2008 2009 2010 2011 2012 2013 2014 2015 2016
‘000 m
�
Oficinas / Offices High-Tech / Hi-Tech
Detalle Oferta Futura / Future Supply Detail
0 10 20 30 40 50 60 70 80 90
100
Oficina / Office High-Tech / Hi-Tech Oficina / Office Oficina / Office
2014 2015 2016
Milla
res Ocupación propia / Owner Occupation
Especulativo / Spec
Disponibilidad / Vacancy
0
500
1.000
1.500
2.000
2003 2004 2005 2006 2007 2008 2009 2010 2011 2012 2013 Dis
poni
bilid
ad /
Vaca
cny
‘000
m� Disponibilidad / Vacancy
Sin incluir hi tech / Hi tech not included Fuente/ Source: Jones Lang LaSalle 1T/Q 2014
Madrid Offices

Offices - Market Report Madrid & Barcelona 1Q 2014 · 23
Fuente/ Source: Jones Lang LaSalle 1T/Q 2014
0 100 200 300 400 500 600 700 800 900
2003 2004 2005 2006 2007 2008 2009 2010 2011 2012 2013 1T/Q 2014
‘000
m�
Alquiler / Lease Pre-alquiler / Pre-letting Ocupación Propia / Owner Occupation High-Tech / Hi-Tech
Contratación Anual / Annual Take up
TransactionsTake-up in 2014 has started with a relatively high figure of over 100,000 m2.
It is the first quarter since 2010 in which the 100,000 m2 threshold
has been breached without a large transaction
Such as those of Vodafone or Cepsa, skewing the results, transactions which, with more than 30,000 m2, represented almost a third of the take-up for the quarter. Transactions in the range of between 1,000 and 3,000 m2 have been particularly prominent, representing around 35% of the take-up in the quarter.
With this trend holding firm and while still awaiting the confirmation of larger transactions (around 10,000 m2), which could change the pace of take-up, the figure for this year is expected to be around 400,000 m2, recovering levels seen in 2010.
As in previous quarters, the most prominent markets have been the CBD and periphery, in which more than 80% of the surface area to be taken up is located. In the CBD the pre-leasing by ICEX of the former Repsol building at Pº de la Castellana 278, which will be occupied once the renovation works are finished, is noteworthy. The biggest transaction in the periphery was for Alstom at Martínez Villergas 49, in which JLL intermediated.
Madrid Offices
Castellana 278 - 15.295 m2
Francisca Delgado 9 - 5.496 m2. ITP
Martínez Villergas 49 - 5.775 m2
Alfonso XII, 62 - 3.657 m2 CONFIDENCIAL
OP
ER
AC
IÓN
ASESORAD
A P
OR
JLL
OP
ER
AC
IÓN
ASESORAD
A P
OR
JLL

24 · Offices - Market Report Madrid & Barcelona 1Q 2014
Barcelona main Indicators
*Incluyendo high-tech / including high tech
A-2
B-23
B-10
B-10
B-10
PRAT DE LLOBREGAT
HOSPITALETDE LLOBREGAT
CORNELLÁDE LLOBREGAT
SANT JOAN DESPÍ
ESPLUGUES DE LLOBREGAT
SANT JUST DESVENT
SANT CUGATDEL VALLÈS
BADALONA
RONDA DALT
RONDA LITORAL
GRAN VIA CORTS CATALANES
DIAGONAL
AP-7
4T / 4Q 2013 1T / 1Q 2014
Tendencia a 12
meses /
12 Month Outlook
Stock / Stock (m2) 6.000.817 6.004.037
Tasa de disponibilidad / Vacancy Rate 14,58% 14,18%
Contratación / Take up (m2) 63.677 60.581
Tasa de Disponibilidad / Vacancy Rate 14,18 %
Pº de Gracia- Diagonal / Pº de Gracia- Diagonal 11,71 %
Centro Ciudad / City Center 8,89 %
Nuevas Áreas de Negocio / New Business Areas 18,00 %
Periferia / Periphery 19,18 %
Fuente/ Source: Jones Lang LaSalle 1T/Q 2014

Offices - Market Report Madrid & Barcelona 1Q 2014 · 25
Barcelona Offices
The stabilising of rental levels appears to be the trend for the coming months in the Barcelona office market.
Rental levels in the prime area currently stand at 17.50 €/m²/month
and the maximum rental levels in other areas remain stable.
We believe that, with a view to the end of the year, we could begin to see a rebound in rental levels due primarily to the lack of quality properties, a clearly falling vacancy rate and a reactivation of economic activity.
Although we are still seeing rent-free periods and attractive contributions, we expect these to wane as the year progresses, especially in better quality properties as owners begin to become aware of the scarcity of supply in this segment.
0 �
5 �
10 �
15 �
20 �
25 �
30 �
2003 2004 2005 2006 2007 2008 2009 2010 2011 2012 2013 1T 2014
Rent
a Pr
ime
/ Prim
e Re
nt �
/m�/m
0 �
5 �
10 �
15 �
20 �
25 �
30 �
1993 1995 1997 1999 2001 2003 2005 2007 2009 2011 2013
�/m�/m
es /
�/m�/m
onth
Rentas por Submercados Submarket Rents
Paseo de Gracia/Diagonal Centro Ciudad Nueva Areas de Negocio Periferia
Renta Prime / Prime Rent
Rentas por submercados / Submarkets Rents
Fuente/ Source: Jones Lang LaSalle 1T/Q 2014
Fuente/ Source: Jones Lang LaSalle 1T/Q 2014
Rentas en €/m2/mes
Rents in €/m2/month
4T / 4Q 2013 1T / 1Q 2014 Tendencia a 12
meses /
12 Month OutlookMin. Max. Min. Max.
Pº de Gracia- Diagonal / Pº de Gracia- Diagonal 13,00 17,50 13,00 17,50
Centro Ciudad / City Center 8,75 14,75 8,75 14,75
Nuevas Áreas de Negocio / New Business Areas 8,25 14,50 8,25 14,50
Periferia / Periphery 5,50 8,00 5,50 8,00
Fuente/ Source: Jones Lang LaSalle 1T/Q 2014
Rental levels

26 · Offices - Market Report Madrid & Barcelona 1Q 2014
Fuente/ Source: Jones Lang LaSalle 1T/Q 2014
0
200
400
600
800
1.000
2003 2004 2005 2006 2007 2008 2009 2010 2011 2012 2013 1T 2014
Dis
poni
bilid
ad /
Vaca
cny
‘000
m� Disponibilidad / Vacancy
Disponibilidad Anual / Annual Vacancy
Fuente/ Source: Jones Lang LaSalle 1T/Q 2014
The vacancy rate in the first quarter of 2014 has fallen from 14.58% to 14.19% and this trend is set continue for the rest of the year. Only one building has been handed over, a property of 3,220 m² on Avda. Diagonal.
We do not expect any speculative development to be added to the
office market either in 2014 or 2015
Taking into account annual office take-up levels of between 200,000 and 250,000 m², by the middle of this year there may be real problems as regards the supply of offices in Barcelona.
The problem is much more acute if we only take into account new office buildings or recently renovated buildings with large floor spaces. A large company wanting to relocate to a new building in Barcelona will have serious problems finding a suitable product.
We are given to understand that certain owners will shortly be considering speculative office developments, provided they are able to gain access to financing.
Supply
0
50
100
150
200
250
2006 2007 2008 2009 2010 2011 2012 2013 2014 2015 2016
‘000 m
�
Oficinas / Offices
*Datos de 1T 2014, sujetos a variaciones del contexto macroeconómico.Q1 2014 data, subject to changes in the macroeconomic environment.
Oferta Futura / Future Supply
Detalle Oferta Futura / Future Supply Detail
3.220
3.220 4.184
0 0
1.000
2.000
3.000
4.000
5.000
6.000
7.000
8.000
9.000
10.000
2.014 2.015 2.016
Ocupacion Propia/Owner Occupation
Especulativo/Speculative
Barcelona Offices

Offices - Market Report Madrid & Barcelona 1Q 2014 · 27
0 50
100 150 200 250 300 350 400 450
2003 2004 2005 2006 2007 2008 2009 2010 2011 2012 2013 1T/Q1 2014
‘000
m�
Alquiler / Lease Pre-alquiler / Pre-letting Ocupación Propia / Owner Occupation
Contratación Anual / Annual Take up
Fuente/ Source: Jones Lang LaSalle 1T/Q 2014
The take-up rate of offices in Barcelona stands at almost 61,000 m2 in the first quarter of 2014, almost 30% more than in the same quarter of 2013 and the most active first quarter for three years.
Some 16 transactions for more than 1,000 m² were signed (a positive figure considering that the average is around 10 transactions for this amount of floor space per quarter).
The most prominent transactions for the quarter include ADP in
Cornerstone, Tecnocom in Torre BCN and eBAY in Illacuna
(advised by JLL)
The city centre and the new business districts are the two areas with the greatest rate of take-up for the quarter accounting for 36% and 37%, respectively.
Transactions
Barcelona Offices
Cornerstone – 6.800 m²
Torre BCN – 5.000 m²
Catalana Park – 3.300 m² CONFIDENTIAL
Illacuna – 2.130 m²
OP
ER
AC
IÓN
ASESORAD
A P
OR
JLL

28 · Offices - Market Report Madrid & Barcelona 1Q 2014
Madrid Investment
Buyers are not letting up their pressure in the Madrid office market. In addition to private and opportunistic investors who have been buying assets in the market for some months now, new, more conservative profiles (value added, core plus and core) and even pension funds and insurance companies are now analysing the supply of products very closely.
Large investment fund managers such as Blackstone, Cerberus and Apollo are still analysing the market in search of both corporate products with a real estate component and direct investments in real estate assets.
British and American capital are currently the most interested in the
Madrid office market.
DemandThe main market move during the first quarter of 2014 was the sale of the loan portfolio with underlying real estate assets by the German bank formerly known as Eurohypo. Together with this transaction, there were other transactions of a less institutional nature and the sale of more secondary assets.
One of the main transactions currently underway is the sale of the mixed-use Castellana 200 complex developed by Reyal Urbis in the Northern section of the CBD which has attracted significant interest from institutional investors. There are also deals in progress in the secondary area, although there has barely been any movement during the quarter.
The public authorities in Madrid are maintaining the pace of gradually putting assets up for sale. There are currently three buildings in the historic core of the city being sold by public auction. The market is closely following the effects of the changes in the governing body of Sareb, and the new portfolios and products which are coming onto the market.
The lack of products continues to be the underlying tone
Which is leading certain buyers to become more open to paying premiums or surcharges on certain landmark or iconic assets.
Supply

Offices - Market Report Madrid & Barcelona 1Q 2014 · 29
Madrid Investment
There have been two investment transactions in Madrid offices: Av. América 115 sold by Solvia to British fund London & Regional Properties for €117 million. Pramérica has sold the Titán building to Coivisa for almost €28 million.
This level of investment in a first quarter is the highest since 2009,
without taking into account the sale of Torre Picasso
Given that the rental levels are still very low, investors are still studying the existing operations with a greater focus on €/m² values than on rental levels. As regards prime products, the rental levels have followed a downward trend, a reflection of the lack of investor opportunities.
0 1 2 3 4 5 6 7
London
Paris
Hamburg
Frankfurt/M
Milan
Amsterdam
Madrid
Rotterdam
Brussels
Barcelona
Rentabilidades Prime Europeas / European Prime Yields
Fuente/ Source: Jones Lang LaSalle 1T/Q 2014
Transactions & yields levels
Rental Growth Slowing
Rents Falling
Rental Growth Accelerating
Rents Bottoming Out
Athens, Lisbon, Rome Prague
Istanbul
Barcelona, Bucharest, Budapest, Brussels, Copenhagen, Kiev, Madrid, Paris CBD
Oslo, Stuttgart
Amsterdam, Helsinki
London City, London West End
Geneva
Berlin, Dusseldorf, Frankfurt, Hamburg
Luxembourg, Stockholm Warsaw
Edinburgh, Manchester
Munich
St. Petersburg
Zurich Lyon
Dublin
Cologne, Moscow
Milan
Ciclo de Rentas / Property Clock
Fuente/ Source: Jones Lang LaSalle 1T/Q 2014
Note
This diagram illustrates where JLL esti-mate each prime office market is within its individual rental cycle as at end of March 2014
Markets can move around the clock at different speeds and directions
The diagram is a convenient method of comparing the relative position of mar-kets in their rental cycle
Their position is not necessarily repre-sentative of investment or development market prospects
Their position refers to Prime Face Rental Values

30 · Offices - Market Report Madrid & Barcelona 1Q 2014
Barcelona Investment
There was intense investment activity during this first quarter of the year.
There seems to be an investor for each opportunity appearing on the
market. As usual, positions are found based on price
We are seeing notable aggressiveness by investors who want to acquire assets in Barcelona’s core area. Flexible regulations in most of the centre lead investors to analyse assets from several different angles.
Although the centre remains the priority, the 22@ area is also being studied by investors with great interest, especially by international investors.
The pressure to invest in Spain and, therefore, in Barcelona, is so intense that we foresee continued interest by new investors entering the market and continued participation by long-standing institutional investors, as well as traditional family offices.
Investors clearly believe that the cycle has changed regarding investment and that now is the ideal moment for acquisitions.
Demand
0
500
1.000
1.500
2.000
2.500
3.000
3.500
4.000
4.500
2002
2003
2004
2005
2006
2007
2008
2009
2010
2011
2.01
2
2.01
3
1T/Q
2.0
14
Mill �
Total
Madrid
Barcelona
Volumen de Inversión Total / Total Investment Volume
Fuente/ Source: Jones Lang LaSalle 1T/Q 2014
No changes in Barcelona’s historical trend. There is a scarcity of high-quality products on the market.
There is practically no offer in the city centre, leading investors to consider off-market offers for centrally located
office buildings
Officially on the market, the Regional Government’s portfolio for sale comprising 13 buildings given over to office and public facilities use is particularly noteworthy. Closure of this operation would have a significant effect on the final investment volume reached during 2014, and will give a very clear image of investors’ true appetite as well as the current price levels.
New assets will officially be put on the market very soon in new business districts. These assets could serve to satisfy investment appetite.
Clearly, office assets forming part of the main loan portfolios for sale will also serve to invigorate the investment market.
Supply

Offices - Market Report Madrid & Barcelona 1Q 2014 · 31
The investment volume for the first quarter of the year reached €119 million, nearly 40% of the investment volume for the whole of 2013, which reached €303 million.
Specifically, four operations have taken place, all of them involving properties belonging to public bodies.
Half of these operations involved office property which will be transformed into hotels, thus maintaining the current trend
Yield levels have decreased in the first quarter of the year, down to 6.25% in Paseo de Gracia/Diagonal. In the remaining areas there has also been a decrease of a quarter of a point, both in maximum and in minimum values.
Transactions & yields levels
0,00%
2,00%
4,00%
6,00%
8,00%
2T/Q
2009
3T/Q
2009
4T/Q
2009
1T/Q
2010
2T/Q
2010
3T/Q
2010
4T/Q
2010
1T/Q
201
1
2T/Q
201
1
3T/Q
201
1
4T/Q
201
1
1T/Q
201
2
2T/Q
201
2
3T/Q
201
2
4T/Q
201
2
1T/Q
201
3
2T/Q
201
3
3T/Q
201
3
4T/Q
201
3
1T/Q
201
4
Madrid Barcelona bonos a 10 años / 10 year bond yields
Rentabilidades Prime / Prime Yields
Fuente/ Source: Jones Lang LaSalle 1T/Q 2014
Barcelona Investment

COPYRIGHT © JONES LANG LASALLE IP, INC. 2014. All rights reserved. No part of this publication may be reproduced or transmitted in any form or by any means without prior written consent of Jones Lang LaSalle. It is based on material that we believe to be reliable. Whilst every effort has been made to ensure its accuracy, we cannot offer any warranty that it contains no factual errors.
We would like to be told of any such errors in order to correct them.
Contactos Agencia Oficinas
José Miguel Setién
Director Agencia Oficinas [email protected]
Elena Torres
Directora Agencia Oficinas [email protected]
Contactos Inversión
Juan Manuel Ortega
Director Capital Markets Oficinas [email protected]
Xavier Cotet
Director Capital Markets Oficinas [email protected]
Madrid
Pº de la Castellana, 51- 5ª28046Tel.: 91 789 11 00Fax: 91 789 12 00
Barcelona
Pº de Gracia, 11- 4ª, esc A08007Tel.: 93 318 53 53Fax: 93 301 29 99
Sevilla
S. Fco. Javier, 20- 3ª. 31441018Tel.: 95 493 46 00Fax: 95 493 46 23
Oficinas de Jones Lang LaSalle en España
jll.es jllinmuebles.es jllestudiosmercado.es
Puede seguirnos también en las siguientes redes sociales:
You can follow us in social networks: