gamma irradiation improves the extractability of phenolic ...gamma irradiation improves the...
TRANSCRIPT
1
Gamma irradiation improves the extractability of phenolic compounds
in Ginkgo biloba L.
Eliana Pereiraa,b, Lillian Barrosa,*, Montserrat Dueñasb, Amilcar L. Antonioa,c, Celestino
Santos-Buelgab, Isabel C.F.R. Ferreiraa,*
aCentro de Investigação de Montanha (CIMO), ESA, Instituto Politécnico de Bragança,
Campus de Santa Apolónia, 1172, 5301-855 Bragança, Portugal.
bGIP-USAL, Facultad de Farmacia, Universidad de Salamanca, Campus Miguel de
Unamuno, 37007 Salamanca, Spain.
cCentro de Ciências e Tecnologias Nucleares (C2TN/IST), Universidade de Lisboa,
Estrada Nacional 10, 2686-953 Sacavém, Portugal.
*Authors to whom correspondence should be addressed (e-mail: [email protected];
telephone +351-273-303219; fax +351-273-325405 and e-mail: [email protected];
telephone +351-273-303903; fax +351-273-325405).
2
ABSTRACT
Irradiation has been increasingly recognized as an effective decontamination technique
that ensures the chemical and organoleptic quality of medicinal and aromatic plants.
The aim of the present study was to evaluate the effects of gamma irradiation in the
phenolic compounds of Ginkgo biloba L. (infusion and methanol/water extract), widely
used in traditional medicine and in dietary supplements. Twenty-five compounds were
detected, eighteen of which were flavonoids, one phenolic acid, five terpene lactones
and one unknown compound. Among the quantified phenolic compounds, flavonoids
were the main group present, being two kaempferol derivatives the major compounds
found: kaempferol-3-O-dirhamnosylglucoside and kaempferol-3-O-rutinoside. The
irradiation with the highest dose (10 kGy) is sufficient to guarantee the product
disinfestation and microbial decontamination, also contributing to an increase in the
extractability of phenolic compounds, both in methanol/water and infusion preparations.
Keywords: Ginkgo biloba; Phenolic compounds; Gamma irradiation.
3
1. Introduction
The interest for natural antioxidants has been increasing over the years. Phenolic
compounds comprise a very large group of biologically active molecules, being
appreciated for their beneficial effects on health (physiologically active compounds with
anti-allergic, anti-atherogenic, antimicrobial, antithrombotic, anti-inflammatory,
antioxidant, cardioprotective and vasodilatory effects) (Mendel and Youdim, 2004;
Balasundram et al., 2006; Martins et al., 2011). Their mechanism of action as
antioxidants is considered essential regarding the reduction of the oxidation processes in
the body, playing an important role in maintaining health, including protection of the
cells and biomacromolecules and, therefore, intervening against certain human diseases
(cancer, inflammatory diseases, neurological degeneration, heart disease, and many
others) (Lan et al., 2007; Rawat et al., 2011; Acosta-Estrada et al., 2014). Thus, the
most cited forms of intervention of antioxidant potential of phenolic compounds are
their ability to scavenge reactive oxygen species and to chelate metal ions (Port's et al.,
2013).
Plants are some of the most important sources of natural antioxidants including phenolic
compounds (e.g., phenolic acids and flavonoids, phenolic diterpenes and tannins),
which have been related with the bioactivity of several medicinal plants (Sati et al.,
2013). One of those plants that has been highly studied is Ginkgo biloba L., due to its
use in traditional medicine, but also by professionals in the medical field in order to
treat problems typically associated with aging, such as intermittent claudication,
decreased mental vitality in old age (mental confusion, memory loss, dementia praecox,
concentration problems), poor circulation and tinnitus (Diamond et al., 2000). The
extracts from G. biloba, such as EGb761 in Tebonin®, are also used as alternative
therapy against Alzheimer's disease (van Beek and Montoro, 2009; Parimoo et al.,
4
2014). The products with this plant are commercially available in various forms: leaves
for infusions preparation, standardized extracts, pills, capsules or oral solutions (Liu et
al., 2014).
The effectiveness of the therapeutic use of this plant leads to a strong demand from the
pharmaceutical industry (Koch, 2005). However, due to the strict hygiene standards
applied for raw materials to be incorporated into pharmaceuticals and/or dietary
supplements, efficient decontamination methods are necessary, avoiding other
alternatives that may leave chemical residues in the plant (Haleem et al., 2014).
The use of irradiation has been increasingly accepted for decontamination and
conservation, since it does not significantly affect (at specific doses) the organoleptic
and physico-chemical properties of the irradiated matrices (Alothman et al., 2009;
Kirkin et al., 2014), including G. biloba (Pereira et al., 2015). This method reduces
reliance on chemical fumigants (ethylene oxide and methyl bromide), which have been
pointed out as mutagens and carcinogens to humans, leave chemical residue on plants
and destroy the ozone layer in the atmosphere (Migdal & Owczarczyk, 1998;
Chmielewski & Migdal, 2005).
Therefore, this study aims to evaluate if gamma irradiation (at doses of 1 and 10 kGy)
improves the extraction of phenolic compounds using Ginkgo biloba (infusion and
methanolic extract) as source material.
2. Materials and methods
2.1. Samples and samples irradiation
Ginkgo biloba L. samples were supplied by Américo Duarte Paixão Lda., Alcanede
(Portugal), imported from China, as dry leaves material. The botanical identification
was confirmed by the biologist, Dr. Carlos Aguiar of the Escola Superior Agrária of the

5
Polytechnic Institute of Bragança (Trás-os-Montes, Portugal). The samples were
divided into three groups: control (non-irradiated, 0 kGy), group 1 and group 2, where 1
kGy and 10 kGy were, respectively, the predicted doses.
The irradiation was performed in a Co-60 experimental chamber (Precisa 22, Graviner
Manufacturing Company Ltd., UK) with total activity 177 TBq (4.78 kCi), in
September 2013, and the estimated dose rate for the irradiation position was obtained
with Fricke dosimeter. During irradiation process, the dose was estimated using Amber
Perspex routine dosimeters (batch V, from Harwell Company, U.K.), following the
procedure previously described by Pereira et al. (2015). The estimated doses, dose rates
and dose uniformity ratios (Dmax/Dmin) were, respectively: 1.20 ± 0.07 kGy, 2.57 ± 0.15
kGy h–1, 1.20 for sample 1 and 8.93 ± 0.14 kGy, 1.91 ± 0.03 kGy h–1, 1.02 for sample 2.
For simplicity, in the text and tables we considered the values 0, 1 and 10 kGy, for the
doses of non-irradiated and irradiated groups 1 and 2, respectively.
After irradiation, the samples were reduced to powder and mixed to obtain
homogenized samples for subsequent analysis.
2.2. Standards and Reagents
For irradiation: To estimate the dose and dose rate of irradiation a chemical solution
sensitive to ionizing radiation, Fricke dosimeter, prepared in the lab following the
standards (ASTM, 1992) and Amber Perspex dosimeters (batch V, from Harwell
Company, UK) were used. The acid aqueous Fricke dosimeter solution was prepared
using ferrous ammonium sulfate(II) hexahydrate, sodium chloride and sulfuric acid, all
purchased from Panreac S.A. (Barcelona, Spain) with purity PA (proanalysis), and
water treated in a Milli-Q water purification system (Millipore, model A10, USA).
6
For chemical analyses: HPLC-grade acetonitrile was obtained from Merck KgaA
(Darmstadt, Germany). Formic acid was purchased from Prolabo (VWR International,
Fontenay-sous-Bois, France). Phenolic standards were from Extrasynthèse (Genay,
France). Water was treated in Milli-Q water purification system (TGI Pure Water
Systems, Greenville, SC, USA).
2.3. Phenolic compounds
2.3.1. Extraction procedure
Methanol/water extracts: each sample (1 g) was extracted with 30 mL of
methanol/water 80:20 (v/v) at room temperature, 150 rpm, for 1 h. The extract was
filtered through Whatman 4 paper. The residue was then re-extracted twice, with
additional 30 mL portions of methanol/water 80:20 (v/v). The combined extracts were
evaporated under reduced pressure (rotary evaporator Büchi R-210), until complete
removal of methanol. The aqueous phase was lyophilized (FreeZone 4.5, Labconco,
Kansas City, MO, USA) (Barros et al., 2013).
Infusions preparation: each sample (1 g) was added to 200 mL of boiling distilled water
and left to stand at room temperature for 5 min, and then filtered under reduced
pressure; afterwards the obtained infusion was frozen and lyophilized (Barros et al.,
2013).
Methanol/water extracts and lyophilized infusions were re-dissolved in 20% aqueous
methanol and water, respectively, at 20 mg/mL and filtered through a 0.22 µm
disposable LC filter disc for High Performance Liquid Chromatography (HPLC)
analysis.
2.3.2. Analysis of phenolic compounds
7
Phenolic compounds were determined by HPLC (Hewlett-Packard 1100, Agilent
Technologies, Santa Clara, CA, USA) as previously described by the authors (Barros et
al., 2013). Double online detection was carried out in a DAD using 280 nm and 370 nm
as preferred wavelengths and in a mass spectrometer (API 3200 Qtrap, Applied
Biosystems, Darmstadt, Germany) connected to the HPLC system via the DAD cell
outlet. The phenolic compounds were characterized according to their UV and mass
spectra and retention times, and comparison with authentic standards when available.
The phenolic compounds were identified by comparing their retention time, UV–vis and
mass spectra with those obtained from standard solutions, when available. Otherwise,
peaks were tentatively identified comparing the obtained information with available
data reported in the literature. For quantitative analysis, a calibration curve for each
available phenolic standard was constructed based on the UV signal. For the identified
phenolic compounds for which a commercial standard was not available, the
quantification was performed through the calibration curve of other compounds from
the same phenolic group. The results were expressed in mg/g of methanol/water extract
and lyophilized infusion.
2.4. Statistical analysis
Three samples from each group were analysed and all the assays were carried out in
triplicate. The results are expressed as mean values±standard deviation (SD). The
results were analyzed using one-way analysis of variance (ANOVA) followed by
Tukey’s HSD Test with α = 0.05. This treatment was carried out using SPSS v. 22.0
program (IBM Corp.).
3. Results and Discussion
8
3. Results and Discussion
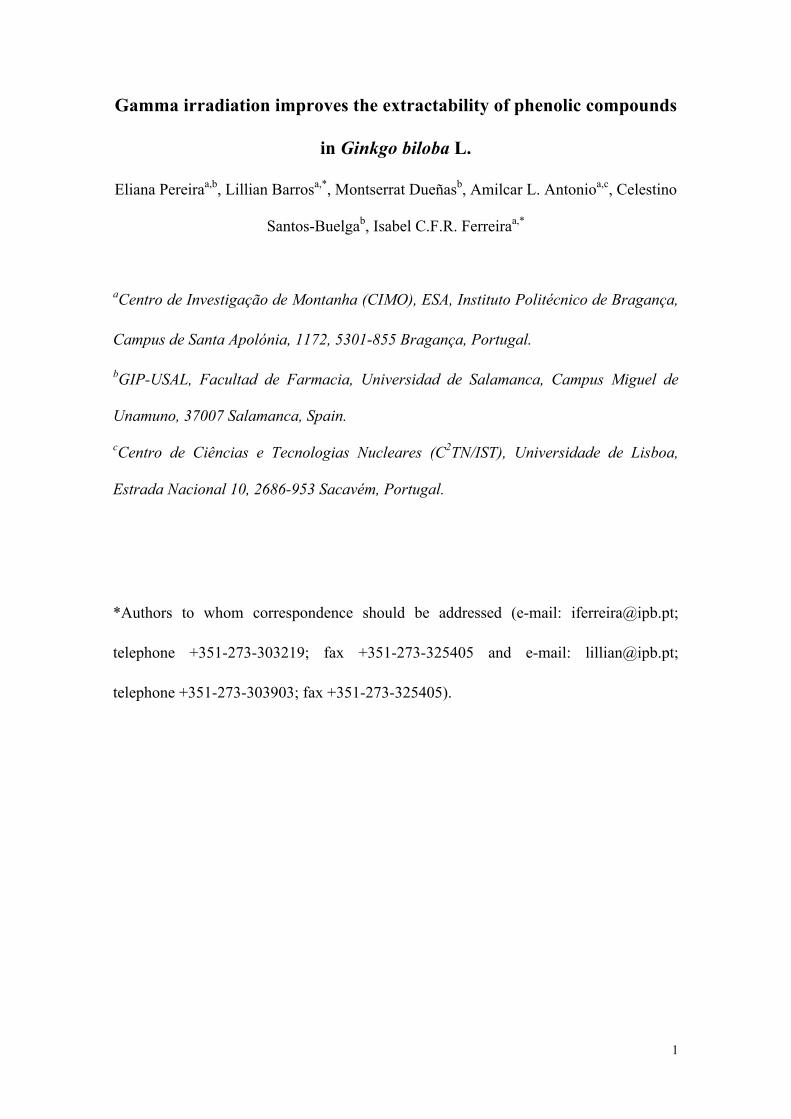
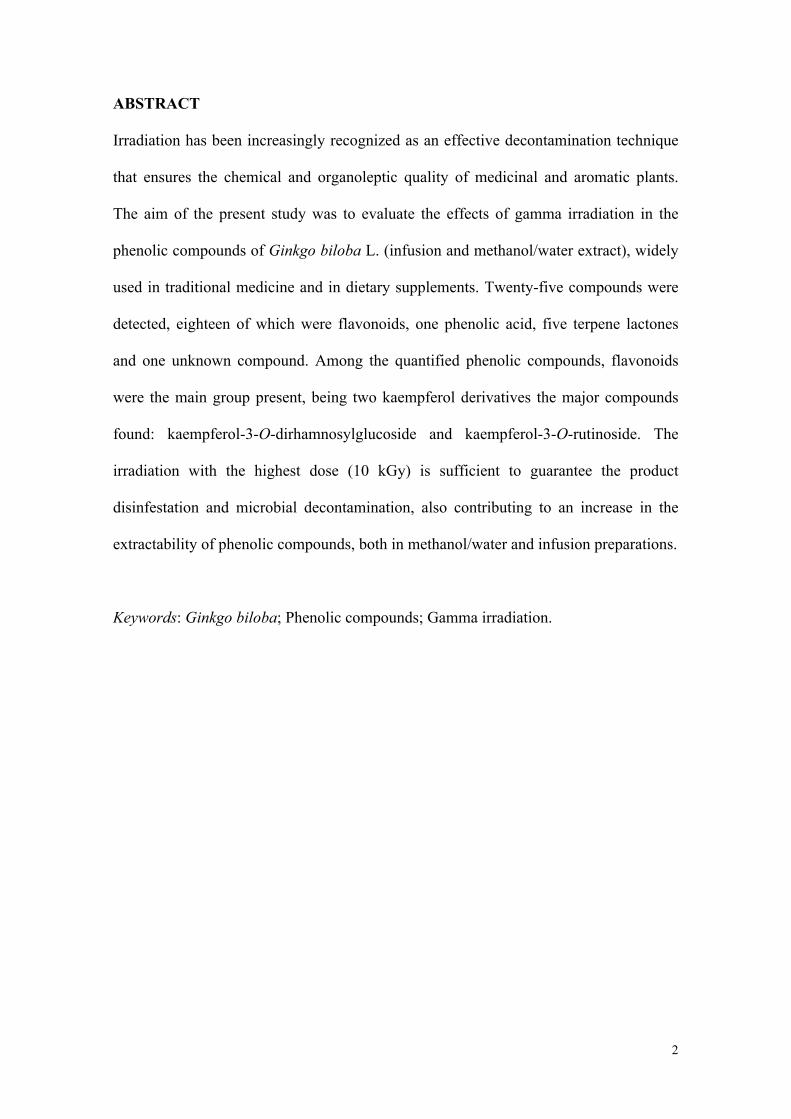
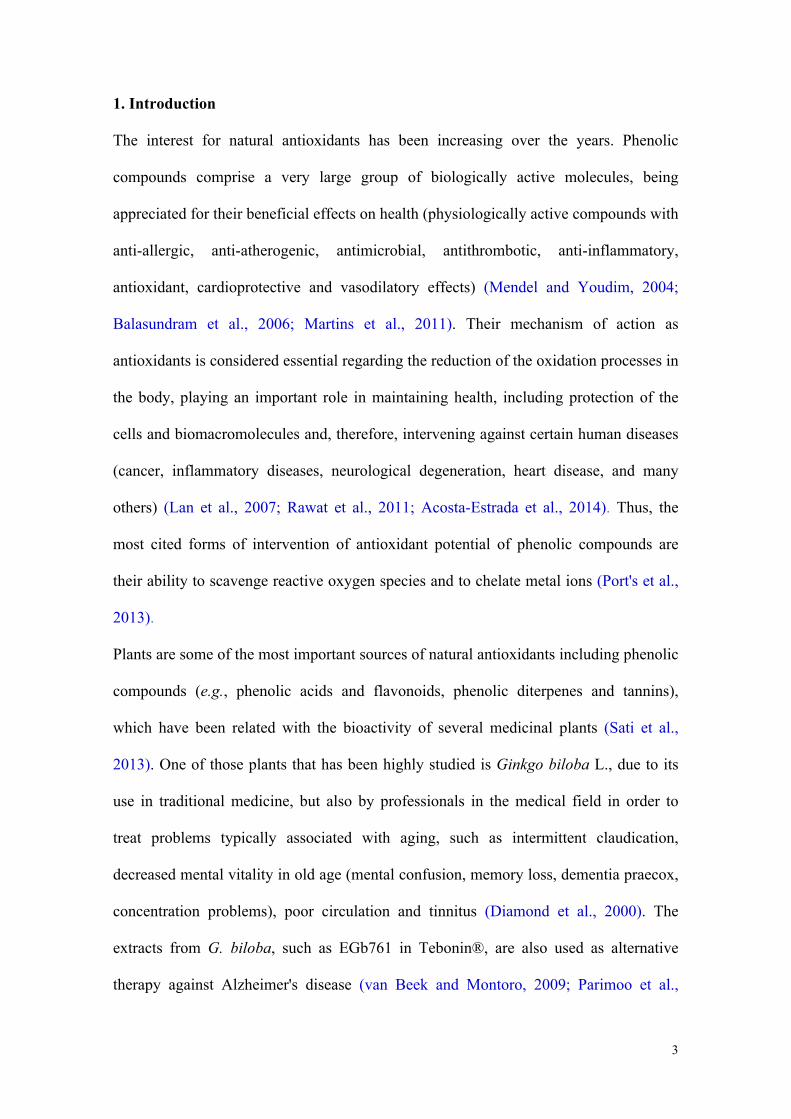
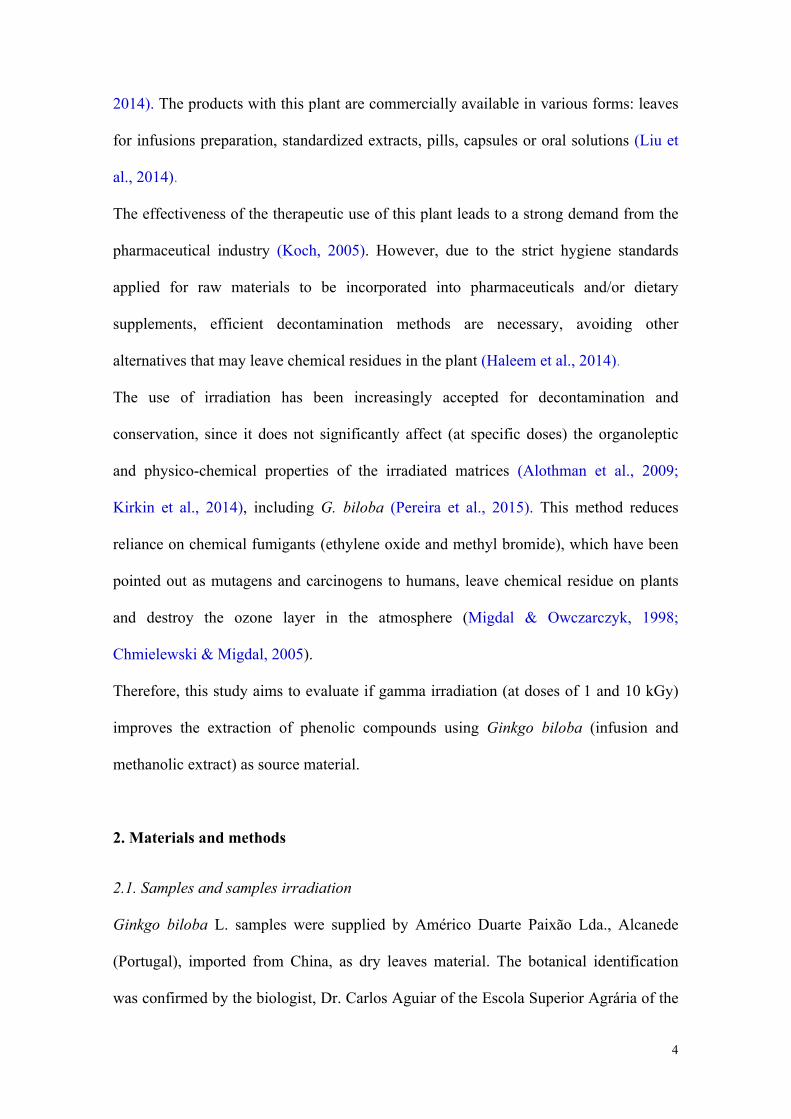
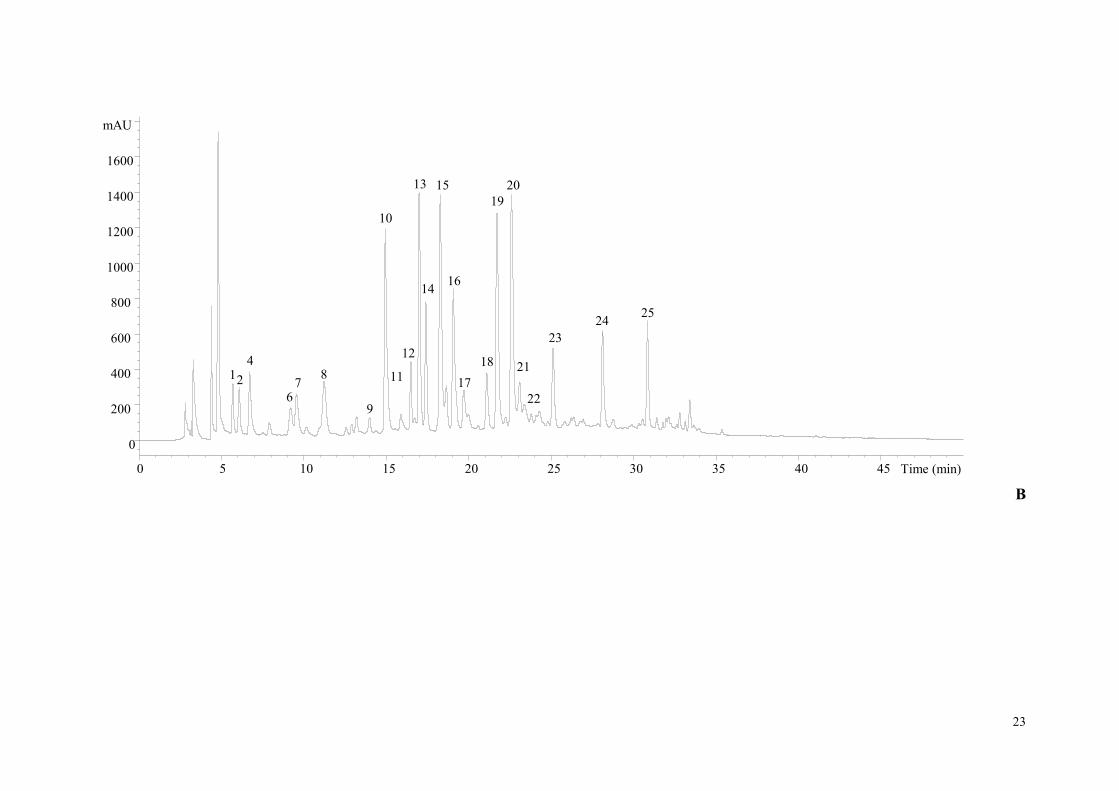
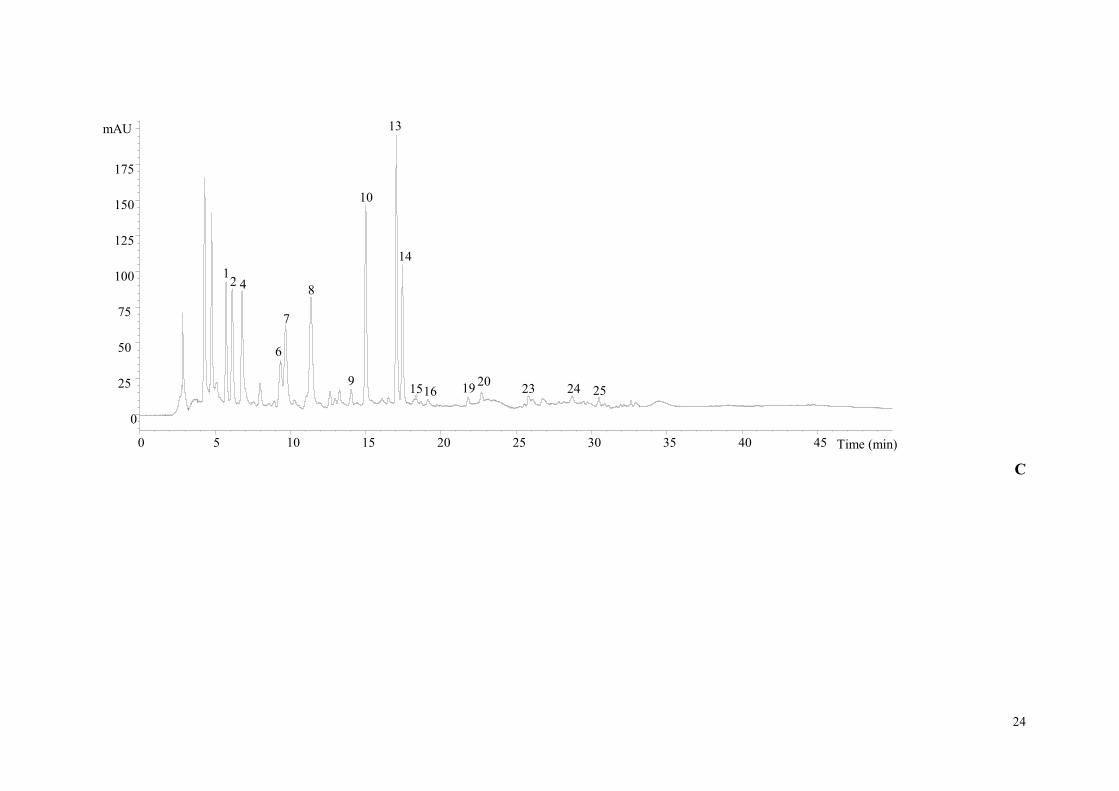
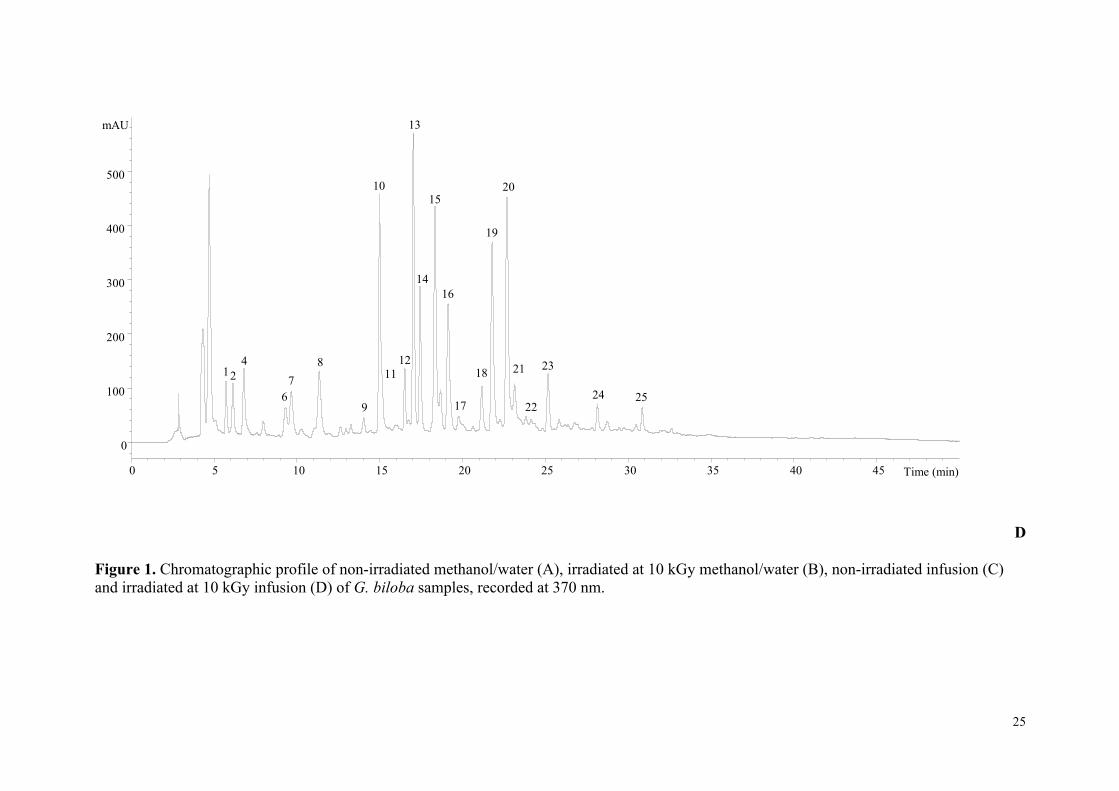
The chromatographic profile of non-irradiated and irradiated at 10 kGy G. biloba
samples, obtained after methanol/water extraction, and recorded at 370 nm is shown in
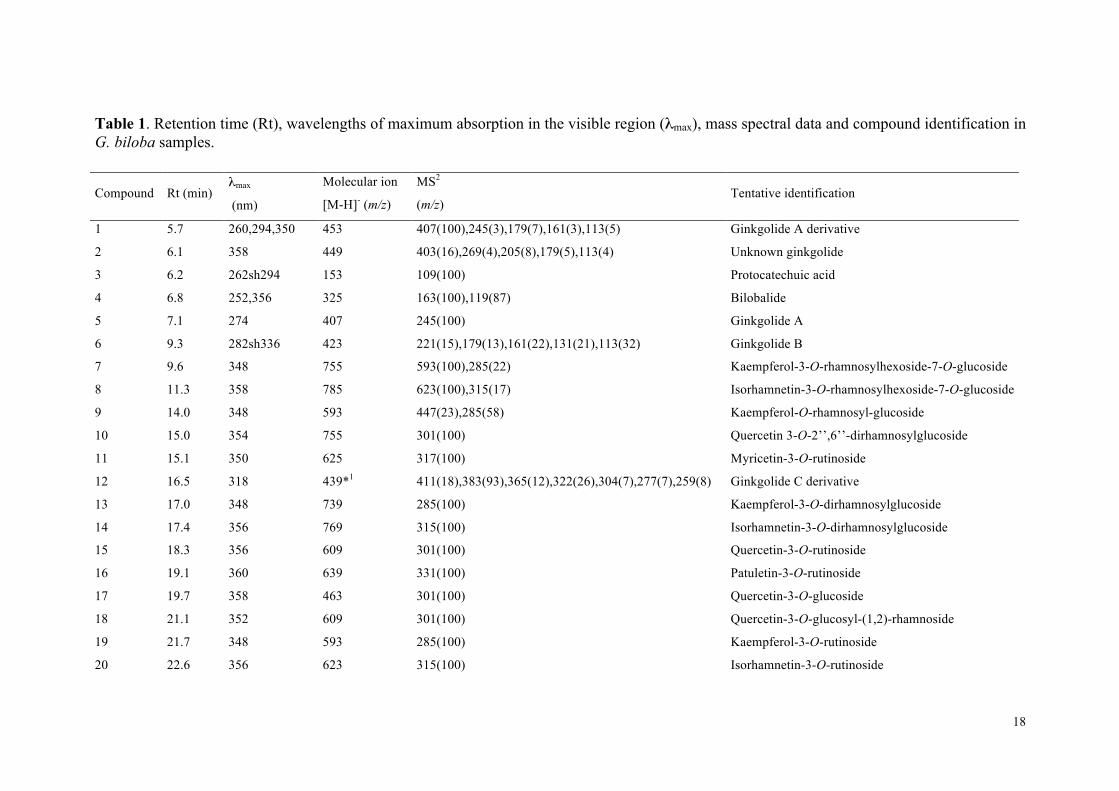
Figure 1; compound characteristics and tentative identities are presented in Table 1.
Twenty-five compounds were detected, eighteen of which were flavonoids, one
phenolic acid, five terpene lactones and one unknown compound.
Protocatechuic acid (compound 3), myricetin-3-O-rutinoside (compound 11), quercetin-
3-O-rutinoside (compound 15), quercetin-3-O-glucoside (compound 17), kaempferol-3-
O-rutinoside (compound 19), isorhamnetin-3-O-rutinoside (compound 20) and
isorhamnetin-3-O-glucoside (compound 22) were positively identified according to
their retention, mass and UV-vis characteristics by comparison with commercial
standards. All the compounds mentioned above, with the exception of protocatechuic
acid were previously reported in leaves of G. biloba (Tang et al., 2001; Zhang et al.,
2007; Ding et al., 2008; Lin et al., 2008).
Peaks 1, 2, 4-6 and 12 were associated to terpene trilactones. That type of compounds
have low UV absorption and coexisting substances present in the complex matrix of G.
biloba extracts make it difficult for their detection and quantification, using UV
detection (Sloley et al., 2003; Mesbah et al., 2005). Nonetheless, they could be detected
in the analysed extracts and tentatively identified based on their MS characteristics and
comparison with data reported in the bibliography (Bedir et al., 2002; van Beek, 2002;
Ding et al., 2008; Lin et al., 2008; van Beek and Montoro, 2009; Rossi et al., 2011; Liu
et al., 2014); in particular, bilobalide (compound 4), ginkgolide A (compound 5),
ginkgolide B (compound 6) and ginkgolide C derivative (compound 12). The latter
compound should correspond to a derivative of ginkgolide C, since ginkgolide C would
be expected to elute earlier than ginkgolide A and B (Ding et al., 2008; Lin et al., 2008;

9
van Beek & Montoro, 2009). No identification could be assigned to compound 1
([M−H]- at m/z 453), although the major m/z fragment at 407 might point to it was a
derivative of ginkgolide A. No conclusions could be drawn about the identity and nature
of compound 2 ([M-H]- at m/z 449). Three compounds with the same pseudomolecular
ion were also detected by Ding et al. (2008) in G. biloba supplements, which were
assigned as unknown glycosyl flavonoids. However, the flavonoid nature of the
compound was not clear in our samples, but the presence of MS2 fragments at m/z 179
and 113 also observed in compounds 1 and 6 rather suggested that it could be a
ginkgolide, which remained unknown.
The rest of compounds showed UV and mass characteristics coherent with flavonol
glycosides. Compounds 9, 19 and 23 ([M-H]- at m/z 593) presented characteristics that
match a structure of kaempferol bearing deoxyhexosyl and hexosyl residues. Ding et al.
(2008) also detected three compounds with the same mass in G. biloba supplements, all
of them identified as kaempferol-O-rhamnosyl-glucoside. Zhang et al. (2007) and Lin et
al. (2008) also found two compounds with similar characteristics in G. biloba leaves,
one of them kaempferol-3-O-rutinoside (positively identified as peak 19 in our samples)
and the other one as kaempferol-3-O-glucosyl-(1,2)-rhamnoside. This latter identity was
assumed for peak 23 owing to its delayed elution in relation to peak 19, as reported by
those authors. As no further information was available for compound 9 it was just
assigned as a kaempferol-O-rhamnosyl-glucoside. Similar reasoning was applied for the
identification of compounds 15 and 18 showing the same pseudomolecular ion [M-H]-
at m/z 609, which were respectively identified as quercetin-3-O-rutinoside and
quercetin-3-O-glucosyl-(1,2)-rhamnoside, as also reported Zhang et al. (2007) and Lin
et al. (2008).

10
Compounds 7, 10 and 24 presented the same pseudomolecular ion [M-H]- at m/z 755.
Their MS2 spectra pointed to they are derived from different aglycones, i.e., kaempferol
(7) and quercetin (10 and 24). Different compounds with similar UV and mass
characteristics were reported by Lin et al. (2008) and Ding et al. (2008) in G. biloba
leaves and supplements. Compound 7 would correspond to a kaempferol derivative
bearing one deoxyhexosyl and two hexosyl residues; the observation of a main MS2
fragment at m/z 593 from the lost of the hexosyl residue suggested that this latter was
located at a different position of the other two glycosyl moieties that could be
constituting a disaccharide. Although no information about the actual nature and
position of the sugar substituents can be obtained from the available data, based on the
previous comments assumption and the identification made by Lin et al. (2008) the
compound was tentatively assigned as kaempferol-3-O-rhamnosylhexoside-7-O-
glucoside. Characteristics of compound 10 were consistent with a quercetin derivative
possessing two deoxyhexosyl and one hexosyl residues. The fact that only one MS2
fragment was released corresponding to the aglycone (i.e., m/z at 301, quercetin) would
suggest that the three sugars constituted a trisaccharide; based on this assumption the
compound was tentatively identified as quercetin 3-O-2’’,6’’-dirhamnosylglucoside
reported in G. biloba leaves by Lin et al. (2008). Compound 24 showed different UV
and MS2 spectra than compound 10, presenting maximum wavelength at 316 nm and an
additional minor MS2 fragment at m/z 609 (loss of 146 mu that may correspond to either
a rhamnosyl or a p-coumaroyl moiety), due to its delayed retention time and previous
identifications of similar compounds by Lin et al. (2008) and Ding et al. (2008), this
compound was tentatively assigned as quercetin-3-O-p-coumaroyl-rhamnosylhexoside.
Similar reasoning was applied for assigning compounds 13 and 25, both showing
pseudomolecular ions [M-H]- at m/z 739, which were tentatively identified respectively

11
as kaempferol-3-O-dirhamnosylglucoside and kaempferol-3-O-p-coumaroyl-
rhamnosylhexoside, as also proposed by Lin et al. (2008).
Mass spectra characteristics of compounds 8 ([M-H]- at m/z 785) and 14 ([M-H]- at m/z
769) were similar to those of compounds 7 and 13 respectively, but derived from an
isorhamnetin aglycone as revealed by the MS2 fragment produced at m/z 315. Based on
this observation and previous identifications by Lin et al. (2008), these compounds were
respectively assigned as isorhamnetin-3-O-rhamnosylhexoside-7-O-glucoside and
isorhamnetin-3-O-dirhamnosylglucoside. Compounds 16 ([M-H]- at m/z 639) and 21
([M-H]- at m/z 447) were assigned as patuletin-3-O-rutinoside and quercetin-3-O-
rhamnoside, owing the identification of these compound in leaves from G. biloba by
Lin et al. (2008) and the latter one also by Yao et al. (2013).
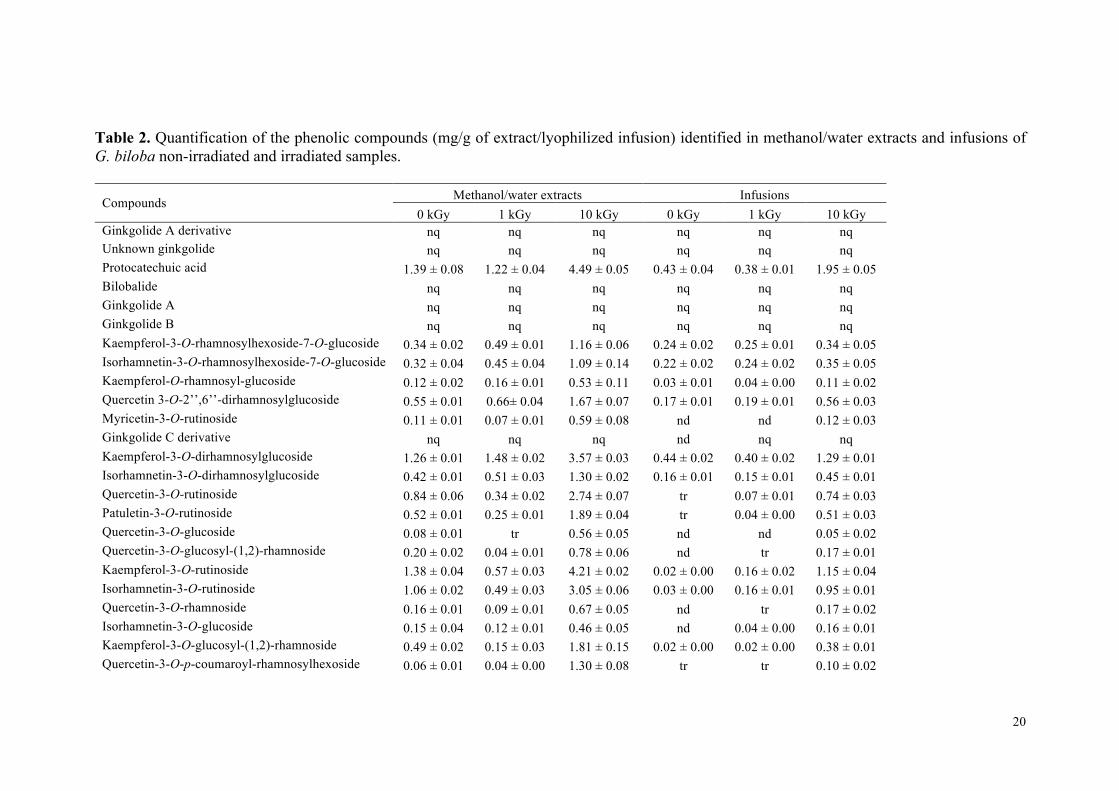
Among the twenty-five compounds detected, compounds 1, 2, 4-6 and 12, associated to
ginkgolides, were not quantified due their low UV absorption and possible interferences
in the complex matrix of G. biloba extracts, as well as the unavailability of commercial
gingkolide standards. Flavonoids were the main group present, being two kaempferol
derivatives the majority compounds found (Table 2). Thus, kaempferol-3-O-
dirhamnosylglucoside (compound 13) was the most abundant compound in all the
infusion preparations and in the methanol/water extract irradiated at 1 kGy, whereas
kaempferol-3-O-rutinoside (compound 19) was the most abundant one in the control
and irradiated at 10 kGy methanol/water extracts. Protocatechuic acid was the only
phenolic acid identified and the quantities present were in the same range as the major
flavonoids.
This study intended to evaluate which irradiation dose would be the most efficient to
improve the extractability of phenolic compounds in G. biloba samples (methanol/water
extract and infusion oral solution). Infusions presented lower quantities than the

12
methanol/water extracts, due to the high temperatures applied to obtain these
preparations that could destroy some thermal sensitive compounds, but also due to the
lower extraction time. Both methanol/water and infusion preparation irradiated at a dose
of 10 kGy gave the highest content in phenolic compounds. The sub-products formed
during food irradiation depend on the food matrix and dose (Stewart, 2001). The
degradation of some molecules during irradiation occurs by complex mechanisms.
Although it is considered that some bonds can be broken resulting in smaller molecules
(Stewart, 2001), the use of high irradiation doses might also lead to higher compound
extractability. This could explain the higher values of phenolic compounds
concentration observed for the doses of 10 kGy compared with those found in non-
irradiated and 1 kGy irradiated samples. A small decrease in the phenolic compounds
content was observed for the dose of 1 kGy in the methanol/water extract, when
compared with non-irradiated samples. Low doses up to 1 kGy are used for preservation
of fresh samples (Molins, 2001), which are more sensitive than dried food, indicating
that at this doses there are no effect or only slight changes in food main characteristics.
To our knowledge, this is the first report that describes the phenolic composition in
irradiated samples of G. biloba using two different doses. The dose of 10 kGy is enough
to guarantee product disinfestation and microbial decontamination (Molins, 2001),
contributing also for an increase in the phenolic compounds extractability, both for
methanol/water and infusion preparations. The use of irradiation to improve bioactive
properties was also suggested by other authors as a result of an increase in the levels of
phenolic compounds in the extracts obtained from cooked and derived plant products
(Zhu et al., 2010; Aouidi et al., 2011; Lee et al., 2013; Wanyo et al., 2014).
Nevertheless, further research is needed to understand all the mechanisms involved in
the irradiation processing effects in plant constituents.
13
Acknowledgements
The authors are grateful to project Proder nº 53514 AROMAP for financial support and
for E. Pereira grant, also to Fundação para a Ciência e a Tecnologia (FCT, Portugal) for
CIMO strategic project (PEst-OE/AGR/UI0690/2014). L. Barros thanks “Compromisso
para a Ciência 2008” for her contract. The authors are also grateful to Mrs. Clarinda
Paixão, from “Américo Duarte Paixão Lda”, for samples providing.
References
Acosta-Estrada, B.A., Gutierrez-Uribe, J.A., Serna-Saldivar, S.O. 2014. Bound
phenolics in foods, a review. Food Chem. 152, 46-55.
Alothman, M., Bhat, R., Karim, A.A. 2009. Effects of radiation processing on
phytochemicals and antioxidants in plant produce. Trend. Food Sci. Technol. 20,
201-212.
Aouidi, F., Ayari, S., Ferhi, H., Roussos, S., Hamdi, M. 2011. Gamma irradiation of air-
dried olive leaves: Effective decontamination and impact on the antioxidative
properties and on phenolic compounds. Food Chem. 127, 1105–1113.
ASTM, American Society for Testing and Materials. 1992. Practice for Using the Fricke
Reference Standard Dosimetry System, ASTM E1026. Annual Book of ASTM
Standards, 12.02, Philadelphia, PA.
Balasundram N, Sundram K, Samman S. 2006. Phenolic compounds in plants and
agriindustria by-products: antioxidant activity, occurrence, and potential uses.
Food Chem. 99, 191-203.
Barros, L., Pereira, E., Calhelha, R.C., Dueñas, M., Carvalho, A.M., Santos-Buelga, C.,
Ferreira, I.C.F.R. 2013. Bioactivity and chemical characterization in hydrophilic
14
and lipophilic compounds of Chenopodium ambrosioides L. J. Funct. Food. 5,
1732-1740.
Bedir, E., Tatli, I.I., Khan, R.A., Zhao, J., Takamatsu, S., Walker, L.A., Goldman, P.,
Khan, I.A. 2002. Biologically active secondary metabolites from Ginkgo biloba. J.
Agric. Food Chem. 50, 3150-3155.
Chmielewski, A. G., & Migdał, W. (2005). Radiation decontamination of herbs and
spices. Nukleonika, 50, 179−184.
Diamond, B.J., Shiflett, S.C., Feiwel, N., Matheis, R.J., Noskin, O., Richards, J.A.,
Schoen-berger, N.E. 2000. Ginkgo biloba extract: mechanisms and clinical
indications. Arch. Phys. Med. Rehabilit. 81, 668-678.
Ding, S., Dudley, E., Plummer, S., Tang, J., Newton, R.P., Brenton, A.G. 2008.
Fingerprint profile of Ginkgo biloba nutritional supplements by LC/ESI-MS/MS.
Phytochem. 60, 1555-1564.
Haleem, R.M., Salem, M.Y., Fatahallah, F.A., Abdelfattah, L.E. 2014. Quality in the
pharmaceutical industry – A literature review. Saud. Pharmac. J.
dx.doi.org/10.1016/j.jsps.2013.11.004.
Kirkin, C., Mitrevski, B., Gunes, G., Marriott, P.J. 2014. Combined effects of gamma-
irradiation and modified atmosphere packaging on quality of some spices. Food
Chem. 154, 255-261.
Koch, E. 2005. Inhibition of platelet activating factor (PAF)-induced aggregation of
human thrombocytes by ginkgolides: considerations on possible bleeding
complications after oral intake of Ginkgo biloba extracts. Phytomed. 12, 10-16.
Lan, S., Yin, J., Charles, D., Zhou, K., Moore, J., Yu, L. 2007. Total phenolic content,
chelating capacities and radical scavenging properties of black peppercorn,
nutmeg, rosehip, cinnamon and oregano leaf. Food Chem. 100, 990-997.
15
Lee, J-H., Kim, J-H., Yoon, Y., Jo, C., Byun, M-C. 2013. Potential
Applications of Ionizing Radiation, in Food Irradiation Research and Technology,
edited by Xuetong Fan, Christopher H. Sommers, 2nd. edition,
Wiley-Blackwell, USA, pp. 385.
Lin, L.-Z. Chen, P., Ozcan, M., Harnly, J.M. 2008. Chromatographic profiles and
identification of new phenolic components of Ginkgo biloba leaves and selected
products. J. Agric. Food Chem. 56, 6671-6679.
Liu, X.-G., Yang, H., Cheng, X.-L., Liu, L., Qin, Y., Wang, Q., Qi, L.-W., Li, P. 2014.
Direct analysis of 18 flavonol glycosides, aglycones and terpene trilactones in
Ginkgo biloba tablets by matrix solid phase dispersion coupled with ultra-high
performance liquid chromatography tandem triple quadrupole mass spectrometry.
J. Pharmac. Biomed. Anal. 97, 123-128.
Martins, S. Mussatto, S.I., Martínez-Avila, G., Montañez-Saenz, J., Aguilar, C.N.,
Teixeira, J.A. 2011. Bioactive phenolic compounds: Production and extraction by
solid-state fermentation. A review. Biotechnol. Adv. 29, 365-373.
Mendel, S., Youdim, M.B. 2004. Catechin polyphenols: neurodegeneration and
neuroprotection in neurodegenerative diseases. Free Rad. Biol. Med. 37, 304-317.
Mesbah, M.K., Khalifa, S.I., El-Gindy, A., Tawfik, K.A. 2005. HPLC determination of
certain flavonoids and terpene lactones in selected Ginkgo biloba L.
phytopharmaceuticals. Il Farmaco 60, 583-590.
Migdal, W., & Owczarczyk, B. (1998). The effect of ionizing radiation on
microbiological decontamination of medical herbs and biologically active
compounds. Radiation Physical Chemistry, 52, 91-94.
Molins, R.A. 2001. Food Irradiation: Principles and Applications, edited by Ricardo
Molins, Wiley-Interscience, USA.

16
Parimoo, H.A., Sharma, R., Patil, R.D., Sharma, O.P., Kumar, P., Kumar, N. 2014.
Hepatoprotective effect of Ginkgo biloba leaf extract on lantadenes-induced
hepatotoxicity in guinea pigs. Toxicon. 81, 1-12.
Pereira, E., Barros, L., Antonio, A., Bento, A., Ferreira, I.C.F.R. 2015. Analytical
methods applied to assess the effects of gamma irradiation on color, chemical
composition and antioxidant activity of Ginkgo biloba L. Food Anal. Method. 8,
154-163.
Port's, P.S., Chisté, R.C., Godoy, H.T., Prado, M.A. 2013. The phenolic compounds and
the antioxidant potential of infusion of herbs from the Brazilian Amazonian
region. Food Res. Int. 53, 875-881.
Rawat, S., Bhatt, I.D., Rawal, R.S. 2011. Total phenolic compounds and antioxidant
potential of Hedychium spicatum Buch. Ham. ex D. Don in west Himalaya, India.
J. Food Compos. Anal. 24, 574-579.
Rossi, R., Basilico, F., De Palma, A., Mauri, P. 2011. Analytical methods for
characterizing bioactive terpene lactones in Ginkgo biloba extracts and
performing pharmacokinetic studies in animal and human, in Komorowska, M.A.
& Olsztynska-Janus, S. Biomed. Eng. Trend. Res. Technol. 363-382 pp, Intech
Journals.
Sati, P., Pandey, A., Rawat, S., Rani, A. 2013. Phytochemicals and antioxidants in leaf
extracts of Ginkgo biloba with reference to location, seasonal variation and
solvent system. J. Pharm. Res. 7, 804-809.
Sloley, B.D., Tawfik, S.R., Scherban, K.A., Tam, Y.K. 2003. Quality control analyses
for Ginkgo extracts require analysis of intact flavonol glycosides. J. Food Drug
Anal. 11, 102-107.

17
Stewart, E.M. 2001. Food Irradiation Chemistry, in Food Irradiation: Principles and
Applications, R.A. Molins, pp.37-76.
Tang, Y., Lou, F., Wang, J., Li, Y., Zhuang, S. 2001. Coumaroyl flavonol glycosides
from the leaves of Ginkgo biloba. Phytochem. 58, 1251–1256.
van Beek, T.A. 2002. Chemical analysis of Ginkgo biloba leaves and extracts. J.
Chromatog. A, 967, 21–55.
van Beek, T.A., Montoro P. 2009. Chemical analysis and quality control of Ginkgo
biloba leaves, extracts, and phytopharmaceuticals. J. Chromatog. A, 1216, 2002-
2032.
Wanyo, P., Meeso, N., Siriamornpun, S. 2014. Effects of different treatments on the
antioxidant properties and phenolic compounds of rice bran and rice husk. Food
Chem. 157, 457-463
Yao, X., Zhou, G.-S., Tang, Y.-P., Qian, Y.-F., Guan, H.-L., Pang, H., Zhu, S., Mo, X.,
Su, S.-L., Jin, C., Qin, Y., Qian, D.-W., Duan, J.-A. 2013. Simultaneous
quantification of flavonol glycosides, terpene lactones, flavones,
proanthocyanidins, and ginkgolic acids in Ginkgo biloba leaves from fruit
cultivars by ultrahigh-performance liquid chromatography coupled with triple
quadrupole mass spectrometry. BioMed Res. Int. Article ID 582591, 1-11.
Zhang, Q., Chen, L.-J., Ye, H.-Y., Gao, L., Hou, W., Tang, M., Yang, G., Zhong, Z.,
Yuan, Y., Peng, A. 2007. Isolation and purification of ginkgo flavonol glycosides
from Ginkgo biloba leaves by high-speed counter-current chromatography. J.
Separat. Sci. 30, 2153-2159.
Zhu, F., Cai, Y.-Z., Bao, J., Corke, H. 2010. Effect of γ-irradiation on phenolic
compounds in rice grain. Food Chem. 120, 74-77.
18
Table 1. Retention time (Rt), wavelengths of maximum absorption in the visible region (λmax), mass spectral data and compound identification in G. biloba samples.
Compound Rt (min) λmax
(nm)
Molecular ion
[M-H]- (m/z)
MS2
(m/z) Tentative identification
1 5.7 260,294,350 453 407(100),245(3),179(7),161(3),113(5) Ginkgolide A derivative
2 6.1 358 449 403(16),269(4),205(8),179(5),113(4) Unknown ginkgolide
3 6.2 262sh294 153 109(100) Protocatechuic acid
4 6.8 252,356 325 163(100),119(87) Bilobalide
5 7.1 274 407 245(100) Ginkgolide A
6 9.3 282sh336 423 221(15),179(13),161(22),131(21),113(32) Ginkgolide B
7 9.6 348 755 593(100),285(22) Kaempferol-3-O-rhamnosylhexoside-7-O-glucoside
8 11.3 358 785 623(100),315(17) Isorhamnetin-3-O-rhamnosylhexoside-7-O-glucoside
9 14.0 348 593 447(23),285(58) Kaempferol-O-rhamnosyl-glucoside
10 15.0 354 755 301(100) Quercetin 3-O-2’’,6’’-dirhamnosylglucoside
11 15.1 350 625 317(100) Myricetin-3-O-rutinoside
12 16.5 318 439*1 411(18),383(93),365(12),322(26),304(7),277(7),259(8) Ginkgolide C derivative
13 17.0 348 739 285(100) Kaempferol-3-O-dirhamnosylglucoside
14 17.4 356 769 315(100) Isorhamnetin-3-O-dirhamnosylglucoside
15 18.3 356 609 301(100) Quercetin-3-O-rutinoside
16 19.1 360 639 331(100) Patuletin-3-O-rutinoside
17 19.7 358 463 301(100) Quercetin-3-O-glucoside
18 21.1 352 609 301(100) Quercetin-3-O-glucosyl-(1,2)-rhamnoside
19 21.7 348 593 285(100) Kaempferol-3-O-rutinoside
20 22.6 356 623 315(100) Isorhamnetin-3-O-rutinoside

19
*1 879 [2M-H]-
21 23.1 352 447 301(100) Quercetin-3-O-rhamnoside
22 23.8 350 477 315(100) Isorhamnetin-3-O-glucoside
23 25.1 348 593 285(100) Kaempferol-3-O-glucosyl-(1,2)-rhamnoside
24 28.1 268,316 755 609(46),301(21) Quercetin-3-O-p-coumaroyl-rhamnosylhexoside
25 30.8 266,316 739 593(51),285(21) Kaempferol-3-O-p-coumaroyl-rhamnosylhexoside
20
Table 2. Quantification of the phenolic compounds (mg/g of extract/lyophilized infusion) identified in methanol/water extracts and infusions of G. biloba non-irradiated and irradiated samples.
Compounds Methanol/water extracts Infusions 0 kGy 1 kGy 10 kGy 0 kGy 1 kGy 10 kGy
Ginkgolide A derivative nq nq nq nq nq nq Unknown ginkgolide nq nq nq nq nq nq Protocatechuic acid 1.39 ± 0.08 1.22 ± 0.04 4.49 ± 0.05 0.43 ± 0.04 0.38 ± 0.01 1.95 ± 0.05 Bilobalide nq nq nq nq nq nq Ginkgolide A nq nq nq nq nq nq Ginkgolide B nq nq nq nq nq nq Kaempferol-3-O-rhamnosylhexoside-7-O-glucoside 0.34 ± 0.02 0.49 ± 0.01 1.16 ± 0.06 0.24 ± 0.02 0.25 ± 0.01 0.34 ± 0.05 Isorhamnetin-3-O-rhamnosylhexoside-7-O-glucoside 0.32 ± 0.04 0.45 ± 0.04 1.09 ± 0.14 0.22 ± 0.02 0.24 ± 0.02 0.35 ± 0.05 Kaempferol-O-rhamnosyl-glucoside 0.12 ± 0.02 0.16 ± 0.01 0.53 ± 0.11 0.03 ± 0.01 0.04 ± 0.00 0.11 ± 0.02 Quercetin 3-O-2’’,6’’-dirhamnosylglucoside 0.55 ± 0.01 0.66± 0.04 1.67 ± 0.07 0.17 ± 0.01 0.19 ± 0.01 0.56 ± 0.03 Myricetin-3-O-rutinoside 0.11 ± 0.01 0.07 ± 0.01 0.59 ± 0.08 nd nd 0.12 ± 0.03 Ginkgolide C derivative nq nq nq nd nq nq Kaempferol-3-O-dirhamnosylglucoside 1.26 ± 0.01 1.48 ± 0.02 3.57 ± 0.03 0.44 ± 0.02 0.40 ± 0.02 1.29 ± 0.01 Isorhamnetin-3-O-dirhamnosylglucoside 0.42 ± 0.01 0.51 ± 0.03 1.30 ± 0.02 0.16 ± 0.01 0.15 ± 0.01 0.45 ± 0.01 Quercetin-3-O-rutinoside 0.84 ± 0.06 0.34 ± 0.02 2.74 ± 0.07 tr 0.07 ± 0.01 0.74 ± 0.03 Patuletin-3-O-rutinoside 0.52 ± 0.01 0.25 ± 0.01 1.89 ± 0.04 tr 0.04 ± 0.00 0.51 ± 0.03 Quercetin-3-O-glucoside 0.08 ± 0.01 tr 0.56 ± 0.05 nd nd 0.05 ± 0.02 Quercetin-3-O-glucosyl-(1,2)-rhamnoside 0.20 ± 0.02 0.04 ± 0.01 0.78 ± 0.06 nd tr 0.17 ± 0.01 Kaempferol-3-O-rutinoside 1.38 ± 0.04 0.57 ± 0.03 4.21 ± 0.02 0.02 ± 0.00 0.16 ± 0.02 1.15 ± 0.04 Isorhamnetin-3-O-rutinoside 1.06 ± 0.02 0.49 ± 0.03 3.05 ± 0.06 0.03 ± 0.00 0.16 ± 0.01 0.95 ± 0.01 Quercetin-3-O-rhamnoside 0.16 ± 0.01 0.09 ± 0.01 0.67 ± 0.05 nd tr 0.17 ± 0.02 Isorhamnetin-3-O-glucoside 0.15 ± 0.04 0.12 ± 0.01 0.46 ± 0.05 nd 0.04 ± 0.00 0.16 ± 0.01 Kaempferol-3-O-glucosyl-(1,2)-rhamnoside 0.49 ± 0.02 0.15 ± 0.03 1.81 ± 0.15 0.02 ± 0.00 0.02 ± 0.00 0.38 ± 0.01 Quercetin-3-O-p-coumaroyl-rhamnosylhexoside 0.06 ± 0.01 0.04 ± 0.00 1.30 ± 0.08 tr tr 0.10 ± 0.02
21
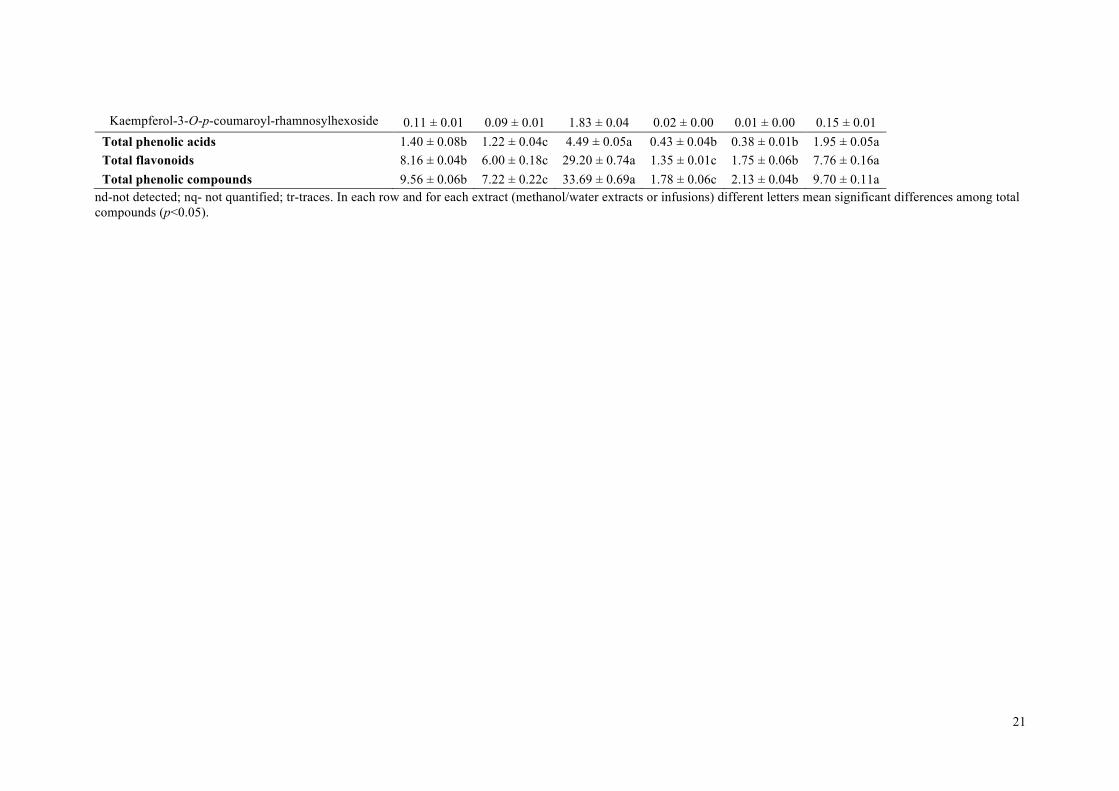
Kaempferol-3-O-p-coumaroyl-rhamnosylhexoside 0.11 ± 0.01 0.09 ± 0.01 1.83 ± 0.04 0.02 ± 0.00 0.01 ± 0.00 0.15 ± 0.01 Total phenolic acids 1.40 ± 0.08b 1.22 ± 0.04c 4.49 ± 0.05a 0.43 ± 0.04b 0.38 ± 0.01b 1.95 ± 0.05a Total flavonoids 8.16 ± 0.04b 6.00 ± 0.18c 29.20 ± 0.74a 1.35 ± 0.01c 1.75 ± 0.06b 7.76 ± 0.16a Total phenolic compounds 9.56 ± 0.06b 7.22 ± 0.22c 33.69 ± 0.69a 1.78 ± 0.06c 2.13 ± 0.04b 9.70 ± 0.11a
nd-not detected; nq- not quantified; tr-traces. In each row and for each extract (methanol/water extracts or infusions) different letters mean significant differences among total compounds (p<0.05).

22
Time (min)0 5 10 15 20 25 30 35 40 45
mAU
0
200
400
600
800
1 42 7
68
9
10
1112
13
14
15
16
1718
1920
2122
23
24 25
A
23
Time (min)0 5 10 15 20 25 30 35 40 45
mAU
0
200
400
600
800
1000
1200
1400
1600
124
67 8
9
10
11
12
13
14
15
16
1718
1920
21
22
2324 25
B
24
Time (min)0 5 10 15 20 25 30 35 40 45
mAU
0
25
50
75
100
125
150
175
1
10
2 4
6
7
8
9
13
14
1516 19 20 23 24 25
C
25
Time (min)0 5 10 15 20 25 30 35 40 45
mAU
0
100
200
300
400
500
124
67
8
9
10
1112
13
14
15
16
17
18
19
20
21 23
2224 25
D Figure 1. Chromatographic profile of non-irradiated methanol/water (A), irradiated at 10 kGy methanol/water (B), non-irradiated infusion (C) and irradiated at 10 kGy infusion (D) of G. biloba samples, recorded at 370 nm.