docentes - resumo gerencial€¦ · prof. educ. básica i (classe) evolução do contingente em...
TRANSCRIPT
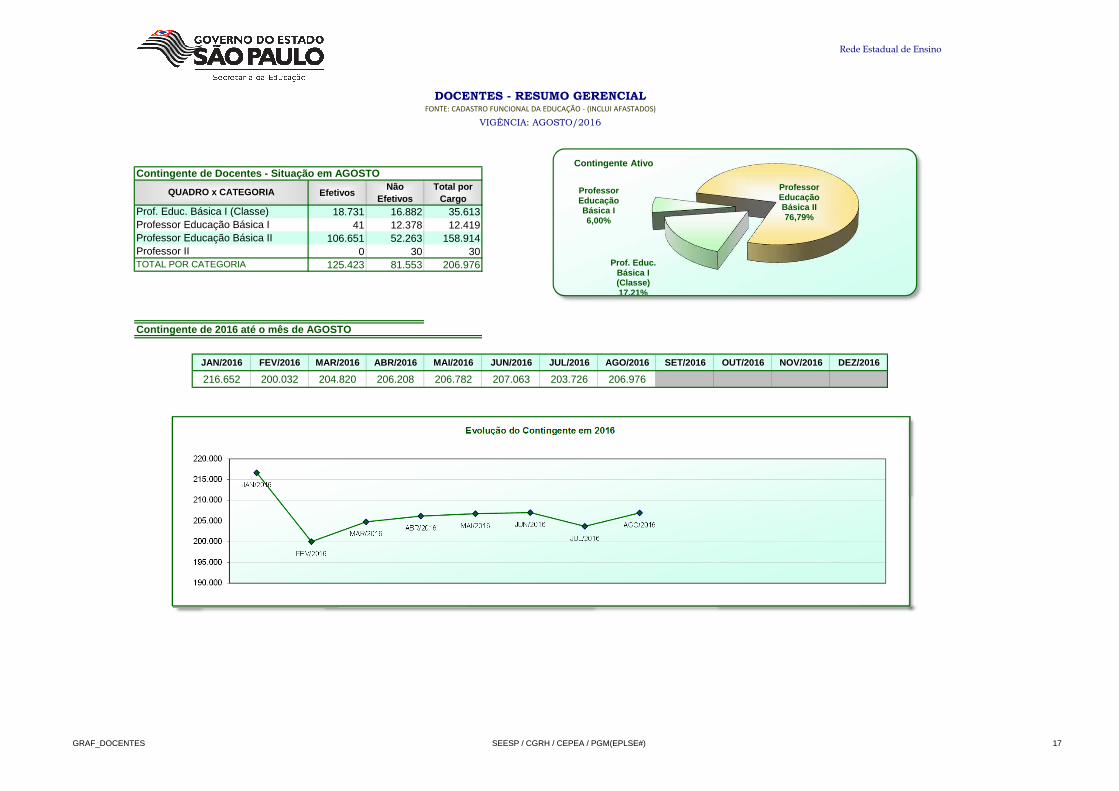
Contingente de Docentes - Situação em AGOSTO
EfetivosNão
EfetivosTotal por
Cargo18.731 16.882 35.613
41 12.378 12.419 106.651 52.263 158.914
0 30 30 125.423 81.553 206.976
Contingente de 2016 até o mês de AGOSTO
JAN/2016 FEV/2016 MAR/2016 ABR/2016 MAI/2016 JUN/2016 JUL /2016 AGO/2016 SET/2016 OUT/2016 NOV/2016 DEZ/2016
216.652 200.032 204.820 206.208 206.782 207.063 203.726 206.976
Professor IIProfessor Educação Básica IIProfessor Educação Básica I
TOTAL POR CATEGORIA
QUADRO x CATEGORIA
DOCENTES - RESUMO GERENCIAL
FONTE: CADASTRO FUNCIONAL DA EDUCAÇÃO - (INCLUI AFASTADOS)
VIGÊNCIA: AGOSTO/2016
Prof. Educ. Básica I (Classe)
Evolução do Contingente em 2016
Rede Estadual de Ensino
Prof. Educ. Básica I (Classe) 17,21%
Professor Educação Básica I6,00%
Professor Educação Básica II76,79%
Contingente Ativo
JAN/2016
FEV/2016
MAR/2016ABR/2016 MAI/2016 JUN/2016
JUL/2016
AGO/2016
190.000
195.000
200.000
205.000
210.000
215.000
220.000
GRAF_DOCENTES SEESP / CGRH / CEPEA / PGM(EPLSE#) 17

DOCENTES - RESUMO GERENCIAL
FONTE: CADASTRO FUNCIONAL DA EDUCAÇÃO - (INCLUI AFASTADOS)
VIGÊNCIA: AGOSTO/2016
Rede Estadual de Ensino
Comparativo do contingente ativo no mês de AGOSTO n os anos de 1999 a 2016
Mês/Ano Contingente
Variação em relação ao mês/ano anterior
Variação em relação a
AGO/2016
AGO/2016 206.976 -8,02% -AGO/2015 225.032 -10,01% 8,02%AGO/2014 250.065 7,24% 17,23%AGO/2013 233.192 1,39% 11,24%AGO/2012 229.993 3,93% 10,01%AGO/2011 221.292 0,80% 6,47%AGO/2010 219.543 5,19% 5,72%AGO/2009 208.705 -1,22% 0,83%AGO/2008 211.274 -5,78% 2,03%AGO/2007 224.242 6,03% 7,70%AGO/2006 211.490 3,10% 2,13%AGO/2005 205.133 4,77% -0,90%AGO/2004 195.799 0,62% -5,71%AGO/2003 194.597 5,22% -6,36%AGO/2002 184.938 4,41% -11,92%AGO/2001 177.124 -1,56% -16,85%AGO/2000 179.936 -6,84% -15,03%AGO/1999 193.154 - -7,16%
Variação (%)
AGO/1999AGO/2000AGO/2001AGO/2002AGO/2003AGO/2004AGO/2005AGO/2006AGO/2007AGO/2008AGO/2009AGO/2010AGO/2011AGO/2012AGO/2013AGO/2014AGO/2015AGO/2016
193.154179.936
177.124184.938
194.597195.799
205.133211.490
224.242211.274208.705
219.543221.292
229.993233.192
250.065225.032
206.976
GRAF_DOCENTES SEESP / CGRH / CEPEA / PGM(EPLSE#) 18

DOCENTES - RESUMO GERENCIAL
FONTE: CADASTRO FUNCIONAL DA EDUCAÇÃO - (INCLUI AFASTADOS)
VIGÊNCIA: AGOSTO/2016
Rede Estadual de Ensino
Contingente de AGOSTO nos anos de 1999 a 2010 agrup ado em períodos de 4 anos e 2011 a 2015 em período de 5 anos
AGO/2007; 224.242
AGO/2008; 211.274 AGO/2009;
208.705
AGO/2010; 219.543
200.000
205.000
210.000
215.000
220.000
225.000
230.000
DE 2007 A 2010
AGO/2011; 221.292
AGO/2012; 229.993
AGO/2013; 233.192
AGO/2014; 250.065AGO/2015;
225.032AGO/2016; 206.976
0
50.000
100.000
150.000
200.000
250.000
300.000
DE 2011 A 2016
AGO/1999; 193.154
AGO/2000; 179.936 AGO/2001;
177.124
AGO/2002; 184.938
165.000
170.000
175.000
180.000
185.000
190.000
195.000
DE 1999 A 2002
AGO/2003; 194.597
AGO/2004; 195.799
AGO/2005; 205.133
AGO/2006; 211.490
185.000
190.000
195.000
200.000
205.000
210.000
215.000
DE 2003 A 2006
GRAF_DOCENTES SEESP / CGRH / CEPEA / PGM(EPLSE#) 19

DOCENTES - RESUMO GERENCIAL
FONTE: CADASTRO FUNCIONAL DA EDUCAÇÃO - (INCLUI AFASTADOS)
VIGÊNCIA: AGOSTO/2016
Rede Estadual de Ensino
Comparativo do Contingente de AGOSTO de 1999 a 2016
AGO/1999193.154 AGO/2000
179.936AGO/2001177.124
AGO/2002184.938
AGO/2003194.597
AGO/2004195.799
AGO/2005205.133
AGO/2006211.490
AGO/2007224.242 AGO/2008
211.274AGO/2009208.705
AGO/2010219.543
AGO/2011221.292
AGO/2012229.993
AGO/2013233.192
AGO/2014250.065
AGO/2015225.032
AGO/2016206.976
100.000
120.000
140.000
160.000
180.000
200.000
220.000
240.000
260.000
DE 1999 A 2016
GRAF_DOCENTES SEESP / CGRH / CEPEA / PGM(EPLSE#) 20
DOCENTES - RESUMO GERENCIAL
FONTE: CADASTRO FUNCIONAL DA EDUCAÇÃO - (INCLUI AFASTADOS)
VIGÊNCIA: AGOSTO/2016
Rede Estadual de Ensino
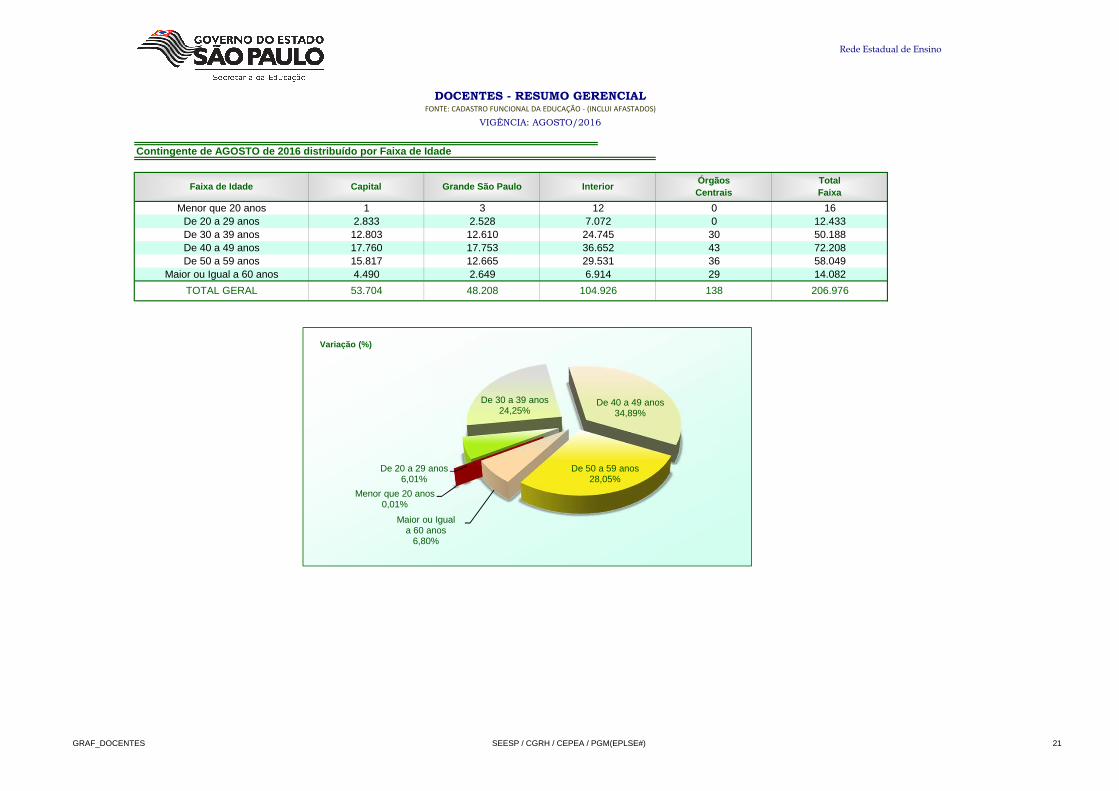
Contingente de AGOSTO de 2016 distribuído por Faixa de Idade
206.976
TotalFaixa
1612.43350.18872.20858.049
53.704
Grande São Paulo InteriorÓrgãosCentrais
3 12 02.528 7.072 0
12.80317.76015.8174.490 14.0822.649 6.914 29
Faixa de Idade
Menor que 20 anosDe 20 a 29 anosDe 30 a 39 anosDe 40 a 49 anosDe 50 a 59 anos
Maior ou Igual a 60 anos
TOTAL GERAL
Capital
12.833
48.208 104.926 138
12.610 24.745 3017.753 36.652 4312.665 29.531 36
Menor que 20 anos0,01%
De 20 a 29 anos6,01%
De 30 a 39 anos24,25%
De 40 a 49 anos34,89%
De 50 a 59 anos28,05%
Maior ou Igual a 60 anos
6,80%
Variação (%)
GRAF_DOCENTES SEESP / CGRH / CEPEA / PGM(EPLSE#) 21
DOCENTES - RESUMO GERENCIAL
FONTE: CADASTRO FUNCIONAL DA EDUCAÇÃO - (INCLUI AFASTADOS)
VIGÊNCIA: AGOSTO/2016
Rede Estadual de Ensino
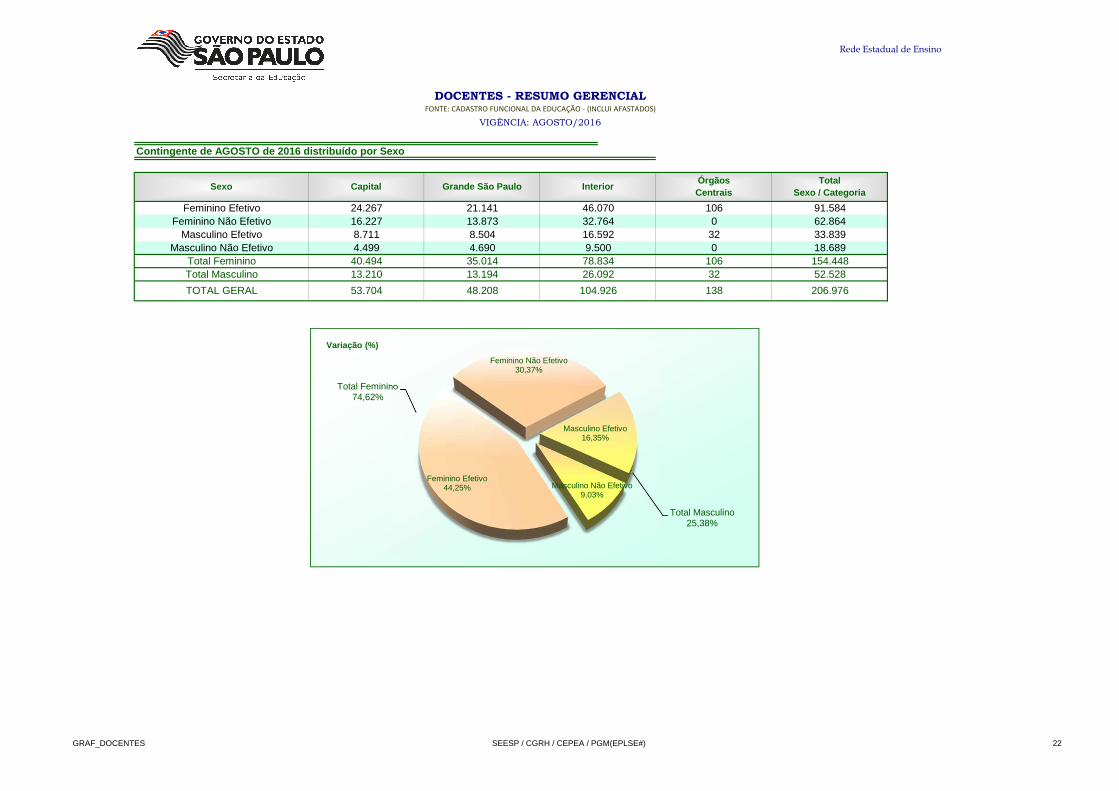
Contingente de AGOSTO de 2016 distribuído por Sexo
206.976TOTAL GERAL 53.704 48.208 104.926 138
154.448Total Masculino 13.210 13.194 26.092 32 52.528Total Feminino 40.494 35.014 78.834 106
33.839Masculino Não Efetivo 4.499 4.690 9.500 0 18.689
Masculino Efetivo 8.711 8.504 16.592 32
91.584Feminino Não Efetivo 16.227 13.873 32.764 0 62.864
Feminino Efetivo 24.267 21.141 46.070 106
Sexo Capital Grande São Paulo InteriorÓrgãosCentrais
TotalSexo / Categoria
Total Feminino74,62%
Total Masculino25,38%
Feminino Efetivo44,25%
Feminino Não Efetivo30,37%
Masculino Efetivo16,35%
Masculino Não Efetivo9,03%
Variação (%)
GRAF_DOCENTES SEESP / CGRH / CEPEA / PGM(EPLSE#) 22
DOCENTES - RESUMO GERENCIAL
FONTE: CADASTRO FUNCIONAL DA EDUCAÇÃO - (INCLUI AFASTADOS)
VIGÊNCIA: AGOSTO/2016
Rede Estadual de Ensino
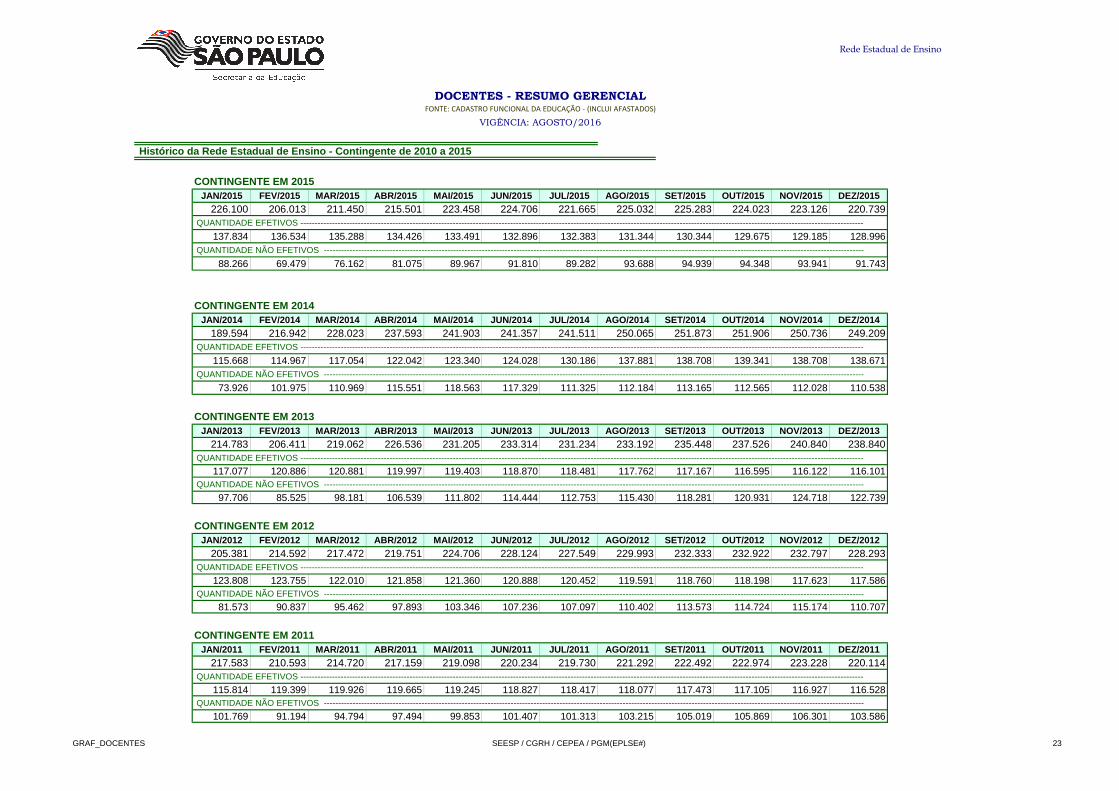
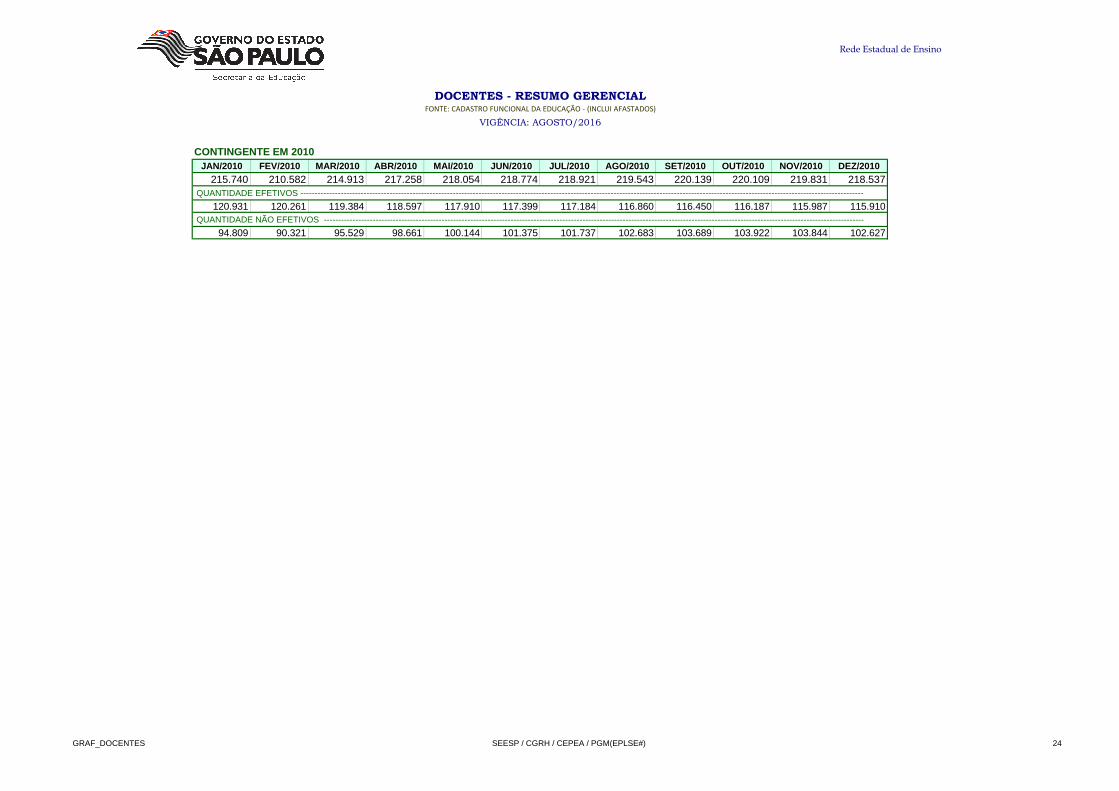
Histórico da Rede Estadual de Ensino - Contingente de 2010 a 2015
CONTINGENTE EM 2015JAN/2015 FEV/2015 MAR/2015 ABR/2015 MAI/2015 JUN/2015 JUL /2015 AGO/2015 SET/2015 OUT/2015 NOV/2015 DEZ/2015
226.100 206.013 211.450 215.501 223.458 224.706 221.665 225.032 225.283 224.023 223.126 220.739 QUANTIDADE EFETIVOS ----------------------------------------------------------------------------------------------------------------------------------------------------------------------------------------------------
137.834 136.534 135.288 134.426 133.491 132.896 132.383 131.344 130.344 129.675 129.185 128.996 QUANTIDADE NÃO EFETIVOS --------------------------------------------------------------------------------------------------------------------------------------------------------------------------------------------
88.266 69.479 76.162 81.075 89.967 91.810 89.282 93.688 94.939 94.348 93.941 91.743
CONTINGENTE EM 2014JAN/2014 FEV/2014 MAR/2014 ABR/2014 MAI/2014 JUN/2014 JUL /2014 AGO/2014 SET/2014 OUT/2014 NOV/2014 DEZ/2014
189.594 216.942 228.023 237.593 241.903 241.357 241.511 250.065 251.873 251.906 250.736 249.209 QUANTIDADE EFETIVOS ----------------------------------------------------------------------------------------------------------------------------------------------------------------------------------------------------
115.668 114.967 117.054 122.042 123.340 124.028 130.186 137.881 138.708 139.341 138.708 138.671 QUANTIDADE NÃO EFETIVOS --------------------------------------------------------------------------------------------------------------------------------------------------------------------------------------------
73.926 101.975 110.969 115.551 118.563 117.329 111.325 112.184 113.165 112.565 112.028 110.538
CONTINGENTE EM 2013JAN/2013 FEV/2013 MAR/2013 ABR/2013 MAI/2013 JUN/2013 JUL /2013 AGO/2013 SET/2013 OUT/2013 NOV/2013 DEZ/2013
214.783 206.411 219.062 226.536 231.205 233.314 231.234 233.192 235.448 237.526 240.840 238.840 QUANTIDADE EFETIVOS ----------------------------------------------------------------------------------------------------------------------------------------------------------------------------------------------------
117.077 120.886 120.881 119.997 119.403 118.870 118.481 117.762 117.167 116.595 116.122 116.101 QUANTIDADE NÃO EFETIVOS --------------------------------------------------------------------------------------------------------------------------------------------------------------------------------------------
97.706 85.525 98.181 106.539 111.802 114.444 112.753 115.430 118.281 120.931 124.718 122.739
CONTINGENTE EM 2012JAN/2012 FEV/2012 MAR/2012 ABR/2012 MAI/2012 JUN/2012 JUL /2012 AGO/2012 SET/2012 OUT/2012 NOV/2012 DEZ/2012
205.381 214.592 217.472 219.751 224.706 228.124 227.549 229.993 232.333 232.922 232.797 228.293 QUANTIDADE EFETIVOS ----------------------------------------------------------------------------------------------------------------------------------------------------------------------------------------------------
123.808 123.755 122.010 121.858 121.360 120.888 120.452 119.591 118.760 118.198 117.623 117.586 QUANTIDADE NÃO EFETIVOS --------------------------------------------------------------------------------------------------------------------------------------------------------------------------------------------
81.573 90.837 95.462 97.893 103.346 107.236 107.097 110.402 113.573 114.724 115.174 110.707
CONTINGENTE EM 2011JAN/2011 FEV/2011 MAR/2011 ABR/2011 MAI/2011 JUN/2011 JUL /2011 AGO/2011 SET/2011 OUT/2011 NOV/2011 DEZ/2011
217.583 210.593 214.720 217.159 219.098 220.234 219.730 221.292 222.492 222.974 223.228 220.114 QUANTIDADE EFETIVOS ----------------------------------------------------------------------------------------------------------------------------------------------------------------------------------------------------
115.814 119.399 119.926 119.665 119.245 118.827 118.417 118.077 117.473 117.105 116.927 116.528 QUANTIDADE NÃO EFETIVOS --------------------------------------------------------------------------------------------------------------------------------------------------------------------------------------------
101.769 91.194 94.794 97.494 99.853 101.407 101.313 103.215 105.019 105.869 106.301 103.586
GRAF_DOCENTES SEESP / CGRH / CEPEA / PGM(EPLSE#) 23
DOCENTES - RESUMO GERENCIAL
FONTE: CADASTRO FUNCIONAL DA EDUCAÇÃO - (INCLUI AFASTADOS)
VIGÊNCIA: AGOSTO/2016
Rede Estadual de Ensino
CONTINGENTE EM 2010JAN/2010 FEV/2010 MAR/2010 ABR/2010 MAI/2010 JUN/2010 JUL /2010 AGO/2010 SET/2010 OUT/2010 NOV/2010 DEZ/2010
215.740 210.582 214.913 217.258 218.054 218.774 218.921 219.543 220.139 220.109 219.831 218.537 QUANTIDADE EFETIVOS ----------------------------------------------------------------------------------------------------------------------------------------------------------------------------------------------------
120.931 120.261 119.384 118.597 117.910 117.399 117.184 116.860 116.450 116.187 115.987 115.910 QUANTIDADE NÃO EFETIVOS --------------------------------------------------------------------------------------------------------------------------------------------------------------------------------------------
94.809 90.321 95.529 98.661 100.144 101.375 101.737 102.683 103.689 103.922 103.844 102.627
GRAF_DOCENTES SEESP / CGRH / CEPEA / PGM(EPLSE#) 24
DOCENTES - RESUMO GERENCIAL
FONTE: CADASTRO FUNCIONAL DA EDUCAÇÃO - (INCLUI AFASTADOS)
VIGÊNCIA: AGOSTO/2016
Rede Estadual de Ensino
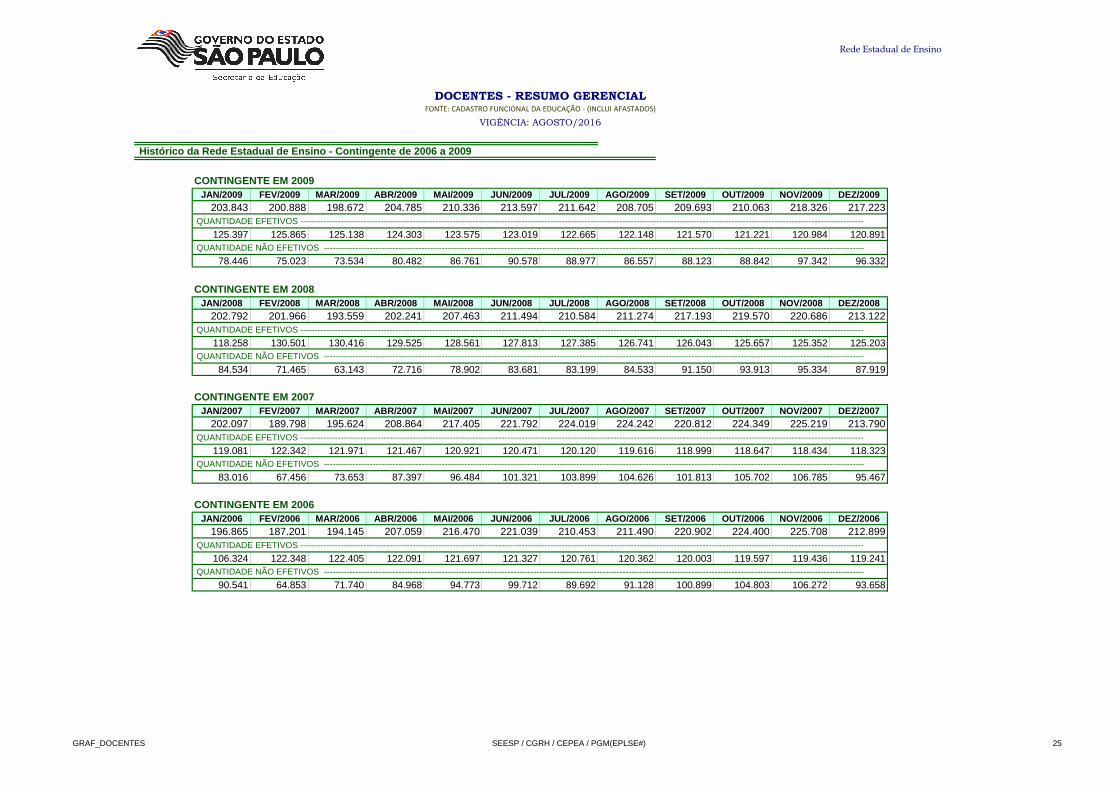
Histórico da Rede Estadual de Ensino - Contingente de 2006 a 2009
CONTINGENTE EM 2009JAN/2009 FEV/2009 MAR/2009 ABR/2009 MAI/2009 JUN/2009 JUL /2009 AGO/2009 SET/2009 OUT/2009 NOV/2009 DEZ/2009
203.843 200.888 198.672 204.785 210.336 213.597 211.642 208.705 209.693 210.063 218.326 217.223 QUANTIDADE EFETIVOS ----------------------------------------------------------------------------------------------------------------------------------------------------------------------------------------------------
125.397 125.865 125.138 124.303 123.575 123.019 122.665 122.148 121.570 121.221 120.984 120.891 QUANTIDADE NÃO EFETIVOS --------------------------------------------------------------------------------------------------------------------------------------------------------------------------------------------
78.446 75.023 73.534 80.482 86.761 90.578 88.977 86.557 88.123 88.842 97.342 96.332
CONTINGENTE EM 2008JAN/2008 FEV/2008 MAR/2008 ABR/2008 MAI/2008 JUN/2008 JUL /2008 AGO/2008 SET/2008 OUT/2008 NOV/2008 DEZ/2008
202.792 201.966 193.559 202.241 207.463 211.494 210.584 211.274 217.193 219.570 220.686 213.122 QUANTIDADE EFETIVOS ----------------------------------------------------------------------------------------------------------------------------------------------------------------------------------------------------
118.258 130.501 130.416 129.525 128.561 127.813 127.385 126.741 126.043 125.657 125.352 125.203 QUANTIDADE NÃO EFETIVOS --------------------------------------------------------------------------------------------------------------------------------------------------------------------------------------------
84.534 71.465 63.143 72.716 78.902 83.681 83.199 84.533 91.150 93.913 95.334 87.919
CONTINGENTE EM 2007JAN/2007 FEV/2007 MAR/2007 ABR/2007 MAI/2007 JUN/2007 JUL /2007 AGO/2007 SET/2007 OUT/2007 NOV/2007 DEZ/2007
202.097 189.798 195.624 208.864 217.405 221.792 224.019 224.242 220.812 224.349 225.219 213.790 QUANTIDADE EFETIVOS ----------------------------------------------------------------------------------------------------------------------------------------------------------------------------------------------------
119.081 122.342 121.971 121.467 120.921 120.471 120.120 119.616 118.999 118.647 118.434 118.323 QUANTIDADE NÃO EFETIVOS --------------------------------------------------------------------------------------------------------------------------------------------------------------------------------------------
83.016 67.456 73.653 87.397 96.484 101.321 103.899 104.626 101.813 105.702 106.785 95.467
CONTINGENTE EM 2006JAN/2006 FEV/2006 MAR/2006 ABR/2006 MAI/2006 JUN/2006 JUL /2006 AGO/2006 SET/2006 OUT/2006 NOV/2006 DEZ/2006
196.865 187.201 194.145 207.059 216.470 221.039 210.453 211.490 220.902 224.400 225.708 212.899 QUANTIDADE EFETIVOS ----------------------------------------------------------------------------------------------------------------------------------------------------------------------------------------------------
106.324 122.348 122.405 122.091 121.697 121.327 120.761 120.362 120.003 119.597 119.436 119.241 QUANTIDADE NÃO EFETIVOS --------------------------------------------------------------------------------------------------------------------------------------------------------------------------------------------
90.541 64.853 71.740 84.968 94.773 99.712 89.692 91.128 100.899 104.803 106.272 93.658
GRAF_DOCENTES SEESP / CGRH / CEPEA / PGM(EPLSE#) 25
DOCENTES - RESUMO GERENCIAL
FONTE: CADASTRO FUNCIONAL DA EDUCAÇÃO - (INCLUI AFASTADOS)
VIGÊNCIA: AGOSTO/2016
Rede Estadual de Ensino
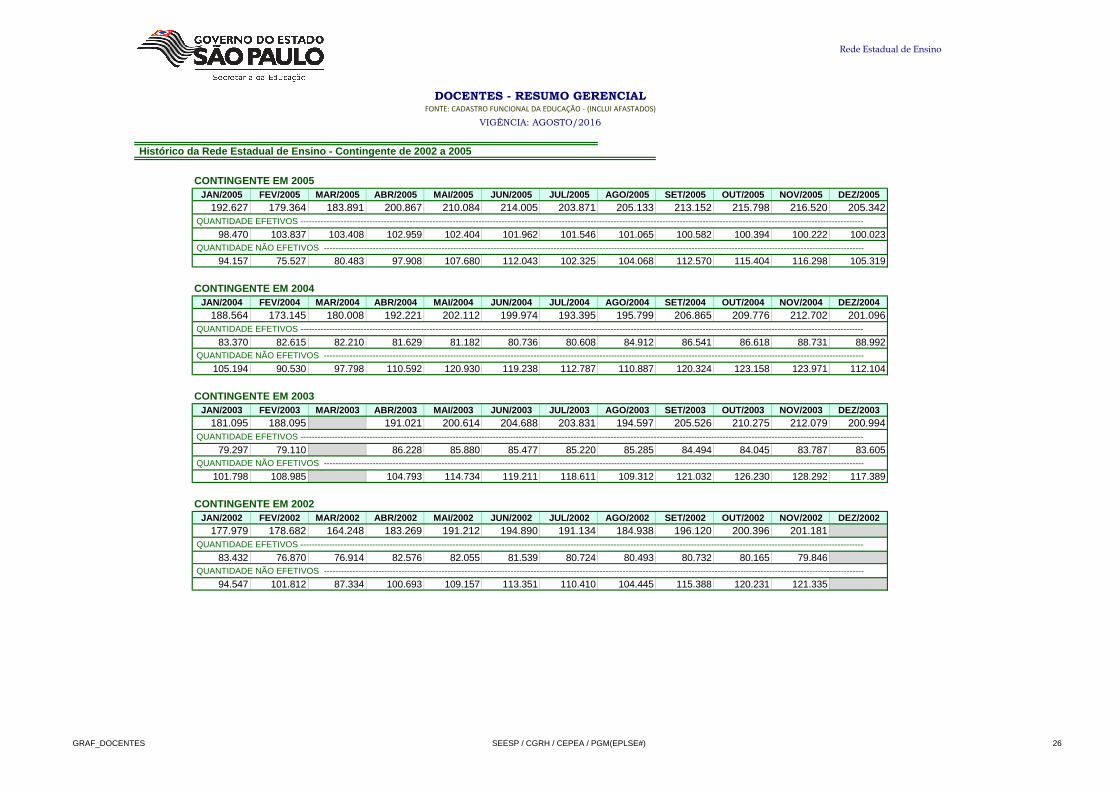
Histórico da Rede Estadual de Ensino - Contingente de 2002 a 2005
CONTINGENTE EM 2005JAN/2005 FEV/2005 MAR/2005 ABR/2005 MAI/2005 JUN/2005 JUL /2005 AGO/2005 SET/2005 OUT/2005 NOV/2005 DEZ/2005
192.627 179.364 183.891 200.867 210.084 214.005 203.871 205.133 213.152 215.798 216.520 205.342 QUANTIDADE EFETIVOS ----------------------------------------------------------------------------------------------------------------------------------------------------------------------------------------------------
98.470 103.837 103.408 102.959 102.404 101.962 101.546 101.065 100.582 100.394 100.222 100.023 QUANTIDADE NÃO EFETIVOS --------------------------------------------------------------------------------------------------------------------------------------------------------------------------------------------
94.157 75.527 80.483 97.908 107.680 112.043 102.325 104.068 112.570 115.404 116.298 105.319
CONTINGENTE EM 2004JAN/2004 FEV/2004 MAR/2004 ABR/2004 MAI/2004 JUN/2004 JUL /2004 AGO/2004 SET/2004 OUT/2004 NOV/2004 DEZ/2004
188.564 173.145 180.008 192.221 202.112 199.974 193.395 195.799 206.865 209.776 212.702 201.096 QUANTIDADE EFETIVOS ----------------------------------------------------------------------------------------------------------------------------------------------------------------------------------------------------
83.370 82.615 82.210 81.629 81.182 80.736 80.608 84.912 86.541 86.618 88.731 88.992 QUANTIDADE NÃO EFETIVOS --------------------------------------------------------------------------------------------------------------------------------------------------------------------------------------------
105.194 90.530 97.798 110.592 120.930 119.238 112.787 110.887 120.324 123.158 123.971 112.104
CONTINGENTE EM 2003JAN/2003 FEV/2003 MAR/2003 ABR/2003 MAI/2003 JUN/2003 JUL /2003 AGO/2003 SET/2003 OUT/2003 NOV/2003 DEZ/2003
181.095 188.095 0 191.021 200.614 204.688 203.831 194.597 205.526 210.275 212.079 200.994 QUANTIDADE EFETIVOS ----------------------------------------------------------------------------------------------------------------------------------------------------------------------------------------------------
79.297 79.110 86.228 85.880 85.477 85.220 85.285 84.494 84.045 83.787 83.605 QUANTIDADE NÃO EFETIVOS --------------------------------------------------------------------------------------------------------------------------------------------------------------------------------------------
101.798 108.985 104.793 114.734 119.211 118.611 109.312 121.032 126.230 128.292 117.389
CONTINGENTE EM 2002JAN/2002 FEV/2002 MAR/2002 ABR/2002 MAI/2002 JUN/2002 JUL /2002 AGO/2002 SET/2002 OUT/2002 NOV/2002 DEZ/2002
177.979 178.682 164.248 183.269 191.212 194.890 191.134 184.938 196.120 200.396 201.181 0 QUANTIDADE EFETIVOS ----------------------------------------------------------------------------------------------------------------------------------------------------------------------------------------------------
83.432 76.870 76.914 82.576 82.055 81.539 80.724 80.493 80.732 80.165 79.846 QUANTIDADE NÃO EFETIVOS --------------------------------------------------------------------------------------------------------------------------------------------------------------------------------------------
94.547 101.812 87.334 100.693 109.157 113.351 110.410 104.445 115.388 120.231 121.335
GRAF_DOCENTES SEESP / CGRH / CEPEA / PGM(EPLSE#) 26

DOCENTES - RESUMO GERENCIAL
FONTE: CADASTRO FUNCIONAL DA EDUCAÇÃO - (INCLUI AFASTADOS)
VIGÊNCIA: AGOSTO/2016
Rede Estadual de Ensino
Histórico da Rede Estadual de Ensino - Contingente de 1999 a 2001
CONTINGENTE EM 2001JAN/2001 FEV/2001 MAR/2001 ABR/2001 MAI/2001 JUN/2001 JUL /2001 AGO/2001 SET/2001 OUT/2001 NOV/2001 DEZ/2001
177.320 174.180 163.776 173.583 177.785 185.731 185.360 177.124 183.445 183.154 183.378 181.259 QUANTIDADE EFETIVOS ----------------------------------------------------------------------------------------------------------------------------------------------------------------------------------------------------
84.874 84.633 84.134 83.394 82.190 81.441 81.209 80.941 81.047 76.562 75.874 83.342 QUANTIDADE NÃO EFETIVOS --------------------------------------------------------------------------------------------------------------------------------------------------------------------------------------------
92.446 89.547 79.642 90.189 95.595 104.290 104.151 96.183 102.398 106.592 107.504 97.917
CONTINGENTE EM 2000JAN/2000 FEV/2000 MAR/2000 ABR/2000 MAI/2000 JUN/2000 JUL /2000 AGO/2000 SET/2000 OUT/2000 NOV/2000 DEZ/2000
182.190 188.021 165.958 174.751 179.754 188.303 184.813 179.936 184.232 189.979 190.475 183.313 QUANTIDADE EFETIVOS ----------------------------------------------------------------------------------------------------------------------------------------------------------------------------------------------------
49.388 89.482 89.904 88.237 87.225 86.721 85.949 84.659 83.557 81.828 81.022 79.815 QUANTIDADE NÃO EFETIVOS --------------------------------------------------------------------------------------------------------------------------------------------------------------------------------------------
132.802 98.539 76.054 86.514 92.529 101.582 98.864 95.277 100.675 108.151 109.453 103.498
CONTINGENTE EM 1999JAN/1999 FEV/1999 MAR/1999 ABR/1999 MAI/1999 JUN/1999 JUL /1999 AGO/1999 SET/1999 OUT/1999 NOV/1999 DEZ/1999
197.119 0 175.825 0 0 0 192.331 193.154 196.247 203.650 204.776 200.531 QUANTIDADE EFETIVOS ----------------------------------------------------------------------------------------------------------------------------------------------------------------------------------------------------
64.414 60.125 56.909 57.245 56.697 56.017 55.550 54.861 QUANTIDADE NÃO EFETIVOS --------------------------------------------------------------------------------------------------------------------------------------------------------------------------------------------
132.705 115.700 135.422 135.909 139.550 147.633 149.226 145.670
GRAF_DOCENTES SEESP / CGRH / CEPEA / PGM(EPLSE#) 27

DOCENTES - RESUMO GERENCIAL
FONTE: CADASTRO FUNCIONAL DA EDUCAÇÃO - (INCLUI AFASTADOS)
VIGÊNCIA: AGOSTO/2016
Rede Estadual de Ensino
Média Anual dos Contingentes de 2011, 2012, 2013 e 2014, com Variação em Relação à Média do Ano Anter ior
2011 2012 2013 2014 2011 2012 2013 2014 2011 2012 2013 2014
118.117 120.491 118.279 100.985 104.002 110.754 219.101 224.493 229.033 211.134 193.933 175.678
0,31% 2,01% -1,84% 1,04% 2,99% 6,49% 0,64% 2,46% 2,02% -7,81% -8,15% -9,41%
Média Anual Contingente da Rede Estadual de 1999 a 2010 e Variação em Relação à Média do Ano Anterior
1999 2000 2001 2002 2003 2004 2005 2006 2007 2008 2009 2010
195.454 182.644 178.841 187.641 199.347 196.305 203.388 210.719 214.001 209.329 208.981 217.700
- -6,55% -2,08% 4,92% 6,24% -1,53% 3,61% 3,60% 1,56% -2,18% -0,17% 4,17%
Análise
Média Anual
(%) variação em relação ao ano anterior
Total GeralNão EfetivosEfetivos
186.145 202.440 212.503
- 8,75% 4,97%
Análise
Média Anual
(%) variação em relação ao ano anterior
Média obtida em 4 anos
(%) variação em relação aos 4 anos anteriores
GRAF_DOCENTES SEESP / CGRH / CEPEA / PGM(EPLSE#) 28
DOCENTES - RESUMO GERENCIAL
FONTE: CADASTRO FUNCIONAL DA EDUCAÇÃO - (INCLUI AFASTADOS)
VIGÊNCIA: AGOSTO/2016
Rede Estadual de Ensino
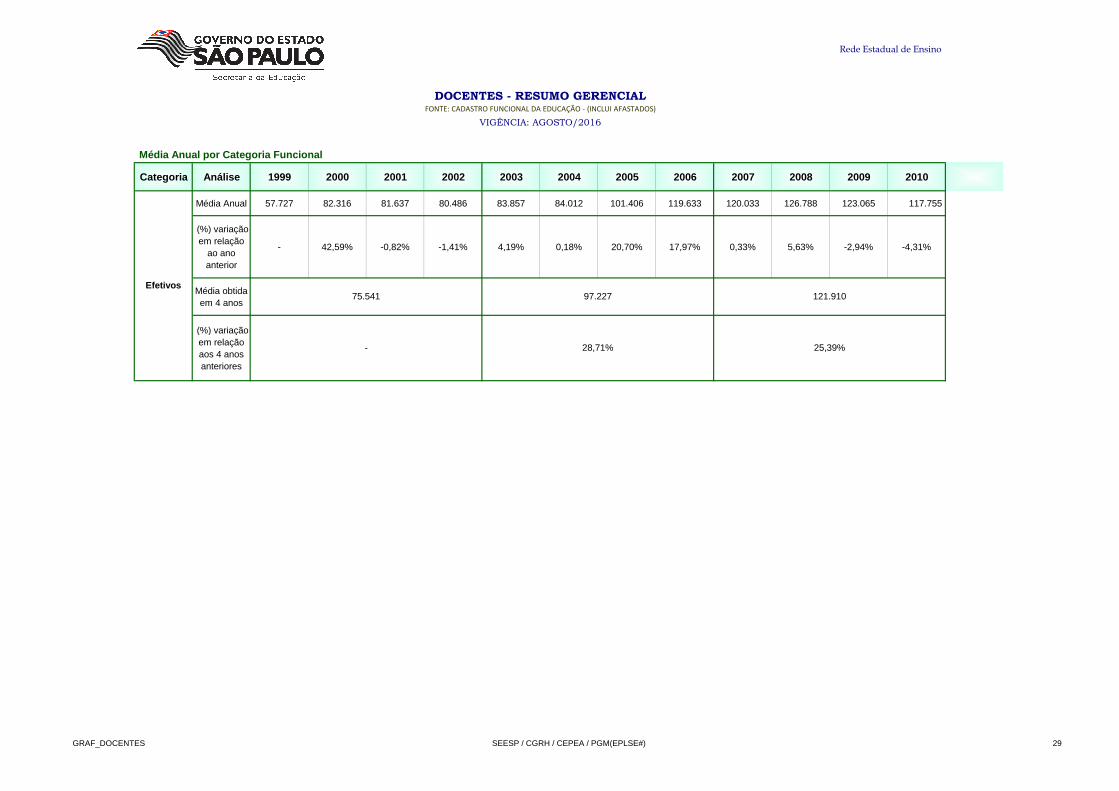
Média Anual por Categoria Funcional
Categoria Análise 1999 2000 2001 2002 2003 2004 2005 2006 200 7 2008 2009 2010
Média Anual 57.727 82.316 81.637 80.486 83.857 84.012 101.406 119.633 120.033 126.788 123.065 117.755
(%) variação em relação
ao ano anterior
- 42,59% -0,82% -1,41% 4,19% 0,18% 20,70% 17,97% 0,33% 5,63% -2,94% -4,31%
Média obtida em 4 anos
(%) variação em relação aos 4 anos anteriores
28,71% 25,39%
Efetivos75.541 97.227 121.910
-
GRAF_DOCENTES SEESP / CGRH / CEPEA / PGM(EPLSE#) 29

DOCENTES - RESUMO GERENCIAL
FONTE: CADASTRO FUNCIONAL DA EDUCAÇÃO - (INCLUI AFASTADOS)
VIGÊNCIA: AGOSTO/2016
Rede Estadual de Ensino
Média Anual por Categoria Funcional
Categoria Análise 1999 2000 2001 2002 2003 2004 2005 2006 200 7 2008 2009 2010
Média Anual 137.727 100.328 97.205 107.155 115.490 112.293 101.982 91.087 93.968 82.541 85.916 99.945
(%) variação em relação
ao ano anterior
- -27,15% -3,11% 10,24% 7,78% -2,77% -9,18% -10,68% 3,16% -12,16% 4,09% 16,33%
Média obtida em 4 anos
(%) variação em relação aos 4 anos anteriores
-80.000 -18.013 -15.568 -26.669 -31.633 -28.281 -576 28.546 26.064 44.247 37.148 17.810
-58,09% -17,95% -16,02% -24,89% -27,39% -25,18% -0,56% 31,34% 27,74% 53,61% 43,24% 17,82%
105.213 90.593
- -4,87% -13,90%
(%) -31,70% -7,59% 34,57%
Contigente Efetivo em relação ao contingente Não Efetivo (Anual)
(%)
Contigente Efetivo em relação ao contingente Não
Efetivo(Período de 4 anos)
-35.062 -7.986 31.317
Não Efetivos 110.604
GRAF_DOCENTES SEESP / CGRH / CEPEA / PGM(EPLSE#) 30

DOCENTES - RESUMO GERENCIAL
FONTE: CADASTRO FUNCIONAL DA EDUCAÇÃO - (INCLUI AFASTADOS)
VIGÊNCIA: AGOSTO/2016
Rede Estadual de Ensino
Fonte Cadastro Funcional da Educação
DOCENTES
- O Cadastro Funcional não possui registros de eventuais.
- Registros não efetivos: Inclui todos os registros com categoria funcional diferente de "A";
- Incluídos registros com códigos de afastamentos: Junto ao T.R.E., convênio da municipalização, órgãos da administração direta e/ou autarquias, entre outros;
- A partir de setembro de 2007, todos os docentes Temporários, com interrupção de exercício (motivo 253), deixaram de ser considerados nos relatórios de contingente ativos da Rede Estadual de Ensino. Exclusivamente para consultas, foi acrescentado um relatório referente a estes docentes no final deste gerencial;
Critérios de Seleção de Registros
Informações referentes aos meses de fevereiro, abril, maio e junho de 1999, dezembro de 2002 e março de 2003 não disponíveis.
Observação
Mês de Referência AGOSTO de 2016
- Registros ativos respectivamente nos cargos e unidades administrativas de exercício;
- Incluídos os afastamentos para postos de serviço: Professor Coordenador (Motivo 116) e Vice-Diretor de Escola (MOTIVO 121);
GRAF_DOCENTES SEESP / CGRH / CEPEA / PGM(EPLSE#) 31