comisiÓn nacional del mercado de valores · comisiÓn nacional del mercado de valores ... revenues...
TRANSCRIPT

COMISIÓN NACIONAL DEL MERCADO DE VALORES Paseo de la Castellana, 19 28046 Madrid
Madrid, 14 de noviembre de 2012
Muy Sres. nuestros: ACCIONA adjunta presentación en ingles que se seguirá en la multiconferencia de hoy a las 12:00pm. La presentación podrá ser seguida vía webcast a través de la Web de ACCIONA (www.acciona.es).
Jorge Vega-Penichet López Secretario del Consejo de Administración

14th November 2012

9M 2012 Results Presentation 2
Disclaimer
This document has been prepared by ACCIONA, S.A. (“ACCIONA” or the “Company”) exclusively for use during the presentation of financial results of the of thefirst nine months 2012 (9M 2012). Therefore it cannot be disclosed or made public by any person or entity with an aim other than the one expressed above,without the prior written consent of the Company.
The Company does not assume any liability for the content of this document if used for different purposes thereof.
The information and any opinions or statements made in this document have not been verified by independent third parties, nor audited; therefore no express orimplied warranty is made as to the impartiality, accuracy, completeness or correctness of the information or the opinions or statements expressed herein.
Neither the Company, its subsidiaries or any entity within ACCIONA Group or subsidiaries, any of its advisors or representatives assume liability of any kind,whether for negligence or any other reason, for any damage or loss arising from any use of this document or its contents.
The information contained in this document on the price at which securities issued by ACCIONA have been bought or sold, or on the performance of thosesecurities, cannot be used to predict the future performance of securities issued by ACCIONA.
Neither this document nor any part of it constitutes a contract, nor may it be used for incorporation into or construction of any contract or agreement.
IMPORTANT INFORMATION
This document does not constitute an offer or invitation to purchase or subscribe shares, in accordance with the provisions of the Spanish Securities Market Law(Law 24/1988, of July 28, as amended and restated from time to time), Royal Decree-Law 5/2005, of March 11, and/or Royal Decree 1310/2005, of November 4,and its implementing regulations.
In addition, this document does not constitute an offer of purchase, sale or exchange, nor a request for an offer of purchase, sale or exchange of securities, nor arequest for any vote or approval in any other jurisdiction.
Particularly, this document does not constitute an offer to purchase, sell or exchange or the solicitation of an offer to purchase, sell or exchange any securities.
FORWARD-LOOKING STATEMENTS
This document contains forward-looking information and statements about ACCIONA, including financial projections and estimates and their underlyingassumptions, statements regarding plans, objectives and expectations with respect to future operations, capital expenditures, synergies, products and services, andstatements regarding future performance. Forward-looking statements are statements that are not historical facts and are generally identified by the words“expects”, “anticipates”, “believes”, “intends”, “estimates” and similar expressions.
Although ACCIONA believes that the expectations reflected in such forward-looking statements are reasonable, investors and holders of ACCIONA shares arecautioned that forward-looking information and statements are subject to various risks and uncertainties, many of which are difficult to predict and generallybeyond the control of ACCIONA, that could cause actual results and developments to differ materially from those expressed in, or implied or projected by, theforward-looking information and statements. These risks and uncertainties include those discussed or identified in the documents sent by ACCIONA to the ComisiónNacional del Mercado de Valores, which are accessible to the public.
Forward-looking statements are not guarantees of future performance. They have not been reviewed by the auditors of ACCIONA. You are cautioned not to placeundue reliance on the forward-looking statements, which speak only as of the date they were made. All subsequent oral or written forward-looking statementsattributable to ACCIONA or any of its members, directors, officers, employees or any persons acting on its behalf are expressly qualified in their entirety by thecautionary statement above. All forward-looking statements included herein are based on information available to ACCIONA, on the date hereof. Except as requiredby applicable law, ACCIONA does not undertake any obligation to publicly update or revise any forward-looking statements, whether as a result of new information,future events or otherwise.

9M 2012 Results Presentation 3
1. 9M 2012 key highlights
2. Energy reform
3. Group financial information
4. Core divisions - financial information
5. Other businesses - financial information
6. Conclusions
Table of contents
1. 9M 2012 key highlights

9M 2012 Results Presentation
9M 2012 key highlights
Revenues: €5,165m (+7.7%); EBITDA: €1,040m (+11.4%);
Ordinary EBT: €168m (+49.4%¹)
Revenues: €5,165m (+7.7%); EBITDA: €1,040m (+11.4%);
Ordinary EBT: €168m (+49.4%¹)
Energy growth backed by capacity increase and higher wind load factors
Infrastructures impacted by lower volumes in Spain
Energy growth backed by capacity increase and higher wind load factors
Infrastructures impacted by lower volumes in Spain
Ordinary capex down ~33% to €588m vs 9M 201160% of capex invested internationally
Ordinary capex down ~33% to €588m vs 9M 201160% of capex invested internationally
Energy reform: significant negative impact on P&L but limited on project finance structures
Energy reform: significant negative impact on P&L but limited on project finance structures
5
Consortium led by ACCIONA (39%) and BTG Pactual (39%) awarded the management concession for Aigües Ter Llobregat (ATLL)
Consortium led by ACCIONA (39%) and BTG Pactual (39%) awarded the management concession for Aigües Ter Llobregat (ATLL)
1Like for like Ordinary EBT growth excluding the effect of 9M 2011 capital gains
2. Energy reform

9M 2012 Results Presentation
Energy reform
On 14th September Government approved draft legislation to end tariff deficit
On 14th September Government approved draft legislation to end tariff deficit
Introduction of generation taxes and levies as main instrumentsIntroduction of generation taxes and levies as main instruments
Limited impact to ACCIONA’s Spanish generation project finance structures
Limited impact to ACCIONA’s Spanish generation project finance structures
Improved regulatory visibility welcomed but fiscal measures are disproportionate
Improved regulatory visibility welcomed but fiscal measures are disproportionate
Corrective measures to mitigate the impact on profitability and to preserve strong financial position
Corrective measures to mitigate the impact on profitability and to preserve strong financial position
7
9M 2012 Results Presentation
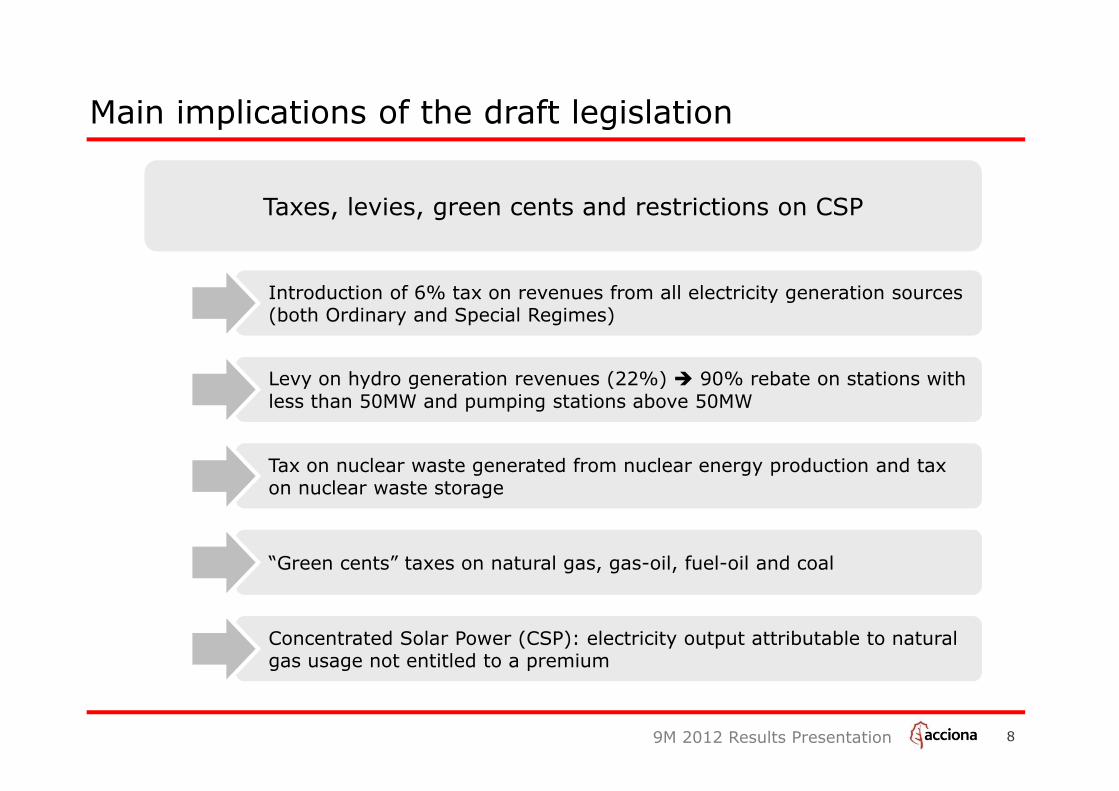
Main implications of the draft legislation
Taxes, levies, green cents and restrictions on CSPTaxes, levies, green cents and restrictions on CSP
Introduction of 6% tax on revenues from all electricity generation sources (both Ordinary and Special Regimes)Introduction of 6% tax on revenues from all electricity generation sources (both Ordinary and Special Regimes)
Levy on hydro generation revenues (22%) 90% rebate on stations with less than 50MW and pumping stations above 50MW Levy on hydro generation revenues (22%) 90% rebate on stations with less than 50MW and pumping stations above 50MW
Tax on nuclear waste generated from nuclear energy production and tax on nuclear waste storageTax on nuclear waste generated from nuclear energy production and tax on nuclear waste storage
“Green cents” taxes on natural gas, gas-oil, fuel-oil and coal“Green cents” taxes on natural gas, gas-oil, fuel-oil and coal
8
Concentrated Solar Power (CSP): electricity output attributable to natural gas usage not entitled to a premiumConcentrated Solar Power (CSP): electricity output attributable to natural gas usage not entitled to a premium

9M 2012 Results Presentation
Impact of the measures
6% generation revenue tax1
Regulatory measures affecting ACCIONA
22% hydro levy643MW of ACCIONA’s capacity entitled to 90% rebate
2
CSP: electricity output attributable to natural gas usage not entitled to a premium3
Total estimated annual gross impact
Potential for partial mitigation via increase in marginal costs of thermal generators
Potential for partial mitigation via increase in marginal costs of thermal generators
Marginal impact on ACCIONA’s Spanish generation project finance structures
Marginal impact on ACCIONA’s Spanish generation project finance structures
Pre-tax:Σ~€80m-€100m
9
9M 2012 Results Presentation
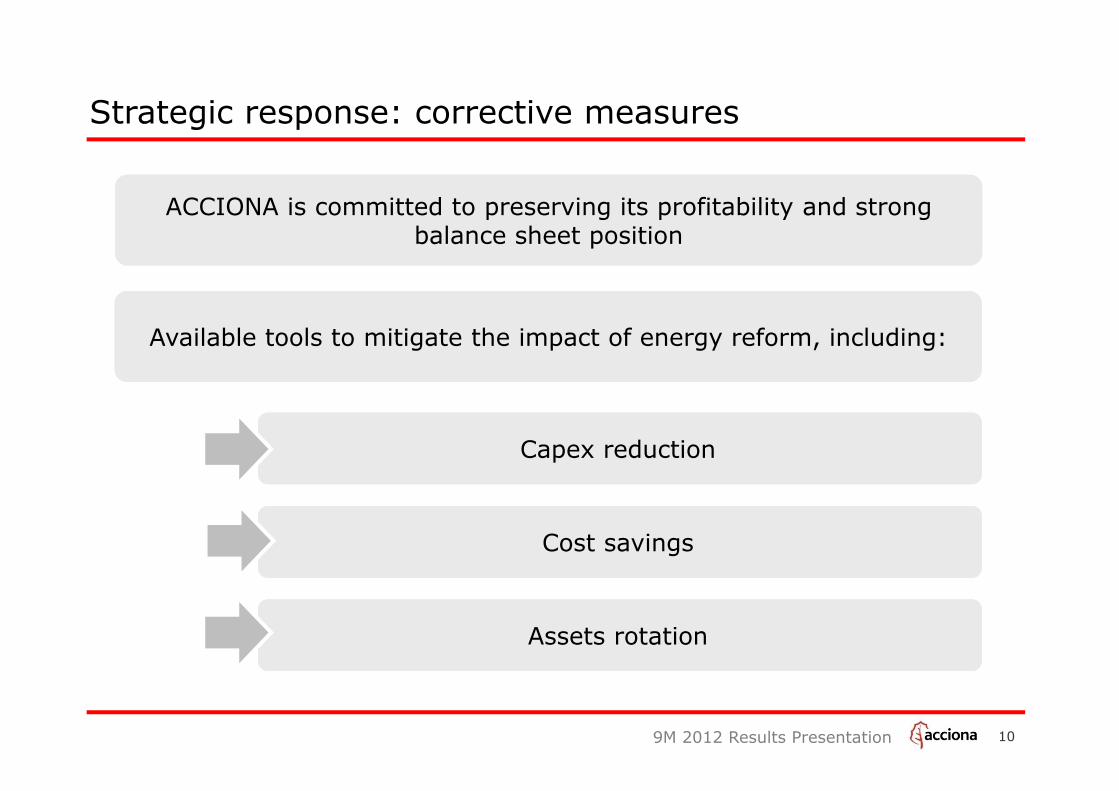
Strategic response: corrective measures
Capex reductionCapex reduction
Cost savingsCost savings
Assets rotationAssets rotation
Available tools to mitigate the impact of energy reform, including:Available tools to mitigate the impact of energy reform, including:
ACCIONA is committed to preserving its profitability and strong balance sheet position
ACCIONA is committed to preserving its profitability and strong balance sheet position
10

3. Group financial information

9M 2012 Results Presentation
Jan-Sep 11 Jan-Sep 12 Chg. Chg.€m €m €m (%)
Revenues 4,796 5,165 369 7.7%
EBITDA 934 1,040 106 11.4%
D&A and provisions -514 -527 -13 2.6%
Results on impairment / reversal of assets -4 -15 -11 247.7%
Results on non current assets disposals or held for sale assets val.
278 7 -271 -97.4%
Other gains or losses -3 4 6 n.m.
EBIT 691 509 -182 -26.4%Net financial results¹ -304 -338 -33 11.0%
Others 5 -1 -7 n.m.
Ordinary EBT³ 112 168 55 49.4%
EBT 392 170 -223 -56.7%Income tax -82 -51 31 -37.5%
Profit after Taxes 310 118 -192 -61.8%Minority interest 4 -4 -8 n.m.
Attributable Net Profit 314 114 -200 -63.7%
P&L: Key figures
EBITDA breakdown2
9M 2012 (By division)
1Net financial results include financial revenues and expenses and exchange differences 2EBITDA contribution percentages are calculated before consolidation adjustments3Like for like Ordinary EBT growth excluding the effect of 9M 2011 capital gains 12
Energy 79%
Infrastructure 12%
Water and ES 3%
Others 7%

9M 2012 Results Presentation 13
Capex by division
Capex breakdown By division
Significant ordinary capex reduction to €588m (-33%)
60% of capex invested internationally
Core areas capture most of 9M 2012 capex:
− Infrastructures: capex diversified in concessions works e.g. Ruta 160 road (Chile), Nouvelle Autoroute A-30 (Canada), Chinook road (Canada), A-2 road (Spain), Rodovía do Aço road (Brazil) and Fort St John Hospital (Canada)
− Energy:
o 132MW wind and 50MW CSP installed during 9M 2012
o 107MW under construction
Key highlights
Jan-Sep 11 Jan-Sep 12
Energy 629 322
Infrastructures 206 259
Real Estate 3 2
Water & Environment 23 17
Logistic & Transport S. 6 -8
Other Business 5 -4
Net ordinary capex 872 588
Divestments -425 -24
Total net capex 447 564
Capex(€m)
9M 2012 Results Presentation
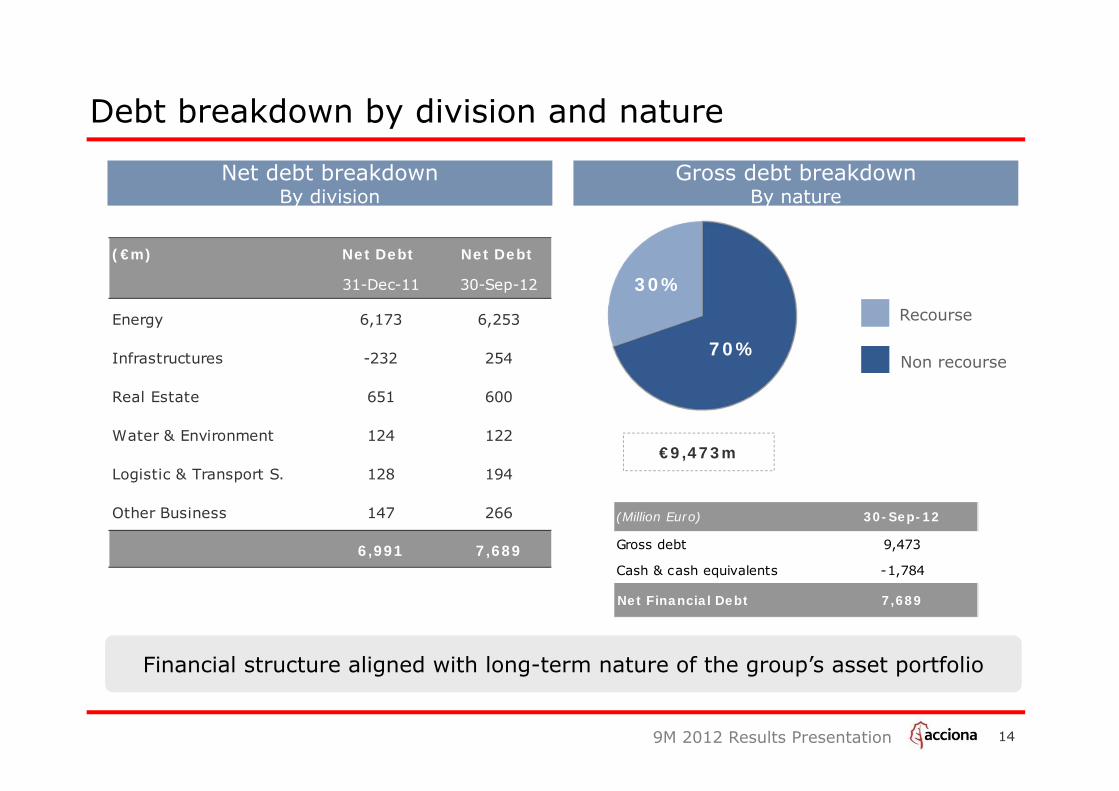
Debt breakdown by division and nature
Net debt breakdownBy division
Gross debt breakdownBy nature
70%
30%
Recourse
Non recourse
€9,473m
Financial structure aligned with long-term nature of the group’s asset portfolioFinancial structure aligned with long-term nature of the group’s asset portfolio
(Million Euro) 30-Sep-12
Gross debt 9,473
Cash & cash equivalents -1,784
Net Financial Debt 7,689
14
(€m) Net Debt Net Debt
31-Dec-11 30-Sep-12
Energy 6,173 6,253
Infrastructures -232 254
Real Estate 651 600
Water & Environment 124 122
Logistic & Transport S. 128 194
Other Business 147 266
6,991 7,689

9M 2012 Results Presentation
Net debt evolution
Net debt reconciliation 9M 2012
15
9M 2012 Results Presentation 16
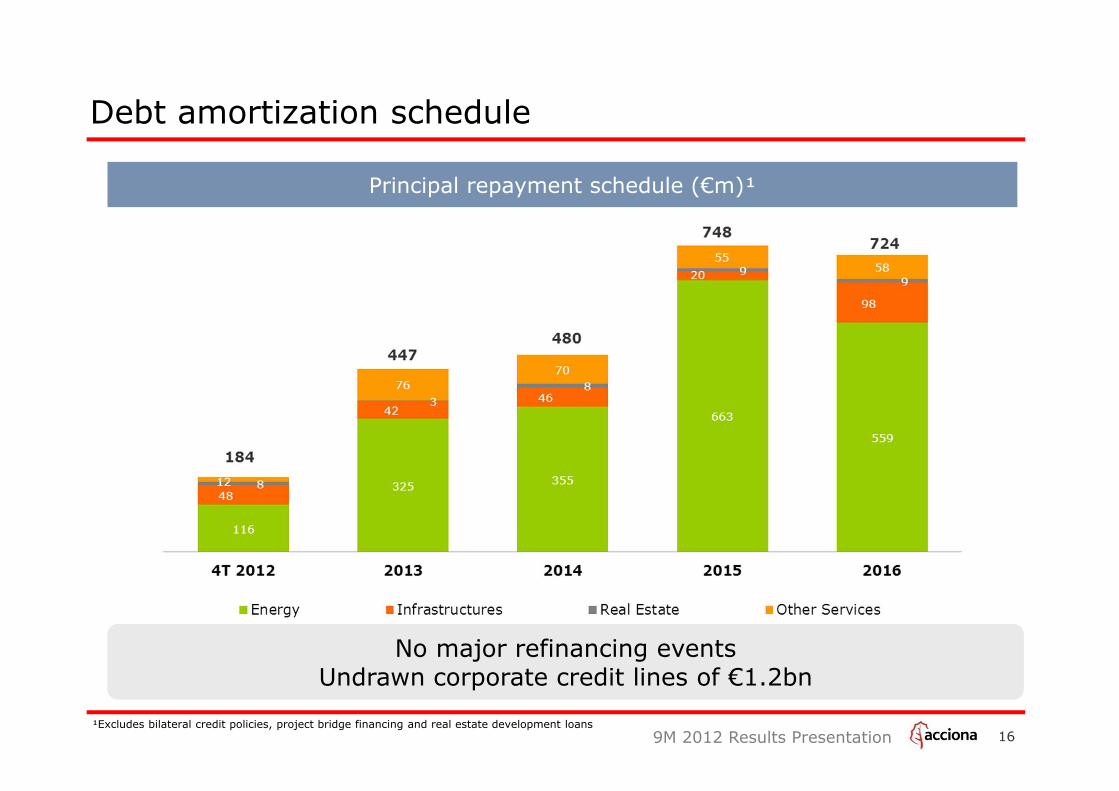
Debt amortization schedule
Principal repayment schedule (€m)¹
¹Excludes bilateral credit policies, project bridge financing and real estate development loans
No major refinancing eventsUndrawn corporate credit lines of €1.2bn
No major refinancing eventsUndrawn corporate credit lines of €1.2bn

4. Core divisions - financial information

9M 2012 Results Presentation 18
Energy: Key figures
Key highlightsKey figures
Attributable production up 15.9%: increased capacity in LTM (+209MW) and higher national and international wind load factors vs. 9M 2011, partially offset by lower hydro load factor
9M 2012 pool prices down -2.1% vs. 9M 2011
Generation EBITDA margin reduction explained by higher sales from energy commercialisation and lower hydraulicity
9M 2012 Energy EBITDA breakdown (€m)
(Million Euro) Jan-Sep 11 Jan-Sep 12 Chg. Chg. (%)
Revenues 1,178 1,590 412 35.0%
EBITDA 682 820 138 20.2%
Margin (%) 57.9% 51.6%

9M 2012 Results Presentation 19
Energy: Installed capacity and under construction
Installed MW @ Sep 2012 MW under construction @ Sep 2012
89% Attributable 100% Attributable
MW (Total) Spain Internat. Total
Wind 4,691 2,362 7,054
Conventional Hydro 680 - 680
Hydro special regime 232 - 232
Solar Thermoelectric 250 64 314
Biomass 57 - 57
Solar PV 3 46 49
Cogeneration 9 - 9
TOTAL 5,922 2,472 8,394
MW (Total) Spain Internat. Total
Wind 53 54 107
Conventional Hydro - - -
Hydro special regime - - -
Solar Thermoelectric - - -
Biomass - - -
Solar PV - - -
Cogeneration - - -
TOTAL 53 54 107

9M 2012 Results Presentation
Q1 2012 Q2 2012 Q3 2012 Q4 2012
MW¹ 618 656 710 492
GWh 1,349 1,433 1,568 1,087
€/MWh 53.3 52.0 55.6 53.4
% Var vs Pool price² 5% 12% 13% -
% Saleable energy³ 74% 66% 97% 55%
20
€53.3MWh (+5%)
Pool 9M 2012: €48.8
Quarterly forward 2012
Quarterly av. pool 2012
Pool FY2011: €50.3
€MWh
1Assuming load base (100% load factor) 2Quarterly average pool price3Saleable energy: Spanish production from wind MW under the transitory regime (2,792MW net) and most of the hydro capacity (681MW)
Energy: Spanish pool price
€52.0MWh (+12%)€55.6MWh (+13%) €53.4MWh
Ene Feb Mar Apr May Jun Jul Aug Sept Oct Nov Dec
9M 2012 Results Presentation 21
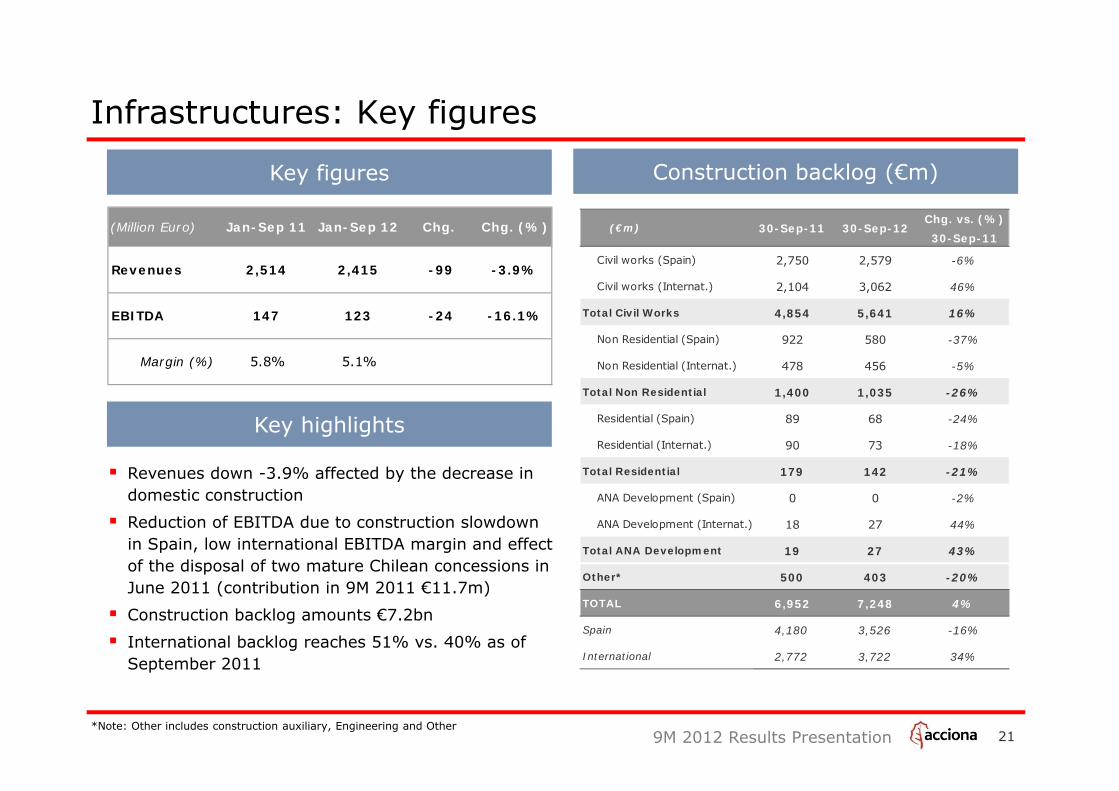
Infrastructures: Key figures
Construction backlog (€m)Key figures
Revenues down -3.9% affected by the decrease in domestic construction
Reduction of EBITDA due to construction slowdown in Spain, low international EBITDA margin and effect of the disposal of two mature Chilean concessions in June 2011 (contribution in 9M 2011 €11.7m)
Construction backlog amounts €7.2bn
International backlog reaches 51% vs. 40% as of September 2011
*Note: Other includes construction auxiliary, Engineering and Other
Key highlights
(Million Euro) Jan-Sep 11 Jan-Sep 12 Chg. Chg. (%)
Revenues 2,514 2,415 -99 -3.9%
EBITDA 147 123 -24 -16.1%
Margin (%) 5.8% 5.1%
30-Sep-11
Civil works (Spain) 2,750 2,579 -6%
Civil works (Internat.) 2,104 3,062 46%
Total Civil Works 4,854 5,641 16%
Non Residential (Spain) 922 580 -37%
Non Residential (Internat.) 478 456 -5%
Total Non Residential 1,400 1,035 -26%
Residential (Spain) 89 68 -24%
Residential (Internat.) 90 73 -18%
Total Residential 179 142 -21%
ANA Development (Spain) 0 0 -2%
ANA Development (Internat.) 18 27 44%
Total ANA Development 19 27 43%
Other* 500 403 -20%
TOTAL 6,952 7,248 4%
Spain 4,180 3,526 -16%
International 2,772 3,722 34%
(€m) 30-Sep-11 30-Sep-12Chg. vs. (%)

9M 2012 Results Presentation 22
Infrastructures: Construction backlog
International backlog Sep 2012By geography
Spanish backlog Sep 2012By client type
€3,526m€3,722m
Construction backlog Sep 2012
International 51%
(40% in 9M 11)
Central Admin (52%)
Regional Gover (21%)
Private (11%)
Group Companies (9%)
Municipalities (6%)
Europe (36%)
Latam (41%)
Canada (9%)
Australia (9%)
RoW (4%)
€7,248m€7,248m
Construction backlog Sep 2012 By work type
Civil works (78%)
Non residential (14%)
Residential (2%)
Other¹ (6%)
Spain49%
¹Note: Other includes construction auxiliary, engineering and other
ANA Development (0%)

9M 2012 Results Presentation
Infrastructures: Concessions
Under construction
Operating
Operat. + underconstruction
3 Weighted average by book value (equity + net debt) excluding holding companies4 Debt figure includes net debt from concessions held for sale (€115m) and those accounted by equity method (€813m)
Invested capital
(€1,854m2)
Spain
Canada
Chile
Mexico
Brazil
Equity: €388m
Net debt4: €1,466m
23
¹Total EBITDA includes -€5m from holding companies and €4m from a sold concession²Total Capital invested includes €41m from SPV companies
Road Rail Canal Port Hospital Total
# of concessions 11 3 1 1 6 22
EBITDA 9M 2012 (€m) 24 0 2 0 17 42¹
Average life3 (yrs) 32 32 30 30 30 31
Average consumed life3 (yrs) 5 6 6 7 6 6
Invested capital (€m) 1,388 72 65 16 271 1,854²
9M 2012 Results Presentation 24
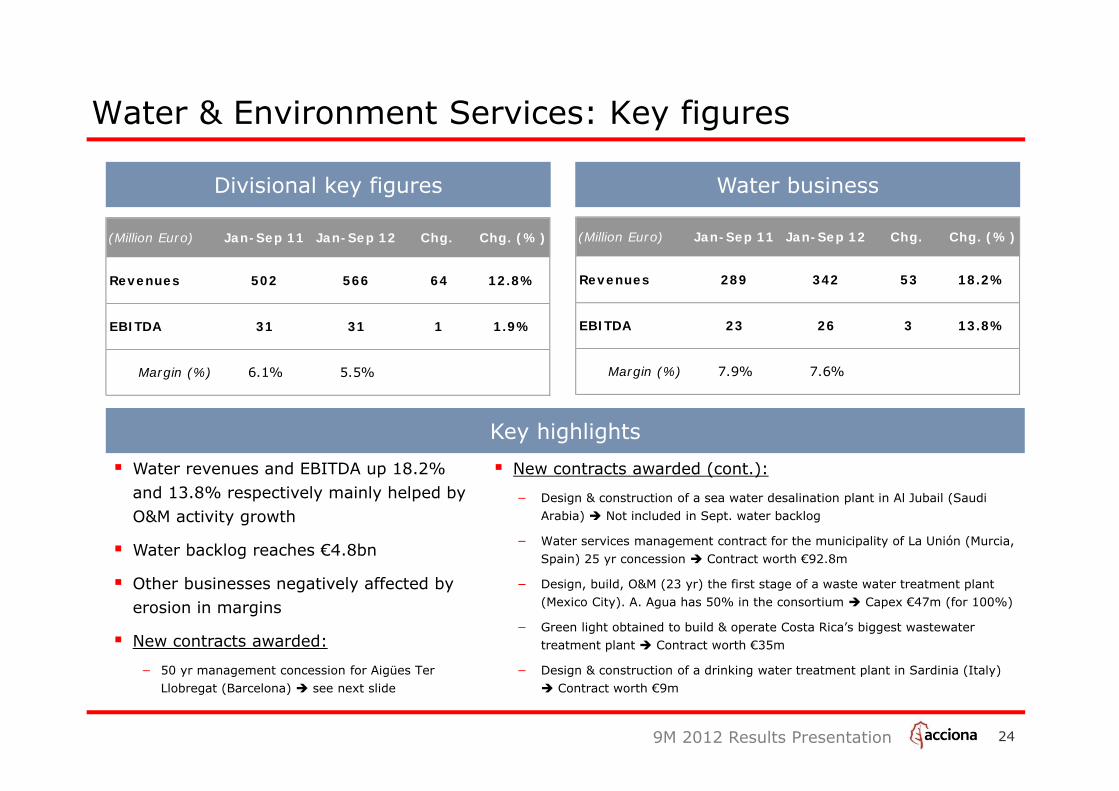
Water & Environment Services: Key figures
Water revenues and EBITDA up 18.2% and 13.8% respectively mainly helped by O&M activity growth
Water backlog reaches €4.8bn
Other businesses negatively affected by erosion in margins
New contracts awarded:
− 50 yr management concession for Aigües Ter Llobregat (Barcelona) see next slide
Divisional key figures Water business
Key highlights
New contracts awarded (cont.):
− Design & construction of a sea water desalination plant in Al Jubail (Saudi Arabia) Not included in Sept. water backlog
− Water services management contract for the municipality of La Unión (Murcia, Spain) 25 yr concession Contract worth €92.8m
− Design, build, O&M (23 yr) the first stage of a waste water treatment plant (Mexico City). A. Agua has 50% in the consortium Capex €47m (for 100%)
− Green light obtained to build & operate Costa Rica’s biggest wastewater treatment plant Contract worth €35m
− Design & construction of a drinking water treatment plant in Sardinia (Italy) Contract worth €9m
(Million Euro) Jan-Sep 11 Jan-Sep 12 Chg. Chg. (%)
Revenues 502 566 64 12.8%
EBITDA 31 31 1 1.9%
Margin (%) 6.1% 5.5%
(Million Euro) Jan-Sep 11 Jan-Sep 12 Chg. Chg. (%)
Revenues 289 342 53 18.2%
EBITDA 23 26 3 13.8%
Margin (%) 7.9% 7.6%

9M 2012 Results Presentation 2525
About the contract
The Catalonian Regional Government has awardeda consortium led by ACCIONA (39%) and the Brazilian investment bank BTG Pactual (39%) the management concession for Aigües TerLlobregat (ATLL)
The 50-year concession includes the management, operation and improvement of facilities that make up the ATLL upstream supply network, including water treatment, storage and transport
The total investment amounts to €995.5m in fees payable to the government:
−Upfront fee of €298.6m to be paid upon the signing of the contract
−A deferred fee of €696.8m in NPV terms to be paid in 50 annual installments
ACCIONA will be responsible for the O&M of the concession assets
The concession will be consolidated using the Equity method; while the O&M contract will be fully consolidated
About ATLL
ATLL is the company that manages the upstream water supply for the Barcelona metropolitan area and nine nearby districts
It serves ~105 municipalities (~90% of revenues from private sector concession holders), representing a population of close to 5m
The facilities managed by ATLL include four large plants: two drinking water treatment plants (Ter and Llobregat rivers), and two desalination plants, as well as several pumping stations and a pipeline network of 900Km
Benefits of the transaction
Further strengthening of ACCIONA’s credentials with this high-profile contract
Reinforces ACCIONA’s commitment to the growth of this core business
Attractive financial returns at a significant premium to ACCIONA’s investment threshold
ACCIONA awarded the management contract for Aigües Ter Llobregat

9M 2012 Results Presentation
Backlog breakdown (€m)By activity
Internat. backlog breakdown Sep 2012By geography
D&C
O&M and services
International
€1,690m
Water backlog breakdown
ATTL contract is not included in the water backlog as of Sep 2012ATTL contract is not included in the water backlog as of Sep 2012
26
5. Other businesses - financial information

9M 2012 Results Presentation 28
Real Estate
9M 2012 results explained by:
− Property development activity affected by challenging market conditions
− Disposal of Splau! shopping centre in October 2011 (€6.3m EBITDA contribution in 9M 2011)
− Disposal of the parking assets in July 2011 (€5m EBITDA contribution in 9M 2011)
Continuing to destock in the residential market
Key figures LTM destocking (units)
~70% first residence
~22% international
Key highlights
(Million Euro) Jan-Sep 11 Jan-Sep 12 Chg. Chg. (%)
Revenues 84 51 -33 -39.5%
EBITDA 10 2 -8 -80.9%
Margin (%) 11.4% 3.6%

9M 2012 Results Presentation 29
Services and Other Business: Key figures
TRASMEDITERRÁNEA affected by: − Fuel cost per mile sailed +8.4%− Occupancy rate:
• Passenger: +3.4pp• Vehicle: +4.6pp• Linear meter: -5.0pp
Restructuring plan implemented
Logistics & transport services
Other businesses BESTINVER:
Assets under management €5,555m vs €5,110m as of September 2011 (+9%)
(Million Euro) Jan-Sep 11 Jan-Sep 12 Chg. Chg. (%)
Revenues 559 560 0 0.1%
EBITDA 27 30 3 10.0%
Margin (%) 4.9% 5.4%
(Million Euro) Jan-Sep 11 Jan-Sep 12 Chg. Chg. (%)
Revenues 95 96 1 1.1%
EBITDA 40 37 -3 -8.6%
Margin (%) 42.5% 38.4%
6. Conclusions

9M 2012 Results Presentation 31
Conclusions
Strong set of results in a challenging environment:Revenues +7.7%, EBITDA +11.4%, Ordinary EBT: +49.4%1
Energy reform: Significant negative impact on P&L but limited on project finance structures Corrective measures
Significant capex reduction Ordinary capex down ~33% to €588m60% of 9M 2012 capex invested abroad
Strengthening of Water business through the ATLL 50 year concession award
1Like for like Ordinary EBT growth excluding the effect of 9M 2011 capital gains
14th November 2012