study of the effects of an aquaponics system with
TRANSCRIPT

Universidad Pública de Navarra Nafarroako Unibertsitate Publikoa ESCUELA TÉCNICA SUPERIOR NEKAZARITZAKO INGENIARIEN DE INGENIEROS AGRÓNOMOS GOI MAILAKO ESKOLA TEKNIKOA
STUDY OF THE EFFECTS OF AN AQUAPONICS SYSTEM WITH DIFFERENT FISH DENSITIES IN LETTUCE
Anne Lanz Ayerza
Director / Directora / Zuzendaria:
Ainara López Maestresalas
INGENIERÍA AGROALIMENTARIA Y DEL MEDIO RURAL
NEKAZARITZAKO ELIKAGAIEN ETA LANDA INGURUNEAREN INGENIARITZA
Junio, 2018
2018, Ekaina

2

3
Eskerrak BioTkniFish proiektuko taldeari:
Xoxe, Oier, Maixa, Arkaitz, Arantxa, Inaxio eta Fernando

4

5
Abstract
Aquaponics is a sustainable food production system based on the interaction between fish,
bacteria, and plants. Although it has existed for millennia, research begun a few decades ago
and there is little practical knowledge about it. This experiment aimed to compare three
different fish (Oreochromis niloticus) densities and study the effects on the growth of lettuce
(Lactuca sativa var. capitata). The results showed that the lowest density (3.5 kg/1,000L)
produced significantly smaller lettuces and with nitrogen deficiency symptoms. The middle
(6.5 kg/1,000L) and highest density (13 kg/1,000L) formed bigger lettuces, with no significant
differences between their weight. Nevertheless, considering the pH unstableness of the
highest density and fish death due to competition, it was concluded that the fish density that
best met the biological requirements of the system was 6.5 kg/1,000L.
Keywords
Aquaponics, Fish density, Lettuce, Growth, Tilapia
Resumen
La acuaponía es un sistema de producción de alimento sostenible que se basa en la interacción
entre peces, bacterias y plantas. Aunque haya existido durante milenios, las investigaciones
comenzaron hace unas décadas y el conocimiento práctico sobre el tema es reducido. El
objetivo de este experimento fue comparar tres densidades de peces (Oreochromis niloticus) y
estudiar los efectos en el crecimiento de la lechuga (Lactuca sativa var. capitata). Los
resultados mostraron que la densidad menor (3,5 kg/1.000L) produjo lechugas
significativamente más pequeñas y con síntomas de deficiencia de nitrógeno. La mediana (6,5
kg/1.000L) y la mayor (13 kg/1.000L) produjeron lechugas más grandes, sin diferencias
significativas entre ellos dos en el peso. Sin embargo, teniendo en cuenta la inestabilidad en el
pH del agua de la densidad mayor y la muerte de peces debido a la competición, se concluyó
que la densidad de peces que mejor cumplió los requerimientos biológicos del sistema fue la
de 6,5kg/1.000L).
Palabras clave
Acuaponía, Densidad de peces, Lechuga, Crecimiento, Tilapia

6
Laburpena
Arrain, bakteria eta landareen arteko elkarrekintzan oinarritzen den elikagai produkzio
sistema jasangarria da akuaponia. Milaka urte izan arren, inbestigazioak duela hamarkada
gutxi ekin ziren eta gaiaren inguruko jakinduria prkatikoa murriztua da. Experimentu honen
helburua arrain (Oreochromis niloticus) dentsitate ezberdinak konparatu eta letxugaren
(Lactuca sativa var. capitata ) hazkuntzan zuten eragina aztertzea izan zen. Emaitzetan
dentsitate txikienarekin (3,5 kg/1.000L) hazitako letxugak esanguratsuki txikiagoak zirela ikusi
zen eta nitrogeno faltaren sintomak zituzten. Dentsitate ertainak (6,5 kg/1.000L) eta handiak
(13 kg/1.000L) letxuga handiagoak produzitu zituzten, euren arteko pisuan diferentzia
esanguratsurik aurkitu etzelarik. Hala ere, dentsitate handienaren uraren pH-aren
ezegonkortasuna eta konpetizioagatik hildako arrainak kontuan izanik, eskakizun biologikoak
hobekien betetzen zituen arrain dentsitatea 6,5 kg/1.000L zela ondorioztatu zen.
Hitz gakoak
Akuaponia, Arrain dentsitatea, Letxuga, Hazkuntza, Tilapia

7
INDEX
Abstract ............................................................................................................................ 5
Keywords .......................................................................................................................... 5
1. Introduction & Objectives ........................................................................................ 9
1.1. Literature Review ............................................................................................. 10
1.1.1. Hydroponics ................................................................................................. 10
1.1.2. Aquaculture .................................................................................................. 10
1.1.3. Aquaponics ................................................................................................... 11
1.1.4. Nile tilapia (Oreochromis niloticus) .............................................................. 12
1.1.5. Lettuce (Lactuca sativa var. capitata). ......................................................... 13
1.1.6. Bacteria & Nitrification ................................................................................. 13
1.1.7. Water quality for each organism ................................................................. 14
2. Material & Methods ............................................................................................... 15
2.1. Facilities & Equipment ......................................................................................... 15
2.1.1. Tanks ................................................................................................................ 17
2.1.2. Crop lines ......................................................................................................... 17
2.1.3. Pumps .............................................................................................................. 17
2.1.4. Aeration system ............................................................................................... 17
2.1.5. Pipes and hoses ................................................................................................ 17
2.1.6. Lighting ............................................................................................................. 18
2.1.7. Substrate .......................................................................................................... 18
2.1.8. Net pots ............................................................................................................ 18
2.1.9. Bacterial filters ................................................................................................. 18
2.1.10. Heaters ......................................................................................................... 19
2.2. Living being balance ............................................................................................ 19
2.2.1. Fish ................................................................................................................... 19
2.2.2. Plants ................................................................................................................ 19
2.3. Maintenance ........................................................................................................ 20
2.3.1. NH4+ & NO2
- ...................................................................................................... 20
2.3.2. Fish feed ........................................................................................................... 20
2.3.3. KOH solution to rise pH .................................................................................... 22
2.3.4. Formol bath to eliminate parasites ................................................................. 23

8
2.4. Data collection ..................................................................................................... 23
2.4.1. Growth of lettuces: diameter, number of leaves & weight ............................ 23
2.4.2. Water parameters: pH, NO3-, and DO .............................................................. 24
2.5. Statistical analysis ................................................................................................ 25
2.6. Nutrient deficiencies ........................................................................................... 25
3. Results & Discussion ............................................................................................... 26
3.1. Water parameters: pH, NO3-, and DO ................................................................. 26
3.2. Fish death ............................................................................................................ 28
3.3. Growth of lettuces ............................................................................................... 29
3.4. Nutrient deficiencies ........................................................................................... 34
4. Conclusions ............................................................................................................. 35
5. Bibliography ............................................................................................................ 36

9
1. Introduction & Objectives
This study was framed inside Tknika’s BioTkniFish project, linked to an internship
done at the center. Tknika is the Basque Center of Applied Research and Innovation
in Vocational Education and Training (VET), promoted by the Deputy Ministry of
VET of the Education Department of the Basque Government. Through networking
and direct involvement by the Basque Vocational Training teaching staff, the
Centre develops innovative projects in the areas of technology, education, and
management, with the objective of contributing to the improvement in the
standards and quality of VET in Basque Country Autonomous Community.
BioTkniFish (Figure 1) is a project on
sustainable aquiculture and vegetal production
through aquaponics. It is structured as the
focal point for aquaponics technology in the
Basque Country Autonomous Community,
with the aim of building the Basque technical
aquaculture sector and supplying the markets
with new quality products.
Although industrialization and technological development of the last century has
led to benefits for humanity, it has also caused deterioration of environmental
resources and future concerns, such as overpopulation. It is expected that by 2050
world’s population will reach 9.8 billion, 30 percent higher than today (United
Nations, Department of Economic and Social Affairs, 2017). In order to feed this
larger number of people, food production may need to double in 30 years
(Radford, 2016).
Therefore, producing more with less, while preserving and enhancing the
livelihoods of small-scale and family farmers, is a key challenge for the future.
Substantial improvements in resource-use efficiency and gains in resource
conservation will need to be achieved globally to meet growing and changing food
demand, and halt and reverse environmental degradation (FAO, 2017).
Aquaponics relies in a symbiotic interaction between fish, bacteria, and plants,
which makes it an ecological and sustainable food production system. Although it
has its origins centuries ago, developed aquaponic system components are not yet
fully realized in view of either cost effectiveness or technical capabilities (Goddek
et al., 2015). It is a promising subject to contribute to both global and urban
sustainable food production and would help diminish pollution and need for
resources, but needs to be scientifically studied and developed to get its place in
the worlds’ market.
Figure 1. BioTkniFish Project. Source: Tknika

10
From a commercial point of view of aquaponics, both the fish rearing and the
hydroponic vegetable components must be operated continuously near maximum
production capacity (Rakocy, Masser, & Losordo, 2006). This study consisted on
evaluating the effect of three different fish densities on the growth of lettuce, as
well as observing effects at any level on the system, so as to define the density that
best meets the aquaponic ecosystem balance, not economically, but from a
biological perspective.
1.1. Literature Review
1.1.1. Hydroponics
Hydroponics is the cultivation of plants in soilless media, which provide plant
support and moisture retention. Irrigation systems are integrated within these
media, thereby introducing a nutrient solution to the plants’ root zones that
provides all of the necessary nutrients for their growth (Somerville, Cohen,
Pantanella, Stankus, & Lovatelli, 2014).
Without contact between plants and soil, hydroponics avoids the appearance of
weeds and soil-borne pests. It leaves no toxic pesticide residue, the water- and
fertilizer-use is highly efficient and there is a better control over nutrient and
oxygen (FAO’s Plant Production and Protection Division, 2018), making
hydroponics the most suitable farming technique in arid regions or wherever
nutrient dispersal is an issue for both environmental and economic reasons.
Furthermore, as soilless media can be sterilized and reused between crops,
hydroponics meets the particular demands of intensive production, allowing an
increased crop quality and yields (Somerville et al., 2014).
Some substrates are even better than soil in terms of water-holding capacity and
oxygen supply at the root zone. The manipulation, monitoring, and real-time
control of nutrient availability is also better, which allows higher quantitative and
qualitative productions (Somerville et al., 2014).
On the other hand, in hydroponics anything that ever comes into contact with
plants or the nutrient solution needs to be sterilized, which makes it a very
receptive system to disease outbreaks and they can be spread very quickly.
Management is also more complicated and requires a different set of inputs,
especially during installation, since electricity is generally required to circulate or
oxygenate the water (Somerville et al., 2014). So the initial investment for this kind
of production system is much higher than for conventional soil-based agriculture.
1.1.2. Aquaculture
Aquaculture is the farming of aquatic organisms in both coastal and inland areas
involving interventions in the rearing process to enhance production (FAO, n.d.-a).

11
Since the beginning of the 21st century, and primarily in reaction to the problem of
over-fishing throughout the world’s oceans, aquaculture is an increasingly
important source of global protein production. In fact, it now provides half of all
fish for human consumption in the world, with a 73.8 million tonnes production in
2014 (FAO, 2016). It has the potential to decrease the pressure on the world’s
fisheries and to significantly reduce the footprint of less-sustainable terrestrial
animal farming systems in supplying humans with animal protein (Somerville et al.,
2014). At the same time, being one of the fastest growing-food production systems
(WWF, 2017), aquaculture can be crucial for the prospective increasing food
demand in the world for the next decades.
Nevertheless, aquaculture poses some environmental problems and concerns that
need to be addressed to improve the sustainability of this agricultural technique.
One major problem is the treatment of nutrient-rich wastewater. Some countries’
environmental regulations do not oblige farmers to treat effluent, and without
treatment, the release of nutrient-rich water can lead to eutrophication and
hypoxia in the watershed and localized coastal areas, macroalgae overgrowth of
coral reefs, and other ecological and economical disturbances (Somerville et al.,
2014).
1.1.3. Aquaponics
Aquaponics is a sustainable production system of plants and fish that combine
traditional aquaculture with hydroponics. The technique is based on a continuous
recycling of the effluents, which maximizes the exploitation of the used resources
and minimizes their waste.
In an aquaponic system, water from
the fish tank cycles through filters,
plant grow beds and then back to
the fish tank (Figure 2). In the
filters, water first passes through a
mechanical filter that removes the
solid waste and then through a
biofilter where bacteria convert
ammonium into nitrate. This
process is called nitrification. As the
water (containing nitrate and other nutrients) travels through the plant grow beds
the plants uptake the nutrients, and finally the water returns to the fish tank
purified. This process allows the fish, plants, and bacteria to thrive symbiotically
and work together to create a healthy environment, provided that the system is
properly balanced (Figure 3) (Somerville et al., 2014).
Figure 2. Aquaponic cycle. Source: http://smallgarden-ideas.com/aquaponics-systems

12
The concept of raising plants on rafts on the
water surface has its origins back in 1000 AD,
with early civilizations in both Asia and South
America (ACS Distance Education, n.d.).
Through the pioneering work of North
American and European academic institutions
in the late 1970s, and further research in the
following decades, this basic form of
aquaponics evolved into the modern food
production system of today. Although in use
since the 1980s, aquaponics is still a relatively
new method of food production with only a
small number of research and practitioner hubs worldwide with comprehensive
aquaponic experience (Somerville et al., 2014).
Unlike in aquaculture, in aquaponics, the effluent is diverted through plant beds
and not released to the environment, while at the same time the nutrients for the
plants are supplied from a sustainable source. This minimization of water exchange
reduces operating costs in arid climates and heated greenhouses where water or
heated water is a significant expense (Rakocy et al., 2006). Beyond the benefits
derived by integrating aquaculture and hydroponics, aquaponics has shown that its
plant and fish productions can be equivalent to both systems (Somerville et al.,
2014).
The principle drawbacks that this food production system faces are the extended
superficial area required for its installation, the necessity of qualified staff for the
maintenance of all the components, pest control that must be strictly biological,
and the limited knowledge about the subject (Garcia-Ulloa, León, Hernández, &
Chávez, 2005).
1.1.4. Nile tilapia (Oreochromis niloticus)
Oreochromis niloticus, nile tilapia (Figure 4) is an
omnivorous grazer that feeds on phytoplankton,
periphyton, aquatic plants, small invertebrates, benthic
fauna, detritus and bacterial films associated with
detritus. It is a warm water fish, preferring temperature
ranges from 31 to 36 °C, although it can tolerate
temperatures from 11-12 ºC to 42 °C. Nile tilapia can
live longer than 10 years and reach a weight exceeding
5 kg (FAO, n.d.-b).
Figure 3. Balance of an aquaponics system. Source: (Somerville et al., 2014)
Figure 4. Oreochromis niloticus. Source:
http://zomufish.com.pe/es/pj-categs/oreochromis-niloticus/

13
Originated in Africa, worldwide distribution of the Nile tilapia occurred during the
1960s up to the 1980s. The development of hormonal sex-reversal techniques in
the 1970s represented a major breakthrough that allowed male monosex
populations to be raised to uniform, marketable sizes. In addition, research on
nutrition and culture systems, along with market development and processing
advances, led to rapid expansion of the industry since the mid-80s (FAO, n.d.-b).
Nile tilapia is one the most used fish in aquaponics due to the its commercial
acceptance and its wide tolerance level to diverse environmental conditions
(Rakocy et al., 2006).
1.1.5. Lettuce (Lactuca sativa var. capitata).
Lactuca sativa, lettuce or garden lettuce, is a leafy annual herb in the Compositae
family. The species, which is not known in the wild but is thought to have been
developed from the wild lettuce L. serriola, around 4,500 years ago in eastern
Mediterranean basin, has been developed into diverse cultivars (Bradshaw, 2016).
Today, it is the most widely used salad crop, cultivated commercially and in home
gardens worldwide for its leafy greens.
The FAO estimates that total global commercial production of lettuce was 26.8
million metric tons (mmt) in 2016. China led production with 14.9 mmt, just over
half the world total, while the second-ranked U.S. produced 4.1 mmt. India, Spain,
and Italy were the next countries, with harvests of 1.1, 0.9, and 0.7 mmt,
respectively (FAOSTAT, 2016).
The lettuce is a plant that facilitates its cultivation in aquaponic systems, due to the
fact that it has a short productive cycle and, as its commercial interest is focused in
leave production, it uses considerable nitrate quantities (Lee & Escobar, 2000).
The variety capitata has succulent leaves growing from basal rosette that forms
heads that if not harvested turns into a flowering stalk (Ecocrop, 2007).
1.1.6. Bacteria & Nitrification
Two major groups of nitrifying bacteria are involved in the nitrification process: the
ammonia-oxidizing bacteria (AOB), and the nitrite-oxidizing bacteria (NOB). The
AOB oxidize the ammonium (NH4+) and create nitrite (NO₂-) and the NOB further
oxidize the NO₂- into nitrate (NO₃-). The genus Nitrosomonas is the most common
AOB in aquaponics, and the genus Nitrobacter is the most common NOB, which are
frequently used interchangeably in the literature (Somerville et al., 2014).
The biological cultures self-regulate according to the food available and the surface
area they have to colonize. When the amount of ammonium increases, the
bacterial culture also grows, as long as there is surface area for colonization

14
(otherwise the system may unbalance, poisoning the water of the fish tank with
high levels of ammonium). Whenever the level of ammonium falls, the number of
bacteria reduces, leaving only those that are necessary to keep the system
balanced (Sustaeta Zubillaga, 2015).
1.1.7. Water quality for each organism
As stated before, aquaponics is the management of a complete ecosystem that
includes three major groups of organisms: fish, plants and bacteria. For the proper
functioning of the system water parameters need to be adjusted to the needs of
each one (Table 1), which is not always easy due to the fact that those needs can
vary slightly depending on the specific species used for the aquaponics system.
Table 1. General water quality tolerances for fish (warm- or cold-water), hydroponic plants and nitrifying bacteria. Source: (Somerville et al., 2014)
Organism type
Temp (ºC) pH Ammonia
(mg/L) Nitrite (mg/L)
Nitrate (mg/L)
DO (mg/L)
Warm water fish
22-32 6-8.5 < 3 < 1 < 400 4-6
Plants 16-30 5.5-7.5 < 30 < 1 - > 3 Bacteria 14-34 6-8.5 < 3 < 1 - 4-8
The water temperature at the fish tanks was set at 25 ºC.
Although according to the table above the pH could range between 6 and 7.5 to
fulfill the requirements of the three organisms, the optimal pH was set from 6.5 to
6.8, since that is the margin where most of the nutrients are available for the plant.
On the other hand, bacterial activity gets reduced below 7.
Regarding ammonia, nitrite, and nitrate, and dissolved oxygen (DO) concentrations,
all of them were variables measured either for the control of the proper operation
of the system or for its study.

15
2. Material & Methods
2.1. Facilities & Equipment
The study took place at the laboratory of Biotknifish (Figure 5) in Tknika, which is
located in Errenteria (Basque Autonomous Country).
Figure 5. Laboratory of BioTkniFish.
The system infrastructure consisted on 9 fish tanks, 3 of each density of study, and
each tank connected to two crop lines (Figure 6).

Figure 6. Blueprint of the aquponic system.

2.1.1. Tanks
The water tanks were made of glass, a material that does neither contaminate
water nor harm fish and plants. Each tank had a capacity of 170 L.
2.1.2. Crop lines
Each tank was connected to two crop lines set on a cart at a height of 1 m. The
crop lines consisted on triangular gutters made of plastic with circular holes on the
above side that permitted the water enter. The dimensions were 2.8 x 0.25 m.
Above each gutter there were 3 arlite sacs. Arlite is a chemically neutral expanded
clay that guarantees air, water, and nutrients penetrate in plants’ roots.
2.1.3. Pumps
To transport the water from the fish tanks to the crop lines water pumps were
necessary. The pump used in this study was Surface pump Natflow JPG 6005, an
external pump, which had the characteristics shown in Table 2.
Table 2. Characteristics of Surface pump Natflow JPG 6005.
Power 600 W Maximum flow 3,000 L/h Maximum pumping height 35 m Maximum pressure 3.5 bar Maximum suction height 8 m
2.1.4. Aeration system
Fish need oxygen to be able to breathe. Oxygen in the water can run out quickly
depending on the biomass in the tank, so it is necessary to oxygenate the water.
For that, membrane aerators were used, which generate small air bubbles,
providing a greater surface area for contact between the bubbles and the water
and thereby making the oxygen exchange more efficient.
Two aerators were placed in each tank, which supplied the same amount of oxygen
to all of them.
2.1.5. Pipes and hoses
Pipes and hoses made the connections from the tanks to the crop lines and vice
versa, as well as the connection between the fish tanks and the biological filters.
Water was absorbed from the fish tank and transported to the filters through a
hose with 25 mm of interior diameter, and returned through a parallel hose to the
tank.

18
To transport the water to the crop lines, it was pumped and run through a hose
with 25 mm of interior diameter, which was connected to two thinner hoses that
divided up the water to both crop lines of each tank. From there, water was
distributed to each lettuce by drip irrigation.
For the returning of the water back to the fish tank, a pipe with 60 mm of diameter
connected the crop line and the tank.
2.1.6. Lighting
Plants reflect the green light, due to the fact that chlorophyll absorbs blue (400-
500 nm) and red light (600-700 nm) so as to perform the photosynthesis.
Therefore, most plants can grow without green light.
For this study pink LEDs where used,
Urbi Line FF200-4P, which provided the
plants with a light spectrum shown in
Figure 7. The dimensions of each lamp
were 400 x 300 x 121 mm, and had an
aperture of 120º.
By using this kind of lamps, electricity is
saved (since LED lights are more
efficient) and as plants might grow
faster, water and time are saved as well.
2.1.7. Substrate
As soil is not used in aquaponics, plants need some solid support to take root.
Rockwool was the type of substrate used in this study, which is a type of wool used
as thermal and acoustic insulation in the construction industry. In aquaponics, a
special, more compact rockwool is used, which does not shed any fiber or residue
that could be harmful to the fish.
2.1.8. Net pots
The net pots used in aquaponics are specially designed so that the substrate that
keeps the plants in place gets very wet and ensures the nutrients come into
contact with the roots. The pots are made of a mesh so that they hold the
substrate but leave a large surface area free so that the water bearing the
nutrients can flow without any problem through them.
2.1.9. Bacterial filters
The bacterial filter is another core part of an aquaponics ecosystem, since it is
where nitrification takes place. In order to get a good bacterial filter, it was filled
Figure 7. Urbi Line FF200-4P spectrum. Source: Ingeniería Urbiline S.L.

19
with expanded clay aggregate and biobarrels (small tubular pieces with a big
specific surface area) that enable the bacteria to settle and colonize the filter.
The biofilter used in this study was EHEIM professionel 4+ 350t, indicated for
aquariums from 120 L to 600 L. It had a prefilter that trapped large particles of dirt
before entering into the biological filter.
2.1.10. Heaters
To regulate the water temperature heaters are needed, which consist on electrical
resistors that are placed in the water to heat it directly. They had a thermostat that
can be set at the desired temperature, so that when the water reaches that
temperature, it automatically switches off until it falls below the setpoint again
(Sustaeta Zubillaga, 2015).
Heaters were included in the biofilter EHEIM professional 4+ 350t, which allowed
maintaining the water temperature between 24 and 26 ºC (the target value was set
at 25 ºC ).
2.2. Living being balance
2.2.1. Fish
Three different fish densities were studied in this project: 3.5 kg/1000L, 6.5
kg/1000L, and 13 kg/1000L. Therefore, three tanks were destined for each density.
Table 3 shows the biomass quantity in grams introduced in each tank, as well as
the number of fish and the average weight.
Table 3. Biomass, number of fish, and the average fish weight introduced in each tank.
Tank Total
biomass (g) Quantity
Average weight (g)
1 655 12 54.58
2 1,022 17 60.12
3 2,280 46 49.57
4 634 11 57.64
5 1,177 21 56.05
6 2,261 40 56.53
7 581 11 52.82
8 1,276 19 67.16
9 2,269 47 48.28
2.2.2. Plants
Each crop line had three arlite sacs with 4 holes (around 200 mm from one to
another). One lettuce was planted in each hole. Therefore, there were 24 lettuce
20
connected to each fish tank, which makes 72 plants in total for each fish density
(Figure 6).
2.3. Maintenance
2.3.1. NH4+ & NO2
-
As explained in the introduction, ammonium is converted into nitrites and nitrites
into nitrates. Nevertheless, both reagents can be accumulated in the water due to
the fact that nitrification process can take longer than the input rate (for example,
in the case of giving an excessive feed dose).
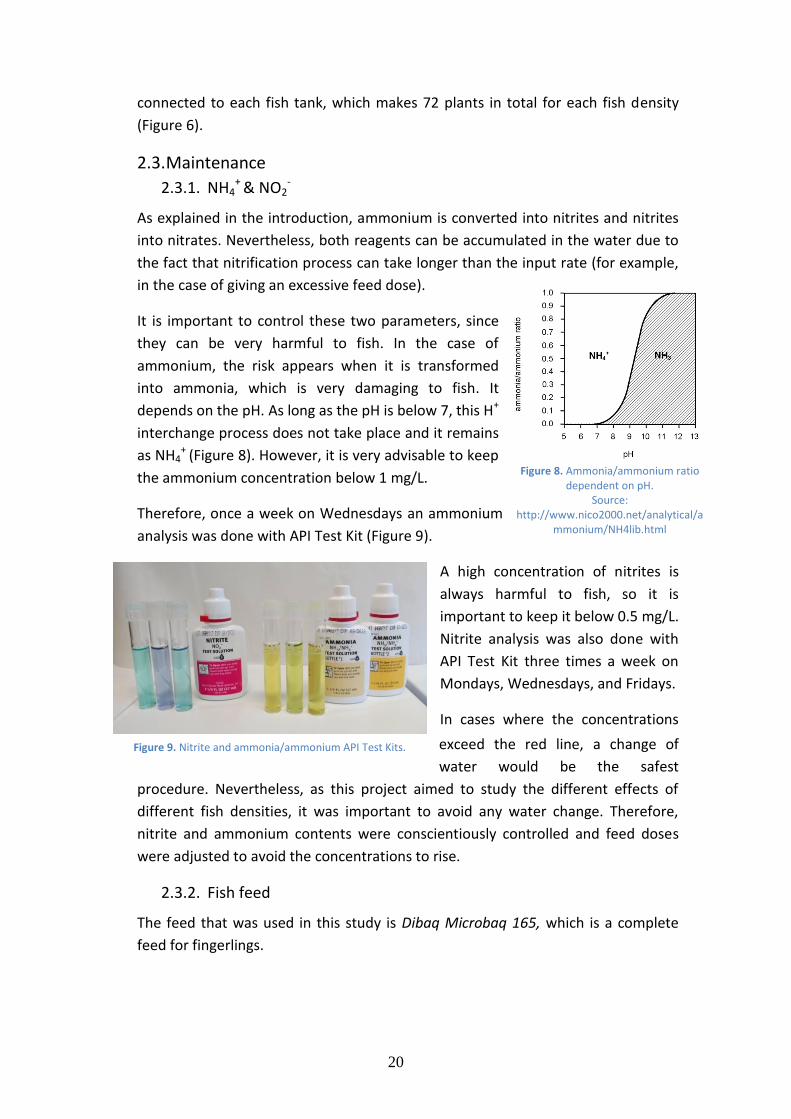
It is important to control these two parameters, since
they can be very harmful to fish. In the case of
ammonium, the risk appears when it is transformed
into ammonia, which is very damaging to fish. It
depends on the pH. As long as the pH is below 7, this H+
interchange process does not take place and it remains
as NH4+ (Figure 8). However, it is very advisable to keep
the ammonium concentration below 1 mg/L.
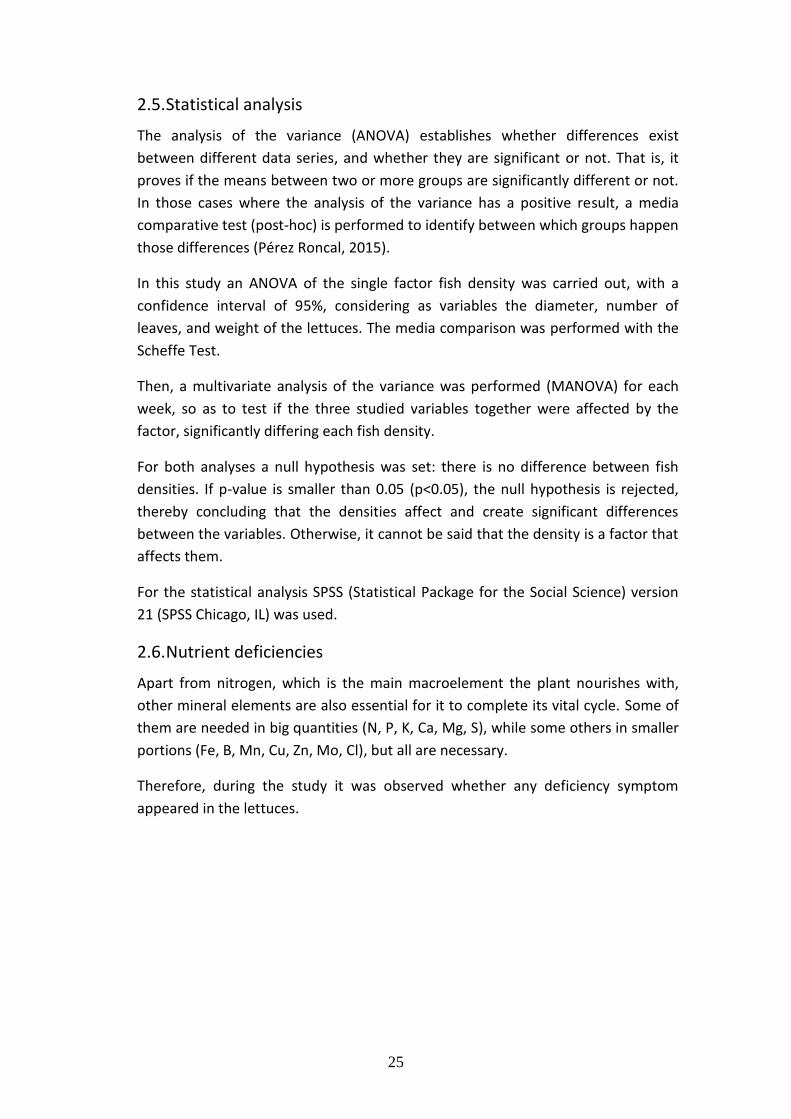
Therefore, once a week on Wednesdays an ammonium
analysis was done with API Test Kit (Figure 9).
A high concentration of nitrites is
always harmful to fish, so it is
important to keep it below 0.5 mg/L.
Nitrite analysis was also done with
API Test Kit three times a week on
Mondays, Wednesdays, and Fridays.
In cases where the concentrations
exceed the red line, a change of
water would be the safest
procedure. Nevertheless, as this project aimed to study the different effects of
different fish densities, it was important to avoid any water change. Therefore,
nitrite and ammonium contents were conscientiously controlled and feed doses
were adjusted to avoid the concentrations to rise.
2.3.2. Fish feed
The feed that was used in this study is Dibaq Microbaq 165, which is a complete
feed for fingerlings.
Figure 8. Ammonia/ammonium ratio dependent on pH.
Source: http://www.nico2000.net/analytical/a
mmonium/NH4lib.html
Figure 9. Nitrite and ammonia/ammonium API Test Kits.

21
◦ Composition: fish meal, pea protein, wheat gluten, fish oil, soya protein
concentrate, corn gluten meal, pea starch, yeast extract, krill meal, canola
oil, squid meal, soya lecithin, minerals.
◦ Components and analytical levels: 52% crude protein, 18% oils and crude
fat, 1.2 % crude fiber, 8% total ashes, 1.4% Calcium, 1.2% Phosphorous,
0.31% Sodium.
During the first week of study 2.5% of the fish weight was supplied to them, divided in two doses, following the information supplied by Nerbreen Aquaponics Company from Hondarribia. However, it showed up to be excessive, since in the nitrite analysis performed on Wednesday the results were too high that could endanger the fish. Therefore, it was decided to reduce the dose to 1% of the fish weight. The feed supplied each day during each week is shown in Tables 4-7, as well as the total feed provided each week.
Table 4. Amount of feed (g) given each day and in total the first week in each fish tank.
Tank Week 1
Mon Tues Wed Thurs Fri Sat Sun Total (g)
1 10 5 10 5 10 - - - 6 6 - 52
2 20 10 20 10 20 - - - - - - 80
3 40 15 40 15 40 - - - 22 22 - 194
4 10 5 10 5 10 - - - 6 6 - 52
5 20 10 20 10 20 - - - 11 11 - 102
6 40 15 40 15 40 - - - - - - 150
7 10 5 10 5 10 - - - 6 6 - 52
8 20 10 20 10 20 - - - - 11 - 91
9 40 15 40 15 40 - - - 22 No - 172
Table 5. Amount of feed (g) given each day and in total the second week in each fish tank.
Tank
Week 2
Mon Tues Wed Thurs Fri Sat Sun Total (g)
1 6 6 6 6 6 6 - 36 2 - - - - 11 11 - 22 3 22 22 11 22 22 22 - 121 4 6 6 6 - 6 6 - 30 5 11 11 - - 11 11 - 44 6 22 11 - - 22 22 - 77 7 6 3 - 6 6 6 - 27 8 11 6 - 11 11 11 - 50 9 22 22 22 22 22 22 - 132

22
Table 6. Amount of feed (g) given each day and in total the third week in each fish tank.
Tank
Week 3
Mon Tues Wed Thurs Fri Sat Sun Total (g)
1 6 - - - 6 6 - 18
2 11 - - - 11 11 - 33
3 22 - - - 22 22 - 66
4 - - - - 6 6 - 12
5 11 - - - 11 11 - 33
6 22 - - - 22 22 - 66
7 6 - - - 6 6 - 18
8 - - - - 11 11 - 22
9 22 - - - 22 22 - 66
Table 7. Amount of feed (g) given each day and in total the fourth week in each fish tank.
Tank
Week 4
Mon Tues Wed Thurs Fri Sat Sun Total (g)
1 6 6 6 6 6 6 - 36
2 11 11 11 - 11 11 - 55
3 22 22 22 22 - 22 - 110
4 6 6 6 6 6 6 - 36
5 11 11 11 11 11 11 - 66
6 - 22 22 22 - 22 - 88
7 6 6 6 6 6 6 - 36
8 - 11 11 11 - 11 - 44
9 22 22 22 22 22 22 - 132
When nitrite concentration in the water was high, feed was not supplied until it
descended to 0.25 mg/L. All the dashes (-) that appear in Tables 4-7 mean that no
food was given to the fish in the tank due to the mentioned issue.
At the end of the study, it is shown in Table 8 the total amount of feed that had
been supplied for each density.
Table 8. Average of the total amount of feed given for each fish density during the four weeks of the experiment.
Density (kg/1,000L) 3.5 6.5 13
Feed (g) 135 214 458
2.3.3. KOH solution to rise pH
As stated in the section 1.1.7. of the Introduction, a target pH range was stablished
for this study according to the optimal conditions for the three organisms that
compose the system. That range went from 6.5 to 6.8. Nevertheless, pH values

23
drop due to the oxygen consumption of fish, and therefore, it was necessary to
intervene to maintain the pH as close as possible to those values so as to avoid any
harm to the living beings.
A solution of 100 g/L KOH was used to raise the pH. An average of 6 mL was poured
for each 0.1 that descended the pH from 6.6 down.
2.3.4. Formol bath to eliminate parasites
A monogenean trematode had been found in the hatchery of BioTkniFish. The
trematode from the genus Gyrodactylus is an ectoparasite that parasites the body
surface fish, as well as the gills of many species of Oreochromis. As it is viviparous,
fish death is exponential.
Some fish died during the weeks the study lasted. Although necropsies did not
show pathogenicity and the deaths seemed to be due to aggression, an
intervention was required to make sure the trematode would not be present in the
tank. Therefore formol baths were done to tanks 3 and 6 during the third week of
the study. Fish were treated in buckets with a solution of 170 ppm of formol during
an hour (Jiménez Guzmán et al., 1988).
2.4. Data collection
For the study of the effects of different fish densities two groups of parameters
were analyzed: the growth of the plants and water parameters.
2.4.1. Growth of lettuces: diameter, number of leaves & weight
So as to take the measures of the lettuces, a sample of 18 plants was randomly
taken for each density. For that, each plant was numbered from 1 to 72 (Figure 10)
and then RANDOM() function was used in Microsoft Excel, obtaining random 18
numbers between 1 and 72.

24
Figure 10. Numbering of the lettuces.
First of all, the diameter was noted down by measuring the radius of the longest
leaf using a tape measure. Then, the quantity of leaves was counted for the 18
plants that were randomly chosen. Finally, lettuces were weighted with a weighing
scale.
These three measures were taken once a week on Mondays, and these data were
collected into a Microsoft Excel file.
2.4.2. Water parameters: pH, NO3-, and DO
Water pH was measured with a pH-meter that was calibrated every morning. A
beaker was used to take water from each fish tank, a pill was put inside and it was
placed on a shaker so as to homogenize the liquid. After a couple of minutes the
pH value was stabilized and the value was noted down. This data was collected on
Mondays, Wednesdays, and Fridays, and noted down in a Microsoft Excel file.
Nitrate concentration in water was measured as well, as it is the main component
that affects plants’ growth. A volume of 6 mL of each water tank were poured into
a cell and this was introduced into the spectrophotometer to make the ‘zero’
value. Then an envelope of nitrate reactive was added to the cell and after mixing
it gently for a minute, it was reintroduced into the machine. After 4’ 30s the nitrate
value was shown on the screen. The spectrophotometer had a range of 0 to 30
mg/L, and some waters exceeded this value. Therefore, in those cases, an API Test
Kit was used, which even if less accurate, it covers a bigger range of values. Nitrate
contents were measured twice a week, on Mondays and Fridays.
Regarding dissolved oxygen concentration, it was measured the last day of the
study using an oximeter.
25
2.5. Statistical analysis
The analysis of the variance (ANOVA) establishes whether differences exist
between different data series, and whether they are significant or not. That is, it
proves if the means between two or more groups are significantly different or not.
In those cases where the analysis of the variance has a positive result, a media
comparative test (post-hoc) is performed to identify between which groups happen
those differences (Pérez Roncal, 2015).
In this study an ANOVA of the single factor fish density was carried out, with a
confidence interval of 95%, considering as variables the diameter, number of
leaves, and weight of the lettuces. The media comparison was performed with the
Scheffe Test.
Then, a multivariate analysis of the variance was performed (MANOVA) for each
week, so as to test if the three studied variables together were affected by the
factor, significantly differing each fish density.
For both analyses a null hypothesis was set: there is no difference between fish
densities. If p-value is smaller than 0.05 (p<0.05), the null hypothesis is rejected,
thereby concluding that the densities affect and create significant differences
between the variables. Otherwise, it cannot be said that the density is a factor that
affects them.
For the statistical analysis SPSS (Statistical Package for the Social Science) version
21 (SPSS Chicago, IL) was used.
2.6. Nutrient deficiencies
Apart from nitrogen, which is the main macroelement the plant nourishes with,
other mineral elements are also essential for it to complete its vital cycle. Some of
them are needed in big quantities (N, P, K, Ca, Mg, S), while some others in smaller
portions (Fe, B, Mn, Cu, Zn, Mo, Cl), but all are necessary.
Therefore, during the study it was observed whether any deficiency symptom
appeared in the lettuces.
26
3. Results & Discussion
3.1. Water parameters: pH, NO3-, and DO
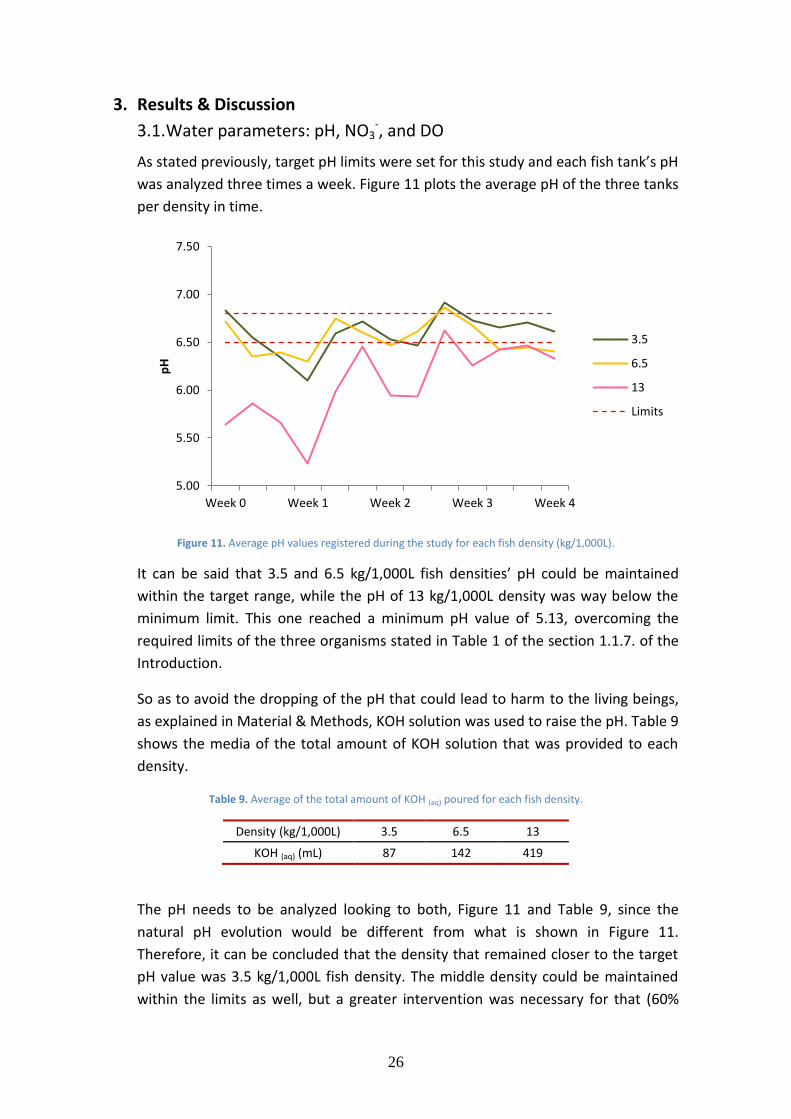
As stated previously, target pH limits were set for this study and each fish tank’s pH
was analyzed three times a week. Figure 11 plots the average pH of the three tanks
per density in time.
Figure 11. Average pH values registered during the study for each fish density (kg/1,000L).
It can be said that 3.5 and 6.5 kg/1,000L fish densities’ pH could be maintained
within the target range, while the pH of 13 kg/1,000L density was way below the
minimum limit. This one reached a minimum pH value of 5.13, overcoming the
required limits of the three organisms stated in Table 1 of the section 1.1.7. of the
Introduction.
So as to avoid the dropping of the pH that could lead to harm to the living beings,
as explained in Material & Methods, KOH solution was used to raise the pH. Table 9
shows the media of the total amount of KOH solution that was provided to each
density.
Table 9. Average of the total amount of KOH (aq) poured for each fish density.
Density (kg/1,000L) 3.5 6.5 13
KOH (aq) (mL) 87 142 419
The pH needs to be analyzed looking to both, Figure 11 and Table 9, since the
natural pH evolution would be different from what is shown in Figure 11.
Therefore, it can be concluded that the density that remained closer to the target
pH value was 3.5 kg/1,000L fish density. The middle density could be maintained
within the limits as well, but a greater intervention was necessary for that (60%
5.00
5.50
6.00
6.50
7.00
7.50
Week 0 Week 1 Week 2 Week 3 Week 4
pH
3.5
6.5
13
Limits

27
more KOH solution). The pH of 13 kg/1,000L fish density had the tendency to drop
drastically, exceeding the limits for the living beings and requiring a continuous
control and intervention on the system (380% more KOH solution than 3.5
kg/1,000L density and 195% more than 6.5 kg/1,000L density).
Regarding nitrate concentration, it went increasing from the beginning of the study
to the end of it (Figure 12), which might be the answer to the bacteria population
growth over time.
Figure 12. Average NO3- values registered during the study for each fish density (kg/1,000L).
In accordance with the results obtained in a study done in Italy that compared
lettuce growth in aquaponics with two different fish densities and hydroponics,
nitrate concentrations increased from the beginning to the end of the study
(Pantanellaa, Cardarelli, Collab, Rea, & Marcucci, 2010).
The fish density of 13 kg/1,000 showed much higher nitrate concentration than the
other two during the intermediate period. It reached the double nitrate content
(almost 70 mg/L) than 3.5 and 6.5 kg/L densities (around 30 mg/L). However, the
last day closer values to the densest ones were registered.
In the graph above it can be seen that the biggest increment in nitrate
concentration came at different time for each density; between the first and the
second week for the density of 13 kg/1,000L, around the third week for the middle
one, and the last week for the 3.5 kg/1,000L fish density.
In the study of Pantanellaa et al. (2010), an ANOVA was done with nitrate
concentration values obtained for low and high densities, and it resulted in
significant differences between them.
0.00
10.00
20.00
30.00
40.00
50.00
60.00
70.00
80.00
90.00
Week 0 Week 1 Week 2 Week 3 Week 4
NO
3-
(mg/
L)
3.5
6.5
13

28
Therefore, further study would have been necessary to see how the nitrate
concentration evolved in time once the systems reached that highest value around
65 mg/L and get into a clear conclusion.
Finally, Table 10 shows the average DO for each fish density.
Table 10. Average DO for each fish density.
Density (kg/1,000L) DO (mg/L) DO (%)
3.5 6.33 93 6.5 6.20 91 13 5.90 86
The concentrations were suitable according to the optimal water quality
parameters, but the difference on the oxygen content from the density of 6.5 to 13
kg/1,000L, was the double than what it was from 3.5 to 6.5 kg/1,000L.
This is connected to the water pH. The free CO2 released during respiration (oxygen
consumption) reacts with water, producing carbonic acid (H2CO3), and pH is
lowered (Wurts & Durborow, 1992). Therefore, pH and DO results obtained and
analyzed previously make total sense.
3.2. Fish death
Many fish appeared dead during the four weeks that lasted the study (from April
16th to May 14th) (Table 11).
Table 11. Fish death date, tank, and number of dead fish.
Death
Date Tank Quantity
04/17/2018 3 1
04/23/2018 3 1
04/24/2018 9 1
05/01/2018 3 3
05/02/2018 6 2
05/11/2018 6 1
05/14/2018 6 1
All the deaths happened in the tanks that had the biggest density of fish.
Necropsies were done and could not be diagnosed any pathogenicity while some
aggression signs were detected, such as scale lack and broken lateral fins.
The presence of more than one male causes a great competition between them.
Generally, male and female fish are differentiated and put a chip, but was not the
case for this study, as they were not adults and the procedure was not done yet.

29
However, the conclusion from the registered deaths was that the higher the
density, the higher the competition between fish.
3.3. Growth of lettuces
As explained in section 2.4.1. of Material & Methods, data of the four weeks that
the study lasted was saved in a Microsoft Excel file. Figure 13, Figure 14, and Figure
15, show the evolution of the lettuces in diameter, number of leaves, and weight,
respectively.
Figure 13. Evolution of the diameter (cm) of lettuces for each fish density (kg/1,000L).
The growth in diameter had a relatively lineal evolution. Although the highest density
seems to promote the growth in diameter, the values crossed along the study and the
tendency was similar in the three cases.
Figure 14. Evolution of the number of leaves of lettuces for each fish density (kg/1,000L).
0.00
5.00
10.00
15.00
20.00
25.00
30.00
35.00
Week 0 Week 1 Week 2 Week 3 Week 4
Dia
me
ter
(cm
)
3.5
6.5
13
0.00
2.00
4.00
6.00
8.00
10.00
12.00
14.00
Week 0 Week 1 Week 2 Week 3 Week 4
Nu
mb
er
of
leav
es
3.5
6.5
13
30
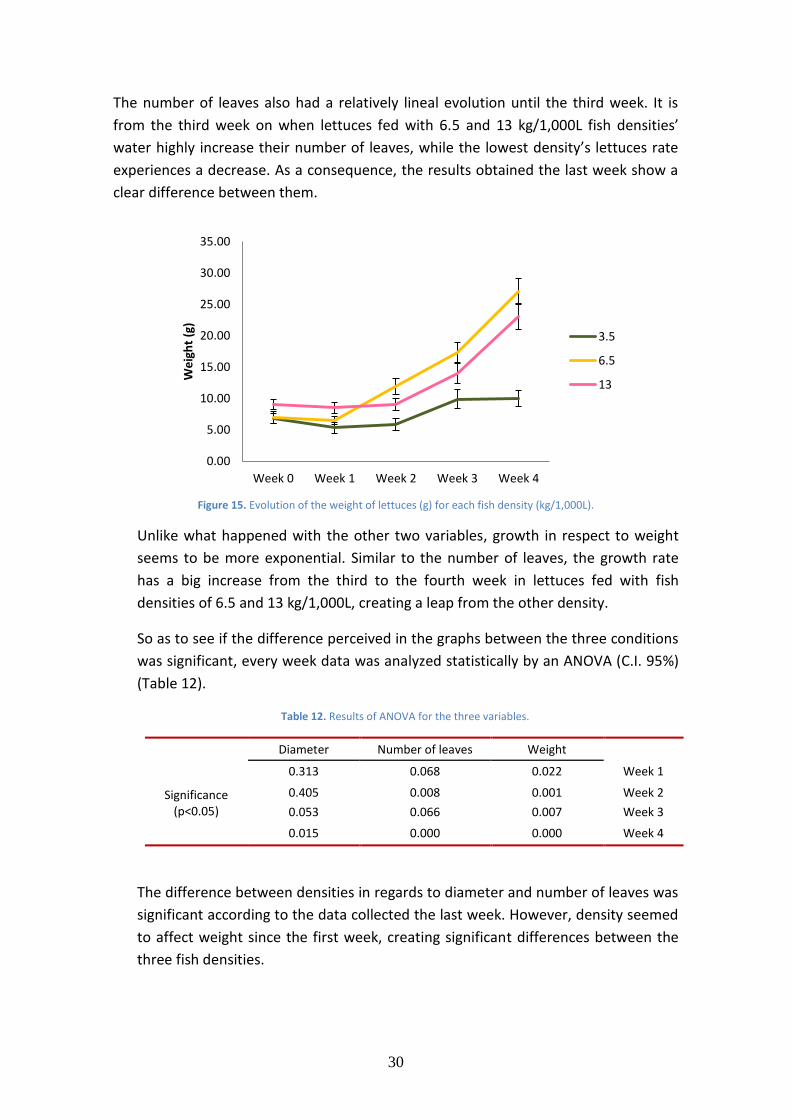
The number of leaves also had a relatively lineal evolution until the third week. It is
from the third week on when lettuces fed with 6.5 and 13 kg/1,000L fish densities’
water highly increase their number of leaves, while the lowest density’s lettuces rate
experiences a decrease. As a consequence, the results obtained the last week show a
clear difference between them.
Figure 15. Evolution of the weight of lettuces (g) for each fish density (kg/1,000L).
Unlike what happened with the other two variables, growth in respect to weight
seems to be more exponential. Similar to the number of leaves, the growth rate
has a big increase from the third to the fourth week in lettuces fed with fish
densities of 6.5 and 13 kg/1,000L, creating a leap from the other density.
So as to see if the difference perceived in the graphs between the three conditions
was significant, every week data was analyzed statistically by an ANOVA (C.I. 95%)
(Table 12).
Table 12. Results of ANOVA for the three variables.
Diameter Number of leaves Weight
Significance (p<0.05)
0.313 0.068 0.022 Week 1
0.405 0.008 0.001 Week 2
0.053 0.066 0.007 Week 3
0.015 0.000 0.000 Week 4
The difference between densities in regards to diameter and number of leaves was
significant according to the data collected the last week. However, density seemed
to affect weight since the first week, creating significant differences between the
three fish densities.
0.00
5.00
10.00
15.00
20.00
25.00
30.00
35.00
Week 0 Week 1 Week 2 Week 3 Week 4
We
igh
t (g
)
3.5
6.5
13

31
In order to see between which groups appeared those differences, Scheffe Test
was done with the obtained data (Table 13).
Table 13. Averages, errors and results of Scheffe Test for the three variables.
Diameter (cm) Number of leaves Weight (g) Density
(kg/1,000L)
Week 1
16.67±1.00 a 4.33±0.2 a 5.32±0.89 a 3.5
17.44±0.78 a 4.83±0.17 a 6.52±0.6 ab 6.5
18.44±0.64 a 4.89±0.18 a 8.49±0.85 b 13
Week 2
21.78±1.02 a 5.89±0.31 a 5.84±0.95 a 3.5
23.83±0.89 a 7.17±0.23 b 11.95±1.29 b 6.5
23.00±1.29 a 6.50±0.28 ab 9.07±0.90 ab 13
Week 3
27.22±0.81 a 7.50±0.34 a 9.91±1.48 a 3.5
26.28±0.77 a 8.56±0.39 a 17.29±0.56 b 6.5
29.11±0.87 a 8.39±0.27 a 13.97±1.58 ab 13
Week 4
21.78±1.02 ab 5.89±0.31 a 5.84±0.95 a 3.5
29.83±0.76 a 11.72±0.54 b 27.03±2.09 b 6.5
32.44±0.56 b 11.33±0.46 b 23.09±2.10 b 13
There was no significant difference in diameter between any group until the fourth
week, when 6.5 kg/1,000L fish density’s diameter was significantly smaller than 13
kg/1,000L, while the diameter of lettuces fed with 3.5 kg/1,000 fish density water
was similar to both groups.
Regarding the number of leaves, significance differences appeared on the second
week, although they disappeared on the third week. The last week the number of
leaves of 6.5 and 13 kg/1,000L fish densities was significantly bigger.
The weight is the parameter used to measure lettuces for commercial aptitude.
Therefore, it can be considered the most important between the three variables
studied in this experiment. The second and the third weeks, two significantly
different groups were differentiated: the lightest were those of 3.5 kg/1,000L,
while those of 6.5 kg/1,000L gained more weight. Lettuces fed with 13 kg/1,000L
water were similar to both groups until the fourth week, when differentiated from
the lightest group.
Observing the results, it needs to be considered the fact that the crop line number
9 (with highest fish density) was next to the laboratory window. Although it cannot
be demonstrated, there is the possibility that the light that entered from there
affected those lettuces growth negatively, since the differences between line 5 and
6, or 2 and 3 were not visible but differences from 8 to 9 were obvious (Figure 16).

32
Figure 16. Visual differences between middle and high density crop lines.
During the first crop cycle of the study of Pantanellaa et al. (2010) lettuces grown
with high fish density (8 kg/1,000L) treatment showed to be significantly heavier
(fresh weight) than those with low fish density (5 kg/1,000L). In the second crop
trial, differences between 6 and 20 kg/1,000L were minimal. Analyzing those
results and the results obtained in this study, it could be said that the optimum fish
density (in these particular conditions) in regards to weight gain should be at some
point between 6.5 and 13 kg/1,000L, since there are differences between 5 and 8
kg/1,000L, but 13 or 20 kg/1,000L seemed to be unnecessary.
Theoretically the effect of the three different densities would be accumulated the
last week. Figure 17, shows the differences in diameter, number of leaves, and
weight according to the data collected the last week of the study
2 3 5 6 8 9
33
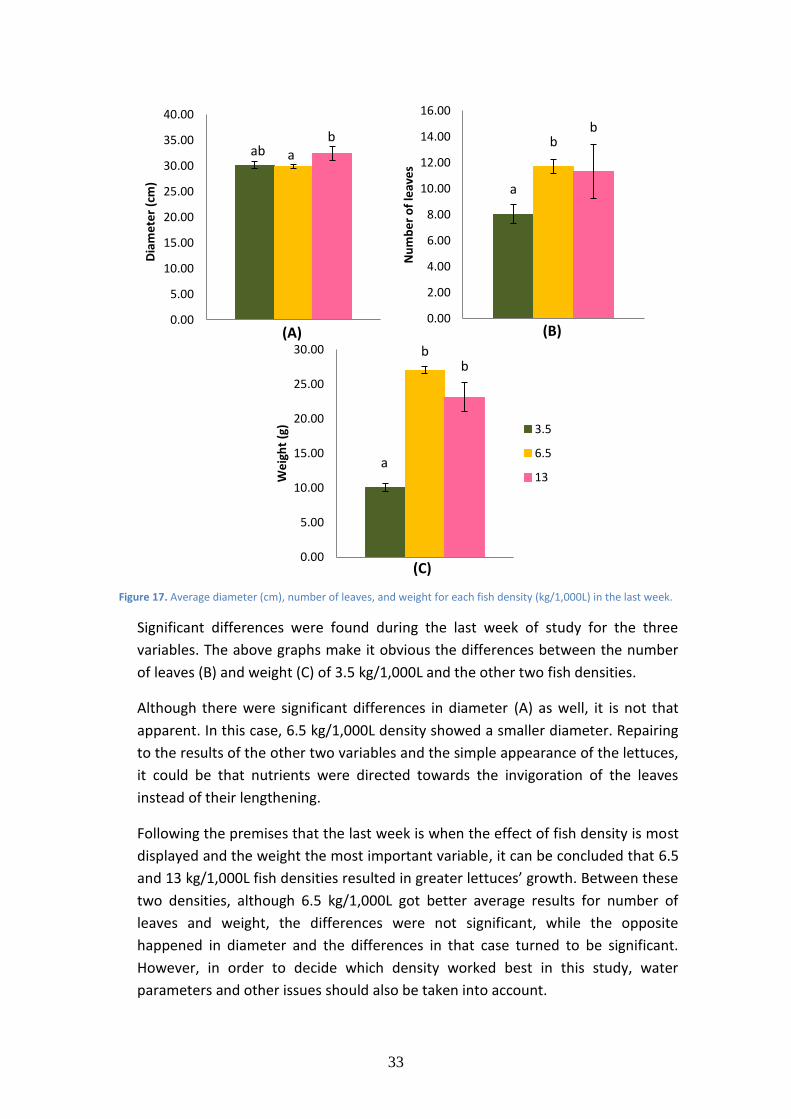
Figure 17. Average diameter (cm), number of leaves, and weight for each fish density (kg/1,000L) in the last week.
Significant differences were found during the last week of study for the three
variables. The above graphs make it obvious the differences between the number
of leaves (B) and weight (C) of 3.5 kg/1,000L and the other two fish densities.
Although there were significant differences in diameter (A) as well, it is not that
apparent. In this case, 6.5 kg/1,000L density showed a smaller diameter. Repairing
to the results of the other two variables and the simple appearance of the lettuces,
it could be that nutrients were directed towards the invigoration of the leaves
instead of their lengthening.
Following the premises that the last week is when the effect of fish density is most
displayed and the weight the most important variable, it can be concluded that 6.5
and 13 kg/1,000L fish densities resulted in greater lettuces’ growth. Between these
two densities, although 6.5 kg/1,000L got better average results for number of
leaves and weight, the differences were not significant, while the opposite
happened in diameter and the differences in that case turned to be significant.
However, in order to decide which density worked best in this study, water
parameters and other issues should also be taken into account.
0.00
2.00
4.00
6.00
8.00
10.00
12.00
14.00
16.00
Nu
mb
er
of
leav
es
a
b b
(A) (B)
(C)
0.00
5.00
10.00
15.00
20.00
25.00
30.00
35.00
40.00
Dia
me
ter
(cm
) ab a
b
0.00
5.00
10.00
15.00
20.00
25.00
30.00
We
igh
t (g
) 3.5
6.5
13a
b
b b
b
b b
a
(B)
34
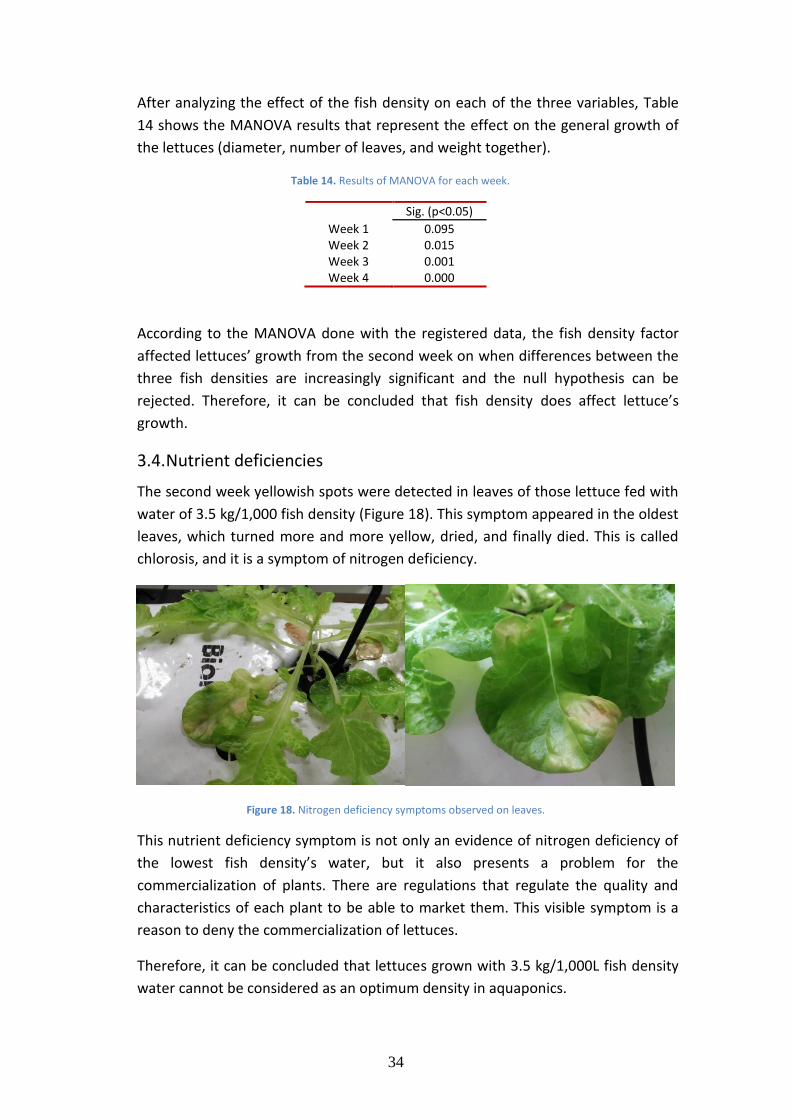
After analyzing the effect of the fish density on each of the three variables, Table
14 shows the MANOVA results that represent the effect on the general growth of
the lettuces (diameter, number of leaves, and weight together).
Table 14. Results of MANOVA for each week.
Sig. (p<0.05)
Week 1 0.095 Week 2 0.015 Week 3 0.001 Week 4 0.000
According to the MANOVA done with the registered data, the fish density factor
affected lettuces’ growth from the second week on when differences between the
three fish densities are increasingly significant and the null hypothesis can be
rejected. Therefore, it can be concluded that fish density does affect lettuce’s
growth.
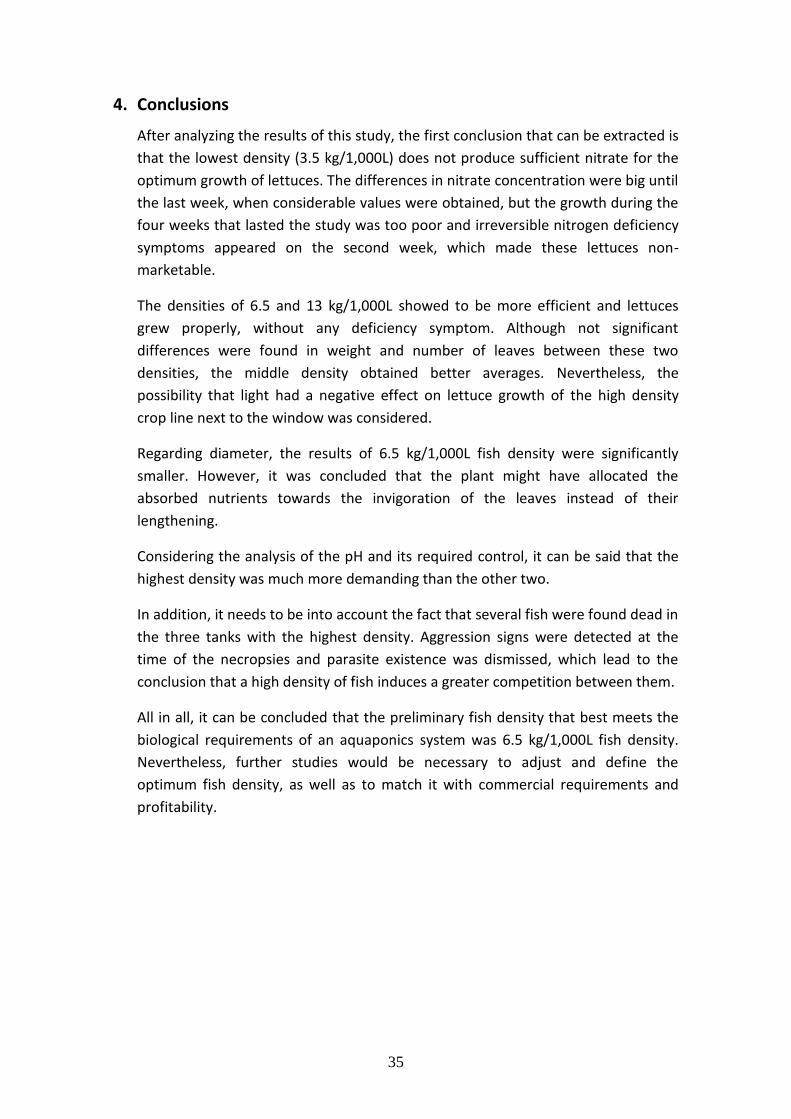
3.4. Nutrient deficiencies
The second week yellowish spots were detected in leaves of those lettuce fed with
water of 3.5 kg/1,000 fish density (Figure 18). This symptom appeared in the oldest
leaves, which turned more and more yellow, dried, and finally died. This is called
chlorosis, and it is a symptom of nitrogen deficiency.
Figure 18. Nitrogen deficiency symptoms observed on leaves.
This nutrient deficiency symptom is not only an evidence of nitrogen deficiency of
the lowest fish density’s water, but it also presents a problem for the
commercialization of plants. There are regulations that regulate the quality and
characteristics of each plant to be able to market them. This visible symptom is a
reason to deny the commercialization of lettuces.
Therefore, it can be concluded that lettuces grown with 3.5 kg/1,000L fish density
water cannot be considered as an optimum density in aquaponics.
35
4. Conclusions
After analyzing the results of this study, the first conclusion that can be extracted is
that the lowest density (3.5 kg/1,000L) does not produce sufficient nitrate for the
optimum growth of lettuces. The differences in nitrate concentration were big until
the last week, when considerable values were obtained, but the growth during the
four weeks that lasted the study was too poor and irreversible nitrogen deficiency
symptoms appeared on the second week, which made these lettuces non-
marketable.
The densities of 6.5 and 13 kg/1,000L showed to be more efficient and lettuces
grew properly, without any deficiency symptom. Although not significant
differences were found in weight and number of leaves between these two
densities, the middle density obtained better averages. Nevertheless, the
possibility that light had a negative effect on lettuce growth of the high density
crop line next to the window was considered.
Regarding diameter, the results of 6.5 kg/1,000L fish density were significantly
smaller. However, it was concluded that the plant might have allocated the
absorbed nutrients towards the invigoration of the leaves instead of their
lengthening.
Considering the analysis of the pH and its required control, it can be said that the
highest density was much more demanding than the other two.
In addition, it needs to be into account the fact that several fish were found dead in
the three tanks with the highest density. Aggression signs were detected at the
time of the necropsies and parasite existence was dismissed, which lead to the
conclusion that a high density of fish induces a greater competition between them.
All in all, it can be concluded that the preliminary fish density that best meets the
biological requirements of an aquaponics system was 6.5 kg/1,000L fish density.
Nevertheless, further studies would be necessary to adjust and define the
optimum fish density, as well as to match it with commercial requirements and
profitability.

36
5. Bibliography
ACS Distance Education. (n.d.). The history of aquaponics. Retrieved May 29, 2018, from https://www.acsedu.co.uk/Info/Agriculture/Sustainable-Agriculture/The-History-of-Aquaponics.aspx
Bradshaw, J. E. (2016). Plant Breeding: Past, Present and Future. Springer Nature.
Ecocrop, F.-. (2007). Lactuca sativa var. capitata. Retrieved May 19, 2018, from http://ecocrop.fao.org/ecocrop/srv/en/cropView?id=1313
FAO’s Plant Production and Protection Division. (2018). Hydroponics and soil-less system. FAO. Retrieved from http://www.fao.org/agriculture/crops/thematic-sitemap/theme/climatechange0/methyl-bromide/alt/hydro/en/
FAO. (n.d.-a). Aquaculture. Retrieved May 19, 2018, from http://www.fao.org/aquaculture/en/
FAO. (2016). The state of world fisheries and aquaculture 2016. Rome: FAO. Retrieved from http://www.fao.org/3/a-i5555e.pdf
FAO. (2017). The future of food and agriculture - Trends and challenges (2017th ed.). Rome: FAO. Retrieved from http://www.fao.org/3/a-i6583e.pdf
FAO, F. and A. D. (n.d.-b). Cultured Aquatic Species Information Programme: Oreochromis niloticus (Linnaeus, 1758). Retrieved May 19, 2018, from http://www.fao.org/fishery/culturedspecies/Oreochromis_niloticus/en
FAOSTAT. (2016). Crops - Lettuce and chicory. Retrieved from http://www.fao.org/faostat/en/#data/QC
Garcia-Ulloa, M., León, C., Hernández, F., & Chávez, R. (2005). Evaluación de un sistema experimental de acuaponía. Colima.
Goddek, S., Delaide, B., Mankasingh, U., Ragnarsdottir, K. V., Jijakli, H., & Thorarinsdottir, R. (2015). Challenges of Sustainable and Commercial Aquaponics. Sustainability. Retrieved from http://www.mdpi.com/2071-1050/7/4/4199/htm
Jiménez Guzmán, F., Garza Fernández, H., Segovia Salinas, F., Galaviz Silva, L., Iruegas Buentello, F., Adane, J. M., & Salinas López, M. (1988). Parásitos y enfermedades de la tilapia (2nd ed.). San Nicolás de los Garza: Universidad Autónoma de Nuevo León. Retrieved from http://cdigital.dgb.uanl.mx/la/1020082555/1020082555.PDF
Lee, R., & Escobar, H. (2000). Manual de produccion de lechuga lisa bajo invernadero. Universidad de Bogota “Jorge Tadeo Lozano” & Centro de Investigaciones y Asesorias Agroindustriales.
Pantanellaa, E., Cardarelli, M., Collab, G., Rea, E., & Marcucci, A. (2010). Aquaponics vs. Hydroponics: Production and Quality of Lettuce Crop. Retrieved from https://www.actahort.org/books/927/927_109.htm
37
Pérez Roncal, C. (2015). Estimación del umbral de daños internos en patata mediante tecnología NIRS. Universidad Pública de Navarra/Nafarroako Unibertsitate Publikoa.
Radford, T. (2016). Report: food production must rise 100% by 2050. Climate News Network. Retrieved from http://www.climatechangenews.com/2016/10/03/report-food-production-must-rise-100-by-2050/
Rakocy, J. E., Masser, M. P., & Losordo, T. M. (2006). Recirculating Aquaculture Tank Production Systems: Aquaponics—Integrating Fish and Plant Culture. Retrieved from http://dasnr22.dasnr.okstate.edu/docushare/dsweb/Get/Document-10215/SRAC-454web.pdf
Somerville, C., Cohen, M., Pantanella, E., Stankus, A., & Lovatelli, A. (2014). Small-scale aquaponic food production (2014th ed.). Rome: Food and Agriculture Organization of the United Nations (FAO). Retrieved from http://www.fao.org/3/a-i4021e.pdf
Sustaeta Zubillaga, F. (2015). Aquaponics Practical Guide. Hondarribi.
United Nations, Department of Economic and Social Affairs, P. D. (2017). World Population Prospects: The 2017 Revision, Key Findings and Advance Tables (No. ESA/P/WP/248). Retrieved from https://esa.un.org/unpd/wpp/publications/Files/WPP2017_KeyFindings.pdf
Wurts, W. A., & Durborow, R. M. (1992). Interactions of pH, Carbon Dioxide, Alkalinity and Hardness in Fish Ponds. Retrieved from https://appliedecology.cals.ncsu.edu/wp-content/uploads/SRAC-0464.pdf
WWF. (2017). Aquaculture. Retrieved May 30, 2018, from http://wwf.panda.org/our_work/food/agriculture/aquaculture.cfm