smgr corp presentation_juni_2013
TRANSCRIPT
Together We Build a Better Future 0
Together We Build a Better Future 1
INDONESIA’S CEMENT INDUSTRY: NOW and THE FUTURE SMGR Corporate Presentation
June 2013
Together We Build a Better Future
2
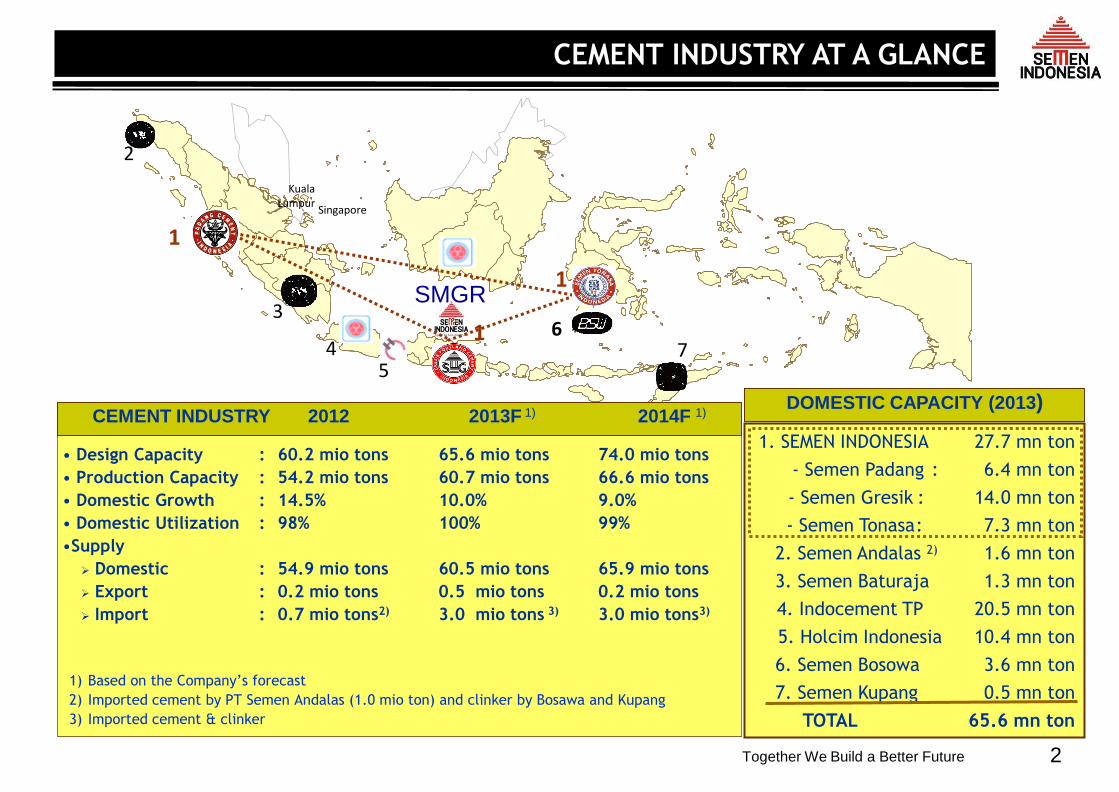
1. SEMEN INDONESIA 27.7 mn ton
- Semen Padang : 6.4 mn ton
- Semen Gresik : 14.0 mn ton
- Semen Tonasa : 7.3 mn ton
2. Semen Andalas 2) 1.6 mn ton
3. Semen Baturaja 1.3 mn ton
4. Indocement TP 20.5 mn ton
5. Holcim Indonesia 10.4 mn ton
6. Semen Bosowa 3.6 mn ton
7. Semen Kupang 0.5 mn ton
TOTAL 65.6 mn ton
• Design Capacity : 60.2 mio tons 65.6 mio tons 74.0 mio tons
• Production Capacity : 54.2 mio tons 60.7 mio tons 66.6 mio tons
• Domestic Growth : 14.5% 10.0% 9.0%
• Domestic Utilization : 98% 100% 99%
•Supply
Domestic : 54.9 mio tons 60.5 mio tons 65.9 mio tons
Export : 0.2 mio tons 0.5 mio tons 0.2 mio tons
Import : 0.7 mio tons2) 3.0 mio tons 3) 3.0 mio tons3)
1) Based on the Company’s forecast
2) Imported cement by PT Semen Andalas (1.0 mio ton) and clinker by Bosawa and Kupang
3) Imported cement & clinker
Singapore
Kuala Lumpur
SMGR
2
1
3
4 5
1
1
6 7
DOMESTIC CAPACITY (2013) CEMENT INDUSTRY 2012 2013F 1) 2014F 1)
CEMENT INDUSTRY AT A GLANCE
2
Together We Build a Better Future
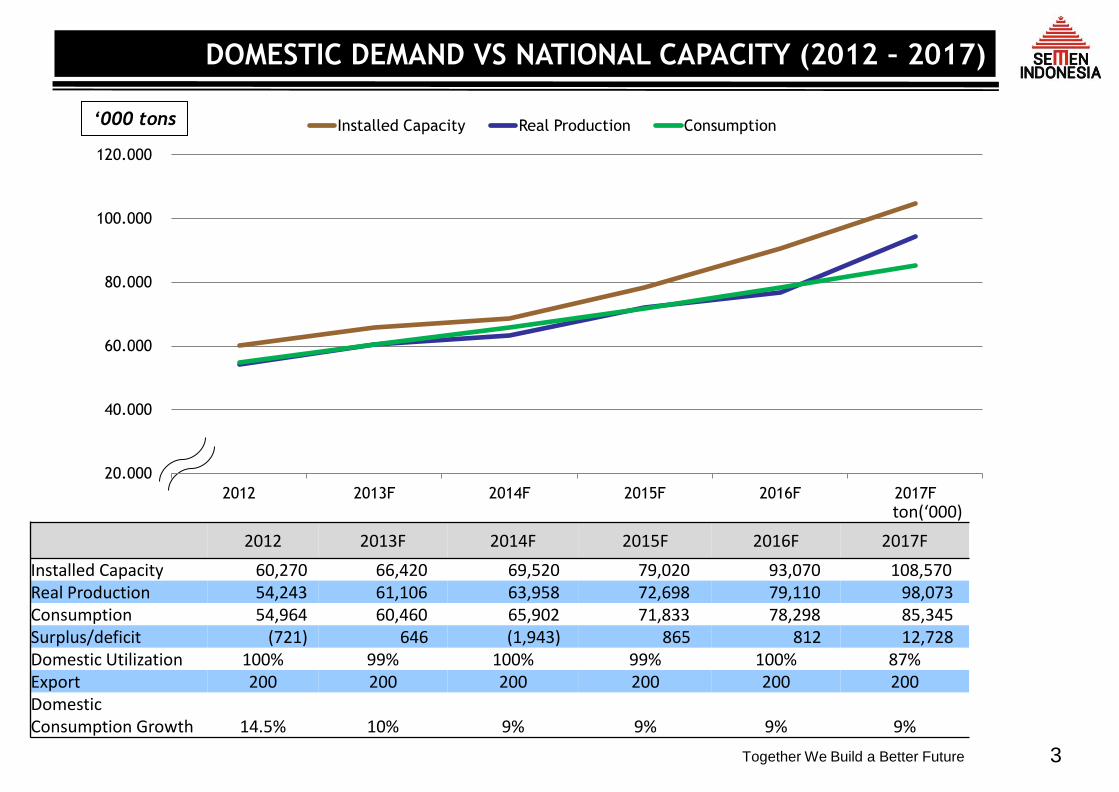
‘000 tons
ton(‘000)
2012 2013F 2014F 2015F 2016F 2017F
Installed Capacity 60,270 66,420 69,520 79,020 93,070 108,570 Real Production 54,243 61,106 63,958 72,698 79,110 98,073 Consumption 54,964 60,460 65,902 71,833 78,298 85,345 Surplus/deficit (721) 646 (1,943) 865 812 12,728 Domestic Utilization 100% 99% 100% 99% 100% 87% Export 200 200 200 200 200 200 Domestic Consumption Growth 14.5% 10% 9% 9% 9% 9%
3
DOMESTIC DEMAND VS NATIONAL CAPACITY (2012 – 2017)
20.000
40.000
60.000
80.000
100.000
120.000
2012 2013F 2014F 2015F 2016F 2017F
Installed Capacity Real Production Consumption
Together We Build a Better Future 4
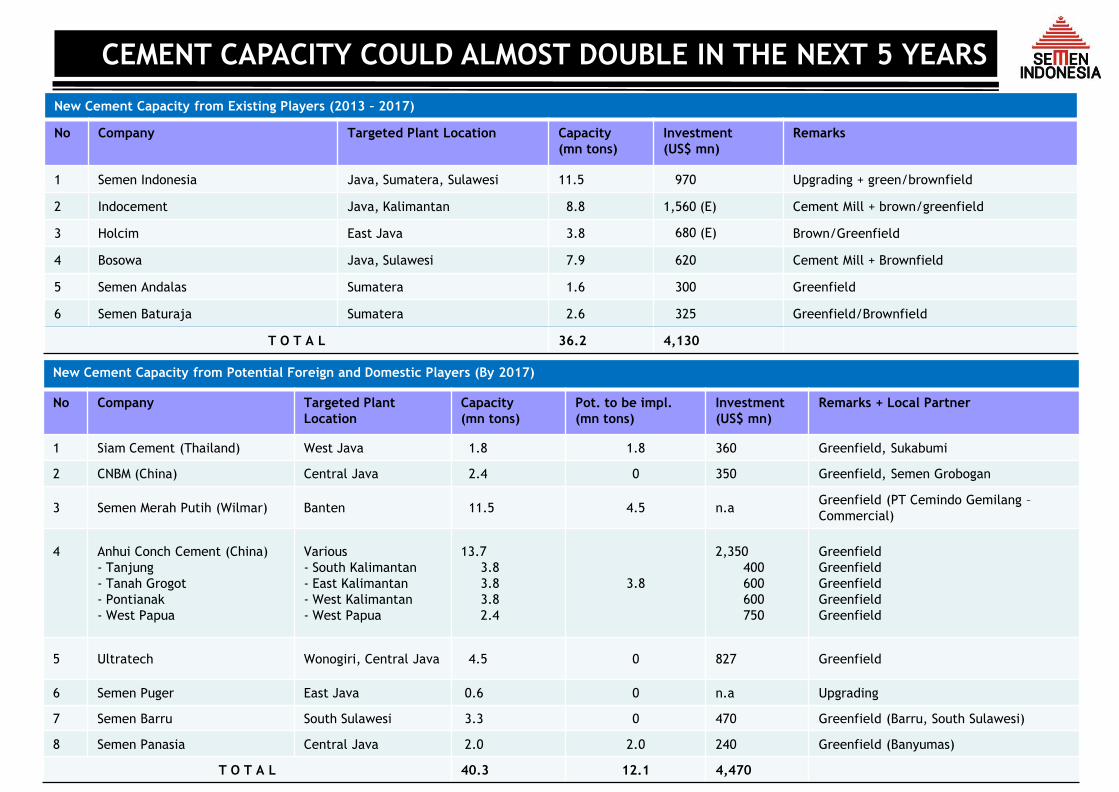
New Cement Capacity from Potential Foreign and Domestic Players (By 2017)
No Company Targeted Plant
Location
Capacity
(mn tons)
Pot. to be impl.
(mn tons)
Investment
(US$ mn)
Remarks + Local Partner
1 Siam Cement (Thailand) West Java 1.8 1.8 360 Greenfield, Sukabumi
2 CNBM (China) Central Java 2.4 0 350 Greenfield, Semen Grobogan
3 Semen Merah Putih (Wilmar) Banten 11.5 4.5 n.a Greenfield (PT Cemindo Gemilang –
Commercial)
4
Anhui Conch Cement (China)
- Tanjung
- Tanah Grogot
- Pontianak
- West Papua
Various
- South Kalimantan
- East Kalimantan
- West Kalimantan
- West Papua
13.7
3.8
3.8
3.8
2.4
3.8
2,350
400
600
600
750
Greenfield
Greenfield
Greenfield
Greenfield
Greenfield
5 Ultratech Wonogiri, Central Java 4.5 0 827 Greenfield
6 Semen Puger East Java 0.6 0 n.a Upgrading
7 Semen Barru South Sulawesi 3.3 0 470 Greenfield (Barru, South Sulawesi)
8 Semen Panasia Central Java 2.0 2.0 240 Greenfield (Banyumas)
T O T A L 40.3 12.1 4,470
New Cement Capacity from Existing Players (2013 – 2017)
No Company Targeted Plant Location Capacity
(mn tons)
Investment
(US$ mn)
Remarks
1 Semen Indonesia Java, Sumatera, Sulawesi 11.5 970 Upgrading + green/brownfield
2 Indocement Java, Kalimantan 8.8 1,560 (E) Cement Mill + brown/greenfield
3 Holcim East Java 3.8 680 (E) Brown/Greenfield
4 Bosowa Java, Sulawesi 7.9 620 Cement Mill + Brownfield
5 Semen Andalas Sumatera 1.6 300 Greenfield
6 Semen Baturaja Sumatera 2.6 325 Greenfield/Brownfield
T O T A L 36.2 4,130
CEMENT CAPACITY COULD ALMOST DOUBLE IN THE NEXT 5 YEARS
Together We Build a Better Future 5
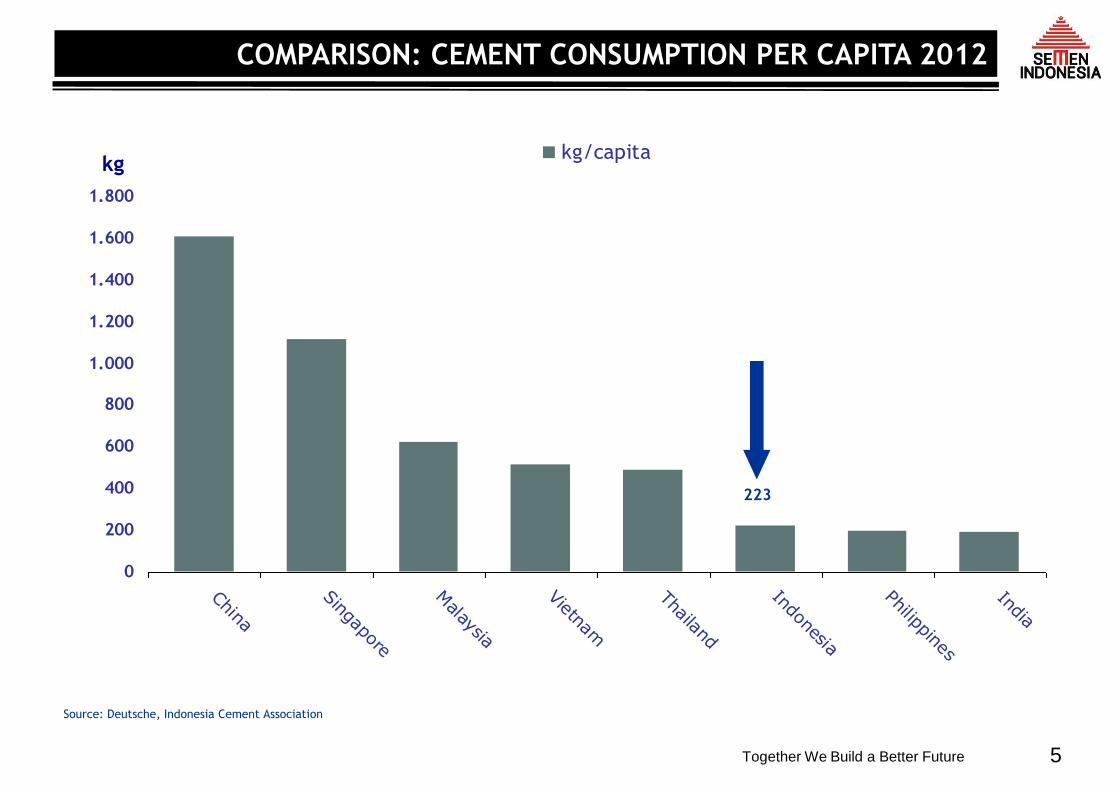
Source: Deutsche, Indonesia Cement Association
223
kg
0
200
400
600
800
1.000
1.200
1.400
1.600
1.800
China
Singapore
Malaysia
Vietnam
Thailand
Indonesia
Philippines
India
kg/capita
COMPARISON: CEMENT CONSUMPTION PER CAPITA 2012
Together We Build a Better Future
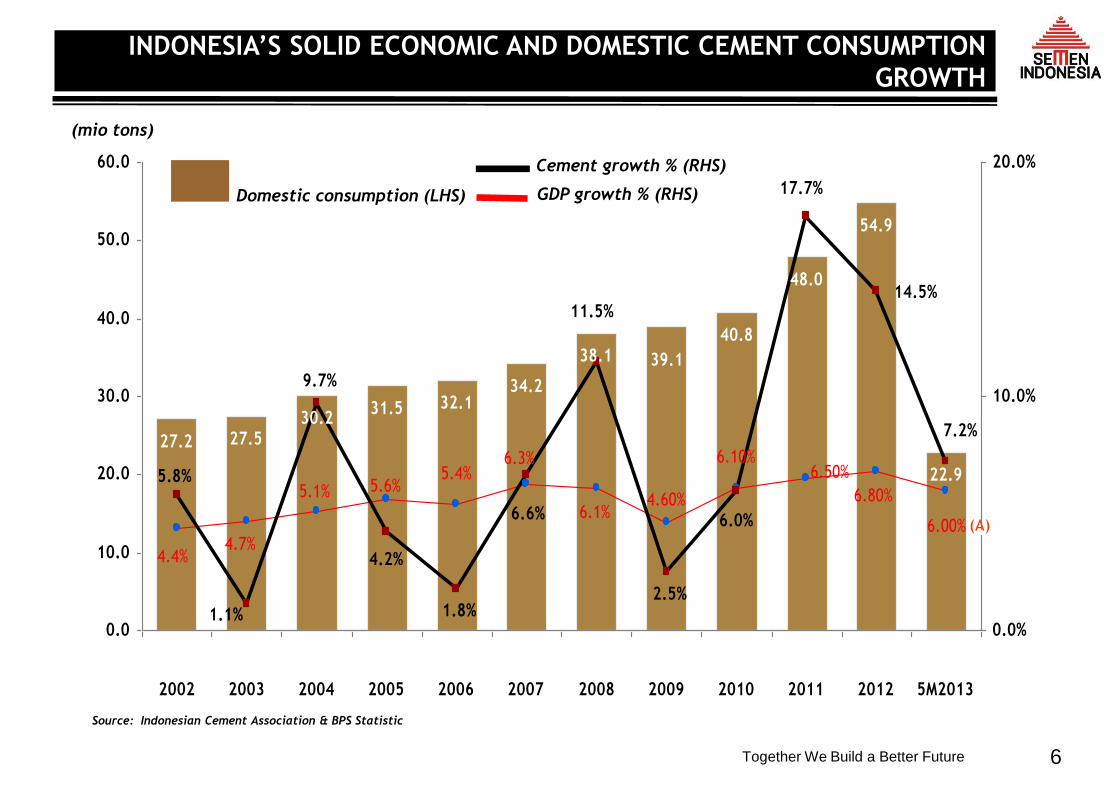
Source: Indonesian Cement Association & BPS Statistic
Growth
:
1.1%
Growth
:
9.7%
Growth
:
4.2%
Growth
:
1.8%
Growth
:
6.6%
Growth
:
5.8%
Growth
:
19.4%
Domestic consumption (LHS) GDP growth % (RHS)
(mio tons)
40.8
48.0
54.9
22.9
39.1
27.2 27.530.2
31.5 32.134.2
38.1
6.10%
6.00%
6.80%5.6%
4.7%
5.1%5.4%
4.4%
6.3%
6.1% 4.60%
6.50%
7.2%
14.5%
6.0%
11.5%
4.2%
9.7%
2.5%
6.6%
1.8%1.1%
5.8%
17.7%
0.0
10.0
20.0
30.0
40.0
50.0
60.0
2002 2003 2004 2005 2006 2007 2008 2009 2010 2011 2012 5M2013
0.0%
10.0%
20.0%Cement growth % (RHS)
(A)
6
INDONESIA’S SOLID ECONOMIC AND DOMESTIC CEMENT CONSUMPTION
GROWTH
Together We Build a Better Future
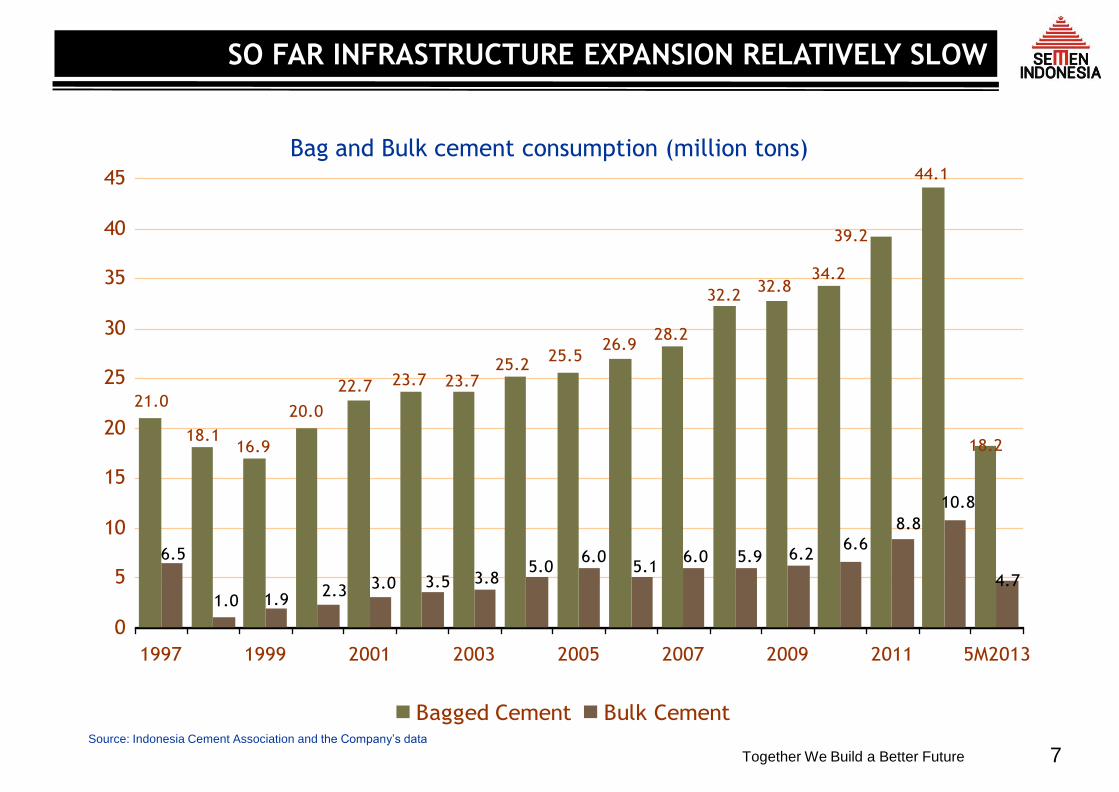
21.0
6.5
18.1
1.0
16.9
1.9
20.0
2.3
22.7
3.0
23.7
3.5
23.7
3.8
25.2
5.0
25.5
6.0
26.9
5.1
28.2
6.0
32.2
5.9
32.8
6.2
34.2
6.6
39.2
8.8
44.1
10.8
18.2
4.7
0
5
10
15
20
25
30
35
40
45
1997 1999 2001 2003 2005 2007 2009 2011 5M2013
Bagged Cement Bulk Cement
Bag and Bulk cement consumption (million tons)
7 Source: Indonesia Cement Association and the Company’s data
SO FAR INFRASTRUCTURE EXPANSION RELATIVELY SLOW
Together We Build a Better Future
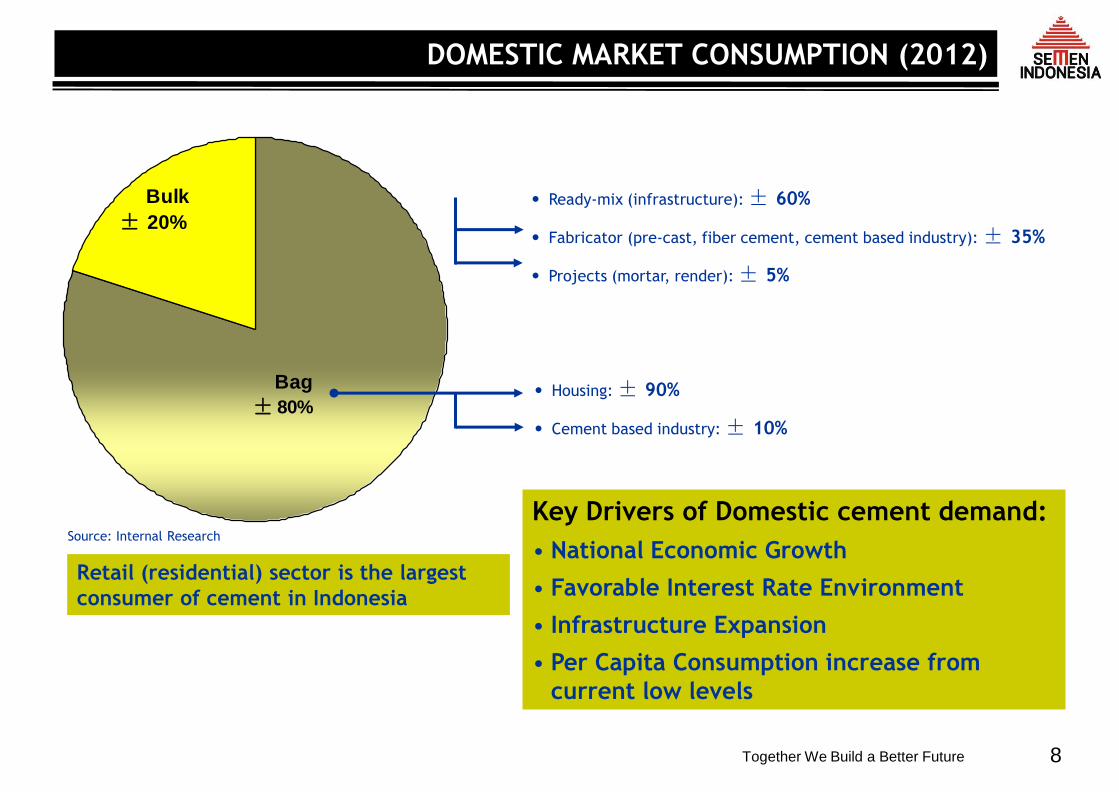
Retail (residential) sector is the largest
consumer of cement in Indonesia
8
Bag
80%
Bulk
20%
Key Drivers of Domestic cement demand:
• National Economic Growth
• Favorable Interest Rate Environment
• Infrastructure Expansion
• Per Capita Consumption increase from
current low levels
• Ready-mix (infrastructure): ± 60%
• Fabricator (pre-cast, fiber cement, cement based industry): ± 35%
• Projects (mortar, render): ± 5%
• Housing: ± 90%
• Cement based industry: ± 10% ±
±
Source: Internal Research
DOMESTIC MARKET CONSUMPTION (2012)
Together We Build a Better Future 9
MARKET UPDATE SMGR Corporate Presentation
June 2013
Together We Build a Better Future
Papua
Bali & N T
Kalimantan
Sulawesi
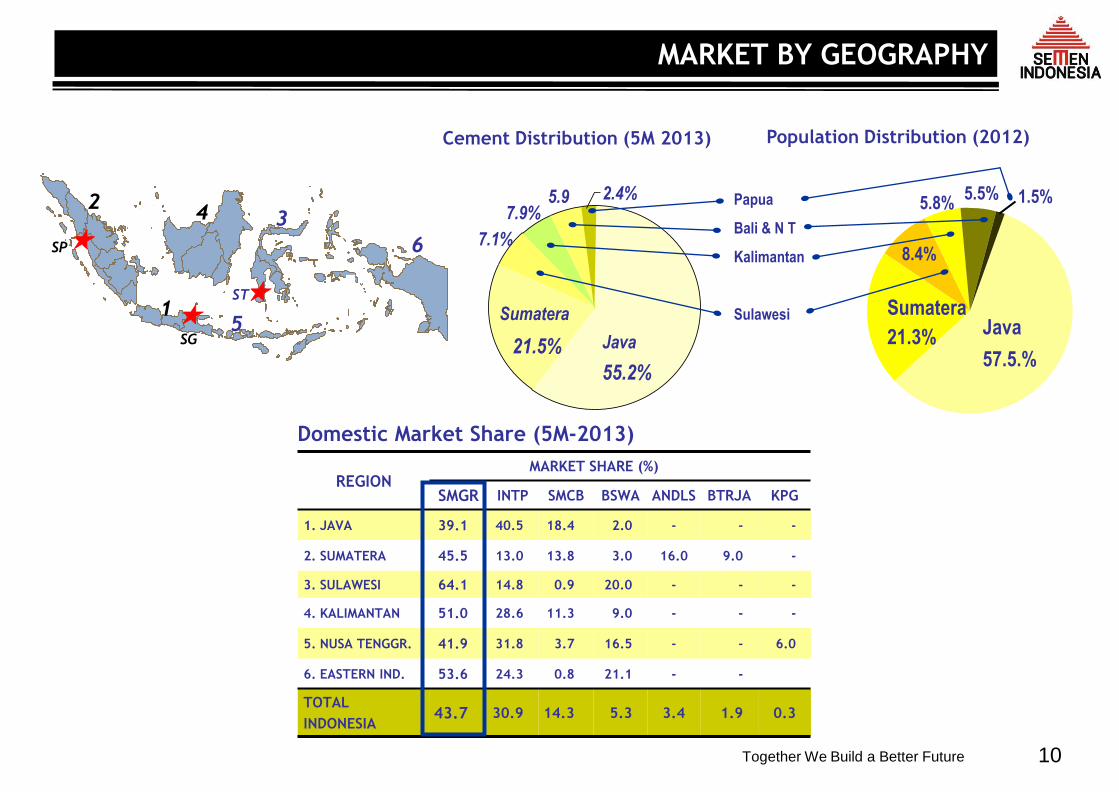
Population Distribution (2012)
Sumatera
21.3% Java
57.5.%
8.4%
5.8% 5.5% 1.5%
10
REGION MARKET SHARE (%)
SMGR INTP SMCB BSWA ANDLS BTRJA KPG
1. JAVA 39.1 40.5 18.4 2.0 - - -
2. SUMATERA 45.5 13.0 13.8 3.0 16.0 9.0 -
3. SULAWESI 64.1 14.8 0.9 20.0 - - -
4. KALIMANTAN 51.0 28.6 11.3 9.0 - - -
5. NUSA TENGGR. 41.9 31.8 3.7 16.5 - - 6.0
6. EASTERN IND. 53.6 24.3 0.8 21.1 - -
TOTAL
INDONESIA 43.7 30.9 14.3 5.3 3.4 1.9 0.3
SG
SP
ST 1
2 3 4
5
6
21.5%
7.1%
7.9% 5.9 2.4%
Java
55.2%
Sumatera
Cement Distribution (5M 2013)
Domestic Market Share (5M-2013)
MARKET BY GEOGRAPHY
Together We Build a Better Future
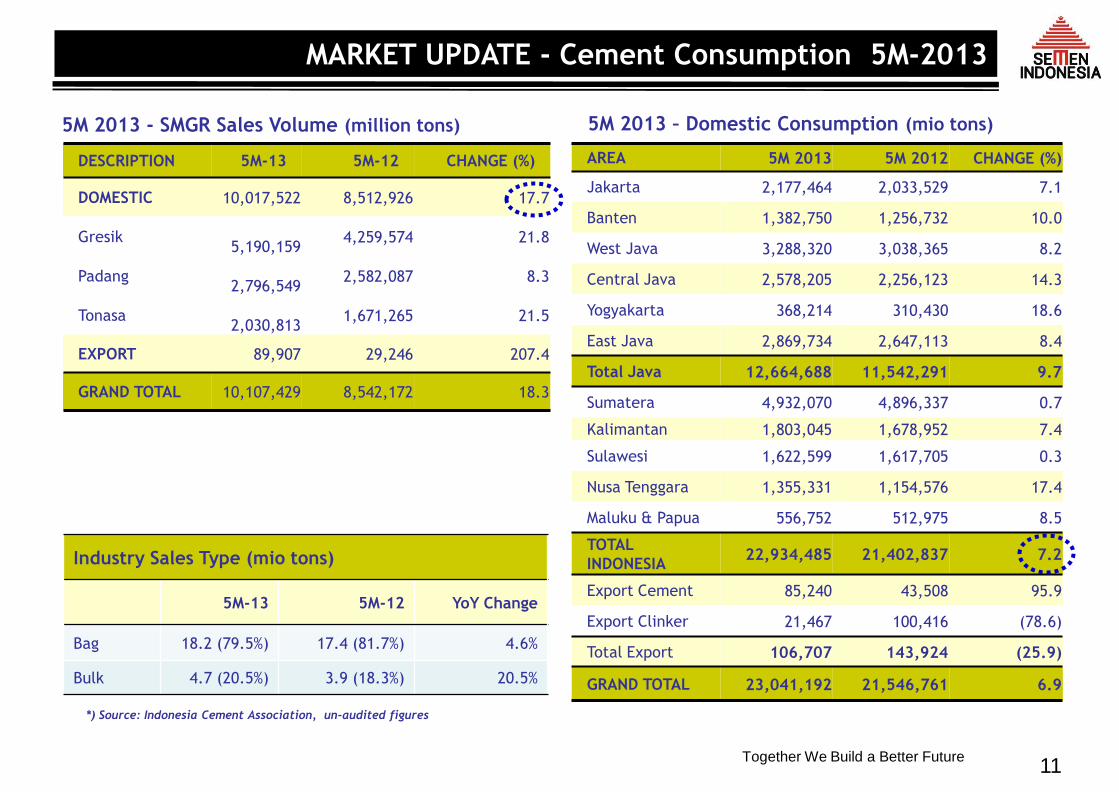
*) Source: Indonesia Cement Association, un-audited figures
11
AREA 5M 2013 5M 2012 CHANGE (%)
Jakarta 2,177,464 2,033,529 7.1
Banten 1,382,750 1,256,732 10.0
West Java 3,288,320 3,038,365 8.2
Central Java 2,578,205 2,256,123 14.3
Yogyakarta 368,214 310,430 18.6
East Java 2,869,734 2,647,113 8.4
Total Java 12,664,688 11,542,291 9.7
Sumatera 4,932,070 4,896,337 0.7
Kalimantan 1,803,045 1,678,952 7.4
Sulawesi 1,622,599 1,617,705 0.3
Nusa Tenggara 1,355,331 1,154,576 17.4
Maluku & Papua 556,752 512,975 8.5
TOTAL
INDONESIA 22,934,485 21,402,837 7.2
Export Cement 85,240 43,508 95.9
Export Clinker 21,467 100,416 (78.6)
Total Export 106,707 143,924 (25.9)
GRAND TOTAL 23,041,192 21,546,761 6.9
5M 2013 – Domestic Consumption (mio tons)
DESCRIPTION 5M-13 5M-12 CHANGE (%)
DOMESTIC 10,017,522 8,512,926 17.7
Gresik
5,190,159 4,259,574 21.8
Padang
2,796,549 2,582,087 8.3
Tonasa
2,030,813 1,671,265 21.5
EXPORT 89,907 29,246 207.4
GRAND TOTAL 10,107,429 8,542,172 18.3
Industry Sales Type (mio tons)
5M-13 5M-12 YoY Change
Bag 18.2 (79.5%) 17.4 (81.7%) 4.6%
Bulk 4.7 (20.5%) 3.9 (18.3%) 20.5%
5M 2013 - SMGR Sales Volume (million tons)
MARKET UPDATE - Cement Consumption 5M-2013

Together We Build a Better Future 12
COMPANY PROFILE SMGR Corporate Presentation
June 2013
Together We Build a Better Future 13
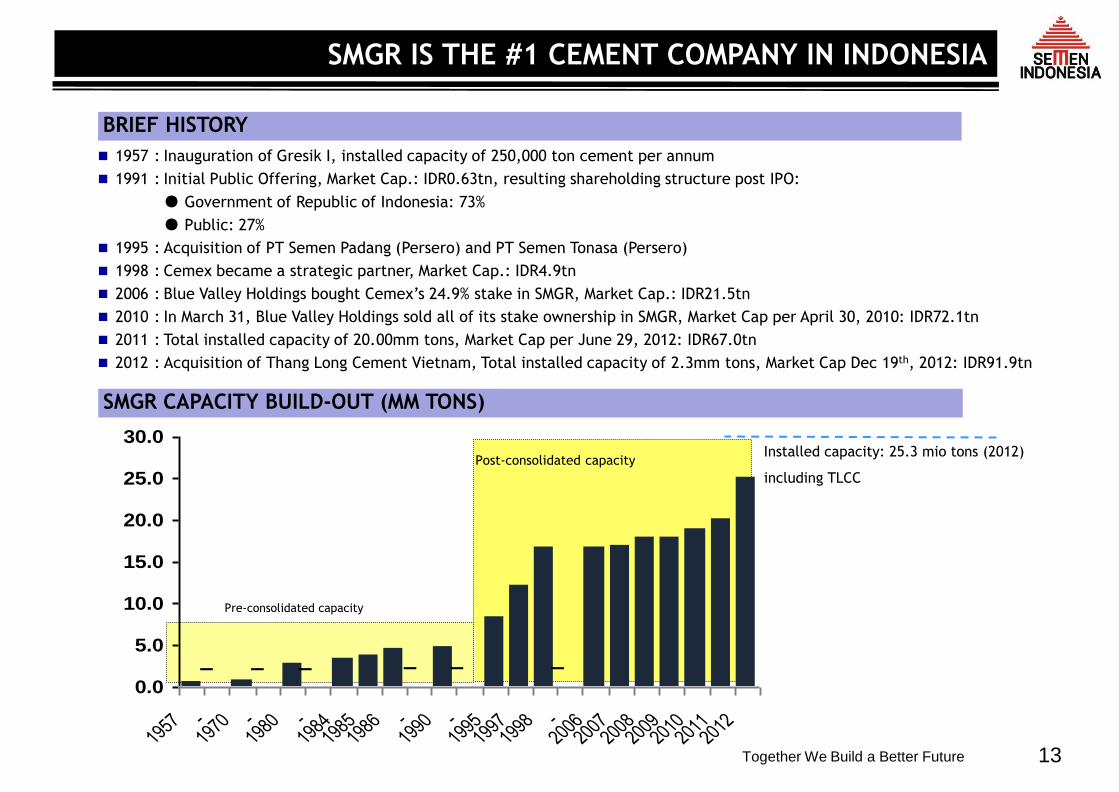
1957 : Inauguration of Gresik I, installed capacity of 250,000 ton cement per annum
1991 : Initial Public Offering, Market Cap.: IDR0.63tn, resulting shareholding structure post IPO:
● Government of Republic of Indonesia: 73%
● Public: 27%
1995 : Acquisition of PT Semen Padang (Persero) and PT Semen Tonasa (Persero)
1998 : Cemex became a strategic partner, Market Cap.: IDR4.9tn
2006 : Blue Valley Holdings bought Cemex’s 24.9% stake in SMGR, Market Cap.: IDR21.5tn
2010 : In March 31, Blue Valley Holdings sold all of its stake ownership in SMGR, Market Cap per April 30, 2010: IDR72.1tn
2011 : Total installed capacity of 20.00mm tons, Market Cap per June 29, 2012: IDR67.0tn
2012 : Acquisition of Thang Long Cement Vietnam, Total installed capacity of 2.3mm tons, Market Cap Dec 19th, 2012: IDR91.9tn
BRIEF HISTORY
0.0
5.0
10.0
15.0
20.0
25.0
30.0
1957 -
1970 -
1980 -
1984
1985
1986 -
1990 -
1995
1997
1998 -
2006
2007
2008
2009
2010
2011
2012
SMGR CAPACITY BUILD-OUT (MM TONS)
Pre-consolidated capacity
Post-consolidated capacity Installed capacity: 25.3 mio tons (2012)
including TLCC
_ _ _ _ _ _
SMGR IS THE #1 CEMENT COMPANY IN INDONESIA
Together We Build a Better Future 14
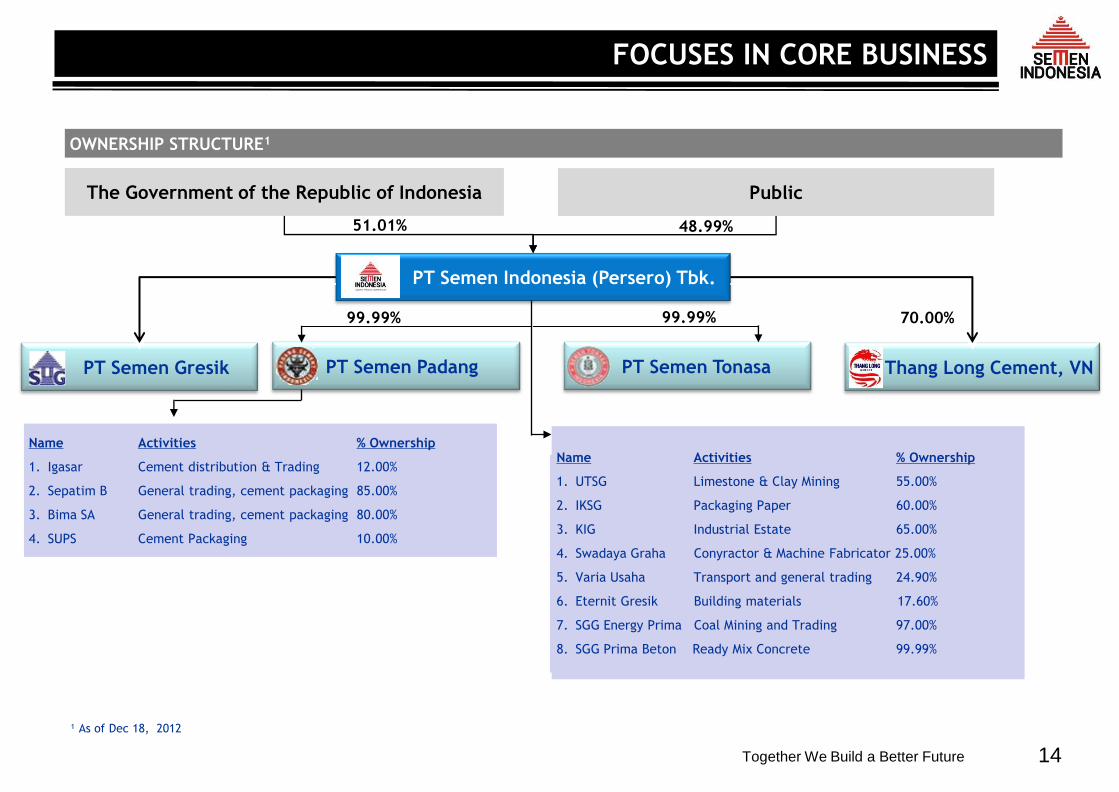
Public The Government of the Republic of Indonesia
PT Semen Indonesia (Persero) Tbk.
PT Semen Padang PT Semen Tonasa
OWNERSHIP STRUCTURE1
¹ As of Dec 18, 2012
51.01% 48.99%
99.99% 99.99%
Name Activities % Ownership
1. Igasar Cement distribution & Trading 12.00%
2. Sepatim B General trading, cement packaging 85.00%
3. Bima SA General trading, cement packaging 80.00%
4. SUPS Cement Packaging 10.00%
Name Activities % Ownership
1. UTSG Limestone & Clay Mining 55.00%
2. IKSG Cement Packaging 60.00%
3. KIG Industrial Estate 65.00%
4. Swadaya Gra Steel fabrication, contractor 25.00%
5. Varia Usaha Transport and general trading 24.90%
6. Eternit Gresik Building materials 17.60%
7. SGG Prima Coal Trading Coal 99.99%
8. SGG Prima Beton Ready Mix Concrete 99.99%
Thang Long Cement, VN
70.00%
PT Semen Gresik
Name Activities % Ownership
1. UTSG Limestone & Clay Mining 55.00%
2. IKSG Packaging Paper 60.00%
3. KIG Industrial Estate 65.00%
4. Swadaya Graha Conyractor & Machine Fabricator 25.00%
5. Varia Usaha Transport and general trading 24.90%
6. Eternit Gresik Building materials 17.60%
7. SGG Energy Prima Coal Mining and Trading 97.00%
8. SGG Prima Beton Ready Mix Concrete 99.99%
FOCUSES IN CORE BUSINESS
15
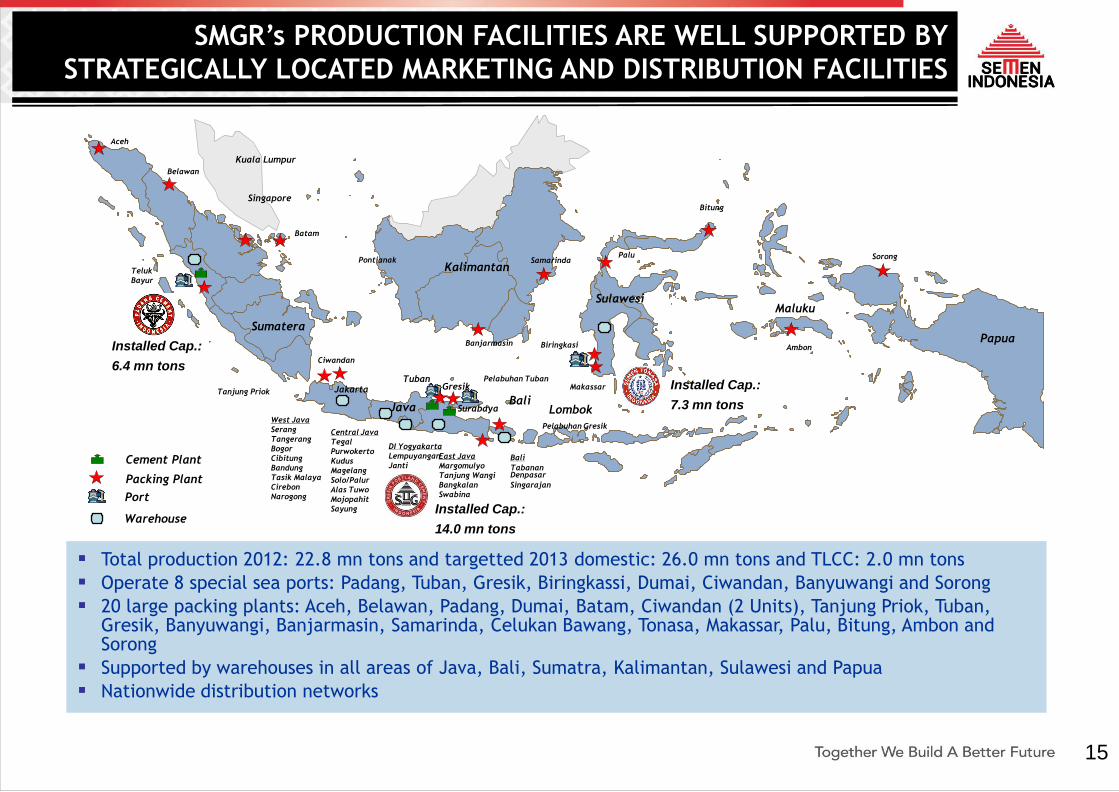
Total production 2012: 22.8 mn tons and targetted 2013 domestic: 26.0 mn tons and TLCC: 2.0 mn tons
Operate 8 special sea ports: Padang, Tuban, Gresik, Biringkassi, Dumai, Ciwandan, Banyuwangi and Sorong
20 large packing plants: Aceh, Belawan, Padang, Dumai, Batam, Ciwandan (2 Units), Tanjung Priok, Tuban, Gresik, Banyuwangi, Banjarmasin, Samarinda, Celukan Bawang, Tonasa, Makassar, Palu, Bitung, Ambon and Sorong
Supported by warehouses in all areas of Java, Bali, Sumatra, Kalimantan, Sulawesi and Papua
Nationwide distribution networks
SMGR’s PRODUCTION FACILITIES ARE WELL SUPPORTED BY
STRATEGICALLY LOCATED MARKETING AND DISTRIBUTION FACILITIES
Teluk
Bayur
Sumatera
Kalimantan
Sulawesi Maluku
Papua
Lombok Bali
Java
Batam
Ciwandan
Tanjung Priok Jakarta
Samarinda
Banjarmasin
Palu
Bitung
Ambon
Makassar
Biringkasi
Bali
Tabanan Denpasar
Singarajan
DI Yogyakarta
Lempuyangan
Janti
Central Java
Tegal
Purwokerto
Kudus
Magelang
Solo/Palur
Alas Tuwo
Mojopahit
Sayung
West Java
Serang
Tangerang
Bogor
Cibitung
Bandung
Tasik Malaya
Cirebon
Narogong
Belawan
Singapore
Kuala Lumpur
Tuban
Surabaya
Cement Plant
Packing Plant
Port
Warehouse
East Java
Margomulyo
Tanjung Wangi
Bangkalan
Swabina
Aceh
Pelabuhan Tuban
Pelabuhan Gresik
Installed Cap.:
6.4 mn tons
Installed Cap.:
14.0 mn tons
Installed Cap.:
7.3 mn tons
Gresik
Sorong Pontianak

Together We Build a Better Future 16
FINANCIAL UPDATE SMGR Corporate Presentation
June 2013
Together We Build a Better Future 17
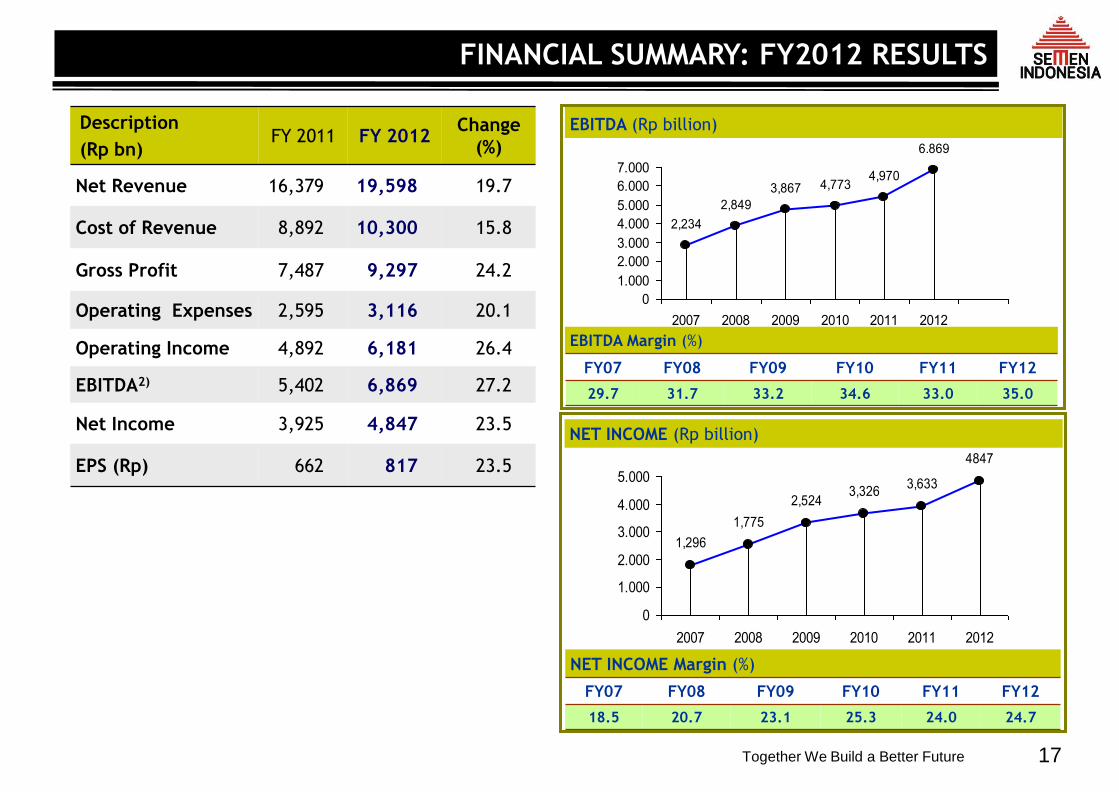
EBITDA (Rp billion)
NET INCOME (Rp billion)
EBITDA Margin (%)
FY07 FY08 FY09 FY10 FY11 FY12
29.7 31.7 33.2 34.6 33.0 35.0
NET INCOME Margin (%)
FY07 FY08 FY09 FY10 FY11 FY12
18.5 20.7 23.1 25.3 24.0 24.7
4,9704,7733,867
2,849
2,234
6.869
0
1.000
2.000
3.000
4.000
5.000
6.000
7.000
2007 2008 2009 2010 2011 2012
4847
3,6333,326
2,524
1,775
1,296
0
1.000
2.000
3.000
4.000
5.000
2007 2008 2009 2010 2011 2012
Description
(Rp bn) FY 2011 FY 2012
Change
(%)
Net Revenue 16,379 19,598 19.7
Cost of Revenue 8,892 10,300 15.8
Gross Profit 7,487 9,297 24.2
Operating Expenses 2,595 3,116 20.1
Operating Income 4,892 6,181 26.4
EBITDA2) 5,402 6,869 27.2
Net Income 3,925 4,847 23.5
EPS (Rp) 662 817 23.5
FINANCIAL SUMMARY: FY2012 RESULTS
Together We Build a Better Future 18
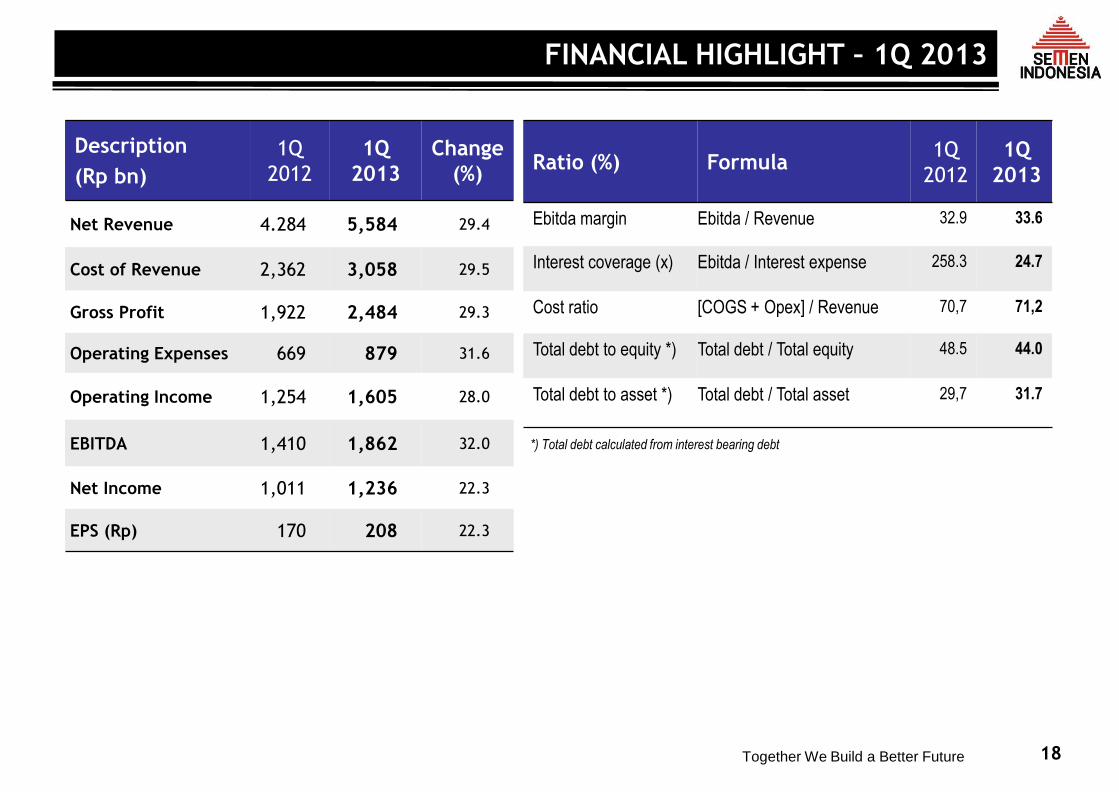
Description
(Rp bn)
1Q
2012
1Q
2013
Change
(%)
Net Revenue 4.284 5,584 29.4
Cost of Revenue 2,362 3,058 29.5
Gross Profit 1,922 2,484 29.3
Operating Expenses 669 879 31.6
Operating Income 1,254 1,605 28.0
EBITDA 1,410 1,862 32.0
Net Income 1,011 1,236 22.3
EPS (Rp) 170 208 22.3
Ratio (%) Formula 1Q
2012
1Q
2013
Ebitda margin Ebitda / Revenue 32.9 33.6
Interest coverage (x) Ebitda / Interest expense 258.3 24.7
Cost ratio [COGS + Opex] / Revenue 70,7 71,2
Total debt to equity *) Total debt / Total equity 48.5 44.0
Total debt to asset *) Total debt / Total asset 29,7 31.7
*) Total debt calculated from interest bearing debt
FINANCIAL HIGHLIGHT – 1Q 2013
Together We Build a Better Future
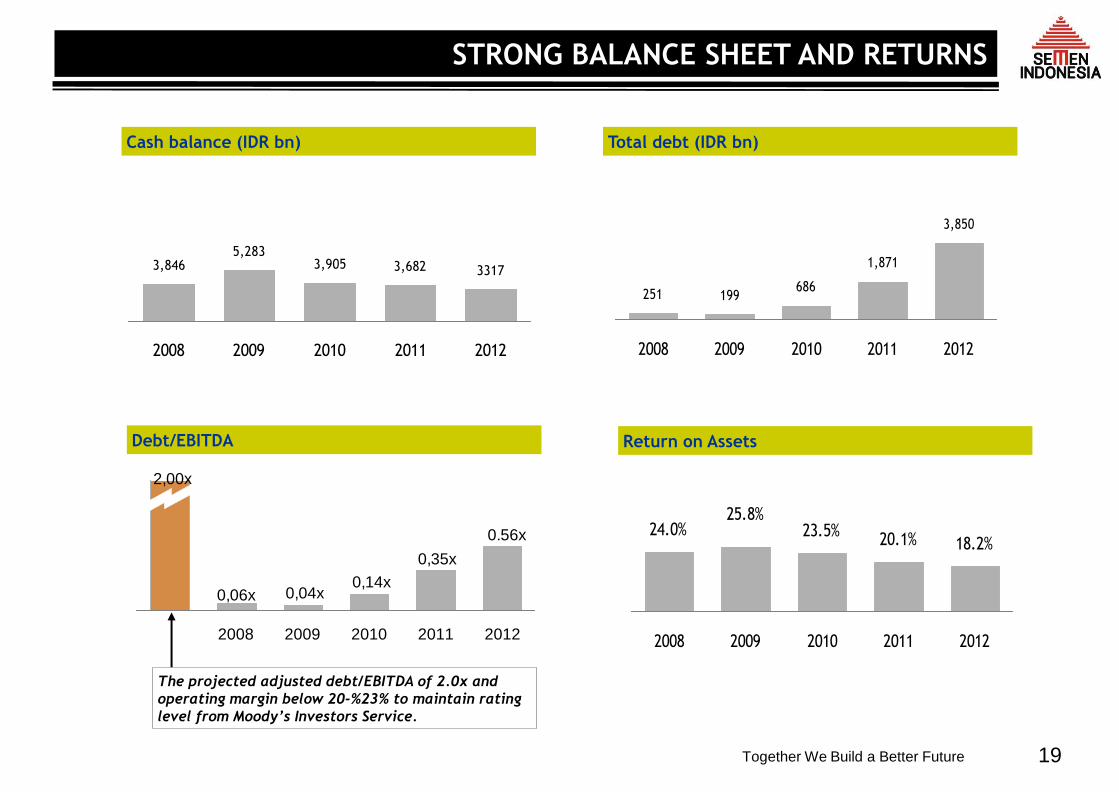
Cash balance (IDR bn) Total debt (IDR bn)
3,905 33173,6823,8465,283
2008 2009 2010 2011 2012
3,850
251 199686
1,871
2008 2009 2010 2011 2012
* Include short term investment
Debt/EBITDA Return on Assets
0,06x
2,00x
0,35x
0,04x0,14x
0.56x
2008 2009 2010 2011 2012
The projected adjusted debt/EBITDA of 2.0x and
operating margin below 20-%23% to maintain rating
level from Moody’s Investors Service.
18.2%24.0%
25.8%23.5%
20.1%
2008 2009 2010 2011 2012
19
STRONG BALANCE SHEET AND RETURNS
Together We Build a Better Future 20
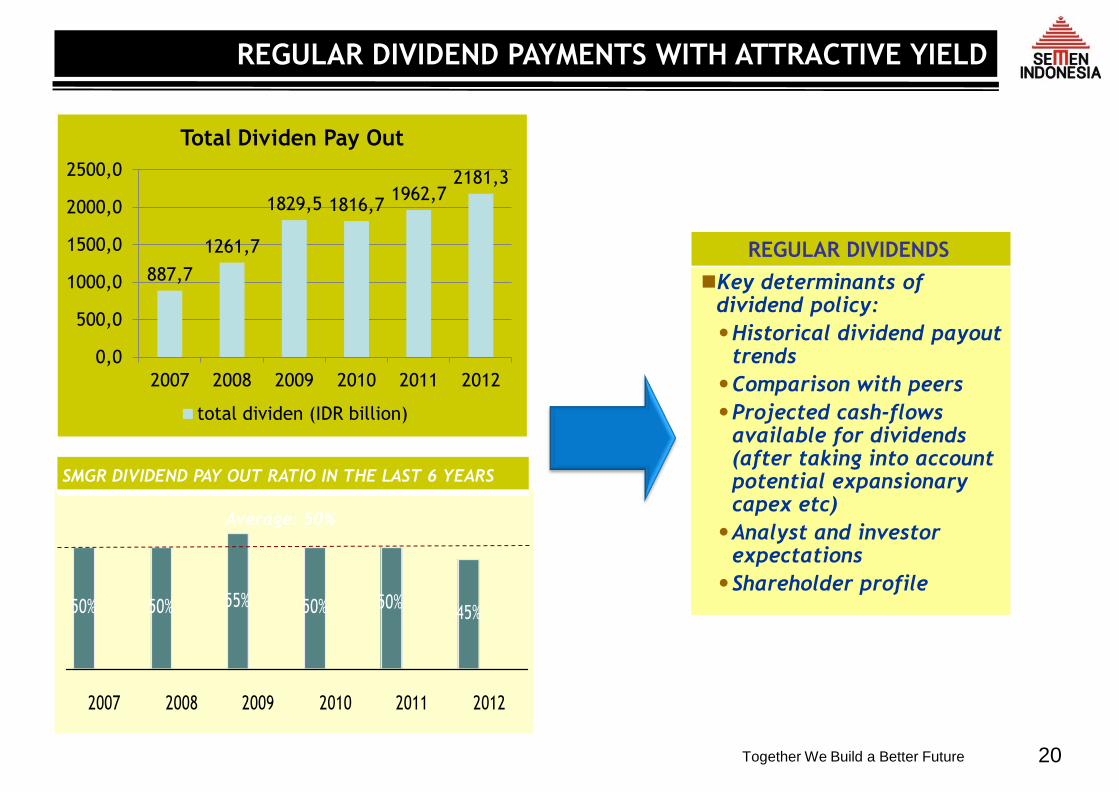
50% 50% 55% 50% 45%50%
2007 2008 2009 2010 2011 2012
Average: 50%
SMGR DIVIDEND PAY OUT RATIO IN THE LAST 6 YEARS
REGULAR DIVIDENDS
Key determinants of dividend policy:
•Historical dividend payout trends
•Comparison with peers
•Projected cash-flows available for dividends (after taking into account potential expansionary capex etc)
•Analyst and investor expectations
•Shareholder profile
REGULAR DIVIDEND PAYMENTS WITH ATTRACTIVE YIELD
887,7
1261,7
1829,5 1816,7 1962,7
2181,3
0,0
500,0
1000,0
1500,0
2000,0
2500,0
2007 2008 2009 2010 2011 2012
Total Dividen Pay Out
total dividen (IDR billion)
Together We Build a Better Future 21
STRATEGIC PROJECTS SMGR Corporate Presentation
June 2013
Together We Build a Better Future 22
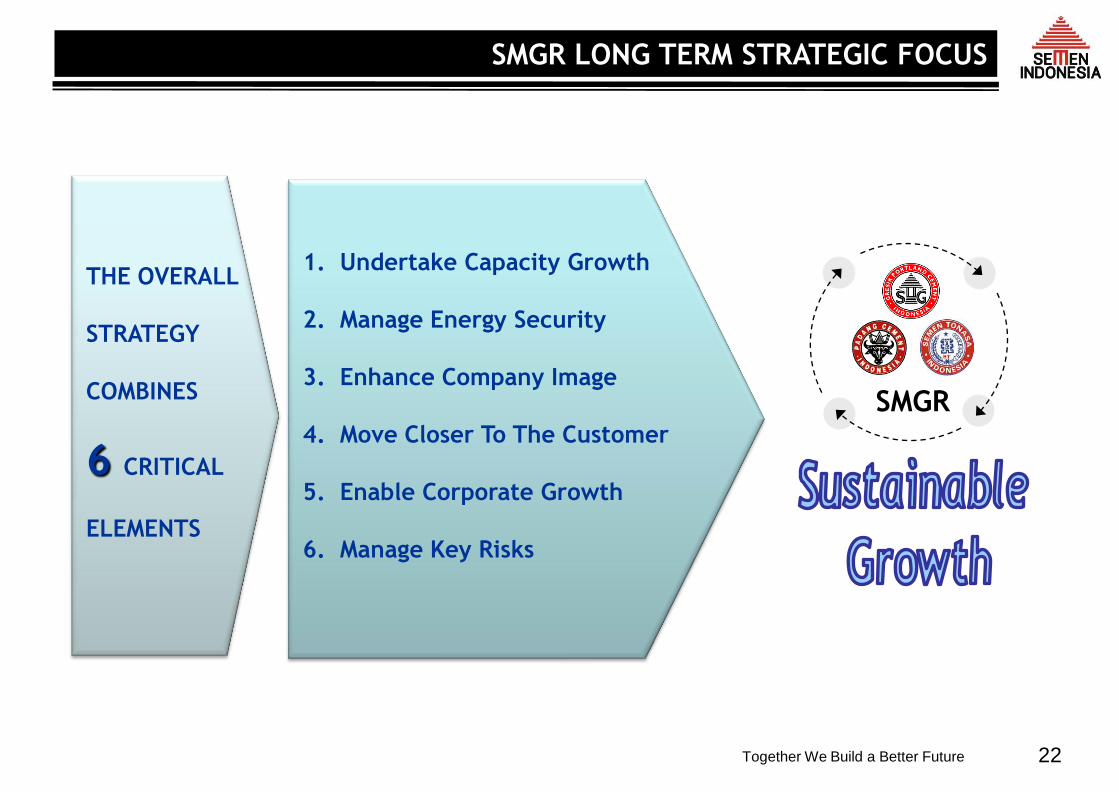
SMGR
THE OVERALL
STRATEGY
COMBINES
6 CRITICAL
ELEMENTS
1. Undertake Capacity Growth
2. Manage Energy Security
3. Enhance Company Image
4. Move Closer To The Customer
5. Enable Corporate Growth
6. Manage Key Risks
SMGR LONG TERM STRATEGIC FOCUS
Together We Build a Better Future 23
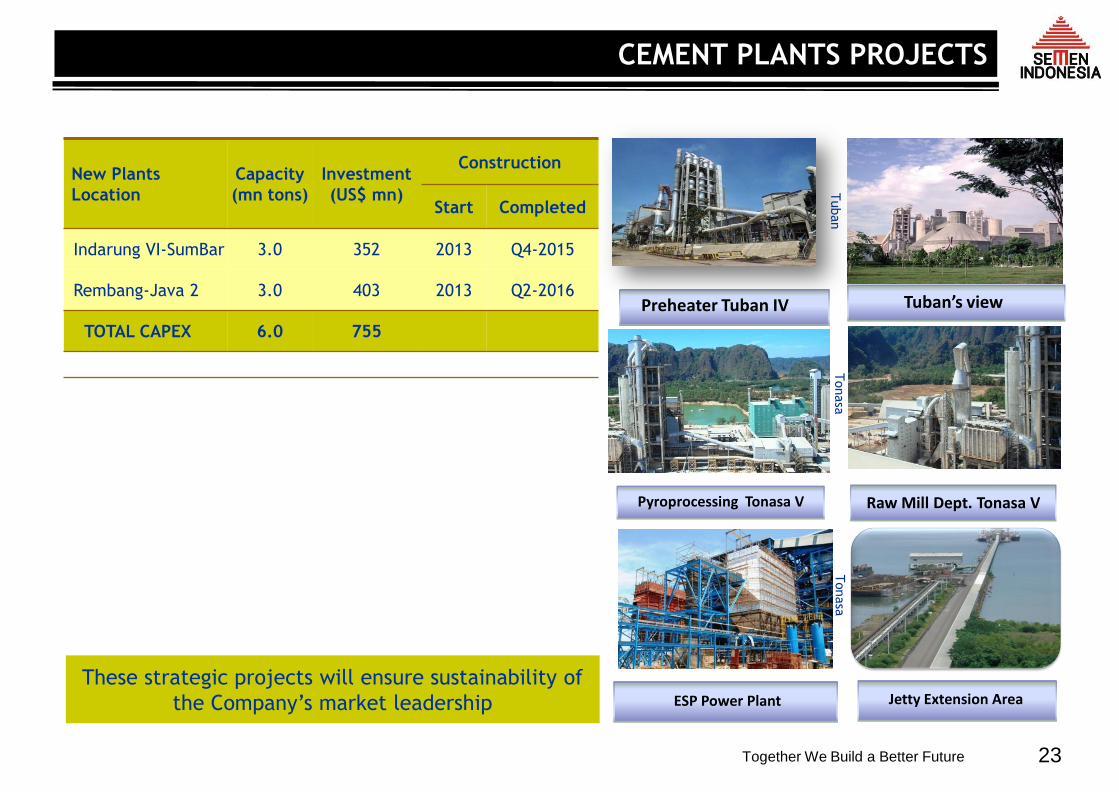
Tuban’s view
Pyroprocessing Tonasa V
Jetty Extension Area
Tuban
Tonasa
Tonasa
ESP Power Plant
These strategic projects will ensure sustainability of
the Company’s market leadership
Preheater Tuban IV
Raw Mill Dept. Tonasa V
New Plants
Location
Capacity
(mn tons)
Investment
(US$ mn)
Construction
Start Completed
Indarung VI-SumBar 3.0 352 2013 Q4-2015
Rembang-Java 2 3.0 403 2013 Q2-2016
TOTAL CAPEX 6.0 755
CEMENT PLANTS PROJECTS
Together We Build a Better Future 24
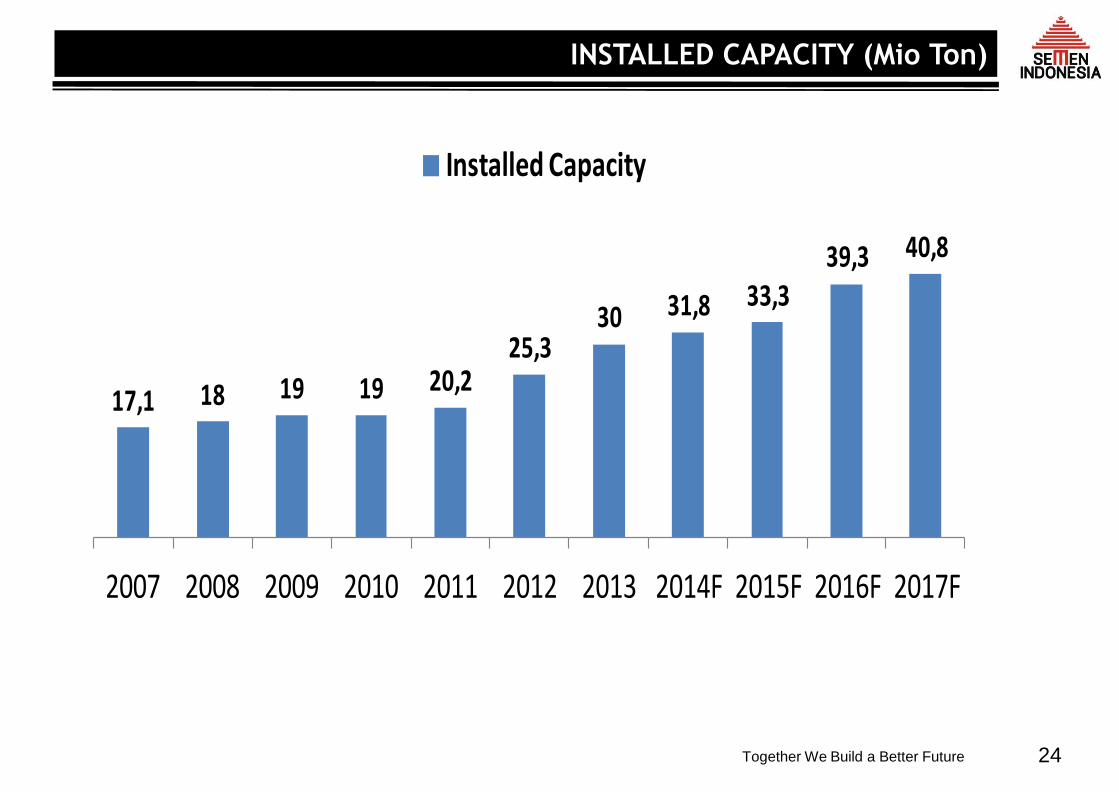
17,1 18 19 19 20,225,3
30 31,8 33,339,3 40,8
2007 2008 2009 2010 2011 2012 2013 2014F 2015F 2016F 2017F
Installed Capacity
INSTALLED CAPACITY (Mio Ton)
Together We Build a Better Future
2
3
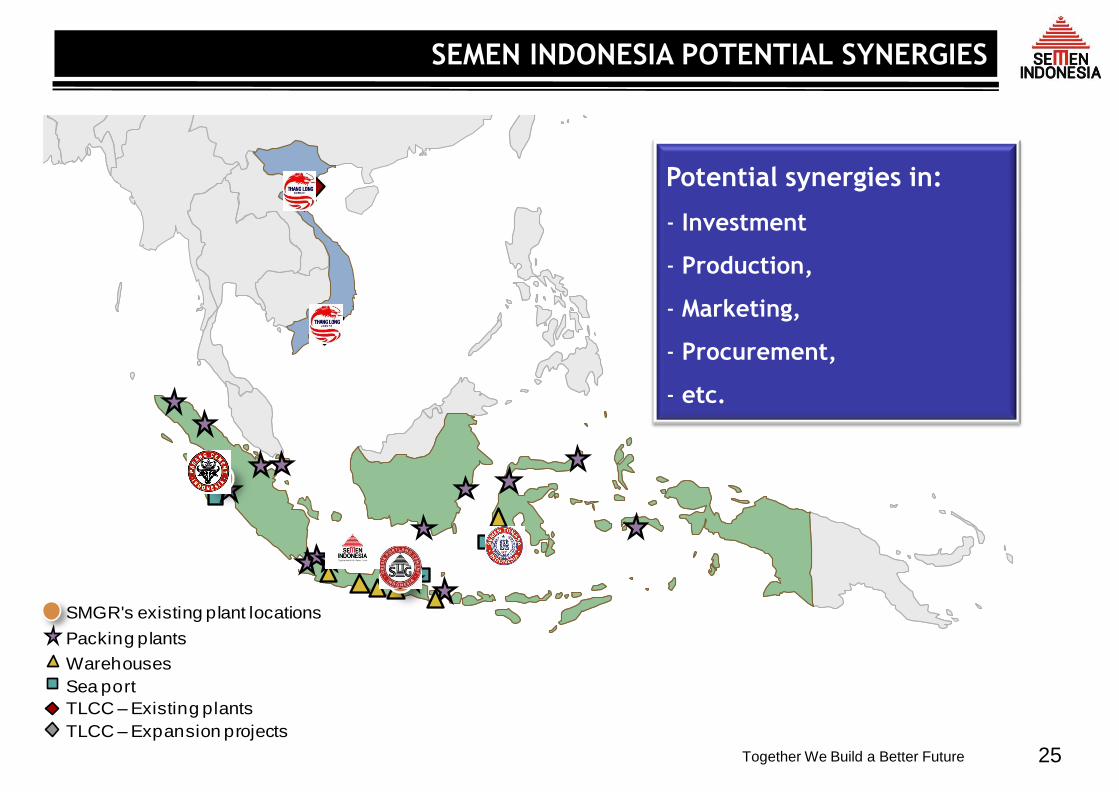
1
Packing plants
Sea port
Warehouses
SMGR's existing plant locations
TLCC – Existing plants
TLCC – Expansion projects
Potential synergies in:
- Investment
- Production,
- Marketing,
- Procurement,
- etc.
25
SEMEN INDONESIA POTENTIAL SYNERGIES
Together We Build a Better Future
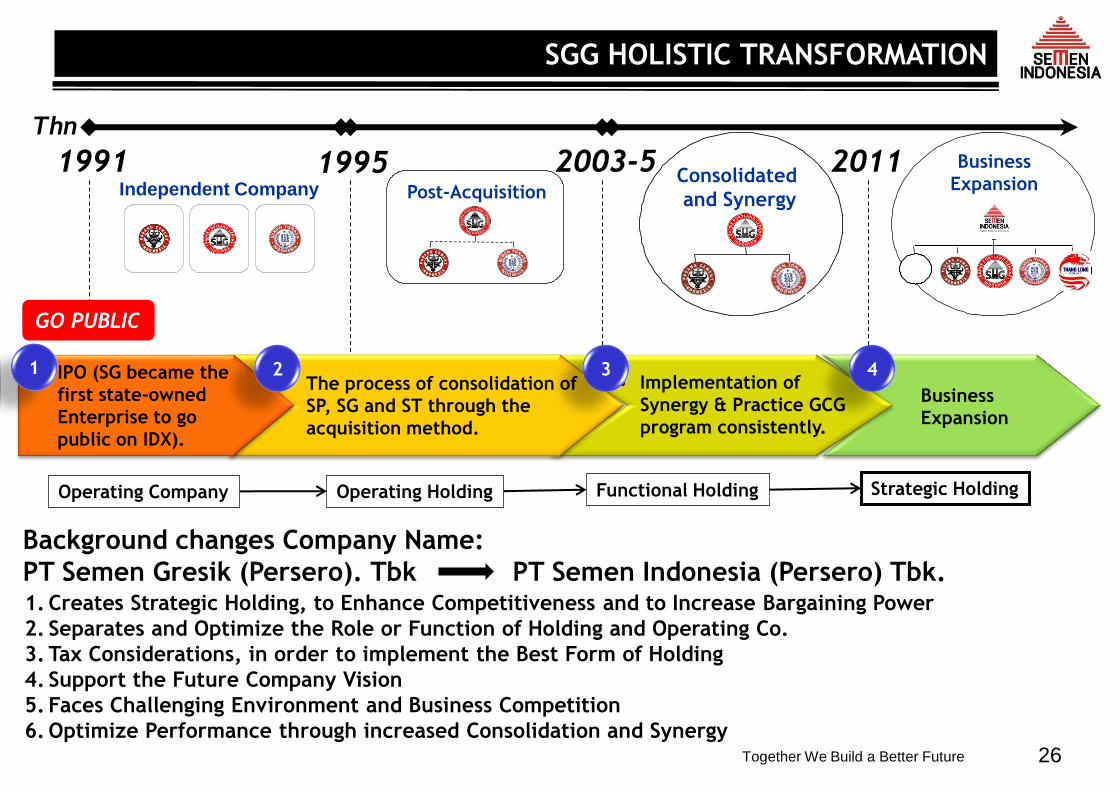
1995 2003-5
Thn
2011 1991
GO PUBLIC
The process of consolidation of
SP, SG and ST through the
acquisition method.
• Implementation of
Synergy & Practice GCG
program consistently.
Business
Expansion
IPO (SG became the
first state-owned
Enterprise to go
public on IDX).
1 2 3 4
Background changes Company Name:
PT Semen Gresik (Persero). Tbk PT Semen Indonesia (Persero) Tbk.
Post-Acquisition Consolidated
and Synergy
Business
Expansion
SG
Operating Holding Functional Holding Strategic Holding
1. Creates Strategic Holding, to Enhance Competitiveness and to Increase Bargaining Power
2. Separates and Optimize the Role or Function of Holding and Operating Co.
3. Tax Considerations, in order to implement the Best Form of Holding
4. Support the Future Company Vision
5. Faces Challenging Environment and Business Competition
6. Optimize Performance through increased Consolidation and Synergy
Operating Company
Independent Company
26
SGG HOLISTIC TRANSFORMATION
Together We Build a Better Future
CONCLUSION: WHY SMGR? SMGR Corporate Presentation
June 2013
27
Together We Build a Better Future 28
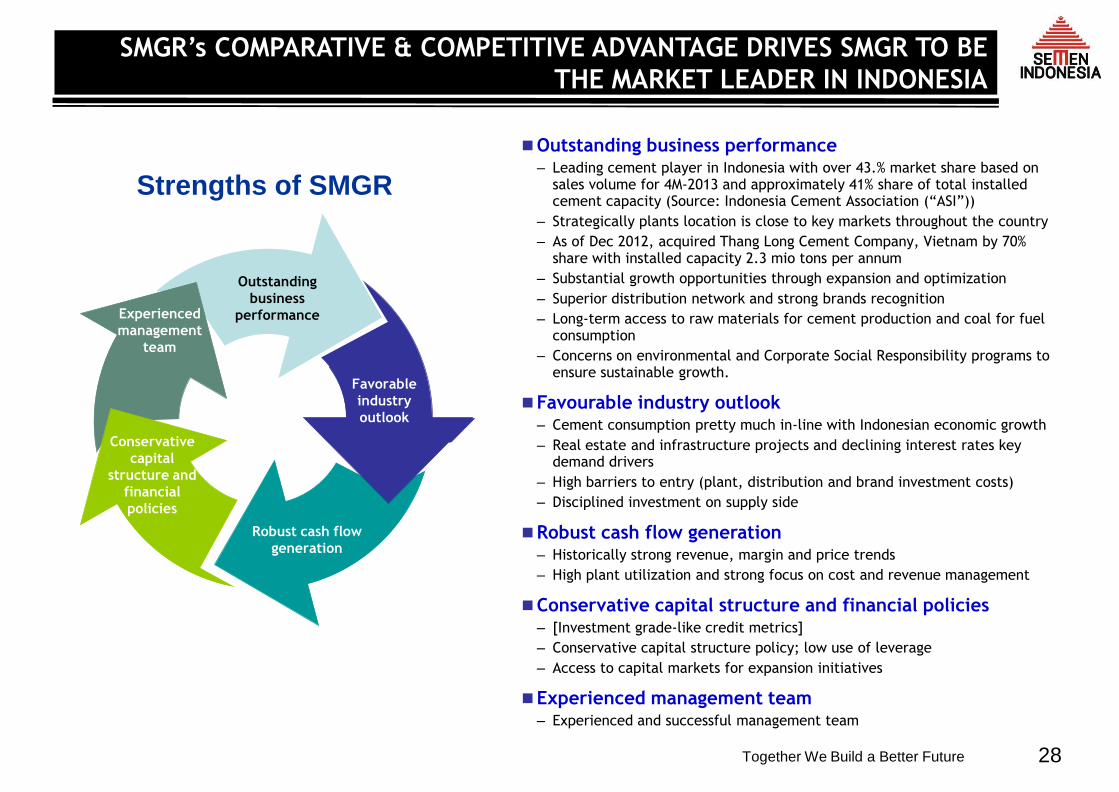
Outstanding
performance
Experienced
management
team
Conservative
capital
structure and
financial
policies
Robust cash flow
generation
Outstanding
business
performance
Favorable
industry
outlook
Outstanding business performance – Leading cement player in Indonesia with over 43.% market share based on
sales volume for 4M-2013 and approximately 41% share of total installed cement capacity (Source: Indonesia Cement Association (“ASI”))
– Strategically plants location is close to key markets throughout the country
– As of Dec 2012, acquired Thang Long Cement Company, Vietnam by 70% share with installed capacity 2.3 mio tons per annum
– Substantial growth opportunities through expansion and optimization
– Superior distribution network and strong brands recognition
– Long-term access to raw materials for cement production and coal for fuel consumption
– Concerns on environmental and Corporate Social Responsibility programs to ensure sustainable growth.
Favourable industry outlook – Cement consumption pretty much in-line with Indonesian economic growth
– Real estate and infrastructure projects and declining interest rates key demand drivers
– High barriers to entry (plant, distribution and brand investment costs)
– Disciplined investment on supply side
Robust cash flow generation – Historically strong revenue, margin and price trends
– High plant utilization and strong focus on cost and revenue management
Conservative capital structure and financial policies – [Investment grade-like credit metrics]
– Conservative capital structure policy; low use of leverage
– Access to capital markets for expansion initiatives
Experienced management team – Experienced and successful management team
Strengths of SMGR
SMGR’s COMPARATIVE & COMPETITIVE ADVANTAGE DRIVES SMGR TO BE
THE MARKET LEADER IN INDONESIA
Together We Build a Better Future 29 29
Main Office:
Semen Gresik Tower
Jln. Veteran
Gresik 61122 – Indonesia
Phone: (62-31) 3981731 -2, 3981745
Fax: (62-31) 3983209, 3972264
Jakarta Office: The East Building, 18th Floor,
Jln. DR. Ide Anak Agung Gde Agung Kav. E3.2 No.1,
Mega Kuningan, Jakarta 12950 – Indonesia
Phone : (62-21) 5261174 – 5
Fax : (62-21) 5261176 www.semenindonesia.com
THANK YOU IMPORTANT NOTICE
THIS PRESENTATION IS NOT AND DOES NOT CONSTITUTE OR FORM PART OF, AND IS NOT MADE IN CONNECTION WITH, ANY OFFER FOR SALE OR SUBSCRIPTION OF OR SOLICITATION, RECOMMENDATION OR INVITATION OF ANY OFFER TO BUY OR SUBSCRIBE FOR ANY SECURITIES NOR SHALL IT OR ANY PART OF IT FORM THE BASIS OF OR BE RELIED ON IN CONNECTION WITH ANY CONTRACT, COMMITMENT OR INVESTMENT DECISION WHATSOEVER.
THE SLIDES USED IN THIS PRESENTATION ARE STRICTLY CONFIDENTIAL AND HAVE BEEN PREPARED AS A SUPPORT FOR ORAL DISCUSSIONS ONLY. THE INFORMATION CONTAINED IN THIS PRESENTATION IS BEING PRESENTED TO YOU SOLELY FOR YOUR INFORMATION AND MAY NOT BE REPRODUCED OR REDISTRIBUTED TO ANY OTHER PERSON, IN WHOLE OR IN PART.
This presentation includes forward-looking statements, which are based on current expectations and forecast about future events. Such statements involve known / unknown risks uncertainties and other factors, which could cause actual results to differ materially from historical results or those anticipated. Such factors include, among others:
● economic, social and political conditions in Indonesia, and the impact such conditions have on construction and infrastructure spending in Indonesia;
● the effects of competition;
● the effects of changes in laws, regulations, taxation or accounting standards or practices;
● acquisitions, divestitures and various business opportunities that we may pursue;
● changes or volatility in inflation, interest rates and foreign exchange rates;
● accidents, natural disasters or outbreaks of infectious diseases, such as avian influenza, in our markets;
● labor unrest or other similar situations; and
● the outcome of pending or threatened litigation.
We can give no assurance that our expectations will be attained.
DISCLAIMER
The information contained in this report has been taken from sources which we deem reliable. However, none of PT Semen Indonesia (Persero) Tbk and/or its affiliated companies and/or their respective employees and/or agents make any representation or warranty (express or implied) or accepts any responsibility or liability as to, or in relation to, the accuracy or completeness of the information and opinions contained in this report or as to any information contained in this report or any other such information or opinions remaining unchanged after the issue thereof.
We expressly disclaim any responsibility or liability (express or implied) of PT Semen Indonesia (Persero) Tbk, its affiliated companies and their respective employees and agents whatsoever and howsoever arising (including, without limitation for any claim, proceedings, action, suits, losses, expenses, damages or costs) which may be brought against or suffered by any person as a result of acting in reliance upon the whole or any part of the contents of this report and neither PT Semen Indonesia (Persero) Tbk, its affiliated companies or their respective employees or agents accepts liability for any errors, omission or mis-statements, negligent or otherwise, in the report and any liability in respect of the report or any inaccuracy therein or omission therefrom which might otherwise arise is hereby expresses disclaimed.