smarter urban planning through a citizen-based approach ... · de la persona autora. pot ser...
TRANSCRIPT

SMARTER URBAN PLANNING THROUGH A CITIZEN-BASED APPROACH.
THE SMART URBAN PLANNING METHOD
Maria-Lluïsa Marsal-Llacuna
Dipòsit legal: Gi. 188-2015 http://hdl.handle.net/10803/285384
ADVERTIMENT. L'accés als continguts d'aquesta tesi doctoral i la seva utilització ha de respectar els drets de la persona autora. Pot ser utilitzada per a consulta o estudi personal, així com en activitats o materials d'investigació i docència en els termes establerts a l'art. 32 del Text Refós de la Llei de Propietat Intel·lectual (RDL 1/1996). Per altres utilitzacions es requereix l'autorització prèvia i expressa de la persona autora. En qualsevol cas, en la utilització dels seus continguts caldrà indicar de forma clara el nom i cognoms de la persona autora i el títol de la tesi doctoral. No s'autoritza la seva reproducció o altres formes d'explotació efectuades amb finalitats de lucre ni la seva comunicació pública des d'un lloc aliè al servei TDX. Tampoc s'autoritza la presentació del seu contingut en una finestra o marc aliè a TDX (framing). Aquesta reserva de drets afecta tant als continguts de la tesi com als seus resums i índexs. ADVERTENCIA. El acceso a los contenidos de esta tesis doctoral y su utilización debe respetar los derechos de la persona autora. Puede ser utilizada para consulta o estudio personal, así como en actividades o materiales de investigación y docencia en los términos establecidos en el art. 32 del Texto Refundido de la Ley de Propiedad Intelectual (RDL 1/1996). Para otros usos se requiere la autorización previa y expresa de la persona autora. En cualquier caso, en la utilización de sus contenidos se deberá indicar de forma clara el nombre y apellidos de la persona autora y el título de la tesis doctoral. No se autoriza su reproducción u otras formas de explotación efectuadas con fines lucrativos ni su comunicación pública desde un sitio ajeno al servicio TDR. Tampoco se autoriza la presentación de su contenido en una ventana o marco ajeno a TDR (framing). Esta reserva de derechos afecta tanto al contenido de la tesis como a sus resúmenes e índices. WARNING. Access to the contents of this doctoral thesis and its use must respect the rights of the author. It can be used for reference or private study, as well as research and learning activities or materials in the terms established by the 32nd article of the Spanish Consolidated Copyright Act (RDL 1/1996). Express and previous authorization of the author is required for any other uses. In any case, when using its content, full name of the author and title of the thesis must be clearly indicated. Reproduction or other forms of for profit use or public communication from outside TDX service is not allowed. Presentation of its content in a window or frame external to TDX (framing) is not authorized either. These rights affect both the content of the thesis and its abstracts and indexes.

DOCTORAL THESIS
SSmmaarrtteerr UUrrbbaann PPllaannnniinngg tthhrroouugghh aa cciittiizzeenn--bbaasseedd aapppprrooaacchh
TThhee SSmmaarrtt UUrrbbaann PPllaannnniinngg MMeetthhoodd
Maria-Lluïsa Marsal-Llacuna
2013
DOCTORAL PROGRAM IN TECHNOLOGY
Advisor: Beatriz López-Ibáñez
Thesis submitted for the Degree of Doctor of Philosophy
at the University of Girona

LLIISSTT OOFF PPUUBBLLIICCAATTIIOONNSS
MLl. Marsal, JLl. De la Rosa, The Representation for All Model: An Agent‐Based
Collaborative Method for More Meaningful Citizen Participation in Urban Planning,
Lecture Notes in Computer Science, LNCS 7973 (III) (2013) 324–339
MLl. Marsal, I. Boada, 3D‐VUPID: 3D Visual Urban Planning Integrated Data, Lecture
Notes in Computer Science, LNCS 7974 (iV) (2013) 17‐32
The following papers have been sent for publication:
MLl. Marsal, J. Meléndez, J. Colomer, Lessons in Urban Monitoring taken from
Sustainable and Liveable Cities to better address the Smart Cities Initiative: The need
for Intelligent Indices. Sent to Technological Forecasting & Social Change (Elsevier)
2012 Impact Factor: 2,106 (1Q)
MLl. Marsal, B. López, Smarter Urban Planning: Designing Urban Land Use from Urban
Time Use. Sent to Social Indicators Research (Springer) 2012 Impact factor: 1,264 (2Q)
MLl. Marsal, R. Fabregat, Modelling Citizens’ Urban Time Use using an Adaptive
Hypermedia Survey to obtain an Urban Planning, Citizen‐Centered, Methodological
Reinvention. Sent to Time and Society (Sage) 2012 Impact factor: 0,528 (3Q)
NOTE :
On July 2013, the Method Smarter Urban Planning has been submitted to the United
States Patent Office to apply for a US patent.

LLIISSTT OOFF FFIIGGUURREESS
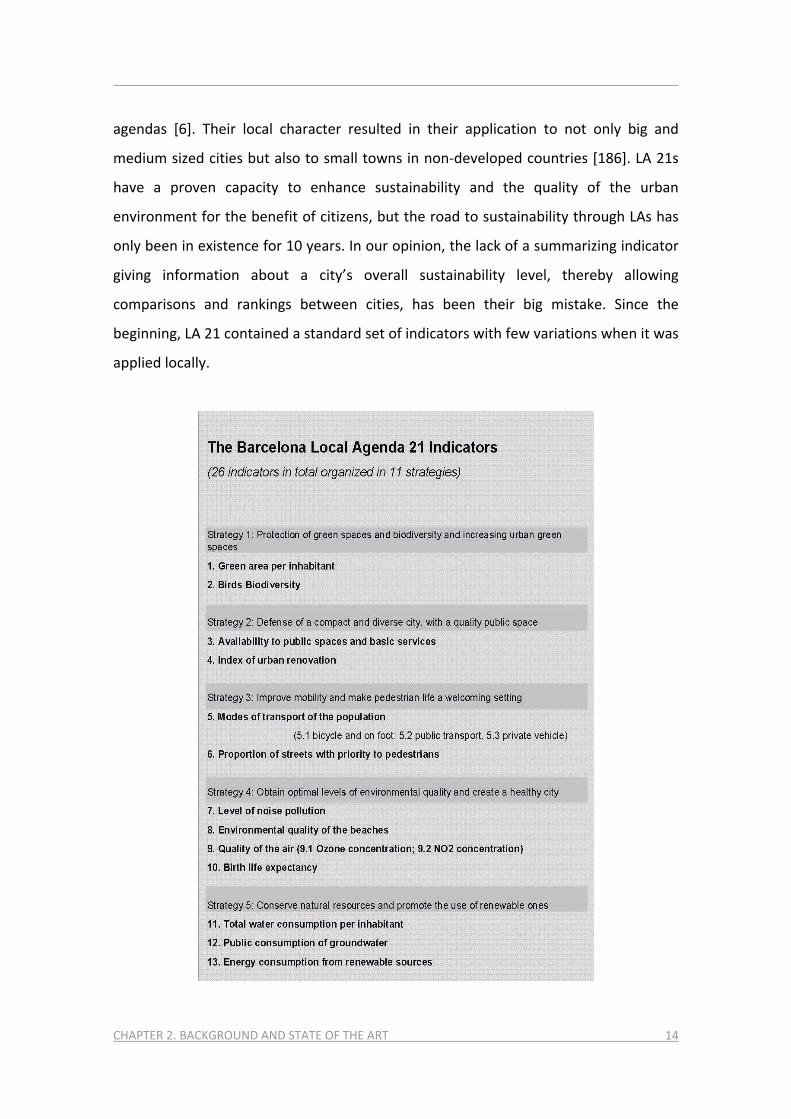
Fig. 1. List of strategies and their indicators contained in Barcelona’s LA 21 (p. 15)
Fig. 2. Sequential development of the first PC over 10 years. It demonstrates that PCA
is a good technique for representing the whole set of sustainability indicators (LA 21
indicators) in a synthetic index, relating PC values to the values of that index (p.18)
Fig. 3. Variable contribution (indicator) in the construction of the first principal
component (p.18)
Fig. 4. Statistics of built park and energy consumption measurements: aggregated and
residential data (p.30)
Fig 5. Statistics of built park and energy consumption measurements: industrial and
business sectors data (p.31)
Fig. 6. Rule of Correspondence between Urban Time Use and Urban Land Use. New
planning values for optimal urban design are obtained from the desired urban time use
and the indicators of equivalence, current relation between urban time and land use
(p.38)
Fig 7. F2F Stereotype Survey Questionnaire: Questions for initial stereotypes groups
and subgroups formation and feature‐based survey’s user model profiles construction
(p. 48)
Fig. 8. Stereotype Survey Pilot test: Most common correlations between initial
stereotypes groups, stereotype subgroups and feature‐based survey’s user model
profiles obtained in a pilot test (p.51)
Fig. 9. Urban Information (Representation) Pyramid UN‐Habitat ROLAC (p.62)
Fig. 10. Proposed Urban Information Visualization Pyramid (p.69)
Fig. 11. Model information representation: sources and visualization techniques (p. 77)
Fig. 12. Proposed Model conceptual schema (p. 80)
Fig. 13. Current elaboration process of a master plan (p. 86)
Fig. 14. Recommendations time line of the collaborative filtering and content‐based
agents. The picture above represents how recommendations operate over time in
parallel with the elaboration of the master plan (p.96)
Fig. 15. Redesign of the Diagonal Avenue in Barcelona. Option A (p. 102)
Fig. 16. Redesign of the Diagonal Avenue in Barcelona. Option B (p. 102)
Fig. 17. Depiction of potentially discriminating attributes. “Facilities area/urban
surface” (second graphic) most accurately separates the “class” (first graphic) (p. 120)
Fig. 18. Experiment a) and b) decision tree (p. 121)

AACCKKNNOOWWLLEEDDGGMMEENNTTSS
Special thanks to my thesis director, Beatriz López. It has been a long and fruitful
collaboration. Besides the thesis, we worked together in the preparation of an article
about the Method presented in this thesis which has been sent for publication. More
importantly, the Method Smart Urban Planning disclosed here is being submitted for a
patent in the United States. Regarding the patent, on behalf of Bea and myself, we
want to thank the University of Girona, and more specially the Research Vice‐
Rectorate, and the Research and Technology Transfer Office, for their economic
support and technical assistance, respectively.
Before this doctorate, I received a Master of Science in Applied Informatics,
Automatics and Systems Computation at the University of Girona. I want to thank the
professors for the advice and support given during the preparation of content that has
now become parts of this thesis. Special thanks to Joaquim Meléndez and Joan
Colomer, who helped me in the preparation of the Background Art, more precisely in
the use of PCA to elaborate a summarizing index. I am grateful to Ramon Fabregat,
who provided me with substantial material to prepare the adaptive hypermedia survey
model. Thanks to Imma Boada, who carefully corrected and provided valuable
suggestions on the model for integrated visualization and representation of urban
planning data. And to Josep Lluís de la Rosa, who gave me interesting suggestions and
ideas during the preparation of the agent‐based collaborative model. Additional thanks
to Josep Lluís de la Rosa and Imma Boada for their economic support in the
participation at ICCSA 2013 (International Conference in Computational Science and its
Applications), we presented two papers related to the research on agents and
visualization, respectively; also published in two issues of Lecture Notes in Computer
Science.
Finally, it is important to mention my research group, eXIT, Research Group on
Intelligent Systems, who welcomed an architect and doctor in urban planning who was
extremely thirsty to learn about intelligent systems, with the desire to contribute to
making smarter urban systems.

CCOONNTTEENNTTSS
Abstract _______________________________________________________________i
Resum ________________________________________________________________ii
Resumen______________________________________________________________iii
1. INTRODUCTION
1.1. Problem: the obsolescence of urban planning design values and disillusion with
the urban planning approval process________________________________________1
1.2. Traditional Urban Planning methods are based on obsolete and subjective
planning values. Urgent updating and revision are needed ______________________2
1.3. Traditional urban planning participatory processes are merely validation tools,
which do not improve urban design. A more citizen‐centered participatory model
based on public opinion is required _________________________________________3
1.4. Concept and main objective: Smart Urban Planning_________________________4
1.5. Thesis overview and additional objectives ________________________________5
2. BACKGROUND AND STATE OF THE ART
2.1. Introduction: on the need for a synthetic index to visualize the monitoring of
urban strategies _______________________________________________________11
2.2. Learning from the Sustainable City and the problems with the LA 21 set of
indicators_____________________________________________________________13
2.3. Learning from the Livable city and the successful QoL index _________________20
2.4. The Smart concept__________________________________________________24
2.5. Summary _________________________________________________________33
3. METHODOLOGY
3.1. Introduction_______________________________________________________36

3.2. A novel approach which reinvents public participation in urban planning: an
opinion survey on urban time use to obtain citizen‐centered design values for master
plans ________________________________________________________________38
3.3. Obtaining new urban planning values and citizens’ satisfaction thresholds
_____________________________________________________________________39
3.4. INSIGHT on citizens’ adaptive hypermedia surveys
3.4.1. Selection of adaptive hypermedia techniques for survey purposes:
combination of stereotype and feature‐based models to collect information
from citizens on their urban‐time‐use ________________________________42
3.4.2. Adaptive Hypermedia Survey on Urban‐Time‐Use is based on normalized
adaptive hypermedia techniques and designed according to existing
standards of adaptation ___________________________________________46
3.4.3. Stereotyped survey: user groups construction ____________________50
3.4.4. Feature‐based survey: personalization___________________________58
3.4.5. Summary of the advantages of using adaptive hypermedia techniques for
survey purposes _________________________________________________60
3.5. INSIGHT on visualization and representation tools to support decision making in
the urban context
3.5.1. Problems with the presentation of urban information ______________64
3.5.2. Urban data representation____________________________________66
3.5.3. Urban information visualization________________________________71
3.5.4. Model for integrated urban information representation and visualization
_______________________________________________________________79
3.5.5. Summary of the advantages of integrated presentation of urban
information_____________________________________________________84
3.6. INSIGHT on agent‐based public participation
3.6.1. The problem of public participation in urban planning ______________87
3.6.2. The technique: Agent technology in the urban context______________91
3.6.3. A pair of opinion‐miner agents that recommend the ideas of citizens to
planners________________________________________________________94
3.6.4. A concluding example: the redesign of Diagonal Avenue in Barcelona_102

3.6.5. Summary of the advantages of using agent technology in public
participation ___________________________________________________107
3.7. Summary ________________________________________________________108
4. APPLICATIONS OF THE METHODOLOGY
4.1. Decision tree rule learning for classification of municipalities _______________111
4.2. Improving classification with Knn _____________________________________112
4.3. Summary ________________________________________________________115
5. RESULTS AND DISCUSSION
5.1. Survey design on urban time use and citizens’ opinions on urban needs ______117
5.2. Processing data survey _____________________________________________119
5.3. Obtaining a new standard __________________________________________120
5.4. Outcomes of the classification of municipalities _________________________121
5.5. Sub‐classification outcomes with knn _________________________________126
5.6. Summary________________________________________________________128
6. CONCLUSIONS AND FURTHER RESEARCH
6.1. Contributions ____________________________________________________131
6.2. Next research steps _______________________________________________134
7. REFERENCES _______________________________________________________137


i
AABBSSTTRRAACCTT
In this dissertation we propose an objective method for updating traditional urban
planning methodologies based on input from citizens regarding their current and
future urban requirements. Specifically, our methodology is based on citizen web –
based surveys regarding urban time use allocation and opinions concerning how to
cover urban needs, and on the use of data mining tools to process the collected data.
The Smart Urban Planning Method allows to obtain new planning values for urban land
use design using an innovative conversion rule which transforms the daily distribution
of urban time use into quantities of urban land use.
The Smart Urban Planning Method presented here is accompanied by different insights
which provide methodological extensions. These extensions aim to identify difficulties
and problems associated with the research topic and bring to light potential solutions.
These insights are developed in the form of models. Precisely, we provide a first model
that uses a hypermedia adaptive survey to gain voluntary participation from citizens. A
second model covers the very much needed integrated representation and
visualization of urban data. The final model is based on agent technology for more
meaningful public participation in urban planning.
We test our Method by experimenting with a case study on the specific urban sub‐
system of public facilities and services, and use Girona Province as a pilot area. Our
novel Method obtains new, objective, and more accurate design values for the
planning of facilities and services using citizens’ satisfaction thresholds. In addition, as
an example of further application of the Method, we develop a municipal classification
on self sufficiency in the services and facilities subsystem according to citizens’
satisfaction values.

ii
RREESSUUMM
En la present dissertació proposem un mètode objectiu per a l’actualització de les
metodologies tradicionals de planificació urbanística basat en l’opinió dels ciutadans al
respecte dels seus requeriments urbans presents i futurs. Específicament, la nostra
metodologia està basada en enquestes web a la ciutadania per conèixer com
distribueixen el seu temps urbà i en la opinió de com cobrir les seves necessitats
urbanes. S’utilitzen eines de mineria de dades per al processat de les dades recollides.
El Mètode Smart Urban Planning permet obtenir nous valors de planificació urbanística
per al disseny dels usos del sòl amb la utilització d’una innovadora regla de conversió
que transforma la distribució diària del temps urbà en quantitats d’usos del sòl urbà.
El Mètode Smart Urban Planning presentat en la tesi s’acompanya de diferents
introspeccions que proporcionen extensions metodològiques. Aquestes extensions
(anomenades “insights”) pretenen identificar dificultats i problemes associats amb el
tema de la recerca alhora que aportar llum o fins i tot una possible solució. Aquestes
introspeccions s’elaboren com a models. Concretament, aportem un primer model que
utilitza enquestes hipermèdia adaptatives per a guanyar participació voluntària del
ciutadà. Un segon model per la més que necessària representació i visualització
integrada de les dades urbanes. I finalment, un model basat en tecnologia agent per a
una participació ciutadana en la planificació urbanística més representativa.
Provem el nostre Mètode experimentant amb un cas d’estudi en el subsistema urbà
dels equipaments i serveis públics, i emprem la província de Girona com a àrea pilot. El
nostre Mètode innovador obté nous valors de disseny per a la planificació urbanística
dels equipaments i serveis més objectius i acurats a partir d’índexs de satisfacció
ciutadana. Addicionalment, com a exemple d’altra aplicació del Mètode,
desenvolupem una classificació municipal en termes de autosuficiència d’acord amb
els valors de satisfacció ciutadana per al subsistema dels equipaments i serveis.
iii
RREESSUUMMEENN
En la presente disertación proponemos un método objetivo para la actualización de las
metodologías tradicionales de planificación urbanística basado en la opinión de los
ciudadanos al respecto de sus requerimientos urbanos presentes y futuros.
Específicamente, nuestra metodología esta basada en encuestas web a la ciudadanía
para conocer cómo distribuyen su tiempo urbano y en la opinión en cómo cubrir sus
necesidades urbanas. Se utilizan herramientas de minería de datos para el procesado
de los datos recogidos. El Método Smart Urban Planning permite obtener nuevos
valores de planificación urbanística para el diseño de los usos del suelo con la
utilización de una innovadora regla de conversión que transforma la distribución diaria
del tiempo urbano en cantidades de usos del suelo urbano.
El Método Smart Urban Planning presentado aquí se acompaña de distintas
introspecciones que proporcionan extensiones metodológicas. Estas extensiones
(llamadas “insights”) pretenden identificar dificultades y problemas asociados con el
tema de la investigación a la vez que aportar luz o incluso una posible solución. Éstas
introspecciones se desarrollan cómo modelos. Concretamente, aportamos un primer
modelo que utiliza encuestas hipermedia adaptativas para ganar participación
voluntaria del ciudadano. Un segundo modelo para la más que necesaria
representación y visualización integrada de los datos urbanos. Y finalmente, un modelo
basado en tecnología agente para una participación ciudadana en la planificación
urbanística más representativa.
Probamos nuestro Método experimentando con un caso de estudio en el subsistema
urbano de los equipamientos y servicios públicos, y utilizamos la provincia de Girona
cómo área piloto. Nuestro Método innovador obtiene nuevos valores de diseño para la
planificación urbanística, más objetivos y precisos a partir de índices de satisfacción
ciudadana. Adicionalmente, cómo ejemplo de otra aplicación del Método,
desarrollamos una clasificación municipal en términos de autosuficiencia de acuerdo
con los valores de satisfacción ciudadana para el subsistema de los equipamientos y
servicios.

CHAPTER 1. INTRODUCTION 1
11.. IINNTTRROODDUUCCTTIIOONN
In the context of the Smart City initiative we present the Smart Urban Planning
Concept. The concept stands for the need to reformulate the planning values used for
designing and establishing the distribution and use of urban land. Depending on the
legal system in a particular country, planning values can be either recommendations or
mandatory standards. In many countries, planning values have not been updated since
their creation, commonly during the 1970’s, and they are based on the subjective
thinking of planners.
Nowadays, ICT opens new opportunities to tackle urban planning. In this thesis, we
propose the Smart Urban Planning Method, a methodology that takes advantage of
ICT to obtain planning values according to citizens’ needs. The Method is based on how
citizens use and want to use their city. The Method uses a survey to learn about the
current and desired urban time use distribution of citizens. Next, the Method
transforms urban time use results into urban land use amounts, a pioneering and
objective approach to reformulate urban planning values.
11..11.. PPrroobblleemm:: tthhee oobbssoolleesscceennccee ooff uurrbbaann ppllaannnniinngg ddeessiiggnn
vvaalluueess aanndd ddiissiilllluussiioonn wwiitthh tthhee uurrbbaann ppllaannnniinngg aapppprroovvaall
pprroocceessss
The main purpose of the urban planning discipline is to meet the urban needs of
citizens. These are for the most part focused on decent and affordable housing,
convenient public transport, accessible and sufficient public services placed in public
facilities, and safe and livable public spaces. All of these basic urban planning purposes
are in crisis, due to:

CHAPTER 1. INTRODUCTION 2
a) Obsolescence of the planning values (and thus rules and procedures) used by
urban planners, and
b) The impoverished role of citizens in the overall planning process
Each of these problems is discussed in turn, below.
11..22.. TTrraaddiittiioonnaall UUrrbbaann PPllaannnniinngg mmeetthhooddss aarree bbaasseedd oonn oobbssoolleettee
aanndd ssuubbjjeeccttiivvee ppllaannnniinngg vvaalluueess.. UUrrggeenntt uuppddaattiinngg aanndd rreevviissiioonn
aarree nneeeeddeedd
Traditional urban planning methods consist of rules and procedures which are based
on planning values, which are in large part derived from the experience of urban
planners. Therefore, traditional planning proposals are not only subjective, but
sometimes even biased, due to political and other influences. Urban Planning Acts
generally provide recommended values and/or planning standards for the amount of
urban lands and their allocated uses (such as public spaces, facilities, housing, roads,
commercial, etc.). Many of these recommended values and planning standards were
created during the urban planning exercises of the 1970’s, or even earlier. Since this
foundational era, most countries have failed to update their urban planning design
values, and still use them as the basis for city master plans. Even updated and recent
city master plans are often based on antiquated planning design values. This situation
must be addressed now. Cities are completely different, and the needs of citizens have
changed dramatically.
New data for the revision of urban planning design values must come from the actual
experience of citizens, and be based upon their opinions and desires concerning their
urban needs and how they want to use their cities.
CHAPTER 1. INTRODUCTION 3
11..33.. TTrraaddiittiioonnaall uurrbbaann ppllaannnniinngg ppaarrttiicciippaattoorryy pprroocceesssseess aarree
mmeerreellyy vvaalliiddaattiioonn ttoooollss,, wwhhiicchh ddoo nnoott iimmpprroovvee uurrbbaann ddeessiiggnn..
AA mmoorree cciittiizzeenn--cceenntteerreedd ppaarrttiicciippaattoorryy mmooddeell bbaasseedd oonn ppuubblliicc
ooppiinniioonn iiss rreeqquuiirreedd
Traditional public participation in the urban planning approval process consists mainly
of citizen validation of proposed master plans. It is normally organized as a three‐step
approval process, requiring a public vote before passing to the next step. First of all,
the basic city design schema is submitted for the so‐called master plan initial approval,
which is binding at the municipal level. At this point, citizens can only express whether
or not they like the first initial layout. The second step, which is called the master plan
provisional approval, involves a more detailed proposal, which is binding at the
regional level and involves the regional administration (if it has jurisdiction under
national law). Once again, citizens are only empowered to accept or decline the master
plan. The third and last step, the master plan final approval, corresponds to the
regional or even national administration, and the role of citizens is still restricted to
validation.
Public participation in the urban planning approval processes can no longer be a mere
formality, limited to the validation of master plan proposals. Societies and
municipalities are much more “social” than forty years ago. Citizens want cities and
their governing bodies to serve them in the most optimal fashion. Using new
technology, social media, and enhanced access to information, citizens want to be
acknowledged, empowered, engaged, informed, and given multiple avenues to
contribute to the design of their cites and the ways that their lives unfold. Citizens will
not accept public participation which is structured as a formality, completing an
administrative approval process that took place behind closed doors. Therefore, urban
planning processes should expand the role of citizens and integrate their opinions in
the earliest stages. Citizens are and need to be treated as the source of the most
CHAPTER 1. INTRODUCTION 4
important and up‐to‐date data that must form the basis of urban planning values and
standards.
To revise and update planning values, and make them correspond to the needs of
citizens, we propose a more citizen‐centered approach and expanded public
participation as part of a Smart Urban Planning Method. Our methodology, set forth
below, utilizes web‐based opinion surveys and data mining tools to establish new
values and rules for urban planning. Proof of concept is presented through a Study
Case on public services and facilities urban sub‐system in Girona Province (Catalunya,
Spain).
11..44.. CCoonncceepptt aanndd mmaaiinn oobbjjeeccttiivvee:: SSmmaarrtt UUrrbbaann PPllaannnniinngg
The main objective of this work is to update urban planning values to better meet the
needs of citizens through the use of ICT tools that reinvent public participation in
urban planning. The Smart Urban Planning Method is designed for this purpose.
The proposed Smart Urban Planning Method consists on an objective approach that
reinvents obsolete traditional urban planning. It uses a rule of correspondence and
indicators of equivalence between urban time use and urban land use as innovative
and pioneering tools for updating urban planning design values.
To develop the Smart Urban Planning Method we use the inverse engineering concept,
under which the initial parameters are unknown and must be determined in relation to
the desired target. In other words, this determines the causal parameters for an
observed or desired effect. Solving a problem using inverse engineering techniques
usually requires two computational tasks: first, simulating the problem, and second,
selecting the optimal solution. In the context of the Smart City Initiative, the Smart
Urban Planning Method addresses the problem of obsolete urban planning design
CHAPTER 1. INTRODUCTION 5
techniques. It does so by meeting the urban needs of citizens (target) through an ICT‐
based citizen‐centered method (solution), collecting data regarding the desired use of
the city (simulation) for establishing the new urban planning design values (initial
parameters).
11..55.. TThheessiiss oovveerrvviieeww aanndd aaddddiittiioonnaall oobbjjeeccttiivveess
The Smart Urban Planning dissertation follows the classical presentation of a scientific
experiment:
1. Introduction
2. Background and state of the art
3. Methodology
4. Applications of the Methodology
4. Results and Discussion
5. Conclusions and Further Research
In addition to describing the experiment through the different chapters,
methodological insights are provided in order to explore further aspects of the Smart
Urban Planning Method. These additional insights and explorations are presented as
subchapters of the Methodology chapter. These insights have a technological nature,
presenting a problem or a difficulty and attempting to provide a technical solution.
Therefore, this thesis has additional sub‐objectives and achievements, which are the
following:
In chapter 2, Background and state of the art, a problem relating to the need for
intelligent indices is presented. In an attempt to solve the problem, we analyze two
ideas for monitoring the Smart Cities initiative in a better way. In developing the first
idea, we study past and on‐going initiatives in the field of Sustainable Cities and Livable
CHAPTER 1. INTRODUCTION 6
Cities and their respective monitoring indicators to demonstrate that not only is a set
of indicators needed for efficient monitoring, but also a final synthetic or aggregative
index to visualize the initiative’s achievements. Specifically, we essay the construction
of synthetic indices using principal component analysis (PCA). The second idea
attempts to anticipate the changes needed, especially with regard to data collection,
to be introduced in current monitoring practices to assess a city’s “smartness”
accurately. We test the use of real‐time data instead of historical statistics as the basic
information with which to construct a set of indicators to explain the initiative. A final
index summarizing Smart Cities’ real‐time set of indicators is presented in the
summary.
In chapter 3, the Methodology of the Smart Urban Planning Method is presented. Our
methodology is based on citizen web‐based surveys regarding urban time use
allocation and opinions concerning how to cover urban needs, and on the use of data
mining tools to process the collected data. The new planning values for urban design
are obtained from an innovative conversion rule which transforms the daily
distribution of urban time use into quantities of urban land use. The opinions of
citizens concerning how to cover their urban needs and associated time use allocation
are used to establish equivalence results, and re‐calibrate and improve current urban
land use.
Also in chapter 3, methodological insights are presented. We propose a more
sophisticated survey which uses adaptive hypermedia techniques to gain voluntary
participation from citizens to ensure good representation of all ages and social groups.
The adaptive hypermedia techniques we propose combine stereotype and feature‐
based models, which we explore in order to include them in the survey. The
combination of stereotype and feature‐based models has different advantages, among
others: stereotype techniques avoid initiating survey profiles from scratch and feature‐
based techniques allow a personalized questionnaire to be employed. Moreover,

CHAPTER 1. INTRODUCTION 7
personalization, in combination with user profiles, allows prediction which is of great
interest for this project due to its planning purposes.
A second insight related to the visualization and representation of the new urban
planning values obtained from the Smart Urban Planning Method is presented. The
new urban planning values are part of the urban information used during the
elaboration of master plans. Urban information is integrated (technically called
“represented”) by statistics, indicators and indices. Urban planning values are
mandatory (in some countries recommended) indicators and/or indices. The overall
set of urban information can be visualized in graphics, maps, Geographic Information
Systems (GIS), 3D images, and simulations. Cities use urban information portfolios for
planning purposes but, unfortunately, these are usually represented separately and
visualized in independent tools. This leads to complex and time‐consuming
information management requirements and data redundancies. To the best of our
knowledge, there have never been any attempts to represent and visualize the urban
information portfolio of a city in a single or unitary piece of software. Our proposal is a
Model which integrates information representation and visualization in urban
planning. The Model is designed to converge, organize, and map all urban information
related to the urban planning activity in a common framework and to depict it in a
simple, understandable way. Additionally, our proposed Model provides customized
updates and gathers available open data and mobile internet anonymous data.
A final insight presenting the problem of participation in urban planning is provided in
chapter 3. An agent‐based collaborative model for more meaningful public
participation in urban planning is presented. The Model is designed to greatly increase
public participation in urban planning and make it more citizen‐friendly, to automate
data collection processes, and to ease the verification of results. We use an agent
technology consisting of a pair of opinion‐miner recommender agents which, through
mining of the opinions of citizens, make recommendations to planners on the design of
the master plan. The advantages of using recommender agent technology in our DSS
CHAPTER 1. INTRODUCTION 8
Model are that it accelerates acceptance of planning proposals and creates more
participatory urban planning. A particularly innovative feature of our Model is that
public participation occurs both before and during the development of the master
plan, and in a citizen‐friendly way. With our Model, planners come up with citizen‐
sensitive proposals and are able to more accurately predict the reaction of citizens to
them. The case of the redesign of the Diagonal Avenue in Barcelona is provided as a
concluding example.
In chapter 4, as an example of further application of the Method, we analyze how rules
for self‐sufficiency classification and sub‐classification of municipalities can be
generated through the land‐uses values obtained with our method. We use the
corrected values of the conversion rule to classify the municipalities into those which
satisfy the needs of citizens and those which do not. To refine the classification, more
data from municipalities is required, which is often unknown. Therefore, we analyze
and discuss how missing data can be treated in this context to enable classification.
In chapter 5, results of the implementation of the Smart Urban Planning Method in the
case study of the Girona area are presented. The outcome is new urban planning
values for urban land uses which are citizens’ satisfaction thresholds for the
corresponding urban activities.
Finally, in chapter 6, conclusions and recommendations for further research are
presented. The conclusions highlight the need for updating urban planning standards
and the value of our ICT‐based citizen‐centered Method, since it is proven to be
successful in the Girona case study. Our novel Method makes it possible to obtain new,
objective, and more accurate design values for urban planning. In addition, it
stimulates and inspires public participation in the urban planning approval process,
changing citizens from passive valuators to active partners and designers. The next
research steps will investigate what needs to be done to integrate the urban planning

CHAPTER 1. INTRODUCTION 9
values obtained with our Method in an Intelligent Index which would monitor the
Smart Cities initiative.

CHAPTER 1. INTRODUCTION 10

CHAPTER 2. BACKGROUND AND STATE OF THE ART 11
22.. BBAACCKKGGRROOUUNNDD AANNDD SSTTAATTEE OOFF TTHHEE AARRTT
Standards and recommended values, as part of indicators and indices in general, are
indispensable, not only as a mechanism to ensure legal compliance with practices such
as urban planning, but also to follow up the evolution of initiatives and actions. Urban
planning standards, as a set of indicators which regulate urban land uses, are part of
Smart Cities measurement. In this chapter we analyze different proposals for indices to
measure and monitor the Smart City. In future developments of our Method, the new
planning values should have the intelligent index features described in this chapter.
22..11.. IInnttrroodduuccttiioonn:: oonn tthhee nneeeedd ffoorr aa ssyynntthheettiicc iinnddeexx ttoo vviissuuaalliizzee
tthhee mmoonniittoorriinngg ooff uurrbbaann ssttrraatteeggiieess
It can be said that urban monitoring started with the Earth Summit of 1992, a pioneer
event in promoting the role of cities on the road to sustainability. Out of the summit
came the so‐called Aalborg Charter, which began the assessment of the sustainability
of cities. By 1995, more than 1,200 cities all over the world had ratified the charter.
The main agreement reached by the signatories was to draw up their own Local
Agenda 21, consisting of a set of indicators to monitor sustainability. From 1995 and
over a period of approximately ten years a number of cities did this. Since 2006,
however, sustainability monitoring has decreased considerably. In our opinion, the lack
of a synthetic index summarizing the overall set of sustainability indicators is the
reason behind LA 21’s failure, a claim which is analyzed in the following section.
Concurrent with the start of the Local Agenda crisis, in 2005, a new set of global
indicators appeared. Quality of Life indicators were proposed as a way of assessing a
city’s livability. The promoter of this new urban monitoring was a private corporation,
Mercer, a human resources and related financial services consultancy, with its
CHAPTER 2. BACKGROUND AND STATE OF THE ART 12
headquarters in New York City. Mercer is the world's largest human resources
consultancy, operating in more than 40 countries. Prior to launching its livability
monitoring indicators and index, the so called Mercer's Quality of Living Reports, the
firm was well‐known for its ranking of cities in terms of cost of living, and its list of the
world’s most expensive cities for expatriate employees. Mercer's quality of life reports
are published on a yearly basis for 221 major cities all over the world. All its surveys
are updated yearly. Besides Mercer’s there is another measure of livability accepted
world‐wide: The Economist Intelligence Unit's quality‐of‐life index. Indicators and the
final index were first calculated in 2005 and included data from 111 countries. Unlike
Mercer’s, The Economist index ranks both countries and cities, making use of Mercer’s
data for cities. The Intelligence Unit is an independent company within The Economist
Group, a world leader in the field of financial information. The unit provides tailored
advisory, management and analysis services to companies. It is known for its e‐
readiness index (concerning the effective use of ICT technologies to boost countries’
economies and welfare provision) and democracy index (a measure of the level of
democracy in both UN and non‐UN countries).
Although both Mercer’s and The Economist‘s sets of indicators and final indices have a
shorter history, they look more promising than local agendas. Both summarize a
combination of subjective life‐satisfaction and objective quality of life indicators in an
aggregated index which makes their well‐known rankings of countries and cities
possible. The need of synthetic indices is not only for comparison matters out of a
certain ranking. In our opinion, in today’s era of information excess it is crucial to
synthesize the large amounts of available information in small but representative
visualizations, and both Mercer’s and The Economist Intelligence Unit seem aware of
that when drawing up their indices. Proof that quality of life indices are successful is
that middle‐sized cities not included in these reports produce their own quality of life
indicators and indices, and the number of them doing so is growing every year. This is
exactly the opposite of what has occurred with local agendas that assess a city’s
CHAPTER 2. BACKGROUND AND STATE OF THE ART 13
sustainability. We take a deeper look at the success story of quality of life indices in the
third section of this chapter.
In recent times the Smart Cities initiative has expanded all over the world. It was
around 2009 when the concept began to be globally understood as the target for any
city to achieve, no matter what its size. The initiative developed out of the previous
experiences of environmentally friendly and livable cities, embracing the concepts of
sustainability and quality of life but with the important and significant addition of
technological and informational components. Reliable indicators do not yet exist to
measure how “intelligent” cities are, and neither does a summarizing index, but
interest in the initiative is growing and it will not be long before the worlds of
academia, business and government start to take notice. Besides the analysis we make
about the use of real‐time data to develop a Smart Cities set of indicators ‐ learning
from the previous experiences of sustainable cities and livable cities ‐ we study the
goodness of the elaboration of a synthetic indicator to summarize a city’s
“intelligence” or “smartness”. In the fourth section of this chapter we explain the
different sources of real‐time data available for developing the latest generation of
indicators for monitoring a city’s smartness. The summary recaps on the need for a
final synthetic index of the Smart City set of indicators, to make it possible to easily
visualize a city’s steps towards “smartness”.
22..22.. LLeeaarrnniinngg ffrroomm tthhee SSuussttaaiinnaabbllee CCiittyy aanndd tthhee pprroobblleemmss wwiitthh
tthhee LLAA 2211 sseett ooff iinnddiiccaattoorrss
Local Agendas 21 were conceived of as a sustainability agenda based in the principles
of urban ecology [42]. From the origins of the sustainability movement, sustainable
development was projected as an activity best generated and most appropriate at a
local scale. This localization of the phenomenon was central to the design of the
CHAPTER 2. BACKGROUND AND STATE OF THE ART 14
agendas [6]. Their local character resulted in their application to not only big and
medium sized cities but also to small towns in non‐developed countries [186]. LA 21s
have a proven capacity to enhance sustainability and the quality of the urban
environment for the benefit of citizens, but the road to sustainability through LAs has
only been in existence for 10 years. In our opinion, the lack of a summarizing indicator
giving information about a city’s overall sustainability level, thereby allowing
comparisons and rankings between cities, has been their big mistake. Since the
beginning, LA 21 contained a standard set of indicators with few variations when it was
applied locally.
CHAPTER 2. BACKGROUND AND STATE OF THE ART 15
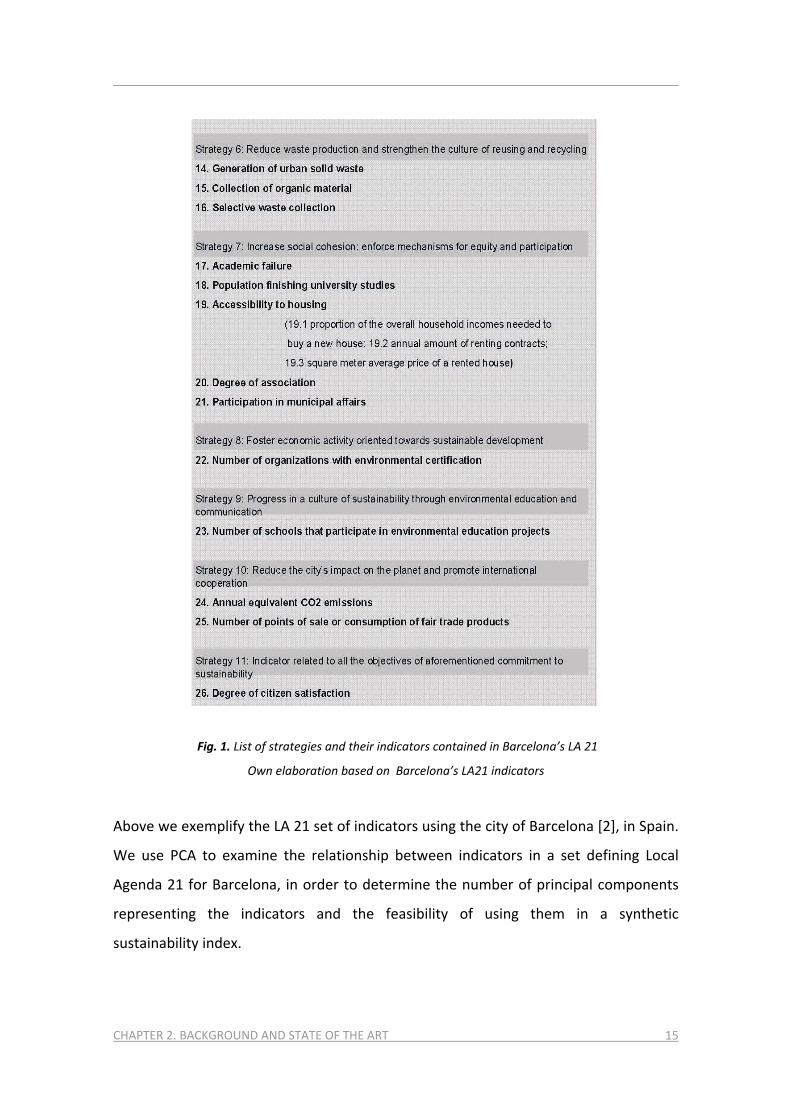
Fig. 1. List of strategies and their indicators contained in Barcelona’s LA 21
Own elaboration based on Barcelona’s LA21 indicators
Above we exemplify the LA 21 set of indicators using the city of Barcelona [2], in Spain.
We use PCA to examine the relationship between indicators in a set defining Local
Agenda 21 for Barcelona, in order to determine the number of principal components
representing the indicators and the feasibility of using them in a synthetic
sustainability index.
CHAPTER 2. BACKGROUND AND STATE OF THE ART 16
Principal component analysis (PCA) has been demonstrated to be a very useful
technique with which to synthesize sets of monitoring indicators. PCA is a
mathematical procedure that uses a linear transformation to convert a set of
correlated variables into a set of linearly uncorrelated variables named principal
components. The number of principal components is less than or equal to the number
of original variables. This transformation is defined in such a way that the first principal
component has the largest possible variance and each succeeding component in turn
has the highest variance possible. A reduction of data dimension can be obtained while
substantial information is retained in the new data set. Stated another way, the ratio
of information comprised in the dimension of the new data set is increased. In addition
to the reduction of dimension, PCA models can be utilized to construct two statistics
frequently used in monitoring processes, the Q‐statistic and the Hotelling’s T2 statistic.
The Q‐statistic corresponds to the non‐modelled, supposedly non‐informative part of
the data set. Therefore, this measure shows the lack of fitness of a (new) observation
for the model. The Hotelling’s T2‐statistic is the squared distance from the projection
of a (new) observation onto the center of the model.
We can find some significant examples in the urban context. Wong [203] uses PCA to
examine the relationships amongst a set of indicators defining Local Economic
Development (LED). Based on a conceptual framework of 11 factors widely perceived
to be the major determinants of local economic development, 29 indicators were
identified to measure these factors. The author, besides examining the structure of
relationships among the LED indicators compiled, used PCA to explore the spatial
patterns emerging from the analysis. A series of multiple regression models were then
calibrated to investigate the relative strengths of relationships between the LED
indicators and suggested performance variables. Still in the area of urban economics
but turning to urban functional analysis, Chen et al. [37] used principal component
analysis, cluster analysis, and location quotient methods to analyze the economies and
industries of cities in the Xinjiang region of China, assessing factors such as urban scale,
growth pole level, specialization sectors and industry gradients. In the field of real

CHAPTER 2. BACKGROUND AND STATE OF THE ART 17
estate economics, Li [112] aimed to solve contradictions between the certainty of fixed
reference land prices at a certain time point and the uncertainty of land price changes,
which lead to difficulties in the application of reference land prices using principal
component analysis to select the main factors affecting land prices.
Focusing more on environmental monitoring, Liu et al. [118] utilized PCA methods to
perform a qualitative and quantitative analysis of the spatial and temporal distribution
of various eco‐environmental factors, in order to determine the main features that
impact on the eco‐environment. Tu and Lin [185] conducted a principal component
analysis using collected data sets of citizens’ perceptions of residential environmental
quality in order to extract the major scales and factors of the residents' assessments.
PCA was performed with the results of a questionnaire consisting of 45 questions
which was administered to 240 residents randomly selected from 80 residential
buildings in residential‐commercial mixed‐use zones. Combining environmental issues
with social monitoring, Takano et al. [176] used PCA to study the associations between
public spaces filled with greenery located near residential areas and easy to walk to,
and the longevity of senior citizens in a densely populated developed megacity.
Examples of PCA can also be used to study urban patterns. Weng et al. [199] analyzed
the spatial patterns of urban land surface temperatures (LST) and examined the factors
contributing to LST variations using PCA, with potential factors being grouped into
different categories. PCA helped to determine the relative importance of each group of
variables within its category. Qi et al. [144] constructed an index on urban land
gradation which considered 12 factors (commercial/services prosperity, road access,
public and external transport convenience, infrastructure, public services,
cultural/sport facility maturity, natural conditions, environmental quality, population
density, industry clustering and urban planning) to finally develop a system consisting
on 35 indicators. PCA helped to analyze the index system on urban land gradation.
Ewing et al. [59] consolidated the variables which define urban sprawl using PCA. The
variables considered were density, land use mix, degree of centering, and street

CHAPTER 2. BACKGROUND AND STATE OF THE ART 18
accessibility. These were then related to other factors such as vehicle ownership,
commute mode choice, commute time, vehicle miles traveled per capita, traffic delay
per capita, traffic fatalities per capita and 8‐hour ozone level, to analyze how the
factors affected the variables and vice versa. The study of the correlations was made
with multiple regression analysis. Finally, Li and Yeh [113] developed a PCA to reduce
errors in multi‐temporal images. Multi‐temporal images are usually used to monitor
urban expansion for change detection, but tend to over‐estimate land use changes
because classification signatures have been inadequately created. The authors
demonstrated that PCA could reduce such errors and provide a more reliable method
for monitoring rapid land use changes and urban expansion.
Similarly to Wong [5] we use PCA to analyze a set of indicators, but then go one step
further by testing to aggregate indicators in a single index. As just seen in the state‐of‐
the‐art of PCA applications, there have been no attempts to use PCA to elaborate a
value summarizing a data set. This is the target of our experiment, as presented
hereafter.
We use data corresponding to the Barcelona Local Agenda 21 set of indicators for 11
years (from 1999 to 2009) to obtain a PCA model. From the original set of 30 indicators
described in figure 1, only 24 have been selected, because of lack of information
regarding the other 6.
Results from our experiment show how the set of indicators is extensively represented
in the first component, accumulating more than 70% of variance. This means that all
the original indicators are highly correlated. For this reason, in our experiment, only
one principal component has been chosen as the proposed LA 21 synthetic index. In a
different experiment, if more than a principal component would be required, the
Hotelling’s T2‐statistic could be use to summarize the information in the proposed
synthetic index.
CHAPTER 2. BACKGROUND AND STATE OF THE ART 19
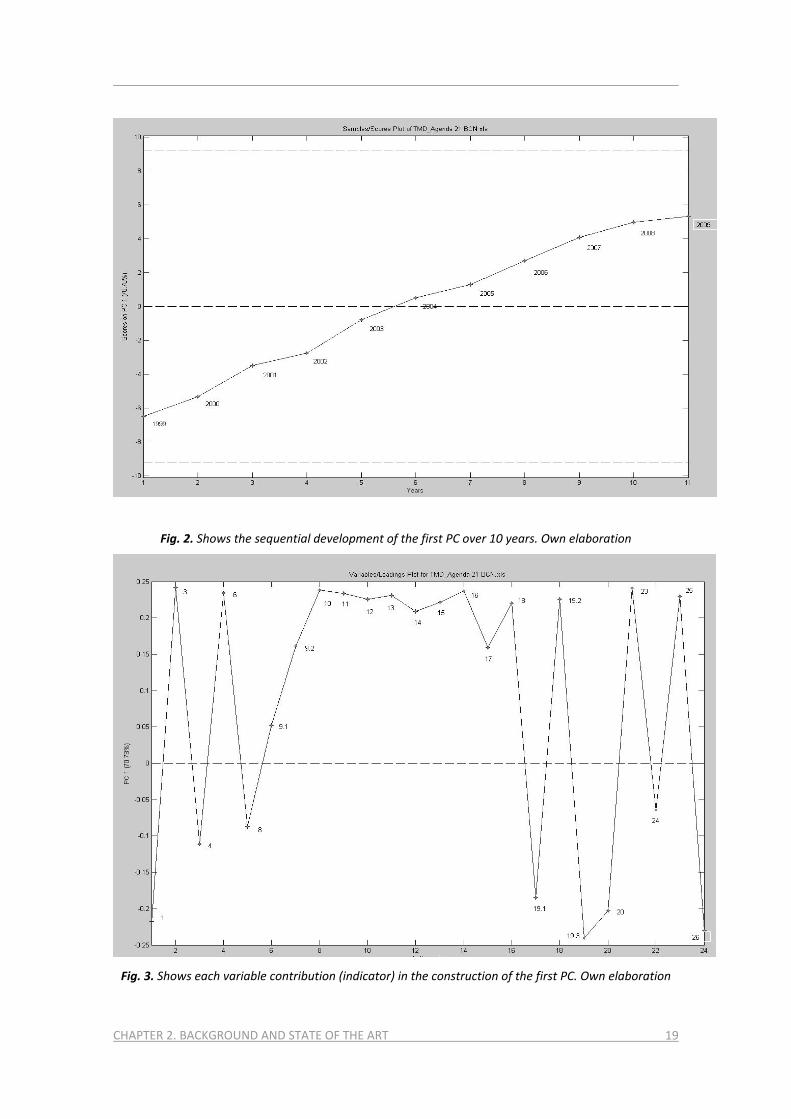
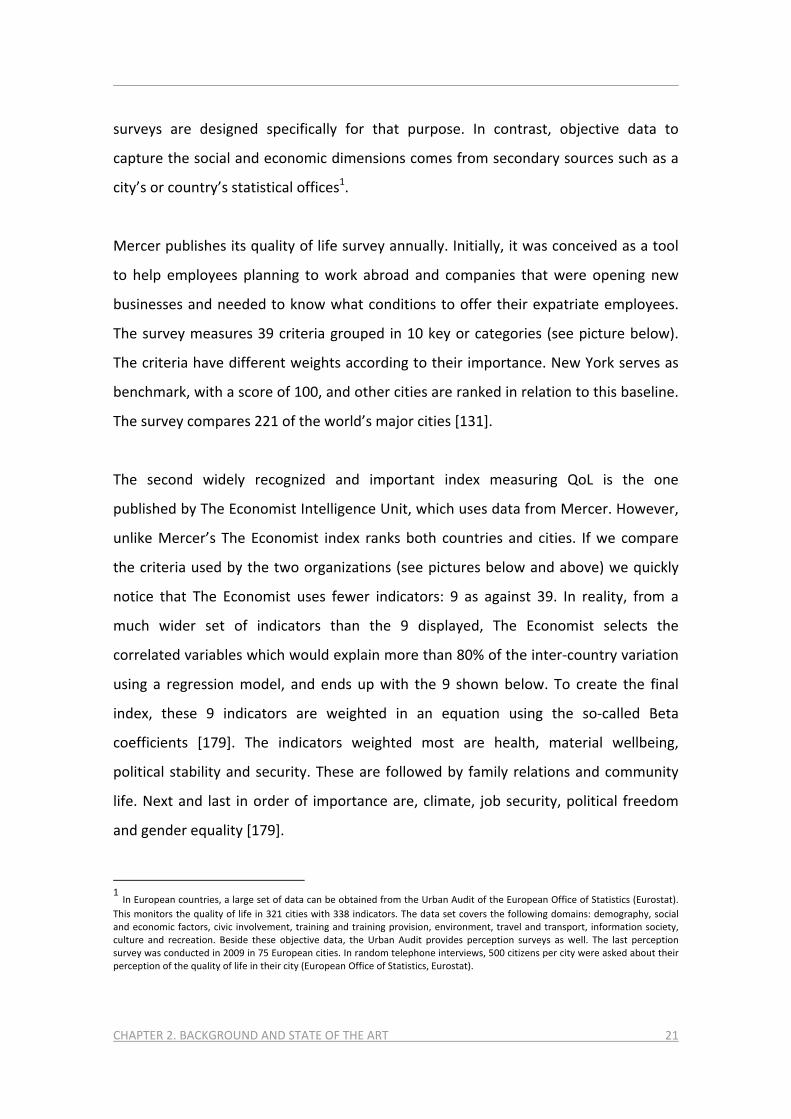
Fig. 2. Shows the sequential development of the first PC over 10 years. Own elaboration
Fig. 3. Shows each variable contribution (indicator) in the construction of the first PC. Own elaboration

CHAPTER 2. BACKGROUND AND STATE OF THE ART 20
The way each original indicator is represented in the new index can be easily observed
by means of the so‐called loadings. In our experiment (see figure 2), it is interesting to
note that a significant number of indicators (14 of 24) have approximately the same
loading. This means that from a statistical point of view, they are highly correlated.
They have similar behavior during the observed period of time, and consequently their
role in the PCA model is also similar. Negative loadings show that the role of some
indicators to the LA 21 synthetic index diverges from the rest.
Finally, figure 3 shows the temporal evolution of the proposed synthetic index (first
principal component) over 11 years (from 1999 to 2009). In our experiment, the first
PC successfully summarizes the set of LA 21 indicators. The LA21 summarizing index
(figure 3) shows us how the city of Barcelona has better compliance with LA 21
objectives every year. For the Barcelona case study, the utility of the proposed LA21
index is demonstrated.
22..33.. LLeeaarrnniinngg ffrroomm tthhee LLiivvaabbllee cciittyy aanndd tthhee ssuucccceessssffuull QQooLL
iinnddeexx
The livable city initiative monitors a city’s welfare and well‐being with a quality of life
(QoL) index. The term quality of life should not be confused with the concept of
standard of living, which is solely related to income. The standard set of QoL indicators
proposed by both Mercer and The Economist Intelligence Unit includes data on wealth,
employment, urban environment, social health, education, time‐use, family and
community services. In both cases, an aggregated index summarizes a QoL set of
indicators. QoL data is collected from two different sources: life‐satisfaction surveys of
citizens, providing a subjective view of a population’s emotional well‐being in various
life domains, and quality of life indicators, an objective evaluation of more socio‐
economic factors. Results of life‐satisfaction surveys are primary data and hence
CHAPTER 2. BACKGROUND AND STATE OF THE ART 21
surveys are designed specifically for that purpose. In contrast, objective data to
capture the social and economic dimensions comes from secondary sources such as a
city’s or country’s statistical offices1.
Mercer publishes its quality of life survey annually. Initially, it was conceived as a tool
to help employees planning to work abroad and companies that were opening new
businesses and needed to know what conditions to offer their expatriate employees.
The survey measures 39 criteria grouped in 10 key or categories (see picture below).
The criteria have different weights according to their importance. New York serves as
benchmark, with a score of 100, and other cities are ranked in relation to this baseline.
The survey compares 221 of the world’s major cities [131].
The second widely recognized and important index measuring QoL is the one
published by The Economist Intelligence Unit, which uses data from Mercer. However,
unlike Mercer’s The Economist index ranks both countries and cities. If we compare
the criteria used by the two organizations (see pictures below and above) we quickly
notice that The Economist uses fewer indicators: 9 as against 39. In reality, from a
much wider set of indicators than the 9 displayed, The Economist selects the
correlated variables which would explain more than 80% of the inter‐country variation
using a regression model, and ends up with the 9 shown below. To create the final
index, these 9 indicators are weighted in an equation using the so‐called Beta
coefficients [179]. The indicators weighted most are health, material wellbeing,
political stability and security. These are followed by family relations and community
life. Next and last in order of importance are, climate, job security, political freedom
and gender equality [179].
1 In European countries, a large set of data can be obtained from the Urban Audit of the European Office of Statistics (Eurostat). This monitors the quality of life in 321 cities with 338 indicators. The data set covers the following domains: demography, social and economic factors, civic involvement, training and training provision, environment, travel and transport, information society, culture and recreation. Beside these objective data, the Urban Audit provides perception surveys as well. The last perception survey was conducted in 2009 in 75 European cities. In random telephone interviews, 500 citizens per city were asked about their perception of the quality of life in their city (European Office of Statistics, Eurostat).

CHAPTER 2. BACKGROUND AND STATE OF THE ART 22
Regarding indicators that were not considered (variables accounting for the remaining
20% of inter‐country variation), these were education level, rate of real GDP growth
and income inequality (the Gini coefficient). The most significant correlation amongst
these variables is between education and overall life‐satisfaction, as education has an
impact on incomes, health and possibly on political freedom [179].
Brief reference should be made to two international journals that publish less well‐
known annual lists of most livable cities. In their lifestyle magazine the media company
Monocle (Monocle, Top Livable Cities ranking) [134] lists the world’s 25 top livable
cities according to criteria similar to that seen in the previous surveys. And,
International Living Magazine, which recommends the best places to retire to, travel
to, buy real estate in and enjoy life, ranks 194 countries yearly according to their
quality of life. To produce its index, the journal uses governmental sources such as the
World Health Organization, United Nations and others like The Economist. Nine
factors, similar to those seen for the previously mentioned indices, are given
weightings: cost of living, culture and leisure, economy, environment, freedom, health,
infrastructure, safety and risk, and climate [87].
There is a growing interest in monitoring quality of life not only for the world’s largest
cities but for others as well, as a way to sell an image and attract new residents and
businesses. Not being rated in the Mercer and Economist lists is not an issue for small
and medium sized cities; it is reasonable to suppose they can demonstrate elsewhere
their quality of life. Local and national governments are behind these efforts. For
instance, the UK Government has drawn up local quality of life indicator guidelines to
support livability monitoring in UK municipalities [188]. Accordingly, cities, Bristol [21]
and even London (although ranked in the QoL surveys already mentioned) [122]
publish their QoL scores in line with the UK government’s proposed indicators [121].
Quality of life indicators are also drawn up at regional level; South Gloucestershire
[170] and Wales [195] or Shropshire [162] county are examples.

CHAPTER 2. BACKGROUND AND STATE OF THE ART 23
In the US, we find QoL indicator guidelines published by universities, such as the
University of Wisconsin’s [189]. As an example of a city publishing the values of QoL
indicators we have Jacksonville (Jacksonville Community Council) [88]. North West
Indiana is an example at regional level [136]. In India, QoL indicator guidelines for cities
have been produced by that country’s government in collaboration with an NGO [84].
Those proposed by the government of New Zealand [135], or by the city‐state of Hong‐
Kong [78], or the Canadian city of Edmonton [53] are further examples of governments
working to disseminate the quality of life of their cities.
The research community has also shown itself to be interested in the subject of quality
of life, for the most part focusing on the study of the monitoring indicators. In general
terms, Senecal and Hamel [160] relate urban quality of life and a city’s sustainability
with a compact model pattern. Still in a general frame, Fahy and Cinneide [60] have
researched QoL criteria to produce an operational framework to assess quality of life in
an urban setting. The same authors [61], in a more focused study, state that subjective
QoL indicators are unlikely to be acceptable or particularly useful unless they are
designed in close consultation with the target populations. The authors defend the use
of community derived quality of life indicators instead of standard life‐satisfaction
surveys. Campanera et al. [31] have researched QoL indicators that would allow better
comparison between urban‐classified and rural‐classified municipalities. Lee [109]
proposes a set of indicators to evaluate the quality of life of urban dwellers with regard
to the semi‐public spaces of high‐rise mixed use housing (HMUH) complexes in order
to help in the design of more livable complexes. Lastly, Galster et al. [66] have studied
the key factors eroding neighborhood quality of life. This study was carried out in US
metropolitan areas. The findings showed that the poverty rate, male unemployment,
the overall adult unemployment rate, the female headship rate for families with
children, and the secondary school drop out rate, were the most important factors in
determining a neighborhood’s quality of life.
CHAPTER 2. BACKGROUND AND STATE OF THE ART 24
Although the efforts of both governments and academia to research and improve QoL
indicators for small and medium‐sized cities are of great value, a synthetic index is
essential to make these efforts both more comparable and easier to assess.
22..44.. TThhee SSmmaarrtt ccoonncceepptt
Mention needs to be made of the close connection between the quality of life concept
and the “transitional initiatives” to the Smart Cities concept. Richard Florida's concept
of the creative city (2002) is a compelling argument about urban development and its
dependency on novel combinations of knowledge and ideas. The concept is based on
the assertion that certain occupations specialize in the creative task. People in these
occupations are drawn to areas providing a high quality of life, and therefore it should
be an essential development strategy for cities to create an environment that attracts
and retains those workers [129].
More or less in parallel with the concept of the creative city appeared the concept of
the digital city (2004) or e‐city, focusing more on the idea of a “connected
community”, combining broadband communications with government open data and
open industry standards as a way to enhance the quality of life of “e‐citizens” [45].
Before going further into the Smart City concept we should mention the knowledge
city concept (2008), with closer connections to specialized education as a key issue for
ensuring a society’s long‐term quality of life. The Knowledge City can be considered a
“bridging initiative” to the Intelligent City [149] or better known Smart City.
Despite its apparent novelty, the concept of Smart Cities was coined back in the early
nineties. In 1993, Gibson, Kozmetsky and Smilor, in their book The Technopolis
Phenomenon ‐ smart cities, fast systems, global networks [72] anticipate a kind of
urban‐tech phenomenon to come that, through a twenty‐first century infrastructure,

CHAPTER 2. BACKGROUND AND STATE OF THE ART 25
would contribute to the enhancement of the quality of life as well as widening the
range of global marketplaces. The authors’ vision was that academia, together with
governments and industry, would present information, ideas, programs and initiatives
in a new manner, much more technological and informed than previously, that would
accelerate the creation of smart cities, fast systems, and global networks. They were
not that wrong. In 1999 we find the earliest application of Smart Cities experiences.
Mahizhnan [124] presents the case of Singapore, whose transformation into an
information economy on the back of information technologies was made necessary by
the island’s lack of natural resources plus the need to reinvent its traditional industrial
economy. Nearly contemporaneously, in 2001, we find the experience of Edinburgh,
where the government made a huge investment in the necessary technological
infrastructure to turn the city into an experimental IT centre, and where the first e‐
Government initiatives took place.
But despite its earlier development, the Smart Cities concept only became widely
known after 2009, and even today it is still a somewhat fuzzy idea. In an attempt to
provide an overall definition of the concept we could say that Smart Cities have
evolved out of livable, creative, digital and knowledge cities, drawing heavily on the
concept of the sustainable city and having in common a large technological
component.
A less conceptual definition would be that the Smart Cities initiative tries to improve
urban performance by using data, information and information technologies (IT) to
provide more efficient services to citizens, to monitor and optimize existing
infrastructure, to increase collaboration among different economic actors and to
encourage innovative business models in both the private and public sectors. Adding
to both definitions, in a more technical description, we could say that cities wishing to
become smart must be equipped with a “brain” (software) supplied with lots of real‐
time information (data collected from sensors) enabling them to take more

CHAPTER 2. BACKGROUND AND STATE OF THE ART 26
sustainable, efficient and citizen‐centered decisions, smoothly transforming decisions
into actions by means of technological solutions.
On the basis of the definitions and the technical description we can anticipate an
important issue with regard to monitoring: a Smart Cities initiative must be monitored
in real‐time in order to asses it properly. Because it seeks to measure cities’ urban
performance on the basis of high IT levels, it can not be monitored with statistics
based on historical data.
The Smart Cities concept’s point of departure is that individuals are permanently
connected with others and with their machines. This hyper‐connection does not only
relate to the common image of users connecting with their smart phone but with their
washing machine, fridge, heating, lights, etc. through sensors in connection with their
smart phones. In technical terms, the connecting network between digital devices and
sensors is given the name Internet of Things (IoT). Each device is equipped with
sensors so that humans and other mechanisms can operate them at a distance. Here,
it is worth mentioning that in today’s cities, people, companies, governments etc.
generate digital data on almost all the urban activities they perform, but it is estimated
that only 5% of the available digital information is currently being used. This hyper‐
connection in society anticipates the idea of the “sensor‐citizen”.
In the Smart Cities context all these technological interconnections are known as
ambient intelligence. Several studies have developed standardized frameworks for its
application to Smart Cities [175]. A similar concept is ubiquitous computing. The
example of South Korean smart cities promotes the development of standard
architecture to integrate both ubiquitous computing and ambient intelligence in green
technologies [110]. The technological possibilities offered by ambient intelligence,
together with ubiquitous connectivity, the fast internet and a dramatic cost reduction
in sensors suggests extremely well monitored cities in the near future.

CHAPTER 2. BACKGROUND AND STATE OF THE ART 27
If we consider these extremely well monitored cities of the future and today’s fast‐
evolving society, which is changing more rapidly than statistics are being updated, we
are forced to the conclusion that we will have to use sources other than historical
statistics to monitor Smart Cities. In our opinion, indicators based on historical
statistical information should be substituted by indicators constructed out of real‐time
data. Smart Cities need “smart indicators”: information extracted from the city, which
duly processed is converted into indicators and returned to the city as monitoring
values.
We have found two Smart Cities monitoring initiatives already in operation, both
producing indicators from historical statistical data.
The first initiative is the European Initiative on Smart Cities, promoted by the European
Commission, or more specifically the Strategic Energy Technologies Information
System (SETIS) [174]. This initiative focuses on achieving more efficient models for
reducing carbon emissions in Europe and, according to our understanding, at least is
therefore more a smart energy than a Smart Cities proposal. Its specific objectives are
to involve the minimum of 5% of the European population in the use of low carbon
emission technologies as well as to reduce by 40% greenhouse gas emissions by 2020
and to spread across Europe best practices in the area of sustainable energy. The
initiative proposes specific actions for buildings, energy networks (heating, cooling and
electricity) and transport, and seeks the participation of 25 large cities (>500,000
inhabitants) and five very large cities (>1,000,000 inhabitants) to commit to
implementing programs in these three sectors. A set of key performance indicators
(KPI) are proposed. For energy networks, these include: meeting 50% of heat and
cooling demand from renewable energy sources (RES), establishing at least 20 pilot
schemes by 2015 for “smart grids” coupled with “smart building” equipment, and
measuring energy consumption with “smart meters” [174].

CHAPTER 2. BACKGROUND AND STATE OF THE ART 28
The second initiative in the field of Smart Cities monitoring comes from academia. A
consortium made up of the Vienna University of Technology, University of Ljubljana
and Delft University of Technology [190] has produced a ranking of European cities
based on an index of “smartness” consisting of 74 indicators in six categories: Smart
Economy, Smart Mobility, Smart Governance, Smart Living, Smart People and Smart
Environment. The ranking is composed of 70 medium‐sized cities with urban
populations of between 100.000 and 500.000 inhabitants with at least one university
and a catchment area of less than 1.500.000 inhabitants (to exclude cities dominated
by a bigger city) [190]. The indicators were created using the previously mentioned
Urban Audit database, produced by the European Statistical Office (Eurostat) [58].
Examples of indicators for the Smart Living category are: number of cultural facilities,
health conditions, individual safety, housing quality, number of educational facilities,
touristic attraction and social cohesion. To compare the different indicators values are
standardized. The method utilized is the z‐transformation in which all indicator values
are transformed into standardized values with a 0 average and a standard deviation of
1. To obtain results at the category level, indicators must be aggregated. In the
aggregation, the indicators’ coverage is considered, weighting indicators according to
coverage. The aggregation is additive, meaning that totals are divided by the number
of values added. No further corrections or weightings are made to produce a city’s
final index of “smartness”.
In the research arena, Cargaliu et al. [32] have also used the EU Urban Audit data set to
analyze the factors determining the performance of Smart Cities. They found that the
presence of a creative class, attention to the urban environment, level of education,
multimodal accessibility and the use of ICTs for public administration are all positively
correlated with urban smartness. More interested in summarizing indices than working
with a set of indicators, Malek [125] studied the suitability of an existing index, the
Informative Global Community Development Index (IGC), for monitoring the Smart
Cities initiative.
CHAPTER 2. BACKGROUND AND STATE OF THE ART 29
We have already stated our view that the monitoring of Smart Cities needs smart
indicators. Smart indicators are obtained from real‐time data. A set of smart indicators
would monitor a city’s technological and information advances, quality of life and
sustainability improvements. To monitor all these aspects of the Smart City, real‐time
physical and non physical data would be needed.
Today’s technology providing the most updated data on cities’ physical recognition is
remote sensing imagery. It would take too long to mention just some relevant
examples of urban pattern recognition for the physical monitoring of cities using
information provided by remote sensing satellites thus there are several successful
experiences in that area of application. In the urban context, remote sensing imagery
has been used not only for pattern recognition but also for building features extraction
and automatic reconstruction; here, we will also avoid having to draw up a long list by
not referring to examples. Instead, we will mention some techniques based on remote
sensing data that make possible a more detailed study of urban pattern changes.
The most traditional methodologies for analyzing settlement patterns on the basis of
remote sensing imagery are principal component analysis (to determine differentiation
patterns), cluster analysis (to determine homogeneity patterns), and regression
analysis (to identify the explicit functional relations between settlement patterns and
their underlying variables). Additionally, Rebelo [146] has studied the use of decision
trees, neural networks and the link between neural networks and the nodes of
decision trees for urban settlements pattern classification. In the field of simulation,
Han et al. [71] aim to predict urban growth by adding cellular automata techniques to
satellite imagery. Also using simulation techniques, Schwarz et al. [157] and Schetcke
[154] have studied the opposite phenomena: urban shrinkage.
When we focus on the more common and accessible applications of satellite imagery
we find, in 2006, the appearance of Google maps. In combination with the GIS tools
that already existed, these changed the way location aware systems worked [178].

CHAPTER 2. BACKGROUND AND STATE OF THE ART 30
Internet mapping left traditional cartographic techniques by the wayside. These had
depended on expensive specific photographic flights which only allowed updates ever
five years, approximately.
Besides the physical urban surface, the non‐physical data obtained from the city needs
to be monitored, and this is even more interesting for the Smart Cities concept. Here
the good news is that even more updated data than that obtained from physical
assessment is possible: the extensively monitored Smart City will provide real‐time
data through its citizens (citizen‐sensor) and organizations (data captured by
companies providing services to the city).
To provide an example of what could be a smart indicator and show its advantages
over parallel information obtained from historical statistical sources, we have studied
the occupancy and utilization of built stocks in two Catalan cities over a 5‐year period.
Data was extracted from the Spanish National Institute of Statistics (Instituto Nacional
de Estadística) [86] and kindly provided by the Spanish energy company, FECSA‐
ENDESA Energia 21 (as an example of data captured by companies providing services
to the city). Data provided by the energy company was partially obtained from the so‐
called smart grids. Smart grids have more powerful monitoring applications than that
of merely providing information about total amounts of energy consumption; they can
even monitor the contribution of renewables to the net.
Smart grids exemplify the concept of producers and energy consumers being in
constant communication in order to achieve a more efficient, profitable and reliable
supply of energy. It is clear, then, that indicators for monitoring smart energy will not
be the number of solar panels installed, for example, but their real‐time contribution
to the energy net.
The figures below compare the latest statistical data available (Spanish Census, 2001)
[86] on the occupation of residential stocks (main residence, holiday residence or
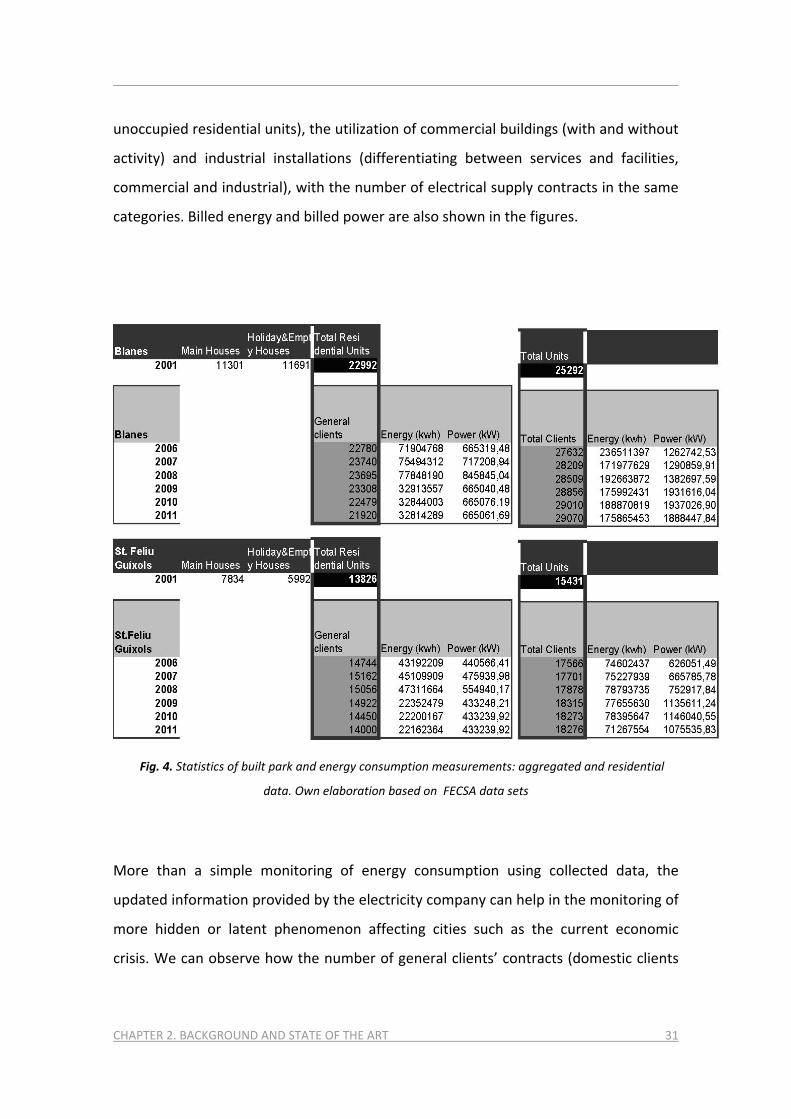
CHAPTER 2. BACKGROUND AND STATE OF THE ART 31
unoccupied residential units), the utilization of commercial buildings (with and without
activity) and industrial installations (differentiating between services and facilities,
commercial and industrial), with the number of electrical supply contracts in the same
categories. Billed energy and billed power are also shown in the figures.
Fig. 4. Statistics of built park and energy consumption measurements: aggregated and residential
data. Own elaboration based on FECSA data sets
More than a simple monitoring of energy consumption using collected data, the
updated information provided by the electricity company can help in the monitoring of
more hidden or latent phenomenon affecting cities such as the current economic
crisis. We can observe how the number of general clients’ contracts (domestic clients

CHAPTER 2. BACKGROUND AND STATE OF THE ART 32
and small businesses up to 15KW of supplied power) and consumption started to
decrease in 2008 in both cities (Fig. 4). But, interestingly, we can observe the opposite
with medium sized businesses and large companies: the number of clients, billed
energy and power rose considerably (Fig. 5). This suggests that the current crisis has
hit families and small businesses particularly hard.
Fig 5. Statistics of built park and energy consumption measurements: industrial and business sectors data.
Own elaboration based on FECSA data sets
Remaining in the area of energy consumption monitoring, a further example of smart
indicators would be the data processed out of so called smart meters. Here, the citizen
collaborates in obtaining data. The Google PowerMeter visualizes individual energy
usage by capturing data from smart meters. Google.org, promoters of the initiative –
currently solely implemented in the US ‐ state that it was designed as a free monitoring
CHAPTER 2. BACKGROUND AND STATE OF THE ART 33
tool to raise awareness about the importance of giving people access to their energy
information. Besides visualization, the tool includes the feature of sharing information
with others through smart phones and the possibility of receiving personalized
recommendations on saving energy. On June 24, 2011, Google announced they were
discontinuing the PowerMeter because manufacturers and their utilities partners were
opening direct access to their energy information services.
22..55.. SSuummmmaarryy
This summary recaps the lessons of previous experiences of city monitoring, the
proposals that came out of what was learnt and their specific application to the Smart
Cities initiative.
Firstly, the need for an aggregated or synthetic index to visualize monitoring results
from a set of indicators has been conclusively demonstrated. Indices, apart from
making comparisons and rank order lists possible, summarize large amounts of data. In
an era of information excess, where information filters and synthesis are essential, an
index summarizing a city’s smartness will unquestionably guarantee an initiative’s
success. Different techniques for obtaining summarizing indices have been shown.
Particularly, we analyze the use of principal component analysis in the example of
Barcelona’s LA21. The experiences of private bodies and academic research have
shown how mathematical models are also a promising technique.
Secondly, we would stress the need for real‐time indicators (what we call smart
indicators) as the appropriate monitoring tool for developing a final smart or
intelligent index. It has been illustrated how historical statistics can be extremely out
of date. The Smart Cities initiative attempts to asses what is happening in the present
in a city in terms of urban IT, quality of life and sustainability. Therefore, there is no
CHAPTER 2. BACKGROUND AND STATE OF THE ART 34
question about the need for real‐time data to illustrate the city’s smartness status. We
showed the possibilities extended by real‐time data with the examples of information
provided by a services company and by citizens through their smart phones, taking the
place of statistical information on the city’s built stock status. Here, the target for the
scientific community is to find different real‐time data sources that correlate with
historical statistics and can take their place.
The basic concept of the Smart Cities initiative can be expressed as follows: the Smart
Cities initiative seeks to improve urban performance by using data, information and
Information Technologies (IT) to provide more efficient services to citizens, to monitor
and optimize existing infrastructure, to increase collaboration between different
economic actors and to encourage innovative business models in both the private and
public sectors. Urban smartness extends to any city aspect, including urban planning.
As mentioned earlier, urban planning design values need an urgent update and
revision. It is the main objective of this dissertation to use urban technologies being
developed in the Smart City context to update and review urban planning standards.
Moreover, taking into account that there have already been examples of successful
collaboration between different actors ‐ citizens, private and public bodies – in the
creation of real‐time data, in the future research of this work, we aim to study the
goodness of data close to real‐time for more frequent updates of the urban planning
design values to better match with the rapidly changing urban needs.

CHAPTER 2. BACKGROUND AND STATE OF THE ART 35

CHAPTER 3. METHODOLOGY. 36
33.. MMEETTHHOODDOOLLOOGGYY
Traditional urban planning methodologies cannot solve the planning challenges that
cities confront today. Citizens’ needs have substantially changed over the last decade,
while urban planning methods have remained the same since the 1970’s. A more
citizen‐centered urban planning method is presented in this chapter. To that end, and
to effectively deal with the larger amounts of citizen data needed for the urban
planning methodological reinvention, interdisciplinary work is supported with ICT
technologies. Particularly, our method is comprised of adaptive hypermedia
techniques, visualization solutions, and agent technology tools. Some other methods
are conceivable, establishing a step forward towards the intelligent toolboxes an urban
planner should have available to support urban planning activity.
33..11.. IInnttrroodduuccttiioonn
To develop the Smart Urban Planning Method, inverse engineering principles are
applied as follows:
The problem of giving a real and accurate answer to citizens’ needs is
tackled through a pioneering algorithm which transforms the urban
time use of citizens into urban land use, obtaining rules of
correspondence and indicators of equivalence between urban time
use distributions and urban land use allocations.
To that end, citizens are questioned on a) their current urban activities during a
twenty‐four hour time period, and b) their desired or ideal scenarios for urban
activities. The rule of correspondence and indicators of equivalence operate with two
sets of values, those obtained from citizens’ real use of the city, and those obtained
from citizens’ desired or ideal use of the city. Thus, the optimal urban land use
CHAPTER 3. METHODOLOGY. 37
allocation which forms the basis for design will be the set of urban land use values
corresponding to citizens’ desired use of their city.
Urban time use surveys are typically oriented towards learning about gender
differences with respect to the use of cities. In addition, the effects of mobility on time
use distribution and how time use affects socialization have been studied. To the best
of our knowledge, there have been no attempts to learn the correlation between
urban time use distribution and urban land use allocation.
There is some interesting research related to urban time use which is relevant for our
study. First, research on time stereotypes based on identifying a typology of latent
“time‐styles” which define the different ways people allocate time to multiple and
sometimes competing daily activities [91]. Second, studies of how time use patterns
can be used by local authorities to increase the involvement of residents in different
urban activities [9]. Third, analysis of whether and in what ways the use of time and
space has changed due to increased access to ICT [191]. And, finally, studies which
classify time use patterns into “maintenance”, “subsistence”, and “leisure” urban
activities [217].
However, although some research has been carried out in the area of urban time use
distribution, our study and method is the first to correlate urban time use distribution
and urban land use allocation.
Urban time use data is obtained by means of a survey of citizens on urban‐time‐use,
which is the main pillar of our Method. The results on urban‐time‐use distribution are
converted into urban‐land‐uses as pioneering methodology for the reinvention of
urban planning. The survey aims to bring more public participation in the urban
planning decision making processes, such as master plan elaboration. Regarding the
social aspects of Smart Cites, public participation together with citizens’ inclusion are
the basis for designing Smart Cities solutions.
CHAPTER 3. METHODOLOGY. 38
33..22.. AA nnoovveell aapppprrooaacchh wwhhiicchh rreeiinnvveennttss ppuubblliicc ppaarrttiicciippaattiioonn iinn
uurrbbaann ppllaannnniinngg:: aann ooppiinniioonn ssuurrvveeyy oonn uurrbbaann ttiimmee uussee ttoo oobbttaaiinn
cciittiizzeenn--cceenntteerreedd ddeessiiggnn vvaalluueess ffoorr mmaasstteerr ppllaannss
We propose that information from citizens form the basis for the design values for
master plans:
Distinct from the traditional urban planning participatory processes,
the proposed opinion survey occurs prior to design of the master
plan. Citizens are surveyed on their real and desired urban activities
during a twenty‐four hour time period, for both working and non‐
working days.
Imported and exported hours of citizens who perform their activities in a municipality
other than their place of residence are considered burdens or benefits to the
corresponding municipalities, and duly accounted for. For example, citizens working in
a city were they do not live place a burden on public services (unless they pay some
additional city taxes), and their working hours are calculated as time which is exported
from their city of residence. It is necessary to keep in mind that the Smart Urban
Planning Method considers the desired use of the city as the simulation providing the
optimal scenario to reinvent the urban planning design values.
Under the current traditional approach, public participation in urban planning
processes fails to generate collective intelligence. It settles for building limited
consensus after the process is underway, instead of gathering data and assessing the
desires of citizens during formulative stages. Indeed, research by J. Carr [33] indicates
that political elites may use public input garnered by planners as a form of “shadow
referendum”, to determine whether any powerful actors might oppose proposed
CHAPTER 3. METHODOLOGY. 39
policies. Xing et al. [207] sustain that lack of official trust in public participation and
limited avenues for expression reduce interest and cause passivity amongst the
citizens.
Practical innovation in public participatory processes is limited to the area of virtual
environments to improve public participation by seeking user immersion [68].
Methods for obtaining user immersion include geographic information systems,
computer aided design, visual support systems, virtual environments, and digital
games. Closer to our study, we find some research on how virtual supports for the
exchange of more visual information between administration and the public can help
in solving long‐standing conflicts and ensure successful implementation of plans [81].
However, there are no previous studies which utilize opinion surveys launched prior to
the urban planning process to achieve more objective planning, and ease the approval
process for master plans through a citizen‐centered approach that promotes
satisfaction. Thus, our study is the first of its kind in this regard.
33..33.. OObbttaaiinniinngg nneeww uurrbbaann ppllaannnniinngg vvaalluueess aanndd cciittiizzeennss’’
ssaattiissffaaccttiioonn tthhrreesshhoollddss
Next, to define the conversion rule between the respondents’ current twenty‐four
hour urban time use distribution for a typical working and non‐working day and the
corresponding urban land use allocation, urban time use is mapped into the
corresponding physical locations. Time use distribution is allocated according to the
physical location of performance, in order to establish the targeted direct correlation
between urban time use and urban land use. Therefore, survey results on urban time
use are expressed according to the following physical urban locations:

CHAPTER 3. METHODOLOGY. 40
• House: Number of hours spent at home
• Work: Number of hours spent at work (including all activities conducted at the work place, such
as time spent in training or at the cantina, etc.)
• Main Facilities: Number of hours spent in a facility which constitutes respondent’s main activity
(equivalent to a university for students or a day‐center for pensioners)
• Secondary Facility: Number of hours spent in a facility other than the one constituting
respondent’s main activity (such as a library, sports facility, learning center, etc.)
• Consumption: Number of hours invested in consumer activities (such as shopping, eating in
restaurants, going to the cinema, etc.) or personal services (going to the hair dresser, visiting a
private doctor, etc.)
• Public Space: Number of hours spent in public spaces (including city squares, parks and
gardens), but not including mere transit
• Public Transport: Number of hours commuting with public transport
• Private Transport: Number of hours commuting with private transport.
• Self‐transport: Number of hours commuting on foot or bicycle
• Outdoors: Number of hours spent in natural surroundings outside of the urban area
(mountains, beaches, rivers, natural parks, walking trails, farms and orchards, etc.)
• Different city: Number of hours spent in a city other than that of residence, performing
activities other than those specified above (visiting friends, weekend stays in a holiday house,
etc.)
Applying the rule of correspondence, we found the indicators of equivalence between
the time spent on each urban activity and its location. The rule of correspondence and
indicators of equivalence were calculated for each municipality, as correlations
between time and land are variable. Rule of correspondence and indicators of
equivalence were calculated for each municipality in which we obtained responses,
and weighted according to the number of responses.
The indicators of equivalence obtained in the current correlation between urban time
use and urban land use serve as a basis for the new urban planning design values.

CHAPTER 3. METHODOLOGY. 41
However, they must be adjusted to account for desired urban time use. Thus, the new
urban planning design values are obtained as follows:
Using the indicators of equivalence obtained for the correspondence
between current time and land use, and knowing the desired time use
distribution, we use correlative equations to obtain the land‐use
allocation corresponding to the desired activities time‐distribution.
Fig. 6. Rule of Correspondence between Urban Time Use and Urban Land Use. New planning values for
optimal urban design are obtained from the desired urban time use and the indicators of equivalence,
current relation between urban time and land use. Own elaboration.

CHAPTER 3. METHODOLOGY. 42
33..44.. IINNSSIIGGHHTT oonn cciittiizzeennss’’ aaddaappttiivvee hhyyppeerrmmeeddiiaa ssuurrvveeyyss
MODELING CITIZENS’ URBAN TIME-USE USING AN ADAPTIVE HYPERMEDIA SURVEY TO OBTAIN AN URBAN PLANNING, CITIZEN-CENTRED, METHODOLOGICAL REINVENTION
Deepening the technological aspects of the survey proposed in our Method,
and in order to obtain more accurate results, the survey would use
hypermedia adaptive systems. Besides presenting it to the citizens in a
friendlier manner, this would permit periodical updates that make the results
more up‐to‐date, thereby approaching the ideal of real‐time data.
This insight aims to explain why a hypermedia survey is chosen as a method
for citizens’ participatory process, how thesis’s hypermedia adaptive survey
on urban time‐use is designed, and how it has begun to be conducted.
Mainly, the steps have been the following:
1. Selection of adaptive hypermedia techniques
2. Consideration of standards
3. User‐group construction
4. Personalization through feature‐based survey
33..44..11.. SSeelleeccttiioonn ooff aaddaappttiivvee hhyyppeerrmmeeddiiaa tteecchhnniiqquueess ffoorr ssuurrvveeyy
ppuurrppoosseess:: sstteerreeoottyyppee aanndd ffeeaattuurree--bbaasseedd mmooddeellss ccoommbbiinnaattiioonn ttoo
ccoolllleecctt cciittiizzeennss’’ iinnffoorrmmaattiioonn oonn tthheeiirr uurrbbaann--ttiimmee--uussee
Adaptive hypermedia (AH) is generally accepted as a crossroads in
hypermedia and user modeling (UM) research [22], [23]; [17], [18]. Adaptive
hypermedia systems (AHS) belong to the class of user‐adaptive software
systems [156]. These technologies allow an individual user of a hypermedia

CHAPTER 3. METHODOLOGY. 43
application to personalize the content and presentation of the application
according to their preferences, objectives and knowledge [140], [147].
Personalization is defined as how an application’s content, navigation and
interface are tailored to match the specific needs of an individual (user
modeling) or a community (group modeling) [30].
User and group models are created through user modeling (UM) and group
modeling (GM) processes in which unobservable information about users is
inferred from observable information from such users [219] by modeling user
interactions with the system for a specific domain concept. A user model, as a
representation of information about an individual user, is essential in order
for an adaptive system to provide an adaptation effect [25]. User interaction
modeling represents and defines the interaction between the user and the
application. The data stored in the interaction model are used to infer user
characteristics with the objective of updating and validating the UM. For this
purpose, this component includes evaluation, adaptation and inference
mechanisms [10], [17]. The domain model represents a set of domain
concepts in which each concept is related with other concepts and represents
a semantic net. The most important function of this model is to provide a
structure for the representation of user domain knowledge (i.e. to store the
estimated level of the user's knowledge for each concept) [10], [17].
In order to better understand the newest AHS applications of our interest ‐
which include information systems, volunteered geographic information and
geodata collection‐, a reference to the earliest and most well‐known AHS
applications is a must. Adaptive educational systems (AES), commonly used in
e‐learning are the first AHS deployments, paving the way of any later
evolution. A typical AES system operates as the following: when a user is
studying content supported by AES (e.g. the meaning of a word) the user can
select the depth of the information displayed by the application by

CHAPTER 3. METHODOLOGY. 44
prioritizing and highlighting the most important information based on the
user’s existing knowledge (such as “expert, intermediate or novice”) thanks
to adaptive navigation techniques such as web‐based mechanisms like “hide,
sort or annotate” details of a piece of information, etc. In AES, user
knowledge is frequently the only user feature being modeled as it is the sole
AES objective.
User knowledge modeling used in AES is similar to a scalar model, where the
level of a user’s knowledge is estimated by rating values using a numerical
scale or by qualitative ranking using a categorical scale. Scalar models,
especially qualitative ones, are quite similar to stereotype models [10] which
are of interest of the research presented in this section as a method to
initiate the public participatory survey proposed here. Stereotype models,
developed by Elaine Rich [148], [147] in the late seventies and extensively
used in early adaptive systems, especially between 1989 and 1994 [77],
attempt to cluster all possible users of an adaptive system into different
groups or stereotypes with one adaptive solution being developed for each
stereotype. What makes scalar models and stereotype models slightly
different is that knowledge assessment in the former is made by the user him
or herself while in the latter the assessment is made by a third party. The
shortcoming of both models is their low level of precision [25] due to the
techniques’ generous averages of what is being modeled.
More recently, in search of more precision, many of the AHS that focus on
advanced user modeling use more elaborated techniques based on user
feature modeling, the so called feature‐based models. Feature‐based
modeling is today’s dominant approach in AHS user modeling, with new
contributions constantly coming from different researchers. Although
feature‐based models have overtaken stereotype models, the latter are
useful for user and group modeling purposes in combination with the former.
CHAPTER 3. METHODOLOGY. 45
One of the most popular combinations is the use of stereotypes to initialize a
feature‐based model [183]. This technique avoids the difficulties presented
by employing user feature modeling from scratch. As we’ll see in the next
section, we utilize this combined technique in our research: a two‐step
approach where feature‐based models help us to elaborate the results of the
participatory process of the previously formed stereotype groups.
An interesting application for us of stereotype and feature‐based techniques
in combination is found in information systems. The AVANTI project [63]
provides a good example. The project aims to develop and evaluate a
distributed information system providing hypermedia information about a
metropolitan area (e.g., public services, transportation, buildings) for a
variety of users with different needs (e.g., tourists, citizens, travel agency
clerks, elderly people, the blind, wheelchair‐bound people, and users with
less serious forms of muscular dystrophy). A stereotype model is constructed
by means of an initial interview that provides the basis for primary
assumptions about the user. This is a valuable source of information for
initially assigning the user to certain user groups, or stereotypes. The final
feature‐based user model will contain explicitly modeled assumptions which
represent the important characteristics of an individual user, like preferences
and interests, domain knowledge, and physical, sensorial, and cognitive
abilities [63].
The AVANTI project demonstrates that stereotype and feature‐based
techniques in combination can be very powerful for distributing information.
Similarly, our research will show how a combination of stereotype and
feature‐based models can be extremely useful not only in distributing
information but also in gathering user information. In our model, users are
citizens who are surveyed using an adaptive hypermedia survey to collect
information about their time‐use distribution to rethink urban planning

CHAPTER 3. METHODOLOGY. 46
methodologies focusing on citizens’ urban needs. To discover these needs
we’ll use the above presented two‐step adaptive survey on citizens’ time‐use
distribution in relation to their urban processes. As mentioned earlier, the
results will be transformed into the amounts of different land types (based on
the land’s different urban uses) needed for citizens’ urban processes to be
performed through a “rule of correspondence” (to elaborate qualitative pairs
between different time‐uses and different types of land use) and “indicators
of equivalence” (to elaborate quantitative correlations between time‐use and
land‐use amounts).
33..44..22.. AAddaappttiivvee HHyyppeerrmmeeddiiaa SSuurrvveeyy oonn UUrrbbaann--TTiimmee--UUssee iiss bbaasseedd
oonn nnoorrmmaalliizzeedd aaddaappttiivvee hhyyppeerrmmeeddiiaa tteecchhnniiqquueess aanndd ddeessiiggnneedd
aaccccoorrddiinngg tthhee eexxiissttiinngg ssttaannddaarrddss ooff aaddaappttaattiioonn
Standardization is very important, not because the main goal of this thesis is
to rethink urban planning standards but because it provides a framework
where to build on further developments of a given topic. We’ll design our
citizens’ participatory process through the survey on urban‐time‐use
capitalizing on the existing standards of adaptive hypermedia techniques.
Recently, adaptive systems, also called personalized systems, have been
developed in many fields other than the educational, such as e‐commerce,
information distribution and e‐scheduling. What all these applications of
adaptive systems have in common is that they are user‐centered and every
user is modeled to obtain the different user profiles. Depending on the field
applied, the user profile will contain different descriptive information (e.g.
personal identification, preferences, habits, etc). From that the system
usually provides user services or information appropriate to the profile [50].
In contrast, user profiles in what we call the “adaptive survey method” help
not to provide but to retrieve user information in an accurate and precise

CHAPTER 3. METHODOLOGY. 47
way. This thesis proposes an “adaptive hypermedia survey model” as a
retrieval information technique in two steps, from a stereotype‐based user
survey to a feature‐based user survey. We will model feature‐based survey
results relating to citizens’ urban time‐use distribution for the urban planning
methodological reinvention.
As has been seen, adaptive educational systems (AES) are older than the rest
of AHS. The educational field can be considered mature in comparison with
other AHS areas (commerce, information systems, scheduling management,
etc.) since certain standards have been already developed and some
organizations are applying different regulations. The “Learning Technology
Standards Committee” (LTSC) and the “Global Learning Consortium” (IMS
Global) are examples of organizations that define specifications and
standards for e‐learning. More specifically, the “Computer Society Standards
Activity Board” of the LTSC has defined data‐centered specifications (such as
P1484 and P1484.2) to simplify interoperability between different systems
and to facilitate the reuse of learning tools and contents [127].
Another standardization initiative is the one promoted by several working
groups (WG, http://www.jtc1sc36.org), where certain specifications (ISO/IEC
JTC1/SC36) in respect of student information exchange between different
systems are defined. Such specifications, called the “IMS Learner Information
Package Information Model”, define data models and the syntax and
semantics describing user characteristics, knowledge and abilities. User
acquisition of knowledge, capacities, aptitudes, personal information,
relations, security parameters, preferences and learning style, performance,
portfolio etc. are also described [127]. In a similar way to IMS, “Public and
Private Information for Learners” (PAPI Learner) standardizes not students’
curricula information (IMS) but their performance [41].

CHAPTER 3. METHODOLOGY. 48
Within the adaptive educational field, various standards and normalized
methods can be found in the area of tools and techniques. It is widely
accepted inside the adaptive hypermedia research community that the first
benchmark technique for adaptive hypermedia applications was a tool called
AHA! [16]. This seminal technique provided a generic architecture that led to
further research in many different directions. A complete list of normalized
methods and tools for adaptive educational purposes can be found at [98].
Amongst these methods, and bearing in mind our adaptive survey design, it is
particularly worth highlighting the AtoL technique [23], [141]. AtoL models
groups of students according to a sequence of answered questions and their
level of correctness, so that educational content can be adjusted to the
students’ learning patterns. As will be seen in the following pages, we’ll
capitalize on this technique when designing survey’s stereotype step by using
a sequence of answered questions, while not taking into account the degree
of correctness but the user’s cognitive skills, in order to better adjust survey’s
feature‐based step.
In contrast with the educational field, in generic adaptive hypermedia
systems there are no regulations or specifications for data exchange and
system interoperability, but standard methods and widely accepted tooling
do exist. A complete list of most recognized methods and tools for AHS design
can be found at Martins Antonio et al. [127]. The previously referenced
AVANTI system is also listed here. On the list, we found two methods of
particular interest in respect of our urban‐time‐use survey design. Both
methods are based on stereotype models, either in terms of initiating a
feature‐based model (as in our case) or taking stereotypes as a single
technique: HYPERTUTOR [95] is a system to describe the user strictly based
on stereotypes. It uses exercises to obtain information about users and
employs stereotypes for user modeling. The user can belong to one of three
groups: novice, medium or expert. INTERBOOK [95] is a tool for authoring and

CHAPTER 3. METHODOLOGY. 49
delivering adaptive electronic textbooks on the web. This AHS initiates a user
model using stereotypes. For the interests of this thesis, we’ll consider
HYPERTUTOR method when forming stereotype groups. INTERBOOK will be
considered as a reference technique to initiate a feature‐based model with
stereotype groups.
Finally, to conclude this review on methods and techniques in whose we build
on, we need to mention what has been standardized and normalized in
generic adaptive hypermedia systems to date. It is widely agreed within the
AHS research community that the adaptive process is divided into three levels
or layers: direct adaptation techniques, adaptation language and adaptation
strategies. This classification is aimed at standardizing adaptation techniques
at the different levels. It therefore works towards exchanging adaptive
techniques between different systems, as well as helping the authors of
adaptive hypermedia by giving them higher‐level handlers of low‐level
adaptation techniques [46]. Direct Adaptation Techniques are the lowest
level of adaptation, including all existing adaptive hypermedia applications:
from adaptive presentation (inserting/ removing fragments, altering
fragments, stretching text, sorting fragments, dimming fragments) to linkage
adaptation techniques (adaptive guidance and adaptive navigation support:
direct guidance, link sorting, link hiding/ removal/ disabling, link annotation,
link generation, map adaptation). For an extended summary, visit Brusilovsky
[23] and Wu [204]. Adaptation Language is the medium level of adaptation.
Here, higher level techniques are grouped into standard adaptation
mechanisms and structures, commonly known as programming language
[46]. Lastly, Adaptation Strategies are the highest level of adaptation. In this
last level, adaptation techniques are based on cognition, modeling the user’s
profile and processing user information. This model is closer to the
Adaptation Strategies as survey’s feature‐based step is based on user’s

CHAPTER 3. METHODOLOGY. 50
cognition level. Therefore, we will consider Adaptation Strategies standard
framework when building up our survey’s feature‐based part.
By using the described existing standards for adaptive hypermedia systems in
the design of both stereotype and feature‐based surveys, we ensure this
model can help other survey projects to build on existing standards as well as
to enlarge the current framework of hypermedia system standards
implementation.
33..44..33.. SStteerreeoottyyppeedd ssuurrvveeyy:: uusseerr ggrroouuppss ccoonnssttrruuccttiioonn
As a first step, a stereotype survey is constructed by means of an initial
interview to citizens which provides the basis for primary assumptions about
the user, and is a valuable source of information for initially assigning the
user to a certain user group or stereotype [63]. The object of this survey is
not to uncover information about urban time‐use but specific details of
citizens’ technological motivation and knowledge, in order to assign them to
more precise stereotype subgroups prior to conducting an adaptive
hypermedia feature‐based survey on time use.
Based on primary assumptions about the user (stereotype groups) and
additional information collected about his/her knowledge of the application
domain (stereotype subgroups), and once the right technique is selected, the
system will be able to draw further inferences in order to create more precise
assumptions about the user (a feature‐based model). For instance, if the user
is a retired person (primary assumption‐stereotype group definition) and they
are familiar with the web because they are used to talking with relatives using
internet telephone systems (user knowledge of application ‐ domain‐
stereotype subgroup definition), this information can be exploded and a

CHAPTER 3. METHODOLOGY. 51
precise feature‐based model designed using clustering techniques, as we will
see in the following section.
Fig 7. F2F Stereotype Survey Questionnaire: Questions for initial stereotypes groups and subgroups
formation and feature‐based survey’s user model profiles construction. Own elaboration.
Although the stereotype survey will focus on retrieving information about a
user’s technological knowledge and motivation in order to better design the
feature‐based survey’s applications and presentation, there will be some
preliminary questions about time‐use in order to collect information for the
feature‐based survey’s content adaptation. The user’s cognition, concision,
explanatory skills, etc. revealed in these basic time‐use questions will be the
CHAPTER 3. METHODOLOGY. 52
basis for constructing the feature‐based survey’s user model. However, it
could happen that a number of user models would be created because a
feature‐based survey needs to adapt survey content to several user profiles.
Let us continue with the example of a retired person (stereotype group)
interested in and knowledgeable about technology (stereotype subgroup).
This person may have good explanatory skills so the use of free‐text, for
example, in the feature‐based survey could be a good option for him/her and
other users with this profile or, what amounts to the same thing, for all users
attached to the same user model. On the other hand, another elderly person
with the same amount of knowledge about and interest in technology could
have no explanatory skills, and here a feature‐based survey would be
conducted with predefined options only, for example. Therefore, as will be
seen shortly, the user model will accumulate all explicitly modeled
assumptions gathered in the early stages of the stereotype phase
representing the significant characteristics of the individual user. In this
model these are age and occupation (initial stereotype group formation),
technological preferences and interests ‐domain knowledge‐ and cognitive
and communicative abilities ‐explanatory skills‐ (for stereotype subgroups
formation and feature‐based survey initiation).
To achieve the above, the stereotype survey is constructed in the following
steps:
1) Stereotype group formation: stereotype groups are formed using age
groups and occupation as first assumptions in a citizen’s profile
2) Stereotype survey design: technological interests and preferences are
surveyed in order to define stereotype subgroups. Basic questions about
time‐use are asked in order to gather information about a user’s cognitive
and communicative abilities, so that accurate user models can be constructed

CHAPTER 3. METHODOLOGY. 53
and used to conduct a feature based survey on time‐use that is as
personalized as possible.
3) Conducting the stereotype survey and data collection: this first survey is
face to face. It is done in the universities participating in the pilot.
Undergraduate students are requested to both take part in and administer
the survey in their immediate context (family, friends, etc). In addition, they
are asked to conduct the survey amongst a representative sample in a
different context (e.g. a family in a different neighborhood). Students gather
all data collected in databases specifically designed to fit with standards of
adaptive hypermedia systems.
4) Data pre‐processing and information extraction: information obtained in
the previous stage cannot be directly processed. Noise and inconsistencies
have to be cleaned. In this phase it is very important to prepare data for
pattern discovery algorithms for feature‐based modeling in the steps that will
follow. Pre‐processed data is pre‐classified. All training items (data) receive a
unique label signifying the class (stereotype group) to which the data
belongs. Given this data, a supervised learning algorithm builds a
characteristic description for each class, covering all its training items. The
process of assigning each training item to a unique class is called pre‐
classification, and supervised learning techniques apply here.
5) Data processing: in contrast to data pre‐classification into pre‐set
stereotypes, the construction of groups of individuals who share the same
technological interests and knowledge (the same characteristics featured in
the former stereotype group) is performed using clustering techniques.
Clustering techniques belong to the group of unsupervised learning methods
which do not require pre‐classification of the training items. The main
difference between these and supervised learning methods is that the
categories (classes) are not known in advance but constructed after the

CHAPTER 3. METHODOLOGY. 54
clustering. When the cohesion of a cluster is high, it means that the training
items in it are very similar and thus define a new class (in our case, stereotype
subgroup definition).
Fig. 8. Stereotype Survey Pilot test: Most common correlations between initial stereotypes groups,
stereotype subgroups and feature‐based survey’s user model profiles obtained in a pilot test.
Own elaboration
A clustering algorithm finds the set of concepts ensuring that: 1) the similarity
between training data of the same concepts is maximized, and 2) the
similarity between training data of different concepts is minimized. In a
CHAPTER 3. METHODOLOGY. 55
clustering algorithm, the key question is how to establish the similarity
between two items in the training data set [64]. Clustering techniques can be
classified into hard clustering and fuzzy clustering. In hard clustering, data are
divided into crisp clusters, where each data point belongs to exactly one
cluster. In fuzzy clustering, the data points can belong to more than one
cluster, and associated with each of the instances is a membership grade that
indicates the degree to which it belongs to each of the different clusters [64].
In this model, stereotype survey results will be clustered using hard clustering
techniques because it is wanted that data belongs to one single cluster for
subgroup formation for the creation of further feature‐based groups. Hard
clustering techniques may be grouped into two categories: hierarchical and
non‐hierarchical [89]. A hierarchical clustering procedure involves the
construction of a hierarchy or tree‐like structure, which is basically a nested
sequence of partitions, while non‐hierarchical or partition procedures result
in a particular number of clusters at a single step [64]. Non‐hierarchal
techniques will be applied in this model to clusters coming out of stereotype
survey results, with the aim being to obtain a specific number of these
clusters.
The main non‐hierarchical clustering techniques are: 1) k‐means clustering
and 2) self‐organizing maps (SOM) [64]. In the k‐means clustering technique
[89] the number of K clusters is given as an input. The algorithm then picks k
items, called seeds, from the training set in an arbitrary way. Then, in every
iteration, each input item is assigned to the most similar seed, and the seed
of each cluster is recalculated to be the centroid of all items assigned to that
seed. This process is repeated until the seed coordinates stabilize [64]. The
SOM algorithm [100], apart from being used in a wide variety of fields, is an
interesting tool for exploratory data analysis, particularly for partitioned
clustering and visualization. It is capable of representing high‐dimensional
data in a low‐dimensional space that preserves the structure of the original

CHAPTER 3. METHODOLOGY. 56
data. SOM’s main advantage, in comparison to k‐means clustering, is that
similar input vectors are mapped to geometrically close winner nodes on the
output map. These are called neighborhood preservations, which have turned
out to be very useful for clustering similar data patterns [64]. The SOM
algorithm has been selected to run stereotype survey results in this model as
it works in one step and gives faster results, as well as being able to map an
illustrative gradient of data distribution within the cluster.
We can find successful examples of SOM algorithm application in adaptive
educational projects for student modeling. In the work named “Student
modeling using principal component analysis of SOM clusters” [107] the SOM
algorithm is applied as a pre‐processor of PCA (principal component analysis).
The authors, Lee and Singh [107], chose the SOM technique as it enables
natural clustering without priori knowledge. SOM quantizes the data set into
clusters, grouping vectors with greater degrees of similarity together, which
facilitates cluster analysis. Furthermore, principal component analysis has
been chosen because it does not require the number of clusters to be
predetermined, as is the case with k‐means clustering. Principal component
analysis relies on the degree of variance to determine the number of clusters.
PCA eigenvalues indicate the strength of the eigenvectors, thus verifying the
number of clusters in the data set [107]. We can also find some examples that
use fuzzy clustering, as in Romero and Ventura [150] Educational Data Mining
review, where the fuzzy technique is chosen to support mobile formative
assessment to help teachers to understand the main factors influencing
learner performance [38]. Fuzzy clustering application examples show that
the technique is mainly chosen for mobile or changing data environments.
In general terms, clustering techniques are used to discover usage clusters
and page clusters [64]. The usage model is a subcomponent of the user model
that contains relevant characteristics of the environment (e.g. terminal
CHAPTER 3. METHODOLOGY. 57
location, user interface characteristics) in order to support a user’s technical
motivation and to provide a convenient usage‐oriented adaptation [63].
Usage clusters aim to establish groups of users exhibiting similar
technological interests and knowledge. Amongst the well‐known and
normalized models for usage clustering, we have paid particular attention to
the Fu model [130]. This model groups different users by taking into account
their behavior and access patterns when using a web server. A complete list
of normalized models for usage clustering can be found at (de Virgilio et al.,
2007). In this model we will use the SOM clustering technique to elaborate
usage clusters within the predefined stereotype groups while considering the
Fu model for usage pattern identification. These usage clusters group profiles
into groups of users that require similar technical adaptations to match their
technological interests and knowledge, which greatly alleviates the
adaptation process [192]. On the other hand, page clusters are not of interest
in this model thus the clustering of pages only reveals groups of pages with
related content, to provide personalized Web content to users in an e‐
commerce environment, for example [64].
In this model, the introduction of a threshold of similarity in the design of
stereotype clusters would be particularly interesting if extreme cluster
situations would exist. As some authors [192] state, a threshold of similarity
avoids situations in which many clusters with few profiles exist or, conversely,
a situation in which a limited number of clusters includes many profiles. In
the former case, the selection of a profile would require an exhaustive
search. In the latter, update operations would become rather inefficient. The
threshold of similarity estimates that a profile can be included in a cluster if
the distance from its root is lower than the threshold of the cluster [192].

CHAPTER 3. METHODOLOGY. 58
33..44..44 FFeeaattuurree--bbaasseedd ssuurrvveeyy:: ppeerrssoonnaalliizzaattiioonn
As stated in the previous section, certain user actions developed in the
stereotype model will be exploited for the acquisition of primary assumptions
to elaborate the feature‐based model. Specifically, we refer to the cognitive
and communicative skills that users have shown in the short questionnaire
about time‐use contained in the stereotype survey.
The feature‐based model’s target is to refine stereotype subgroups already
obtained from usage clusters with the introduction of users’ cognitive and
communicative styles. The model will contain relevant characteristics from
former stereotype groups (e.g. “retired/elderly”) and from stereotype
subgroups (e.g. “internet expert/quite familiar with internet/never used
internet”), and the final introduction of a user’s cognitive and communicative
skills, so that a feature‐based survey on urban time‐use that is personalized
as much as possible can be designed. With that purpose, precise user models
will be set. When feature‐based conditions’ are met, a specific profile will be
activated (or created) in order to classify a certain user. This will mean that
features contained in the feature‐based subgroup become assigned to the
user.
Every user model will need a different adaptation for a personalized feature‐
based survey on time‐use in accordance with the user model to be
conducted. For example, although several users could be classified as “retired
(stereotype group) + internet expert (stereotype subgroup)”, some of them
might have good communication skills that will allow them to give excellent
explanations of how they use their urban time. For these users it makes sense
to activate some kind of free text application in the web‐based survey. Such
adaptation to cognitive style hides a three‐fold implicit adaptation: adaptive
content selection, adaptive navigation support, and adaptive presentation

CHAPTER 3. METHODOLOGY. 59
[24]. When the user is asked for information in the survey the system will
adaptively select and prioritize the most relevant requests according to the
user’s profile. When the user navigates from one item to another, the system
will manipulate the links (for example, “hide, sort, annotate”) in order to
provide adaptive navigation support according to the user’s profile. When the
user gets to a particular page, the system will present its content adaptively
as well as presenting adaptive solutions to interact with the user according to
his/her profile.
It will happen that some user models will provide low‐hypermedia profiles
(e.g. “retired + quite familiar with internet”) or even non‐hypermedia profiles
(e.g. “retired + never used internet”). In the first case, for low‐hypermedia
profiles, blended solutions can be used, similar to the already proven blended
learning (BL) techniques. Blended learning (BL) is becoming an increasingly
popular form of e‐learning, particularly suitable for use in the process of
transition from traditional forms of learning and teaching towards e‐learning
[180], [115], [26]. In this model of teaching and learning, significant numbers
of f2f elements are combined with technology‐mediated teaching [77]. For
non‐hypermedia profiles, f2f solutions or telephone conversations are the
only possible ways of conducting the feature‐based survey in this model.
As in the case of stereotype group construction using clustering techniques,
the key question will be what knowledge needs to be captured in order to
choose the most suitable machine learning technique. Additionally, the
choice of the learning method will depend greatly on the type of training data
to be processed. We already know that the distinction between supervised
and unsupervised methods is the need for training data pre‐classification in
the former case. Unlike in the previous case of usage cluster definition, in the
modeling of a user’s cognitive style categories, or classes, may be known in
advance as they will generically represent standard levels of cognitive skills

CHAPTER 3. METHODOLOGY. 60
(e.g.: “excellent, good, regular, insufficient”). As a result, supervised learning
techniques will apply.
The main supervised learning techniques are decision trees, classification
rules, neural networks, k‐NN and SVM algorithms, all of which are used to
model user behavior [64]. We have selected decision trees as they are
typically used to execute classification tasks. The classification tree will be
used to construct a personalized user model that takes into account levels of
expertise in various areas, cognitive styles, etc. [184], [8]. Due to its ability to
group users with similar characteristics, classification trees can be also used
to implement recommendation tasks [137], [198], [218]. Decision trees go
together with classification rules as the latter are an alternative written
representation of the knowledge obtained from classification trees, which is
in graphical form.
33..44..55.. SSuummmmaarryy ooff tthhee aaddvvaannttaaggeess ooff uussiinngg aaddaappttiivvee hhyyppeerrmmeeddiiaa
tteecchhnniiqquueess ffoorr ssuurrvveeyy ppuurrppoossee
We have presented a two‐step innovative technique to conduct personalized
surveys based on user modeling. The proposed technique can be summarized
as a blending of stereotype and feature‐based models so that the user model
does not have to be initiated from scratch. What makes the mixed technique
and its application to surveys even more interesting is its capacity for
accurate prediction, a feature that is extremely important for urban planning
aims.
Starting with the survey based on data concerning the ages and occupations
(the initial stereotype groups) of a certain population set, and thereafter
obtaining accurate results regarding that population’s urban time‐use thanks

CHAPTER 3. METHODOLOGY. 61
to the feature‐based model, the method allows urban‐time‐use results to be
extrapolated to the non‐surveyed remaining population of a specific city
merely on the basis of knowledge of its citizens’ age and occupation. Age and
occupation are information readily available and collected in periodic
population censuses. In other words, extrapolation functionalities of the
method ‐based on initial user profiles and refined with personalization‐, will
permit to extend survey’s results of a very significant sample to the remaining
of citizens, allowing to represent the whole population of a certain city. This
functionality is extremely important for urban planning purposes as the later
can not be biased, which means completeness when using data to represent
urban features. Since the whole population of the city that needs to be
planned is represented, the method is valid. With this, it is demonstrated that
the blended technique of stereotype and feature‐based models applied to
surveys is an extremely powerful tool. This constitutes an important
functionality in terms of our model’s aim of rethinking urban planning
methodologies based on citizens’ urban needs, using urban time‐use as the
unit of measurement for these needs.
As the prediction possibilities remain to be studied, we have not yet decided
on a specific technique to extrapolate data to a larger set of users rather than
the sample, or which prediction technique to use. If an unsupervised
technique is selected then we will choose association rules. Association rules
capture sets of actions that are causally related. A typical application of
association rules for user modeling UM is the capture of pages that are
accessed together and typically used to implement recommendation tasks
[64]. On the other hand, The k‐NN algorithm and neural networks would be
the most suitable supervised techniques. Neural networks are commonly
used to predict user behavior [163], but as behavior is not to be predicted,
the best technique would be a k‐NN algorithm. K‐NN is a predictive technique
suitable for classification [65]. Unlike other learning techniques in which the
CHAPTER 3. METHODOLOGY. 62
training data are processed to create the model, in k‐NN the training data
represents the model itself [64]. This special feature would make the k‐NN
technique very suitable for this model.
As already mentioned, stereotype and feature‐based blended techniques
applied to surveys introduce a predictive element into the model, allowing
the urban‐time‐use distribution of not only a sample but also the overall
population of a specific city to be surveyed. Stereotype and feature‐based
surveys’ predictive functionalities will allow to plan the dimensions and uses
of city’s spaces as if we would have survey results for each and every citizen.
Besides introducing the predictive element, stereotype and feature‐based
techniques applied to surveys would permit easier updates, since only
samples of different population profiles need to be surveyed. Next, using
extrapolation techniques results can be extended to the overall population.
This functionality moves the survey of the Smart Urban Planning Method
towards real‐time data in urban planning.

CHAPTER 3. METHODOLOGY. 63
33..55.. IINNSSIIGGHHTT oonn vviissuuaalliizzaattiioonn aanndd rreepprreesseennttaattiioonn ttoooollss ttoo
ssuuppppoorrtt ddeecciissiioonn mmaakkiinngg iinn tthhee uurrbbaann ccoonntteexxtt THE NEED FOR INTEGRATED VISUALIZATION AND REPRESENTATION OF URBAN PLANNING DATA
Obtaining new, more objective and citizen‐centered urban planning
standards contributes to city smartness. But we still need much more
progress towards elaborating a set of indicators and a summarizing index
to measure urban intelligence and monitor the Smart Cities initiative.
One of the difficulties already being faced by Smart City experts is that
available indicators, indices and statistics in general are largely historical
information. Another difficulty, presented in this insight, is that urban
information (statistics, indicators and indices) presents serious problems
in its representation and visualization.
This insight aims to deepen understanding of the problems involved in
representation and visualization of urban data. To that end, the following
steps are taken:
‐ First, we review the different problems involved in the visualization and
representation of urban data
‐ A complete description of current urban information representation
(data, statistics, indicators, and indices) is given, including a detailed
discussion of the problems and limitations of present‐day urban
information representation.
‐ We propose the Urban Information Visualization Pyramid to classify
existing urban visualization techniques by making a parallel comparison
with the Urban Data Representation Pyramid. These techniques are
analyzed, and the existing ecosystem of visualization techniques is
discussed.
CHAPTER 3. METHODOLOGY. 64
‐ We propose a Model to deal with efficient and accurate data
representation of all available urban information, and the incorporation
of multiple visualization functionalities in a single tool.
33..55..11.. PPrroobblleemmss wwiitthh tthhee pprreesseennttaattiioonn ooff uurrbbaann iinnffoorrmmaattiioonn
The United Nations Habitat Rolac Report proposes that urban information be
organized in the form of a pyramid, the so called Urban Information
(Representation) Pyramid. This Pyramid is composed of four levels,
depending on the complexity of the information presented (see Figure 9).
At the base of the Pyramid is Data. Data is information that must be digitally
transmitted or processed in order to make it meaningful. It includes both
useful and irrelevant or redundant information. Statistics are the next level in
the Pyramid hierarchy. Statistics are a collection of meaningful quantitative
data which has been analyzed and interpreted. Statistics provide new sets of
numerical data (outputs) which are developed input data. Examples are the
statics of population, households, and unemployment. Further up the
Pyramid we find Indicators, obtained by grouping related statistical values.
For instance, from a combination of economic growth and unemployment
statistics an indicator of the health of the economy can be obtained. Finally,
at the summit of the Pyramid, we find Indices. An Index is a ratio, or a
number which relates two items of information in a proportional manner,
one of them usually a statistic. Indices, as relational proportions, are
expressed in values per capita, per square meter, per household, etc. Since
the top three levels of the Pyramid build upon the information contained in
the immediately inferior level, all information is related.

CHAPTER 3. METHODOLOGY. 65
Fig. 9. Urban Information (Representation). Own elaboration based on
ROLAC report, Pyramid UN‐Habitat
The most common ways to visualize the information in the Pyramid are
graphics and maps, which usually incorporate GIS functionalities. More
complex visualizations such as 3D and simulations are also utilized for
additional purposes such as elaboration. With regard to visualization, the
main constraint of the Urban Information Representation Pyramid is that
different levels of information are treated separately and in independent
tools. This is graphically inefficient and hinders understanding of information.
For representation, information pertaining to the different levels‐ although
related‐ is not cross‐processed or cross‐checked. This causes complex data
management and significant redundancies. Visualizing information from the
different levels of the Pyramid in a single tool, and providing an integrated
visualization of all levels, would promote understanding, solve graphical
inefficiencies, and manage data redundancies.
CHAPTER 3. METHODOLOGY. 66
33..55..22.. UUrrbbaann ddaattaa rreepprreesseennttaattiioonn
In this section we describe the three main levels of the Urban Information
Pyramid. These are Urban Statistics, Urban Indicators, and Urban Indices. All
are used as basic information for urban planning activity. The first or lowest
level of the Pyramid (Urban Data) is not described in this section, since it
refers to plain data which has not been processed to eliminate noise and
inconsistencies.
Urban statistics
The first level of meaningful information is Urban Statistics, which are
obtained by processing and debugging raw urban data. Generally, Urban
Statistics are the responsibility of national governments (hence use of the
term “official statistics”), and are only updated yearly or at even longer
intervals. In Europe, national statistics are based on Eurostat standards and
its classification portfolio. Eurostat is the statistical office of the European
Commission. The Eurostat Urban Audit [55] is a data collection set providing
statistical information and comparable measurements of different aspects of
the quality of urban life in European cities.
Municipal population registers, which are the responsibility of local
authorities, contain the only Urban Statistics which are outside the remit of
national governments. They are always up‐to date, since input and output
population movements are constantly being filed. In addition, national
governments conduct a census every ten years. The census is a broad survey
which serves as a source of information about population, demography,
households, and many other urban, economic, and social factors. Population
figures from the census and municipal registers can diverge considerably.
Generally, registers are considered to be the source because of their more
updated information.

CHAPTER 3. METHODOLOGY. 67
Urban Statistics play a role in various different aspects of urban planning,
such as drawing up master plans and municipal planning reports, and
monitoring urban development. The classical format for presenting urban
statistical information is through graphics. But it can also be visualized in
maps, since such information can be territorialized. Different Computer
Assisted Design (CAD) tools are used for this purpose. A good example of
urban statistics representation is the Spanish Digital Atlas of Urban Areas
(Spanish Ministry of Public Works)[169]. Governments use initiatives like this
to make statistical information more understandable and citizen‐friendly,
within both open data and e‐administration frameworks.
Urban indicators
Like statistics, Urban Indicators, in the form of numerical outcomes after the
grouping of related urban statistical values, are used in urban planning. They
are taken into account when master plans are drawn up, and also in the
context of municipal planning reports, monitoring urban development, etc.
Indicators, as statistical compilations, are also collected by national
governments. In Europe, like statistics, they are based on EU standards such
as the EU Sustainable Development Strategy (EU‐SDS), an initiative to develop
a system of common indicators to evaluate sustainability. A major EU
initiative to establish a framework for spatial information to support
environmental policies is the INSPIRE directive [56]. This directive addresses
34 spatial data themes containing a number of indicators to measure the
environmental impact of human activity. INSPIRE includes recommendations
to Member States and technical implementing rules for environmental
assessments (EU Commission).
Like statistics, indicators are frequently mapped, especially since the use of
geographical information systems (GIS) became widespread. Although GIS
CHAPTER 3. METHODOLOGY. 68
utilization in urban planning is described in the next section, it is useful to
provide a few brief definitions here. While CAD tools offer the user no
functionality beyond their display mode, GIS – which are underpinned in CAD
support ‐ enable users to perform spatial queries about what is contained in
the graphical model. Basically, GIS link maps to databases (in our case, an
indicators database). Queries are designed by the GIS programmer, so the
user can only see a display of those which are pre‐arranged. Because
indicators are more complex statistical information than statistics
themselves, their visualization tends to be expressed in GIS systems. As with
statistics, there are exceptions. Indicators are sometimes displayed in CAD
maps, and statistics are sometimes offered in GIS support. The Spanish Urban
Information System (UIS) [85] provides a good example of indicators
displayed in GIS support. The user can pre‐select queries about a specific
municipality, region, or even the entire nation. Results are reported
numerically (in a PDF file) and graphically (on the map).
Many countries besides Spain have developed a national UIS (NUIS) which
gathers urban indicators. We find a significant example in India [83], whose
NUIS is the responsibility of the Space Department, since the application is
based on remote sensing. As we will see in Section 3, GIS are nourished by
cartography, raster images and satellite data. This explains why, in some
cases, space departments are in charge of NUIS hosting and maintenance. A
good example of a municipal UIS is found in Berlin (Berlin Municipality) [11].
In this case, the UIS is larger and incorporates environmental information.
Information Systems (IS) started to take off in the early 1970s. In the
beginning many IS projects failed, because the systems being analyzed
(especially urban ones) were too complex. In the 1980s GIS appeared on the
market, but it was not until the 1990s that public administrations started
using them. GIS and UIS shared a learning phase during the 1990s and

CHAPTER 3. METHODOLOGY. 69
supported each other. GIS provided UIS with the spatial interface needed to
deal with the complexity of systems, since UIS were the most challenging
support with which to test GIS functionalities. Now, both techniques are quite
mature, working together or separately.
Urban indices
Like the main Urban Indicators, which are universally standardized under the
UIS umbrella, most important Urban Indices are collected by an international
standard framework, the so called Local Agenda 21 (LA21). The term 'local'
refers to its application domain, which is municipal. LA21 contains indices
which are mostly expressed in values per capita or square meter.
Nevertheless, LA21 can also contain some indicators. It is worth noting here
that indices are sometimes misnamed as indicators and vice versa, not only in
the context of the Urban Information Pyramid, but in many other fields.
Local Agenda 21 represents the commitment of a city to sustainability, from
both the urban and environmental perspectives. In 1995, more than 1200
cities ratified the Aalborg Charter, which gave great impetus to LA21 in the
European sphere. It had first been made public at the 1992 Earth Summit, a
pioneer event in promoting the role of cities along the road to sustainability.
As part of their support for the Charter, affiliated cities started creating
specific working groups to design and implement its agenda in their
respective cities. Agendas started with a diagnosis in line with the critical
aspects of cities agreed in the Charter. This diagnosis was mainly based on
and monitored with indices and indicators.
LA urban indices are typically grouped according to different urban strategies:
in defense of quality of life in the compact city, conservation of natural
resources and the use of renewable energy, social cohesion and public

CHAPTER 3. METHODOLOGY. 70
participation. Agendas also usually include a final index on overall satisfaction
with the city.
Other significant indices referred to environmental issues. To support the
policy objective of a healthy city, indices like noise pollution, air quality,
beaches or river water quality, and annual equivalent of CO2 emissions were
included. In support of policies oriented towards sustainable development,
we find indices such as the number of organizations with environmental
certification, schools participating in environmental education projects, and
the number of sales points for fair trade products. Unlike statistics and
indicators, urban indices – mainly coming from LA21‐ were presented in the
form of graphics, charts and diagrams. A representative example of an LA21
presentation is Tameside Metropolitan Borough’s preparatory survey, which
included guidelines for calculating sustainability indicators.
We have used the past tense when referring to LA21s because they are no
longer in widespread use. Their heyday was between 1995 and 2005, when
many cities around the world designed and implemented their agendas. After
that time, only in limited cases were indices and indicators updated, since in
most cases their information had become redundant. If we analyze the more
environmental aspects of LA21s, we see that they are close to being an
environmental audit. Municipalities regularly carry out environmental audits,
since these are mandatory for urban planning actions. With respect to the
urban side, LA21s express existing urban statistical information in values per
capita or other proportional measures, and only tell us what we already
know. This explains why they have fallen out of favor. In other words, what
an LA21 does is express known urban statistical information in the shape of
rate. It is interesting to note that the LA21 crisis (from 2005 on) coincided
with the widespread adoption of UIS by local administrations. The
coexistence of LA21 and UIS in a given municipality would lead to information

CHAPTER 3. METHODOLOGY. 71
redundancy. It is not surprising, therefore, that municipalities abandoned
LA21s in order to save scarce public resources. The story of the lack of
success of local agendas opens the discussion on which our proposal is based.
We often find redundant urban information from agendas, statistics, and
indicators that tells us the same thing but in a different format.
33..55..33.. UUrrbbaann iinnffoorrmmaattiioonn vviissuuaalliizzaattiioonn
Urban information visualization has become an emerging focus of research in
the visualization community. Research has focused on the geometric aspects
of the problem, with emphasis on the development of schemes to exchange
data between information databases and optimize engines for visualization,
navigation, and manipulation. In this section, we review the state‐of‐the art
of urban information visualization, the tooling that helps visualize the levels
of an Urban Information Representation Pyramid described in the previous
section. The state‐of‐the‐art will be presented and organized by means of a
classification pyramid, the Urban Information Visualization Pyramid. The
proposed visualization Pyramid makes it possible to establish correlations
between visualization techniques and representation levels. These
correlations are the basis of our proposed Model and will be explained below.
Over the years, different visualization techniques have been proposed to
display the information contained in the levels of the Urban Information
Representation Pyramid. But the existing techniques limit visualization to
information levels on a separate basis. Therefore, as in urban data
representation, methods and techniques for urban visualization can be
classified in the shape of a pyramid according to their functionalities (Figure
10). As far as we know, the proposed Urban Information Visualization
Pyramid is a novel proposal for classification of software for urban
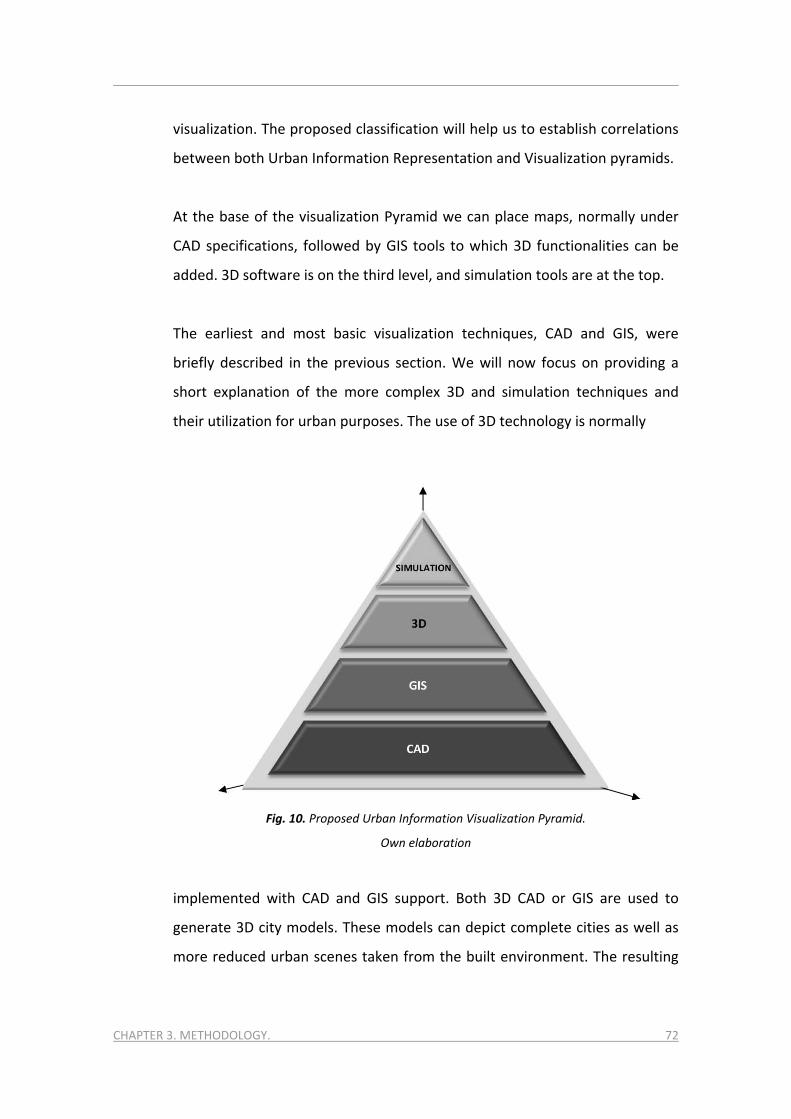
CHAPTER 3. METHODOLOGY. 72
visualization. The proposed classification will help us to establish correlations
between both Urban Information Representation and Visualization pyramids.
At the base of the visualization Pyramid we can place maps, normally under
CAD specifications, followed by GIS tools to which 3D functionalities can be
added. 3D software is on the third level, and simulation tools are at the top.
The earliest and most basic visualization techniques, CAD and GIS, were
briefly described in the previous section. We will now focus on providing a
short explanation of the more complex 3D and simulation techniques and
their utilization for urban purposes. The use of 3D technology is normally
Fig. 10. Proposed Urban Information Visualization Pyramid.
Own elaboration
implemented with CAD and GIS support. Both 3D CAD or GIS are used to
generate 3D city models. These models can depict complete cities as well as
more reduced urban scenes taken from the built environment. The resulting

CHAPTER 3. METHODOLOGY. 73
image is called a render. The level of detail of a render will vary according to
the urban scale of what is being represented, but it has no other functionality
beyond display. For more complex functionalities, we have to move to a
combination of 3D and GIS. With such a combination the 3D model can
display answers to queries, using its linkage to the GIS spatially referenced
database. More interactive 3D CAD and GIS models include navigation
capabilities.
Although simulations can be represented in 2D, 3D techniques have normally
been used since their widespread introduction. An urban 3D simulation
model is similar to any other urban 3D model in terms of display results, since
in both cases virtual representations are made. The main difference is that a
3D simulation model represents an urban situation that doesn’t exist, either
because it is a future scenario or because it is an alternative to reality.
Therefore, simulation models are mainly used for testing.
Many urban visualization models today are three‐dimensional, but there is a
trend towards real‐time presentation of large models. Models to visualize
urban environments have many uses, from urban planning to new building
work pre‐visualization to utilities service planning.
As indicated, in this section we review the state‐of‐the‐art of the most
common and widespread techniques for urban data visualization. In contrast
to the Urban Information Representation Pyramid, techniques composing the
visualization Pyramid cannot be segmented into levels. This is because the
visualization of urban information usually requires more than one of the
techniques described, very often in combination with GIS. Therefore, and
unlike in the previous section on urban data representation, the following
review of information visualization in the urban field is organized according to
CHAPTER 3. METHODOLOGY. 74
purpose or functionality of the technique. We can distinguish six functional
groups:
I. Tools and techniques for visualization of data retrieval, data
classification and data integration;
II. Thematic map visualization;
III. Modeling;
IV. Virtual models, simulations, and augmented reality;
V. Visualization for monitoring: and
VI. Simplified and collaborative visualization for participative ends.
In the first group (I) we find various examples of the technique for
visualization of data classification. One relevant model combines building
footprints and LiDAR (Light Detection and Ranging) to visualize an urban area.
It emphasizes buildings in a GIS environment, with the main objective being
to develop and fix a vector model suitable for classifying urban constructions
[3]. In the area of data retrieval visualization, Yiakoumettis at al. [212] have
developed an application for automatic navigation into geo‐referenced
scenes, adopting the Google Earth API (Application Programming Interface) to
retrieve and visualize data in GIS. Still with data retrieval, Hetherington, R et
al. [74] have constructed a model for the embodiment, extraction,
processing, and display of data from X3D (eXtensible 3 Dimensions)
architectural models, to obtain descriptive information about urban
development. In the field of data integration, the Building Data Integration
System (BDIS) developed by Wang, H et al. [196] attempts to create a
multidimensional system to be used in the UIS of the future. It allows
multidimensional information integration, especially of 3D models. It is also
worth considering collaborative spatial decision‐making based on real‐time
data sharing with coordinated data access and synchronization between
multiple geographical and dispersed participants [201]. This implemented

CHAPTER 3. METHODOLOGY. 75
hypermedia concepts and visualization tools such as the Dynamic
Visualization System (DVS), which dynamically hyperlinks to web map servers,
and the GeoConference, a commercial real‐time Internet‐based geospatial
collaborative conference system.
In the visualization of thematic maps (II), Petrovic [142] demonstrates the
possibilities of 3D thematic maps for spatial planning. They include
segmented representations of the current landscape, representations for
layered spatial analysis, and visualizations of a specific layer of the planning
area. In the more specific field of vegetation thematic maps, El‐Mezouar at al.
[54] have looked at a new index to generate high‐resolution maps for IKONOS
imagery. The Normalized Difference Vegetation Index (NDVI) is the most
popular approach for generating vegetation maps by remote sensing imagery.
The proposed new index attempts to turn NDVI low resolution vegetation
into High Resolution maps (HRNDVI). Moller [132] is developing a method for
the automated analysis of vegetated areas, and especially vegetated roof‐
tops in the inner city, using multispectral and extremely high resolution
imagery. Methods for visualizing geological urban risks through maps also
exist [29]. Mardaljevic and Rylatt [126] have introduced an approach to
evaluate total annual or monthly irradiation incidence on building facades,
with results presented in render images. Wolff et Asche [202] have developed
a method for 3D GIS geospatial crime scene analysis, which allows the
correlations between urban features and robbery offences to be examined.
Some of these correlations link pedestrian frequency with facilities such as
schools, banks, etc. Crime control is becoming an important issue in urban
planning, and this kind of research is therefore attracting great interest.
Finally, Brennan‐Horley [20] use the visualization of mental maps for planning
purposes. Interviews with people in the creative industries were conducted,
and the results accumulated in a GIS for visualization and analysis. Collation
of the different mental maps of the subjects surveyed revealed the opinions

CHAPTER 3. METHODOLOGY. 76
of “creative citizens’” concerning their city. Mental maps are attracting
increasing interest, since they can be drafted in several thematic fields.
Turning now to the modeling techniques group (III), Pinnel et al. [143] have
developed UrbanView, a visualization system for urban modeling. Zhou et al.
[216] have developed a way to integrate GIS with multitier web applications
for creating 3D city models. Web applications support a digital building
model, a digital terrain model, large‐scale true urban orthoimages, and actual
building sidewall pictures. Kim et al. [96] propose 3D GIS software for
automatic modeling of 3D geo‐features, which they call Rule‐Based Modeling
(RBD) models with 3D geo‐features using 2D profiles and 3D feature
attributes. Lai et al. [104] have studied the scope of 3D visualization for
Environmental Impact Assessment (EIA) in urban planning. They conclude
that 3D representations have a good future in EIA, due to their accurate
depiction of the natural world.
In the visualization of urban virtual models (IV) Dong et al. [48] have
developed a new method for modeling overground and underground entities
and spatial analysis, also using Virtual Reality technology (VR). The new
method can construct a virtual urban geological environment, provide
integrated modeling of overground and underground entities, and facilitate
interactive research functions. Serrao et al. [161] have developed a software
architecture based on a geographical database which supports storage,
recovery, and real‐time visualization of urban virtual models. The
contribution of Yao et al. [210] is a virtual reality urban planning tool based
on GIS and virtual environments which generates scenarios and collaborative
urban designs. The system provides an open structure for various
visualization and simulation modules for prototyping urban designs. Lange
[105] has studied the degree of realism of virtual 3D‐visualizations. He claims
that validation of simulations of virtual urban landscapes ‐ in terms of their
CHAPTER 3. METHODOLOGY. 77
degree of realism (R'Degree) ‐ has until now been neglected in the
visualization research arena. Lange focuses on how and to what degree
photographed real landscapes can be validly represented by means of virtual
landscapes.
Remaining with this group (IV) but focusing on the simulation field, Birkin et
al. [12] illustrate how open source spatial simulation models can be calibrated
with crowd‐sourced data. They provide some examples to illustrate this novel
procedure, which is extremely credible due to its use of social networking
mechanisms. The work of Schmidt et al. [155] is in traffic simulation. The
SIMTRAP project is an integrated system of traffic flow information, air
pollution modeling, and decision support, with interpretation and
visualization results displayed in 3D GIS. Finally, in the augmented reality
field, we need to highlight the work of White and Feiner [200] on how
augmented reality techniques can be applied to arrangements for site visits
(for data collection, discovery, comparison, manipulation, and provenance).
The site visit, as a preparatory step, is very important for urban planning.
In the area of visualization for monitoring purposes (V), Bogorny et al. [15]
have developed a software architecture for semantic trajectory data mining
which offers a sequence of spatio‐temporal points with data analysis. Chittaro
et al. [40] have developed a tool for the visual analysis of navigation patterns
of moving entities, such as users, virtual characters, or vehicles in 3D Virtual
Environments (VEs). Zheng and Shi [215] have worked in virtual reality to
create a cyberspace of a real urban area which can be entered via the
internet, enabling visitors to travel around and find their location in
cyberspace. Ibrahim and Noor [82] have researched how to enhance
information legibility in an information visualization context to assist users in
determining optimal travel routes and trajectories.

CHAPTER 3. METHODOLOGY. 78
Lastly, and in the arena of simplified and collaborative visualization
techniques for participative ends (VI), Yao et al. [211] have developed a
virtual reality prototype to support collaborative urban planning. The
prototype is a workspace that comprises a variety of technologies, from a
semi‐immersive stereo display to optical tracking systems. Using semantic
web technology, Hoekstra et al. [76] have come up with what they call the
“Legal Atlas”. The goal is to help citizens understand spatial legal constraints
in an urban context. The tool presents legal norms on a map with a very
intuitive visualization of their scope. Wu et al. [205] have developed a highly
distributed system accessible from the internet to promote participation in
urban planning. End users (citizens) can select any of the available urban
planning solutions for visual investigation, and compare and contrast them
with a specific planning proposal. Coors et al. [43] present a new approach to
tangible interaction with rear‐projection tables that use physical, "active"
pieces which are easy to build and track. Active pieces are used to interact
with 3D‐GIS and support three‐dimensional queries, in addition to
photorealistic visualization. Coutinho et al. [44] have prepared a 3D
environment to assemble customized repositories of geographic information
about a region. The system links the repository with collections of documents
gathered from the World Wide Web or other specialized information sources,
and monitor events that might affect decisions made on the basis of this rich
information set.
Some important findings emerge from this review of how visualization
software is used in the urban field: there are no applications which help with
the visualization of urban planning itself. Amongst all the applications
classified in the six functional groups, none helps construct and understand a
master plan in a more visual way. During research outside the scope of this
work, we took a deeper look at the groups which offered greater potential for
finding such an application, but found nothing for visualization of data

CHAPTER 3. METHODOLOGY. 79
retrieval, data classification, and data integration (I), or simplified and
collaborative visualization for participative ends (VI). (We have seen how
applications classified in groups (II) to (V) mainly focus on visualizing certain
aspects of existing or virtual cities, not related to urban planning). The fact
that no tool exists to help urban planning visualization is the second
justification for proposing the software Model.
This state‐of‐the‐art in visualization techniques for urban purposes clearly
shows the need for all information levels of the Pyramid to be visualized in a
single tool. The Model proposed below, although this single tool, allows
visualizing large data sets pertaining to different urban information levels and
from different sources, using a combination of different visualization
techniques.
33..55..44.. MMooddeell ffoorr iinntteeggrraatteedd uurrbbaann iinnffoorrmmaattiioonn rreepprreesseennttaattiioonn aanndd
vviissuuaalliizzaattiioonn
We previously mentioned the issue of data redundancy in urban information.
We also noted that Local Agenda 21 is nowadays dispensable due to the
duplication of the information it provides in urban statistics and indicators
such as the Urban Information Systems (UIS). Recapping the section on
information visualization, we found that there are no effective applications
which help urban planning visualization itself, or which offer a choice of
visualization functionalities in accordance with the information that needs to
be presented. Therefore, there is a clear need for tooling which accurately
processes multiple urban information from different sources needed for
urban planning activity, while helping and enhancing its visual interpretation.
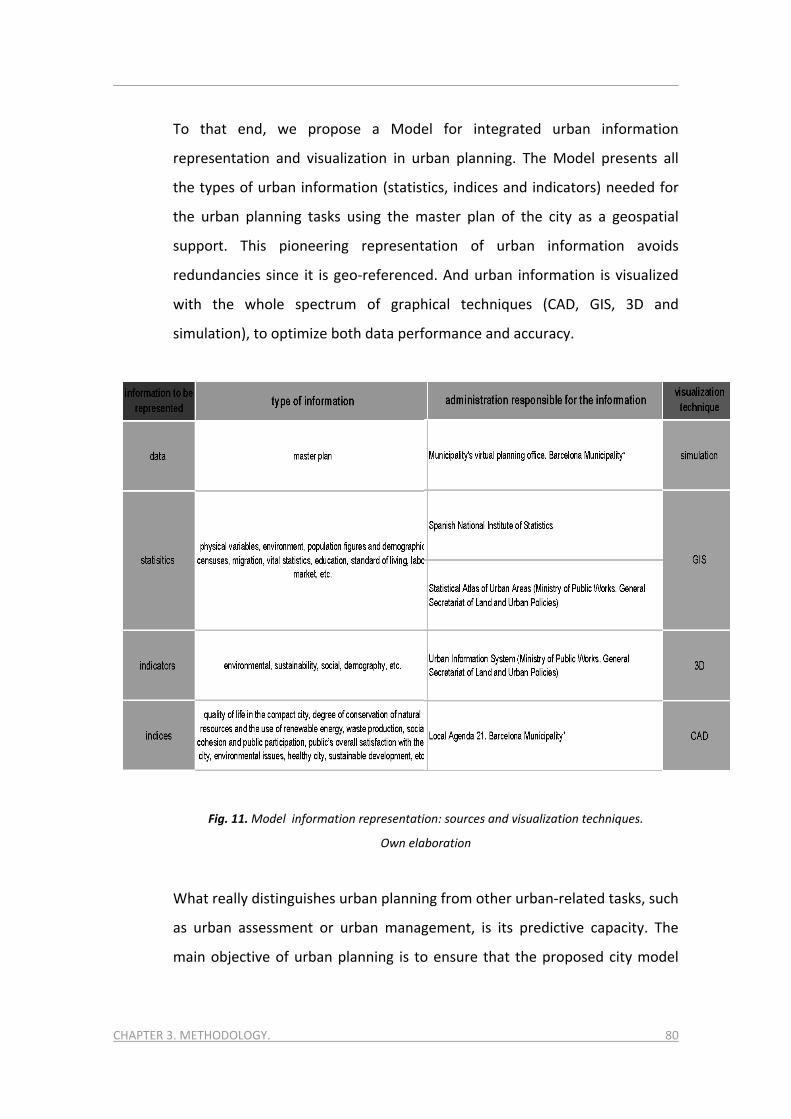
CHAPTER 3. METHODOLOGY. 80
To that end, we propose a Model for integrated urban information
representation and visualization in urban planning. The Model presents all
the types of urban information (statistics, indices and indicators) needed for
the urban planning tasks using the master plan of the city as a geospatial
support. This pioneering representation of urban information avoids
redundancies since it is geo‐referenced. And urban information is visualized
with the whole spectrum of graphical techniques (CAD, GIS, 3D and
simulation), to optimize both data performance and accuracy.
Fig. 11. Model information representation: sources and visualization techniques.
Own elaboration
What really distinguishes urban planning from other urban‐related tasks, such
as urban assessment or urban management, is its predictive capacity. The
main objective of urban planning is to ensure that the proposed city model

CHAPTER 3. METHODOLOGY. 81
will fulfill the needs of citizens in a time‐horizon of 20 years. To that end,
demographic and economic projections are employed, forming the back‐bone
of the proposals made by master plans. Therefore, data from projections is
collected on the Model, at the levels of statistics and indicators and how
projections are represented. In addition to this basic information for urban
planning, the Model also collects the whole spectrum of available urban
information, from statistics to indices.
To construct the Model database, the user introduces all the desired
information, statistics, indicators, and indices from their original source. The
Model disaggregates complex statistical information – indicators and indices
– into plain statistics. After a debugging process to eliminate redundancies,
processed information is systematized to unify units of measurement and
indicators, and statistics are rebuilt. As an example, Figure 12 shows the most
common sources of information that can be used to obtain urban information
for the city of Barcelona.
Once all of the systematized information is in the model, it is classified in
different thematic layers, such as demography (age, sex, etc.); population
profile (level of studies, level of employment, etc.); social profile of citizens
(marital status, time use, household members, etc.); and housing factors
(construction date, last renovation, supply services, etc.). There are also
layers more concerned with economic issues, such as industrial and services
sector activities (location, number of employees, type of activity, registration
date, etc.) and services and facilities (type, ownership, years of concession,
number of daily visits, etc.). Statistics and indices of demographic and
economic projections are introduced in their corresponding layers of
demography and the economy.
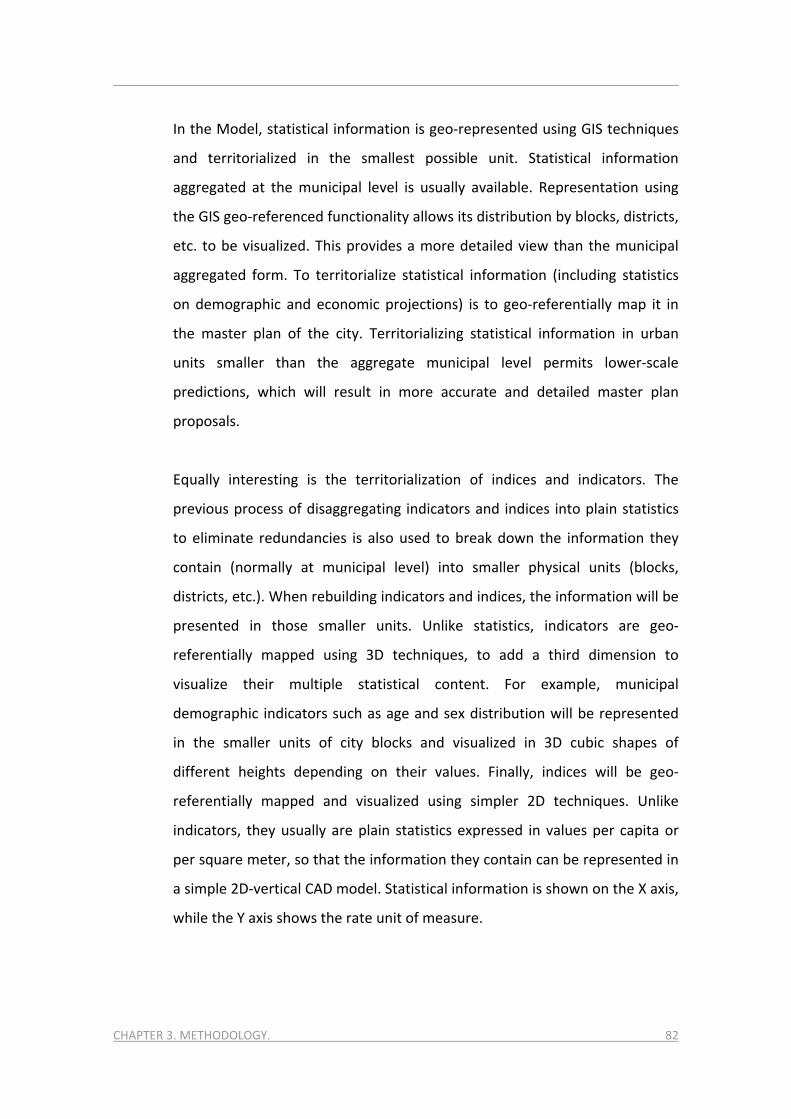
CHAPTER 3. METHODOLOGY. 82
In the Model, statistical information is geo‐represented using GIS techniques
and territorialized in the smallest possible unit. Statistical information
aggregated at the municipal level is usually available. Representation using
the GIS geo‐referenced functionality allows its distribution by blocks, districts,
etc. to be visualized. This provides a more detailed view than the municipal
aggregated form. To territorialize statistical information (including statistics
on demographic and economic projections) is to geo‐referentially map it in
the master plan of the city. Territorializing statistical information in urban
units smaller than the aggregate municipal level permits lower‐scale
predictions, which will result in more accurate and detailed master plan
proposals.
Equally interesting is the territorialization of indices and indicators. The
previous process of disaggregating indicators and indices into plain statistics
to eliminate redundancies is also used to break down the information they
contain (normally at municipal level) into smaller physical units (blocks,
districts, etc.). When rebuilding indicators and indices, the information will be
presented in those smaller units. Unlike statistics, indicators are geo‐
referentially mapped using 3D techniques, to add a third dimension to
visualize their multiple statistical content. For example, municipal
demographic indicators such as age and sex distribution will be represented
in the smaller units of city blocks and visualized in 3D cubic shapes of
different heights depending on their values. Finally, indices will be geo‐
referentially mapped and visualized using simpler 2D techniques. Unlike
indicators, they usually are plain statistics expressed in values per capita or
per square meter, so that the information they contain can be represented in
a simple 2D‐vertical CAD model. Statistical information is shown on the X axis,
while the Y axis shows the rate unit of measure.
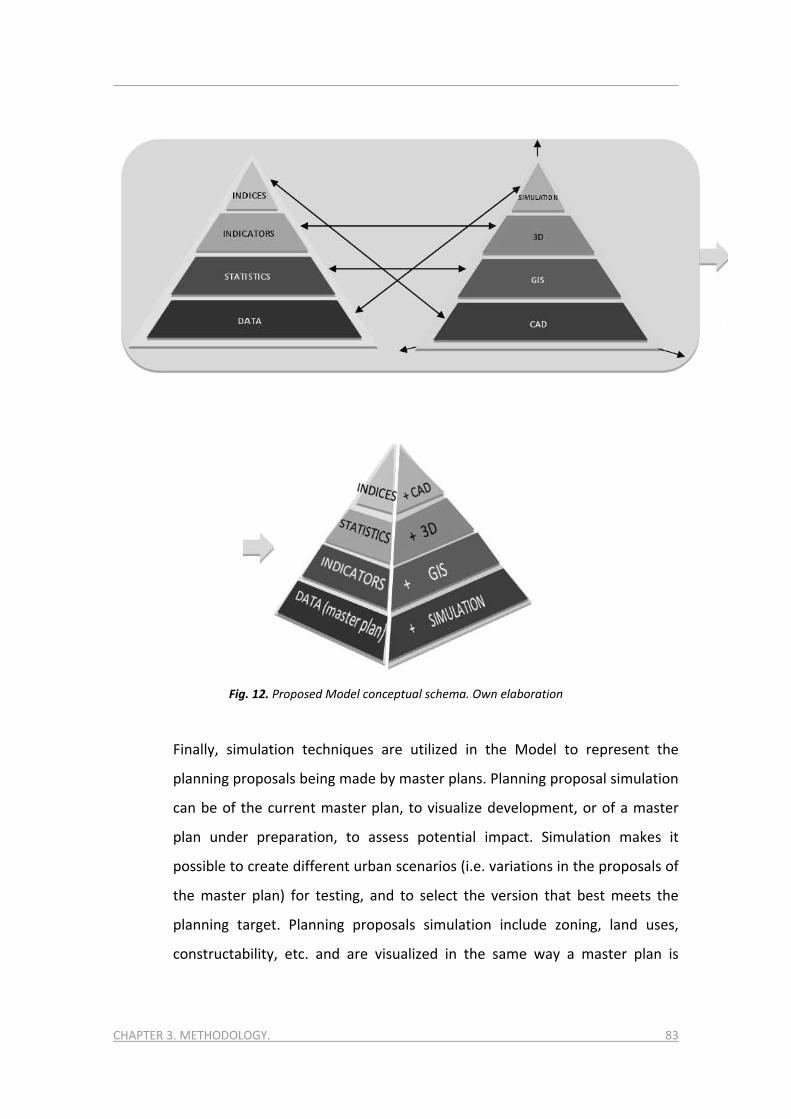
CHAPTER 3. METHODOLOGY. 83
Fig. 12. Proposed Model conceptual schema. Own elaboration
Finally, simulation techniques are utilized in the Model to represent the
planning proposals being made by master plans. Planning proposal simulation
can be of the current master plan, to visualize development, or of a master
plan under preparation, to assess potential impact. Simulation makes it
possible to create different urban scenarios (i.e. variations in the proposals of
the master plan) for testing, and to select the version that best meets the
planning target. Planning proposals simulation include zoning, land uses,
constructability, etc. and are visualized in the same way a master plan is
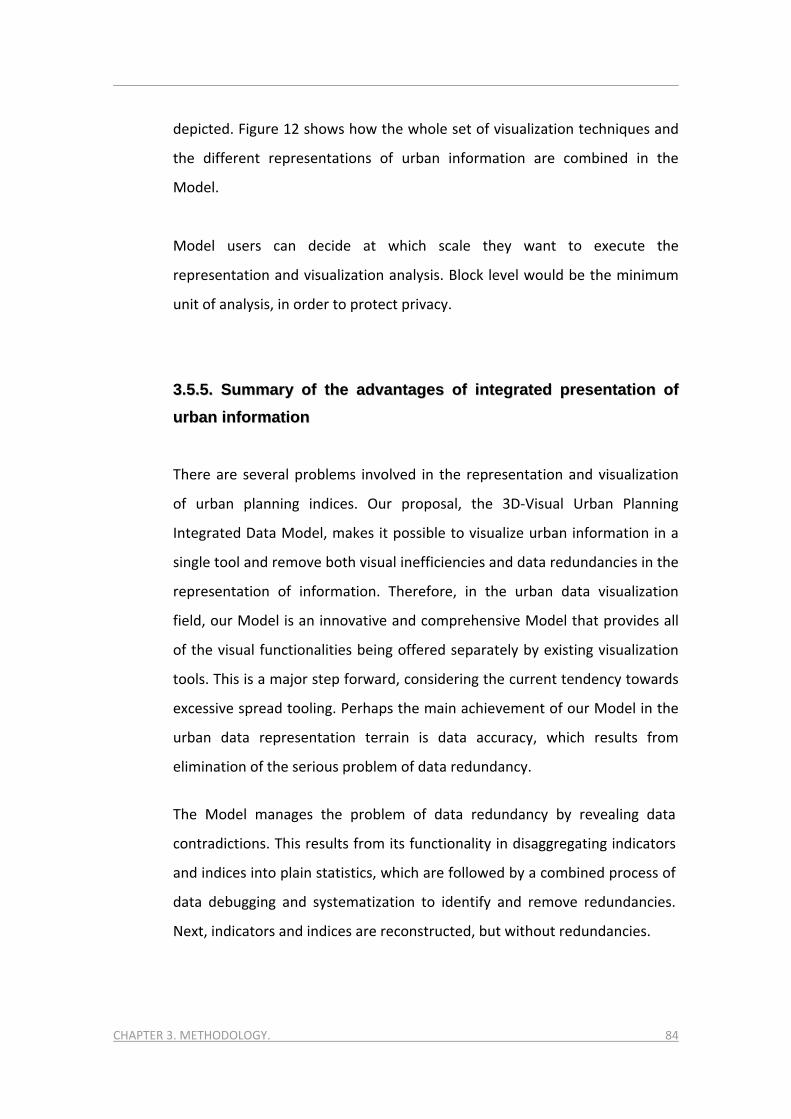
CHAPTER 3. METHODOLOGY. 84
depicted. Figure 12 shows how the whole set of visualization techniques and
the different representations of urban information are combined in the
Model.
Model users can decide at which scale they want to execute the
representation and visualization analysis. Block level would be the minimum
unit of analysis, in order to protect privacy.
33..55..55.. SSuummmmaarryy ooff tthhee aaddvvaannttaaggeess ooff iinntteeggrraatteedd pprreesseennttaattiioonn ooff
uurrbbaann iinnffoorrmmaattiioonn
There are several problems involved in the representation and visualization
of urban planning indices. Our proposal, the 3D‐Visual Urban Planning
Integrated Data Model, makes it possible to visualize urban information in a
single tool and remove both visual inefficiencies and data redundancies in the
representation of information. Therefore, in the urban data visualization
field, our Model is an innovative and comprehensive Model that provides all
of the visual functionalities being offered separately by existing visualization
tools. This is a major step forward, considering the current tendency towards
excessive spread tooling. Perhaps the main achievement of our Model in the
urban data representation terrain is data accuracy, which results from
elimination of the serious problem of data redundancy.
The Model manages the problem of data redundancy by revealing data
contradictions. This results from its functionality in disaggregating indicators
and indices into plain statistics, which are followed by a combined process of
data debugging and systematization to identify and remove redundancies.
Next, indicators and indices are reconstructed, but without redundancies.
CHAPTER 3. METHODOLOGY. 85
In our opinion, models like the one proposed here will become increasingly
necessary in the immediate future. New and more up‐to‐date information
resources are becoming available on a daily basis, making integration and
systematization tools increasingly essential. Open data initiatives will also
increase the need for tools such as our Model. At the end of 2011 the
European Commission proposed a review of the current directive on open
data in order to speed up the release of all public sector information [57]. The
private sector is also actively increasing available data. The Current City
Research Foundation, based on the use of different analysis techniques with
anonymous data from mobile users, maps real‐time urban flows and time
patterns. Such real‐time data is already used in several applications, from
planning different responses to emergencies to studying the impact of urban
development projects. The updating and introduction of real‐time data from
open data or mobile user initiatives can be easily carried out by the software
Model proposed here. This includes debugging, and classifying and storing
any new data in accordance with what is already contained in the Model.
To deal with urban planning updating needs and the increasing availability of
information, we need powerful tools that help planners represent and help
citizens visualize information. The better our cities are documented, the
better urban planning will be. Our Model can make a significant and lasting
contribution to better urban planning.

CHAPTER 3. METHODOLOGY. 86
33..66.. IINNSSIIGGHHTT oonn aaggeenntt--bbaasseedd ppuubblliicc ppaarrttiicciippaattiioonn
AN AGENT-BASED COLLABORATIVE MODEL FOR MORE MEANINGFUL CITIZEN PARTICIPATION IN URBAN PLANNING
One mechanism to accumulate intelligence is through the use of crowd‐
sourcing techniques. Agent technology is very useful to manage information
for specific purposes gained through crowd sourcing. In order to increase
intelligence in our Model, we propose the use of agent technology in parallel
with the beginning of implementation of the urban planning values obtained
with our Model. After this initial step, agent technology will also be utilized
during the preparation of the new urban planning proposals. In this second
step, agent technology is used to monitor the response to urban planning
proposals from the citizens.
This agent‐based model helps the Smart Urban Planning Method to greatly
increase public participation in urban planning and make it more citizen‐
friendly, to automate data collection processes, and to facilitate the
verification of results.
The insight is structured through the following steps:
‐ We review the existing implementation of agent technology used in
urban planning
‐ We explain our Model based on agent technology to mine the opinions
and ideas of citizens
‐ We use an unsuccessful experience in urban planning public consultation,
the renewal of the Diagonal Avenue in Barcelona, as a concluding
example of how our Model reinvents participatory processes in urban
planning

CHAPTER 3. METHODOLOGY. 87
33..66..11.. TThhee pprroobblleemm ooff ppuubblliicc ppaarrttiicciippaattiioonn iinn uurrbbaann ppllaannnniinngg
Public participation in the processes involved in the design and updating of
urban master plans need to be improved. As things stand, it is not easy for
citizens to become involved in these processes. This is due in large measure
to the fact that participatory channels open too late in the timeline of master
plan development. This results in a very low level of participation, which can
raise doubts about the validity and legitimacy of the plan, and even lead to
its rejection.
The processes for ensuring participation during the design and approval of
master plans have a similar structure in all countries: citizens are requested
to give their opinions once the design process is over and the stage is set for
the approval process to begin. The approval process of master plans typically
has three chronological steps, each with an increasingly binding status. In the
first step, immediately after the design phase is over, the authors of the plan
present it to the municipal council for its initial approval. Council members
can ask for changes in the proposals of the plan before they officially approve
it. Once this first approval is given – the so‐called initial approval ‐ public
participation starts. The council organizes a public presentation conducted by
the authors of the plan. Presentation is followed by a one to two month
period for public participation and input. During this period, citizens can only
make suggestions about the proposals of the plan, but not give new ideas for
the city. In a very real sense, the role of citizens is reduced to mere validators
of the proposals already included in the plan. This limited role of citizens is a
constant in all participatory steps of the master plan. Once this period for
suggestions ends, suggestions are assessed by the authors of the plan. Some
suggestions will be favorably considered and included in a new version of the
plan prepared by the same team of urban planners.

CHAPTER 3. METHODOLOGY. 88
In countries where urban planning is within the remit of the municipality, it is
the responsibility of the municipal council to approve this second version of
the plan. In countries where urban planning is within the remit of the
regional authority or the national government, this second version will be
considered by the responsible body in each case, which will either approve it
or ask the planners to make further amendments. The approval of this
second version of the plan is known as provisional approval. At this point,
another two‐month and more binding process of public participation starts.
During this participatory period, the plan is available to citizens on the
municipal web site and at the town hall urban planning offices. However,
once again, citizens can only express their objections to it. They simply serve
as validators of the proposals and, in this phase, their role is even reduced.
Unlike suggestions, objections are not opinions on the proposals of the plan.
Instead, they simply reject the proposals of the plan and/or point out
illegalities, irregularities, or other anomalies. Once the two‐month period of
public consultation is over, the authors of the plan collect all the objections,
assess them, and consider their inclusion in what will be the third and final
version of the plan.
The third version of the plan is then presented to the competent authority.
As in the second phase, the municipal, regional, or national controlling
authority, depending on the legal system of the country concerned, either
approves or requests amendments to the authors of the plan. This final step
is usually described as the definitive approval. Once the third version of the
plan is official, citizens that still object to any part of it can only lodge an
appeal, thus initiating a legal process that will finish in court.
The described public participation in urban planning does not fairly respect
or incorporate the opinion of citizens. It is not fair because it happens once
the design phase of the master plan is over, limiting the role of the citizens to
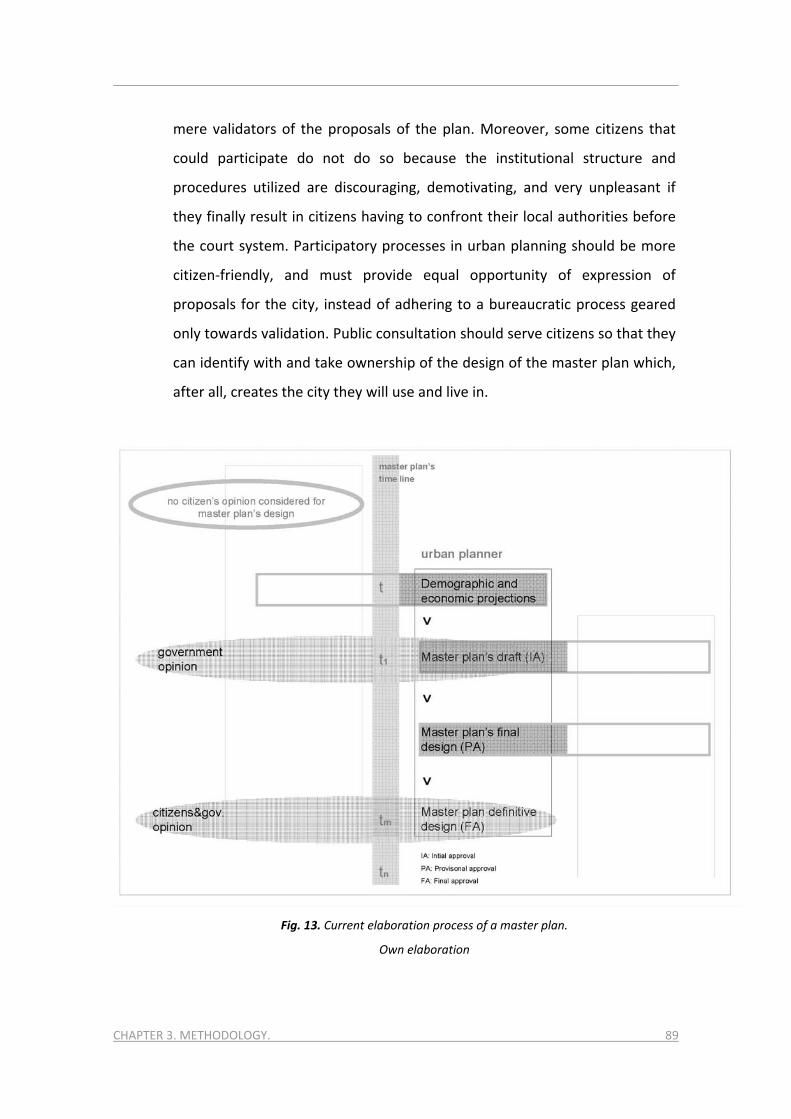
CHAPTER 3. METHODOLOGY. 89
mere validators of the proposals of the plan. Moreover, some citizens that
could participate do not do so because the institutional structure and
procedures utilized are discouraging, demotivating, and very unpleasant if
they finally result in citizens having to confront their local authorities before
the court system. Participatory processes in urban planning should be more
citizen‐friendly, and must provide equal opportunity of expression of
proposals for the city, instead of adhering to a bureaucratic process geared
only towards validation. Public consultation should serve citizens so that they
can identify with and take ownership of the design of the master plan which,
after all, creates the city they will use and live in.
Fig. 13. Current elaboration process of a master plan.
Own elaboration

CHAPTER 3. METHODOLOGY. 90
A master plan is a tool with which to effect change in a city: new residential
developments provide new housing resources, new industrial and tertiary
sites generate new job opportunities, new public spaces offer more leisure
opportunities, new facilities provide more services, etc. It does not make
sense that citizens should suffer rather than enjoy playing a part in the
creation and design of all these resources for their city. They should be
involved in the design phase, not only in the approval process. Moreover, to
draft three versions of the master plan (with their corresponding approval
processes) is inefficient. Reaching final approval can easily take a year or
more, even if it is not interrupted or frozen before completion due to
unforeseen circumstances such as political changes in one of the authorities
involved, lack of resources, etc. For all described reasons, urban planning
participatory processes need to be reformulated in order to allow the public
to be involved in the early design phase of master plans. In addition, this
should be done by employing technological citizen‐friendly participatory
methods.
Computer technology has helped to develop new mechanisms which
incentive public participation in urban planning. More recently, the so called
‘immersive planning’ [68] focuses on the depth and breadth of user
experience. Commonly web‐based, the immersive planning techniques can
be framed in three categories of immersion: challenge‐based, sensory and
imaginative. Geographic information systems (GIS), planning support
systems, virtual environments, and 3D digital games are all methods of
obtaining user immersion in one or a combination of these categories. The
latest developments on these techniques comprise the following: Bugs [27]
et al. analyze the impact of collaborative Web 2.0 tools applied to public
participation GIS applications in urban planning actions. Brabham [19] uses a
web‐based crowd sourcing model typically used in distributed problem
solving and production model for business as a public participation support
CHAPTER 3. METHODOLOGY. 91
system for urban planning. Dai et al. [47] use advanced virtual reality not
only to incentive public participation in urban planning purposes but in the
design of public buildings. Bogdahn et al. [14] enable users to explore in a
playful way urban planning proposals in 3D models. Howard [79] ads
interaction mechanisms between users inside the modeled environment.
33..66..22.. TThhee tteecchhnniiqquuee:: AAggeenntt tteecchhnnoollooggyy iinn tthhee uurrbbaann ccoonntteexxtt
In terms of functionalities, what characterizes urban planning is its predictive
capacity. By definition, prediction means obtaining a model for the future by
modeling the present. To obtain the future urban model, the urban planning
practice uses demographic and economic projections, normally with a
twenty‐year time horizon. Thus, the main urban planning function is to
predict what a city will need in twenty years, based on demographic and
economic projections. And a master plan is the graphical representation of
such predictions, (through the zoning) depicting how the city will look like in
two decades.
Agent technology it is useful for urban assessment and decision support as it
relies on simulation. Agent technology for urban planning purposes must
incorporate predictive functionalities.
The following definition will help to explain how simulation works for urban
assessment and decision support purposes using agent technology. “An
agent is a computer system that is capable of independent action on behalf
of its user or owner in order to satisfy design objectives. An intelligent
software agent has to be autonomous, reactive, proactive, and social
(capable of interacting with other agents to communicate and negotiate).
Intelligent agents can learn and adapt to new situations. (…). A multi‐agent
system consists of a number of agents that interact with one another,

CHAPTER 3. METHODOLOGY. 92
cooperate in order to accomplish different tasks and are able to negotiate
and solve conflicts” [52].
In an agent‐based urban simulation, different scenarios are created to find a
solution to a specific problem. In such scenarios, agents act on behalf of
people, so simulation is a fairly realistic virtual approach to better assessing a
real problem. Simulation allows different scenarios to be generated by
changing the macro‐characteristics of the model which is being assessed. The
functionality that enables the creation of different testing scenarios makes it
an appropriate technique for decision support systems (DSS) assessing
physical realities. As examples in the context of physical urban assessment,
Ligtenberg, A. et al. [116] have developed a model to decide on the location
and spatial distribution of new development areas. The model combines a
multi‐agent simulation (MAS) approach with cellular automata (CA). CA is
used as a support to provide the knowledge an agent needs. It includes
individual actor behavior with different levels of participation. Spatial
intentions and related decision‐making actions are defined by agents. The
modeling concept is intentional and based on the Schulz DSS model where
agents interact with the environment rather than between themselves. The
same author [117] has developed a similar model where interactions
between actors are stronger. Here the MAS also simulates a multi‐actor
interactive spatial DSS process for allocation purposes. It pursues knowledge
sharing between participating actors in a learning approach designed to
create a common view that minimizes decision conflicts when selecting areas
eligible for development.
Besides assessing physical realities, agent‐based DSS models are also used to
assess the strategy for growth in a city, testing different approaches such as
balanced growth as a whole, or uneven growth favoring some parts of the
city. Kou et al. [101] adopt an MAS based on Swarm simulation to assess the

CHAPTER 3. METHODOLOGY. 93
process of urban growth in an artificial city. The effects of organizing the city
into one or more city‐centers are tested. Still in the research area of city‐
center simulation, Wagner [194] has developed a topological and metrical
categorization of different city core areas to assess their level of attraction.
The research combines an MAS of random walking agents and axial graphs.
In other cases, cellular automata and agent concepts have been used to
model and simulate different scenarios of growth and dissemination of slum
areas as a basis for assessing control measures. Chen et al. [36] have
developed a tool for urban growth control. Li and Liu [114] have combined
agent technology with CA and GIS (geographical information system)
techniques in a single exploratory tool to simulate different urban
development patterns in order to assess their level of sustainability.
Agent –based DSS models for urban assessment have also been used at the
urban building level to simulate how citizens use a city by changing the built
environment, either in terms of building functions and other urban elements
[116] or performance indicators [117]. Other authors have been more
concerned about assessing social sustainability in a changing built
environment [101]. A final point to mention is that agent‐based DSS models
have been developed not only for urban assessment but also for larger‐scale
spatial decisions. Arentze et al. [194] have developed a spatial DSS using
agent‐based model (ABM) techniques for land‐suitability and facility‐needs
analysis. The authors highlight the innovation of their analysis as it combines
the two related approaches of land‐use‐allocation and land‐use‐needs
modeling. The resulting integrated model is able to generate different
scenarios of allocated land‐use alternatives by changing the features of
facilities. Agent‐based models (ABMs) are useful for simulating urban, spatial,
and all other kinds of complex systems [36]. Applications can vary from the
simulation of socio‐economic systems through the elaboration of scenarios
for logistics optimization and biological systems to the urban and spatial ones

CHAPTER 3. METHODOLOGY. 94
already seen. Interestingly, ABMs provide the means to include real decision
making without losing the strength of the concept of self‐organization [114]
inherent in complex systems.
Despite the powerful simulation functionalities of ABMs that allow them to
explore all kinds of complex systems, the addition of predictive capabilities
makes them useful for the urban planning activity. In this terrain, to highlight
the works of Batty [7]. He conceptualizes a bottom‐up urban planning
process in which the outcomes are always uncertain. This is combined with
new forms of geometry associated with fractal patterns. Batty’s model
begins with the use of cellular automata (CA) to simulate urban dynamics
through the local actions of automata. Next, he introduces agent‐based
models (ABM) in which agents move between locations. These models relate
to many scales, from the scale of the street to the urban region. Finally, Batty
attempts to understand and predict different urban phenomena with a focus
in spatial modeling changing to dynamic simulations of the individual and
collective behaviors of involved actors at such scales.
Finally, a conceptual clarification is necessary. Prediction and probability are
completely different techniques [5], and demographic projections are much
more than just an extrapolation of population to a certain time‐horizon [49].
We will revisit these concepts when we present our Model in the next
section.
33..66..33.. AA ppaaiirr ooff ooppiinniioonn--mmiinneerr aaggeennttss tthhaatt rreeccoommmmeenndd tthhee iiddeeaass ooff
cciittiizzeennss ttoo ppllaannnneerrss
Our novel contribution to the existing field of technologies for incentivizing
public participation in urban planning activity is an innovative two‐step

CHAPTER 3. METHODOLOGY. 95
agent‐based decision‐support system (DSS) which involves the public both
before and during master plan development. Under our Model the public
participation consists of citizens expressing as many ideas and opinions about
their city as they choose, and it takes place before design of the master plan
starts. The proposed DSS uses agent technology to mine the opinions and
ideas of citizens. We propose a pair of opinion‐miner agents. These agents
belong to a class of recommender agents whose aim is to formulate
recommendations out of a mining process, and submit these
recommendations to the urban planners in charge of the master plan.
Recommender agents have been used extensively in very different fields,
wherever an intelligent mechanism is needed to filter out large quantities of
available information [171], and to provide customers or users with the
means to effortlessly find the items they are probably looking for based on
their history of prior actions [4].
Other related agents are monitoring agents which are used for location and
allocation purposes. Their recommendations help tourists to find sites to visit
[35] or simply provide information using location awareness technology
[208]. The agents in ABM models for urban assessment described in the
previous section can be considered monitoring agents.
Regarding miner agents, they are now mainly used for e‐learning, a new and
important area of application. Miner agents recommend educational
materials [208], [73], [151] or personalized resources [214], [133], [93], to
groups of students based on their profiles. This technology is also being used
in the growing area of social and other networks on the Internet to provide
users with useful internet and website suggestions [67], [177] (see [135] for a
complete taxonomy of internet agents) and to help find potential network
members [97].

CHAPTER 3. METHODOLOGY. 96
Hybrid and customized agents have more specific applications, varying from
agents for personal diet recommendations [108] to recommender agents
that help software developers to select task‐relevant software libraries [128].
The most appropriate profile of agent for our Model, whose purpose is to
enhance and enrich public participation in urban planning by making the
opinions of citizens more prominent, is the miner‐recommender agent:
A pair of opinion‐miner agents extract and classify data contained in the
opinions of citizens to make recommendations to planners during the design
of the master plan. The first agent mines web‐requested opinions from
citizens before the design of the master plan begins. The first agent assists
the planner, helping prepare a more citizen‐centered first draft of the master
plan. Next, during the elaboration of the master plan, the second agent
mines the Internet seeking opinions of citizens from other cities where
similar plan proposals have been made. The second agent informs the
planners regarding the success or failure of similar proposals found, helping
to address the actual proposals being elaborated in the master plan.
In both cases the agents mine the web, since both opinion‐mining processes
will be web‐based. Opinion‐mining is a process similar to data‐mining, which
mines text seeking keywords instead of mining data. The techniques,
algorithms, and methodologies used in web‐based opinion‐mining
encompass those specific to data‐mining, mainly because there is a great
deal of unstructured data on the web, and data changes are frequent and
rapid [92], [120].
Our first agent mines the opinion of citizens from a website specifically
designed for that purpose. The second agent uses hyperlinks to discover
websites containing opinions of citizens about planning proposals similar to
the ones contained in the master plan under elaboration. In the second

CHAPTER 3. METHODOLOGY. 97
agent tasks, a complete web‐mining process applies, from web‐structure‐
mining to web‐content‐mining and web‐usage‐mining [52]. Our pair of
opinion‐mining recommender‐agents is involved in a three‐phase operational
process under which the recommendation tasks are executed, the retrieval
(1), the sorting (2), and the reporting (3) steps.
In the first phase, the retrieval step, a mining algorithm is used. Because it is
about text‐mining, the unsupervised Apriori algorithm is selected. The Apriori
algorithm successively finds large item sets which satisfy the desired minimal
support. Association rules are then constructed, based on the elements
which satisfy the desired minimal confidence [106]. Text‐mining techniques
can deal with noise and data uniformity by implementing correlation rules
between the selected keywords and their descriptions [102]. Nowadays, text‐
mining techniques are extremely advanced, and can even be used to mine
scientific texts [13]. Still in this first phase, the next step is to create a
structured representation of the information that has been mined using an
ontology. An ontology must be defined, so that every piece of information
can be represented in structured formats. Each information piece is mapped
into the ontology as an instance.
The second phase, the sorting step, is to implement an algorithm to classify
and map the information into the ontology. Unstructured data can be
automatically classified and mapped [39], again using text‐mining
techniques, but based on decision rules [38]. There are several algorithms
that can be used for text classification purposes. Bayesian classifiers, neural
networks, and decision trees are among the most common [39]. The ratings
of what is being assessed are computed using the information already
mapped into the ontology.
CHAPTER 3. METHODOLOGY. 98
The third and final phase of the process, the reporting step, is to make
recommendations in response to the assessment request. Recommendations
are made using efficient prediction algorithms. In the context of agent
technology, a prediction can be defined as a value that expresses the
predicted likelihood that a user will have an interest in an item [138].
Accordingly, a recommendation is defined as the list of n items in the top n
predictions from the information set available [138]. To ensure quality
recommendations, once the recommender agent has been implemented, it
must be trained using a test data set (unseen data or training data) which is
different from the data that is being assessed [164].
Still in the reporting phase and in order to select the appropriate predictive
method for recommendation, we have to briefly describe two different
techniques: the content‐based recommendation (CBF) method [128] and the
collaborative‐filtering (CF) recommendation method [75]. Hybrid techniques
have also been proposed by some authors [128]. CBF methods are mostly
used when documents, web pages, publications, news, or similar pieces of
information are to be recommended [138]. The agent provides the
recommendation according to the preferences of the user and/or interests
which have been either explored by the agent or preset by the user.
CF methods aim to identify users that have compatible interests and
preferences by calculating similarities and dissimilarities between user
profiles [75]. This technique is useful when users need refined information,
and it is to their benefit to consult the opinions of other users who share
similar interests and whose opinions can therefore be trusted [138]. Within
CF methods there are two major categories: memory‐based and model‐
based [153]. Memory‐based CF uses nearest‐neighbor algorithms that
determine a set of neighboring users who have rated items similarly, and
combine the preferences of neighbors to obtain a prediction for the active
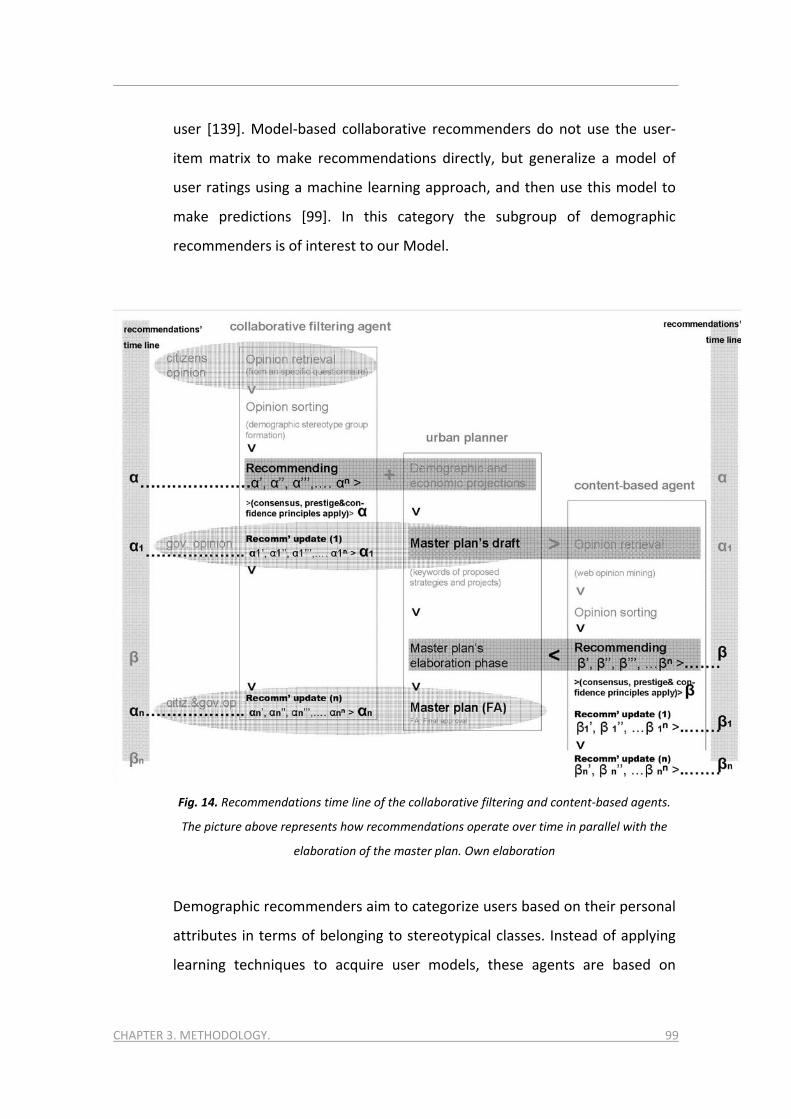
CHAPTER 3. METHODOLOGY. 99
user [139]. Model‐based collaborative recommenders do not use the user‐
item matrix to make recommendations directly, but generalize a model of
user ratings using a machine learning approach, and then use this model to
make predictions [99]. In this category the subgroup of demographic
recommenders is of interest to our Model.
Fig. 14. Recommendations time line of the collaborative filtering and content‐based agents.
The picture above represents how recommendations operate over time in parallel with the
elaboration of the master plan. Own elaboration
Demographic recommenders aim to categorize users based on their personal
attributes in terms of belonging to stereotypical classes. Instead of applying
learning techniques to acquire user models, these agents are based on
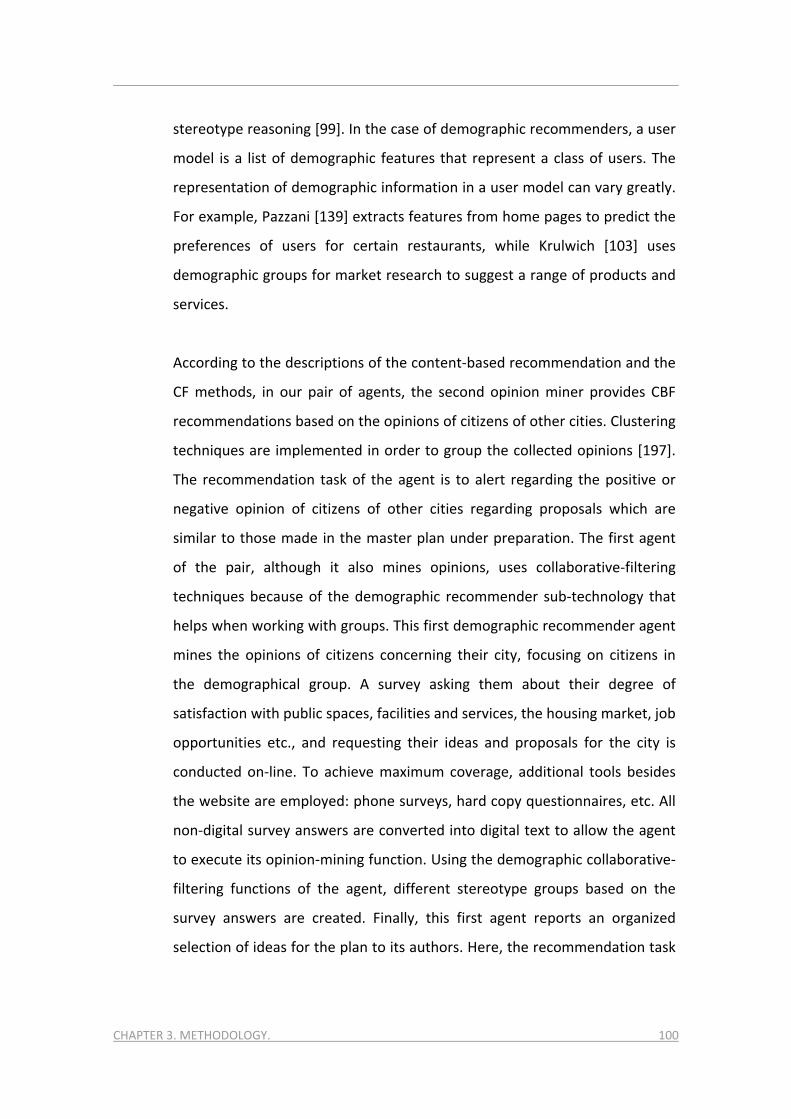
CHAPTER 3. METHODOLOGY. 100
stereotype reasoning [99]. In the case of demographic recommenders, a user
model is a list of demographic features that represent a class of users. The
representation of demographic information in a user model can vary greatly.
For example, Pazzani [139] extracts features from home pages to predict the
preferences of users for certain restaurants, while Krulwich [103] uses
demographic groups for market research to suggest a range of products and
services.
According to the descriptions of the content‐based recommendation and the
CF methods, in our pair of agents, the second opinion miner provides CBF
recommendations based on the opinions of citizens of other cities. Clustering
techniques are implemented in order to group the collected opinions [197].
The recommendation task of the agent is to alert regarding the positive or
negative opinion of citizens of other cities regarding proposals which are
similar to those made in the master plan under preparation. The first agent
of the pair, although it also mines opinions, uses collaborative‐filtering
techniques because of the demographic recommender sub‐technology that
helps when working with groups. This first demographic recommender agent
mines the opinions of citizens concerning their city, focusing on citizens in
the demographical group. A survey asking them about their degree of
satisfaction with public spaces, facilities and services, the housing market, job
opportunities etc., and requesting their ideas and proposals for the city is
conducted on‐line. To achieve maximum coverage, additional tools besides
the website are employed: phone surveys, hard copy questionnaires, etc. All
non‐digital survey answers are converted into digital text to allow the agent
to execute its opinion‐mining function. Using the demographic collaborative‐
filtering functions of the agent, different stereotype groups based on the
survey answers are created. Finally, this first agent reports an organized
selection of ideas for the plan to its authors. Here, the recommendation task

CHAPTER 3. METHODOLOGY. 101
is to select from all the comments and ideas those that apply to planning
purposes, and to dismiss those which are not related.
In our pair of agents, both content‐based and CF agents will provide their
recommendations to the planner based on the principles of consensus,
prestige, and confidence. A consensus opinion is generated amongst the
agents conforming the pair, and synthesized recommendations are sent to
the planner. Consensual will be weighted according to the status of the
opinion source (e.g. the reputation of the webpage) and ranked according to
the source’s credibility (reliability of information).
We are aware that the opinion of citizens changes over time, and have taken
this into account in our Model. The first agent, the CF agent, will report
recommendations to the planners before design of the master plan starts,
and then also throughout the elaboration of the master plan. Similarly, the
second, content‐based agent will provide recommendations as long as the
master plan is under development. Recommendations will be provided until
the final approval of the plan, in order to anticipate public reaction to the
eventual changes and updates in the plan.
The architecture and protocols of the miner agents in the search of opinions
that are relevant to every feature of the Master Plans will be accessed by
social search through a web of trust and aggregated with simple weighted
averages taking into account again the trust that every agent has declared in
its contact list that happens to be a same contact list of citizens participating
in the discussion of the Master Plan.
The agents emulate the social features of the human social networks as a
sort of social machines, dealing with their own contact lists, handling with
requests and interactions in human like language, and supporting their users
in their daily operations in and among the open social networks. This is a fully

CHAPTER 3. METHODOLOGY. 102
bottom‐up approach that contains a design of the types of social machines
that will interact similarly to people, under their roles and rules of
interaction, sharing their contact lists. The first approaches of social search
are ‘Sixearch’ [111] as a search peer to peer, ‘AskNext’ [182], search based
on agents ‘topsy.com’ looking for tweets (on twitter), ‘factoetum.com’ for
the automation of contributions to blogs, and heystack.com as an example of
collaborative search [165]. In the case of multi‐agent referral system (MARS).
Yu et al. [213] proposed a P2P application in which agents assist users in
obtaining and following referrals to find experts who might answer their
questions.
Regarding the contact lists, further works examine the benefits of using
social networks like the FOAF (Friend‐of‐a‐Friend) resource description
framework (RDF) ontology that has recently gained popularity [94]. FOAF
predicates consist of a person’s properties such as name, email address,
group memberships, employer, gender, birthday, interests, projects, and
acquaintances. By ‘spidering’ the Semantic Web and collecting the
information contained in FOAF files, one can build a large collection of data
about people and their interests. This information can be used to email
people with a given interest, people who know people who know a particular
person, and so on.
33..66..44.. AA ccoonncclluuddiinngg eexxaammppllee:: tthhee rreeddeessiiggnn ooff DDiiaaggoonnaall AAvveennuuee iinn
BBaarrcceelloonnaa
In March 2010, the Barcelona City Council launched a public consultation
process to select one of two designs for the Diagonal Avenue renovation
master plan (see pictures below showing designs A and B). Both of these
options included new tram lanes to connect with existing lines. The survey

CHAPTER 3. METHODOLOGY. 103
made little impression on the citizens, since no opinion and only validation of
the options was requested. Participation was only 10%. Interestingly, the
option which received most support was a third one, C, which was a rejection
of the other two. The victory of option C destroyed any chances that the
project would go ahead.
The Diagonal Avenue consultation followed the traditional and unsuccessful
public participation process in urban planning, detailed in the problem
description section, under which the public gives its opinion of the proposals
presented by a master plan at the very end of the design of the plan (when
there is no scope for change).
This undemocratic and elitist approach can sometimes lead to extremely long
approval processes, or even the rejection of master plans when public
reaction is negative, as in the case of Diagonal Avenue in Barcelona. It is
quite clear that introducing wider participation during a plan’s preparatory
and/or design phases would be a step in the right direction for obtaining the
opinion of concerned citizens. In non‐official blogs and opinion websites
created during the Diagonal Avenue case, some people expressed the view
that only a bus lane was needed, and that there was not enough financing
available to justify a huge investment in new tram lines. Others preferred
more investment in basic services and public spaces in the city, rather than
spending significant funds on complete renovation of the Avenue.
Following our Model, a public participation survey would be conducted
before design of the urban project begins. This extensive survey would
involve asking for specific ideas concerning the objectives of the project as
well as more general opinions on related urban aspects affecting the project.
In the case of the Diagonal Avenue, these related aspects would revolve
around the quantity and quality of public spaces and facilities in Barcelona.

CHAPTER 3. METHODOLOGY. 104
Such general opinions would help the planners produce more focused and
useful proposals that besides helping design the specific project, would end
up satisfying the more general urban needs of citizens.
The first type of agent of our pair, the demographic, collaborative‐filtering
agent would retrieve the relevant opinions of individual citizens through text‐
mining from a website created for that purpose doing social search so that
the deep web composed of opinions of all kinds would be accessible.
Recommendations would be reported to the planner in the form of lists of
opinions, positive and negative, ordered by relevance and importance while
taking into account the trust and influence of those who are giving their
opinion away in the form of comments in open social networks. The planner
would develop one or more project solutions based on these
recommendations and economic and demographic projections.
Before presenting the project solutions to the public, the second type of
agent, the content‐based agent, would come into play and mine the Internet
for reactions to similar project solutions in other cities following a similar
scheme of social search but instantiated with other similar projects. The
similarity of projects is assessed by the features of those projects (through
the content based filtering process) and will proceed to aggregate the
opinions of those projects with the forehead mentioned social search
process.
Recommendations on the opinions that similar proposals raised in other
cities would be reported to the planner. Armed with this information, the
planner can carefully consider and compare actual previous reactions,
responses and potential future responses. Finally, the planner can adjust the
project solutions being designed before they are public with proper
estimates of their opinions and relevance.

CHAPTER 3. METHODOLOGY. 105
Fig. 15. Redesign of the Diagonal Avenue in Barcelona. Option A.
Source: http://w110.bcn.cat/V01/Serveis/Noticies/
Fig. 16. Redesign of the Diagonal Avenue in Barcelona. Option B
Source: http://w110.bcn.cat/V01/Serveis/Noticies/
CHAPTER 3. METHODOLOGY. 106
Returning to our case study in Barcelona, through a key word search using
“new tram line, public consultation”, the content‐based agent would have
found that several public consultations had already been conducted on
whether or not a new tram line was needed in a given city, and which other
design options should be considered. Indeed, there is a great deal of
experience in other cities. For example, In Edinburgh, the Scottish Parliament
conducted a public consultation in 2003 regarding the new tramway
network. The people indicated that only three new tram lines were needed,
in combination with feeder bus services or shuttles, to reduce the cost [158].
In Dublin, in December 2005, the Railway Procurement Agency [51] started a
public consultation exercise on a new route to connect with the existing Red
and Green lines. Citizens were asked about their preferred route for such a
connection. Similarly, in London in 2007, the local authority carried out a
survey on the route options for the new Cross River Tram (CRT) line. The CRT
followed a long route covering four boroughs. It was divided into five
sections to facilitate ease of comment during the public consultation [123].
Finally, there is the case of Manchester, where Transport for Greater
Manchester worked closely with Manchester City Council to ensure a new
tram line fitted in with popular opinion and also fulfilled regeneration
aspirations for the area around the new tram line [181]. Interestingly, in all
these new tram line consultations, public participation began with
consideration of whether a new tram line was necessary in the first place.
This differs from the approach in Barcelona.
The agent‐based implementation of such model must scale properly to the
open nature of comments of citizens about public plans in the social
networks. In the end, with the implementation of our agent‐based Model for
public participation in the Diagonal Avenue case, a more citizen‐centered
solution would have been possible.

CHAPTER 3. METHODOLOGY. 107
33..66..55.. SSuummmmaarryy ooff tthhee aaddvvaannttaaggeess ooff uussiinngg aaggeenntt tteecchhnnoollooggyy iinn
ppuubblliicc ppaarrttiicciippaattiioonn
In this insight we analyze the participation of citizens through crowd
sourcing. Specifically, we propose a Model based on agent technology.
Our Model respects the classical three‐step participatory process in urban
planning, but considerably must reduce the social efforts and the economic
costs. Our Model has more social value because it allows real participation
and involves citizens in the planning process from the very beginning. And
finally, its citizen‐friendly approach must be cost‐effective and must save
resources because it manages opposition and reduces the chances that
citizens will object or resort to litigation in response to the final design of a
master plan.
The implementation of the Model is as a multi‐agent system that do social
search for the mining of comments for getting the relevant opinions
regarding an on‐going design of a master plan. It is useful for scaling up
properly at the internet scale and in a modern way, taking advantage of not
only the existing discussing happening along the exposition of the current
plan, but including preceding discussions of similarly plans all over the world
that usually are of relevance for that specific plan.
The Model will have high chances of recommending the proper features of
the plans in a way that people might understand and valuate its benefits or
drawbacks according to the recommendations of former existing experiences
found in the web in an automatic way. The novelty of the approach deserves
further work to validate with a proof of concept that is going to be developed
as future work.

CHAPTER 3. METHODOLOGY. 108
33..77.. SSuummmmaarryy
The main goal of this research is to learn about citizens’ urban needs through their
urban‐time‐use distribution, to obtain new urban planning values. Our Smart Urban
Planning Method does not consider city spaces as simple pieces of land where certain
activities can be performed. Our citizen‐centered standards revision transforms urban
processes into land amounts and their uses. These complex transformations are
computer‐based and begin with the setting of a “rule of correspondence”, fixing a
quantitative and also qualitative correlation between urban‐time use and urban land
use followed by “indicators of equivalence” to set the quantitative correlation
between urban‐time use and urban land use.
We use a citizen survey to collect data on urban time use. We prove that the use of
hypermedia adaptive surveys is the most effective method to collect citizen
information. Besides presenting it to the citizen in a friendlier manner, this permits
periodical updates that actualize the results and move them closer to real‐time data.
This proximity to real‐time data in urban planning is gained through the easy update
functionalities that stereotype and feature based techniques utilized in the proposed
hypermedia adaptive survey introduce in the Method. Both techniques capitalize on
user profiles. The survey can be conducted by relatively short samples of user profiles,
extrapolating results to the overall population, thereby facilitating periodical surveys
and the periodical update of urban planning values. This functionality brings the survey
and the Smart Urban Planning Method towards real‐time accuracy.
To apply the new urban planning values obtained with our Method, it is necessary to
consider all available urban data. These are statistics, indicators and indices. Urban
data must be combined with urban planning standards to elaborate social,
demographical and economical projections. Projections are the basis of urban planning
proposals, showed in city master plans. Today, the visualization and representation of
urban information has serious problems with redundancies and inefficiencies in

CHAPTER 3. METHODOLOGY. 109
general. We propose a Model for integrated urban data representation and
visualization which would help solve these problems. Moreover, the proposed Model
is constructed in a way that supports the introduction of real‐time urban data, a major
step forward compared to the use of historical data which currently takes place.
In order to accumulate collective intelligence, in addition to the information collected
with the survey included in our Smart Urban Planning Method, we propose the use of
an agent‐based model as a crowd‐sourcing technique. Our agent‐based Model is two‐
tiered. It accumulates opinions of the surveyed population in more specific proposals
for the city and provides recommendations to the planners on which proposals should
be introduced in the master plan according to citizens’ vision. And it mines the web,
monitoring the acceptance or rejection that similar urban planning proposals have had
from citizens of other cities. The Model deepens the basic Smart Cities principle of
increasing public participation, and makes it more citizen‐friendly. Moreover, this very
efficient Model is strictly based on automated data collection processes.

CHAPTER 3. METHODOLOGY. 110

CHAPTER 4. APPLICATIONS OF THE METHODOLOGY 111
44.. AAPPPPLLIICCAATTIIOONNSS OOFF TTHHEE MMEETTHHOODDOOLLOOGGYY
Through our Method, new urban planning design values are obtained. These new
values serve as the new urban planning standards, and are more objective and closer
to citizens’ needs than traditional current ones. Hence, new urban planning standards
are satisfaction indices for each of the surveyed urban activities. These satisfaction
indices, besides being the new urban planning values, have further applications, such
as classification. To illustrate one of these applications, we provide a classification
example of municipal self‐sufficiency regarding the specific urban subsystem of public
services and facilities.
44..11.. DDeecciissiioonn ttrreeee rruullee lleeaarrnniinngg ffoorr mmuunniicciippaalliittiieess’’ ccllaassssiiffiiccaattiioonn
Once new urban planning design values or standards have been obtained, they can be
used to separate municipalities in terms of self‐sufficiency for that specific land use.
That is, we want to learn classification rules for an automatic classification of any
municipality with a similar head‐dependency reality. Common urban parameters of the
municipalities forming part of our research (such as population, urban surface,
facilities surface, number of facilities, etc.,) together with the self‐sufficiency threshold
already obtained constitute the training data set we run in data mining tools to find
rules for an automatic classification of any municipality. This obviates data for all of the
parameters contained in the training data set. For instance, classification rules help
classify any municipality in terms of services self‐sufficiency on the basis of one set of
data (such as total surface of facilities, population, etc.). For the purpose of obtaining
classification rules of municipal self‐sufficiency we use the J48 algorithm1, as explained
below.
1 J48 is an open source Java implementation of the C4.5 algorithm in the Weka data mining tool

CHAPTER 4. APPLICATIONS OF THE METHODOLOGY 112
After analyzing the state‐of‐the art on classification of municipalities or urban areas,
we can highlight the novelty of our proposed method for municipal classification.
Simply stated, there is no current method for classifying the performance of
municipalities on a specific urban matter based exclusively on the level of citizen
satisfaction. We have found research on classification methods for municipalities and
ranking tasks using fuzzy logic and GIS technology for their visualization [80]. Other
classification methods a) impose pre‐established conditions to rank the classified
municipalities [28], b) extract thematic information from aerial images and land cover
evolution to establish classes depending on differences in spectral reflectance [152], c)
combine classification results obtained from spectral mixing land cover components
within pixels and spectral confusion with other land cover features [69], d) evaluate
large regions land cover classification using a multiple‐layer characteristics database
approach [193], and e) use support vector machines (SVM) as a method for
constructing nonlinear transition rules for cellular automata (CA) [209].
We selected algorithm C4.5 to learn classification rules, since it most accurately
performs the classification of numeric data [206], that is to say the data where land is
allocated. This has been satisfactory tested in the case study provided in chapter 5.
44..22.. IImmpprroovviinngg ccllaassssiiffiiccaattiioonn wwiitthh KKnnnn
It is also possible to generate rules for a specific sub‐classification of municipalities
based on basic and complimentary levels of services offered in facilities. As an
example, according to the municipality’s degree of self‐sufficiency regarding services
contained in facilities, we propose the following sub‐classifications:

CHAPTER 4. APPLICATIONS OF THE METHODOLOGY 113
1a) Totally Non Self‐Sufficient Municipality (TNSSM): the municipality completely lacks
one or more basic/universal services, which are education, health, and social services.
A minimal sports facility must also exist, either standing alone or as part of education
or health services.
1b) Partially Non‐Self Sufficient Municipality (PNSSM): one or more basic services are
below the average provided by the self‐sufficient municipalities.
2a) Partially Self‐Sufficient Municipality (PSSM): one or more complimentary services
are not covered. Complimentary services include administration, safety and civil
protection, culture, transport, and religion.
2b) Totally Self‐Sufficient Municipality (TSSM): complimentary services are equal to or
above the averages established for self‐sufficient municipalities. Also known as
“complete municipalities”.
To further classify municipalities according to the described sub‐classifications, we
need qualitative and quantitative data on facilities for each of the municipalities. In
that respect, we use data sets from governmental planning offices for the seventy‐six
municipalities participating in our Case Study. We expand our original training set for
self sufficiency classification with the addition of this new data qualifying and
quantifying municipal facilities. From official raw data sets we observe that qualitative
data determining the nature of services offered in facilities is complete. However, to
the contrary, quantitative data about the specific size of services in the facilities may
not be complete. Hence, to conduct the desired sub‐classification, we have to deal
with missing values techniques to complete the data set.
Different methods for dealing with missing values include: a) deletion, deleting
instances containing unknown values, b) maximum likelihood, computing the
maximum likelihood of observed data while integrating out the missing values, and c)

CHAPTER 4. APPLICATIONS OF THE METHODOLOGY 114
imputation, replacing missing values with estimated values [62]. A number of learning
techniques tolerate and integrate incomplete test data: C5.0, classification and
regression trees (CART), linear discrimination (LD) naive Bayes classifier (NBC),
Repeated Incremental Pruning to Produce Error Reduction (RIPPER), and support
vector machines (SVMs) [187]. But since our number of missing values (57%) is too
high to delete or to integrate missing values, we have to proceed with imputation
techniques to complete the missing values on the specific attribute of services physical
size in our training data set.
There are various imputation techniques, and the choice amongst them must be
carefully made, since their underlying mechanisms for missing values vary greatly. The
assumption of how the missing values are distributed within the data set is
compounded by the fact that for small data sets, it may be difficult to determine
mechanism for missing values [166]. Our data set can be considered small, since it has
3966 instances. Sophisticated imputation methods prefer larger data sets. Therefore,
we have to select a simple imputation method. Simple methods to impute missing
values in small project data sets include Class Mean Imputation (CMI) and K‐NN [167,
168]. Some authors sustain that K‐NN gives better results [34].
With the K‐NN imputation technique, missing values are replaced with estimated
values according to the selected k value of most similar cases [90]. Training sets are
simulated with different values of k. Related research suggests that a suitable value of
k is approximately the square root of the number of complete cases [90]. A K‐NN more
elaborated technique is K‐MSN method, in which imputation is based on the weighted
mean of the observed values of the most similar neighbors, where similarity is
measured on the basis of the distance in the feature space [145]. Since we obtain good
results with the K‐NN technique, we not use the more sophisticated weighted mean
imputation method. Finally, to complete this short introduction to the K‐NN
imputation technique, we mention that some research indicates that its accuracy
diminishes when the missing data percentage exceeds 40% [159].

CHAPTER 4. APPLICATIONS OF THE METHODOLOGY 115
The reason why algorithm Knn has been selected to deal with missing values and build
an urban planning toolkit is because, as will be shown in next chapter, it has been
proven to successfully work with real data.
44..33 SSuummmmaarryy
According to the Method explained in Chapter 3, information from citizens may form
the basis for setting new urban planning design values for master plans. However,
once these new standards have been obtained, they can be further applied to support
urban planners in the identification of deficiencies and problems in general in urban
planning‐related issues. In our application of the Method, data characterizing land uses
and services of municipalities, together with the standards for public facilities, are used
as input for a learning method, to generate rules for classifying municipalities.
Moreover, knn methods are applied to deal with missing data for municipalities. These
are two additional applications of the Method, and there are others.

CHAPTER 4. APPLICATIONS OF THE METHODOLOGY 116
CHAPTER 5. DISCUSSION AND RESULTS 117
55.. RREESSUULLTTSS AANNDD DDIISSCCUUSSSSIIOONN
We have conducted a proof of concept of our Method in Girona Province (which
includes Girona as the main city, with a population of approximately 70.000, plus some
two‐hundred closely related municipalities). The results obtained are described and
discussed herein.
55..11.. SSuurrvveeyy ddeessiiggnn oonn uurrbbaann ttiimmee uussee aanndd cciittiizzeennss’’ ooppiinniioonnss oonn
uurrbbaann nneeeeddss
To learn about the covered and uncovered urban needs of citizens of Girona Province,
a survey on urban time use was conducted. Respondents were questioned concerning
how they are using the city today (which indicates how well their urban needs are
covered), plus how they would like to use the city under more ideal conditions (which
reveals their uncovered urban needs). A total of 624 responses were collected on‐line
following the Adaptive Hypermedia Model presented in Chapter 3, and 225 surveys
were conducted in person, for collectives who were less familiar with or had limited
access to technology. With these different survey modalities we ensured a
representative sample of citizens. We established a lower age limit of fourteen, since
below this threshold there is little personal autonomy to decide on urban activities,
which generally tend to correspond to those of the parents.
Our survey is initiated as a stated‐response data to begin classifying the respondents in
one of the following four stereotype occupational groups: student, employed,
unemployed, and retired. Based only on this initial pre‐classification, the survey is
constructed as a revealed‐choice data section, in which respondents answer a set of
questions in free text format.

CHAPTER 5. DISCUSSION AND RESULTS 118
It is important to mention that advanced surveying methods, such as the so‐called
“total survey design” [173] combine both of the described techniques. But they initiate
the survey with revealed‐choice data instead of the stated‐response data. And,
depending on the respondent’s answers, they offer different customized stated‐
response data questions. In order to not limit respondents’ answers and thus obtain
more accurate results, we took the option of inverting the order of “total survey
design” implied techniques.
Other authors have demonstrated that the methodology used to obtain time use data
influences the results [172]. This indicates that survey design has important
consequences for the attitudes of respondents revealed in the survey. In order to
minimize the burden to respondents, our survey was designed as a streamlined version
of the traditional time use surveys, which could be completed in approximately ten
minutes. Accordingly, we focused on questions concerning the physical allocation of
time devoted to urban activities. Moreover, the questions were very carefully selected,
and limited to those which obtain information relevant for modeling the urban time
use of respondents.
Stylized respondent reports and time diaries are two of the most widely used methods
for surveying time use [118]. The former asks respondents to report how much time
they usually spend on a specific activity during a certain period of time, while the latter
asks respondents to report all activities they perform in temporal order and during a
single day. Our survey combines both methods, since we ask for the description of a
typical working and non‐working day, and the amounts of time spent in all of the
involved activities. In our survey the description of a typical day stands for the average
time spent on all daily activities, taking recent weeks as a timeline. Presumably, the
measures obtained using the two original methods should be consistent with each
other at the aggregate level. That is to say, the stylized measure of time spent on a
certain activity should be similar to the total time spent on the same activity, as noted
in a time diary for the same period [118].

CHAPTER 5. DISCUSSION AND RESULTS 119
However, many researchers have found inconsistencies between these two measures.
In some cases, respondents report higher values in stylized measure, and sometimes
they report values which are lower than the total amount of time recorded in time
diaries [118]. To avoid such inconsistencies, our combined method asks respondents to
report on the time distribution of their activities over a twenty‐four hour period, in
terms of physical allocation of time. This avoids issues regarding whether or not the
time committed to an activity has to be accounted with the activity. Thus, for example,
meals at work and training or other events at the work place are counted as time at
work, but transportation to work is counted as commuting time.
Through questions on the physical allocation of time, our Method minimizes the
burden for respondents, by reducing the number of activities that they have to report.
Yet it still preserves the advantages of time diaries, which provide accurate
measurement and reduce distortions associated with social desirability bias [172].
However, we must still acknowledge the possibility of inconsistencies derived from the
request to describe the twenty‐four hour sequence of a typical working and a standard
non‐working day when respondents do not have routines. This is more likely to be the
case for non‐working days. Therefore, we assume that respondents are reporting more
the activities mode than the activities mean.
55..22.. PPrroocceessssiinngg ddaattaa ssuurrvveeyy
The Province of Girona has 221 municipalities organized in 8 counties. Girona is the
main city in the province. We collected 1000 survey answers from citizens of 163
municipalities.

CHAPTER 5. DISCUSSION AND RESULTS 120
Before entering into the mining phase of our survey results, a pre‐processing task was
needed in order to delete a) inconsistent responses (those with less than 50% of the
requested answers) and b) noise (non serious answers). In some cases, both tasks were
conducted manually, because the answers were too complex and lacked text‐mining
key words. Once the pre‐processing task was completed, the answers were organized
by municipality.
The survey text answers were numerically converted into a twenty‐four hour time
distribution for both working and non‐working days. Activities performed in the city of
residence were positively accounted in the municipality, and activities performed in a
non‐residence city were negatively accounted. Thus, we were able to track exported
and imported hours between municipalities. This also served as an initial correction
factor to design a fair rule of correspondence between urban time use and urban land
use at both municipal and regional levels.
We created tables for each municipality from which dependency answers were
obtained (municipalities importing hours). These municipalities are called “head
municipalities”. Subsidiary or “dependent municipalities” export hours to the head
municipalities. We observed that municipalities exporting the main occupation activity
(work, studies, etc.) are also exporting minor activities (shopping, leisure, etc.). In our
Case Study, 163 municipalities, 7 of them are head and 156 are dependent.
55..33.. OObbttaaiinniinngg aa nneeww ssttaannddaarrdd
Limiting our Case Study in Girona Province to the urban sub‐system of public services
in facilities, we find that the land percentages for the use of facilities corresponding to
the time desired to be spent using public services should be at least 11,2% of the total
urban area of a given city. In other words, citizens are satisfied with the amount of
CHAPTER 5. DISCUSSION AND RESULTS 121
services offered in facilities when land for those facilities in the municipality is equal to
or above 11,2%. This value means that the proportion between total urban land and
land specifically designated for the use of facilities (which is a part of the total urban
land) is 11,2%. We propose to use this threshold not only as the design value for
facilities planning but also as the cut‐off for citizen satisfaction, and thereby classify
municipalities into self‐sufficient and non‐self‐sufficient, with respect to the services
offered through facilities.
It is extremely important to mention that the value of 11,2% is above the minimum
level urban planning standard of 5% set by the Catalan Urban Planning Law, and
applicable to the Case Study area. In the Case Study, proportion between land for
facilities and urban land ranges from 0% to 44%. One‐hundred eleven municipalities
are below the satisfaction threshold (11,2%) while fifty‐two are above.
55..44.. OOuuttccoommeess ooff tthhee ccllaassssiiffiiccaattiioonn ooff mmuunniicciippaalliittiieess
For the purpose of finding classification rules for our services and facilities Case Study
in Girona Province, we processed a file containing values on the already mentioned
urban parameters included in our training set. The file contains ten attributes relevant
to determining the self‐sufficiency of municipalities in the urban sub‐system of services
offered in facilities. This includes urban land surface, population, facilities area,
number of services contained in facilities, etc. The attribute “self‐sufficiency” is the
class. The seventy‐six municipalities participating in the classification pilot are the
number of instances. Weka tool has been used as the data mining software [70],
where C4.5 is implemented (named J48 in Weka). To learn classification rules, we first
need to identify which of the attributes is the most discriminating, and therefore
delineates the class. We did not find one completely discriminating attribute, but the
proportion between “facilities area/urban surface” appears to be the most indicative
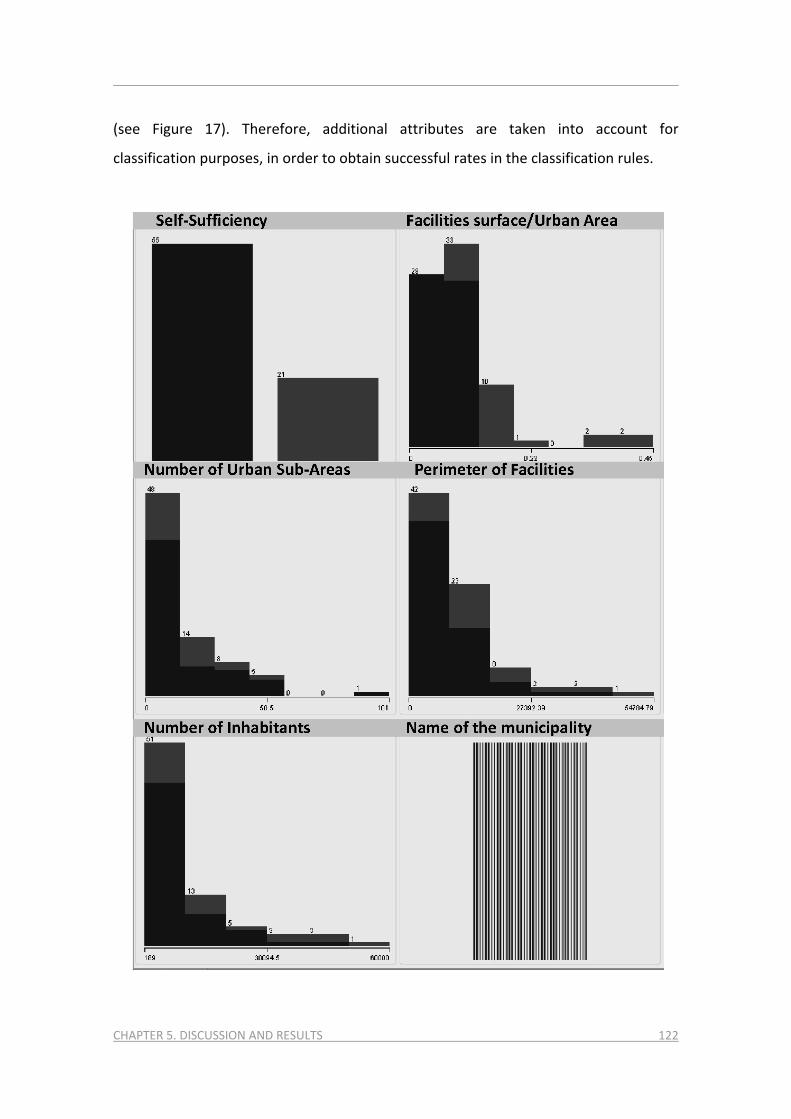
CHAPTER 5. DISCUSSION AND RESULTS 122
(see Figure 17). Therefore, additional attributes are taken into account for
classification purposes, in order to obtain successful rates in the classification rules.

CHAPTER 5. DISCUSSION AND RESULTS 123
Fig. 17. Depiction of potentially discriminating attributes. “Facilities area/urban surface” (second
graphic) most accurately separates the “class” (first graphic). Own elaboration using WEKA software.
We use stratified cross‐validation to estimate the validity of the rules learned. We test
both the 5 and 10‐fold, which means that the technique is processing the instances by
grouping them in 5 and 10 folders. This estimates the predictive capacity of the rules.
We observe no differences in results between the two tests.
In order to learn classification rules to classify instances when the class and the most
discriminating attribute are missing, we eliminate both and run the J48 algorithm with
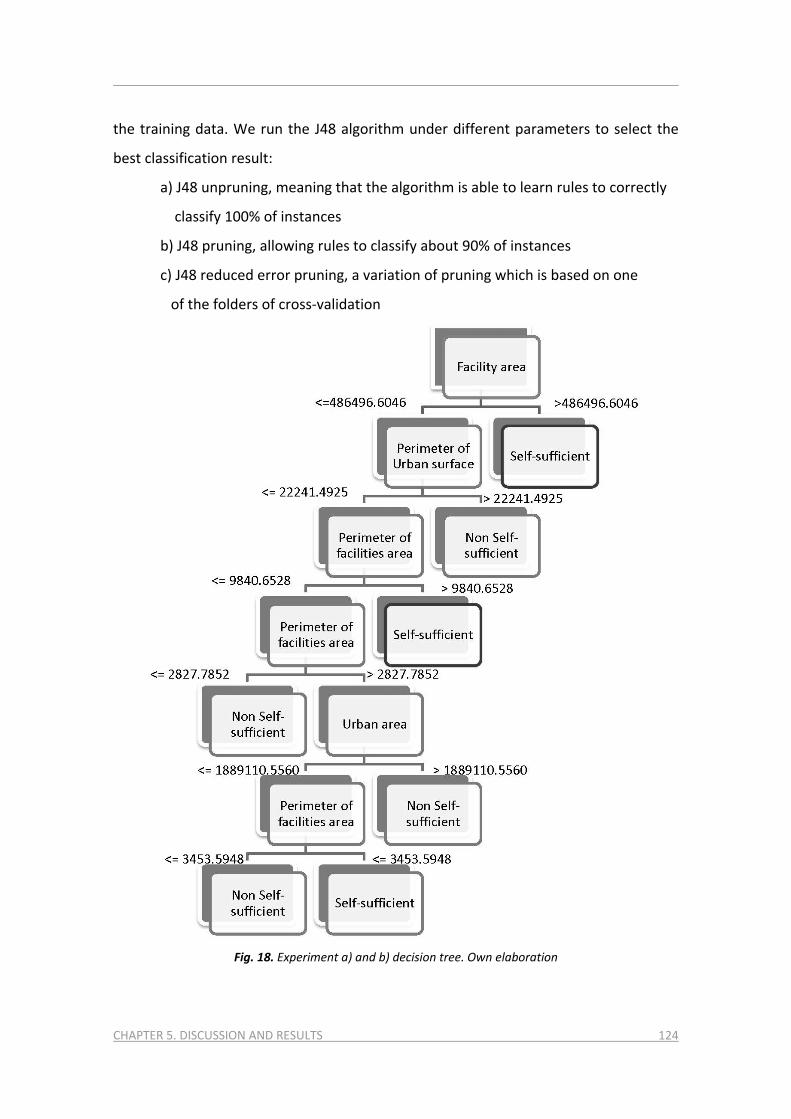
CHAPTER 5. DISCUSSION AND RESULTS 124
the training data. We run the J48 algorithm under different parameters to select the
best classification result:
a) J48 unpruning, meaning that the algorithm is able to learn rules to correctly
classify 100% of instances
b) J48 pruning, allowing rules to classify about 90% of instances
c) J48 reduced error pruning, a variation of pruning which is based on one
of the folders of cross‐validation
Fig. 18. Experiment a) and b) decision tree. Own elaboration

CHAPTER 5. DISCUSSION AND RESULTS 125
In the two first experiments, a) and b), the most discriminating attribute is “facilities
area”. However, in the third one, c), the attribute “number of facilities” is most
discriminating. In a) the unpruning context increases precision and therefore generates
over‐fitting. However, we do not observe very significant differences between the
three experiments.
Figure 18 shows one of the decision trees learned with J48, from which the rules are
derived, showing the tree from the roots to leaves. Each leaf corresponds to the class,
while nodes in the tree are the attributes, and edges the attribute values. The
following insight classification rules can be extracted from the tree of Figure 18:
1) For a facilities area <= 486496.6046 m2 a municipality will be self sufficient if:
Perimeter of Urban surface is <= 22241.4925 m2
And
Perimeter of facilities area is <= 9840.6528 m2
(...)
2) For a facilities area > 486496.6046 a municipality will be non‐self sufficient
Although it has more classification error due to increased accuracy, it is worth
mentioning experiment c) decision tree and its classification rules. Based on the most
discriminating attribute for experiment c), “number of facilities”:
1) For a number of facilities <= 14 municipality will not be self‐sufficient
2) For a number of facilities >14 municipality will be self‐sufficient if:
Perimeter of Urban surface is <= 51006.1098 m2
And
Perimeter of facilities area is <= 9840.6528 m2
(…)

CHAPTER 5. DISCUSSION AND RESULTS 126
55..55 SSuubb--ccllaassssiiffiiccaattiioonn oouuttccoommeess wwiitthh kknnnn
In our Case Study, quantitative missing values for services’ physical size are 57% of the
total number of instances. Hence, to conduct the desired sub‐classification, we have to
deal with missing values techniques to complete the data set.
When applying the K‐NN algorithm to deal with missing values on services physical
size, we understand that the high percentage of missing values might diminish the
accuracy of our results, according to [167]. Accordingly, since we may be outside of the
supposedly optimal parameters, we begin by testing different values of k, aside from
the square root of the number of complete cases (1705 instances).
We start with a K‐NN=1, and analyze three different scenarios:
a) Select the closest cases according to population
b) Select the closest cases according to population and facility ownership (public
or private)
c) Select the closest cases according to population, facility ownership, and kind of
service (specific type of basic or complimentary categories, such as education,
culture, etc.)
Best results are expected in scenario (c), since it contains the largest combination of
attributes and better defines a service. We understand best results as more
meaningful, closer to reality, and with fewer repeated values. For K=1, best results are
obtained in combination (b). Therefore, we continue testing with K=5, now obtaining
the best results in the combination of attributes (c). For K=10, best results continue
being obtained in combination (c). For K=20, best results still reside in set (c), and in
addition they are more realistic and have fewer repetitions than in K=10. For K=30 and
K=40, best results are found in combination (b). This leads us to stop testing for k
values. According to the findings of recent research, the best k values should be
CHAPTER 5. DISCUSSION AND RESULTS 127
obtained from the square root of the number of complete cases, which is 26 for our
Case Study of 1705. When testing K=26, we find that the best results still remain in
K=20. We attribute this small deviation from the rule of the square root to the
elevated number of missing values with respect to the supposedly optimal accuracy
threshold.
After completing our data training set missing values with results obtained from K=20,
we start essaying to obtain classification rules to sub‐classify the previously obtained
two groups of self‐sufficient and non‐self‐sufficient municipalities into four groups,
namely 1a) Totally Non Self‐Sufficient Municipalities (TNSSM), 1b) Partially Non‐Self
Sufficient Municipalities (PNSSM), 2a) Partially Self‐Sufficient Municipalities (PSSM),
and 2b) Totally Self‐Sufficient Municipalities (TSSM).
We apply the same classification method as for the self‐sufficiency classification to sub
classify the first pair (1a/1b), namely algorithm J48, under unpruned and pruned
parameters. We obtain the same classification results under both J48
parametrizations, with the same decision tree. Next, classification rules have been
generated, allowing us to sub‐classify municipalities when most discriminating
attributes are missing, and we need to predict the totally or partially non‐self
sufficiency class. We observe that there is no discriminating attribute, and therefore
we run the algorithm to learn classification rules by only eliminating the class. A unique
classification rule is obtained: municipalities with fewer than 3993 inhabitants are sub‐
classified as Totally Non‐Self Sufficient, and municipalities above 3993 inhabitants are
sub‐classified as Partially Non‐Self‐Sufficient. Under this rule, seven municipalities are
sub‐classified as Totally Non‐Self‐Sufficient, while twenty‐six pertain to the subgroup
of Partially Non‐Self‐Sufficient.
We proceed with the same method to sub classify the self‐sufficient pair 2a/2b. But
the results are different, and we can not obtain sub‐classification rules. This makes our
previous task of completing missing values much more relevant, and leads us to sub‐
CHAPTER 5. DISCUSSION AND RESULTS 128
classify with a sole method of services identification. Thus, a municipality will be
Partially Self‐Sufficient when one or many complimentary services are not covered,
and Totally Self‐Sufficient when offer exists for all circumstantial services, and in values
which are equal to or above the average defined by self‐sufficient municipalities. Out
of the one‐hundred thirty‐four self‐sufficient municipalities, thirty‐tree are Totally Self‐
Sufficient, while one‐hundred one are classified as Partially Self‐Sufficient.
55..66.. SSuummmmaarryy In this Chapter we prove the Method through a Case Study in the Girona province.
Among the different outcomes, first it is interesting to highlight that the Method goes
beyond providing an accurate answer to the current urban needs of citizens by also
discovering future and uncovered needs as revealed through desired urban use.
Second, the Method's rule of correspondence processes citizens’ targeted urban time
use distribution, and through the indicators of equivalence previously found between
current urban time use and urban land use, the corresponding land allocation is found.
In our Case Study in Girona Province, new planning values for the public services
offered in facilities were obtained. This is also possible for other urban land uses such
as public space, transport infrastructure, retail sales, housing, etc.
Third, with the new planning values obtained for the specific land use of public
facilities, municipalities participating in the Case Study were also classified. Therefore,
the Method not only updates municipal planning standards, it also establishes a
regional classification of municipalities according to the new indicators obtained,
which are also the satisfaction thresholds of citizens for the specific land use. Hence,
the new indicators or satisfaction thresholds of each land use constitute, in turn, the
level of municipal self‐sufficiency for this specific land use. Sufficiency will be achieved
if municipal levels of a specific use are above the satisfaction threshold of citizens.
Below the threshold, municipalities must be considered non self‐sufficient, because

CHAPTER 5. DISCUSSION AND RESULTS 129
there is insufficient quantity of the specified use, and citizens must to commute to the
next municipality offering that specific use.
Fourth, for the purpose of municipal classification on self‐sufficiency, we prove that
the J48 algorithm provides good results, as we obtain useful automatic rules for
classifying municipalities beyond sufficiency values. Therefore, a municipality can be
easily classified without knowing the class (self‐sufficiency). Typical urban databases
containing only basic information such as municipal population or quantities of a
specific land use are enough to classify the municipality for that land use.
And fifth, subsequent classification on self‐sufficiency for a specific land use is possible
with larger land use data bases detailing land use characteristics. However, urban data
bases can have a number of unknown values, and this is more problematic with larger
datasets. In our Method, we prove that sub‐classification is possible by completing
missing values of urban databases using the K‐NN technique. With this technique we
successfully sub‐classify the self‐sufficiency condition on public services and facilities
into four subgroups, making a distinction between self‐sufficiency in basic and
complimentary services.
Summarizing, we can claim that the ICT‐based method is proved to help urban
planners to obtain citizen‐centered values for conducting their activities.

CHAPTER 5. DISCUSSION AND RESULTS 130
CHAPTER 6.CONCLUSIONS AND FURTHER RESEARCH 131
66.. CCOONNCCLLUUSSIIOONNSS AANNDD FFUURRTTHHEERR RREESSEEAARRCCHH
The main objective of this work is to review and update urban planning values in a
more objective and citizen‐centered manner. To that end we elaborated the Smart
Urban Planning Method, based on the use of ICT. It has been proven that the Method
successfully obtains new urban planning values, and has many further applications. We
have implemented one of these applications by classifying a set of municipalities on
the basis of self‐sufficiency. Furthermore, we accompanied the dissertation of the
Method with additional explorations on significant and related topics. A description of
the three main contributions of this work: objective, application of the methodology
and exploratory insights, follows.
66..11.. CCoonnttrriibbuuttiioonnss
OBJECTIVE: TO ELABORATE A CITIZEN‐CENTERED METHOD TO UPDATE URBAN PLANNING VALUES
Urban planning methodologies require urgent revision because they are based on
obsolete and subjective planning values for urban design. As part of this revision, the
role of citizens should also be updated, so they can contribute more meaningfully to
master plans proposals. In our Smart Urban Planning Method, ICT technologies
constitute the basis for gathering and processing objective data regarding urban time
use of citizens, using web‐based surveys and data mining tools.
Our Method constitutes a way to update obsolete urban planning values with new
values coming from data about citizens' actual use and desired use of their cities.
Therefore, the new planning values obtained with the Smart Urban Planning Method
guarantee an urban land offer and urban uses which perfectly meet citizens' urban
needs.

CHAPTER 6.CONCLUSIONS AND FURTHER RESEARCH 132
The Smart Urban Planning Method goes beyond providing an accurate answer to the
current urban needs of citizens, by also discovering future and uncovered needs as
revealed through desired urban use. The Method's rule of correspondence processes
citizens’ targeted urban time use distribution, and through the indicators of
equivalence previously found between current urban time use and urban land use, the
corresponding land allocation is found.
APPLICATION OF THE METHODOLOGY: METHODS TO CLASSIFY MUNICIPALITIES
For the purpose of municipal classification on self‐sufficiency, we obtain useful
automatic rules for classifying municipalities beyond sufficiency values, thanks to the
use of inductive learning methods (C4.5). Therefore, a municipality can be easily
classified without knowing the class (self‐sufficiency). Typical urban databases
containing only basic information such as municipal population or quantities of a
specific land use are enough to classify the municipality for that land use.
Subsequent classification on self‐sufficiency for a specific land use is possible with
larger land use data bases detailing land use characteristics. However, urban data
bases can have a number of unknown values, and this is more problematic with larger
datasets. In our Method, we prove that sub‐classification is possible by completing
missing values of urban databases using the K‐NN technique. With this technique we
successfully sub‐classify the self‐sufficiency condition on public services and facilities
into four subgroups, making a distinction between self‐sufficiency in basic and
complimentary services.
EXPLORATORY INSIGHTS OF THE METHOD
The Smart City concept uses ICT technologies within the urban fabric to make our cities
more efficient and optimize the use of natural resources. This results in significant

CHAPTER 6.CONCLUSIONS AND FURTHER RESEARCH 133
economic savings, protection of the environment, and higher living standards and
quality of life. Under this perspective, the pioneering Smart Urban Planning Method
uses ICT technologies to develop more informed and objective planning, and thereby
better achieve the main urban planning goal, which is to cover the needs of citizens.
The Smart Urban Planning Method fills the existing gap of smart solutions in the urban
planning arena.
The Smart Urban Planning Method learns about the needs of citizens through a survey
on urban time use. To make the survey Method more sophisticated, and increase
accuracy and readiness in the responses, we propose an adaptive hypermedia survey.
In addition to the benefits of the Method in the areas of municipal and regional
planning, The Smart Urban Planning Method improves public participation in the urban
planning approval process. As an extension of the Method we propose the use of
agent technology to obtain collective opinion on urban proposals in which urban
planning values obtained with our Method materialize.
Finally, it is important to mention that the Smart Urban Planning Method contributes
to the Smart City Initiative in the urban planning context, providing planning
innovation at municipal and regional levels. We identify inefficiencies in the
presentation of urban data which make it difficult to get maximize the utility of the
Method. We present an insight concerning a model for integrated urban data
visualization and representation, which could help solve these inefficiencies.
CHAPTER 6.CONCLUSIONS AND FURTHER RESEARCH 134
66..22.. NNeexxtt rreesseeaarrcchh sstteeppss
SMART CITY ASSOCIATED BENEFITS OF BUILDING AN URBAN REAL‐ TIME USE DATA‐
COLLECTION SOLUTION FOR MORE STRATEGIC UPDATING OF URBAN PLANNING
VALUES
Further research can be done on opinion‐mining of citizens at the time of the survey,
and on real‐time data mining as long as new data is available. To obtain real‐time data
on the urban time use of the city, the Smart Urban Planning Method needs adaptive
hypermedia survey techniques, agent‐based models, and integrated urban data
presentation, and to cooperate with Smart City technological solutions already
operating in our cities.
Cooperation between the Smart Urban Planning Method and the existing Smart City
data collection solutions would contribute to more complete success of the Smart City
Global Initiative. The Smart Urban Planning Method provides a perfect platform for
coordinating sensing technologies for urban data collection, which are already making
our cities smarter, with both urban development strategies and growth policies
proposed by master plans in light of the new planning values obtained with our
Method.
The Smart Urban Planning Method can lead a new generation of urban master plans,
based on ICT, which make possible to coordinate data captured in the city through the
deployment of sensing technologies with Method’s new planning values. This, in turn,
permits real updating of planning values, plus more strategic action in the specific city
aspects controlled by sensors, by expanding their sensitive capacities to actuation
functionalities. For instance, a sensor controlling traffic pollution with actuation
functionalities could report to drivers to adjust the speed limit in coordination with the
planning values obtained for the transport sub‐subsystem. Thereby, real‐time data
CHAPTER 6.CONCLUSIONS AND FURTHER RESEARCH 135
captured by the urban sensors together with real‐time data which citizens report via
mobile phones would constitute an innovation that moves beyond the opinion survey
used in this Case Study. This needs to be explored, and will constitute the basis of our
future research.
Real‐time data poses challenges associated with big‐data. The term ‘big data’ refers to
data sets which exceed standard software capacities to gather, process and manage
data in a reasonable time frame. Indeed, we will have to consider the difficulties and
challenges real‐time data generates when developing future implementations of our
Method, and especially because we aim to process real time data which will mean not
only to have big data sets but to process them continuously. In the area of big data
analytics, the Senseable Lab at MIT is leading a number of projects on big data
analytics. Here, we highlight The Urban Code project, analyzing how big data is
impacting the various facets of urban living, a reference to look at when developing
next research steps.

CHAPTER 6.CONCLUSIONS AND FURTHER RESEARCH 136
REFERENCES 137
77.. RREEFFEERREENNCCEESS AA 1. S. Aciar, D. Zhang, S. Simoff, J. Debenham, Informed recommender agent: Utilizing
consumer product reviews through text mining. Editor(s): Butz CJ, et al.
IEEE/WIC/ACM Intl Conf. on Web Intel. and Agent Technology (2006) 37‐40
2. Ajuntament de Barcelona. Indicadors 21. Indicadors locals de sostenibilitat a
Barcelona (2003). Documents 8
3. C. Alexander, S. Smith‐Voysey, K. Jarvis, C. Tansey, Integrating building footprints
and LiDAR elevation data to classify roof structures and visualize buildings, Computers
Environment and Urban Systems, 33 (4) (2009) 285‐292
4. TA. Arentze, A. Borgers, LD. Ma, H. Timmermans, An agent‐based heuristic method
for generating land‐use plans in urban planning, Environment and Planning B‐Planning
& Design, 37 (2010) 463‐482
5. G. Aschwanden, S. Haegler, F. Bosche, L. Van Gool, G. Schmitt, Empiric design
evaluation in urban planning, Automation in Construction, 20 (2011) 299‐310
BB 6. JR. Barton, Urban sustainability as strategic planning, EURE‐Revista latinoamericana
de estudios urbano regionales, 32 (96) (2006) 27‐45
7. M. Batty, Cities and Complexity: Understanding Cities with Cellular Automata,
Agent‐Based Models, and Fractals. The MIT Press (2007)

REFERENCES 138
8. J. Beck, P. Jia, J. Sison, J. Mostow, Predicting student help‐request behavior in an
intelligent tutor for reading, in: Proceedings 9th Int. Conf. User Model, Lecture Notes
in Artificial Intelligence, 2702 (2003) 303–312.
9. MC. Belloni, MC, Tempi delle citta ‐ Italy's urban time plans and policies, Time &
Society, 7 (2) (1998) 249‐263
10. D. Benyon, Adaptive systems: A solution to Usability Problems, Journal of User
Modeling and User Adapted Interaction, 1‐3 (1993) 1‐22.
11. Berlin Muncipality. Senate Department for Urban Development and Environment
http://www.stadtentwicklung.berlin.de/umwelt/info_system/index_en.shtml
12. M. Birkin, H. Malleson, A. Hudson‐Smith, S. Gray, R. Milton, Calibration of a spatial
simulation model with volunteered geographical information. International Journal of
Geographical Information science, 25 (8) (2011) 1221‐1239
13. T. Blanke, M. Hedges, R. Palmer, Restful services for the e‐Humanities ‐ web
services that work for the e‐Humanities ecosystem, 3RD IEEE International Conference
on Digital Ecosystems and Technologies (2009) 290‐295
14. J. Bogdahn, V. Coors, V. Sachdeva, A 3D tool for public participation in urban
planning. Editor(s): Coors V., Rumor M., Fendel E., Zlatanova S. Urban and Regional
Data Management. Procs. and Monographs in Eng., Water and Earth Sciences (2008)
231‐236
15. V. Bogorny, H. Avancini, BC. de Paula, CR. Kuplich, LO. Alvares, Weka‐STPM: a
Software Architecture and Prototype for Semantic Trajectory Data Mining and
Visualization, Transactions in GIS, 15 (2) (2011) 227‐248

REFERENCES 139
16. P. de Bra, G‐J. Houben, H. Wu, AHAM: A dexter‐based reference model for adaptive
hypermedia, In: J. Westbomke, U.K. Wiil, J.J. Leggett, K. Tochtermann and J.M. Haake
(Eds), Hypertext’99: Proceedings of the Tenth ACM Conference on Hypertext and
Hypermedia: Returning to our Diverse Roots, (1999) 147‐156
17. P. de Bra, L. Aroyo, V. Chepegin, The Next Big Thing: Adaptive Web‐ Based Systems,
Journal of Digital Information, 1‐5 (2004a)
18. P. de Bra, L. Aroyo, A. Cristea, Adaptive Web‐based Educational Hypermedia, in M.
Levene and A. Poulovassilis (eds.), Web Dynamics, Adaptive to Change in Content, Size,
Topology and Use (2004b) 387‐410.
19. DC. Brabham, Crowdsourcing the Public Participation Process for Planning
Projects, Planning Theory, 8 (3) (2009) 242‐262
20. C. Brennan‐Horley, Mental mapping the 'creative city', Journal of Maps (2010) 250‐
259
21. Bristol Municipality
http://www.bristol.gov.uk/node/4103]
22. P. Brusilovsky, Adaptive hypermedia, an attempt to analyze and generalize, Lecture
Notes in Computer Science, 1077 (1996) 288‐304.
23. P. Brusilovsky, Adaptive hypermedia, User Modeling and User Adapted Interaction,
11 (2002) 87–110
24. P. Brusilovsky, M.T. Maybury, From adaptive hypermedia to the adaptive web,
Communications of the ACM, 45 (5) (2002) 30‐33

REFERENCES 140
25. P. Brusilovsky, E. Millán, User Models for Adaptative Hypermedia and Adaptative
Educational Systems, in: The Adaptative Web, Lecture Notes in Computer Science,
4321 (2007) 3‐53
26. G. Bubas, D. Kermek, The prospects for blended learning in Croatian academic
institutions, in: Proceedings CARNet Users Conference (2004)
27. G. Bugs, C. Granell, O. Fonts, J. Huerta, M. Painho, An assessment of Public
Participation GIS and Web 2.0 technologies in urban planning practice in Canela,
Brazil, Cities, 27 (3) (2010) 172‐181
CC 28. A. Caballero, M. Alvarez, JL. Abreu, E. Caballero, Methodology for classification of
municipalities in the state of Hidalgo (Mexico), M. Demiralp, WB. Mikhael, AA.
Caballero, N. Abatzoglou, MN. Tabrizi, R. Leandre, M. GarciaPlanas, RS. Choras (Eds.)
ACMOS '08: Proceedings of the 10th WSeas International Conference on Automatic
Control, Modelling and Simulation, Book Series: Electrical and Computer Engineering
(2008) 406‐410
29. ML. Calijuri, E. Marques, A. Meira, F. Maia, E. Bhering, Digital land‐use cartography
‐ the example of Vicosa, Brazil. Engineering Geology, 63 (1‐2) (2002) 1‐16
30. J. Callan, A. Smeaton, M. Beaulieu, P. Borlund, P. Brusilovsky, M. Chalmers, C.
Lynch, J. Riedl, B. Smyth, U. Straccia, Personalization and recommender systems in
digital libraries, 2nd DELOS Workshop Personalization and Recommender Systems in
Digital Libraries (2001)
31. JM. Campanera, P. Higgins, Quality of life in urban‐classified and rural‐classified
English local authority areas, Environment and Planning A, 43 (3) (2011) 683‐702

REFERENCES 141
32. A. Caragliu, C. del Bo, P. Nijkamp, Smart cities in Europe, CERS 2009 ‐ 3rd Central
European Conference in Regional Science, International Conference Proceedings
(2009) 45‐59
33. J. Carr, Public Input/Elite Privilege: The use of participatory planning to reinforce
urban geographies of power in Seattle, Urban Geography, 33 (3) (2012) 420‐441
34. MH. Cartwright, MJ. Shepperd, Q. Song, Dealing with missing software project
data, IEEE Computer Society, Ninth International Software Metrics Symposium,
Proceedings (2003) 154‐165
35. A. Casali, L. Godo, C. Sierra, Validation and Experimentation of a Tourism
Recommender Agent based on a Graded BDI Model. Editor(s): Alsinet T, PuyolGruart J,
Torras C. AI Research and Dev., Frontiers in Artificial Intelligence and Applications, 3
(2008) 41‐50
36. J. Chen, J. Jiang, A. Yeh, Designing a GIS‐based CSCW system for control with an
event‐driven approach, Photogrammetric Eng. and Remote Sensing, 70 (2004) 225‐
233
37. CP. Chen, YJ. Ding, SY.Liu, City Economical Function and Industrial Development:
Case Study along the Railway Line in North Xinjiang in China, Journal of Urban Planning
and Development‐ASCE, 134 (4) (2008) 153‐158
38. C. Chen, M. Chen, Mobile formative assessment tool based on data mining
techniques for supporting web‐based learning, Computer & Educaction Journal, 52 (1)
(2009) 256‐273.
REFERENCES 142
39. JH. Chiang, YC. Chen, An intelligent news recommender agent for filtering and
categorizing large volumes of text corpus, Intl J. of Intelligent Systems, 19 (2004) 201‐
216
40. L. Chittaro, R. Ranon, L. Ieronutti, VU‐flow: A visualization tool for analyzing
navigation in virtual Environments, IEEE Transactions on Visualization and Computer
Graphics, 12(6) (2006) 1475‐1485.
41. L. Cobaleda, F. Duitama, Content personalization in adaptive educational
hypermedia systems: Review, Revista Facultad de Ingenieria‐ Universidad de
Antioquia, 50 (2009) 217‐226
42. J. Colding, ‘Ecological land‐use complementation' for building resilience in urban
ecosystems, Landscape and Urban Planning, 81 (1‐2) (2007) 46‐55
43. V. Coors, U. Jasnoch, V. Jung V, Using the Virtual Table as an interaction platform
for collaborative urban Planning, Computers & Graphics‐UK, 23 (4) (1999) 487‐496
44. M. Coutinho, R. Neches, A. Bugacov, V. Kumar, KT. Yao, Y. Ko, R. Eleish, S.
Abhinkar, GeoWorlds: A geographically based situation understanding and information
management system for disaster relief Operations, World Multiconference on
Systemics, Cybernetics and Informatics, 1 (1999) 133‐136
45. M. Craglia, L. Leontidou, G. Nuvolati, J. Schweikart, Towards the development of
quality of life indicators in the 'digital' city, Environment and Planning B‐Planning &
Design, 31(1) (2004) 51‐64
46. A. Cristea, L. Calvi, The three layers of adaptation granularity, in: P. Brusilovsky, A.
Corbett, F. DeRosis (eds), Proceedings 9th International Conference on User Modeling
Location, Johnstown, PA, Lecture Notes in Artificial Intelligence, 2702 (2003) 4‐14

REFERENCES 143
DD 47. CY. Dai, T. Li, Research on the Application of Virtual Reality Technology in the
Large‐scale Public Construction Planning Dynamic Analysis, Editor(s): China Civil Eng.
Soc., Chinese Acad. of Eng./DCHAE; Tongji Univ., China State Construction Eng. Co. Ltd.
Proceedings of Shanghai Intl. Conf. on Tech. of Architecture and Structure (2009) 580‐
586
48. CH. Dong, JP. Hu, L. Wang, Application of a Virtual Geosciences Modelling System
in Digital City, Construction, Information Technology for Manufacturing Systems, 1‐2
(2010) 1311‐1314
49. J. Dijkstra, H. Timmermans, Towards a multi‐agent model for visualizing simulated
user behavior to support the assessment of design performance, Automation in
Construction, 11 (2002) 135‐145
50. L. Duc‐Long, N. An‐Te, N. Dinh‐Thuc et al., A Survey of Applying User Profile in the
Adaptive Instructional Systems, in: Proceedings 5th International Conference on e‐
Learning (2010) 207‐218
51. Dublin Municipality. Railway Procurement Agency
http://www.rpa.ie/en/Pages/default.aspx
52. I. Dzitac, I. Moisil, Advanced AI Techniques for Web Mining, Editor(s): Mastorakis
NE, Poulos M., Mladenov V, Bojkovic Z, Simian D, Kartalopoulos S. Mathematical
Methods, Computational Techniques, non‐linear Systems, Intelligent Systems, Book
Series: Mathematics and Computers in Science and Engineering (2008) 343‐346
EE 53. Edmonton Municipality
http://www.edmonton.ca/city_government/planning_development/neighbourhood‐
indicators.aspx

REFERENCES 144
54. MC. El‐Mezouar, N. Taleb, K. Kpalma, J. Ronsin, A high‐resolution index for
vegetation extraction in IKONOS images, Remote Sensing for Agriculture, Ecosystems,
and Hydrology. Proceedings of SPIE‐The International Society for Optical Engineering,
7824 (2010) Art. Num. 78242ª
55. European Comission. Eurostat. Urban Audit
http://epp.eurostat.ec.europa.eu/portal/page/portal/region_cities/city_urban
56. European Comission. INSPIRE Directive.
http://inspire.jrc.ec.europa.eu/
57. European Comission. Public Sector Information ‐ Raw Data for New Services and
Products http://ec.europa.eu/information_society/policy/psi/index_en.htm
58. European Office of Statistics (Eurostat). Urban Audit database
http://epp.eurostat.ec.europa.eu/portal/page/portal/region_cities/city_urban
59. R. Ewing, R. Pendall, D. Chen, Measuring sprawl and its transportation impacts,
Travel Demand and Land Use 2003: Planning and Administration, in: Transportation
Research Record, 1831 (2003) 175‐183
FF 60. F. Fahy, MO. Cinneide, Community‐based quality of life indicators for urban areas
as derived in Galway City, Ireland, Sustainable City IV : Urban Regeneration and
Sustainability, in: Mander, U; Brebbia, CA; Tiezzi, E (Eds.) WIT Transactions on Ecology
and the Environment, (2006) 691‐702

REFERENCES 145
61. F. Fahy, MO. Cinneide, Developing and testing an operational framework for
assessing quality of life, Environmental Impact Assessment Review, 28 (6) (2008) 366‐
379
62. O. Fatukasi, J. Kittler, N. Poh, Estimation of Missing Values in Multimodal Biometric
Fusion, 2008 IEEE Second International Conference on Biometrics: Theory, Applications
and Systems (BTAS) (2008) 117‐122
63. J. Fink, A. Kobsa, J. Schreck, Personalized hypermedia information provision
through adaptive and adaptable system features: User modelling, privacy and security
issues, in: Mullery A; Besson M; Campolargo M; et al (eds.) Proceedings 4th
International Conference on Intelligence in Services and Networks (IS&N 97):
Intelligence in Services and Networks: Technology for Cooperative Competition,
Lecture Notes in Computer Science, 1238 (1997) 459‐467
64. E. Frias‐Martinez, Y. Chen Sherry, X. Liu, Survey of data mining approaches to user
modeling for adaptive hypermedia, IEEE Transactions on Systems Man and Cybernetics
36, Part c, Applications and Reviews, 6 (2006) 34‐749
65. J‐H. Friedman, F. Baskett, L‐J Shustek, An algorithm for finding nearest neighbors,
IEEE Transactions on Computer Sciencet, 24 (10) (1975) 1000–1006
GG 66. G. Galster, R. Quercia, A. Cortes, Identifying sustainable neighborhoods: An
empirical exploration of threshold effects, Sustainable City: Urban Regeneration and
Sustainability, in: Brebbia, CA; Ferrante, A; Rodriguez, M; Terra, B (Eds.) Advances in
Architecture Series, 9 (2000) 371‐380

REFERENCES 146
67. S. Garruzzo, D. Rosaci, G. Sarne, MARS: An agent‐based recommender system for
the semantic Web, Editor(s): Indulska J, Raymond K. Distributed Applications and
Interoperable Systems, Proceedings Book Series: LNCS 4531 (2007) 181‐194
68. E. Gordon, S. Schirra, J. Hollander, Immersive planning: a conceptual model for
designing public participation with new technologies, Environment and Planning B‐
Planning & Design, 38 (3) (2011) 505‐519
69. B. Guindon, Y. Zhang, C. Dillabaugh, Landsat urban mapping based on a combined
spectral‐spatial methodology, Remote Sensing of Environment, 92 (2) (2004) 218‐232
HH 70. M. Hall, E. Frank, G. Holmes, BP. Fahringer, P. Reutemann, IH. Witten, The WEKA
Data Mining Software: An Update, SIGKDD Explorations, 11 (1) (2009)
71. J. Han, Y. Hayashi, X. Cao, H. Imura, Application of an integrated system dynamics
and cellular automata model for urban growth assessment: A case study of Shanghai,
China, Landscape and Urban Planning, 91(3) (2009) 133‐141
72. P. Harris, The Technopolis Phenomenon ‐ Smart Cities, Fast Systems, Global
Networks, Behavioral Science, 38 (2) (1993) 141‐143
73. G. Haubl, K. Murray, Double agents. MIT SLOAN Management Review, 47 (2006)
74. R. Hetherington, B. Farrimond, P. Clynch, Embodying and extracting data in Web3D
models of proposed building developments, Computer Graphics, Imaging and
Visualisation: New Advances. International Conference on Computer Graphics Imaging
and Visualization, 1 (2007) 528‐533

REFERENCES 147
75. J. Herlocker, JA. Konstan, L. Terveen, J. Riedl J, Evaluating collaborative filtering
recommender systems, ACM Transactions on Information Systems (TOIS), 22 (2004)
76. R. Hoekstra, R. Winkels, E. Hupkes, Spatial Planning on the Semantic Web.
Transactions in GIS, 14 (2) (2010) 147‐161
77. N. Hoic‐Bozic, V. Mornar, I. Boticki, A Blended Learning Approach to Course Design
and Implementation, IEEE Transactions on Education, 52 (1) (2009) 19‐30
78. Hong‐Kong Muncipality
http://www2.cuhk.edu.hk/ssc/qol/eng/hkqol.html
79. TLJ. Howard, N. Gaborit, Using virtual environment tech. to improve public
participation in urban planning process, Journal of Urban Planning and Developement,
ASCE, 133 (4) (2007) 233‐241
80. M. Hudec, M. Vujosevic, A fuzzy system for municipalities classification, Central
European Journal of Operations Research, 18 (2) (2010) 171‐180
II 81. DS. Iacofano, NK. Lewis, Maximum Feasible Influence: The new standard for
American public participation in planning, Journal of Architectural and Planning
Research, 29 (1) (2012) 30‐44
82. N. Ibrahim, N. Noor, Navigation technique in 3D information visualization. TENCON
2004 – 2004. IEEE Region 10 Conference, Proceedings: analog and digital techniques in
electrical engineering, A‐D (2004) B379‐B382
83. Indian National Government. Space Department
http://www.isro.org/scripts/rsa_nuis.aspx

REFERENCES 148
84. Indian National Government and Janaagraha
85_http://www.janaagraha.org/civicissue/quality‐life‐indicators
85. IneBase. Instituto Nacional de Estadística (National Statistics Institute). Spain.
http://www.ine.es/en/inebmenu/indice_en.htm#2
86. Instituto Nacional de Estadística (National Statistics Institute). Spain.
http://www.ine.es/
87. International Living. Cities’ quality of life ranking.
http://internationalliving.com/2010/02/quality‐of‐life‐2010/
JJ 88. Jacksonville Community Council
http://www.jcci.org/jcciwebsite/pages/indicators.html
89. A. Jain, R‐C. Dubes, Data clustering, ACM Computer Survey, 31 (1999) 264–323
90. P. Jonsson, C. Wohlin, An evaluation of k‐nearest neighbour imputation using Likert
data. IEEE Computer Society, 10th. International Symposium on Software Metrics,
Proceedings (2004) 108‐118
KK 91. WA. Kamakura, A. Wagner, American Time‐Styles: A Finite‐Mixture Allocation
Model for Time‐Use Analysis, Multivariate Behavioral Research, 44 (3) (2009) 332‐361
92. M. Kantardzic, Data Mining: Concepts, Models, Methods, and Algorithms, John
Wiley & Sons, New Jersey (2003)
93. H. Karoui, P. Kanawati, L. Petrucci, COBRAS: Cooperative CBR system for
bibliographical reference recommendation, Editor(s): RothBerghofer TR, Goker MH,

REFERENCES 149
Guvenir HA, Advances in Case‐Based Reasoning, Proceedings Book Series: Lecture
Notes in Artificial Intelligence, 4106 (2006) 76‐90
94. M. Kassoff, C. Petrie, LM. Zen, M. Genesereth, Semantic Email Addressing, The
Semantic Web Killer App? IEEE Internet Computing (2009) 30‐37
95. A. Kavcic, The Role of User Models in Adaptive Hypermedia Systems, in:
Proceedings of the 10th Mediterranean Electrotechnical Conference MeleCon (2000)
96. SS. Kim, SH. Lee, SK. Choe, JH. Lee, Component based 3D GIS software design for
the Urban Planning, Management Information Systems 2002: Incorporating GIS and
Remote Sensing, Management Information Systems, 4 (2002) 205‐214
97. JH. Kim, HJ. Kwon, KS. Hong, Location awareness‐based intelligent multi‐agent
technology, Multimedia Systems, 16 (2010) 275‐292
98. E. Knutov, P. De Bra Paul and M. Pechenizkiy, AH 12 years later: a comprehensive
survey of adaptive hypermedia methods and techniques, New Review of Hypermedia
and Multimedia, 15 (2009) 5‐38
99. A. Kobsa, J. Koenemann, W. Pohl, Personalized hypermedia presentation
techniques for improving online customer relationships, The Knowledge Eng. Review,
16 (2001) 111‐55.
100. T. Kohonen, Self‐Organizating Maps (1997)
101. XD. Kou, L. Yang, L. Cai, Artificial Urban Planning: Application of MAS in Urban
Planning Education. Intl. Symp. on Computational Intelligence and Design, 2 (2008)
349‐353

REFERENCES 150
102. Y. Kusumura, Y. Hijikata, S. Nishida, NTM‐Agent: Text mining agent for net
auction. IEICE Transactions on Inf. and Systems E87D (2004) 1386‐1396
103. B. Krulwich, Lifestyle finder: intelligent user profiling using large‐scale
demographic data, Artificial Intelligence Magazine, 18 (1997) 37‐45.
LL 104. PC. Lai, KH Kwong, A. Mak, Assessing the applicability and effectiveness of 3D
visualization in environmental impact assessment, Environment and Planning B‐
Planning & Design, 37 (2) (2010) 221‐233
105. E. Lange, The limits of realism: perceptions of virtual landscapes, Landscape and
Urban Planning, 54(1‐4) (2001) 163‐182
106. R. Lau, Belief revision for adaptive recommender agents in E‐commerce.
Editor(s): Liu J, Cheung YM, Yin HJ. Intelligent Data Engineering and Automated
Learning, Book Series: Lecture Notes in Computer Science, 2690 (2003) 99‐103
107. CS. Lee, Y‐P. Singh, Student modeling using principal component analysis of SOM
clusters, in: X. Kinshuk, C.K. Looi, E. Sutinen et al., Proceedings 4th IEEE International
Conference on Advanced Learning Technologies, (2004) 480‐484
108. CS. Lee, MH. Wang, HA. Hagras, Type‐2 Fuzzy Ontology and its Application to
Personal Diabetic‐Diet Recommendation, IEICE Trans. on Info. and Systems, 18 (2010)
374‐395
109. J. Lee, Quality of Life and Semipublic Spaces in High‐Rise Mixed‐Use Housing
Complexes in South Korea, Journal of Asian Architecture and Building Engineering,
10(1) (2011) 149‐156

REFERENCES 151
110. J. Lee, S. Baik, C. Lee, Building an Integrated Service Management Platform for
Ubiquitous Ecological Cities, Computer, 44(6) (2011) 56‐63
111. N. Lele, L. Wu, R. Akavipat, F. Menczer, Sixearch.org 2.0 peer application for
collaborative web search, Conference on Hypertext and Hypermedia archive.
Proceedings of the 20th ACM conference on Hypertext and Hypermedia table of
contents (2009) 333‐334
112. S. Li, Multi‐factor prediction of urban reference land price based on principal
component analysis and BP network, Proceedings of the 5th Asia‐Pacific Conference on
Control & Measurement (2002) 269‐273
113. X. Li, AG. Yeh, Principal component analysis of stacked multi‐temporal images for
the monitoring of rapid urban expansion in the Pearl River Delta, International Journal
of Remote Sensing, 19 (8) (1998) 1501‐1518
114. X. Li, XP. Liu, Embedding sustainable development strategies in agent‐based
models for use as a planning tool, Intl. Journal of Geographical Information Science, 22
(2008) 21‐45
115. C. Li, Y. Yoo, Modeling student online learning using clustering, in : Proceedings of
the 44th Annual Southeast Regional Conference ACM‐SE, 44 (2006) 186‐191.
116. A. Ligtenberg, AK. Bregt, R. Van Lammeren, Multi‐actor‐based land use modelling:
spatial planning using agents, Landscape and Urban Planning, 56 (2001) 21‐33
117. A. Ligtenberg, A. Beulens, D. Kettenis, AK. Bregt, M. Wachowicz, Simulating
knowledge sharing in spatial planning: an agent‐based approach, Environment and
Planning B‐Planning & Design, 36 (2009) 644‐663

REFERENCES 152
118. KH. Lin, Revisiting the gap between stylized and diary estimates of market work
time, Social Science Research, 41 (2) (2012) 380‐391
119. HQ. Liu, HL. Gong, ZW. Hu, Ecological Environment Regionalization of Beijing: RS &
GIS Application Research, 2009 Joint Urban Remote Sensing Event (1‐3) (2009) 190‐196
120. B. Liu, Web Data Mining. Exploring Hyperlinks, Contents, and Usage Data,
Springer Verlag Berlin, Heidelberg New York (2007)
121. London Government. European Quality of Life Survey
http://data.london.gov.uk/datastore/package/european‐quality‐life‐survey
122. London Muncipality,
http://www.londonsdc.org/sustainable_development/monitoring.aspx
123. London Transport authority
http://www.tfl.gov.uk/assets/downloads/final‐report.pdf
MM 124. A. Mahizhnan, Smart cities ‐ The Singapore case, Cities, 16 (1) (1999) 13‐18
125. JA. Malek, Informative Global Community Development Index of Informative
Smart City, EDU '09: Proceedings of the 8th Wseas International Conference on
Education and Educational Technology, in: Revetria, R; Mladenov, V; Mastorakis, N
(Eds.) Recent Advances in Computer Engineering (2009) 121‐125
126. J. Mardaljevic, M. Rylatt, Irradiation mapping of complex urban environments: an
image‐based Approach. Energy and Buildings, 35 (1) (2003) 27‐35

REFERENCES 153
127. C. Martins Antonio, L. Faria, C‐V de Carvalho et al., User Modeling in adaptive
hypermedia educational systems, Educational Technology & Society, 11 (1) (2008)
194‐207
128. F. McCarey, M. O'Cinneide, N. Kushmerick, A recommender agent for software
libraries: An evaluation of memory‐based and model‐based collaborative filtering.
Editor(s): Nishida T, et al. 2006 IEEE/WIC/ACM Intl Conf. on Intelligent Agent
Technology (2006) 154‐162
129. D. McGranahan, T. Wojan, Recasting the creative class to examine growth
processes in rural and urban counties, Regional Studies, 41 (2) (2007) 197‐216
130. D‐L. McGuinness, F. Van Harmelen, OWL Web Ontology Language Overview,
World Wide Web Consortium (2004)
131. Mercer’s Quality of Living Survey
http://www.mercer.com/articles/quality‐of‐living‐definition‐1436405
132. M. Moller, New remote sensing systems and GIS‐Techniques for the monitoring of
urban ecological processes, Remote Sensing for Environmental Monitoring, GIS
Applications, and Geology, Proceedings of the Society of Photo‐Optical
Instrumentation Engineers (SPIE), 4545 (2002) 109‐117
133. MC. Mihaescu, DD. Burdescu, CM. Ionascu, B. Logofatu, Intelligent Educational
System Based on Personal Agents. Editor(s): Damiani E, Jeong J, Howlett RJ, Jain LC.
New Directions in Intelligent Interactive Multimedia Systems and Services‐ 2, Book
Series: Studies in Computational Intelligence, 226 (2009) 545‐554
134. Monocle. Top Livable Cities ranking
http://www.monocle.com/sections/edits/Web‐Articles/Top‐25‐Cities/

REFERENCES 154
135. Montaner, B. Lopez , JL de la Rosa, A taxonomy of recommender agents on the
Internet, Artificial Intelligence Review, 19 (2003) 285‐330
NN 136. Northwest Indiana Quality of Life Council
http://www.nwiqlc.org/
PP 137. G. Paliouras, V. Karkaletsis, C. Papathedorou, C. Spyropoulos, Exploiting learning
techniques for the acquisition of user stereotypes and communities, International
Conference on User Modeling, UM’99 (1999)
138. M. Papagelis, D. Plexousakis, Qualitative analysis of user‐based and item‐based
prediction algorithms for recommendation agents, Eng. Applications of AI, 18 (2005)
781‐789
139. MJ. Pazzani, A framework for collaborative, content‐based and demographic
filtering, Artificial Intelligence Review, 13 (1999) 393‐408.
140. M. Perkowitz, O. Etzioni, Towards adaptive Web sites: Conceptual framework and
case Study, 8th International World Wide Web Conference (1999)
141. M. Perkowitz, O. Etzioni, Adaptive Web sites, Communications ACM, 43 (8) (2000)
152–158
142. D. Petrovic, Three‐dimensional (thematic) maps in spatial planning. Geodetski
Vestnik, 51(2) (2007) 293‐303
143. LD. Pinnel, M. Dockrey, A. Brush, A. Borning, Design of visualizations for urban
modeling, Data Visualization 2000, Springer Computer Science, 1 (2000) 199‐208

REFERENCES 155
QQ 144. XZ. Qi, SZ. Zhao, W. Xu, WY. Jiang, Research on the index system of urban land
gradation based on principal component analysis, Proceedings of the Second
International Conference on Management Science and Engineering Management, in:
Xu, JP; Jiang, Y; Tan, Y (Eds.) Management Science and Engineering Management
(2008) 555‐563
RR 145. M. Raty, A. Kangas, Reprint of: Comparison of k‐MSN and kriging in local
prediction, Forest Ecology and Management, 272 (2012) 51‐60
146. EM. Rebelo, A methodology to approach immigrants' land use in metropolitan
areas, Cities, 27 (3) (2010) 137‐153
147. E. Rich, Building and Exploiting User Models, in: Proceedings of Sixth International
Joint Conference on Artificial Intelligence (1979) 720‐722
148. E. Rich, Stereotypes and user modeling, in: Kobsa, A., Wahlster, W. (eds.) User
models in dialog Systems, 18 (1989) 35‐51
149. K. Rodrigues, E. Tome, Knowledge Cities: A Portuguese Case, Proceedings of the
3rd European Conference on Intellectual Capital, (2011) 350‐358
150. C. Romero, S. Ventura, Educational Data Mining: A Review of the State of the Art,
IEEE Transactions on Systems Man and Cybernetics 40, Part C: Applications and
Reviews, 6 (2010) 601‐618
151. D. Rosaci, G. Sarne, Dynamically Computing Reputation of Recommender Agents
with Learning Capabilities. Editor(s): Badica C, Mangioni G, Carchiolo V, Burdescu DD.
REFERENCES 156
Intelligent Distributed Computing, Systems and Applications Book Series: Studies in
Computational Intelligence, 162 (2008) 299‐304
152. E. Roumenina, V. Vassilev, K. Ruskov, Large scale cartography and analyses of
man‐induced transformation in an urban area using satellite imagery with very high
resolution, S. Kurnaz, F. Ince, S.Onbasioglu, S. Basturk (Eds.) RAST 2009: Proceedings of
the 4th International Conference on Recent Advances in Space Technologies (2009)
313‐316
SS 153. B. Sarwar, G. Karypis, J. Konstan, J. Reidl, Item‐based coll. filtering
recommendation algorithms. 10th Intl. Conf. on World Wide Web, ACM Press, NY
(2001) 285‐295
154. S. Schetke, D. Haase, Multi‐criteria assessment of socio‐environmental aspects in
shrinking cities. Experiences from eastern Germany, Environmental Impact Assessment
Review, 28 (7) (2008) 483‐503
155. M. Schmidt, RP. Schafer, K. Nokel, SIMTRAP: Simulation of traffic‐induced air
pollution, Transactions of the Society for Computer Simulation International, 15(3)
(1998) 122‐132
156. M. Schneider‐Hufschmidt, Adaptive user interfaces: Principles and practice, T.
Kühme and U. Malinowski, U. (eds.), Human Factors in Information Technology (1993)
157. N. Schwarz, D. Haase, R. Seppelt, Omnipresent sprawl? A review of urban
simulation models with respect to urban shrinkage, Environment and Planning B‐
Planning & Design, 37(2) (2010) 265‐283
158. Scottish Transport Organization

REFERENCES 157
http://www.scottishtransport.org/new_trams_for_edinburgh/edinburgh_tram_i
159. QB. Song, M. Shepperd, XR. Chen, J. Liu, Can k‐NN imputation improve the
performance of C4.5 with small software project data sets? A comparative evaluation,
Journal of Systems and software, 81 (12) (2008) 2361‐2370
160. G. Senecal, PJ. Hamel, Compact city and quality of life: Discussions of the
Canadian approach to sustainability indicators, Canadian Geographer‐Geographe
Canadien, 45(2) (2001) 306‐318
161. RS. Serrao, AC. Paiva, Architecture based on Virtual Reality techniques and
geographic data base for storage and visualization of urban virtual models, Urban and
Regional Data Management. Proceedings and Monographs in Engineering, Water and
Earth Sciences, 1 (2008) 201‐210
162. Shropshire County
http://www.shropshire.gov.uk/factsfigures.nsf/open/3B9A853832652F2D80256FB200331E32
163. M‐A. Sicilia, E. Garcia, Fuzzy group models for adaptation in cooperative
information retrieval contexts, in: P.V. Boas, J. Pokorny, M. Bielikova et al. (eds.),
Proceedings 30th Conference on Current Trends in Theory and Practice of Computer
Science: SOFSEM 2004: Theory and Practice of Computer Science, Lecture Notes in
Computer Science, 2932 (2004) 324‐334
164. I. Smeureanu, A. Diosteanu, C. Delcea, L. Cotfas, Business Ontology for Evaluating
Corporate Social Responsibility, Amfiteatru Econ., 13 (2011) 28‐42
165. B. Smyth, P. Briggs, M. Coyle, M. O’Mahony, Google Shared, A Case‐Study in
Social Search, Editor(s): Houben et al. UMAP. LNCS 5535 (2009) 283‐294

REFERENCES 158
166. QB. Song, M. Shepperd, K. Cartwright, A short note on safest default missingness
mechanism assumptions, Empirical Software Engineering, 10 (2) (2005) 235‐243
167. QB. Song, M. Shepperd, A new imputation method for small software project data
sets, Journal of Systems and Software, 80 (1) (2007) 51‐62
168. QB. Song, M. Shepperd, XR. Chen, J. Liu, Can k‐NN imputation improve the
performance of C4.5 with small software project data sets? A comparative evaluation,
Journal of Systems and software, 81 (12) (2008) 2361‐2370
169. Spanish Ministry of Public Works. Secretariat of Urban Policies
http://siu.vivienda.es/portal/
170. 22. South Gloucestershire Council
http://www.southglos.gov.uk/Communities/QualityofLifeIndicators.htm
171. J. Steinhofel, F. Anders, H. Kohler, D. Kalisch, R. Konig, Computer‐Based Methods
for a Socially Sustainable Urban and Regional Planning – CoMStaR. Editor(s): Taniar D,
et al. Computational Science and its Applications ‐ ICCSA 2010, LNCS 6016 (2010) 152‐
165
172. I. Stepanikova, NH. Nie, XB. He, Time on the Internet at home, loneliness, and life
satisfaction: Evidence from panel time‐diary data, Computers in Human Behavior, 26
(3) (2010) 329‐338
173. PR. Stopher, A review of separate and joint strategies for the use of data on
revealed and stated choices, Transportation, 25 (2) (1998) 187‐205
174. Strategic Energy Technologies Information System (SETIS). European Initiative on
Smart Cities.

REFERENCES 159
http://setis.ec.europa.eu/about‐setis/technology‐roadmap/european‐initiative‐on‐smart‐cities
175. N. Streitz, Ambient Intelligence Research Landscapes: Introduction and Overview,
Ambient Intelligence, in: DeRuyter, B; Wichert, R; Keyson, DV; Markopoulos, P; Streitz,
N; Divitini, M; Georgantas, N; Gomez, AM (Eds.) Lecture Notes in Computer Science,
6439 (2010) 300‐303
TT 176. T. Takano, K. Nakamura, M. Watanabe, Urban residential environments and
senior citizens' longevity in megacity areas: the importance of walkable green spaces,
Journal of Epidemiology and Community Health, 56 (12) (2002) 913‐918
177. T. Takenouchi, T. Kawamura, A. Ohsuga, Development of knowledge‐filtering
agent along with user context in ubiquitous environment. Editor(s): Enokido T, Yan L,
Xiao B, Kim D, Dai Y, Yang LT. Embedded and Ubiquitous Computing ‐ EUC 2005
Workshops Proc. Book Series: LNCS 3823 (2005) 71‐80
178. SC. Tan, O. Wong, Location aware applications for smart cities with Google maps
and GIS tools, Advances in Intelligent IT: Active Media Technology 2006, in: Li, Y; Looi,
M; Zhong, N (Eds.) Frontiers in Artificial Intelligence and Applications, 138 (2006) 223‐
228
179. The Economist Intelligence Unit. Quality of Life Survey.
http://www.economist.com/media/pdf/QUALITY_OF_LIFE.pdf
180. K. Thorne, Blended Learning, Kogan Page, London (2003)
181. Transport for Greater Manchester
http://www.tfgm.com/2009_news.cfm?news_id=9006950?submenuheader=3

REFERENCES 160
182. A. Trias, J. Mansilla, JL. de la Rosa, Asknext, An Agent Protocol for Social Search.
Information Sciences, 190 (2012) 144‐161
183. V. Tsiriga, M. Virvou, Modelling the Student to Individualise Tutoring in a Web‐
Based, ICALL. International Journal of Continuing Engineering Education and Lifelong
Learning, 13 (3‐4) (2003) 350‐365
184. M. Tsukada, T. Washio, H. Motoda, Automatic Web‐page classification by using
machine learning methods, in: Lecture Notes in Artificial Intelligence, 2198 (2001) 303–
313.
185. KJ. Tu, LT. Lin, Evaluative structure of perceived residential environment quality in
high‐density and mixed‐use urban settings: An exploratory study on Taipei City,
Landscape and Urban Planning, 87(3) (2008) 157‐171
186. R. Tuts, Localizing Agenda 21 in small cities in Kenya, Morocco and Vietnam,
Environment and Urbanization, 10(2) (1998) 175‐189
187. B. Twala, M. Phorah, Predicting incomplete gene microarray data with the use of
supervised learning algorithms, Pattern Recognition Letters, 31 (13) (2010) 2061‐2069
UU 188. UK Audit Commission
http://www.audit‐
commission.gov.uk/nationalstudies/firerescue/Pages/localqualityoflifeindicators_copy.aspx
189. University of Wisconsin
http://www.uwex.edu/ces/cced/communities/qualityoflifedataindicatorsdatasources.cfm

REFERENCES 161
VV 190. Vienna University of Technology, University of Ljubljana and Delft University of
Technology. European Smart Cities ranking. http://www.smart‐cities.eu/
191. B. Vilhelmson, B, E. Thulin, Virtual Mobility, Time Use and the Place of the Home.
Tijdschrift Voor Economische en Sociale Geografie, 99 (5) (2008) 602‐618
192. R. de Virgilio, R. Torlone, D. Valeriano et al. A cluster‐based approach to Web
adaptation in context‐aware applications, Journal of Web Engineering, 4‐6 (2007) 360‐
388
193. JE. Vogelmann, T. Sohl, SM. Howard, Regional characterization of land cover using
multiple, Photogrammetric Engineering and Remote Sensing, 64 (1) 45‐57
WW 194. R. Wagner, On the metric, topological and functional structures of urban
networks, Physical‐statistical Mechanics and its App., 387 (2008) 2120‐2132
195. Wales Council
http://www.dataunitwales.gov.uk/Data.asp?cat=285
196. H. Wang, Y. Song, A. Hamilton, S. Curwell, Urban information integration for
advanced e‐Planning in Europe, Government Information Quarterly, 24(4) (2007) 736‐
754
197. ZY. Wang ZY., Liu AH.: Toward Intelligent Web Collaborative Learning System.
Editor(s): Hu ZB, Liu QT. Proceedings of the First International Workshop on Education
Technology and Computer Science III (2009) 467‐471
198. G‐I Webb, M‐J Pazzani, D. Billsus, Machine learning for user modeling, User
Modeling and User‐Adapted Interaction, 11 (2001) 19–29.

REFERENCES 162
199. QH. Weng, H. Liu, BQ. Liang, DS. Lu, The Spatial Variations of Urban Land Surface
Temperatures: Pertinent Factors, Zoning Effect, and Seasonal Variability, IEEE Journal
of Selected Topics in Applied Earth Observations and Remote Sensing, 1(2) (2008) 154‐
166
200. S. White, S. Feiner, SiteLens: Situated Visualization Techniques for Urban Site
Visits, CHI2009: Proceedings of the 27th Annual CHI Conference on Human Factors in
Computing Systems,1‐4 (2009) 1117‐1120
201. P. Williams, E. Siekierska, C. Armenakis, F. Savopol, C. Siegel, J. Webster,
Visualization and Hypermedia for Decision Making, Geographic Hypermedia: Concepts
and Systems. Lecture Notes in Geoinformation and Cartography, 1 (2006) 309‐328
202. M. Wolff, H. Asche, Geospatial Crime Scene Investigation ‐ From Hotspot Analysis
to Interactive 3D Visualization, Computational Science and its Applications ‐ ICCSA
2009, Lecture Notes in Computer Science, 5592 (2009) 285‐299
203. C. Wong, Developing indicators to inform local economic development in England,
Urban Studies, 39(10) (2002) 1833‐1863
204. H. Wu, A reference architecture for adaptive hypermedia application. PhD
Dissertation, Eindhoven University of Technology (2002)
205. HY, Wu, ZW. He, Y. Gong, A virtual globe‐based 3D visualization and interactive
framework for public participation in urban planning processes, Computers
Environment and Urban Systems, 34 (4) (2010) 291‐298
REFERENCES 163
206. X. Wu, V. Kumar, JR. Quinlan, J. Ghosh, Q. Yang, H. Motoda, GJ. McLachlan, NG.
Angus, B. Liu, S. Philip, S. Yu, ZH Zhou, M. Steinbach, DJ. Hand, D. Steinberg. Top 10
algorithms in data mining. Knowledge and Information Systems, 14 (1) (2008) 1‐37
XX 207. Y. Xing, JW. Liu, BX. Li, M. Zhang, DG. Meng, Research on Public Participation in
Urban Planning, JY, Zhao, JY (Eds.), Advances in Civil Engineering, 1‐6, Book Series:
Advanced Materials Research, 255‐260 (2011) 1333‐1337
YY 208. HL. Yang, HF. Yang, Recommender agent based on social network. Editor(s):
Okuno HG, Ali M, New Trends in Applied Artificial Intelligence, Proceedings Book
Series: Lecture Notes in Artificial Intelligence, 4570 (2007) 943‐952
209. QS. Yang, X. Li, X. Shi, Cellular automata for simulating land use changes based on
support vector machines, Computers & Geosciences, 34 (6) (2008) 592‐602
210. JL. Yao, T. Fernando, H. Tawfik, R. Armtiage, I. Billing, VR‐centred workspace for
supporting collaborative urban planning, Proceedings of the 211_Ninth International
Conference on Computer Supported Cooperative Work in Design, 1‐2 (2005) 564‐569
211. JL. Yao, H. Tawfik, T. Fernando, A GIS based virtual urban simulation environment,
Computational Science ‐ ICCS 2006, 3. Lecture Notes in Computer Science, 3993 (2006)
60‐68
212. CP. Yiakoumettis, CP. Bardis, G. Miaoulis, D. Plemenos, D. Ghazanfarpour, A GIS
Platform for Automatic Navigation into Georeferenced Scenes Using GIS Scene
Explorer (GIS‐SE), in: Intelligent Computer Graphics 2010. Studies in Computational
Intelligence, 321 (2010) 105‐122

REFERENCES 164
213. B. Yu, MP. Singh, K. Sycara, Developing Trust in Large‐Scale Peer‐to‐Peer Systems,
First IEEE Symp.on Multi‐Agent Security and Survivability (2004) 1‐10
ZZ 214. OR. Zaiane, Building a recommender agent for e‐learning systems. Editor(s):
Kinshuk X, Lewis R, Akahori K, Kemp R, Okamoto T, Henderson L, Lee CH. International
Conference on Computers in Education (I –II) Proceedings (2002) 55‐59
215. JY. Zheng, M. Shi, Mapping cityscapes into cyberspace for visualization. Computer
Animation and Virtual Worlds, 16(2) (2005) 97‐107
216. GQ. Zhou, ZY. Tan, MY Cen, CK. Li, Customizing visualization in three‐dimensional
urban GIS via web‐based interaction, Journal of Urban Planning and Development‐
ASCE, 132(2) (2006) 97‐103
217. HF. Zhou, ZS. Li, DQ. Xue, L. Yang, Time Use Patterns Between Maintenance,
Subsistence and Leisure Activities: A Case Study in China, Social Indicators Research,
105 (1) (2012) 121‐136
218. T. Zhu, R. Greiner, G. Haubl, Learning a model of a Web user’s interests, in:
Lecture Notes in Artificial Intelligence, 2702 (2003) 148‐
219. I. Zukerman, D‐W. Albrecht and A‐E. Nicholson, Predicting users request on the
WWW, 7th International Conference in User Modeling UM99 (1999)

REFERENCES 165