síntesis y caracterización de materiales
DESCRIPTION
Buena literaturaTRANSCRIPT
The SERS Activity of a Supported AgNanocube Strongly Depends on ItsOrientation Relative to LaserPolarizationJoseph M. McLellan, Zhi-Yuan Li, † Andrew R. Siekkinen, and Younan Xia*
Department of Chemistry, UniVersity of Washington, Seattle, Washington 98195-1700
Received January 19, 2007; Revised Manuscript Received March 12, 2007
ABSTRACT
Silver nanocubes with sharp or truncated corners were synthesized, deposited on silicon substrates, and functionalized with Raman-activethiols for surface-enhanced Raman scattering (SERS) studies. The use of substrates with registration marks allowed us to correlate the SERSspectra from individual nanocubes to their physical parameters revealed by high-resolution SEM imaging. We observed dramatic variationsin SERS intensity when the nanocubes were oriented at different angles relative to the polarization of excitation laser. This angular dependencewas less significant when the nanocubes were truncated and became nearly spherical in profile. Numerical calculations were employed toconfirm our observations, and to attribute the source of variation to the difference in near-field distribution between different laser polarizati ons.
The role of localized surface plasmon resonance (LSPR) insurface-enhanced Raman scattering (SERS) has been clearlyestablished for many years.1-4 It is generally accepted thatthe local field that develops on the surface of a metalnanoparticle when it interacts with the incident light isprimarily responsible for the SERS effect. The enhancementwill be maximized when the wavelength of incident light isin resonance with the LSPR band of the nanoparticle.5,6 TheLSPR properties of a metal nanoparticle is strongly depend-ent on several factors including the size, shape, dielectricenvironment, and proximity to other particles as well asorientation relative to the polarization of incident light.7-15
Any polydispersity in size and shape of the particles maylead to variations in the overall SERS activity of theensemble. The random formation of “hot spots” throughplasmonic coupling of closely spaced particles is expectedto be the most significant source of variation.14-19 The localfields in such hot spots can be orders of magnitude strongerthan those on individual particles and have enabled the giantenhancement required for single molecule detection.16,17
While calculations have confirmed that the field enhancementin a hot spot can account for the observation of singlemolecules by SERS,20 Nie and Emory found that a smallportion of single silver particles could also be extremelyRaman active with an enhancement factor high enough forsingle molecule detection.21 However, the origin of this
extraordinary enhancement is yet to be uncovered. Asystematic study on the relationship between the Ramanscattering intensity and the physical parameters of a nano-particle could eventually lead to an understanding of whycertain particles are hot while others are not. In this regard,experiments capable of correlating the optical response withhigh-resolution imaging should be helpful in attaining a betterunderstanding of the complex physics behind the enhance-ment process.
It is worth noting that theoretical calculations of opticalproperties of metal nanoparticles with arbitrary shapes havealready reached a fairly high level of maturity.20,22 Thesecalculations are typically conducted for single particles withwell-defined compositions, sizes, shapes, and spatial orienta-tions relative to the polarization of incident light. As a result,SERS experiments on single nanoparticles could provide adirect comparison between experimental and theoreticalresults. Here we report SERS measurements on individualAg nanocubes with different orientations relative to thepolarization of excitation laser. While significant variationswere found for the SERS activities of individual nanocubeswith sharp corners, the intensity of SERS signals fromrounded particles showed little difference. Additionally, wehave conducted calculations for both the far-field extinctionspectra and near-field distributions to further confirm theseresults.
Several approaches have been demonstrated to correlateboth elastic and inelastic scattering measurements to themorphology of a nanoparticle. These include the use of
* Corresponding author. E-mail: [email protected].† Institute of Physics, Chinese Academy of Sciences, Beijing 100080,
P. R. China.
NANOLETTERS
2007Vol. 7, No. 41013-1017
10.1021/nl070157q CCC: $37.00 © 2007 American Chemical SocietyPublished on Web 03/22/2007
instruments that allow for simultaneous optical and atomicforce microscopy (AFM) characterization21,23-25 as well asthe use of registration marks on a substrate26-29 or patternrecognition30,31 to help correlate the optical and structuralmeasurements. While the use of an instrument that allowsfor in situ optical and AFM experiments is elegant, AFMimaging alone cannot easily resolve the exact profile of ananoparticle due to tip convolution. In comparison, electronmicroscopy (both scanning and transmission) provides adefinite advantage. For this reason, several groups haveemployed registration marks on substrates for ex situcorrelation of optical with electron microscopy measure-ments. These experiments have primarily utilized the high-resolution power of transmission electron microscopy (TEM)for structural characterization. It appears to us that scanningelectron microscopy (SEM) might be more convenient forthe correlated measurements because it can be easily operatedto obtain similar details about the morphology of a nano-particle (see Figure S1, Supporting Information, for acomparison between SEM and TEM images of Ag nanocubes).More importantly, one can use conductive Si substratespatterned with a simple array of microscale registration marksas the supports for correlated SERS/SEM measurements. Theregistration marks can be readily fabricated using photoli-thography, followed by thermal evaporation of a metal (e.g.,Au or Al) and lift-off. The result is a substrate that isinexpensive, simple to fabricate, structurally robust, andeasily handled (compared to TEM grids). The marks allowone to readily locate the same nanoparticle when goingbetween Raman and electron microscopes. In general, thisapproach allows for the use of SEM, AFM, or both to fur-ther characterize the region of interest following Ramancharacterization, albeit we only focus on SEM in thiswork.
The first step involved synthesis of Ag nanocubes withsharp or truncated corners using our previously publishedprocedures (see the Supporting Information for experimentaldetails).32,33Briefly, AgNO3 was reduced by ethylene glycol(EG) at 150°C in the presence of poly(vinyl pyrrolidone)(PVP) and HCl. The EG served as both reductant and solvent,while HCl mainly acted as an oxidative etchant. The mixturewas allowed to react for 24 h, and the products, Agnanocubes with sharp corners, were collected by centrifuga-tion. The nanocubes were washed with acetone and ethanolto remove EG and excess PVP, and then redispersed in waterfor further use. The truncated versions of these sharp cubeswere obtained by dispersing them in a 1 mM solution ofHCl in EG and heating to 145°C for 5 min. A small amountof PVP (0.1 mM) was also added to help stabilize thesuspension. The truncated nanocubes were finally washedwith acetone and ethanol, centrifuged, and redispersed inwater. Samples for correlated SEM and SERS experimentswere prepared by drop-casting a dilute aqueous suspensionof the Ag nanocubes on Si substrates that had been patternedwith registration marks and letting them dry under ambientconditions. Once the samples had dried, they were immersedin a 1 mMsolution of 1,4-benzenedithiol (1,4-BDT, Aldrich)in ethanol for 1 h, taken out, washed with copious amounts
of ethanol, and finally dried with a stream of air. All sampleswere used within 24 h after preparation.
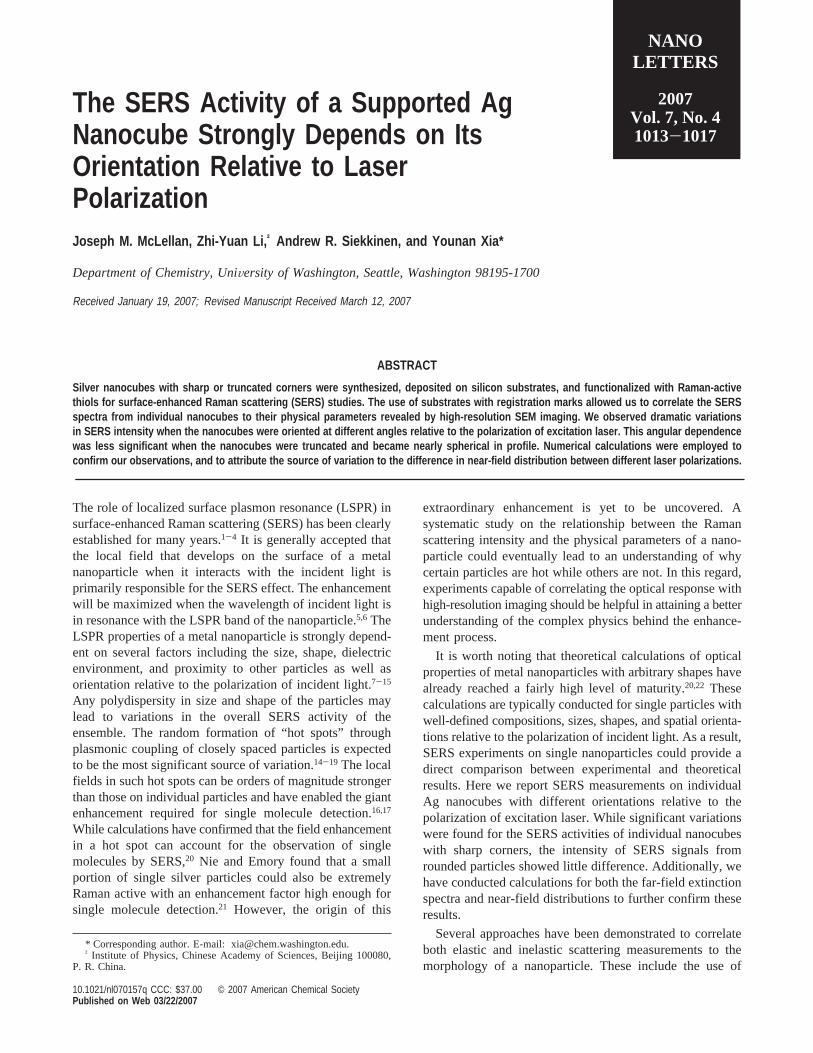
Figure 1 demonstrates how we correlated the SERS spectrafrom individual particles to their SEM images. Figure 1Ashows a dark-field optical micrograph of a region containinga number of sharp Ag nanocubes (the blue dots labeled i-v)and several registration marks (the larger yellow spots).Figure 1B shows an SEM image of the same region shownin Figure 1A. The particles are also circled and labeled inthe SEM image to help identify them. SEM images of thesecubes at a higher magnification are shown in the strip ofimages below panels A and B.
Using this approach, we recorded SERS spectra and SEMimages from many individual particles. Figure S2, SupportingInformation, shows the correlated SERS spectra and SEMimages from 10 typical nanocubes with random orientationsrelative to the polarization of the incident laser. All spectrain this study were obtained with a 514 nm argon laser (2mW at the sample) using a dry 50× objective (NA) 0.80)in single static scans with an acquisition time of 30 s (seeSupporting Information for more details). In the spectra, thebroad band at 900-1000 cm-1 can be attributed to the Sisubstrate and was used in this work as a reference forintensity normalization. The peaks at other positions (1080,1180, and 1565 cm-1) can be ascribed to the vibrations of1,4-BDT.33-35 More specifically, the bands at 1565 and 1180cm-1 were assigned to modesν8a andν9a, while the band at1080 cm-1 can be ascribed to theν1 fundamental in Fermiresonance with a combination mode consisting ofν6a +ν7a.33,34 For the 30 individual cubes investigated, we foundan average edge length of 97.3 nm and a standard deviationof 5 nm. Despite the high-level of monodispersity for thesecubes, the SERS signals could vary significantly from cubeto cube. When we examine the spectra and take intoconsideration the orientation of the particles relative to thelaser polarization during spectral acquisition, we noticed aninteresting trend. It appears that the variation in SERS activity
Figure 1. (A) Dark-field optical micrograph of a substrate withregistration marks (large yellow spots) and a number of individualAg nanocubes (small blue dots) labeled i-v. (B) SEM image ofthe same region as shown in (A). Below (A) and (B) are SEMimages that clearly resolve the morphology of each individual Agnanocube. Note that the 100 nm scale bar applies to all the high-magnification SEM images.
1014 Nano Lett., Vol. 7, No. 4, 2007
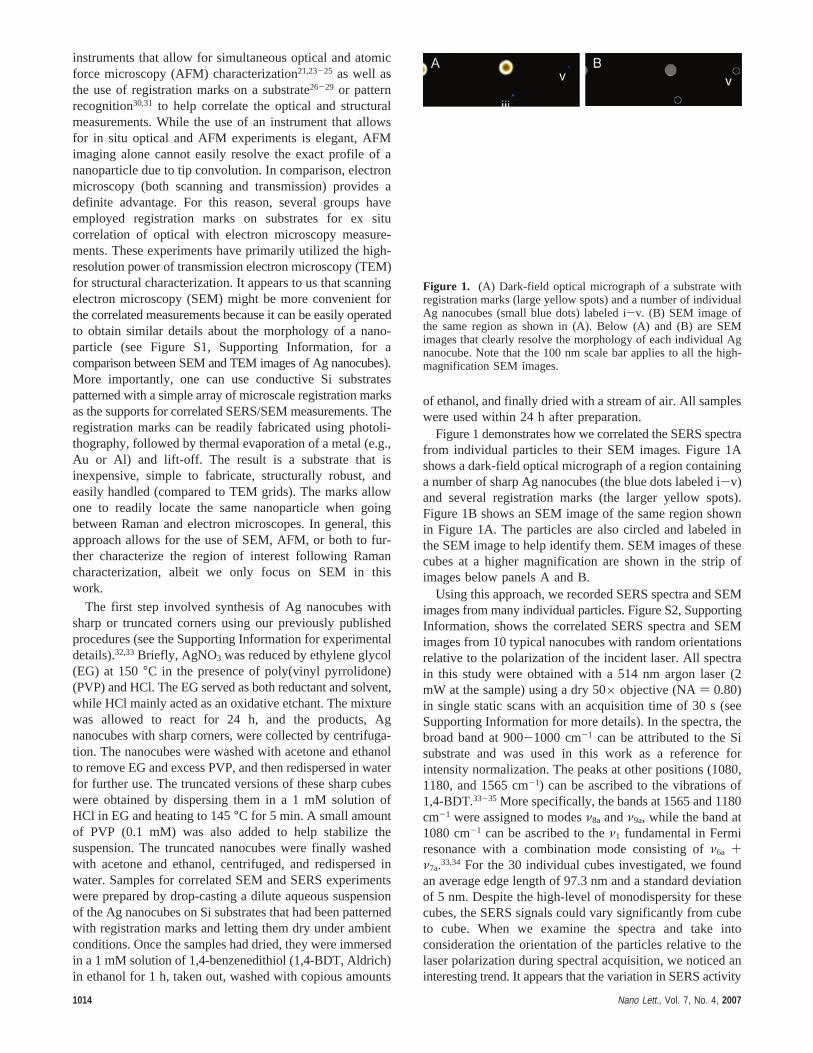
for these cubes mainly came from the difference in localfield strength as the cube is randomly oriented relative tothe polarization of excitation laser. For example, Figure 2shows SEM images of four cubes and their correspondingSERS spectra. The white arrows in the SEM images denotethe polarization of the incident laser. It is clear that individualnanocubes with sharp corners were most active when theywere oriented such that a diagonal axis (corner to corner) ofthe cube (particles A and B in Figure 2) was parallel to thepolarization of the laser. As shown by particles C and D inFigure 2, nanocubes that were oriented with one of their facesparallel to the laser polarization were much less active.
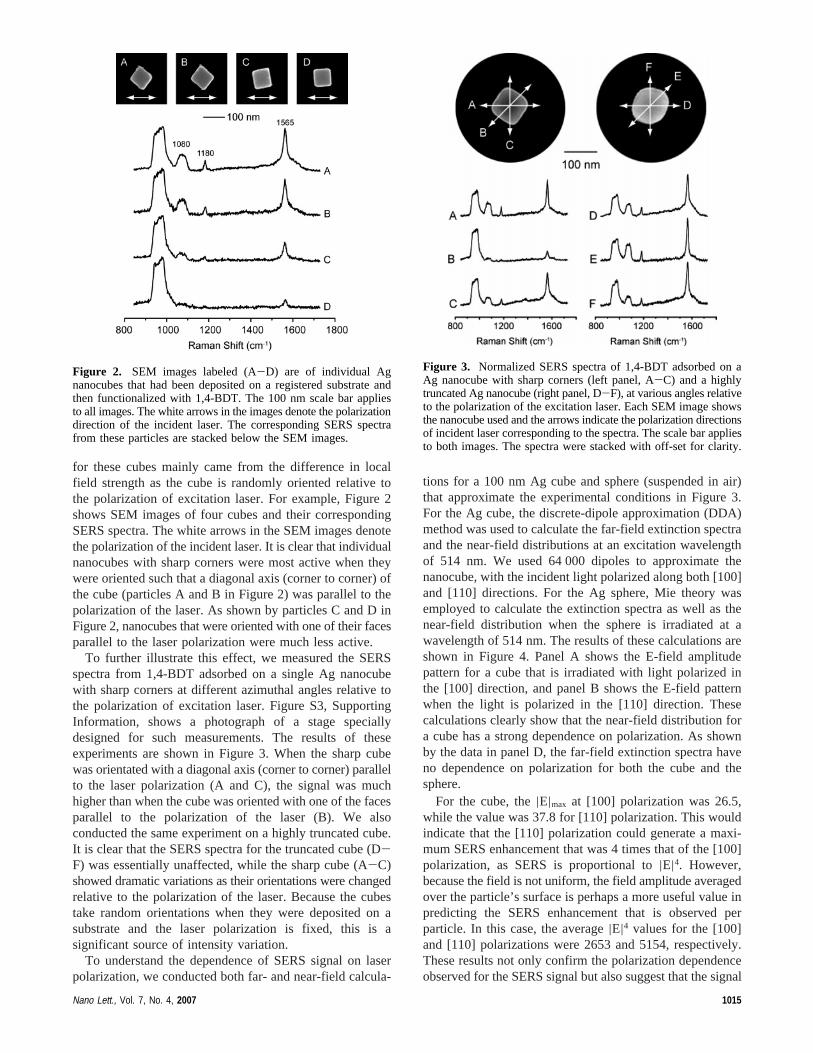
To further illustrate this effect, we measured the SERSspectra from 1,4-BDT adsorbed on a single Ag nanocubewith sharp corners at different azimuthal angles relative tothe polarization of excitation laser. Figure S3, SupportingInformation, shows a photograph of a stage speciallydesigned for such measurements. The results of theseexperiments are shown in Figure 3. When the sharp cubewas orientated with a diagonal axis (corner to corner) parallelto the laser polarization (A and C), the signal was muchhigher than when the cube was oriented with one of the facesparallel to the polarization of the laser (B). We alsoconducted the same experiment on a highly truncated cube.It is clear that the SERS spectra for the truncated cube (D-F) was essentially unaffected, while the sharp cube (A-C)showed dramatic variations as their orientations were changedrelative to the polarization of the laser. Because the cubestake random orientations when they were deposited on asubstrate and the laser polarization is fixed, this is asignificant source of intensity variation.
To understand the dependence of SERS signal on laserpolarization, we conducted both far- and near-field calcula-
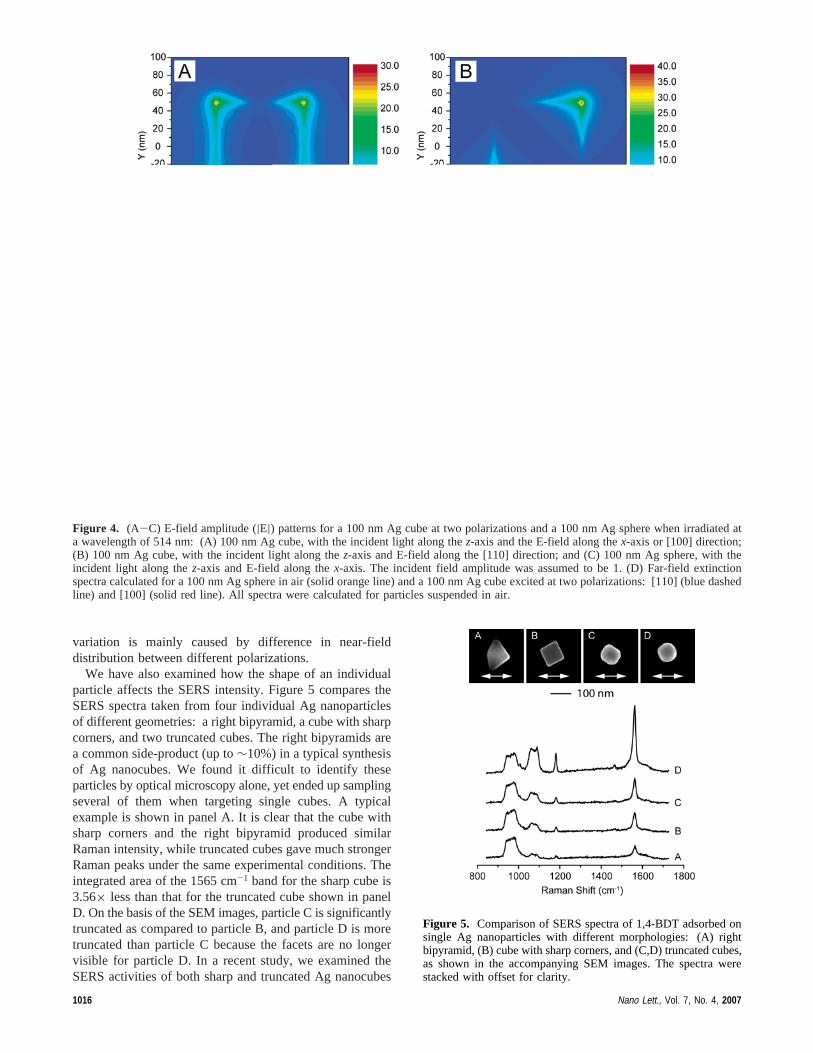
tions for a 100 nm Ag cube and sphere (suspended in air)that approximate the experimental conditions in Figure 3.For the Ag cube, the discrete-dipole approximation (DDA)method was used to calculate the far-field extinction spectraand the near-field distributions at an excitation wavelengthof 514 nm. We used 64 000 dipoles to approximate thenanocube, with the incident light polarized along both [100]and [110] directions. For the Ag sphere, Mie theory wasemployed to calculate the extinction spectra as well as thenear-field distribution when the sphere is irradiated at awavelength of 514 nm. The results of these calculations areshown in Figure 4. Panel A shows the E-field amplitudepattern for a cube that is irradiated with light polarized inthe [100] direction, and panel B shows the E-field patternwhen the light is polarized in the [110] direction. Thesecalculations clearly show that the near-field distribution fora cube has a strong dependence on polarization. As shownby the data in panel D, the far-field extinction spectra haveno dependence on polarization for both the cube and thesphere.
For the cube, the|E|max at [100] polarization was 26.5,while the value was 37.8 for [110] polarization. This wouldindicate that the [110] polarization could generate a maxi-mum SERS enhancement that was 4 times that of the [100]polarization, as SERS is proportional to|E|4. However,because the field is not uniform, the field amplitude averagedover the particle’s surface is perhaps a more useful value inpredicting the SERS enhancement that is observed perparticle. In this case, the average|E|4 values for the [100]and [110] polarizations were 2653 and 5154, respectively.These results not only confirm the polarization dependenceobserved for the SERS signal but also suggest that the signal
Figure 2. SEM images labeled (A-D) are of individual Agnanocubes that had been deposited on a registered substrate andthen functionalized with 1,4-BDT. The 100 nm scale bar appliesto all images. The white arrows in the images denote the polarizationdirection of the incident laser. The corresponding SERS spectrafrom these particles are stacked below the SEM images.
Figure 3. Normalized SERS spectra of 1,4-BDT adsorbed on aAg nanocube with sharp corners (left panel, A-C) and a highlytruncated Ag nanocube (right panel, D-F), at various angles relativeto the polarization of the excitation laser. Each SEM image showsthe nanocube used and the arrows indicate the polarization directionsof incident laser corresponding to the spectra. The scale bar appliesto both images. The spectra were stacked with off-set for clarity.
Nano Lett., Vol. 7, No. 4, 2007 1015
variation is mainly caused by difference in near-fielddistribution between different polarizations.
We have also examined how the shape of an individualparticle affects the SERS intensity. Figure 5 compares theSERS spectra taken from four individual Ag nanoparticlesof different geometries: a right bipyramid, a cube with sharpcorners, and two truncated cubes. The right bipyramids area common side-product (up to∼10%) in a typical synthesisof Ag nanocubes. We found it difficult to identify theseparticles by optical microscopy alone, yet ended up samplingseveral of them when targeting single cubes. A typicalexample is shown in panel A. It is clear that the cube withsharp corners and the right bipyramid produced similarRaman intensity, while truncated cubes gave much strongerRaman peaks under the same experimental conditions. Theintegrated area of the 1565 cm-1 band for the sharp cube is3.56× less than that for the truncated cube shown in panelD. On the basis of the SEM images, particle C is significantlytruncated as compared to particle B, and particle D is moretruncated than particle C because the facets are no longervisible for particle D. In a recent study, we examined theSERS activities of both sharp and truncated Ag nanocubes
Figure 4. (A-C) E-field amplitude (|E|) patterns for a 100 nm Ag cube at two polarizations and a 100 nm Ag sphere when irradiated ata wavelength of 514 nm: (A) 100 nm Ag cube, with the incident light along thez-axis and the E-field along thex-axis or [100] direction;(B) 100 nm Ag cube, with the incident light along thez-axis and E-field along the [110] direction; and (C) 100 nm Ag sphere, with theincident light along thez-axis and E-field along thex-axis. The incident field amplitude was assumed to be 1. (D) Far-field extinctionspectra calculated for a 100 nm Ag sphere in air (solid orange line) and a 100 nm Ag cube excited at two polarizations: [110] (blue dashedline) and [100] (solid red line). All spectra were calculated for particles suspended in air.
Figure 5. Comparison of SERS spectra of 1,4-BDT adsorbed onsingle Ag nanoparticles with different morphologies: (A) rightbipyramid, (B) cube with sharp corners, and (C,D) truncated cubes,as shown in the accompanying SEM images. The spectra werestacked with offset for clarity.
1016 Nano Lett., Vol. 7, No. 4, 2007
in aqueous solutions and found surface-enhancement factorsof 1.25× 10⁵ and 8.53× 10⁴ for 100 nm sharp and truncatednanocubes, respectively.33 While it may not necessarily makesense to compare the spectra taken from single particles withfixed orientations and the directionally averaged solution-phase ensemble measurements, the solution-phase resultswere consistent with theoretical predictions. The observationof higher SERS activity for a supported truncated cube ascompared to a supported cube with sharp corners is interest-ing because it is contrary to the theoretical prediction and toprevious studies. We do not yet understand this trend, butare currently pursuing investigations in this direction.
In summary, we have utilized substrates with registrationmarks to correlate the SERS spectra from individual Agnanocubes to their physical parameters revealed by high-resolution SEM imaging. While the nanocubes used in thisstudy were monodispersed in size and shape, the SERSsignals recorded from different nanocubes showed consider-able variations in intensity. Backed up by calculations, wehave shown that this variation can be attributed to thedifference in near-field distribution when the nanocube takesdifferent orientation relative to the laser polarization. Wehave also shown that the importance of this effect is highlydependent on the degree of truncation for the cubes, withthe sharp ones being more sensitive to the orientation thantheir truncated, nearly spherical counterparts. This angulardependence of SERS activities for Ag nanocubes suggeststhat the laser polarization needs to be taken into accountwhenever supported, nonspherical nanoparticles are involved.
Acknowledgment. This work was initiated through astudent fellowship from the NIH-funded MLSC program atthe UW. It was supported in part by a fellowship from theDavid and Lucile Packard Foundation and GEMSEC (Ge-netically Engineered Materials Science and EngineeringCenter), an NSF-supported MRSEC program at the UW.Y.X. is a Camille Dreyfus Teacher Scholar (2002-2007).Instrumentation was provided by the Nanotech User Facility(NTUF), a member of the National Nanotechnology Infra-structure Network (NNIN) supported by the NSF. We alsothank the NTUF staff for technical support. Z.Y.L. thanksthe National Natural Science Foundation of China (no.10525419) for financial support.
Supporting Information Available: Experimental de-tails; figures showing a comparison of TEM and SEMimages, SERS spectra from 10 individual Ag nanocubes, anda digital photograph of the rotational stage. This material isavailable free of charge via the Internet at http://pubs.acs.org.
References
(1) Haynes, C. L.; Van Duyne, R. P.J. Phys. Chem. B2003, 107, 7426.(2) Jackson, J. B.; Halas, N. J.Proc. Natl. Acad. Sci. U.S.A.2004, 101,
17930.(3) Haes, A. J.; Haynes, C. L.; McFarland, A. D.; Schatz, G. C.; Van
Duyne, R. P.; Zou, S.MRS Bull.2005, 30, 368.(4) McLellan, J. M.; Xiong, Y.; Hu, M.; Xia, Y.Chem. Phys. Lett.2006,
417, 230.(5) Schwartzberg, A. M.; Grant, C. D.; Wolcott, A.; Talley, C. E.; Huser,
T. R.; Bogomolni, R.; Zhang, J. Z.J. Phys. Chem. B2004, 108,19191.
(6) Halas, N. J.MRS Bull.2005, 30, 362.(7) (a) Sun, Y.; Xia, Y.J. Am. Chem. Soc.2004, 126, 3892. (b) Wiley,
B. J.; Im, S. H.; Li, Z. Y.; McLellan, J. M.; Siekkinen, A.; Xia, Y.J. Phys. Chem. B2006, 110, 15666.
(8) Sun, Y.; Xia, Y.Analyst2003, 128, 686.(9) (a) Wiley, B.; Im, S. H.; Li, Z. Y.; McLellan, J. M.; Siekkinen, A.;
Xia, Y. J. Phys. Chem. B2006, 110, 15666. (b) Wiley, B.; Sun, Y.;Mayers, B.; Xia, Y.Chem.sEur. J. 2005, 11, 454.
(10) (a) Xiong, Y.; Wiley, B.; Chen, J.; Li, Z. Y.; Yin, Y.; Xia, Y.Angew.Chem., Int. Ed.2005, 44, 7913. (b) McLellan, J. M.; Xiong, Y.; Hu,M.; Xia, Y. Chem. Phys. Lett.2006, 417, 230. (c) Xiong, Y.;McLellan, J. M.; Chen, J.; Yin, Y.; Li, Z. Y.; Xia, Y.J. Am. Chem.Soc.2005, 127, 17118.
(11) Jensen, T. R.; Malinsky, M. D.; Haynes, C. L.; Van Duyne, R. P.J.Phys. Chem. B2000, 104, 10549.
(12) Oldenburg, S. J.; Jackson, J. B.; Westscott, S. L.; Halas, N. J.Science2003, 302, 419.
(13) Chen, J.; Wiley, B.; McLellan, J. M.; Xiong, Y.; Li, Z. Y.; Xia, Y.Nano Lett.2005, 5, 2058.
(14) Kneipp, K.; Kneipp, H.; Manoharan, R.; Hanlon, E. B.; Itzkan, I.;Dasari, R. R.; Feld, M. S.Appl. Spectrosc.1998, 52, 1493.
(15) (a) Xu, H. X.; Kall, M. ChemPhysChem2003, 4, 1001. (b) Xu, H.X.; Azpurua, J.; Ka¨ll, M. J.; Apell, P.Phys. ReV. E 2000, 62, 4318.
(16) Wang, Z.; Pan, S.; Krauss, T. D.; Du, H.; Rothberg, L. J.Proc. Natl.Acad. Sci. U.S.A.2003, 100, 8638.
(17) Kneipp, K.; Wang, Y.; Dasari, R. R.; Feld, M. S.Appl. Spectrosc.1995, 49, 780.
(18) (a) Kuncicky, D. M.; Christesen, S. D.; Velev, O. D.Appl. Spectrosc.2005, 59, 401. (b) Tessier, P. M.; Velev, O. D.; Kalambur, A. T.;Rabolt, J. F.; Lenhoff, A. M.; Kaler, E. W.J. Am. Chem. Soc.2000,122, 9554.
(19) Tao, A.; Kim, F.; Hess, C.; Goldberger, J.; He, R.; Sun, Y.; Xia, Y.;Yang, P.Nano Lett.2003, 3, 1229.
(20) (a) Zou, S.; Schatz, G. C.Chem. Phys. Lett.2005, 403, 62. (b) Schatz,G. C.; Young, M. A.; Van Duyne, R. P. InSurface Enhanced RamanScattering Physics and Applications;Kneipp, K., Moskovits M.,Kneipp, H., Eds.; Topics in Applied Physics; Springer: New York,2006; Vol. 103, pp 19-46.
(21) Nie, S. M.; Emory, S. R.Science1997, 275, 1102.(22) (a) Kelly, K. L.; Coronado, E.; Zhao, L. L.; Schatz, G. C.J. Phys.
Chem. B2003, 107, 668. (b) Sherry, L. J.; Chang, S. H.; Schatz, G.C.; Van Duyne, R. P.; Wiley, B. J.; Xia, Y.Nano Lett.2005, 5,2034.
(23) Michaels, A. M.; Jiang, J.; Brus, L.J. Am. Chem. Soc.2000, 104,11965.
(24) (a) Lu, H. P.J. Phys.: Condens. Matter2005, 17, R333. (b) Hu, D.;Micic, M.; Klymyshyn, N.; Suh, Y. D.; Lu, H. P.ReV. Sci. Instrum.2003, 74, 3347.
(25) Talley, C. E.; Jackson, J. B.; Oubre, C.; Grady, N. K.; Hollars, C.W.; Lane, S. M.; Huser, T. R.; Nordlander, P.; Halas, N. J.NanoLett. 2005, 5, 1569.
(26) (a) Khan, I.; Cunningham, D.; Graham, D.; McComb, D. W.; Smith,W. E. J. Phys. Chem. B2005, 109, 3454. (b) Khan, I.; Polwart, E.;McComb, D. W.; Smith, W. E.Analyst2004, 129, 950.
(27) Nehl, C. L.; Grady, N. K.; Goodrich, G. P.; Tam, F.; Halas, N. J.;Hafner, J. H.Nano Lett.2004; 4, 2355.
(28) Maruyama, Y.; Futamata, M.J. Raman Spectrosc.2005, 36, 581.(29) Jin, R.; Jureller, J. E.; Scherer, N. F.Appl. Phys. Lett.2006, 88,
263111.(30) Mock, J. J.; Barbic, M.; Smith, D. R.; Schultz, D. A.; Schultz, S.J.
Chem. Phys.2002, 116, 6755.(31) Khan, I.; Cunningham, D.; Littleford, R. E.; Graham, D.; Smith, W.
E.; McComb, D. W.Anal. Chem.2006, 78, 224.(32) (a) Im, S. H.; Lee, Y. T.; Wiley, B.; Xia, Y.Angew. Chem., Int. Ed.
2005, 44, 2154. (b) Sun, Y.; Xia, Y.Science2002, 298, 2176.(33) McLellan, J. M.; Siekkinen, A.; Chen, J.; Xia, Y.Chem. Phys. Lett.
2006, 427, 122.(34) (a) Joo, S. W.; Han, S. W.; Kim, K.J. Colloid Interface Sci.2001,
240, 391. (b) Cho, S. H.; Han, H. S.; Jang, D. J.; Kim, K.; Kim, M.S. J. Phys. Chem.1995, 99, 10594.
(35) Moskovits, M.; Jeong, D. H.Chem. Phys. Lett.2004, 397, 91.
NL070157Q
Nano Lett., Vol. 7, No. 4, 2007 1017