reporte de analisis de riesgos activos.pdf
TRANSCRIPT
Risk Management
PRJR13011
01 Proyecto
Issued: 06/11/2013 7:56:03
The information in this document and any attachments is intended for users of Modulo Risk Manager©, a product developed by Modulo Security LLC. If you do not have permission to access this information, know that it is prohibited to read, release, or copy this information. Improper use will be subject to the legislation in effect based on the confidentiality agreements.
The controls in the knowledge bases created by Modulo Security LLC are protected by copyright and ownership laws.
The full or partial unauthorized reproduction of the information in this report shall result in civil and criminal punishments.
Risk Analysis Report
The information in this document and any attachments is intended for users of Modulo Risk Manager©, a product developed by Modulo Security LLC. If you do not have permission to access this information, know that it is prohibited to read, release, or copy this information. Improper use will be subject to the legislation in effect based on the confidentiality agreements.
The controls in the knowledge bases created by Modulo Security LLC are protected by copyright and ownership laws.
The full or partial unauthorized reproduction of the information in this report shall result in civil and criminal punishments.
ATTENTION
www.modulo.com
Modulo Security LCC
Copyright © 2013 Modulo Solutions for GRC2 of 37
PRJR13011
Risk Analysis Report
1. ANALYSIS SUMMARY
This report presents the results of the risk analysis carried out in the 01 Proyecto project. Thesystem used was Modulo Risk Manager, developed by Modulo Security LLC, which is based on theexclusive GRC Metaframework methodology. The investigations included the organization's assetsand may have used a variety of methods for collecting evidence, such as: automated collectors,documental analyses, interviews, facility inspections, and others.
Some of the main issues addressed in this report include: (i)What are the major threats to the business? (ii) What are the risk levels of the non-implemented controls? (iii) What are the recommendations for reducing these risks? (iv) How to prioritized the security measures to be taken?
3 of 37 Copyright © 2013 Modulo Solutions for GRC
PRJR13011
Risk Analysis Report
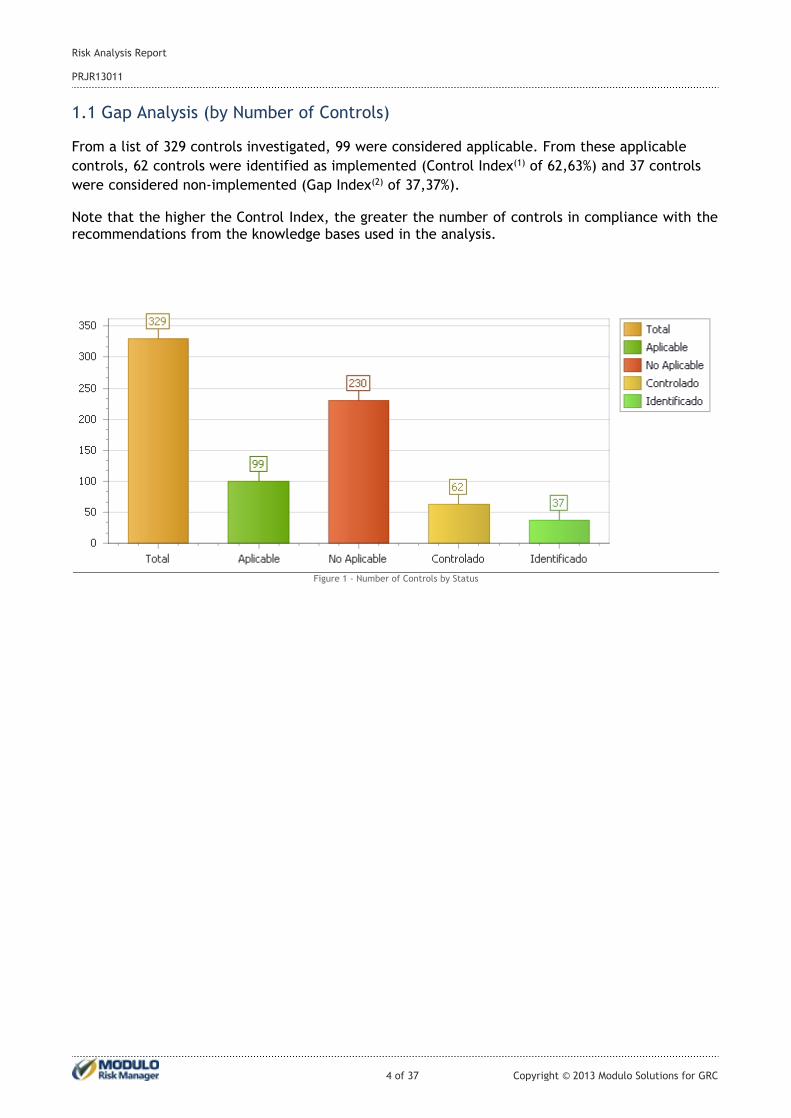
From a list of 329 controls investigated, 99 were considered applicable. From these applicable
controls, 62 controls were identified as implemented (Control Index(1) of 62,63%) and 37 controls
were considered non-implemented (Gap Index(2) of 37,37%).
Note that the higher the Control Index, the greater the number of controls in compliance with therecommendations from the knowledge bases used in the analysis.
1.1 Gap Analysis (by Number of Controls)
Figure 1 - Number of Controls by Status
4 of 37 Copyright © 2013 Modulo Solutions for GRC
PRJR13011
Risk Analysis Report

5 of 37 Copyright © 2013 Modulo Solutions for GRC
PRJR13011
Risk Analysis Report
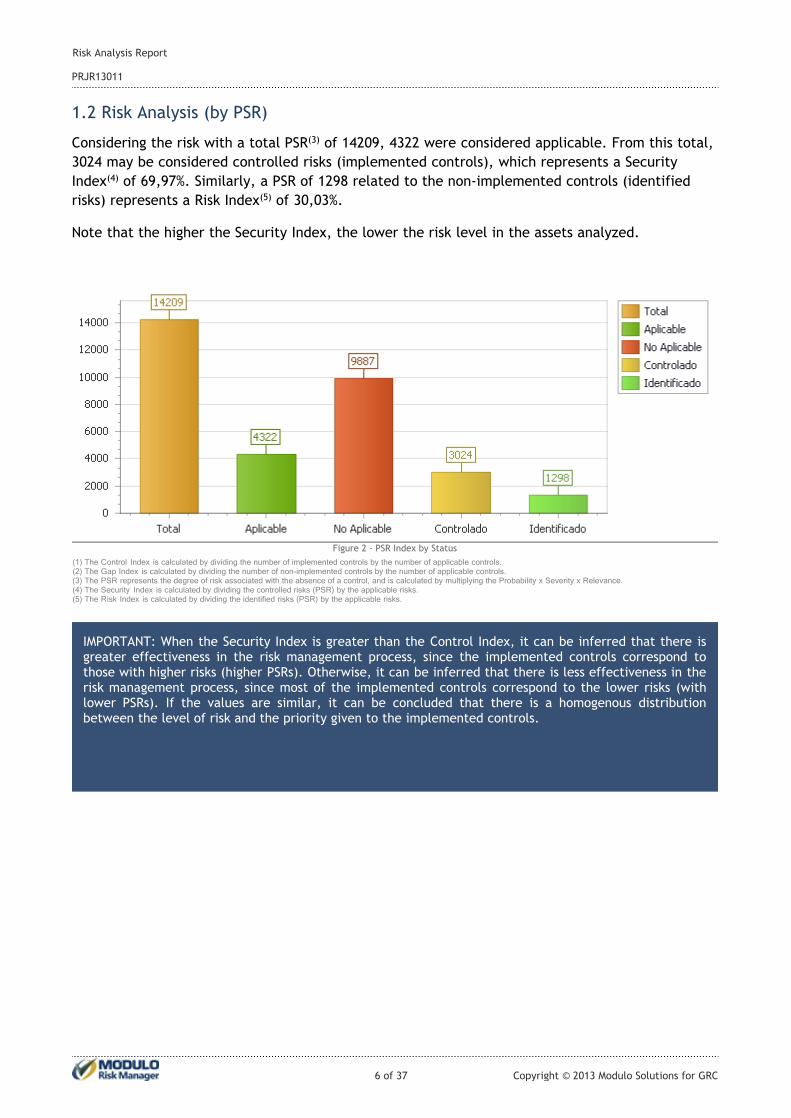
Considering the risk with a total PSR(3) of 14209, 4322 were considered applicable. From this total,
3024 may be considered controlled risks (implemented controls), which represents a Security
Index(4) of 69,97%. Similarly, a PSR of 1298 related to the non-implemented controls (identified
risks) represents a Risk Index(5) of 30,03%.
Note that the higher the Security Index, the lower the risk level in the assets analyzed.
1.2 Risk Analysis (by PSR)
Figure 2 - PSR Index by Status
IMPORTANT: When the Security Index is greater than the Control Index, it can be inferred that there is greater effectiveness in the risk management process, since the implemented controls correspond to those with higher risks (higher PSRs). Otherwise, it can be inferred that there is less effectiveness in the risk management process, since most of the implemented controls correspond to the lower risks (with lower PSRs). If the values are similar, it can be concluded that there is a homogenous distribution between the level of risk and the priority given to the implemented controls.
(1) The Control Index is calculated by dividing the number of implemented controls by the number of applicable controls.(2) The Gap Index is calculated by dividing the number of non-implemented controls by the number of applicable controls.(3) The PSR represents the degree of risk associated with the absence of a control, and is calculated by multiplying the Probability x Severity x Relevance.(4) The Security Index is calculated by dividing the controlled risks (PSR) by the applicable risks.(5) The Risk Index is calculated by dividing the identified risks (PSR) by the applicable risks.
6 of 37 Copyright © 2013 Modulo Solutions for GRC
PRJR13011
Risk Analysis Report

7 of 37 Copyright © 2013 Modulo Solutions for GRC
PRJR13011
Risk Analysis Report
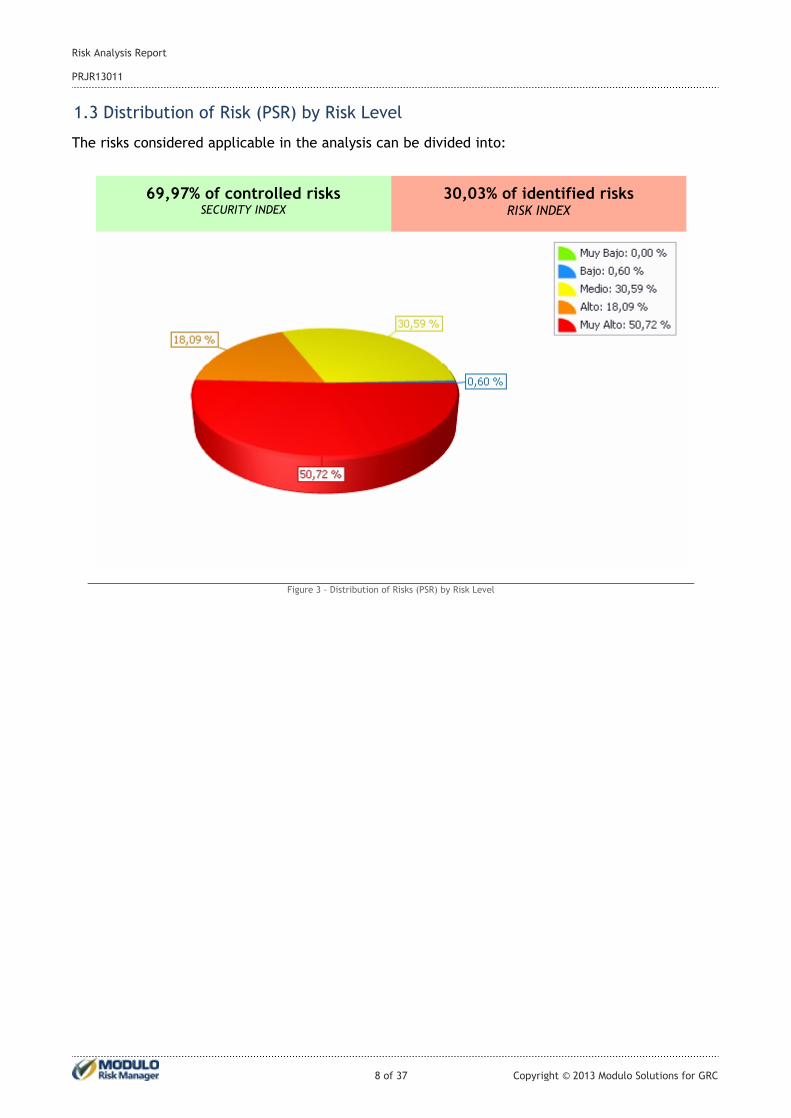
30,03% of identified risksRISK INDEX
69,97% of controlled risksSECURITY INDEX
Figure 3 - Distribution of Risks (PSR) by Risk Level
The risks considered applicable in the analysis can be divided into:
1.3 Distribution of Risk (PSR) by Risk Level
8 of 37 Copyright © 2013 Modulo Solutions for GRC
PRJR13011
Risk Analysis Report

1.4 Risk Levels of Non-Implemented Controls
Table 1 below shows the number and percentage for each risk level of the non-implementedcontrols, for the quantitative and qualitative views of the analysis.
TotalVery LowLowMediumHighVery HighView
Risk Levels
100%0,00%2,00%53,00%15,18%29,82%%
1298026688197387PSRQualitative
100,00%0,00%5,41%64,86%13,51%16,22%%
37022456ControlsQuantitative
Table 1 - Risk Levels of Non-Implemented Controls
As shown in the table above, it can be noted that 16,22% of the non-implemented controls represent 29,82% of the risks considered “Very High” to the organization.
9 of 37 Copyright © 2013 Modulo Solutions for GRC
PRJR13011
Risk Analysis Report

1.5 Risks Identified in Assets (by PSR)
The 2 assets listed in the following table correspond to 100,00% of the total applicable risks. Theseassets should be prioritized for treatment in order to reduce the risks identified.
IdentifiedPSR/TotalApplicable
Risk IndexIdentified
PSRSecurityIndex
ControlledPSR
ApplicablePSR
RelevanceAsset TypeAsset
22,4%27,5%97072,5%25603530Very HighTecnología01 Servidor Back End
7,6%41,4%32858,6%464792HighTecnología01 Firewall
Table 2 - Risk Identified in Assets (by PSR)
30,03%30,03%129869,97%30244322Consolidated (2)
10 of 37 Copyright © 2013 Modulo Solutions for GRC
PRJR13011
Risk Analysis Report
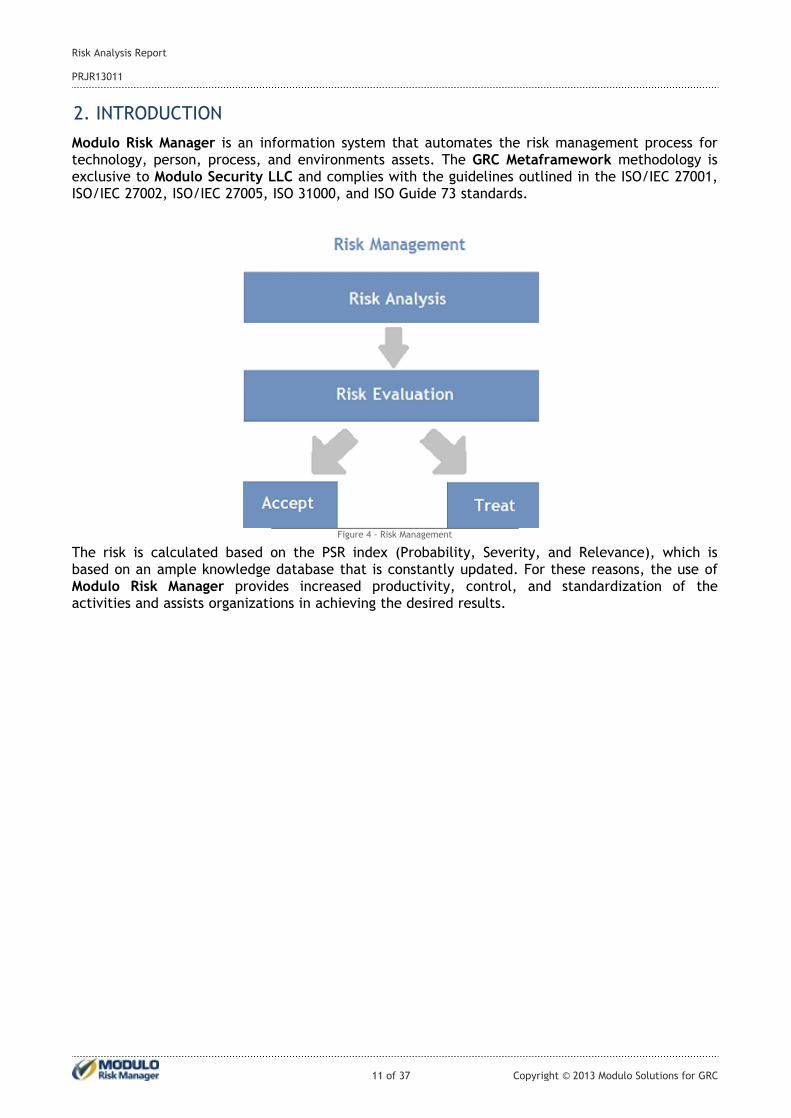
Figure 4 - Risk Management
2. INTRODUCTION
Modulo Risk Manager is an information system that automates the risk management process fortechnology, person, process, and environments assets. The GRC Metaframework methodology isexclusive to Modulo Security LLC and complies with the guidelines outlined in the ISO/IEC 27001,ISO/IEC 27002, ISO/IEC 27005, ISO 31000, and ISO Guide 73 standards.
The risk is calculated based on the PSR index (Probability, Severity, and Relevance), which isbased on an ample knowledge database that is constantly updated. For these reasons, the use ofModulo Risk Manager provides increased productivity, control, and standardization of theactivities and assists organizations in achieving the desired results.
11 of 37 Copyright © 2013 Modulo Solutions for GRC
PRJR13011
Risk Analysis Report
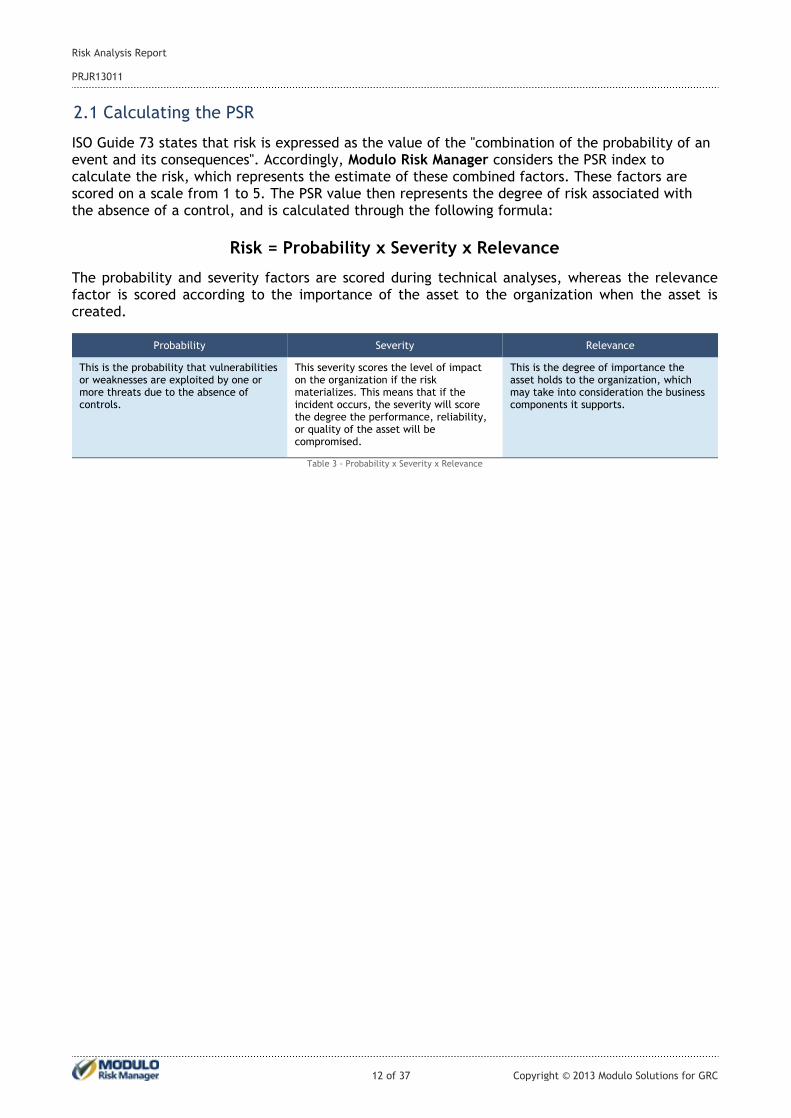
Risk = Probability x Severity x Relevance
The probability and severity factors are scored during technical analyses, whereas the relevancefactor is scored according to the importance of the asset to the organization when the asset iscreated.
2.1 Calculating the PSR
This is the degree of importance theasset holds to the organization, whichmay take into consideration the businesscomponents it supports.
This severity scores the level of impacton the organization if the riskmaterializes. This means that if theincident occurs, the severity will scorethe degree the performance, reliability,or quality of the asset will becompromised.
This is the probability that vulnerabilitiesor weaknesses are exploited by one ormore threats due to the absence ofcontrols.
RelevanceSeverityProbability
Table 3 - Probability x Severity x Relevance
ISO Guide 73 states that risk is expressed as the value of the "combination of the probability of an event and its consequences". Accordingly, Modulo Risk Manager considers the PSR index to calculate the risk, which represents the estimate of these combined factors. These factors are scored on a scale from 1 to 5. The PSR value then represents the degree of risk associated with the absence of a control, and is calculated through the following formula:
12 of 37 Copyright © 2013 Modulo Solutions for GRC
PRJR13011
Risk Analysis Report

PSR: Calculated by summing the PSR scores of the controls. The product of the P, S, and R factors of each control is calculated and the results are then summed. The PSR can be consolidated by asset, asset type, perimeter, control grouping, knowledge base, questionnaire, business component, etc., and may vary between 0 and 100%.
Risk Index: Calculated by dividing the PSR of the non-implemented controls (identified risks) by the PSR of the applicable controls. It's expressed as a percentage and may vary from 0 to 100%.
Security Index: Calculated by dividing the PSR of the implemented controls (avoided risk) by the PSR of the applicable controls, thus complementing the Risk Index. It's also expressed as a percentage and may vary from 0 to 100%.
Control Index: Calculated by dividing the number of implemented controls by the number of applicable controls. It's expressed as a percentage and may vary from 0 to 100%.
Gap Index: Calculated by dividing the number of non-implemented controls by the number of applicable controls, thus complementing the Control Index. It's also expressed as a percentage and may vary from 0 to 100%.
2.2 Risk Indices
Awareness of the risks and their assessment is no longer a technical need. It has become a strategy for organizations to meet the requirements set by the market, the government, regulatory agencies, and others.
To provide a risk estimate, Modulo Risk Manager uses the following indices:
13 of 37 Copyright © 2013 Modulo Solutions for GRC
PRJR13011
Risk Analysis Report
3. LIMITATIONS
These findings are based on questionnaires generated from knowledge bases in Modulo RiskManager. These results should be used as input, allow risks to be treated in the organizationaccording to the best risk management practices.
Those responsible for implementing controls should know that the technical recommendations inthe knowledge bases provided by Modulo Security LLC are valid for generic systems.
The controls in these knowledge bases should be evaluated in terms of their applicability andimpact before being implemented in a production environment. The characteristics of the systemunder analysis should be taken into account, given that a change in the configuration or permissionparameters of the file system could damage the applications.
14 of 37 Copyright © 2013 Modulo Solutions for GRC
PRJR13011
Risk Analysis Report
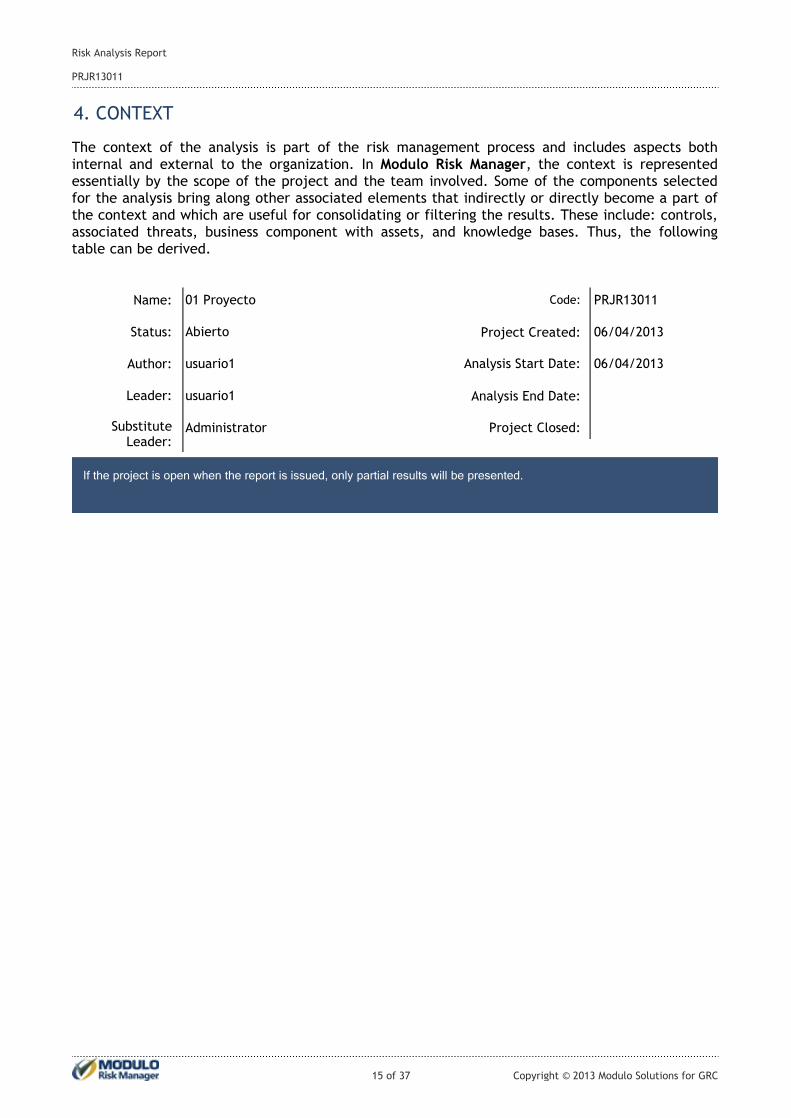
The context of the analysis is part of the risk management process and includes aspects bothinternal and external to the organization. In Modulo Risk Manager, the context is representedessentially by the scope of the project and the team involved. Some of the components selectedfor the analysis bring along other associated elements that indirectly or directly become a part ofthe context and which are useful for consolidating or filtering the results. These include: controls,associated threats, business component with assets, and knowledge bases. Thus, the followingtable can be derived.
4. CONTEXT
Name:
Status:
Author:
Leader:
SubstituteLeader:
01 Proyecto
usuario1
usuario1
Administrator
Code:
Project Created:
Analysis Start Date:
Analysis End Date:
Project Closed:
PRJR13011
06/04/2013
06/04/2013
Abierto
If the project is open when the report is issued, only partial results will be presented.
15 of 37 Copyright © 2013 Modulo Solutions for GRC
PRJR13011
Risk Analysis Report
4.1 Type of Assets Investigated
Tecnología4.1.1
Son los activos físicos de conectividad (switch, router, hub, etc.), hardware de servidores (Risc,Intel, etc.), estaciones de trabajo, dispositivos móviles y otros equipos (teléfonos móviles,PalmPilot, etc.). También están en este tipo cualquier software que esté dentro de los servidoreso computadoras, puede que sean un sistema que gestiona banco de datos, servidores de web,sistemas operativos y otras aplicaciones específicas.
16 of 37 Copyright © 2013 Modulo Solutions for GRC
PRJR13011
Risk Analysis Report
4.2 Project Scope
The scope of the project - comprised of perimeters, assets, and knowledge bases - determines thelimits of the analysis during the project.
17 of 37 Copyright © 2013 Modulo Solutions for GRC
PRJR13011
Risk Analysis Report
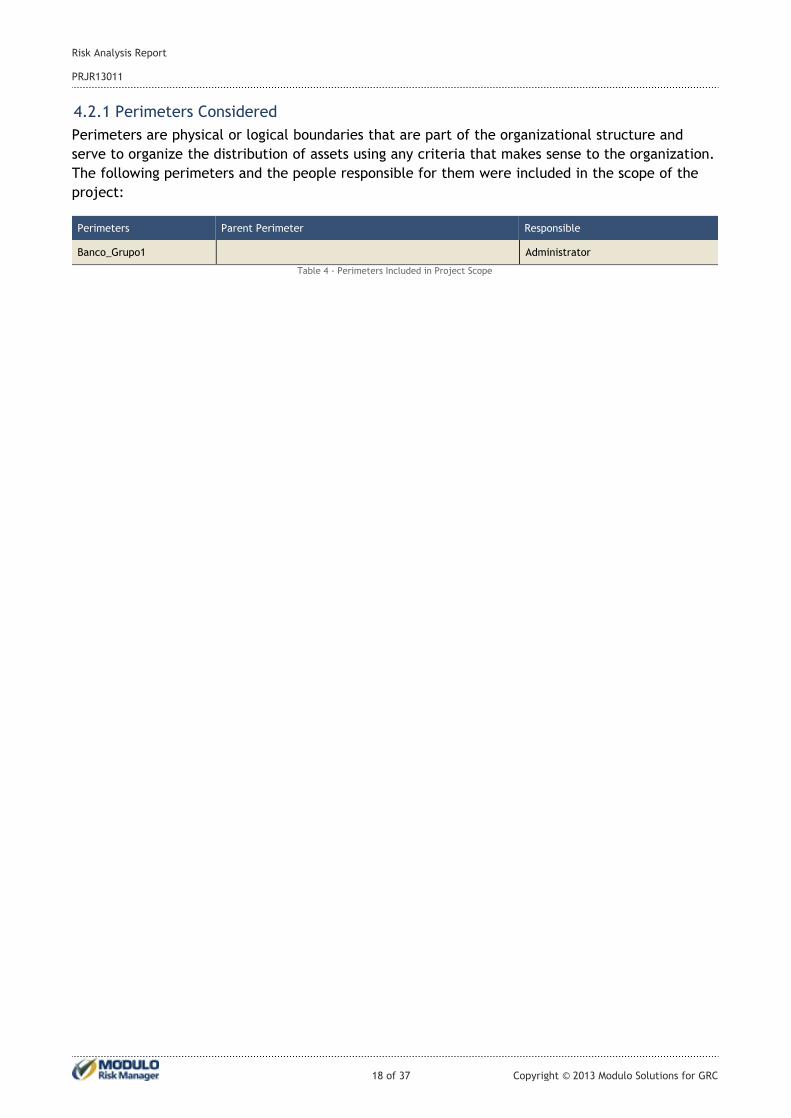
4.2.1 Perimeters Considered
Perimeters are physical or logical boundaries that are part of the organizational structure and
serve to organize the distribution of assets using any criteria that makes sense to the organization.
The following perimeters and the people responsible for them were included in the scope of the
project:
ResponsibleParent PerimeterPerimeters
AdministratorBanco_Grupo1
Table 4 - Perimeters Included in Project Scope
18 of 37 Copyright © 2013 Modulo Solutions for GRC
PRJR13011
Risk Analysis Report
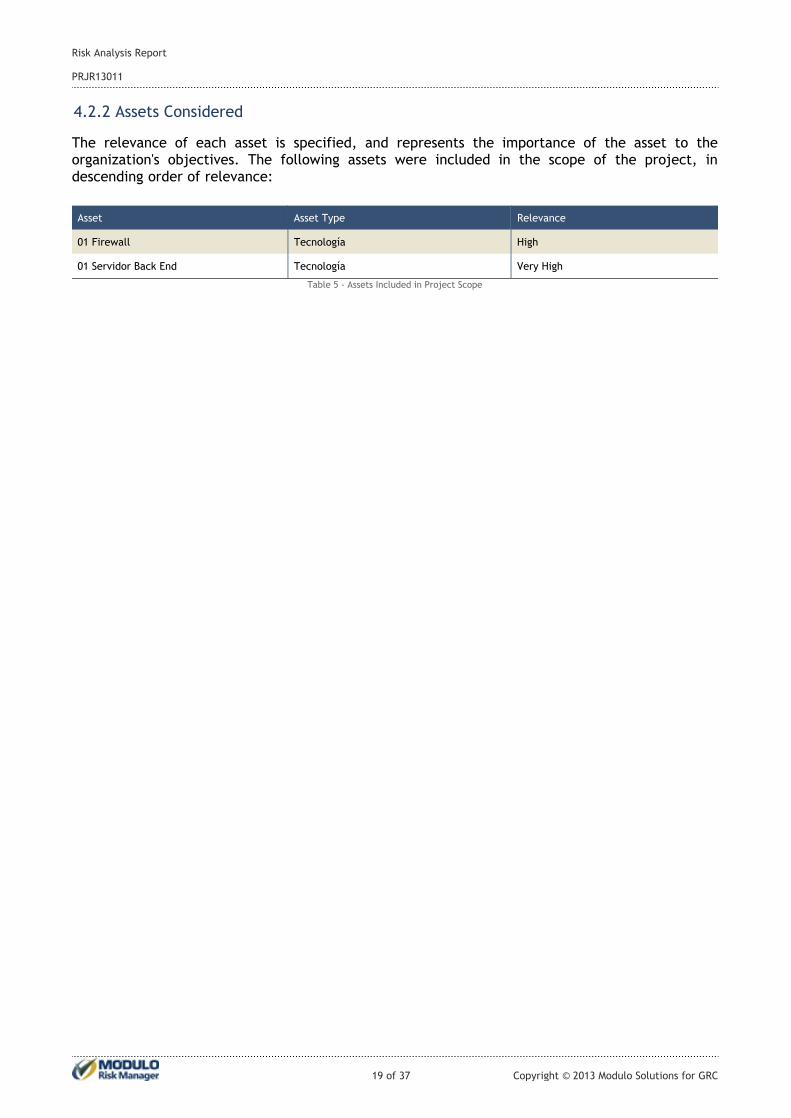
The relevance of each asset is specified, and represents the importance of the asset to theorganization's objectives. The following assets were included in the scope of the project, indescending order of relevance:
4.2.2 Assets Considered
RelevanceAsset TypeAsset
HighTecnología01 Firewall
Very HighTecnología01 Servidor Back End
Table 5 - Assets Included in Project Scope
19 of 37 Copyright © 2013 Modulo Solutions for GRC
PRJR13011
Risk Analysis Report
Threat sources are agents or components that alone or in combination have the potential to pose arisk. Agents have the motivation, method, knowledge, and opportunity to threaten theorganization (intentional threats). Environmental or natural threats give rise to undesirableconditions, such as mistakes, hazards, or disasters (accidental threats). The relevance of thethreat source is determined according to the hazard or level of concern that it represents to theorganization.
4.2.3 Threat Sources Considered
Threat Source Name
Table 6 - Threat Sources Considered in the Project
20 of 37 Copyright © 2013 Modulo Solutions for GRC
PRJR13011
Risk Analysis Report
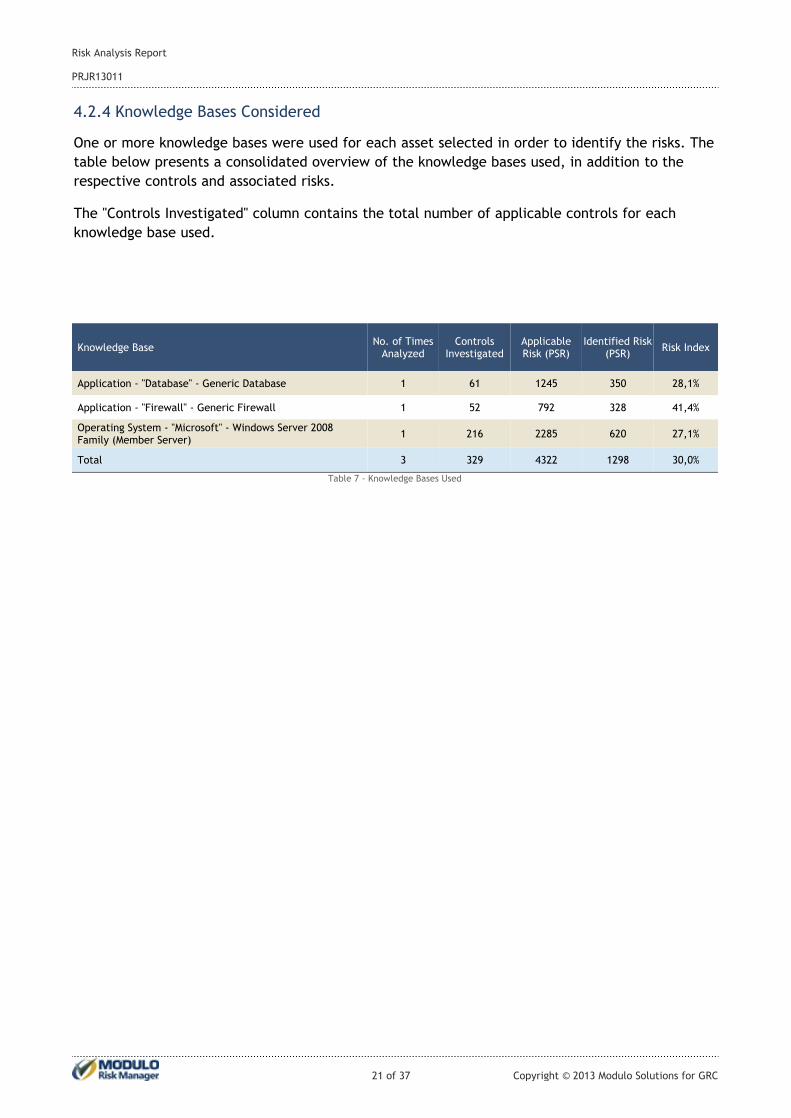
One or more knowledge bases were used for each asset selected in order to identify the risks. The
table below presents a consolidated overview of the knowledge bases used, in addition to the
respective controls and associated risks.
The "Controls Investigated" column contains the total number of applicable controls for each
knowledge base used.
4.2.4 Knowledge Bases Considered
Risk IndexIdentified Risk
(PSR)ApplicableRisk (PSR)
ControlsInvestigated
No. of TimesAnalyzed
Knowledge Base
28,1%3501245611Application - "Database" - Generic Database
41,4%328792521Application - "Firewall" - Generic Firewall
27,1%62022852161Operating System - "Microsoft" - Windows Server 2008Family (Member Server)
30,0%129843223293Total
Table 7 - Knowledge Bases Used
21 of 37 Copyright © 2013 Modulo Solutions for GRC
PRJR13011
Risk Analysis Report
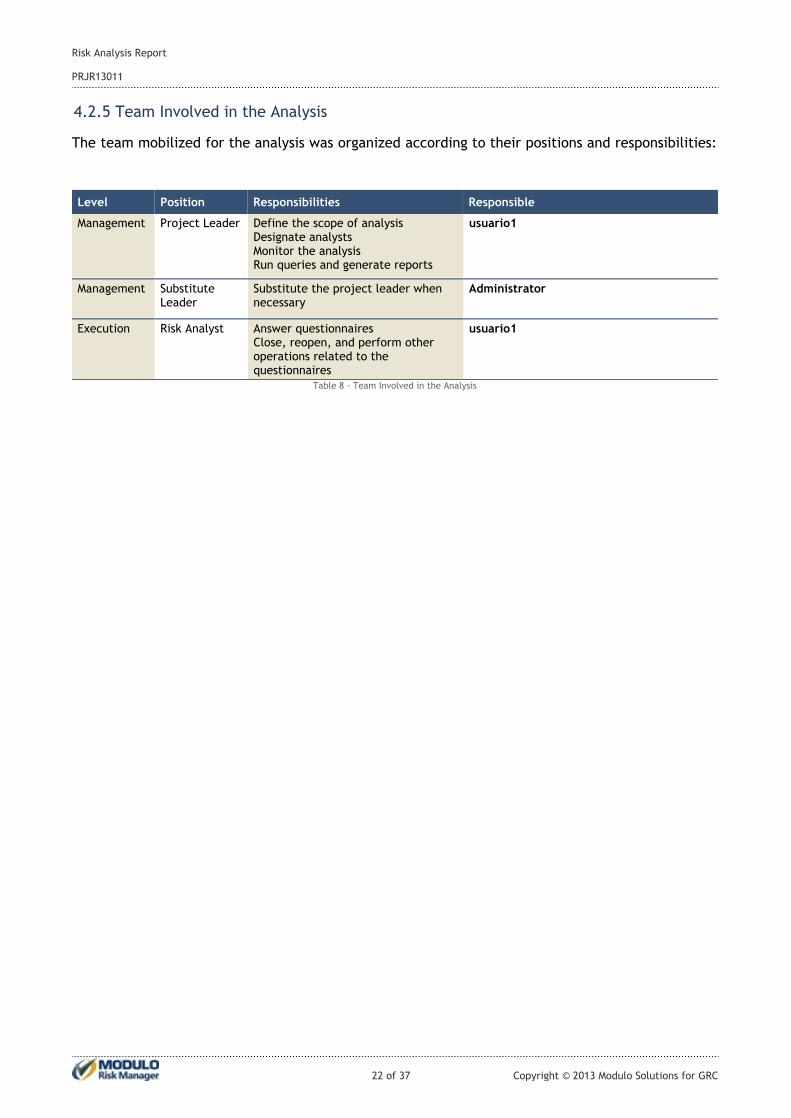
The team mobilized for the analysis was organized according to their positions and responsibilities:
4.2.5 Team Involved in the Analysis
AdministratorSubstitute the project leader whennecessary
SubstituteLeader
Management
ResponsibleResponsibilitiesPositionLevel
usuario1Define the scope of analysisDesignate analystsMonitor the analysisRun queries and generate reports
Project LeaderManagement
usuario1Answer questionnairesClose, reopen, and perform otheroperations related to thequestionnaires
Risk AnalystExecution
Table 8 - Team Involved in the Analysis
22 of 37 Copyright © 2013 Modulo Solutions for GRC
PRJR13011
Risk Analysis Report
5. CONSOLIDATED ANALYSIS
Presenting risks under a variety of perspectives allows managers to decide where to act with the highest priority. Thus, presented below are the consolidated results of the analysis from different perspectives to assist the decision-making process when evaluating and treating risks.
Initially, the consolidated risks are presented for the main business components. Next, the risks for each of the business components are presented and, finally, the risks by threat source, threat, perimeter, asset type, asset, and risk level are presented.
NOTE: If there are unanswered controls, the analysis will show as being in progress with its status as "Open" and the results for the identified risks will be considered partial. In addition, if the questionnaire is closed, unanswered controls will become "Not Applicable".
23 of 37 Copyright © 2013 Modulo Solutions for GRC
PRJR13011
Risk Analysis Report
The risks identified in the assets supporting the organization's business components were
consolidated into the two levels that categorize these components: the strategic level and the
tactical level.
5.1 Risks in Business Component Levels
24 of 37 Copyright © 2013 Modulo Solutions for GRC
PRJR13011
Risk Analysis Report
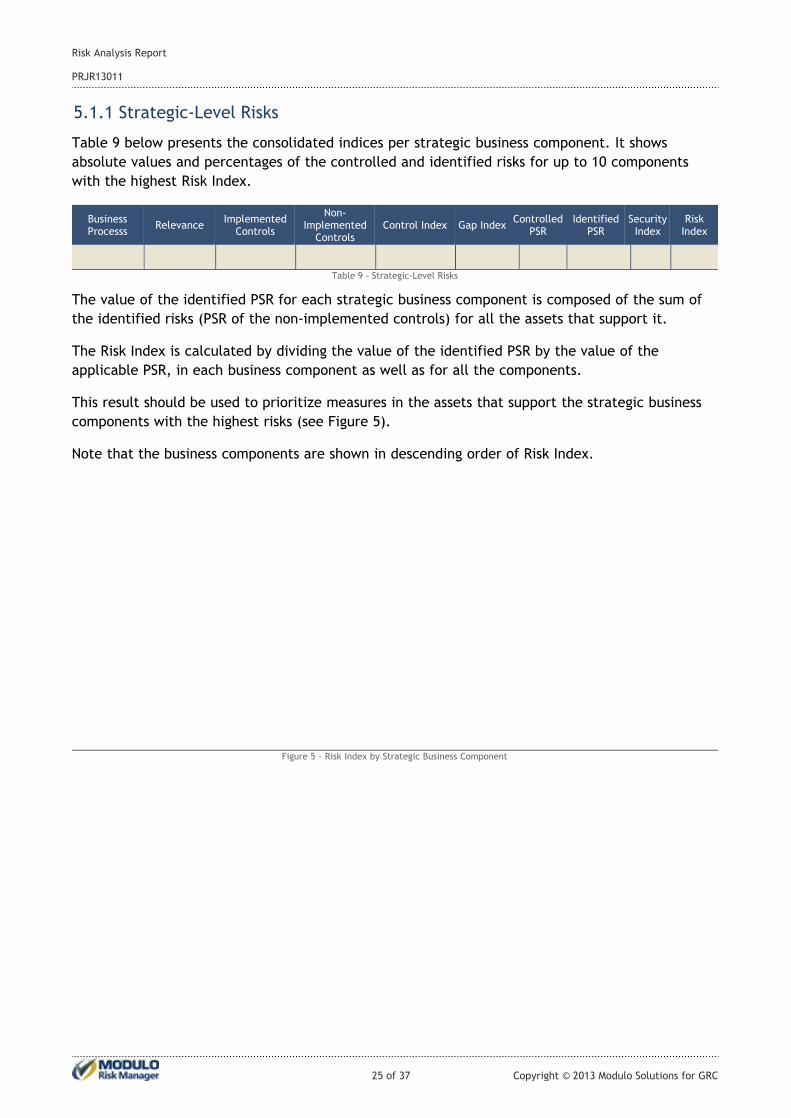
Table 9 below presents the consolidated indices per strategic business component. It shows
absolute values and percentages of the controlled and identified risks for up to 10 components
with the highest Risk Index.
5.1.1 Strategic-Level Risks
RiskIndex
SecurityIndex
IdentifiedPSR
ControlledPSR
Gap IndexControl IndexNon-
ImplementedControls
ImplementedControls
RelevanceBusinessProcesss
Table 9 - Strategic-Level Risks
The value of the identified PSR for each strategic business component is composed of the sum of
the identified risks (PSR of the non-implemented controls) for all the assets that support it.
The Risk Index is calculated by dividing the value of the identified PSR by the value of the
applicable PSR, in each business component as well as for all the components.
This result should be used to prioritize measures in the assets that support the strategic business
components with the highest risks (see Figure 5).
Note that the business components are shown in descending order of Risk Index.
Figure 5 - Risk Index by Strategic Business Component
25 of 37 Copyright © 2013 Modulo Solutions for GRC
PRJR13011
Risk Analysis Report
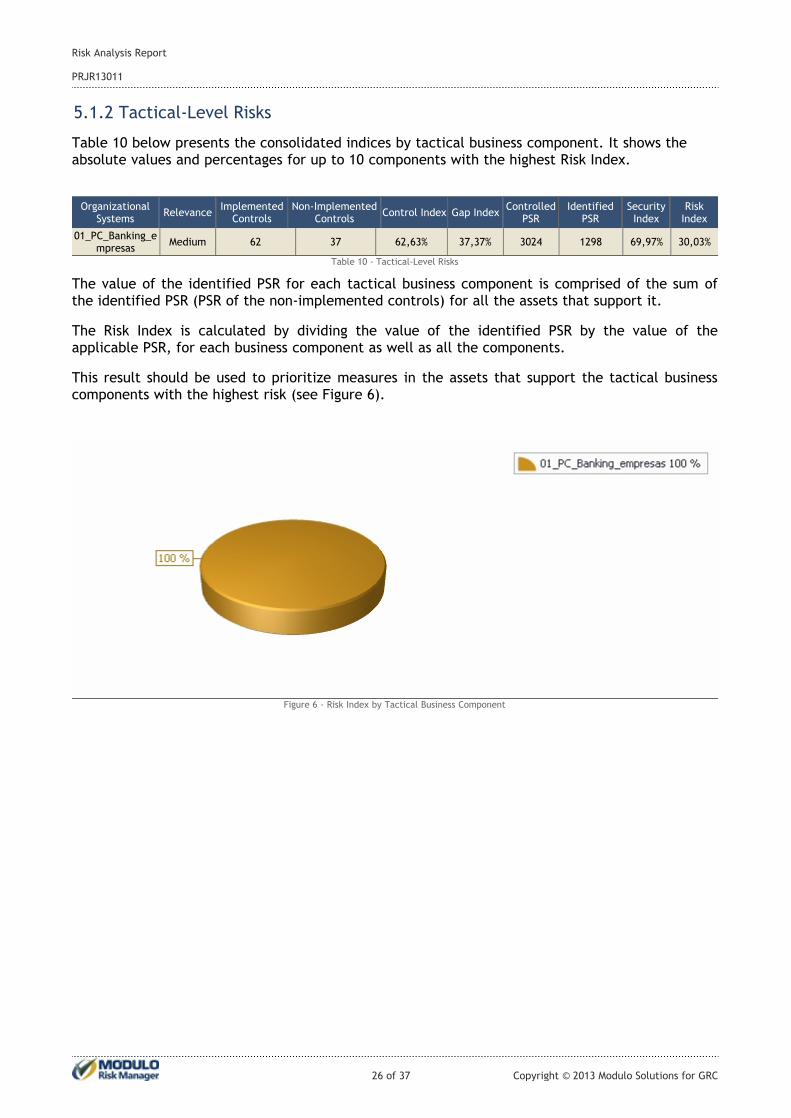
5.1.2 Tactical-Level Risks
Table 10 below presents the consolidated indices by tactical business component. It shows the absolute values and percentages for up to 10 components with the highest Risk Index.
RiskIndex
SecurityIndex
IdentifiedPSR
ControlledPSR
Gap IndexControl IndexNon-Implemented
ControlsImplemented
ControlsRelevance
OrganizationalSystems
30,03%69,97%1298302437,37%62,63%3762Medium01_PC_Banking_e
mpresasTable 10 - Tactical-Level Risks
The value of the identified PSR for each tactical business component is comprised of the sum ofthe identified PSR (PSR of the non-implemented controls) for all the assets that support it.
The Risk Index is calculated by dividing the value of the identified PSR by the value of theapplicable PSR, for each business component as well as all the components.
This result should be used to prioritize measures in the assets that support the tactical businesscomponents with the highest risk (see Figure 6).
Figure 6 - Risk Index by Tactical Business Component
26 of 37 Copyright © 2013 Modulo Solutions for GRC
PRJR13011
Risk Analysis Report
5.2 Risk by Business Component
For each business component, the total quantitative (number of controls) and qualitative (risks)
overviews of the results are presented, distributed over the five risk levels (which vary from “Very
High” to “Very Low”). Next, for each type of asset that supports the strategic business
component, the quantitative and qualitative overviews of the results are shown. This allows the
types of assets with the lowest level of adherence with the knowledge bases used and those with
the highest risks to be identified.
Copyright © 2013 Modulo Solutions for GRC27 of 37
PRJR13011
Risk Analysis Report

5.2.1. 01_PC_Banking_empresas
Table 11 below presents a total of 11 non-implemented controls in the “Very High” and “High”levels, corresponding to 29,73% of the total risk identified for this business component.
100,00%0,00%2,00%53,00%15,18%29,82%%
1298026688197387PSRQualitative
100,00%0,00%5,41%64,86%13,51%16,22%%
37022456ControlsQuantitative
TotalVery LowLowMediumHighVery HighOverview
Risks Levels
Table 11 - Risk Level of Non-Implemented Controls
28 of 37 Copyright © 2013 Modulo Solutions for GRC
PRJR13011
Risk Analysis Report
5.3 Risk by Threat Source
Table 12 below presents the consolidated results by threat source. It shows the absolute valuesand percentages for the controlled and identified risks for the 10 threat sources with the highestRisk Index, presented in descending order of this index.
The identified risk (PSR) associated with each threat source is calculated by the sum of the PSR ofall the threats (potential incidents) related to the non-implemented controls whose threats areassociated with these sources. The Risk Index is calculated by dividing the value of the identifiedPSR by the value of the applicable PSR for each threat source. The associations between thethreat sources and threats were determined in the system by the knowledge manager (or by therole authorized to handle this task).
Risk IndexIdentifiedRisk (PSR)
SecurityIndex
ControlledRisk (PSR)
ApplicableRisk (PSR)
Threat Sources
Table 12 - Risk by Threat Source
These results should be used to prioritize measures for the most critical business components andassets, in terms of the risks arising from the main threat sources (see Figure 7).
Figure 7 - Risk by Threat Source
29 of 37 Copyright © 2013 Modulo Solutions for GRC
PRJR13011
Risk Analysis Report
30 of 37 Copyright © 2013 Modulo Solutions for GRC
PRJR13011
Risk Analysis Report
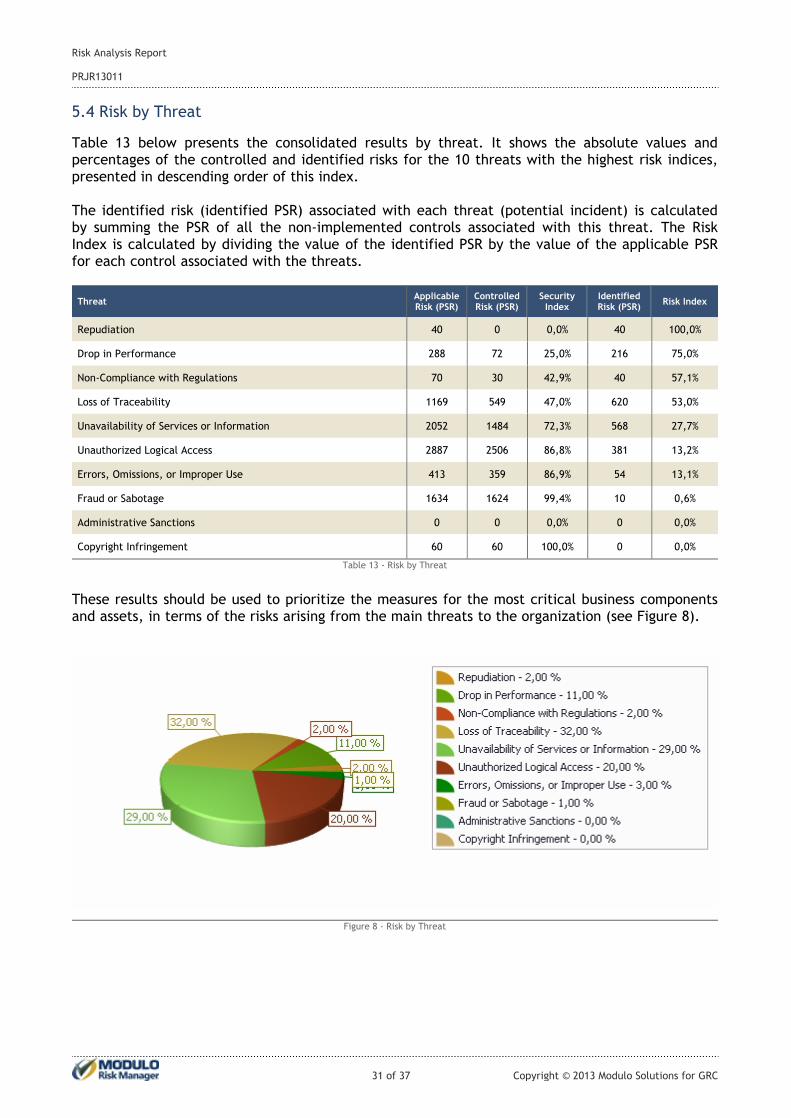
Table 13 below presents the consolidated results by threat. It shows the absolute values andpercentages of the controlled and identified risks for the 10 threats with the highest risk indices,presented in descending order of this index.
The identified risk (identified PSR) associated with each threat (potential incident) is calculatedby summing the PSR of all the non-implemented controls associated with this threat. The RiskIndex is calculated by dividing the value of the identified PSR by the value of the applicable PSRfor each control associated with the threats.
5.4 Risk by Threat
Risk IndexIdentifiedRisk (PSR)
SecurityIndex
ControlledRisk (PSR)
ApplicableRisk (PSR)
Threat
100,0%400,0%040Repudiation
75,0%21625,0%72288Drop in Performance
57,1%4042,9%3070Non-Compliance with Regulations
53,0%62047,0%5491169Loss of Traceability
27,7%56872,3%14842052Unavailability of Services or Information
13,2%38186,8%25062887Unauthorized Logical Access
13,1%5486,9%359413Errors, Omissions, or Improper Use
0,6%1099,4%16241634Fraud or Sabotage
0,0%00,0%00Administrative Sanctions
0,0%0100,0%6060Copyright Infringement
Table 13 - Risk by Threat
These results should be used to prioritize the measures for the most critical business componentsand assets, in terms of the risks arising from the main threats to the organization (see Figure 8).
Figure 8 - Risk by Threat
31 of 37 Copyright © 2013 Modulo Solutions for GRC
PRJR13011
Risk Analysis Report
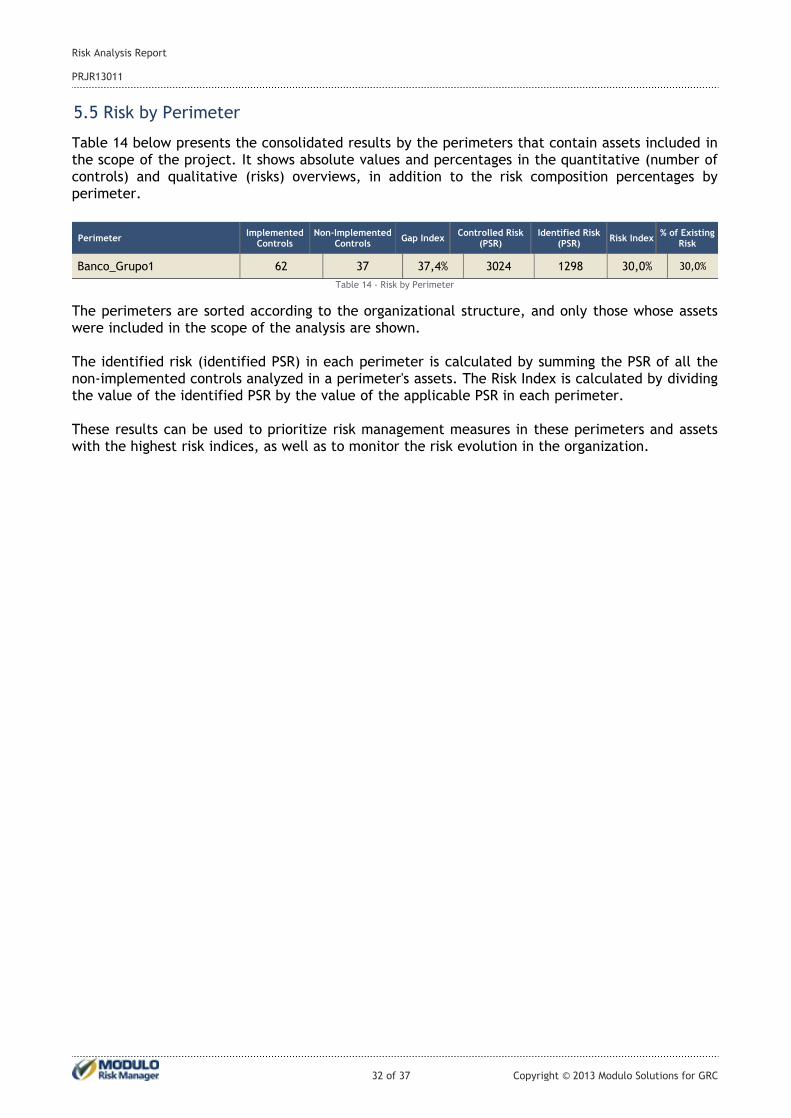
5.5 Risk by Perimeter
Table 14 below presents the consolidated results by the perimeters that contain assets included inthe scope of the project. It shows absolute values and percentages in the quantitative (number ofcontrols) and qualitative (risks) overviews, in addition to the risk composition percentages byperimeter.
% of ExistingRisk
Risk IndexIdentified Risk
(PSR)Controlled Risk
(PSR)Gap Index
Non-ImplementedControls
ImplementedControls
Perimeter
30,0%30,0%1298302437,4%3762Banco_Grupo1
Table 14 - Risk by Perimeter
The perimeters are sorted according to the organizational structure, and only those whose assetswere included in the scope of the analysis are shown.
The identified risk (identified PSR) in each perimeter is calculated by summing the PSR of all thenon-implemented controls analyzed in a perimeter's assets. The Risk Index is calculated by dividingthe value of the identified PSR by the value of the applicable PSR in each perimeter.
These results can be used to prioritize risk management measures in these perimeters and assetswith the highest risk indices, as well as to monitor the risk evolution in the organization.
32 of 37 Copyright © 2013 Modulo Solutions for GRC
PRJR13011
Risk Analysis Report
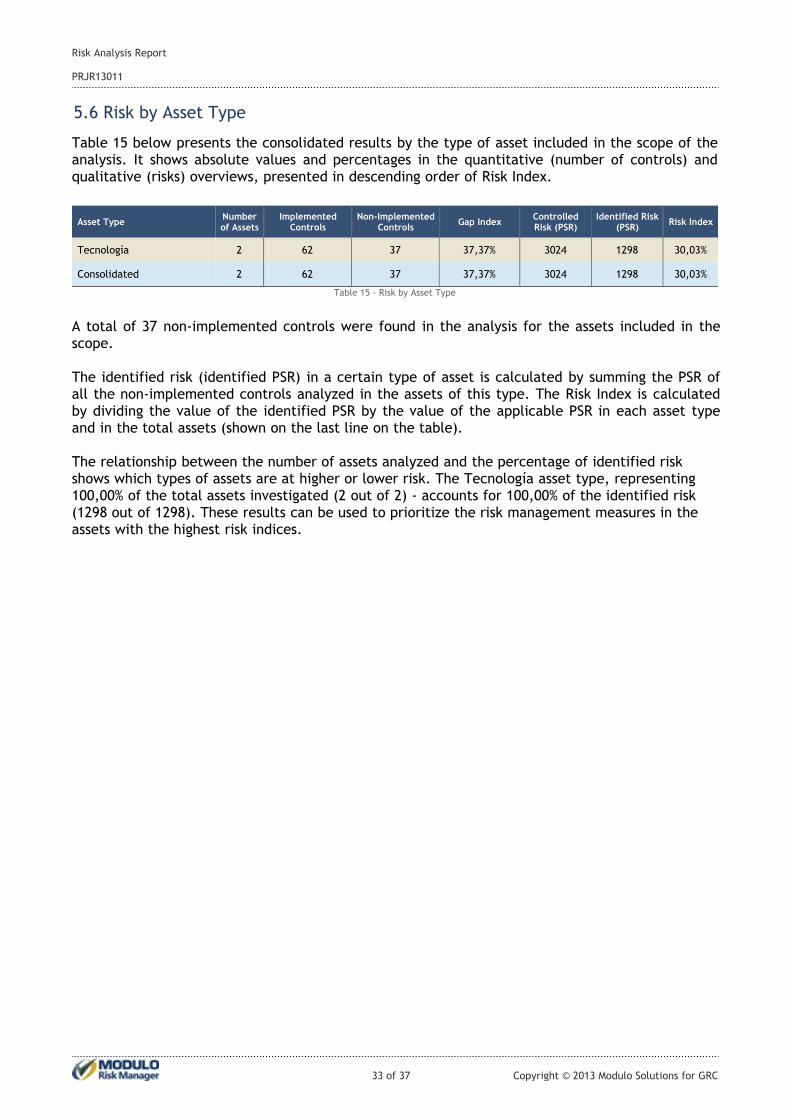
5.6 Risk by Asset Type
Table 15 below presents the consolidated results by the type of asset included in the scope of theanalysis. It shows absolute values and percentages in the quantitative (number of controls) andqualitative (risks) overviews, presented in descending order of Risk Index.
Risk IndexIdentified Risk
(PSR)ControlledRisk (PSR)
Gap IndexNon-Implemented
ControlsImplemented
ControlsNumberof Assets
Asset Type
30,03%1298302437,37%37622Tecnología
30,03%1298302437,37%37622Consolidated
Table 15 - Risk by Asset Type
A total of 37 non-implemented controls were found in the analysis for the assets included in the scope.
The identified risk (identified PSR) in a certain type of asset is calculated by summing the PSR of all the non-implemented controls analyzed in the assets of this type. The Risk Index is calculated by dividing the value of the identified PSR by the value of the applicable PSR in each asset type and in the total assets (shown on the last line on the table).
The relationship between the number of assets analyzed and the percentage of identified risk shows which types of assets are at higher or lower risk. The Tecnología asset type, representing 100,00% of the total assets investigated (2 out of 2) - accounts for 100,00% of the identified risk (1298 out of 1298). These results can be used to prioritize the risk management measures in the assets with the highest risk indices.
33 of 37 Copyright © 2013 Modulo Solutions for GRC
PRJR13011
Risk Analysis Report

A total of 37 non-implemented controls were found in the analysis for the assets included in the
The identified risk (identified PSR) in a certain type of asset is calculated by summing the PSR of all the non-implemented controls analyzed in the assets of this type. The Risk Index is calculated by dividing the value of the identified PSR by the value of the applicable PSR in each asset type
34 of 37 Copyright © 2013 Modulo Solutions for GRC
PRJR13011
Risk Analysis Report
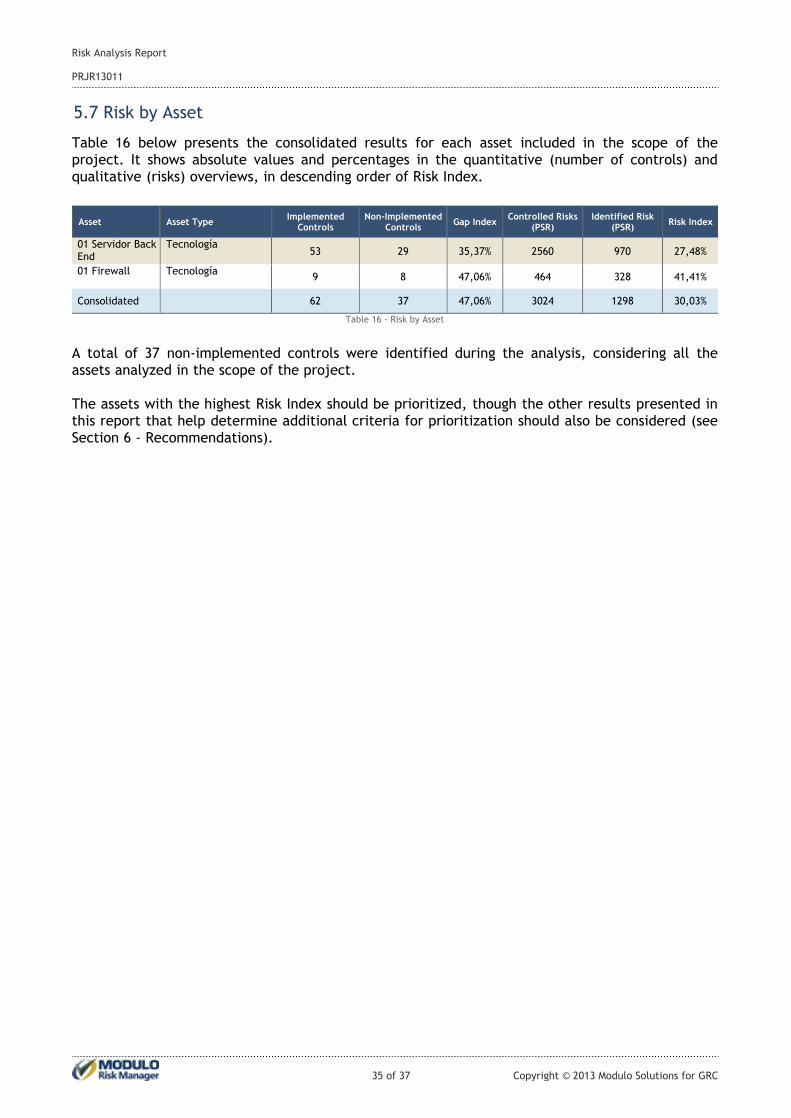
5.7 Risk by Asset
Table 16 below presents the consolidated results for each asset included in the scope of theproject. It shows absolute values and percentages in the quantitative (number of controls) andqualitative (risks) overviews, in descending order of Risk Index.
Risk IndexIdentified Risk
(PSR)Controlled Risks
(PSR)Gap Index
Non-ImplementedControls
ImplementedControls
Asset TypeAsset
27,48%970256035,37%2953Tecnología01 Servidor Back
End
41,41%32846447,06%89Tecnología01 Firewall
30,03%1298302447,06%3762Consolidated
Table 16 - Risk by Asset
A total of 37 non-implemented controls were identified during the analysis, considering all theassets analyzed in the scope of the project.
The assets with the highest Risk Index should be prioritized, though the other results presented inthis report that help determine additional criteria for prioritization should also be considered (seeSection 6 - Recommendations).
35 of 37 Copyright © 2013 Modulo Solutions for GRC
PRJR13011
Risk Analysis Report
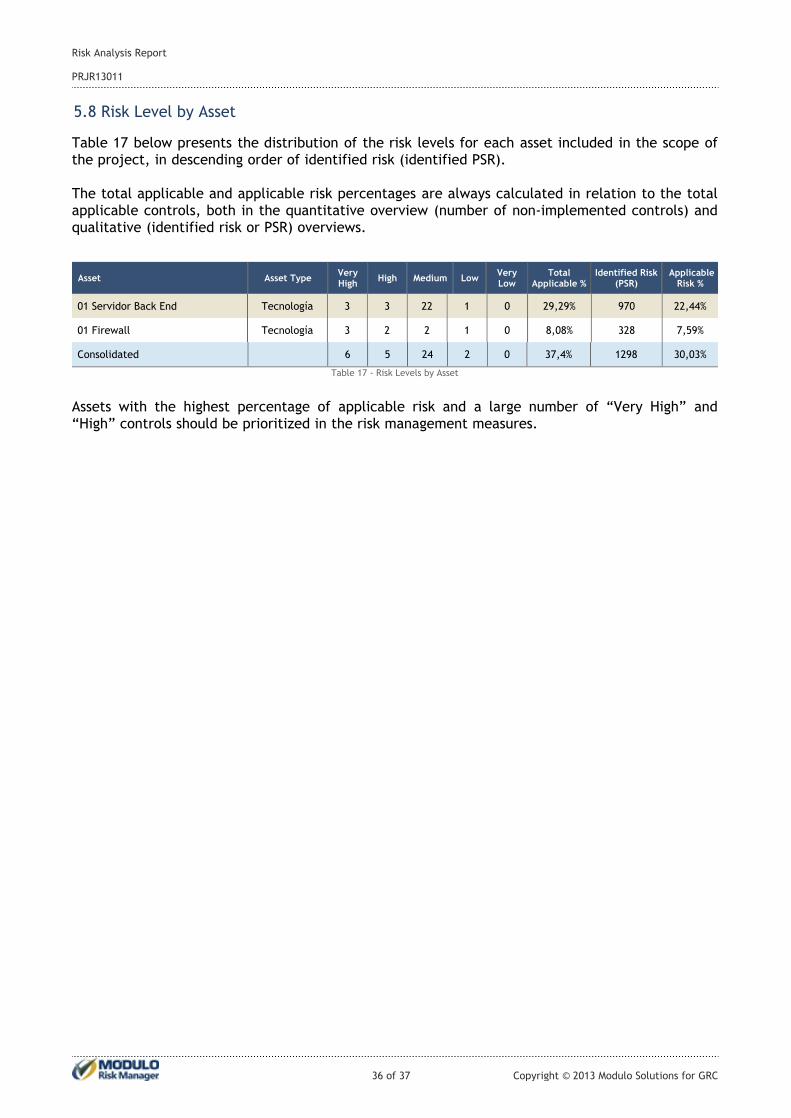
Table 17 below presents the distribution of the risk levels for each asset included in the scope ofthe project, in descending order of identified risk (identified PSR).
The total applicable and applicable risk percentages are always calculated in relation to the totalapplicable controls, both in the quantitative overview (number of non-implemented controls) andqualitative (identified risk or PSR) overviews.
5.8 Risk Level by Asset
ApplicableRisk %
Identified Risk(PSR)
TotalApplicable %
VeryLow
LowMediumHighVeryHigh
Asset TypeAsset
22,44%97029,29%012233Tecnología01 Servidor Back End
7,59%3288,08%01223Tecnología01 Firewall
Table 17 - Risk Levels by Asset
30,03%129837,4%022456Consolidated
Assets with the highest percentage of applicable risk and a large number of “Very High” and“High” controls should be prioritized in the risk management measures.
36 of 37 Copyright © 2013 Modulo Solutions for GRC
PRJR13011
Risk Analysis Report
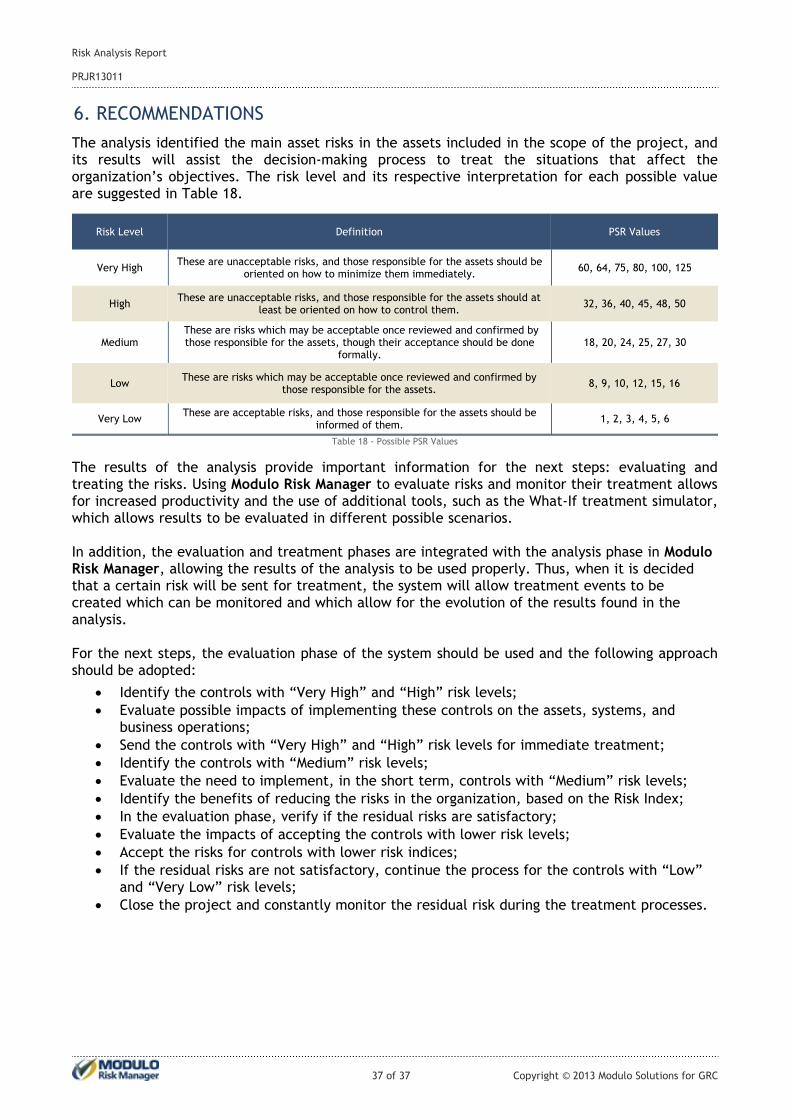
6. RECOMMENDATIONS
The analysis identified the main asset risks in the assets included in the scope of the project, andits results will assist the decision-making process to treat the situations that affect theorganization’s objectives. The risk level and its respective interpretation for each possible valueare suggested in Table 18.
The results of the analysis provide important information for the next steps: evaluating andtreating the risks. Using Modulo Risk Manager to evaluate risks and monitor their treatment allowsfor increased productivity and the use of additional tools, such as the What-If treatment simulator,which allows results to be evaluated in different possible scenarios.
In addition, the evaluation and treatment phases are integrated with the analysis phase in Modulo Risk Manager, allowing the results of the analysis to be used properly. Thus, when it is decided that a certain risk will be sent for treatment, the system will allow treatment events to be created which can be monitored and which allow for the evolution of the results found in the analysis.
For the next steps, the evaluation phase of the system should be used and the following approachshould be adopted:
· Identify the controls with “Very High” and “High” risk levels;· Evaluate possible impacts of implementing these controls on the assets, systems, and
business operations;· Send the controls with “Very High” and “High” risk levels for immediate treatment;· Identify the controls with “Medium” risk levels;· Evaluate the need to implement, in the short term, controls with “Medium” risk levels;· Identify the benefits of reducing the risks in the organization, based on the Risk Index;· In the evaluation phase, verify if the residual risks are satisfactory;· Evaluate the impacts of accepting the controls with lower risk levels;· Accept the risks for controls with lower risk indices;· If the residual risks are not satisfactory, continue the process for the controls with “Low”
and “Very Low” risk levels; · Close the project and constantly monitor the residual risk during the treatment processes.
1, 2, 3, 4, 5, 6These are acceptable risks, and those responsible for the assets should be
informed of them.Very Low
8, 9, 10, 12, 15, 16These are risks which may be acceptable once reviewed and confirmed by
those responsible for the assets.Low
18, 20, 24, 25, 27, 30 These are risks which may be acceptable once reviewed and confirmed bythose responsible for the assets, though their acceptance should be done
formally.Medium
32, 36, 40, 45, 48, 50These are unacceptable risks, and those responsible for the assets should at
least be oriented on how to control them.High
60, 64, 75, 80, 100, 125These are unacceptable risks, and those responsible for the assets should be
oriented on how to minimize them immediately.Very High
PSR ValuesDefinitionRisk Level
Table 18 - Possible PSR Values
37 of 37 Copyright © 2013 Modulo Solutions for GRC
PRJR13011
Risk Analysis Report