bulelengkab.bps.go · produk domestik regional brutokabupaten buleleng menurut lapangan usaha...
TRANSCRIPT
https:
//bulel
engka
b.bps.g
o.id
https:
//bulel
engka
b.bps.g
o.id
PRODUK DOMESTIK REGIONAL BRUTOKABUPATEN BULELENGMENURUT LAPANGAN USAHA 2013-2017
GROSS REGIONAL DOMESTIC PRODUCT OF BULELENG REGENCY BY INDUSTRY 2013-2017
Ukuran Buku/ Book Size: 21,5 cm x 29,7 cmJumlah Halaman/ Number of Pages: xviii + 80 halaman/ pages
Naskah/ Manuscript:BPS Kabupaten BulelengBPS-Statistics of Buleleng Regency
Penyunting/ Editor:BPS Kabupaten BulelengBPS-Statistics of Buleleng Regency
Desain Cover oleh/ Cover Designed by:Subdirektorat Konsolidasi Neraca Produksi Regional/Subdirectorate of Regional Production Account Consloidation
Penerbit/Published By:©Badan Pusat Statistik Kabupaten Buleleng/BPS-Statistics of Buleleng Regency
Pencetak/ Printed By:Percetakan "Teleng Indah", Singaraja
Sumber Ilustrasi/Graphics by:Pixabay.com
Dilarang mengumumkan, mendistribusikan, mengomunikasikan, dan/atau menggandakan sebagian atau seluruh isi buku ini untuk tujuan komersial tanpa izin tertulis dari Badan Pusat Statistik
Prohibited announce, distribute, communicate, and/or copy part or all of the contents of this book for commercial purposes without the written permission of the Central Bureau of Statistics
ISSN: 2356-2730 No. Publikasi/ Publication Number: 51080.1802 Katalog/ Catalogue: 9302021.5108
https:
//bulel
engka
b.bps.g
o.id
TIM PENYUSUN / DRAFTING TEAM
Penanggungjawab Umum/General in Charge:Eman Sulaeman, SST, MAP
Penanggungjawab Teknis/Technical in Charge:Gede Iwan Santika, SST
Penulis/Writer:Ayu Manik Pratiwi, SST, M.SI
Pengolah Data/Data Processor:Ayu Manik Pratiwi, SST, M.SI.
Gambar Kulit/Cover Design:Subdirektorat Konsolidasi Neraca Produksi Regional, BPS-RI.
Layout/Layout Ayu Manik Pratiwi, SST, M.SI
https:
//bulel
engka
b.bps.g
o.id

https:
//bulel
engka
b.bps.g
o.id

v
KATA PENGANTAR
Sebagaimana amanat UU No. 16 Tahun 1997 tentang Statistik, BPS berperan menyajikan berbagai data dan indikator statistik yang dibutuhkan dalam perencanaan dan evaluasi pembangunan baik di tingkat nasional maupun regional. Produk Domestik Regional Bruto (PDRB) menjadi salah satu indikator makro ekonomi yang disajikan oleh BPS secara rutin tiap tahunnya, untuk menggambarkan kondisi perekonomian suatu wilayah. Penjelasan terkait perkembangan nilai PDRB Kabupaten Buleleng selama 5 (lima) tahun terakhir, terangkum dalam publikasi “Produk Domestik Regional Bruto Kabupaten Buleleng menurut Lapangan Usaha Tahun 2013-2017”. Publikasi ini merupakan kelanjutan dari penerbitan tahun-tahun sebelumnya yang disusun oleh BPS Kabupaten Buleleng. Publikasi ini kiranya dapat memberikan makna untuk pembangunan ekonomi di Kabupaten Buleleng, serta bermanfaat bagi para pengguna data. Berbagai saran dan masukan sangat diharapkan guna penyempurnaan publikasi ini di masa yang akan datang. Kepada semua pihak yang telah membantu penyusunan publikasi ini, kami ucapkan terima kasih yang sebesar-besarnya.
Singaraja, Juli 2018BADAN PUSAT STATISTIK KABUPATEN BULELENG
KEPALA,
Eman Sulaeman, SST, MAPhttps:
//bulel
engka
b.bps.g
o.id
vi
PREFACE
As mandated by Law No. 16 Year 1997 on Statistics, BPS plays an important role in presenting the various statistical data and indicators that required in the planning and evaluation of development at both national and regional levels. Gross Regional Domestic Product (GRDP) is one of the macroeconomic indicators presented by BPS on a regular basis every year to describe the economic condition of a region. The explanation related to the development of GRDP value of Buleleng Regency for the last 5 (five) years, summarized in the publication “Gross Regional Domestic Product of Buleleng Regency by Industry 2013-2017”. This publication is a continuation of the publication of previous years compiled by BPS of Buleleng Regency. This publication is expected to be meaningfull for economic development in Buleleng Regency, as well as usefull for data users. Various suggestions and inputs are desirable for the improvement of this publication in the future. To all those who have assisted in the preparation of this publication, we express our greatest gratitude.
Singaraja, July 2018BPS-STATISTICS OF BULELENG REGENCY
CHIEF STATISTICIAN,
Eman Sulaeman, SST, MAP
https:
//bulel
engka
b.bps.g
o.id
vii
DAFTAR ISICONTENTS LIST
KATA PENGANTAR/ PREFACE.............................................................................................. vDAFTAR ISI/ CONTENTS LIST………………………………………………………………… viiDAFTAR TABEL/ LIST OF TABLES....…………………………………………………………. ixDAFTAR GRAFIK/ LIST OF CHARTS........……………………………………………………. xiDAFTAR LAMPIRAN/ APPENDIXS…………………………………………………………… xvPENJELASAN TEKNIS/ TECHNICAL NOTES…………………………………………………. xviiI. PENJELASAN UMUM/ OVERVIEW............................................................................................ 3
1.1 Pengertian PDRB/Concept of GRDP.............................................................................. 31.2 Kegunaan PDRB/ The Usefulness of GRDP.................................................................. 41.3 Perubahan Tahun Dasar PDRB/Base Year Change of GDRP.................................... 5
II RUANG LINGKUP DAN METODE PENGHITUNGAN/COVERAGE AND CALCULA-TION METHOD..................................................................................................................................
13
2.1 Pertanian, Kehutanan, dan Perikanan / Agriculture, Forestry And Fishing........ 152.2 Pertambangan dan Penggalian/ Mining and Quarrying........................................ 172.3 Industri Pengolahan/ Manufacturing........................................................................... 182.4 Pengadaan Listrik dan Gas/ Electricity and Gas........................................................ 192.5 Pengadaan Air, Pengelolaan Sampah, Limbah dan Daur Ulang/ Water Sup-
ply, Sewerage, Waste Management and Remediation Activities............................20
2.6 Konstruksi/ Construction.................................................................................................. 212.7 Perdagangan Besar dan Eceran; Reparasi Mobil dan Sepeda Motor/
Wholesale and Retail Trade; Repair of Motor Vehicles and Motorcycles...............23
2.8 Transportasi dan Pergudangan/ Transportation and Storage.............................. 262.9 Penyediaan Akomodasi dan Makan Minum/ Accommodation and Food
Service Activities..................................................................................................................27
2.10 Informasi dan Komunikasi/ Information and Communication............................. 282.11 Jasa Keuangan dan Asuransi/ Financial and Insurance Activities........................ 302.12 Real Estat/ Real Estate Activities...................................................................................... 312.13 Jasa Perusahaan/ Businnes Activities............................................................................ 322.14 Administrasi Pemerintahan, Pertahanan dan Jaminan Sosial Wajib/ Public
Administration and Defence, Compulsory Social Security.......................................33
2.15 Jasa Pendidikan/ Education............................................................................................. 342.16 Jasa Kesehatan dan Kegiatan Sosial/ Human Health and Social Work
Activities.................................................................................................................................35
2.17 Jasa Lainnya/ Other Services Activities.......................................................................... 36III TINJAUAN EKONOMI BALI/ ECONOMIC REVIEW OF BALI..................................... 39
3.1 Struktur Ekonomi/ Economic Structure........................................................................ 423.2 Pertumbuhan Ekonomi/ Economic Growth............................................................... 463.3 PDRB Perkapita/ GRDP Per Capita.................................................................................. 50
IV PERKEMBANGAN PDRB MENURUT LAPANGAN USAHA/DEVELOPMENT OF GDRP BY INDUSTRY..................................................................................................
53
4.1 Pertanian, Kehutanan, dan Perikanan / Agriculture, Forestry And Fishery........ 55
https:
//bulel
engka
b.bps.g
o.id
viii
4.2 Pertambangan dan Penggalian/ Mining and Quarrying........................................ 564.3 Industri Pengolahan/ Manufacturing........................................................................... 574.4 Pengadaan Listrik dan Gas/ Electricity and Gas........................................................ 584.5 Pengadaan Air, Pengelolaan Sampah, Limbah dan Daur Ulang/ Water Sup-
ply, Sewerage, Waste Management and Remediation Activities............................59
4.6 Konstruksi/ Construction.................................................................................................. 604.7 Perdagangan Besar dan Eceran; Reparasi Mobil dan Sepeda Motor/
Wholesale and Retail Trade; Repair of Motor Vehicles and Motorcycles...............61
4.8 Transportasi dan Pergudangan/ Transportation and Storage.............................. 614.9 Penyediaan Akomodasi dan Makan Minum/ Accommodation and Food
Service Activities..................................................................................................................62
4.10 Informasi dan Komunikasi/ Information and Communication............................. 634.11 Jasa Keuangan dan Asuransi/ Financial and Insurance Activities........................ 644.12 Real Estat/ Real Estate Activities...................................................................................... 654.13 Jasa Perusahaan/ Businnes Activities............................................................................. 664.14 Administrasi Pemerintahan, Pertahanan dan Jaminan Sosial Wajib/ Public
Administration and Defence, Compulsory Social Security.......................................66
4.15 Jasa Pendidikan/ Education............................................................................................. 674.16 Jasa Kesehatan dan Kegiatan Sosial/ Human Health and Social Work Activi-
ties...........................................................................................................................................68
4.17 Jasa Lainnya/ Other Services Activities.......................................................................... 69
https:
//bulel
engka
b.bps.g
o.id

ix
DAFTAR TABELLIST OF TABLES
Halaman/Page
Tabel 1.1Table 1.1
Perbandingan Perubahan Konsep dan Metode Perhitungan PDRB/ Comparison of Concept Changes and Calculation Methods of GRDP
9
Tabel 1.2Table 1.2
Perbandingan Perubahan Klasifikasi PDRB Menurut Lapangan Usaha Tahun Dasar 2000 dan 2010/ Comparison of Changes in Classification of GRDP by Industrial Base Year 2000 and 2010
10
Tabel 1.3Table 1.3
Perbandingan Perubahan Klasifikasi PDRB Menurut Pengeluaran Tahun Dasar 2000 dan 2010/ Comparison of Change in Classification of GRDP by Expenditure Base Year 2000 and 2010
11
Tabel 3.1Table 3.1
Distribusi Persentase Produk Domestik Regional Bruto Kabupaten Buleleng Atas Dasar Harga Berlaku Menurut Lapangan Usaha, 2013-2017/ Distribution of Percentage of Buleleng Regency’s Gross Regional Domestic Product at Current Market Prices Business Field, 2013-2017
44
Tabel 3.2Table 3.2
Laju Pertumbuhan Produk Domestik Regional Bruto Kabupaten Buleleng Atas Dasar Harga Konstan 2010 Menurut Lapangan Usaha (Persen), 2013-2017/ Growth Rate of Gross Regional Domestic Product of Buleleng Regency at 2010 Constant Market Prices by Industry (Percent), 2013-2017
49
Tabel 3.3Table 3.3
Produk Domestik Regional Bruto dan PDRB Perkapita Kabupaten Bule-leng, 2013-2017 / Gross Regional Domestic Product and Per Capita GRDP of Buleleng Regency, 2013-2017
51
Tabel 4.1Table 4.1
Distribusi dan Laju Pertumbuhan Ekonomi Kategori Pertanian, Kehuta-nan dan Perikanan di Kabupaten Buleleng (Persen), 2013-2017Share and Growth Rate of Agriculture, Forestry and Fishery in Buleleng Regency (Percent), 2013-2017
56
Tabel 4.2Table 4.2
Distribusi dan Laju Pertumbuhan Ekonomi Kategori Pertambangan dan Penggalian di Kabupaten Buleleng (Persen), 2013-2017Share and Growth Rate of Mining and Quarrying in Buleleng Regency (Percent), 2013-2017
56
Tabel 4.3Table 4.3
Distribusi dan Laju Pertumbuhan Ekonomi Kategori Industri Pengola-han di Kabupaten Buleleng (Persen), 2013-2017Share and Growth Rate of Manufacturing in Buleleng Regency (Percent), 2013-2017
57
https:
//bulel
engka
b.bps.g
o.id

x
Tabel 4.4Table 4.4
Distribusi dan Laju Pertumbuhan Ekonomi Kategori Pengadaan Listrik dan Gas di Kabupaten Buleleng (Persen), 2013-2017Share and Growth Rate of Electricity and Gas in Buleleng Regency (Per-cent), 2013-2017
58
Tabel 4.5Table 4.5
Distribusi dan Laju Pertumbuhan Ekonomi Kategori Pengadaan Air, Pengelolaan Sampah, Limbah dan Daur Ulang di Kabupaten Buleleng (Persen), 2013-2017Share and Growth Rate of Water Supply, Sewerage, Waste Management and Remediation Activities in Buleleng Regency (Percent), 2013-2017
59
Tabel 4.6Table 4.6
Distribusi dan Laju Pertumbuhan Ekonomi Kategori Konstruksi di Ka-bupaten Buleleng (Persen), 2013-2017Share and Growth Rate of Construction in Buleleng Regency (Percent), 2013-2017
60
Tabel 4.7Table 4.7
Distribusi dan Laju Pertumbuhan Ekonomi Kategori Perdagangan Besar dan Eceran; Reparasi Mobil dan Sepeda Motor di Kabupaten Buleleng (Persen), 2013-2017Share and Growth Rate of Wholesale and Retail Trade; Repair of Motor Vehicles and Motorcycles in Buleleng Regency (Percent), 2013-2017
61
Tabel 4.8Table 4.8
Distribusi dan Laju Pertumbuhan Ekonomi Kategori Transportasi dan Pergudangan di Kabupaten Buleleng (Persen), 2013-2017Share and Growth Rate of Transportation and Storage in Buleleng Re-gency (Percent), 2013-2017
62
Tabel 4.9Table 4.9
Distribusi dan Laju Pertumbuhan Ekonomi Kategori Penyediaan Ako-modasi dan Makan Minum di Kabupaten Buleleng (Persen), 2013-2017Share and Growth Rate of Accommodation and Food Service Activities in Buleleng Regency (Percent), 2013-2017
64
Tabel 4.10Table 4.10
Distribusi dan Laju Pertumbuhan Ekonomi Kategori Informasi dan Komunikasi di Kabupaten Buleleng (Persen), 2013-2017Share and Growth Rate of Information and Communication in Buleleng Regency (Percent), 2013-2017
64
Tabel 4.11Table 4.11
Distribusi dan Laju Pertumbuhan Ekonomi Kategori Jasa Keuangan dan Asuransi di Kabupaten Buleleng (Persen), 2013-2017Share and Growth Rate of Financial and Insurance Activities in Buleleng Regency (Percent), 2013-2017
64
https:
//bulel
engka
b.bps.g
o.id
xi
Tabel 4.12Table 4.12
Distribusi dan Laju Pertumbuhan Ekonomi Kategori Real Estat di Kabu-paten Buleleng (Persen), 2013-2017Share and Growth Rate of Real Estate in Buleleng Regency (Percent), 2013-2017
65
Tabel 4.13Table 4.13
Distribusi dan Laju Pertumbuhan Ekonomi Kategori Jasa Perusahaan di Kabupaten Buleleng (Persen), 2013-2017Share and Growth Rate of Businnes Activities in Buleleng Regency (Per-cent), 2013-2017
66
Tabel 4.14Table 4.14
Distribusi dan Laju Pertumbuhan Ekonomi Kategori Administrasi Pemerintahan, Pertahanan dan Jaminan Sosial Wajib di Kabupaten Buleleng (Persen), 2013-2017Share and Growth Rate of Public Administration and Defence, Compul-sory Social Security in Buleleng Regency (Percent), 2013-2017
67
Tabel 4.15Table 4.15
Distribusi dan Laju Pertumbuhan Ekonomi Kategori Jasa Pendidikan di Kabupaten Buleleng (Persen), 2013-2017Share and Growth Rate of Education in Buleleng Regency (Percent), 2013-2017
68
Tabel 4.16Table 4.16
Distribusi dan Laju Pertumbuhan Ekonomi Kategori Jasa Kesehatan dan Kegiatan Sosial di Kabupaten Buleleng (Persen), 2013-2017Share and Growth Rate of Human Health and Social Work Activities in Buleleng Regency (Percent), 2013-2017
68
Tabel 4.17Table 4.17
Distribusi dan Laju Pertumbuhan Ekonomi Kategori Jasa Lainnya di Kabupaten Buleleng (Persen), 2013-2017Share and Growth Rate of Other Services Activities in Buleleng Regency (Percent), 2013-2017
69https:
//bulel
engka
b.bps.g
o.id
xii
DAFTAR GAMBARLIST OF FIGURES
Halaman/Page
Gambar 3.1Figure 3.1
Persentase Produk Domestik Regional Bruto Kabupaten Buleleng Terh-adap PDRB Provinsi Bali, 2017 Percentage of Gross Regional Domestic Product of Buleleng Regency to GRDP Bali Province, 2017
42
Gambar 3.2Figure 3.2
Laju Pertumbuhan Ekonomi Kabupaten Buleleng, 2013-2017 Economic Growth Rate of Buleleng Regency, 2013-2017
47
https:
//bulel
engka
b.bps.g
o.id
xiii
DAFTAR LAMPIRANAPPENDIXS
Halaman/Page
Tabel 5.1Table 5.1
Produk Domestik Regional Bruto Kabupaten Buleleng Atas Dasar Harga Berlaku Menurut Lapangan Usaha (Miliar Rupiah), 2013-2017 / Gross Regional Domestic Product of Buleleng Regency at Current Market Prices by Industry (Million Rupiah), 2013-2017
73
Tabel 5.2Table 5.2
Produk Domestik Regional Bruto Kabupaten Buleleng Atas Dasar Harga Konstan 2010 Menurut Lapangan Usaha (Miliar Rupiah), 2013-2017 / Gross Regional Domestic Product of Buleleng Regency at 2010 Constant Market Prices by Industry (Million Rupiah), 2013-2017
74
Tabel 5.3Table 5.3
Distribusi Persentase Produk Domestik Regional Bruto Kabupaten Buleleng Atas Dasar Harga Berlaku Menurut Lapangan Usaha (Persen), 2013-2017 / Percentage Distribution of Gross Regional Domestic Product of Buleleng Regency at Current Market Prices by Industry (Percent), 2013-2017
75
Tabel 5.4Table 5.4
Laju Pertumbuhan Produk Domestik Regional Bruto Kabupaten Buleleng Atas Dasar Harga Konstan 2010 Menurut Lapangan Usaha (Persen), 2013-2017 / Growth Rate of Gross Regional Domestic Product of Buleleng Regency at 2010 Constant Market Prices by Industry (Percent), 2013-2017
76
Tabel 5.5Table 5.5
Indeks Perkembangan Produk Domestik Regional Bruto Kabupaten Buleleng Atas Dasar Harga Konstan 2010 Menurut Lapangan Usaha, 2013-2017 / Trend of Gross Regional Domestic Product of Buleleng Re-gency at 2010 Constant Market Prices by Industry, 2013-2017
77
Tabel 5.6Table 5.6
Indeks Harga Implisit Produk Domestik Regional Bruto Kabupaten Buleleng Menurut Lapangan Usaha, 2013-2017 / Implicit Price Index of Gross Regional Domestic Product of Buleleng Regency by industry, 2013-2017
78
Tabel 5.7Table 5.7
Laju Pertumbuhan Indeks Harga Implisit Produk Domestik Regional Bruto Kabupaten Buleleng Menurut Lapangan Usaha (Persen), 2013-2017 / Growth Rate of Implicit Price Index of Gross Regional Domestic Product of Buleleng Regency by industry (Percent) 2013-2017
79
https:
//bulel
engka
b.bps.g
o.id

https:
//bulel
engka
b.bps.g
o.id
xv
PENJELASAN TEKNIS
1. Penghitungan statistik neraca nasional yang digunakan di sini mengikuti buku petunjuk yang diterbitkan oleh Perserikatan Bangsa Bangsa yang dikenal sebagai “Sistem Neraca Nasional”. Namun, penerapan statistik neraca nasional tersebut telah disesuaikan dengan kondisi sosial-ekonomi Indonesia.
2. PDRB pada tingkat regional (provinsi) menggambarkan kemampuan suatu wilayah untuk menciptakan output (nilai tambah) pada suatu waktu tertentu. Untuk menyusun PDRB digunakan 2 pendekatan, yaitu produksi dan penggunaan. Keduanya menyajikan komposisi data nilai tambah yang dirinci menurut sumber kegiatan ekonomi (lapangan usaha) dan menurut komponen penggunaannya. PDRB dari sisi lapangan usaha merupakan penjumlahan seluruh komponen nilai tambah bruto yang mampu diciptakan oleh lapangan usaha atas berbagai aktivitas produksinya. Sedangkan dari sisi penggunaan menjelaskan tentang penggunaan dari nilai tambah tersebut.
3. PDRB menurut lapangan usaha dirinci menurut total nilai tambah dari seluruh lapangan usaha yang mencakup kategori Pertanian, Kehutanan, dan Perikanan; Pertambangan dan Penggalian; Industri Pengolahan; Pengadaan Listrik dan Gas; Pengadaan Air, Pengelolaan Sampah, Limbah dan Daur Ulang; Konstruksi; Perdagangan Besar dan Eceran, Reparasi Mobil dan Sepeda Motor; Transportasi dan Pergudangan; Penyediaan Akomodasi dan Makan Minum; Informasi dan Komunikasi; Jasa Keuangan dan Asuransi; Real Estat; Jasa Perusahaan; Administrasi Pemerintahan, Pertaha-
TECHNICAL NOTES
1. The measurement of Statistics National Accounts used here follows the manual published by the United Nations, known as the “National Accounts System”. However, the implementation of the statistics national accounts have been adapted to the socio-economic conditions of Indonesia.
2. Gross Regional Domestic Product (GRDP) at the regional (provincial) describes the ability of a region to develop output (value added) at a certain time. To measuring GRDP can be done by applying in two approaches, namely the production approach and expenditure approach. Both of them present composition of the value added by economic activity (by industry) and the components of expenditure. GRDP by industry is the sum of all components of gross value added that to be develop by the various activities. In terms, in the expenditure approach describes how to use the value added.
3. GRDP by industry is detailed according to the total value added of the whole economics activity covering Agriculture, Forestry, and Fisheries; Mining and Quarrying; manufacturing Industry; Electricity and Gas; Water Supply, garbage Management, Waste and Recycling; construction; Wholesale and Retail Trade, Cars and Motorcycles repair; Transportation and Warehousing; Accommodation and food and beverage; Information and Communication; Financial Services and Insurance; Real Estate; Business Services; Government Administration, Defence and Social assurance; Education
https:
//bulel
engka
b.bps.g
o.id

xvi
nan dan Jaminan Sosial Wajib; Jasa Pendidikan; Jasa Kesehatan dan Kegiatan Sosial; dan Jasa lainnya.
4. Produk Domestik Regional Bruto maupun agregat turunannya disajikan dalam 2 (dua) versi penilaian, yaitu atas dasar “harga berlaku” dan atas dasar “harga konstan”. Disebut sebagai harga berlaku karena seluruh agregat dinilai dengan menggunakan harga pada tahun berjalan, sedangkan harga konstan penilaiannya didasarkan kepada harga satu tahun dasar tertentu. Dalam publikasi di sini digunakan harga tahun 2010 sebagai dasar penilaian.
5. Laju pertumbuhan Produk Domestik Regional Bruto diperoleh dari perhitungan PDRB atas dasar harga konstan. Laju pertumbuhan tersebut dihitung dengan cara mengurangi nilai PDRB pada tahun ke-n terhadap nilai pada tahun ke n-1 (tahun sebelumnya), dibagi dengan nilai pada tahun ke n-1, kemudian dikalikan dengan 100 persen. Laju pertumbuhan menunjukkan perkembangan agregat pendapatan dari satu waktu tertentu terhadap waktu sebelumnya.
6. Harga Berlaku merupakan penilaian yang dilakukan terhadap produk barang dan jasa Yang dihasilkan ataupun yang dikonsumsi pada harga tahun sedang berjalan.
7. Harga Konstan merupakan penilaian yang dilakukan terhadap produk barang dan jasa yang dihasilkan ataupun yang dikonsumsi pada harga tetap di tahun dasar .
Services; Health Services and Social activity; and other services.
4. Gross Regional Domestic Product and the aggregate derivatives can be presented in two (2) concept i,e., the current prices and constant prices. The current prices be expressed whole aggregate assessed using the price in the current year, while the constant prices valuation is based on the price of a certain base year. In this publication used prices in 2010 as a basis for valuation
5. The rate of Economic growth is calculated using the constant prices of GRDP. The growth rate is calculated by subtracting value of GRDP in ’n’ year to the value in n-1year (previous year), divided by the value in year n-1, and then multiplied by 100 percent. The growth rate shows the grown of the aggregate production of a specified time to an earlier time.
6. Current Price is the valuation made on goods and services produced or consumed at the current years’ price.
7. Constant Price is assessment of the goods and services produced or consumed at a fixed price on the base year.
https:
//bulel
engka
b.bps.g
o.id
xvii
8. Tahun Dasar adalah tahun terpilih sebagai referensi statistik, yang digunakan sebagai dasar penghitungan tahun-tahun yang lain. Dengan tahun dasar tersebut dapat digambarkan seri data dengan indikator rinci mengenai perubahan/pergerakan yang terjadi.
8. Base Year is the year chosen as the reference statistics, which are used as the basis for calculating the years other. With the base year can be described series of detailed indicators about the change / movement occurs.
https:
//bulel
engka
b.bps.g
o.id

https:
//bulel
engka
b.bps.g
o.id

https:
//bulel
engka
b.bps.g
o.id

https:
//bulel
engka
b.bps.g
o.id
PENJELASAN UMUM
Produk Domestik Regional Bruto Kabupaten Buleleng Menurut Lapangan Usaha 2013-2017 3
BAB IPENJELASAN UMUM
1.1 Pengertian Produk Domestik Regional Bruto Perencanaan pembangunan ekonomi, memerlukan bermacam data statistik sebagai dasar dalam menentukan strategi kebijakan, agar sasaran pembangunan dapat dicapai dengan tepat. Strategi dan kebijakan yang telah diambil pada masa lalu perlu dimonitor dan dievaluasi hasil hasilnya. Berbagai data statistik yang bersifat kuantitatif diperlukan untuk memberikan gambaran tentang keadaan pada masa yang lalu dan masa kini, serta sasaran sasaran yang akan dicapai pada masa yang akan datang. Pada hakekatnya, pembangunan ekonomi adalah serangkaian usaha dan kebijakan yang bertujuan untuk meningkatkan taraf hidup masyarakat, memperluas lapangan kerja, memeratakan distribusi pendapatan masyarakat, meningkatkan hubungan ekonomi regional dan melalui pergeseran kegiatan ekonomi dari sektor primer ke sektor sekunder dan tersier. Dengan perkataan lain arah dari pembangunan ekonomi adalah mengusahakan agar pendapatan masyarakat naik, disertai dengan tingkat pemerataan yang sebaik mungkin. Untuk mengetahui tingkat dan pertumbuhan pendapatan masyarakat, perlu disajikan statistik pendapatan nasional/regional secara berkala, untuk digunakan sebagai bahan perencanaan pembangunan nasional atau regional
CHAPTER IOVERVIEW
1.1 Meaning of Domestic Products Regional Gross Economic development planning, requiring a variety of data in determining the policy strategy, so the goals of development can be achieved with the right. Evaluated and monitored should be done to the Strategies and policies that have been taken during the past need. Various quantitative statistical data needed to provide an overview of the situation in the past and present, as well as targeted objectives to be achieved in the future.
Basically, economic development is a series of efforts and policies which intends to improve people’s lives, expanding employment, equalize income distribution, increase the regional economic through the shift of economic activity from the primary sector to the secondary and tertiary sectors. In other words the direction of economic development is to keep people’s incomes rise, accompanied by a level of equalization as possible.
To know the level and growth of people’s income, to be served national/ regional regularly to be used as the material of national or regional development planning especially in the economic activity. Figures on national/regional income can be
https:
//bulel
engka
b.bps.g
o.id

OVERVIEW
Gross Regional Domestic Product Of Buleleng Regency By Industry 2013-20174
khususnya di bidang ekonomi. Angka pendapatan nasional/ regional dapat dipakai juga sebagai bahan evaluasi dari hasil pembangunan ekonomi yang telah dilaksanakan oleh berbagai pihak, baik pemerintah pusat/daerah, maupun swasta.
Apa yang Dimaksud dengan PDRB? Produk Domestik Regional Bruto (PDRB) merupakan nilai tambah bruto seluruh barang dan jasa yang tercipta atau dihasilkan di wilayah domestik suatu negara yang timbul akibat berbagai aktivitas ekonomi dalam suatu periode tertentu tanpa memperhatikan apakah faktor produksi yang dimiliki residen atau non-residen. Penyusunan PDRB dapat dilakukan melalui 3 (tiga) pendekatan yaitu pendekatan produksi, pengeluaran, dan pendapatan yang disajikan atas dasar harga berlaku dan harga konstan. PDRB atas dasar harga berlaku atau dikenal dengan PDRB nominal disusun berdasarkan harga yang berlaku pada periode penghitungan, dan bertujuan untuk melihat struktur perekonomian. Sedangkan PDRB atas dasar harga konstan disusun berdasarkan harga pada tahun dasar dan bertujuan untuk mengukur pertumbuhan ekonomi.
1.2 Kegunaan PDRB Data pendapatan nasional adalah salah satu indikator makro yang dapat menunjukkan kondisi perekonomian nasional setiap tahun. Manfaat yang dapat diperoleh dari data ini antara lain adalah:
used as well as an evaluation of the results of economic development that have been implemented by the various parties, both the central government / local, and private.
What is GRDP ? Gross Regional Domestic Product (GRDP) is the gross value added of all goods and services that are created or produced in the domestic territory of a country that arise from a variety of economic activities in a given period regardless of whether the factors of production are owned by resident or non-resident. The measurement of GRDP can be done by applying 3 (three) approaches: production approach, expenditure approach, and income approach are presented based on current prices and constant prices. GRDP at current prices, known as nominal GRDP is based on the prices at current year period of calculation, and aims to look at the structure of the economy. While the GRDP at constant prices is based on the price in the base year and aims to look at economic growth. 1.2 The Usefulness of GRDP National income data is one of the macro indicators that can indicate the condition of the national economy every year. Benefits to be derived from this data
https:
//bulel
engka
b.bps.g
o.id

PENJELASAN UMUM
Produk Domestik Regional Bruto Kabupaten Buleleng Menurut Lapangan Usaha 2013-2017 5
1. PDRB harga berlaku (nominal) menunjukkan kemampuan sumber daya ekonomi yang dihasilkan oleh suatu wilayah. Nilai PDRB yang besar menunjukkan kemampuan sumber daya ekonomi yang besar, begitu juga sebaliknya.
2. PDRB harga konstan (riil) dapat digunakan untuk menunjukkan laju pertumbuhan ekonomi secara keseluruhan atau setiap kategori dari tahun ke tahun.
3. Distribusi PDRB harga berlaku menurut lapangan usaha menunjukkan struktur perekonomian atau peranan setiap kategori ekonomi dalam suatu wilayah. Kategori-kategori ekonomi yang mempunyai peran besar menunjukkan basis perekonomian suatu wilayah.
4. PDRB per kapita atas dasar harga berlaku menunjukkan nilai PDB dan PNB per satu orang penduduk.
5. PDRB per kapita atas dasar harga konstan berguna untuk mengetahui pertumbuhan nyata ekonomi per kapita penduduk suatu negara.
1.3 Perubahan Tahun Dasar PDRB Selama sepuluh tahun terakhir, banyak perubahan yang terjadi pada tatanan global dan lokal yang sangat berpengaruh terhadap perekonomian nasional. Krisis finansial global yang terjadi pada tahun 2008, penerapan perdagangan bebas antara China-
1. GRDP at current prices (nominal) indicates the ability of economic resources generated in a region. Great value of GRDP shows the ability of Large economic resources, and vice versa.
2. GRDP constant prices (real) can be used to indicate the rate of overall economic growth or each category from year to year.
3. Distribution of GRDP at current prices by industrial origin shows the economic structure or the Source of each economic category in a region. Economic categories that have great source shows the economic base of a region.
4. GRDP per capita at current prices shows the value of GRDP and GNI per one resident.
5. GRDP per capita at constant prices is useful to know the real economic growth per capita of the population in a country.
1.3 Base Year Change of GDRP Over the last ten years, many changes in the global and local level have great influence on the national economy. The global financial crisis that occurred in 2008, the implementation of free trade between China-ASEAN (CAFTA), changes in the recording system of international trade
https:
//bulel
engka
b.bps.g
o.id
OVERVIEW
Gross Regional Domestic Product Of Buleleng Regency By Industry 2013-20176
ASEAN (CAFTA), perubahan sistem pencatatan perdagangan internasional dan meluasnya jasa layanan pasar modal merupakan contoh perubahan yang perlu diadaptasi dalam mekanisme pencatatan statistik nasional. Salah satu bentuk adaptasi pencatatan statistik nasional adalah melakukan perubahan tahun dasar PDB Indonesia dari tahun 2000 ke 2010. Perubahan tahun dasar PDB dilakukan seiring dengan mengadopsi rekomendasi Perserikatan Bangsa-Bangsa (PBB) yang tertuang dalam 2008 System of National Accounts (SNA 2008) melalui penyusunan kerangka Supply and Use Tables (SUT). Perubahan tahun dasar PDB dilakukan secara bersamaan dengan penghitungan Produk Domestik Regional Bruto (PDRB) Provinsi untuk menjaga konsistensi hasil penghitungan.
Apa yang Dimaksud SNA 2008? SNA 2008 merupakan standar rekomendasi internasional tentang cara mengukur aktivitas ekonomi yang sesuai dengan penghitungan konvensional berdasarkan prinsip-prinsip ekonomi. Rekomendasi yang dimaksud dinyatakan dalam sekumpulan konsep, definisi, klasifikasi, dan aturan neraca yang disepakati secara internasional dalam mengukur item tertentu seperti PDRB. SNA dirancang untuk menyediakan informasi tentang aktivitas pelaku ekonomi dalam hal produksi, konsumsi dan akumulasi harta dan dapat dimanfaatkan untuk kepentingan analisis, pengambilan
and the expansion of capital market services is an example of the changes that need to be adapted in the national statistical recording mechanism. One adaptation of the national statistical recording is to change the base year of 2000 Indonesia’s GRDP to 2010. Changes in the base year’s GRDP in line with the implementation of the recommendation of the United Nations (UN) in the 2008 System of National Accounts (SNA 2008) through the preparation of a framework supply and Use Tables (SUT).
Change of GRDP base year is done simultaneously with the calculation of GRDP of the province to maintain the consistency of calculation results
What is 2008 SNA? 2008 SNA is an international standard recommendations in measuring economic activity in accordance with conventional measurements based on economic principles. Recommendations in question is expressed in a set of concepts, definitions, classifications and rules balance in the internationally agreed measure certain items such as GRDP.
SNA is designed to provide information about the activities of economic agents in terms of production, consumption and accumulation of wealth, and can be used for analysis, decision-
https:
//bulel
engka
b.bps.g
o.id
PENJELASAN UMUM
Produk Domestik Regional Bruto Kabupaten Buleleng Menurut Lapangan Usaha 2013-2017 7
keputusan, dan pembuatan kebijakan. Dengan menggunakan Kerangka SNA fenomena ekonomi dapat dengan lebih baik dijelaskan dan dipahami.
Apa Manfaat Perubahan Tahun Dasar? Manfaat perubahan tahun dasar PDRB antara lain :
• Menginformasikan perekonomian regional yang terkini seperti pergeseran struktur dan pertumbuhan ekonomi;
• Meningkatkan kualitas data PDRB;• Menjadikan data PDRB dapat
diperbandingkan secara internasional.
Apa Implikasi Perubahan Tahun Dasar? Pergeseran harga tahun dasar akan memberikan beberapa dampak antara lain:
• Meningkatkan nominal PDRB, yang pada gilirannya akan berdampak pada pergeseran kelompok pendapatan suatu daerah dari pendapatan rendah, menjadi menengah, atau tinggi dan pergeseran struktur perekonomian;
• Akan merubah besaran indikator makro seperti rasio pajak, rasio hutang, rasio investasi dan saving, nilai neraca berjalan, struktur dan pertumbuhan ekonomi;
• Akan menyebabkan perubahan pada input data untuk modeling dan forecasting.
making and policy-making. By using the SNA framework, economic phenomena can be better explained and understood. What the Benefits from the Change ? Benefits from the change of base year :
• Can provide the latest information regional economies such as the shift structure and economic growth;
• Improve the GRDP quality;• Making the GRDP data comparable
in internationally. What the implications from the Change?Changes in the base year will give some impact, namely:
• Increase nominal GDP, and this will have an impact on shifting income from lower income groups, into the medium, or high and shifting economic structure;
• Will change the macro indicators such as the ratio of the amount of tax, debt ratio, the ratio of investment and saving, the current account value, structure and economic growth;
• Will change in the input data for modeling and forecasting.
https:
//bulel
engka
b.bps.g
o.id
OVERVIEW
Gross Regional Domestic Product Of Buleleng Regency By Industry 2013-20178
Mengapa Tahun 2010 sebagai tahun dasar? Badan Pusat Statistik (BPS) telah melakukan perubahan tahun dasar secara berkala sebanyak 5 (lima) kali yaitu pada tahun 1960, 1973, 1983, 1993, dan 2000. Tahun 2010 dipilih sebagai tahun dasar baru menggantikan tahun dasar 2000 karena beberapa alasan berikut:
• Perekonomian Indonesia tahun 2010 relatif stabil;
• Telah terjadi perubahan struktur ekonomi selama 10 (sepuluh) tahun terakhir terutama dibidang informasi dan teknologi serta transportasi yang berpengaruh terhadap pola distribusi dan munculnya produk-produk baru;
• Rekomendasi PBB tentang pergantian tahun dasar dilakukan setiap 5 (lima) atau 10 (sepuluh) tahun;
• Adanya pembaharuan konsep, definisi, klasifikasi, cakupan, sumber data dan metodologi sesuai rekomendasi dalam SNA 2008;
• Tersedianya sumber data baru untuk perbaikan PDRB seperti data Sensus Penduduk 2010 (SP 2010) dan Indeks harga produsen (Producers Price Index /PPI);
• Tersedianya kerangka kerja SUT yang menggambarkan keseimbangan aliran produksi dan konsumsi (barang dan jasa) dan penciptaan pendapatan dari aktivitas produksi tersebut.
Why the 2010 as the base year? Statistics Indonesia-BPS has made changes to the base year periodically as many as five (5) times, namely in 1960, 1973, 1983, 1993, and 2000.2010 was chosen as the new base year replacing 2000 for several reasons:
• The Indonesian economy in 2010 are relatively stable;
• There has been a structural change in the economy during the ten (10) years, especially in the information and technology industry and transportation that affect the distribution patterns and the presence of new products;
• United Nations Recommendations on the turn base year conducted every five (5) or ten (10) years;
• The renewal of concepts, definitions, classification, coverage, data sources and methodology as recommended in the SNA 2008;
• The availability of new data sources to GRDP improvement such as the Population Census of 2010 (SP 2010) and producer price index (PPI);
• Availability of SUT framework that describes the flow of production and consumption balance (goods and services) and the creation of income from the production activity.
https:
//bulel
engka
b.bps.g
o.id
PENJELASAN UMUM
Produk Domestik Regional Bruto Kabupaten Buleleng Menurut Lapangan Usaha 2013-2017 9
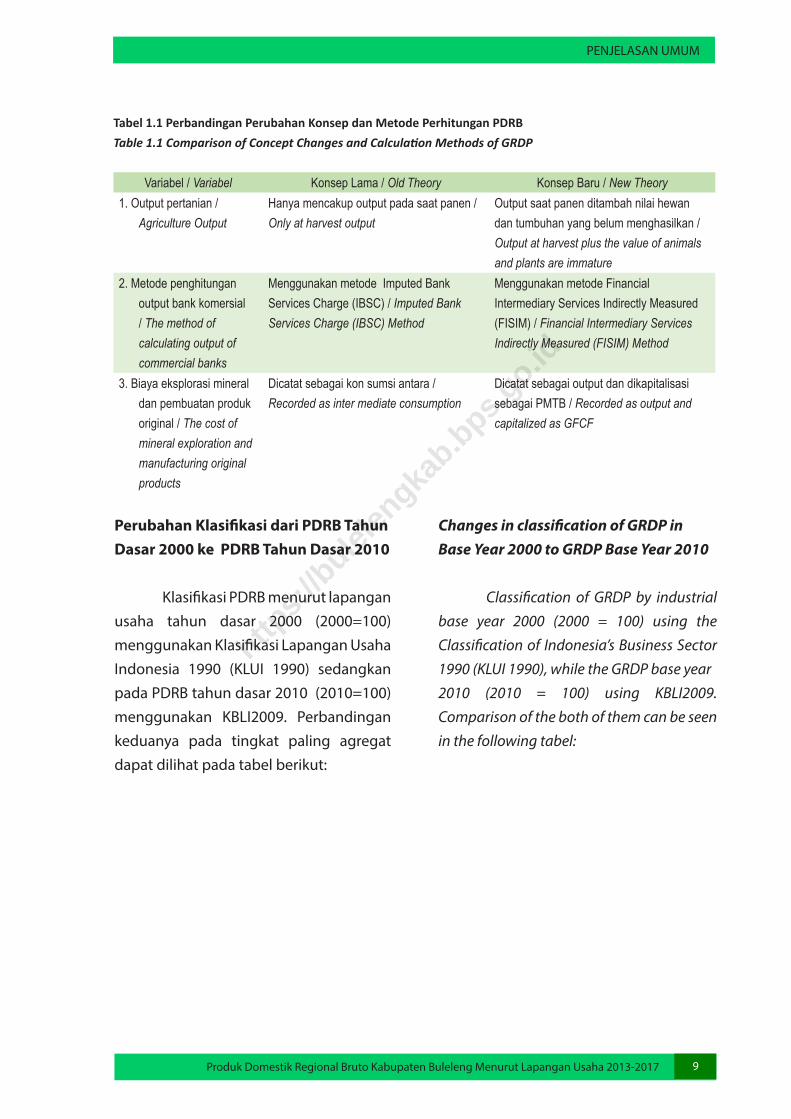
Tabel 1.1 Perbandingan Perubahan Konsep dan Metode Perhitungan PDRBTable 1.1 Comparison of Concept Changes and Calculation Methods of GRDP
Variabel / Variabel Konsep Lama / Old Theory Konsep Baru / New Theory1. Output pertanian /
Agriculture OutputHanya mencakup output pada saat panen / Only at harvest output
Output saat panen ditambah nilai hewan dan tumbuhan yang belum menghasilkan / Output at harvest plus the value of animals and plants are immature
2. Metode penghitungan output bank komersial / The method of calculating output of commercial banks
Menggunakan metode Imputed Bank Services Charge (IBSC) / Imputed Bank Services Charge (IBSC) Method
Menggunakan metode Financial Intermediary Services Indirectly Measured (FISIM) / Financial Intermediary Services Indirectly Measured (FISIM) Method
3. Biaya eksplorasi mineral dan pembuatan produk original / The cost of mineral exploration and manufacturing original products
Dicatat sebagai kon sumsi antara / Recorded as inter mediate consumption
Dicatat sebagai output dan dikapitalisasi sebagai PMTB / Recorded as output and capitalized as GFCF
Perubahan Klasifikasi dari PDRB Tahun Dasar 2000 ke PDRB Tahun Dasar 2010
Klasifikasi PDRB menurut lapangan usaha tahun dasar 2000 (2000=100) menggunakan Klasifikasi Lapangan Usaha Indonesia 1990 (KLUI 1990) sedangkan pada PDRB tahun dasar 2010 (2010=100) menggunakan KBLI2009. Perbandingan keduanya pada tingkat paling agregat dapat dilihat pada tabel berikut:
Changes in classification of GRDP in Base Year 2000 to GRDP Base Year 2010
Classification of GRDP by industrial base year 2000 (2000 = 100) using the Classification of Indonesia’s Business Sector 1990 (KLUI 1990), while the GRDP base year 2010 (2010 = 100) using KBLI2009. Comparison of the both of them can be seen in the following tabel:
https:
//bulel
engka
b.bps.g
o.id
OVERVIEW
Gross Regional Domestic Product Of Buleleng Regency By Industry 2013-201710
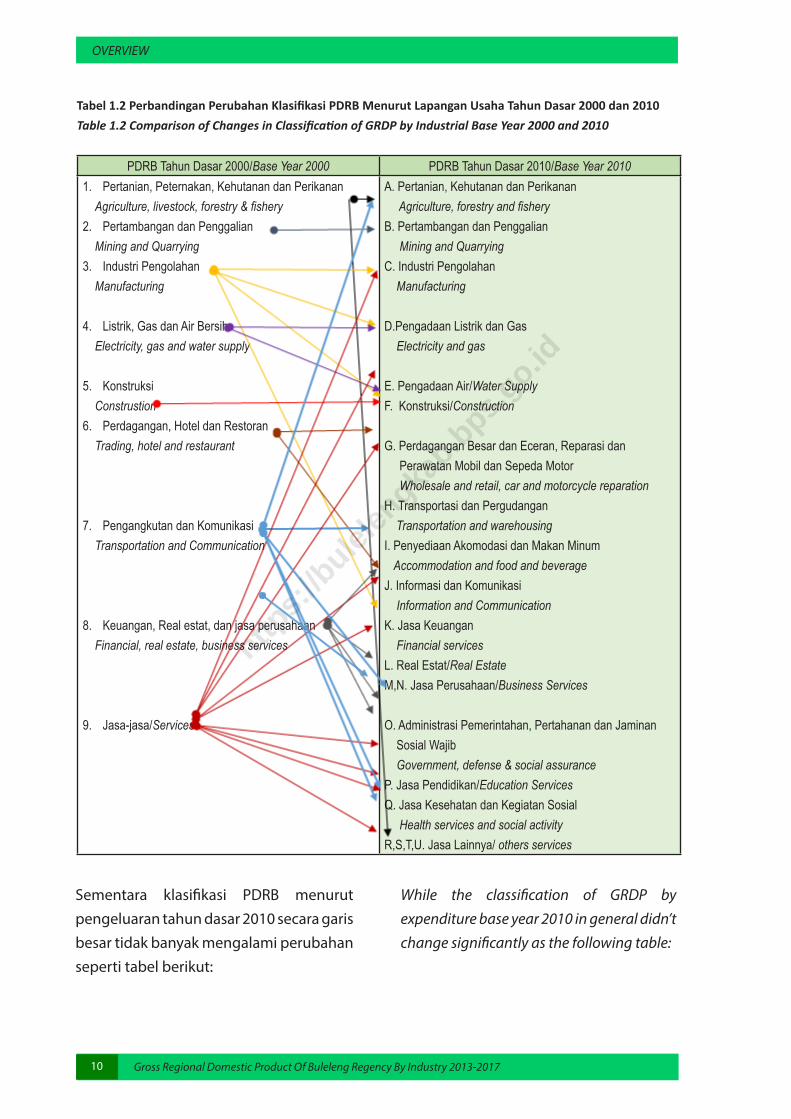
Tabel 1.2 Perbandingan Perubahan Klasifikasi PDRB Menurut Lapangan Usaha Tahun Dasar 2000 dan 2010Table 1.2 Comparison of Changes in Classification of GRDP by Industrial Base Year 2000 and 2010
PDRB Tahun Dasar 2000/Base Year 2000 PDRB Tahun Dasar 2010/Base Year 20101. Pertanian, Peternakan, Kehutanan dan Perikanan Agriculture, livestock, forestry & fishery2. Pertambangan dan Penggalian Mining and Quarrying3. Industri Pengolahan Manufacturing
4. Listrik, Gas dan Air Bersih Electricity, gas and water supply
5. Konstruksi Construstion6. Perdagangan, Hotel dan Restoran Trading, hotel and restaurant
7. Pengangkutan dan Komunikasi Transportation and Communication
8. Keuangan, Real estat, dan jasa perusahaan Financial, real estate, business services
9. Jasa-jasa/Services
A. Pertanian, Kehutanan dan Perikanan Agriculture, forestry and fisheryB. Pertambangan dan Penggalian Mining and QuarryingC. Industri Pengolahan Manufacturing
D.Pengadaan Listrik dan Gas Electricity and gas
E. Pengadaan Air/Water SupplyF. Konstruksi/Construction
G. Perdagangan Besar dan Eceran, Reparasi dan Perawatan Mobil dan Sepeda Motor Wholesale and retail, car and motorcycle reparationH. Transportasi dan Pergudangan Transportation and warehousingI. Penyediaan Akomodasi dan Makan Minum Accommodation and food and beverageJ. Informasi dan Komunikasi Information and CommunicationK. Jasa Keuangan Financial servicesL. Real Estat/Real EstateM,N. Jasa Perusahaan/Business Services
O. Administrasi Pemerintahan, Pertahanan dan Jaminan Sosial Wajib Government, defense & social assuranceP. Jasa Pendidikan/Education ServicesQ. Jasa Kesehatan dan Kegiatan Sosial Health services and social activityR,S,T,U. Jasa Lainnya/ others services
Sementara klasifikasi PDRB menurut pengeluaran tahun dasar 2010 secara garis besar tidak banyak mengalami perubahan seperti tabel berikut:
While the classification of GRDP by expenditure base year 2010 in general didn’t change significantly as the following table:
https:
//bulel
engka
b.bps.g
o.id
PENJELASAN UMUM
Produk Domestik Regional Bruto Kabupaten Buleleng Menurut Lapangan Usaha 2013-2017 11
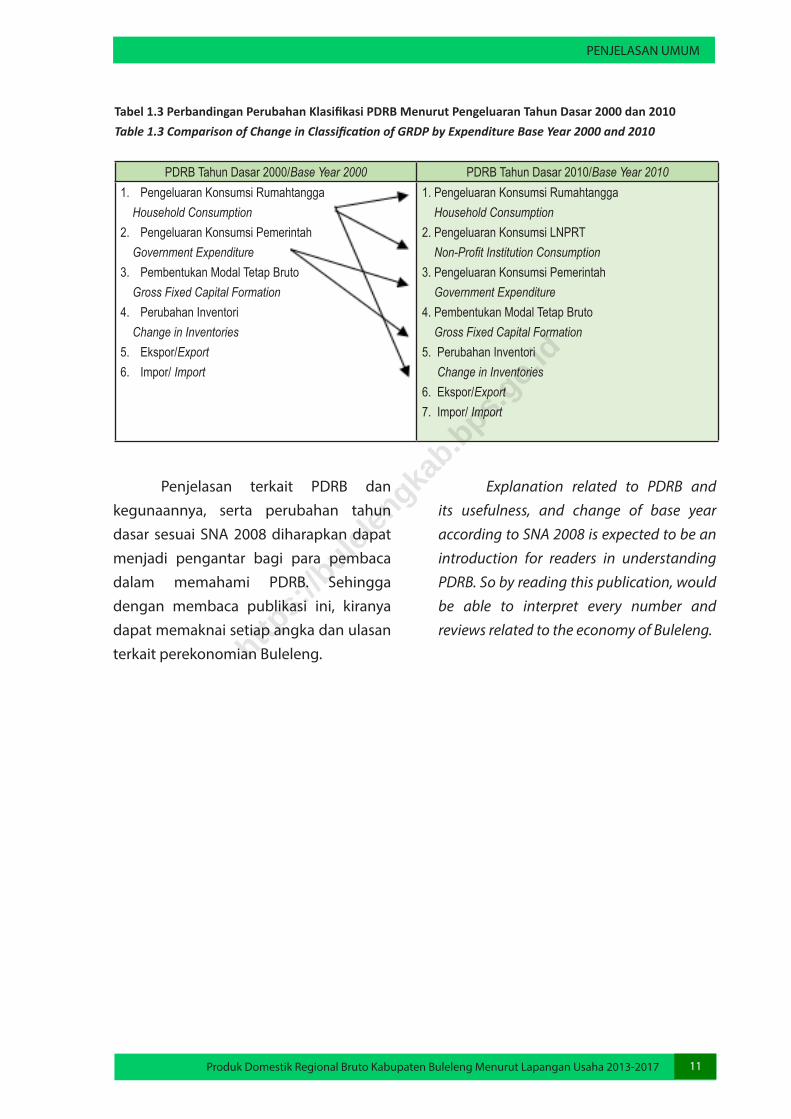
Tabel 1.3 Perbandingan Perubahan Klasifikasi PDRB Menurut Pengeluaran Tahun Dasar 2000 dan 2010Table 1.3 Comparison of Change in Classification of GRDP by Expenditure Base Year 2000 and 2010
PDRB Tahun Dasar 2000/Base Year 2000 PDRB Tahun Dasar 2010/Base Year 20101. Pengeluaran Konsumsi Rumahtangga Household Consumption2. Pengeluaran Konsumsi Pemerintah Government Expenditure3. Pembentukan Modal Tetap Bruto Gross Fixed Capital Formation 4. Perubahan Inventori Change in Inventories5. Ekspor/Export6. Impor/ Import
1. Pengeluaran Konsumsi Rumahtangga Household Consumption2. Pengeluaran Konsumsi LNPRT Non-Profit Institution Consumption3. Pengeluaran Konsumsi Pemerintah Government Expenditure4. Pembentukan Modal Tetap Bruto Gross Fixed Capital Formation5. Perubahan Inventori Change in Inventories6. Ekspor/Export7. Impor/ Import
Penjelasan terkait PDRB dan kegunaannya, serta perubahan tahun dasar sesuai SNA 2008 diharapkan dapat menjadi pengantar bagi para pembaca dalam memahami PDRB. Sehingga dengan membaca publikasi ini, kiranya dapat memaknai setiap angka dan ulasan terkait perekonomian Buleleng.
Explanation related to PDRB and its usefulness, and change of base year according to SNA 2008 is expected to be an introduction for readers in understanding PDRB. So by reading this publication, would be able to interpret every number and reviews related to the economy of Buleleng.
https:
//bulel
engka
b.bps.g
o.id

https:
//bulel
engka
b.bps.g
o.id
https:
//bulel
engka
b.bps.g
o.id

https:
//bulel
engka
b.bps.g
o.id

RUANG LINGKUP DAN METODE PENGHITUNGAN
Produk Domestik Regional Bruto Kabupaten Buleleng Menurut Lapangan Usaha 2013-2017 15
BAB IIRUANG LINGKUP DAN METODE
PENGHITUNGAN
Uraian lapangan usaha yang disajikan dalam bab ini mencakup ruang lingkup dan definisi dari masing-masing kategori dan sub kategori lapangan usaha, cara-cara perhitungan Nilai Tambah Bruto (NTB) baik atas dasar harga berlaku maupun atas dasar harga konstan 2010, serta sumber datanya.
2.1 Pertanian, Kehutanan Dan Perikanan Kategori ini mencakup segala pengusahaan yang didapatkan dari alam dan merupakan benda-benda atau barang-barang biologis (hidup) yang hasilnya dapat digunakan untuk memenuhi kebutuhan hidup sendiri atau untuk dijual kepada pihak lain. Pengusahaan ini termasuk kegiatan yang tujuan utamanya untuk memenuhi kebutuhan sendiri (subsisten) seperti pada kegiatan usaha tanaman pangan, hortikultura, perkebunan, peternakan, kehutanan, dan penangkapan ikan di laut. Pendekatan yang digunakan dalam memperkirakan nilai tambah Kategori Pertanian, Kehutanan dan Perikanan melalui pendekatan produksi. Pendekatan ini didasarkan pada pertimbangan ketersediaan data produksi dan harga untuk masing-masing komoditi pertanian. Data produksi kategori ini diperoleh dari Dinas Pertanian Kabupaten Buleleng, Dinas Perikanan Kabupaten Buleleng, dan Dinas Kehutanan Provinsi
CHAPTER IICOVERAGE AND ESTIMATION
METHOD
Description of Industrial Category presented in this chapter include the coverage and definition of each of the categories and subcategories of the industry, how to calculate the Gross Value Added at current prices and constant prices in 2010, and data source.
2.1 Agriculture, Forestry and Fishery
This section includes any cultivation obtaining the objects or items from nature which are the living things that can be used for own consumption or to be sold to others. The cultivation includes activities whose main purpose is to meet farmer’s own needs (subsistence) such as the cultivation of food crops, horticultural crops, plantations corps, livestock, forestry, and fishing. The approach used in estimating the value-added category of Agriculture, Forestry and Fisheries is through production approach. This approach is based on consideration of the availability of data on production and prices for each agricultural commodity. Production data of this category is obtained from the Department of Agriculture of Buleleng Regency, the Department of Fisheries of Buleleng Regency, and the
https:
//bulel
engka
b.bps.g
o.id
COVERAGE AND ESTIMATION METHOD
Gross Regional Domestic Product Of Buleleng Regency By Industry 2013-201716
Bali. Selain itu data produksi diperoleh dari hasil Survei-survei yang dilakukan BPS seperti Survei Pertanian, Survei PPI, Survei RPH, dll. Sedangkan data struktur biaya kegiatan tanaman pangan diperoleh dari hasil Sensus Pertanian dan Survei Struktur Ongkos Usaha Tani (SOUT) yang dilakukan oleh Subdit Statistik Tanaman Pangan BPS. Pendekatan yang digunakan dalam memperkirakan nilai tambah Lapangan Usaha Pertanian, Kehutanan dan Perikanan adalah melalui pendekatan produksi. Pendekatan ini didasarkan pada pertimbangan ketersediaan data produksi dan harga untuk masing-masing komoditi pertanian. Menurut sifatnya, output dibedakan atas dua jenis, yaitu output utama dan output ikutan. Disamping itu, komoditi lainnya yang belum dicakup diperkirakan melalui besaran persentase pelengkap yang diperoleh dari berbagai survei khusus. Penghitungan output pada kategori ini tidak hanya mencakup output utama dan ikutan pada saat penen tetapi juga ditambahkan output yang diadopsi dari implementasi SNA 2008. Untuk kegiatan yang menghasilkan komoditas yang dapat diambil hasilnya berulang kali, outputnya juga mencakup biaya perawatan yang dikeluarkan selama periode tertentu yang dinamakan dengan Cultivated Biological Resources (CBR). Sedangkan untuk kegiatan yang menghasilkan komoditas semusim atau yang diambil hasilnya hanya sekali, outputnya juga mencakup biaya yang dikeluarkan untuk tanaman yang belum dipanen (standing crops) di akhir periode
Forestry Service of Bali Province. In addition, production data were obtained from survey results conducted by BPS such as Agricultural Survey, PPI Survey, RPH Survey, etc. While the cost structure data of food crop activity is obtained from the results of Agricultural Census and Survey of Structure of Farming Cost (SOUT) conducted by BPS Food Statistics Subdit. The approach used in estimating the value-added Industry of Agriculture, Forestry and Fishing is through production approach. This approach is based on consideration of the availability of data on production and prices for each agricultural commodity. According to its nature, output is divided into two types, namely main output and secondary output. In addition, the other commodities that are not covered are estimated through complementary percentage obtained from various special surveys. Calculation of output in this category not only includes the main and secondary output at harvest time but also the added output adopted from the implementation of SNA 2008. For activities producing the commodities of which the results can be taken repeatedly, the output also includes the maintenance costs incurred during a specific period called Cultivated Biological Resurces (CBR). For the activities producing seasonal commodities or the commoditis harvested only once, the output also includes costs incurred for standing crops at the end of the period reduced by the costs incurred for standing crops in the early period referred as Work-in-Progress (WIP). So that the total output in this category
https:
//bulel
engka
b.bps.g
o.id
RUANG LINGKUP DAN METODE PENGHITUNGAN
Produk Domestik Regional Bruto Kabupaten Buleleng Menurut Lapangan Usaha 2013-2017 17
dikurangi dengan biaya yang dikeluarkan untuk tanaman yang belum dipanen (standing crops) di awal periode yang disebut sebagai Work-in-Progress (WIP). Sehingga total output pada kategori ini merupakan penjumlahan dari nilai output utama, output ikutan, dan CBR atau WIP ditambah dengan nilai pelengkapnya. Nilai Tambah Bruto (NTB) suatu subkategori diperoleh dari penjumlahan NTB tiap-tiap kegiatan usaha yang menghasilkan komoditas tertentu. NTB ini didapat dari pengurangan nilai output atas harga dasar dengan seluruh pengeluaran konsumsi antara. Estimasi NTB atas dasar harga konstan 2010 menggunakan metode revaluasi, yaitu mengalikan produksi di tahun berjalan dengan harga pada tahun dasar (tahun 2010) untuk mengestimasi output konstan tahun berjalan. 2.2. Pertambangan dan Penggalian Seluruh jenis komoditi yang dicakup dalam Lapangan Usaha Pertambangan dan Penggalian, dikelompokkan dalam empat subkategori, yaitu: pertambangan minyak dan gas bumi (migas), pertambangan batubara dan lignit, pertambangan bijih logam serta pertambangan dan penggalian lainnya. Di Kabupaten Buleleng, kategori ini hanya mencakup subkategori pertambangan dan penggalian lainnya. Subkategori ini mencakup penggalian dan pengambilan segala jenis barang galian seperti batu-batuan, pasir dan tanah yang pada umumnya berada pada permukaan bumi. Hasil dari kegiatan
is the sum of the main output, secondary output, and CBR or WIP of all commodities coupled with a complementary value. Gross Value Added (GVA) of a division is obtained from the sum of value added of each activity that produces certain commodities. GVA is obtained from the value of output at basic prices less intermediate consumption. Estimates of GVA at 2010 constant prices use the revaluation method, namely multiplying production value in the current year with the price in the base year (2010) to estimate the constant output of current year.
2.2 Mining and Quarrying All types of commodities of the Industry of Mining and Quarrying are divided into four divisions, namely: crude petroleum, natural gas and geothermal; coal and lignite mining, iron ore mining; and other mining and quarrying. In Buleleng regency, this category only covers mining and quarrying division.
This division covers quarrying and gathering of all kinds of stone, sand and soil which are generally located on the surface of the earth. The products of this division are mountain rock, stone, limestone,
https:
//bulel
engka
b.bps.g
o.id

COVERAGE AND ESTIMATION METHOD
Gross Regional Domestic Product Of Buleleng Regency By Industry 2013-201718
ini adalah batu gunung, batu kali, batu kapur, koral, kerikil, batu karang, batu marmer, pasir untuk bahan bangunan, pasir silika, pasir kwarsa, kaolin, tanah liat, dan komoditi penggalian selain tersebut di atas. Termasuk dalam subkategori ini adalah komoditi garam hasil penggalian. Output dan produksi barang-barang galian diperoleh dari Survei Penggalian Berbadan Hukum dan Survei Penggalian Usaha Rumah tangga yang dilakukan oleh BPS. 2.3 Industri Pengolahan Lapangan Usaha Industri Pengolahan meliputi kegiatan ekonomi di bidang perubahan secara kimia atau fisik dari bahan, unsur atau komponen menjadi produk baru. Bahan baku industri pengolahan berasal dari produk pertanian, kehutanan, perikanan, pertambangan atau penggalian seperti produk dari kegiatan industri pengolahan lainnya Perubahan, pembaharuan atau rekonstruksi yang pokok dari barang secara umum diperlakukan sebagai industri pengolahan. Unit industri pengolahan digambarkan sebagai pabrik, mesin atau peralatan yang khusus digerakkan dengan mesin dan tangan. Termasuk kategori industri pengolahan adalah perubahan bahan menjadi produk baru dengan menggunakan tangan, kegiatan maklon atau kegiatan penjualan produk yang dibuat di tempat yang sama dimana produk tersebut dijual dan unit yang melakukan pengolahan bahan-bahan dari pihak lain atas dasar kontrak. Output dan produksi industri
pebbles, rock, marble, sand (for construction materials), silica sand, quartz, kaolin, clay, salt (quarried), and so on. Outputs and production of excavated goods were obtained from the Legal Entity Excavation Survey and Household Business Excavation Survey conducted by BPS.
2.3 Manufacturing Industry of Manufacturing includes economic activity in the field of chemical or physical change of materials, elements or components into new products. The industrial raw materials are derived from the products of agriculture, forestry, fishing, mining or quarrying, and manufacturing itself. The activities of change, renewal or reconstruction of the products in general are treated as manufacturing. The manufacturing unit is described as factory, machinery or equipment that are specifically driven by machine and human. The industry also includes material change activities into new products by hand, or the activities of which product was made at the same place where the product is sold and the units processing the materials from other parties on a contract basis. The output and production of the manufacturing is obtained from the results of a survey of Large and Medium Industries and Micro Small Industries conducted by BPS.
https:
//bulel
engka
b.bps.g
o.id

RUANG LINGKUP DAN METODE PENGHITUNGAN
Produk Domestik Regional Bruto Kabupaten Buleleng Menurut Lapangan Usaha 2013-2017 19
pengolahan diperoleh dari hasil survei Industri Besar dan Sedang dan Industri Mikro Kecil yang dilakukan oleh BPS. 2.4 Pengadaan Listrik dan Gas Kategori ini mencakup kegiatan pengadaan tenaga listrik, gas alam dan buatan, uap panas, air panas, udara dingin dan produksi es dan sejenisnya melalui jaringan, saluran, atau pipa infrastruktur permanen. Dimensi jaringan/infrastruktur tidak dapat ditentukan dengan pasti, termasuk kegiatan pendistribusian listrik, gas, uap panas dan air panas serta pendinginan udara dan air untuk tujuan produksi es. Produksi es untuk kebutuhan makanan/minuman dan tujuan non makanan. Kategori ini juga mencakup pengoperasian mesin dan gas yang menghasilkan, mengontrol dan menyalurkan tenaga listrik atau gas. Juga mencakup pengadaan uap panas dan AC. Metode penghitungan seri 2010 dengan menggunakan pendekatan produksi. Output atas dasar harga berlaku diperoleh melalui perkalian antara kuantum barang yang dihasilkan dengan harga per unit produksi pada masing-masing tahun. Sedangkan output atas dasar harga konstan 2010 diperoleh dengan cara revaluasi, yaitu mengalikan kuantum barang yang dihasilkan pada masing- masing tahun dengan harga per unit produksi pada tahun 2010. Selanjutnya untuk memperoleh NTB baik atas dasar harga berlaku maupun konstan 2010 adalah dengan mengalikan output pada masing-masing tahun dengan rasio NTB.
2.4 Electricity and Gas This section includes the production of electricity, natural and artificial gas, steam, hot water, cold air and ice and the likes through the network, channel, or permanent infrastructure pipe. Dimensional network/infrastructure can not be determined with certainty, including the activities of the distribution of electricity, gas, steam and hot water and cooling air and water for the purpose of producing ice. Production of ice for food/beverage and non-food purposes. This category also includes the operation of the gas and engine generating, controllling and distributing the electricity or gas. This also includes the production of hot steam and air conditioner. The calculation method used for 2010 series is the production approach. Output at current prices is obtained by multiplying the quantum of goods produced with the price per unit of production in each year. Meanwhile, output at constant prices in 2010 is obtained by revaluation, ie multiplying the quantum of goods produced in each year at a price per unit of production in 2010. Furthermore, to obtain the GVA both at current and constant prices of 2010 was by multiplying the respective the output of each year with the GVA ratio.
https:
//bulel
engka
b.bps.g
o.id

COVERAGE AND ESTIMATION METHOD
Gross Regional Domestic Product Of Buleleng Regency By Industry 2013-201720
2.5 Pengadaan Air, Pengelolaan Sampah, dan Daur Ulang Kategori ini mencakup kegiatan ekonomi/lapangan usaha yang berhubungan dengan pengelolaan berbagai bentuk limbah/sampah, seperti limbah/sampah padat atau bukan baik rumah tangga ataupun industri, yang dapat mencemari lingkungan. Hasil dari proses pengelolaan limbah sampah atau kotoran ini dibuang atau menjadi input dalam proses produksi lainnya. Kegiatan pengadaan air termasuk kategori ini, karena kegiatan ini sering kali dilakukan dalam hubungannya dengan atau oleh unit yang terlibat dalam pengelolaan limbah/kotoran. Metode penghitungan Nilai Tambah Bruto untuk pengadaan air tahun dasar 2010 menggunakan pendekatan produksi. Output atas dasar harga berlaku diperoleh melalui perkalian antara kuantum barang yang dihasilkan dengan harga per unit produksi pada masing-masing tahun. Dan untuk data harga yang tidak tersedia pada tahun terakhir diperkirakan dengan kenaikan laju IHK komponen bahan bakar, penerangan dan air bersih. Sedangkan output atas dasar harga konstan 2010 diperoleh dengan cara revaluasi, yaitu mengalikan kuantum barang yang dihasilkan pada masing-masing tahun dengan harga per unit produksi pada tahun 2010. Selanjutnya untuk memperoleh NTB baik atas dasar harga berlaku maupun konstan 2010 adalah dengan mengalikan output pada masing-masing tahun dengan rasio NTB.
2.5 Water Supply, Sewerage, Waste Management and Remediation Activities This section includes economic/ industry activity with the management of various forms of waste/garbage, such as solid or liquid waste, either domestic or industrial, which can pollute the environment. The results of the sewage treatment process are discarded or being an input for other production processes. The water supply activities is included in this industry, since these activities are often carried out in conjunction with or by the units involved in the management of the waste/garbage. Method of calculating the Gross Value Added for water supply on base year 2010 used production approach. Output at current prices is obtained by multiplying the quantum of goods produced at a price per unit of production in each year. For the price data that are not available in recent years are estimated by the growth of CPI components of fuel, electricity and water supply. Outputs at constant 2010 prices are obtained by revaluation, i.e. multiplying the quantum of goods produced in each year at a price per unit of production in 2010. Furthermore, to obtain value added both at current and constant prices of 2010 are by multiplying the respective output at each year with the GVA ratio.
https:
//bulel
engka
b.bps.g
o.id

RUANG LINGKUP DAN METODE PENGHITUNGAN
Produk Domestik Regional Bruto Kabupaten Buleleng Menurut Lapangan Usaha 2013-2017 21
Penghitungan pengelolaan Sampah/Limbah dengan pendekatan pendapatan. Dalam lembar kerja pengelolaan, pembuangan dan pembersihan sampah dilakukan oleh Pemerintah dan swasta. Kegiatan yang dilakukan pemerintah menggunakan APBN/APBD. Sumber Data Produksi adalah BPS - Subdit. Statistik Pertambangan dan Energi, APBD (Kemenkeu); data Output Sampah diperoleh dari Subdit. Statistik IBS- BPS; Data Harga diperoleh dari Subdit Statistik Harga Produsen - BPS; Data Struktur Biaya diperoleh dari Hasil Survei Tahunan Air Bersih – BPS. 2.6 Konstruksi Lapangan Usaha Konstruksi adalah kegiatan usaha di bidang konstruksi umum dan konstruksi khusus pekerjaan gedung dan bangunan sipil, baik digunakan sebagai tempat tinggal atau sarana kegiatan lainnya. Kegiatan konstruksi mencakup pekerjaan baru, perbaikan, penambahan dan perubahan, pendirian prafabrikasi bangunan atau struktur di lokasi proyek dan juga konstruksi yang bersifat sementara. Kegiatan konstruksi dilakukan baik oleh kontraktor umum, yaitu perusahaan yang melakukan pekerjaan konstruksi untuk pihak lain, maupun oleh kontraktor khusus, yaitu unit usaha atau individu yang melakukan kegiatan konstruksi untuk dipakai sendiri. Hasil kegiatan konstruksi antara lain: Konstruksi gedung tempat tinggal;
Calculation of waste/sewerage management is using the income approach. In the worksheet management, garbage disposal and cleaning activities are done by the Government and the private sector. The government activities in this service are funded by the state budget (APBN) or local government budget (APBD). Source of production data are Sub Directorate of of Mining and Energy Statistics of BPS, APBD (Ministry of Finance); Waste Output data are obtained from Sub Directorate of LMI Statistics of BPS. The prices data are obtained from Subditrectorate of Producer Price Statistics of BPS while the Cost Structure Data are obtained from the Annual Water Survey of BPS. 2.6. Constructions Industry of Construction is the business activities that cover general and special construction of buildings and civil construction works, either for residence or other purposes. The construction activities are new construction work, repair, extension and alteration works, establishment of prefabricated buildings or structures on the site, and temporary construction projects. Construction activities can be carried out by the general contractor (the construction company working for the other party) and the special contractor (the business units or individuals who perform construction activities for their own use).
Results of construction activities include: Construction of housing; non-
https:
//bulel
engka
b.bps.g
o.id
COVERAGE AND ESTIMATION METHOD
Gross Regional Domestic Product Of Buleleng Regency By Industry 2013-201722
Konstruksi gedung bukan tempat tinggal; Konstruksi bangunan sipil, misal: jalan, tol, jembatan, landasan pesawat terbang, jalan rel dan jembatan kereta api, terowongan, bendungan, waduk, menara air, jaringan irigasi, drainase, sanitasi, tanggul pengendali banjir, terminal, stasiun, parkir, dermaga, pergudangan, pelabuhan, bandara, dan sejenisnya; Konstruksi bangunan elektrik dan telekomunikasi: pembangkit tenaga listrik; transmisi, distribusi dan bangunan jaringan komunikasi, dan sebagainya; Instalasi gedung dan bangunan sipil: instalasi listrik termasuk alat pendingin dan pemanas ruangan, instalasi gas, instalasi air bersih dan air limbah serta saluran drainase, dan sejenisnya; Pengerukan: meliputi pengerukan sungai, rawa, danau dan alur pelayaran, kolam dan kanal pelabuhan baik bersifat pekerjaan ringan, sedang maupun berat; Penyiapan lahan untuk pekerjaan konstruksi, termasuk pembongkaran dan penghancuran gedung atau bangunan lainnya serta pembersihannya; Penyelesaian konstruksi sipil seperti pemasangan kaca dan aluminium; pengerjaan lantai, dinding dan plafon gedung; pengecatan; pengerjaan interior dan dekorasi dalam penyelesaian akhir; pengerjaan eksterior dan pertamanan pada gedung dan bangunan sipil lainnya; Penyewaan alat konstruksi dengan operatornya seperti derek lori, molen, buldoser, alat pencampur beton, mesin pancang, dan sejenisnya. Metode yang digunakan untuk memperkirakan output harga
housing building; civil building such as road, highway, bridge, runway, railway and railway bridges, tunnel, dam, reservoir, water tower, irrigation, drainage, sanitation, flood control levees, terminal, station, parking area, docks , warehousing, ports, airports; construction of the electricity and telecommunications building: power generation; transmission, distribution and communication networks building, and so on; Installation of buildings and civil buildings: electricity installations including heating and cooling equipments, gas installation, installation of water and wastewater and drainage channels, and so on; dredging: including dredging rivers, swamps, lakes and shipping lanes, ponds and port canals; land preparing activities for construction works including dismantling and demolition of buildings or other buildings as well as the cleaning of building ruin; completion of civil construction such as glazing and aluminum; processing the floor, walls and ceiling of the building; painting; interior craftsmanship and decoration in a final settlement; workmanship exterior and landscaping on the building and other civil buildings; Construction equipment rental with operators such as lorry crane, molen, bulldozers, concrete mixer, drilling machine, and so on. Calculation method for obtaining output at current prices is extrapolation
https:
//bulel
engka
b.bps.g
o.id
RUANG LINGKUP DAN METODE PENGHITUNGAN
Produk Domestik Regional Bruto Kabupaten Buleleng Menurut Lapangan Usaha 2013-2017 23
berlaku adalah metode ekstrapolasi dengan indeks konstruksi harga berlaku sebagai ekstrapolatornya. Untuk mendapatkan Output harga konstan, Output harga berlaku dideflasi dengan menggunakan IHPB konstruksi sebagai deflator. Sementara konsumsi antara didapat dengan menggunakan metode commodity flow beberapa komoditas utama dari konsumsi antara, misalnya produksi semen, kayu, juga bahan galian. NTB berlaku didapat dari nilai output berlaku dikurangi dengan biaya antara berlaku. Sementara NTB konstan didapat dari mengalikan output konstan dengan rasio NTB tahun dasar 2010. Sumber data indikator produksi kayu log, bambu dan produk industri bukan migas dari Subdirektorat Neraca Barang-BPS; produksi aspal dari Statistik Perminyakan Indonesia (SPI) Ditjen Migas-Kementrian Energi dan Sumber Daya Mineral (ESDM); ekspor semen dari Subdirektorat Statistik Ekspor-BPS dan Asosiasi Semen Indonesia (ASI); impor semen dan bahan bangunan SITC 3 digit dari Subdirektorat Statistik Impor-BPS. Indikator harga berupa IHPB bahan bangunan dari Subdirektorat Statistik Harga Perdagangan Besar-BPS. Indeks konstruksi dari publikasi Statistik Konstruksi, Subdirektorat Statistik Konstruksi-BPS. 2.7. Perdagangan Besar dan Eceran, Reparasi Mobil dan Sepeda Motor Kategori ini meliputi kegiatan ekonomi/lapangan usaha di bidang perdagangan besar dan eceran (yaitu
where the construction index at current prices serves as extrapolator. To get the output at constant prices, the output at current prices is deflated by using construction wholesale price index as the deflator. In the meantime, intermediate consumption is obtained by using commodity flow several major commodities of intermediate consumption, such as the production of cement, wood, as well as minerals. GVA at current is obtained from the output at current reduced by cost of intermediate consumption. The GVA at constant is derived by multiplying the ratio of output at constant with base year 2010. The production indicator data for log, bamboo and industrial products instead of oil and gas are provided by Subdirecorate of Goods Account of BPS, Petroleum bitumen production data from the Indonesian Petroleum Statistics by the Directorate General of Oil and Gas of the Ministry of Energy and Mineral Resources; the data on export of cement from Sub Directorate of Export Statistics of BPS and the Indonesian Cement Company Association; import of cement and building materials of the SITC 3 digits from Sub Directorate of Import Statistics of BPS. WPI price indicator in the form of building materials are taken from Sub Directorate of Wholesale Price Statistics of BPS. 2.7 Wholesale Trade and Retail Trade Except of Motor Vehicles and Motorcycles This section includes economic activities in the field of wholesale and retail trade (i.e. sale without any technical changes)
https:
//bulel
engka
b.bps.g
o.id
COVERAGE AND ESTIMATION METHOD
Gross Regional Domestic Product Of Buleleng Regency By Industry 2013-201724
penjualan tanpa perubahan teknis) dari berbagai jenis barang, dan memberikan imbalan jasa yang mengiringi penjualan barang-barang tersebut. Baik penjualan secara grosir (perdagangan besar) maupun eceran merupakan tahap akhir dalam pendistribusian barang dagangan. Kategori ini juga mencakup reparasi mobil dan sepeda motor. Penjualan tanpa perubahan teknis juga mengikutkan kegiatan yang terkait dengan perdagangan, seperti penyortiran, pemisahan kualitas dan penyusunan barang, pencampuran, pembotolan, pengepakan, pembongkaran dari ukuran besar dan pengepakan ulang menjadi ukuran yang lebih kecil, penggudangan, baik dengan pendingin maupun tidak, pembersihan dan pengeringan hasil pertanian, pemotongan lembaran kayu atau logam. Pedagang besar seringkali secara fisik mengumpulkan, menyortir, dan memisahkan kualitas barang dalam ukuran besar, membongkar dari ukuran besar dan mengepak ulang menjadi ukuran yang lebih kecil. Sedangkan pedagang eceran melakukan penjualan kembali barang-barang (tanpa perubahan teknis), baik barang baru maupun bekas, utamanya kepada masyarakat umum untuk konsumsi atau penggunaan perorangan maupun rumah tangga, melalui toko, departement store, kios, mail-order houses, penjual dari pintu ke pintu, pedagang keliling, koperasi konsumsi, rumah pelelangan, dan lain-lain. Pada umumnya pedagang pengecer memperoleh hak atas barang-barang yang dijualnya, tetapi beberapa
of various types of goods, and that provide compensation for the services along with the sale of the items. Both wholesale (large trade) and retail sales are the final step in the distribution of goods. This section also includes the repair of cars and motorcycles.
Sales without technical changes also include the activities related to trade, such as goods sorting, preparation, and quality separation, blending, bottling, packing, dismantling from the larger size, re-packing into smaller size, storage, whether with cooling system or not, cleaning and drying of agricultural products, cutting of wood or metal sheets.
Wholesale traders are often physically collecting, sorting, and separating the good’s quality in large measure, resizing and repacking into smaller sizes. The retailers resell the goods (without technical change), both new and second-hand goods, mainly to the general public for consumption or use of the individual or household, through shops, department stores, stalls, mail-order houses, sellers of doors to the door, peddlers, consumer cooperatives, auction houses, and others. In general, retailers acquire the direct benefit from the goods they sell, but some retailers act as agents who sell on consignment or commission basis.
https:
//bulel
engka
b.bps.g
o.id
RUANG LINGKUP DAN METODE PENGHITUNGAN
Produk Domestik Regional Bruto Kabupaten Buleleng Menurut Lapangan Usaha 2013-2017 25
pedagang pengecer bertindak sebagai agen, dan menjual atas dasar konsinyasi atau komisi. Output Lapangan Usaha Perdagangan adalah margin perdagangan, yaitu nilai jual dikurangi nilai beli barang yang diperdagangkan setelah dikurangi biaya angkutan yang dikeluarkan oleh pedagang. Output perdagangan (berlaku/konstan) dihitung menggunakan metode tidak langsung, yaitu menggunakan metode pendekatan arus barang “commodity flow approach”. Marjin perdagangan diperoleh dengan mengalikan rasio marjin perdagangan dengan output barang yang dihasilkan oleh industri penghasil barang domestik ditambah impor barang dari luar negeri. Kemudian output atau marjin perdagangan tersebut dikalikan dengan rasio nilai tambah untuk memperoleh nilai tambah perdagangan. Sedangkan reparasi mobil dan sepeda motor dihitung dengan pendekatan produksi, dengan indikator produksinya adalah jumlah kendaraan. Untuk mendapatkan nilai tambah konstannya nilai tambah berlaku yang diperoleh di-deflate menggunakan IHK umum (BPS). Sumber data yang digunakan dalam Lapangan Usaha Perdagangan Besar dan Eceran; Reparasi Mobil dan Sepeda Motor adalah data output barang dari industri domestik (Subdit Neraca Barang dan Neraca Jasa, BPS), Statistik Transportasi (BPS), Impor barang (BPS), Indeks Harga Konsumen (BPS) dan survei lainnya yang dilakukan oleh Direktorat Neraca Produksi BPS.
Output of Trade Business is trade margin obtained by the sale minus the value of goods traded net of transport costs incurred by the trader. Output of trade (current/constant) is calculated using the indirect method, which uses the method of approach flow of goods “commodity flow approach”. Trade margin is obtained by multiplying the trade margin rasio with the output of goods produced by the domestic industry producing goods plus imports of goods from abroad. Then output or trade margins are multiplied by the ratio of value added to obtain value-added trade. Meanwhile, the repair of cars and motorcycles is calculated by production approach, the production indicator is using the number of vehicles. To get the value added at constant prices, the value added at current price is deflated by the general CPI (BPS). Sources of data for the Industry of Wholesale and Retail Trade; Repair of Cars and Motorcycles are the Sub Directorate of Goods and Services Accounts of BPS (data on output of domestic industrial goods), Transport Statistics of BPS, Import of goods of BPS, Consumer Price Statistics of BPS, and other surveys conducted by the Directorate of Production Accounts of BPS
https:
//bulel
engka
b.bps.g
o.id
COVERAGE AND ESTIMATION METHOD
Gross Regional Domestic Product Of Buleleng Regency By Industry 2013-201726
2.8. Transportasi dan Pergudangan Kategori ini mencakup penyediaan angkutan penumpang atau barang, baik yang berjadwal maupun tidak, dengan menggunakan rel, saluran pipa, jalan darat, air atau udara dan kegiatan yang berhubungan dengan pengangkutan. Lapangan Usaha Transportasi dan Pergudangan terdiri atas: angkutan rel; angkutan darat; angkutan laut; angkutan sungai, danau dan penyeberangan; angkutan udara; pergudangan dan jasa penunjang angkutan, pos dan kurir. Kegiatan pengangkutan meliputi kegiatan pemindahan penumpang dan barang dari suatu tempat ke tempat lainnya dengan menggunakan alat angkut atau kendaraan, baik bermotor maupun tidak bermotor. Sedangkan jasa penunjang angkutan mencakup kegiatan yang sifatnya menunjang kegiatan pengangkutan seperti: terminal, pelabuhan, pergudangan, dan lain- lain. Metode estimasi yang digunakan adalah pendekatan produksi. Output atas dasar harga berlaku merupakan perkalian antara indikator produksi (jumlah kendaran wajib uji) dengan indikator harga (rata-rata output untuk masing-masing jenis alat angkutan). Sedangkan output atas dasar harga konstan 2010 diperoleh dengan menggunakan metode ekstrapolasi dengan indeks jumlah kendaraan sebagai ekstrapolatornya. NTB dihitung berdasarkan perkalian antara rasio NTB dengan outputnya.
2.8 Transportation and Storage This section includes the provision of transport of passengers or goods, whether scheduled or not, by using rail, pipeline, road, water or air, and the activities related to transport. Industry of Transportation and Warehousing consisting of: Rail Transport; land transport; sea transport; transport streams, lakes and crossings; air transport; warehousing and transportation support services, postal and courier. The activities also include the transport of passengers and goods removal activities from one place to another by using conveyances or vehicles, both motorized and non- motorized. Meanwhile, the transport support services include the activities that are supporting the activities of transport such as: terminal, port, warehousing, and others. The method of estimation is by production approach. Output at current prices is obtained by multiplying the production indicators (the number of tested vehicle) and price indicators (average output for each type of transport equipment). Meanwhile, the output at 2010 constant prices obtained by using an extrapolation method with the index number of the vehicle as extrapolator. GVA is calculated by multiplying the ratio of value added to output.
https:
//bulel
engka
b.bps.g
o.id

RUANG LINGKUP DAN METODE PENGHITUNGAN
Produk Domestik Regional Bruto Kabupaten Buleleng Menurut Lapangan Usaha 2013-2017 27
2.9 Penyediaan Akomodasi dan Makan Minum Kategori ini mencakup penyediaan akomodasi penginapan jangka pendek untuk pengunjung dan pelancong lainnya serta penyediaan makanan dan minuman untuk konsumsi segera. Jumlah dan jenis layanan tambahan yang disediakan sangat bervariasi. Tidak termasuk penyediaan akomodasi jangka panjang seperti tempat tinggal utama, penyiapan makanan atau minuman bukan untuk dikonsumsi segera atau yang melalui kegiatan perdagangan besar dan eceran. NTB subkategori akomodasi diperoleh dengan menggunakan pendekatan produksi. Indikator produksi yang digunakan adalah jumlah malam kamar terjual dan indikator harganya adalah rata-rata tarif per malam kamar. Output atas dasar harga berlaku diperoleh dari hasil perkalian antara indikator produksi dengan indikator harganya. Sedangkan NTB atas dasar harga konstan diperoleh berdasarkan perkalian output dengan rasio NTB. Output dan NTB atas dasar harga konstan dihitung dengan menggunakan metode revaluasi. Data produksi menggunakan data malam kamar terjual dari Subdit Statistik Pariwisata, BPS. Indikator harga menggunakan data tarif dari Survei Hotel Tahunan yang dilakukan oleh Subdit Statistik Pariwisata, BPS. Sementara pendekatan yang digunakan untuk menghitung output penyediaan makan minum melalui pendekatan produksi. Indikator produksinya berupa jumlah penduduk
2.9 Accommodation and Food Service Activities This section includes the provision of short-term lodging accommodation for visitors and other travellers and the provision of food and beverages for immediate consumption. The number and type of additional services provided are very varied. This is not including the provision of long-term accommodation as primary residences, preparing food or drinks not to be consumed immediately or through wholesale and retail trade. The GVA of accommodation division is obtained by using the production approach. The production indicator used is the number of room nights sold and the price indicator is the average rate per room night. Output at current prices is obtained by multiplying production indicator by price indicator. Meanwhile, the GVA at constant prices is obtained by multiplying the output with GVA ratio. Output and GVA at constant prices is calculated by using the revaluation model. The production data used are the data on room nights sold obtained from Sub Directorate of Tourism Statistics of BPS. The price indicators use the data rates from the Annual Hotel Survey conducted by Sub Directorate of Tourism Statistics of BPS. The approach used to calculate the output is through production approach. The production indicator for this division is the total of mid-year population. The price indicator is the average expenditure
https:
//bulel
engka
b.bps.g
o.id
COVERAGE AND ESTIMATION METHOD
Gross Regional Domestic Product Of Buleleng Regency By Industry 2013-201728
pertengahan tahun. Dan indikator harganya berupa pengeluaran rata-rata per kapita atas makan minum jadi di luar rumah. Hasil perkalian kedua indikator tersebut diperoleh output atas dasar harga berlaku. Sedangkan, output atas dasar harga konstan dihitung dengan menggunakan metode deflasi, dengan IHK kelompok makanan jadi, minuman, dan rokok sebagai deflator. Dan NTB atas dasar harga berlaku maupun konstan diperoleh berdasarkan perkalian output dengan rasio NTB. Data indikator produksi sub kategori penyediaan makan dan minum bersumber dari Proyeksi Penduduk Indonesia Sensus Penduduk 2010 - BPS. Sedangkan data indikator harga diperoleh dari hasil Survei Sosial Ekonomi Nasional (Susenas) dan IHK makanan jadi, minuman dan rokok dari publikasi Indikator Ekonomi - BPS. 2.10. Informasi dan Komunikasi Kategori ini mencakup produksi dan distribusi informasi dan produk kebudayaan, persediaan alat untuk mengirimkan atau mendistribusikan produk-produk ini dan juga data atau kegiatan komunikasi, informasi, teknologi informasi dan pengolahan data serta kegiatan jasa informasi lainnya. Kategori terdiri dari beberapa industri yaitu penerbitan, produksi gambar bergerak, video, perekaman suara dan penerbitan musik, penyiaran dan pemograman (radio dan televisi), telekomunikasi, pemograman, konsultasi komputer dan teknologi informasi.
per capita on eating and drinking outside the home. The result of multiplying both indicators serves as output at current prices. Meanwhile, outputs at constant prices are calculated by using the method of deflation, with the CPI processed foods, beverages, and cigarettes as a deflator. The GVA at current and constant prices are obtained by multiplying the output by GVA ratio. Data source for the production of this division is from BPS’ 2010 Indonesia Population Projection Population Census. Meanwhile, the price indicators are obtained from the National Socioeconomic Survey (Susenas) and CPI for food, drinks and cigarettes from the BPS’ publication of Economic Indicators. 2.10 Information and Communication This section includes the production and distribution of information and cultural products, the inventory tool to transmit or distribute these products as well as data or communications activities, information, information technology and data processing and other information services activities. The section consists of several industries namely Publishing, Moving Image, Video, Sound Recording and Music Publishing, Broadcasting and Programming (Radio and Television), Telecommunications, Programming, Consulting Computer and Information Technology.
https:
//bulel
engka
b.bps.g
o.id
RUANG LINGKUP DAN METODE PENGHITUNGAN
Produk Domestik Regional Bruto Kabupaten Buleleng Menurut Lapangan Usaha 2013-2017 29
Metode estimasi yang digunakan adalah pendekatan produksi. Output atas dasar harga berlaku didapat dari nilai produksi/pendapatan hasil olahan survei industri besar dan sedang, serta laporan keuangan perusahaan- perusahaan go public bergerak di industri informasi dan telekomunikasi, sedangkan NTB atas dasar harga berlaku didapat dari penjumlahan upah dan gaji, laba/rugi, penyusutan, dan komponen-komponen lainnya. Sedangkan output atas dasar harga konstan 2010 diperoleh dengan metode deflasi, dan NTB atas dasar harga konstan didapat dari perkalian antara output atas dasar harga konstan dengan rasio NTB tahun dasar 2010. Sumber data utama untuk kegiatan informasi diperoleh dari Subdit Statistik Industri Besar dan Sedang dan Subdit Statistik Komunikasi dan Teknologi Informasi BPS, perusahaan go public dibidang televisi dan teknologi informasi, Direktorat Pembinaan Kesenian dan Perfilman, Badan Ekonomi Kreatif, sedangkan kegiatan telekomunikasi diperoleh dari perusahaan telekomunikasi go public seperti: PT Telkom dan anak perusahaannya, PT Telekomunikasi Seluler (Telkomsel); PT Indosat dan anak perusahaannya, Excel Axiata; PT. Bakrie Telecom; dan PT. Smartfren Telecom, Sedangkan indikator harga berupa indeks harga seperti: IHP percetakan dan penerbitan dari Subdit Statistik Harga Produsen-BPS; IHK umum dan IHK jasa komunikasi dari Subdit Statistik Harga Konsumen-BPS.
The method of estimation is production approach. Outputs at current prices are obtained from the value of production/income resulting from the large and medium manufacturing survey, as well as the financial statements of publicly traded companies engaged in the information and telecommunications, while the GVA at current prices is obtained from the sum of wages and salaries, profit / loss, depreciation, and other components. Meanwhile, the outputs at 2010 constant prices are obtained by the method of deflation, and GVA at constant prices is obtained by multiplying output at 2010 constant prices with GVA ratio at 2010 as the base year. The main data for the information activities are obtained from Sub Directorate of Large and Medium Industry Statistics and Sub Directorate of Communication Statistics and Information Technology of BPS, the go public television and information technology companies, Directorate of Art and Film, General Directorate of Art and Culture, Ministry of Tourism and Creative Economy, while the telecommunication activities are derived from a number of go public telecommunications companies such as: PT Telkom and its subsidiaries, PT Telecom Mobile (Telkomsel); PT Indosat and its subsidiary, Excel Axiata; PT. Bakrie Telecom; and PT. Smartfren Telecom, Meanwhile, price indicators such as the price index: PPI for printing and publishing are from Sub Directorate of Producer Price Statistics of BPS; General CPI and CPI for communication from Sub Directorate of Consumer Price Statistics of BPS.
https:
//bulel
engka
b.bps.g
o.id

COVERAGE AND ESTIMATION METHOD
Gross Regional Domestic Product Of Buleleng Regency By Industry 2013-201730
2.11 Jasa Keuangan dan Asuransi Kategori ini mencakup jasa perantara keuangan, asuransi dan pensiun, jasa keuangan lainnya serta jasa penunjang keuangan. Kategori ini juga mencakup kegiatan pemegang asset, seperti kegiatan perusahaan holding dan kegiatan dari lembaga penjaminan atau pendanaan dan lembaga keuangan sejenis. Metode estimasi yang digunakan adalah pendekatan produksi untuk bank komersial (termasuk BPR) dan pendekatan pengeluaran untuk bank sentral (Bank Indonesia). Output atas dasar harga berlaku dari usaha bank komersial adalah jumlah penerimaan atas jasa pelayanan bank yang diberikan kepada pemakainya, seperti biaya administrasi atas transaksi dengan bank, dan imputasi jasa implisit bank yang diukur dengan menggunakan metode FISIM, juga pendapatan lainnya yang diperoleh karena melakukan kegiatan pendukung, seperti: mengirim uang, membeli dan menjual surat- surat berharga. Output bank sentral (Bank Indonesia) dihitung adalah jumlah atas biaya- biaya yang dikeluarkan, termasuk konsumsi antara, pengeluaran untuk upah/gaji pegawai, pajak, dan penyusutan. Sedangkan output KSP, BMT dan Jasa Moneter lainnya diperoleh dengan mengalikan rata-rata pendapatan usaha dengan masing-masing jumlah usahanya. Penghitungan NTB atas dasar harga konstan 2010 dilakukan dengan menggunakan metode deflasi dan sebagai deflatornya adalah IHK Umum dan Indeks Implisit PDB tanpa Jasa Perantara
2.11 Financial Service and Insurance This category includes financial intermediaries, insurance and pensions, other financial services and financial support services. This category also covers the activities of asset holders, such as holding companies and activities of guarantee or funding agencies and similar financial institutions. The method of estimation is production approach to commercial banks (including BPR) and the expenditure approach to the central bank (Bank Indonesia). Output at current prices of the commercial banking business is the amount of bank acceptance of the services provided to users, such as administrative costs of the transaction with the bank, and implicitly imputed bank services as measured by using the method of FISIM, as well as other income earned for supporting activities, such as: sending money, buying and selling securities. Output of central bank (Bank Indonesia) is the amount calculated for the costs incurred, including intermediate consumption, expenditure on wages/ salaries, taxes, and depreciation. Meanwhile, the output of KSP, BMT and other Monetary Services is obtained by multiplying average operating revenues with each number business. GVA at 2010 constant prices is calculated using deflation method and General CPI as deflator and GDP Implicit index without the Financial Intermediary Service. Output and GVA at current prices are obtained from Bank Indonesia.
https:
//bulel
engka
b.bps.g
o.id

RUANG LINGKUP DAN METODE PENGHITUNGAN
Produk Domestik Regional Bruto Kabupaten Buleleng Menurut Lapangan Usaha 2013-2017 31
Keuangan. Data output dan NTB atas dasar harga berlaku diperoleh dari Bank Indonesia.
2.12 Real Estat Kategori ini meliputi kegiatan persewaan, agen dan atau perantara dalam penjualan atau pembelian real estat serta penyediaan jasa real estat lainnya bisa dilakukan atas milik sendiri atau milik orang lainyang dilakukan atas dasar balas jasa kontrak. Kategori ini juga mencakup kegiatan pembangunan gedung, pemeliharaan atau penyewaan bangunan. Real estat adalah property berupa tanah dan bangunan. Output untuk persewaan bangunan tempat tinggal diperoleh dari perkalian antara pengeluaran konsumsi rumah tangga per kapita untuk sewa rumah, kontrak rumah, sewa beli rumah dinas, perkiraan sewa rumah, pajak dan pemeliharaan rumah dengan jumlah penduduk pertengahan tahun. Sedangkan output usaha persewaan bangunan bukan tempat tinggal diperoleh dari perkalian antara luas bangunan yang disewakan dengan rata-rata tarif sewa per m2. NTB diperoleh dari hasil perkalian antara rasio NTB dengan outputnya. NTB atas dasar harga konstan diperoleh dengan menggunakan metode ekstrapolasi dan sebagai ekstrapolatornya indeks luas bangunan. Sumber data usaha persewaan bangunan tempat tinggal diperoleh berdasarkan hasil Susenas dan Sensus Penduduk, BPS (imputasi sewa rumah). Sedangkan data produksi usaha persewaan
2.12 Real Estate Activities This section includes the activities of real estate renting, agent or intermediary services (in the sale or purchase) and providing other real estate services that could be done on their own or belonging to others on the contracts basis. This section also includes building development, maintenance, and renting activities. Real estate property comprises of land and the buildings on it.
Output for residential building renting activities is obtained from the multiplication of household consumption expenditure per capita for house rent, lease, contract, estimated rent, taxes and maintenance of the house with a number of mid-year populations. Meanwhile, the output non-residential building renting business is acquired from multiplying building area leased by an average rental rate per m2. GVA is obtained by multiplying the GVA ratio to output. GVA at constant prices is obtained by extrapolation method with index of building area serving as extrapolator.
Data source of residential building renting business are the results of Susenas and the Population Census, BPS (imputation of residential rental). The production data of non-residential renting
https:
//bulel
engka
b.bps.g
o.id
COVERAGE AND ESTIMATION METHOD
Gross Regional Domestic Product Of Buleleng Regency By Industry 2013-201732
bukan tempat tinggal diperoleh dari hasil penelitian asosiasi. Struktur input pada usaha persewaan bangunan tempat tinggal dan bangunan bukan tempat tinggal diperoleh dari hasil Survei Khusus Sektor Perdagangan dan Jasa (SKSPJ), BPS.
2.13 Jasa Perusahaan Lapangan Usaha Jasa Perusahaan merupakan gabungan dari 2 (dua) kategori, yakni kategori M dan kategori N. Kategori M mencakup kegiatan profesional, ilmu pengetahuan dan teknik yang membutuhkan tingkat pelatihan yang tinggi dan menghasilkan ilmu pengetahuan dan ketrampilan khusus yang tersedia untuk pengguna. Kegiatan yang termasuk kategori M antara lain: jasa hukum dan akuntansi, jasa arsitektur dan teknik sipil, penelitian dan pengembangan ilmu pengetahuan, periklanan dan penelitian pasar, serta jasa professional, ilmiah dan teknis lainnya. Kategori N mencakup berbagai kegiatan yang mendukung operasional usaha secara umum. Kegiatan yang termasuk kategori N antara lain: jasa persewaan dan sewa guna usaha tanpa hak opsi, jasa ketenagakerjaan, jasa agen perjalanan, penyelenggaraan tur dan jasa reservasi lainnya, jasa keamanan dan penyelidikan, jasa untuk gedung dan pertamanan, jasa administrasi kantor, serta jasa penunjang kantor dan jasa penunjang usaha lainnya. Metode estimasi yang digunakan untuk menghitung output kategori jasa perusahaan atas dasar harga berlaku adalah pendekatan produksi. Output diperoleh dari hasil perkalian antara jumlah
business are obtained from the research of association of the business. The input structure on residential and non-residential building renting businesess are obtained from Special Survey of Trade and Services Sector by BPS.
2.13 Business Activities Industry of Business Services is a combination of two sections, namely Section M and N. Section M covers professional activities, science and engineering that require high levels of training and generate knowledge and skills available to users. The Section M activities include legal services and accounting, architectural and civil engineering services, research and development of science, advertising and market research, as well as professional services, scientific and other technical services. Section N activities include a variety of the activities supporting general business operations, such as rental and lease services without option rights, employment services, travel agency services, tours and other reservation services, security and investigation services, building and park services, office administrative services, as well as office supporting services and other business supporting services.
The method of estimation used to calculate the output of services section at current prices is production approach. Output is obtained by multiplying the number of workers with the average output
https:
//bulel
engka
b.bps.g
o.id
RUANG LINGKUP DAN METODE PENGHITUNGAN
Produk Domestik Regional Bruto Kabupaten Buleleng Menurut Lapangan Usaha 2013-2017 33
tenaga kerja dengan rata-rata output per tenaga kerja. Sedangkan output atas dasar harga konstan diperoleh dengan menggunakan metode revaluasi. Nilai Tambah Bruto (NTB) baik atas dasar harga berlaku maupun atas dasar harga konstan diperoleh dari hasil perkalian output dan rasio NTB. Sumber data berupa jumlah tenaga kerja diperoleh dari Direktorat Statistik Kependudukan dan Ketenagakerjaan BPS. Sedangkan untuk IHK umum diperoleh dari Subdirektorat Statistik Harga Konsumen BPS.
2.14 Administrasi Pemerintah, Pertahanan dan Jaminan Sosial Wajib Kategori ini mencakup kegiatan yang sifatnya pemerintahan, yang umumnya dilakukan oleh administrasi pemerintahan. Kategori ini juga mencakup perundang- undangan dan penterjemahan hukum yang berkaitan dengan pengadilan dan menurut peraturannya, seperti halnya administrasi program berdasarkan peraturan perundang- undangan, kegiatan legislative, perpajakan, pertahanan Negara, keamanan dan keselamatan Negara, pelayanan imigrasi, hubungan luar negeri dan administrasi program pemerintah, serta jaminan social wajib. Kegiatan yang diklasifikasikan di kategori lain dalam KBLI tidak termasuk pada kategori ini., meskipun dilakukan oleh Badan pemerintahan. Sebagai contoh administrasi sistim sekolah, (peraturan, pemeriksaan, dan kurikulum) termasuk pada kategori ini, tetapi pengajaran
per worker. Meanwhile, output at constant prices is obtained by revaluation method. Gross Value Added (GVA), both at current prices and at constant prices is obtained by multiplying the output and GVA ratio. The key data are total employment data obtained from the Directorate of Population and Employment Statistics of BPS. The general consumer price index is obtained from Sub Directorate of Consumer Price Statistics of BPS.
2.14 Public Administration and Defence; Compulsory Social Security This section includes activities related to government, which are generally carried out by the administration. This section also includes the interpretation of legislation and law relating to the courts and according to the rules, as well as the administration of programs based on legislation, legislative activities, taxation, defence, State security and safety, immigration services, foreign affairs and administration programs government, as well as compulsory social security. The activities that are classified in other section in ISIC are not included in this section, albeit by government agencies. For example, the administrations of the school system, (regulation, inspection, and curriculum) are included in this section, but the teaching activities belong to the Section of Education (P) and prison or military hospitals are classified into section of Q.
https:
//bulel
engka
b.bps.g
o.id
COVERAGE AND ESTIMATION METHOD
Gross Regional Domestic Product Of Buleleng Regency By Industry 2013-201734
itu sendiri masuk kategori Pendidikan (P) dan rumah sakit penjara atau militer diklasifikasikan pada kategori Q. NTB administrasi pemerintahan atas dasar harga berlaku merupakan penjumlahan seluruh belanja pegawai dari kegiatan administrasi pemerintahan dan pertahanan serta jasa pemerintahan lainnya ditambah dengan penyusutan. Perkiraan NTB atas dasar harga konstan 2010 dihitung dengan cara ekstrapolasidan indeks tertimbang jumlah pegawai negeri sipil menurut golongan kepangkatan sebagai ekstrapolatornya. Data bersumber dari Realisasi APBN. Direktorat Jenderal Anggaran Departemen Keuangan; Realisasi anggaran belanja rutin dan belanja pembangunan; Statistik Keuangan Pemerintah daerah (K1, K2, K3), BPS; Realisasi APBD, Biro Keuangan Pemerintah Daerah; Jumlah pegawai negeri sipil, Badan Kepegawaian Nasional (BKN).
2.15 Jasa Pendidikan Kategori ini mencakup kegiatan pendidikan pada berbagai tingkatan dan untuk berbagai pekerjaan, baik secara lisan atau tertulis seperti halnya dengan berbagai cara komunikasi. Kategori ini juga mencakup pendidikan negeri dan swasta juga mencakup pengajaran yang terutama mengenai kegiatan olahraga, hiburan dan penunjang pendidikan. Pendidikan dapat disediakan dalam ruangan, melalui penyiaran radio dan televisi, internet dan surat menyurat. Tingkat pendidikan dikelompokan seperti
The GVA of the administration at current prices is the sum of all employee expenses of government administration and defense activities as well as other government services coupled with the depreciation. Estimation of value added at constant 2010 prices is calculated by extrapolation. The number of civil servants- weighted index by class rank serves as extrapolator.
The data are from the state budget realization by the Directorate General of Budget of the Ministry of Finance; Realization of routine budget and development expenditure; Local government finance statistics (K1, K2, K3) by BPS; Realization of the local government budget by the Bureau of Local Government Finance; number of civil servants by the National Civil Service Agency (NCSA).
2.15 Education This section includes educational activities at various levels and for various jobs, either orally or in writing as well as the various means of communication. This section also includes public and private education also includes teaching, especially regarding sports activities, entertainment and educational support. Education can be provided in the room, through radio and television broadcasting, internet and mailing education. Education level activities classified as basic, secondary, and higher and other education, also including
https:
//bulel
engka
b.bps.g
o.id
RUANG LINGKUP DAN METODE PENGHITUNGAN
Produk Domestik Regional Bruto Kabupaten Buleleng Menurut Lapangan Usaha 2013-2017 35
kegiatan pendidikan dasar, pendidikan menengah, pendidikan tinggi dan pendidikan lain, mencakup juga jasa penunjang pendidikan dan pendidikan anak usia dini. Penghitungan NTB Jasa Pendidikan Pemerintah atas dasar harga berlaku menggunakan pendekatan pengeluaran, dan untuk Jasa Pendidikan Swasta menggunakan pendekatan pendekatan produksi. Untuk NTB Jasa Pendidikan Pemerintah atas dasar harga konstan 2010 menggunakan pendekatan deflasi, sedangkan Jasa Pendidikan Swasta menggunakan pendekatan revaluasi. Data diperoleh dari Realisasi APBN/APBD; Kementerian Pendidikan dan Kebudayaaan; Kementerian Agama; Berbagai Survei Khusus yang dilakukan oleh Direktorat Neraca Produksi dan Pengeluaran BPS; Subdirektorat Statistik Harga Konsumen BPS.
2.16 Jasa Kesehatan dan Kegiatan Sosial Kategori ini mencakup kegiatan penyediaan jasa kesehatan dan kegiatan sosial yang cukup luas cakupannya, dimulai dari pelayanan kesehatan yang diberikan oleh tenaga profesional terlatih di rumah sakit dan fasilitas kesehatan lain sampai kegiatan perawatan di rumah yang melibatkan tingkatan kegiatan pelayanan kesehatan sampai kegiatan sosial yang tidak melibatkan tenaga kesehatan profesional. Kegiatan penyediaan jasa kesehatan dan kegiatan sosial mencakup: Jasa Rumah Sakit;
educational support services and early childhood education.
GVA of Government Education Service at current prices is calculated by expenditure approaches, and Private Education Services by production approach. The GVA of government educational services at 2010 constant prices is calculated by deflation approach, while the Private Education Services by revaluation approach.
The data sources are the state budget, Ministry of Education and The Cultures; Ministry Of Religion Affairs; Various special surveys conducted by Directorate of Production Account and Expenditure Account of BPS; Sub Directorate of Consumer Price Statistics of BPS.
2.16 Human Health and Social Work Activities This section includes providing health services and social activities, from health care provided by skilled professionals in hospitals and other health facilities to home care activities that involve levels of health care activities to social activities that do not involve force health professionals. The provision of health services and social activities include: Hospital Services; Clinical services; Other Hospital Services; Physician practices; Health Care Services performed by paramedics; Traditional Health Care Services; Health support service; Special
https:
//bulel
engka
b.bps.g
o.id

COVERAGE AND ESTIMATION METHOD
Gross Regional Domestic Product Of Buleleng Regency By Industry 2013-201736
Jasa Klinik; Jasa Rumah Sakit Lainnya; Praktik Dokter; Jasa Pelayanan Kesehatan yang dilakukan oleh Paramedis; Jasa Pelayanan Kesehatan Tradisional; Jasa Pelayanan Penunjang Kesehatan; Jasa Angkutan Khusus Pengangkutan Orang Sakit (Medical Evacuation); Jasa Kesehatan Hewan; Jasa Kegiatan Sosial. Metode penghitungan untuk jasa pemerintah atas dasar harga berlaku menggunakan pendekatan pengeluaran, sedangkan swasta menggunakan pendekatan produksi. NTB jasa kesehatan dan kegiatan sosial pemerintah atas dasar harga konstan 2010 menggunakan pendekatan deflasi, sedangkan jasa kesehatan dan kegiatan sosial swasta menggunakan pendekatan revaluasi. Data diperoleh dari Realisasi APBN/APBD; Kementerian Kesehatan; Survei Sosial Ekonomi Nasional (Susenas); Berbagai Survei Khusus yang dilakukan Direktorat Neraca Produksi dan Direktorat Neraca Pengeluaran BPS; Subdirektorat Statistik Harga Konsumen.
2.17 Jasa Lainnya Kategori Jasa Lainnya merupakan gabungan 4 kategori pada KBLI 2009. Kategori ini mempunyai kegiatan yang cukup luas yang meliputi: kesenian, hiburan, dan rekreasi; jasa reparasi komputer dan barang keperluan pribadi dan perlengkapan rumah tangga; jasa perorangan yang melayani rumah tangga; kegiatan yang menghasilkan barang dan jasa oleh rumah tangga yang digunakan sendiri untuk memenuhi kebutuhan; jasa swasta lainnya termasuk kegiatan badan
Transport Services Transportation of the Sick (Medical Evacuation); Animal Health Service; Social Work Services.
The calculation method for government services at current prices applies expenditure approach, while the private sector using production approaches. GVA of government health services and social activities at 2010 constant prices uses the deflation approach, but the GVA of private ones uses revaluation approach.
The data sources are the realization of state budget/local government budget; Ministry of Health; National Socioeconomic Survey (Susenas); Various special surveys conducted by Directorate of Production an Expenditure Account of BPS; and Sub Directorate of Consumer Price Statistics.
2.17 Other Services Activities Industry of Other Services Activities is a combination of four categories in ISIC Rev. 4. This section has a fairly extensive activities that include: Arts, Entertainment, and Recreation; Computer Repair Services and Personal Purposes Goods and Home Appliances; Individuals Services Serving Households; Activity Produce Goods and Services by Household Used Alone to meet the needs; Other private services including the activities of international agencies, such as the UN and UN agencies, the Regional
https:
//bulel
engka
b.bps.g
o.id

RUANG LINGKUP DAN METODE PENGHITUNGAN
Produk Domestik Regional Bruto Kabupaten Buleleng Menurut Lapangan Usaha 2013-2017 37
internasional, seperti PBB dan perwakilan PBB, badan regional, IMF, OECD, dan lain-lain. Output atas dasar harga berlaku diperoleh dari perkalian antara masing-masing jumlah tenaga kerja dengan rata-rata output per tenaga kerja. NTB atas dasar harga berlaku diperoleh dari hasil perkalian antara rasio NTB dengan output. Sedangkan untuk memperoleh output dan NTB atas dasar harga konstan menggunakan metode deflasi dimana deflatornya adalah IHK Umum. Data diperoleh dari internal BPS (Sensus Ekonomi, Subdit Statistik Demografi, Susenas, dan Subdirektorat Statistik Harga Konsumen).
Board, IMF, OECD, etc.
Output at current prices obtained from multiplication of each workforce with an average output per worker. GVA at current prices is obtained by multiplying the GVA ratio to output. The output and GVA at constant prices is calculated by deflation method with the general CPI serving as deflator.
The data are obtained from BPS (Economic Census, Sub Directorate of Demographic Statistics, Survey of Sosioeconomic, and Sub Directorate of Consumer Price Statistics).
https:
//bulel
engka
b.bps.g
o.id

https:
//bulel
engka
b.bps.g
o.id

https:
//bulel
engka
b.bps.g
o.id

https:
//bulel
engka
b.bps.g
o.id
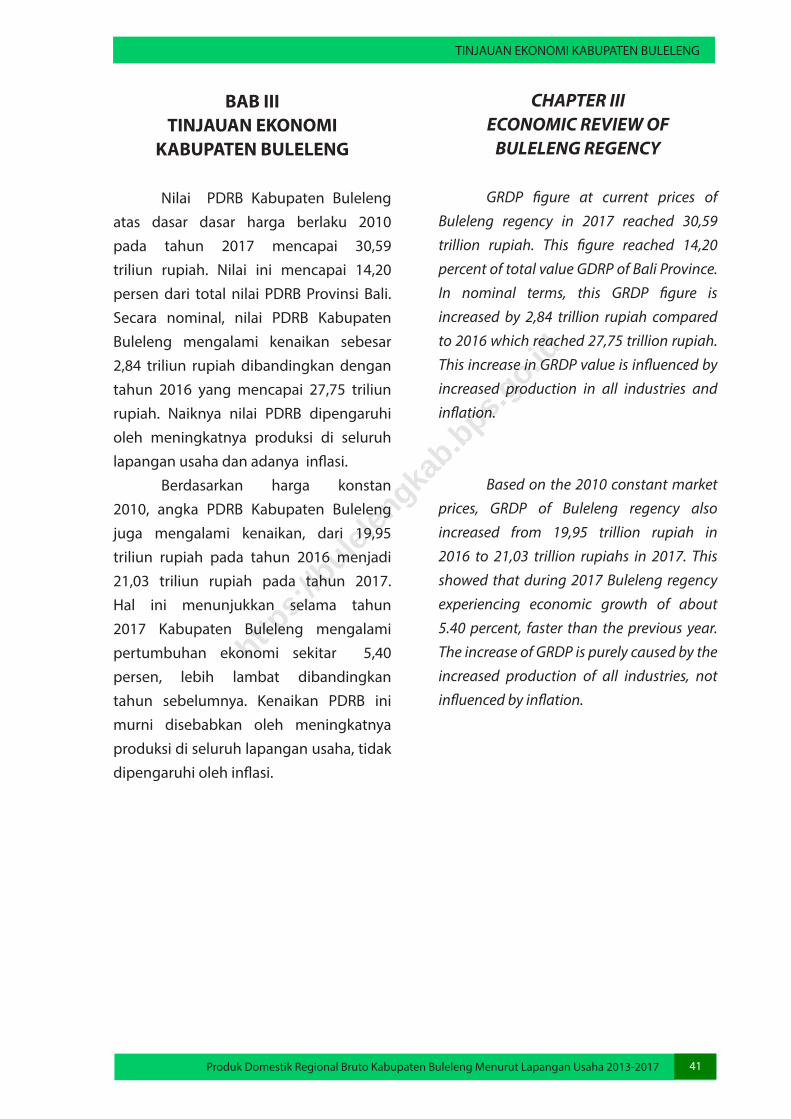
TINJAUAN EKONOMI KABUPATEN BULELENG
Produk Domestik Regional Bruto Kabupaten Buleleng Menurut Lapangan Usaha 2013-2017 41
BAB III TINJAUAN EKONOMI
KABUPATEN BULELENG
Nilai PDRB Kabupaten Buleleng atas dasar dasar harga berlaku 2010 pada tahun 2017 mencapai 30,59 triliun rupiah. Nilai ini mencapai 14,20 persen dari total nilai PDRB Provinsi Bali. Secara nominal, nilai PDRB Kabupaten Buleleng mengalami kenaikan sebesar 2,84 triliun rupiah dibandingkan dengan tahun 2016 yang mencapai 27,75 triliun rupiah. Naiknya nilai PDRB dipengaruhi oleh meningkatnya produksi di seluruh lapangan usaha dan adanya inflasi. Berdasarkan harga konstan 2010, angka PDRB Kabupaten Buleleng juga mengalami kenaikan, dari 19,95 triliun rupiah pada tahun 2016 menjadi 21,03 triliun rupiah pada tahun 2017. Hal ini menunjukkan selama tahun 2017 Kabupaten Buleleng mengalami pertumbuhan ekonomi sekitar 5,40 persen, lebih lambat dibandingkan tahun sebelumnya. Kenaikan PDRB ini murni disebabkan oleh meningkatnya produksi di seluruh lapangan usaha, tidak dipengaruhi oleh inflasi.
CHAPTER IIIECONOMIC REVIEW OF
BULELENG REGENCY
GRDP figure at current prices of Buleleng regency in 2017 reached 30,59 trillion rupiah. This figure reached 14,20 percent of total value GDRP of Bali Province. In nominal terms, this GRDP figure is increased by 2,84 trillion rupiah compared to 2016 which reached 27,75 trillion rupiah. This increase in GRDP value is influenced by increased production in all industries and inflation.
Based on the 2010 constant market prices, GRDP of Buleleng regency also increased from 19,95 trillion rupiah in 2016 to 21,03 trillion rupiahs in 2017. This showed that during 2017 Buleleng regency experiencing economic growth of about 5.40 percent, faster than the previous year. The increase of GRDP is purely caused by the increased production of all industries, not influenced by inflation.
https:
//bulel
engka
b.bps.g
o.id

ECONOMIC REVIEW OF BULELENG REGENCY
Gross Regional Domestic Product Of Buleleng Regency By Industry 2013-201742
3.1 Struktur Ekonomi Struktur ekonomi suatu daerah sangat ditentukan oleh besarnya peranan berbagai lapangan usaha ekonomi dalam memproduksi barang dan jasa. Struktur ekonomi yang terbentuk dari nilai tambah yang diciptakan oleh setiap lapangan usaha menggambarkan seberapa besar ketergantungan suatu daerah terhadap kemampuan berproduksi dari setiap lapangan usaha. Selama lima tahun terakhir (2013-2017) struktur perekonomian Kabupaten Buleleng didominasi oleh 5 (lima) kategori lapangan usaha, diantaranya: Pertanian, Kehutanan, dan Perikanan; Penyediaan Akomodasi dan Makan Minum; Perdagangan Besar dan Eceran, Reparasi Mobil, dan Sepeda Motor; Konstruksi; dan Jasa Pendidikan. Hal ini dapat dilihat dari
Gambar 3.1 Persentase Produk Domestik Regional Bruto Kabupaten Buleleng Terhadap PDRB Provinsi Bali, 2017 Figure 3.1 Percentage of Gross Regional Domestic Product Buleleng Regency to GRDP of Bali Province, 2017
3.1 Economic Structure The economic structure of a region is determined by the role of various economic enterprises in producing goods and services. Economic structure created from value added of each business field describes how much the region’s dependency on production capability of each business field.
Over the last five years (2013-2017) economic structure in Buleleng regency dominated by five (5) category of business field, such as: Agriculture, Forestry, and Fishery; Accommodation and Food Service Activities; Wholesale and and Retail Trade, Repair of Vehicles and Motorcycles; Construction; and Education. It can be seen from the respective roles of the undertaking
https:
//bulel
engka
b.bps.g
o.id

TINJAUAN EKONOMI KABUPATEN BULELENG
Produk Domestik Regional Bruto Kabupaten Buleleng Menurut Lapangan Usaha 2013-2017 43
peranan masing-masing lapangan usaha terhadap pembentukan PDRB Kabupaten Buleleng. Peranan terbesar dalam pembentukan PDRB Kabupaten Buleleng pada tahun 2017 dihasilkan oleh lapangan usaha Pertanian, kehutanan, dan perikanan, yaitu mencapai 22,17 persen. Selanjutnya lapangan usaha Penyediaan akomodasi dan makan minum sebesar 18,39 persen. Kemudian disusul oleh lapangan usaha Perdagangan Besar dan Eceran, Reparasi Mobil, dan Sepeda Motor sebesar 11,54 persen. Di posisi keempat dan kelima, lapangan usaha Konstruksi sebesar 8,30 persen dan lapangan usaha Jasa Pendidikan sebesar 7,49 persen. Kontribusi Pertanian, Kehutanan, dan Perikanan tahun 2017 menurun dibanding tahun 2013. Pada 2013 kontribusinya sebesar 22,74 persen, lalu menurun menjadi 22,04 persen pada 2014; 22,61 persen pada tahun 2015; 22,60 persen pada tahun 2016; lalu menurun menjadi 22,17 persen pada 2017. Salah satu penyebab menurunnya peranan Pertanian, Kehutanan, dan Perikanan adalah berkurangnya luas lahan pertanian di Kabupaten Buleleng. Menurut laporan Luas lahan tahun 2017, terjadi penurunan luas lahan pertanian sebesar 325 hektare, menurun 3,05 persen. Selain itu, lambatnya kenaikan harga produk lapangan usaha tersebut dibandingkan produk lain juga menjadi penyebab turunnya peranan lapangan usaha Pertanian, Kehutanan, dan Perikanan.
to the GRDP formation Buleleng regency.
The largest contribution in the formation of GRDP Buleleng Regency in 2017 produced by agricultural fields, forestry, and fisheries, which reached 22.17 percent. Furthermore, Accommodation and Food Service Activities reached 18.39 percent. Then followed by the Wholesale and and Retail Trade, Repair of Vehicles and Motorcycles 11.54 percent. In the fourth and fifth positions, the Construction business field is 8.30 percent and the Education Service field of 7.49 percent. The contribution of Agriculture, Forestry, and Fishing Industry in 2017 decreased compared to 2013. In 2013, its contribution was 22,74 percent, then declined to 22,04 percent in 2014; 22,61 percent in 2015; 22,60 percent in 2016; then it decreased 22,17 percent in 2017. One of the causes of declining role of Agriculture, Forestry, and Fisheries is the decrease of agricultural land area in Buleleng Regency. According to the report of the land area of 2017, there is a decrease of agricultural land area of 325 hectare, decreased 3,05 percent. In addition, the slow increase in the price of business products compared to other products is also the cause of the decline in the role of agriculture, forestry and fishery business.
https:
//bulel
engka
b.bps.g
o.id
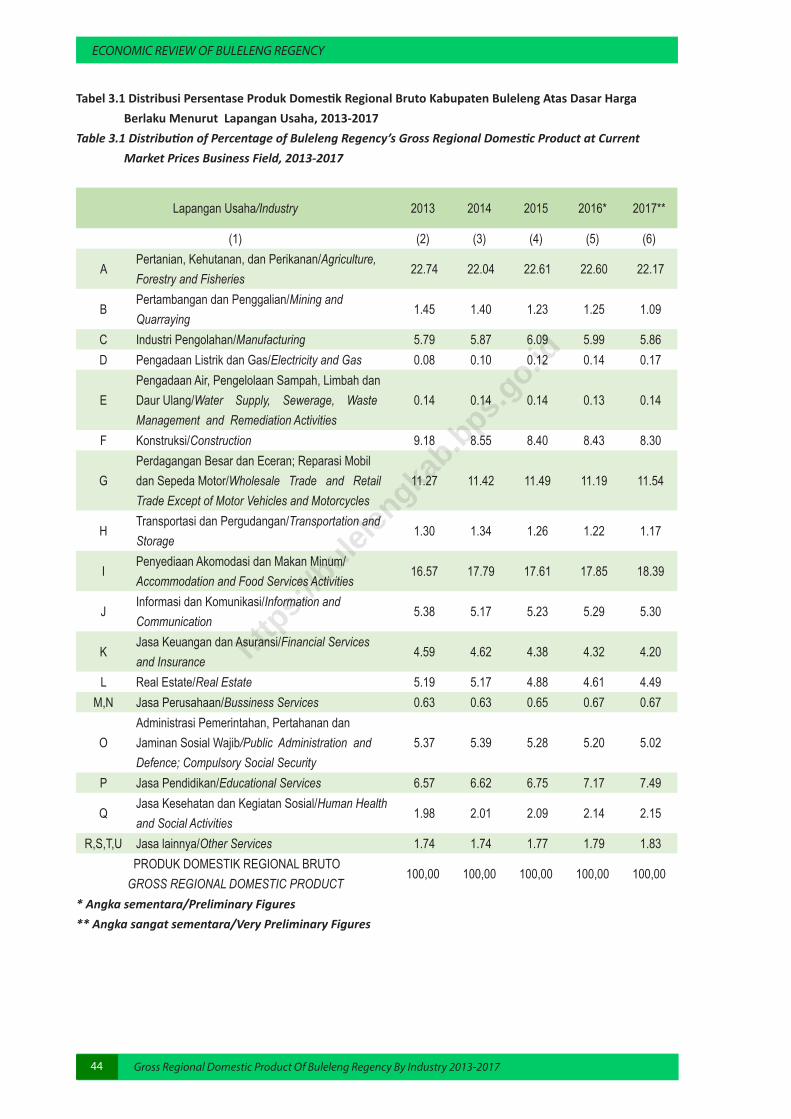
ECONOMIC REVIEW OF BULELENG REGENCY
Gross Regional Domestic Product Of Buleleng Regency By Industry 2013-201744
Tabel 3.1 Distribusi Persentase Produk Domestik Regional Bruto Kabupaten Buleleng Atas Dasar Harga Berlaku Menurut Lapangan Usaha, 2013-2017 Table 3.1 Distribution of Percentage of Buleleng Regency’s Gross Regional Domestic Product at Current Market Prices Business Field, 2013-2017
Lapangan Usaha/Industry 2013 2014 2015 2016* 2017**
(1) (2) (3) (4) (5) (6)
APertanian, Kehutanan, dan Perikanan/Agriculture, Forestry and Fisheries
22.74 22.04 22.61 22.60 22.17
BPertambangan dan Penggalian/Mining and Quarraying
1.45 1.40 1.23 1.25 1.09
C Industri Pengolahan/Manufacturing 5.79 5.87 6.09 5.99 5.86 D Pengadaan Listrik dan Gas/Electricity and Gas 0.08 0.10 0.12 0.14 0.17
EPengadaan Air, Pengelolaan Sampah, Limbah dan Daur Ulang/Water Supply, Sewerage, Waste Management and Remediation Activities
0.14 0.14 0.14 0.13 0.14
F Konstruksi/Construction 9.18 8.55 8.40 8.43 8.30
GPerdagangan Besar dan Eceran; Reparasi Mobil dan Sepeda Motor/Wholesale Trade and Retail Trade Except of Motor Vehicles and Motorcycles
11.27 11.42 11.49 11.19 11.54
HTransportasi dan Pergudangan/Transportation and Storage
1.30 1.34 1.26 1.22 1.17
IPenyediaan Akomodasi dan Makan Minum/Accommodation and Food Services Activities
16.57 17.79 17.61 17.85 18.39
JInformasi dan Komunikasi/Information and Communication
5.38 5.17 5.23 5.29 5.30
KJasa Keuangan dan Asuransi/Financial Services and Insurance
4.59 4.62 4.38 4.32 4.20
L Real Estate/Real Estate 5.19 5.17 4.88 4.61 4.49 M,N Jasa Perusahaan/Bussiness Services 0.63 0.63 0.65 0.67 0.67
OAdministrasi Pemerintahan, Pertahanan dan Jaminan Sosial Wajib/Public Administration and Defence; Compulsory Social Security
5.37 5.39 5.28 5.20 5.02
P Jasa Pendidikan/Educational Services 6.57 6.62 6.75 7.17 7.49
QJasa Kesehatan dan Kegiatan Sosial/Human Health and Social Activities
1.98 2.01 2.09 2.14 2.15
R,S,T,U Jasa lainnya/Other Services 1.74 1.74 1.77 1.79 1.83 PRODUK DOMESTIK REGIONAL BRUTOGROSS REGIONAL DOMESTIC PRODUCT
100,00 100,00 100,00 100,00 100,00
* Angka sementara/Preliminary Figures** Angka sangat sementara/Very Preliminary Figures
https:
//bulel
engka
b.bps.g
o.id
TINJAUAN EKONOMI KABUPATEN BULELENG
Produk Domestik Regional Bruto Kabupaten Buleleng Menurut Lapangan Usaha 2013-2017 45
Contribution of Accommodation and Food Service Activities in Buleleng Regency increased during 2013-2017. In 2013, its contribution was 16,57 percent, then increased to 17,79 percent in 2014; decreased 17,61 percent in 2015; 17,85 percent in 2016; then it increased 18,39 percent in 2017.
Industry of Wholesale and Retail Trade; Repair of Motor Vehicles and Motorcycles showed a fluctuative contribution to the GDRP of Buleleng Regency during period of 2013-2017. In 2013 the contribution was 11,27 percent, then increased to 11,42 percent in 2014, increased to 11,49 percent in 2015, decreased to 11,19 percent in 2016, and then increased to 11,54 percent in 2017.
The contribution of Construction Industry to the GDRP of Buleleng Regency continued to decrease in 2013-2017. In 2013 its contribution was 9.18 percent; 8,55 percent in 2014; 8,40 percent in 2015; 8,43 percent in 2016; and 8,30 percent in 2017.
In contrast to the contribution of construction, the contribution of Education Services to GRDP Buleleng Regency continues to increase during the period 2013-2017. In 2013 its contribution was 6,57 percent; 6,62 percent in 2014; 6,75 percent by 2015; 7,17 percent by 2016; and 7,49 percent by 2017.
Kontribusi Penyediaan Akomodasi dan Makan Minum di Kabupaten Buleleng cenderung mengalami peningkatan selama tahun 2013-2017. Pada 2013 kontribusinya sebesar 16,57 persen, lalu meningkat menjadi 17,79 persen pada 2014; menurun menjadi 17,61 persen pada tahun 2015; 17,85 persen pada tahun 2016; lalu meningkat kembali menjadi 18,39 persen pada 2017. Perdagangan Besar dan Eceran; Reparasi Mobil dan Sepeda Motor memperlihatkan kontribusi yang berfluktuasi terhadap PDRB Kabupaten Buleleng selama periode 2013-2017. Pada tahun 2013 kontribusinya sebesar 11,27 persen, kemudian meningkat menjadi 11,42 persen tahun 2014, meningkat kembali menjadi 11,49 persen tahun 2015, menurun menjadi 11,19 persen tahun 2016, dan meningkat kembali menjadi 11,54 persen pada tahun 2017. Kontribusi Konstruksi terhadap PDRB Kabupaten Buleleng terus mengalami penurunan selama periode 2013-2017. Pada tahun 2013 kontribusinya sebesar 9,18 persen; 8,55 persen tahun 2014; 8,40 persen pada tahun 2015; 8,43 persen pada tahun 2016; dan 8,30 persen pada tahun 2017. Berbeda dengan kontribusi kontruksi, kontribusi Jasa Pendidikan terhadap PDRB Kabupaten Buleleng terus mengalami peningkatan selama periode 2013-2017. Pada tahun 2013 kontribusinya sebesar 6,57 persen; 6,62 persen tahun 2014; 6,75 persen pada tahun 2015; 7,17 persen pada tahun 2016; dan 7,49 persen pada tahun 2017.
https:
//bulel
engka
b.bps.g
o.id
ECONOMIC REVIEW OF BULELENG REGENCY
Gross Regional Domestic Product Of Buleleng Regency By Industry 2013-201746
Kontribusi lapangan usaha lainnya terhadap PDRB Kabupaten Buleleng tahun 2017 masing-masing kurang dari 7 persen. Kategori tersebut diantaranya yaitu Kategori Industri Pengolahan sebesar 5,86 persen, Kategori Informasi dan Komunikasi sebesar 5,30 persen, Kategori Administrasi Pemerintahan, Pertahanan dan Jaminan Sosial Wajib sebesar 5,02 persen, Kategori Real Estat 4,49 persen, Kategori Jasa Keuangan dan Asuransi sebesar 4,20 persen, Kategori Jasa Kesehatan dan Kegiatan Sosial sebesar 2,15 persen, Kategori Jasa Lainnya sebesar 1,83 persen, Kategori Transportasi dan Pergudangan sebesar 1,17 persen, Kategori Pertambangan dan Penggalian sebesar 1,09 persen, Kategori Jasa Perusahaan sebesar 0,67 persen, Kategori Pengadaan Listrik dan Gas sebesar 0,17 persen, Kategori Pengadaan Air, Pengelolaan Sampah, Limbah dan Daur Ulang sebesar 0,14 persen. Semua kategori tersebut dinilai atas harga dasar atau harga keekonomian di tingkat produsen sebelum adanya intervensi pemerintah seperti pajak dan subsidi atas produk.
3.2 Pertumbuhan Ekonomi Pertumbuhan ekonomi merupakan salah satu indikator makro untuk melihat kinerja perekonomian secara riil di suatu wilayah. Laju pertumbuhan ekonomi dihitung berdasarkan perubahan PDRB atas dasar harga konstan tahun yang bersangkutan terhadap tahun sebelumnya. Pertumbuhan ekonomi dapat dipandang sebagai pertambahan
The contribution of other industries to GDRP of Buleleng Regency in 2017 is less than 7 percent. These industries include the Manufacturing 5.86 percent, Information and Communication 5.30 percent, Public Administration and Defence; Compulsory Social Security at 5.02 percent, Real Estate Services 4.49 percent, Financial Services and Insurance 4.20 percent, Health and Social Services 2.15 percent, Other Services 1.83 percent, Transportation and Storage 1.17 percent, Mining and Quarrying 1.09 percent, Bussiness Services 0.67 percent, Electricity and Gas Procurement by 0.17 percent, Water Supply Category, Waste Management, Waste and Recycling by 0.14 percent.
All of sections are valued at basic price or economic value recieved by producer before taxes and subsidies on products.
3.2 Economic Growth Economic growth is one indicator of the macro to see the real performance of the economy in a region. Economic growth rate is calculated based on changes in GRDP at constant prices for the year against the previous year. Economic growth can be seen as an increase in the number of goods and services produced by all business fields of economic activity in a region during a period
https:
//bulel
engka
b.bps.g
o.id

TINJAUAN EKONOMI KABUPATEN BULELENG
Produk Domestik Regional Bruto Kabupaten Buleleng Menurut Lapangan Usaha 2013-2017 47
of one year.
Based on 2010 constant market prices, the value of GDRP of Buleleng Regency in 2017 increased. The increase is influenced by increased production in all industries that are free from inflationary effects. GDRP of Buleleng Regency at 2010 constant prices, reached 21,03 trillion rupiah. This figure is up from 19,93 trillion rupiah in 2016. It shows that during the year 2017 there was economic growth of 5,40 percent, lower than the previous year’s economic growth of 6,02 percent.
jumlah barang dan jasa yang dihasilkan oleh semua lapangan usaha kegiatan ekonomi yang ada di suatu wilayah selama kurun waktu setahun. Berdasarkan harga konstan 2010, nilai PDRB Kabupaten Buleleng pada tahun 2017 meningkat. Peningkatan tersebut dipengaruhi oleh meningkatnya produksi di seluruh lapangan usaha yang sudah bebas dari pengaruh inflasi. PDRB Kabupaten Buleleng atas dasar harga konstan 2010, mencapai 21,03 triliun rupiah. Angka tersebut naik dari 19,95 triliun rupiah pada tahun 2016. Hal tersebut menunjukkan bahwa selama tahun 2017 terjadi pertumbuhan ekonomi sebesar 5,40 persen, lebih rendah jika dibandingkan dengan pertumbuhan ekonomi tahun sebelumnya yang mencapai 6,02 persen.
Gambar 3.2 Laju Pertumbuhan Ekonomi Kabupaten Buleleng, 2013-2017 Figure 3.2 Economic Growth Rate of Buleleng Regency, 2013-2017
https:
//bulel
engka
b.bps.g
o.id
ECONOMIC REVIEW OF BULELENG REGENCY
Gross Regional Domestic Product Of Buleleng Regency By Industry 2013-201748
The highest economic growth was achieved by the Accommodation and Food Service Activities at 9.66 percent. Of the 17 categories of industries, there were 15 categories that grew positive and 2 (two) categories that grew negative. The industries that grew negative in 2017 were Public Administration and Defence; Compulsory Social Security which grew by -2.84 percent and Mining and Quarrying with a growth of -6.07 percent.
Five industries that experienced a positive growth of seven to ten percent, are Accommodation and Food services Activities 9.66 percent, Information and Communications 8.88 percent, Education Services 8.83 percent, Other Services 7.73 percent, and the field of business of Big and Retail Trade; Repair of Cars and Motorcycles by 7.06 percent.
Within the period of 2013-2017, the highest average growth was achieved by the category of educational services that recorded growth of 10.87 percent. Although recorded relatively high, but the growth of this category shows a slowdown in 2017, where the category of Education Services grew by 8,83 percent. Experienced a slowdown compared to the previous year which reached 11.06 percent. Even in 2013 this category had reached the highest growth of 14.62 percent.
Pertumbuhan ekonomi tertinggi dicapai oleh lapangan usaha Penyediaan Akomodasi dan Makan Minum yaitu sebesar 9,66 persen. Dari 17 kategori lapangan usaha, terdapat 5 (lima) kategori yang tumbuh positif diatas 7 persen, 10 (sepuluh) kategori tumbuh dibawah 7 persen, dan 2 (dua) kategori yang tumbuh negatif. Kategori yang tumbuh negatif pada tahun 2017 yaitu kategori Administrasi Pemerintahan dan Pertahanan yang tumbuh -2,84 persen dan kategori Pertambangan dan Penggalian dengan pertumbuhan -6,07 persen. Lima lapangan usaha yang mengalami pertumbuhan positif sebesar tujuh hingga sepuluh persen antara lain lapangan usaha Penyediaan Akomodasi dan Makan Minum sebesar 9,66 persen, lapangan usaha Informasi dan Komunikasi sebesar 8,88 persen, lapangan usaha Jasa Pendidikan sebesar 8,83 persen, lapangan usaha Jasa Lainnya sebesar 7,73 persen, dan lapangan usaha Perdagangan Besar dan Eceran; Reparasi Mobil dan Sepeda Motor sebesar 7,06 persen. Dalam kurun waktu 2013-2017, rata-rata pertumbuhan tertinggi dicapai oleh kategori Jasa pendidikan yaitu tercatat tumbuh sebesar 10,87 persen. Meski tercatat relatif tinggi, namun pertumbuhan kategori ini menunjukkan perlambatan di tahun 2017, dimana kategori Jasa Pendidikan tumbuh sebesar 8,83 persen. Mengalami perlambatan dibandingkan tahun sebelumnya yang mencapai 11,06 persen. Bahkan pada tahun 2013 kategori ini sempat mencapai pertumbuhan tertinggi yaitu 14,62 persen.
https:
//bulel
engka
b.bps.g
o.id
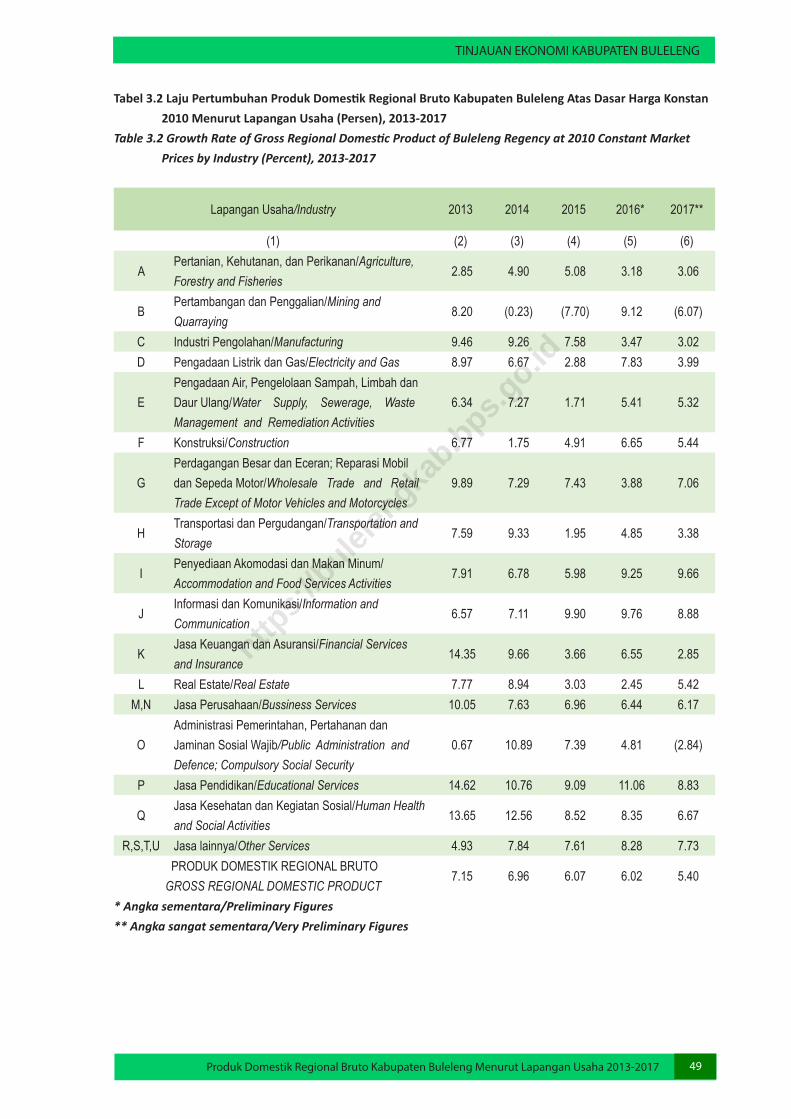
TINJAUAN EKONOMI KABUPATEN BULELENG
Produk Domestik Regional Bruto Kabupaten Buleleng Menurut Lapangan Usaha 2013-2017 49
Tabel 3.2 Laju Pertumbuhan Produk Domestik Regional Bruto Kabupaten Buleleng Atas Dasar Harga Konstan 2010 Menurut Lapangan Usaha (Persen), 2013-2017 Table 3.2 Growth Rate of Gross Regional Domestic Product of Buleleng Regency at 2010 Constant Market Prices by Industry (Percent), 2013-2017
Lapangan Usaha/Industry 2013 2014 2015 2016* 2017**
(1) (2) (3) (4) (5) (6)
APertanian, Kehutanan, dan Perikanan/Agriculture, Forestry and Fisheries
2.85 4.90 5.08 3.18 3.06
BPertambangan dan Penggalian/Mining and Quarraying
8.20 (0.23) (7.70) 9.12 (6.07)
C Industri Pengolahan/Manufacturing 9.46 9.26 7.58 3.47 3.02 D Pengadaan Listrik dan Gas/Electricity and Gas 8.97 6.67 2.88 7.83 3.99
EPengadaan Air, Pengelolaan Sampah, Limbah dan Daur Ulang/Water Supply, Sewerage, Waste Management and Remediation Activities
6.34 7.27 1.71 5.41 5.32
F Konstruksi/Construction 6.77 1.75 4.91 6.65 5.44
GPerdagangan Besar dan Eceran; Reparasi Mobil dan Sepeda Motor/Wholesale Trade and Retail Trade Except of Motor Vehicles and Motorcycles
9.89 7.29 7.43 3.88 7.06
HTransportasi dan Pergudangan/Transportation and Storage
7.59 9.33 1.95 4.85 3.38
IPenyediaan Akomodasi dan Makan Minum/Accommodation and Food Services Activities
7.91 6.78 5.98 9.25 9.66
JInformasi dan Komunikasi/Information and Communication
6.57 7.11 9.90 9.76 8.88
KJasa Keuangan dan Asuransi/Financial Services and Insurance
14.35 9.66 3.66 6.55 2.85
L Real Estate/Real Estate 7.77 8.94 3.03 2.45 5.42 M,N Jasa Perusahaan/Bussiness Services 10.05 7.63 6.96 6.44 6.17
OAdministrasi Pemerintahan, Pertahanan dan Jaminan Sosial Wajib/Public Administration and Defence; Compulsory Social Security
0.67 10.89 7.39 4.81 (2.84)
P Jasa Pendidikan/Educational Services 14.62 10.76 9.09 11.06 8.83
QJasa Kesehatan dan Kegiatan Sosial/Human Health and Social Activities
13.65 12.56 8.52 8.35 6.67
R,S,T,U Jasa lainnya/Other Services 4.93 7.84 7.61 8.28 7.73 PRODUK DOMESTIK REGIONAL BRUTOGROSS REGIONAL DOMESTIC PRODUCT
7.15 6.96 6.07 6.02 5.40
* Angka sementara/Preliminary Figures** Angka sangat sementara/Very Preliminary Figures
https:
//bulel
engka
b.bps.g
o.id
ECONOMIC REVIEW OF BULELENG REGENCY
Gross Regional Domestic Product Of Buleleng Regency By Industry 2013-201750
Sebagai penyangga ekonomi terbesar di Kabupaten Buleleng, kategori Pertanian, Kehutanan dan Perikanan mampu tumbuh sebesar 3,06 persen. Laju pertumbuhan kategori ini sedikit melambat dibanding tahun 2016 yang mencapai 3,18 persen. Bila dilihat secara rata-rata selama 5 (lima) tahun terakhir, kategori Pertanian, Kehutanan dan Perikanan hanya tercatat tumbuh sebesar 3,81 persen.
3.3 PDRB Perkapita Salah satu indikator yang dapat diturunkan dari adanya nilai PDRB suatu wilayah adalah PDRB per kapita. Nilai PDRB per kapita merupakan hasil bagi antara nilai tambah yang dihasilkan oleh seluruh kegiatan ekonomi dengan jumlah penduduk. Oleh karena itu, besar kecilnya jumlah penduduk akan mempengaruhi nilai PDRB per kapita, sedangkan besar kecilnya nilai PDRB sangat tergantung pada potensi sumber daya alam dan faktor-faktor produksi yang terdapat di daerah tersebut. PDRB per kapita atas dasar harga berlaku menunjukkan nilai PDRB per kepala atau per satu orang penduduk.PDRB per kapita tidak dapat dijadikan sebagai dasar indikator kesejahteraan penduduk karena PDRB menghitung seluruh nilai tambah yang dihasilkan di suatu wilayah tanpa memperhitungkan apakah yang menghasilkan nilai tambah tersebut merupakan penduduk atau bukan. Selain itu, PDRB per kapita membagi rata nilai PDRB dengan jumlah penduduk. Padahal kenyataannya, terdapat ketimpangan pendapatan di
As the biggest economic buffer in Buleleng Regency, Agriculture, Forestry and Fisheries is able to grow by 3.06 percent. Growth rate of this category slightly slowed compared to 2016 which reached 3.18 percent. When viewed on average over the last 5 (five) years, Agriculture, Forestry and Fisheries only recorded growth of 3.81 percent.
3.3 GRDP per capita One of the indicators that can be derived from the GRDP value of a region is the GRDP per capita. The value of GRDP per capita is the result of the added value generated by all economic activities with the population. Therefore, the size of the population will affect the value of GRDP per capita, while the size of the GRDP is very dependent on the potential of natural resources and factors of production contained in the area. GRDP per capita at current prices indicates the value of GRDP per head or per one resident. GRDP per capita can not be used as the basic indicator of the welfare of the population because the GRDP calculates all the added value generated in a region without taking into account whether the resulting value added is a resident or not. In addition, GRDP per capita share the GRDP value with the total population. Whereas in reality, there is income inequality among the population.
https:
//bulel
engka
b.bps.g
o.id
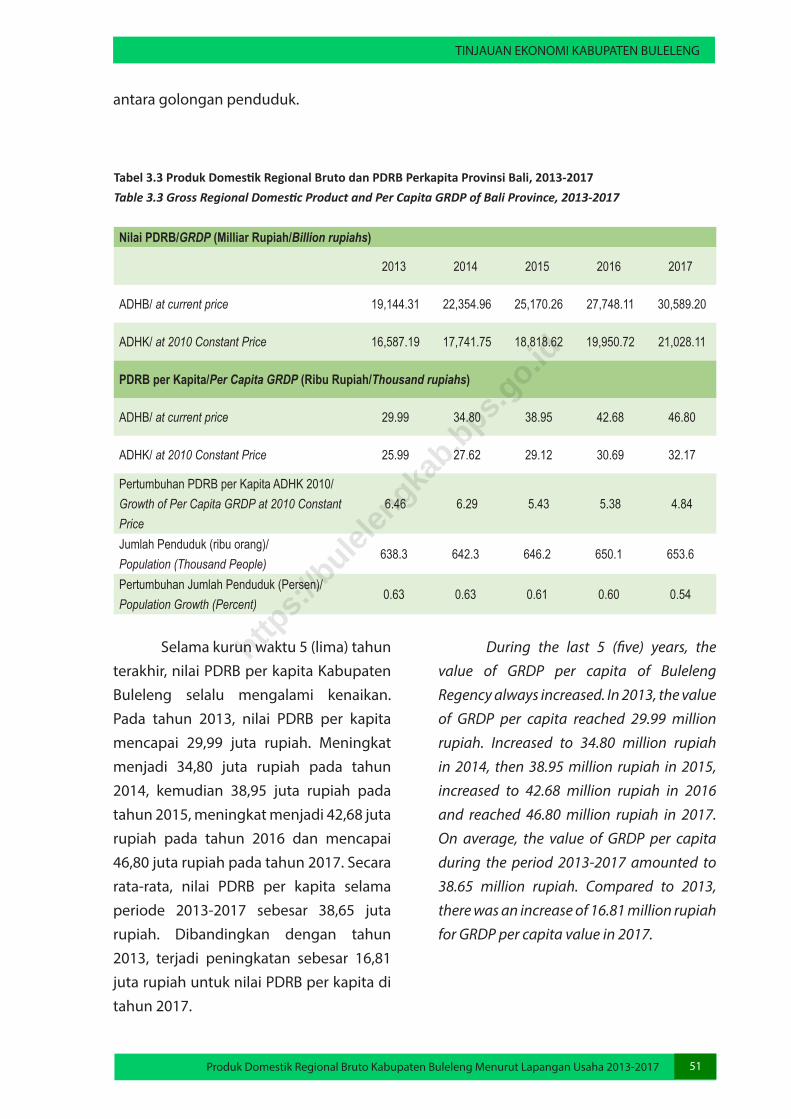
TINJAUAN EKONOMI KABUPATEN BULELENG
Produk Domestik Regional Bruto Kabupaten Buleleng Menurut Lapangan Usaha 2013-2017 51
Tabel 3.3 Produk Domestik Regional Bruto dan PDRB Perkapita Provinsi Bali, 2013-2017 Table 3.3 Gross Regional Domestic Product and Per Capita GRDP of Bali Province, 2013-2017
Nilai PDRB/GRDP (Milliar Rupiah/Billion rupiahs)
2013 2014 2015 2016 2017
ADHB/ at current price 19,144.31 22,354.96 25,170.26 27,748.11 30,589.20
ADHK/ at 2010 Constant Price 16,587.19 17,741.75 18,818.62 19,950.72 21,028.11
PDRB per Kapita/Per Capita GRDP (Ribu Rupiah/Thousand rupiahs)
ADHB/ at current price 29.99 34.80 38.95 42.68 46.80
ADHK/ at 2010 Constant Price 25.99 27.62 29.12 30.69 32.17
Pertumbuhan PDRB per Kapita ADHK 2010/ Growth of Per Capita GRDP at 2010 Constant Price
6.46 6.29 5.43 5.38 4.84
Jumlah Penduduk (ribu orang)/ Population (Thousand People)
638.3 642.3 646.2 650.1 653.6
Pertumbuhan Jumlah Penduduk (Persen)/ Population Growth (Percent)
0.63 0.63 0.61 0.60 0.54
antara golongan penduduk.
Selama kurun waktu 5 (lima) tahun terakhir, nilai PDRB per kapita Kabupaten Buleleng selalu mengalami kenaikan. Pada tahun 2013, nilai PDRB per kapita mencapai 29,99 juta rupiah. Meningkat menjadi 34,80 juta rupiah pada tahun 2014, kemudian 38,95 juta rupiah pada tahun 2015, meningkat menjadi 42,68 juta rupiah pada tahun 2016 dan mencapai 46,80 juta rupiah pada tahun 2017. Secara rata-rata, nilai PDRB per kapita selama periode 2013-2017 sebesar 38,65 juta rupiah. Dibandingkan dengan tahun 2013, terjadi peningkatan sebesar 16,81 juta rupiah untuk nilai PDRB per kapita di tahun 2017.
During the last 5 (five) years, the value of GRDP per capita of Buleleng Regency always increased. In 2013, the value of GRDP per capita reached 29.99 million rupiah. Increased to 34.80 million rupiah in 2014, then 38.95 million rupiah in 2015, increased to 42.68 million rupiah in 2016 and reached 46.80 million rupiah in 2017. On average, the value of GRDP per capita during the period 2013-2017 amounted to 38.65 million rupiah. Compared to 2013, there was an increase of 16.81 million rupiah for GRDP per capita value in 2017.
https:
//bulel
engka
b.bps.g
o.id

https:
//bulel
engka
b.bps.g
o.id
https:
//bulel
engka
b.bps.g
o.id

https:
//bulel
engka
b.bps.g
o.id

PERKEMBANGAN PDRB MENURUT LAPANGAN USAHA
Produk Domestik Regional Bruto Kabupaten Buleleng Menurut Lapangan Usaha 2013-2017 55
BAB IV PERKEMBANGAN PDRB
MENURUT LAPANGAN USAHA Produk Domestik Regional Bruto menurut lapangan usaha dirinci menjadi 17 kategori. Berikut uraian perkembangan di setiap lapangan usaha periode 2013-2017.
4.1 Pertanian, Kehutanan, dan Perikanan Pada tahun 2017, total nilai tambah yang tercipta dari lapangan usaha Pertanian, Kehutanan, dan Perikanan pada tahun 2017 di Kabupaten Buleleng adalah sebesar 6,78 triliun rupiah atau dengan kata lain memberikan kontribusi terhadap PDRB Kabupaten Buleleng sebesar 22,17 persen. Nilai ini cenderung mengalami penurunan dibandingkan dengan tahun sebelumnya yang memberikan kontribusi sebesar 22,60 persen. Secara rata-rata, kontribusi lapangan usaha Pertanian, Kehutanan, dan Perikanan selama kurun waktu 2013-2017 mencapai 22,43 persen. Pada tahun 2017, PDRB atas dasar harga konstan kategori Pertanian, Kehutanan dan perikanan tercatat sebesar 19,85 triliun rupiah pada tahun 2017. Selama periode 2013-2017, kategori ini selalu tumbuh positif yaitu sebesar 2,85 persen pada tahun 2013, menjadi 3,18 persen pada tahun 2016 dan sebesar 3,06 persen pada tahun 2017. Secara rata-rata Lapangan Usaha Pertanian, Kehutanan, dan Perikanan mencatat pertumbuhan 3,81 persen pada selama tahun 2013-2017.
CHAPTER IVGRDP DEVELOPMENT
BY INDUSTRY
Gross Regional Domestic Product by industry specified into 17 industries. The development in industry period 2013-2017 described below.
4.1 Agriculture, Forestry, and Fishery In 2017, the total value added created from Agriculture, Forestry and Fishery field in 2017 in Buleleng Regency amounted to 6.78 trillion rupiah or in other words contributed to Buleleng Regency GRDP by 22.17 percent. This value tends to decrease compared to the previous year which contributed 22.60 percent. On average, the contribution of agriculture, forestry and fishery business field during the period of 2013-2017 reached 22.43 percent. In total, Agricultural, Forestry and Fishery Businesses recorded growth of 3.81 percent in 2017.
In 2017, GRDP at constant prices of Agriculture, Forestry and Fisheries category stood at 19.85 trillion rupiah in 2017. During the period 2013-2017, this category always grew positive by 2.85 percent in 2013, to 3, 18 percent by 2016 and by 3.06 percent by 2017. On average, Agriculture, Forestry and Fishery Businesses recorded a growth of 3.81 percent during 2013-2017.
https:
//bulel
engka
b.bps.g
o.id
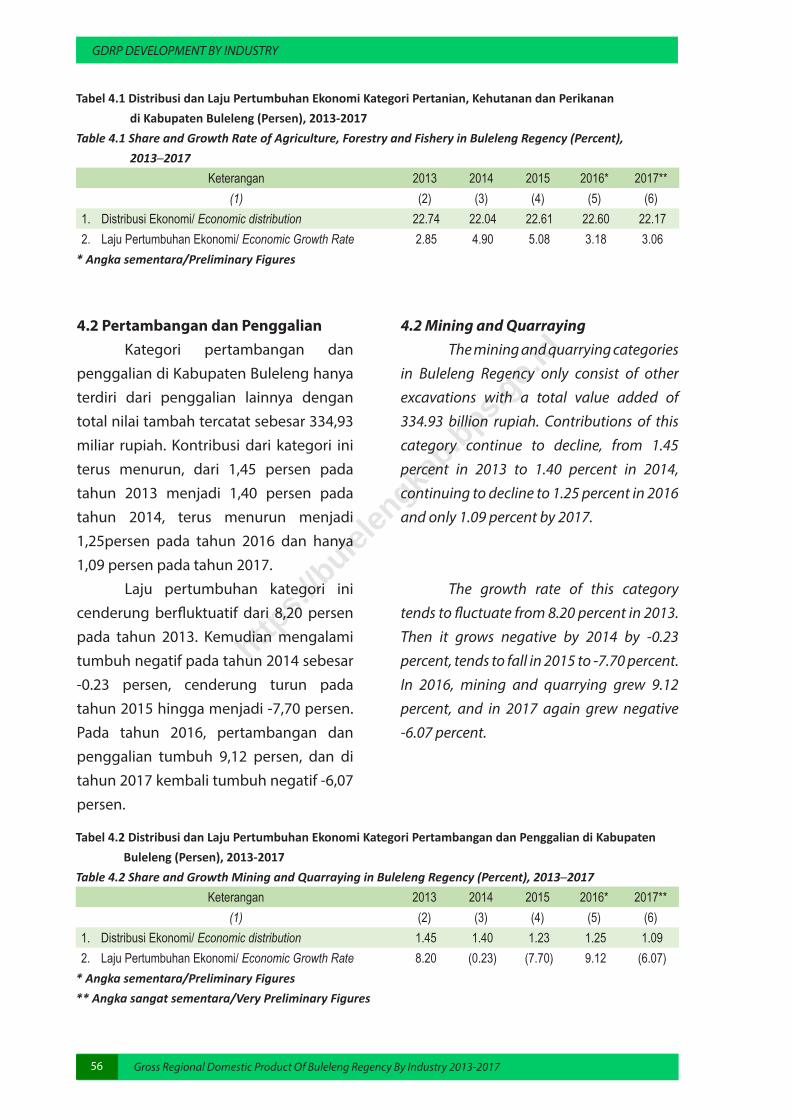
GDRP DEVELOPMENT BY INDUSTRY
Gross Regional Domestic Product Of Buleleng Regency By Industry 2013-201756
4.2 Pertambangan dan Penggalian Kategori pertambangan dan penggalian di Kabupaten Buleleng hanya terdiri dari penggalian lainnya dengan total nilai tambah tercatat sebesar 334,93 miliar rupiah. Kontribusi dari kategori ini terus menurun, dari 1,45 persen pada tahun 2013 menjadi 1,40 persen pada tahun 2014, terus menurun menjadi 1,25persen pada tahun 2016 dan hanya 1,09 persen pada tahun 2017. Laju pertumbuhan kategori ini cenderung berfluktuatif dari 8,20 persen pada tahun 2013. Kemudian mengalami tumbuh negatif pada tahun 2014 sebesar -0.23 persen, cenderung turun pada tahun 2015 hingga menjadi -7,70 persen. Pada tahun 2016, pertambangan dan penggalian tumbuh 9,12 persen, dan di tahun 2017 kembali tumbuh negatif -6,07 persen.
4.2 Mining and Quarraying The mining and quarrying categories in Buleleng Regency only consist of other excavations with a total value added of 334.93 billion rupiah. Contributions of this category continue to decline, from 1.45 percent in 2013 to 1.40 percent in 2014, continuing to decline to 1.25 percent in 2016 and only 1.09 percent by 2017.
The growth rate of this category tends to fluctuate from 8.20 percent in 2013. Then it grows negative by 2014 by -0.23 percent, tends to fall in 2015 to -7.70 percent. In 2016, mining and quarrying grew 9.12 percent, and in 2017 again grew negative -6.07 percent.
Tabel 4.1 Distribusi dan Laju Pertumbuhan Ekonomi Kategori Pertanian, Kehutanan dan Perikanan di Kabupaten Buleleng (Persen), 2013-2017Table 4.1 Share and Growth Rate of Agriculture, Forestry and Fishery in Buleleng Regency (Percent), 2013─2017
Keterangan 2013 2014 2015 2016* 2017**(1) (2) (3) (4) (5) (6)
1. Distribusi Ekonomi/ Economic distribution 22.74 22.04 22.61 22.60 22.17 2. Laju Pertumbuhan Ekonomi/ Economic Growth Rate 2.85 4.90 5.08 3.18 3.06
* Angka sementara/Preliminary Figures
Tabel 4.2 Distribusi dan Laju Pertumbuhan Ekonomi Kategori Pertambangan dan Penggalian di Kabupaten Buleleng (Persen), 2013-2017Table 4.2 Share and Growth Mining and Quarraying in Buleleng Regency (Percent), 2013─2017
Keterangan 2013 2014 2015 2016* 2017**(1) (2) (3) (4) (5) (6)
1. Distribusi Ekonomi/ Economic distribution 1.45 1.40 1.23 1.25 1.09 2. Laju Pertumbuhan Ekonomi/ Economic Growth Rate 8.20 (0.23) (7.70) 9.12 (6.07)
* Angka sementara/Preliminary Figures** Angka sangat sementara/Very Preliminary Figures
https:
//bulel
engka
b.bps.g
o.id
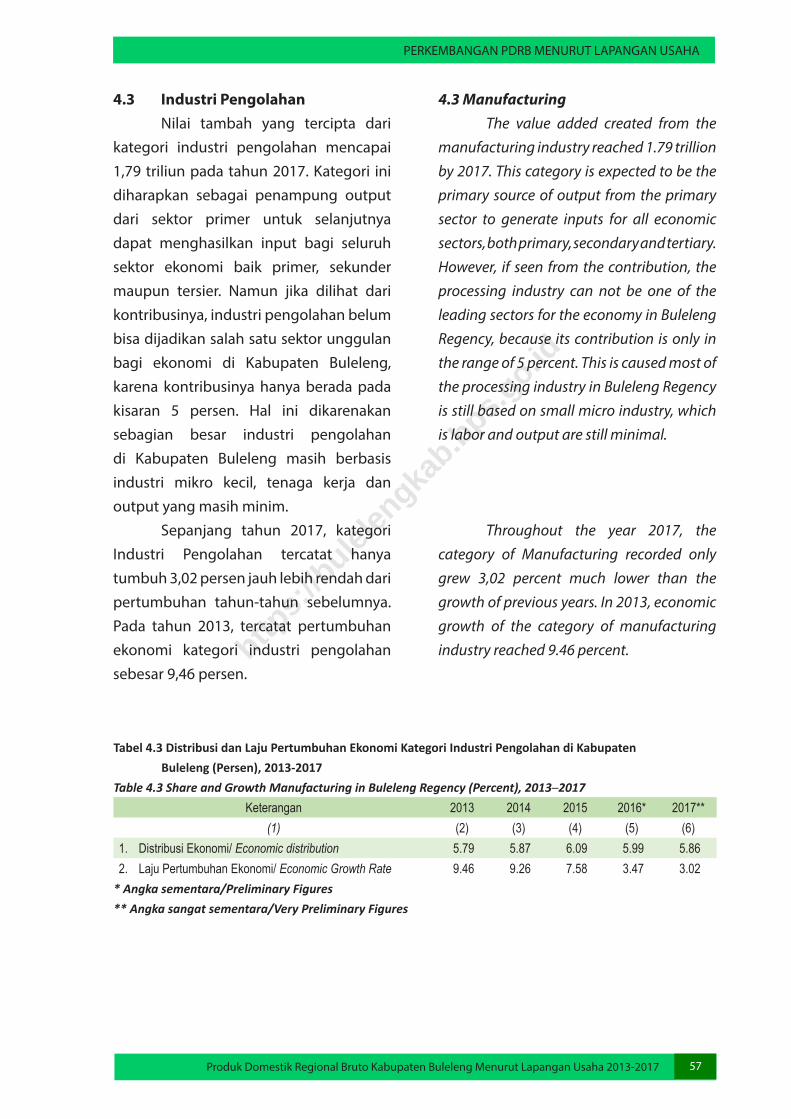
PERKEMBANGAN PDRB MENURUT LAPANGAN USAHA
Produk Domestik Regional Bruto Kabupaten Buleleng Menurut Lapangan Usaha 2013-2017 57
4.3 Industri Pengolahan Nilai tambah yang tercipta dari kategori industri pengolahan mencapai 1,79 triliun pada tahun 2017. Kategori ini diharapkan sebagai penampung output dari sektor primer untuk selanjutnya dapat menghasilkan input bagi seluruh sektor ekonomi baik primer, sekunder maupun tersier. Namun jika dilihat dari kontribusinya, industri pengolahan belum bisa dijadikan salah satu sektor unggulan bagi ekonomi di Kabupaten Buleleng, karena kontribusinya hanya berada pada kisaran 5 persen. Hal ini dikarenakan sebagian besar industri pengolahan di Kabupaten Buleleng masih berbasis industri mikro kecil, tenaga kerja dan output yang masih minim. Sepanjang tahun 2017, kategori Industri Pengolahan tercatat hanya tumbuh 3,02 persen jauh lebih rendah dari pertumbuhan tahun-tahun sebelumnya. Pada tahun 2013, tercatat pertumbuhan ekonomi kategori industri pengolahan sebesar 9,46 persen.
4.3 Manufacturing The value added created from the manufacturing industry reached 1.79 trillion by 2017. This category is expected to be the primary source of output from the primary sector to generate inputs for all economic sectors, both primary, secondary and tertiary. However, if seen from the contribution, the processing industry can not be one of the leading sectors for the economy in Buleleng Regency, because its contribution is only in the range of 5 percent. This is caused most of the processing industry in Buleleng Regency is still based on small micro industry, which is labor and output are still minimal.
Throughout the year 2017, the category of Manufacturing recorded only grew 3,02 percent much lower than the growth of previous years. In 2013, economic growth of the category of manufacturing industry reached 9.46 percent.
Tabel 4.3 Distribusi dan Laju Pertumbuhan Ekonomi Kategori Industri Pengolahan di Kabupaten Buleleng (Persen), 2013-2017Table 4.3 Share and Growth Manufacturing in Buleleng Regency (Percent), 2013─2017
Keterangan 2013 2014 2015 2016* 2017**(1) (2) (3) (4) (5) (6)
1. Distribusi Ekonomi/ Economic distribution 5.79 5.87 6.09 5.99 5.86 2. Laju Pertumbuhan Ekonomi/ Economic Growth Rate 9.46 9.26 7.58 3.47 3.02
* Angka sementara/Preliminary Figures** Angka sangat sementara/Very Preliminary Figures
https:
//bulel
engka
b.bps.g
o.id
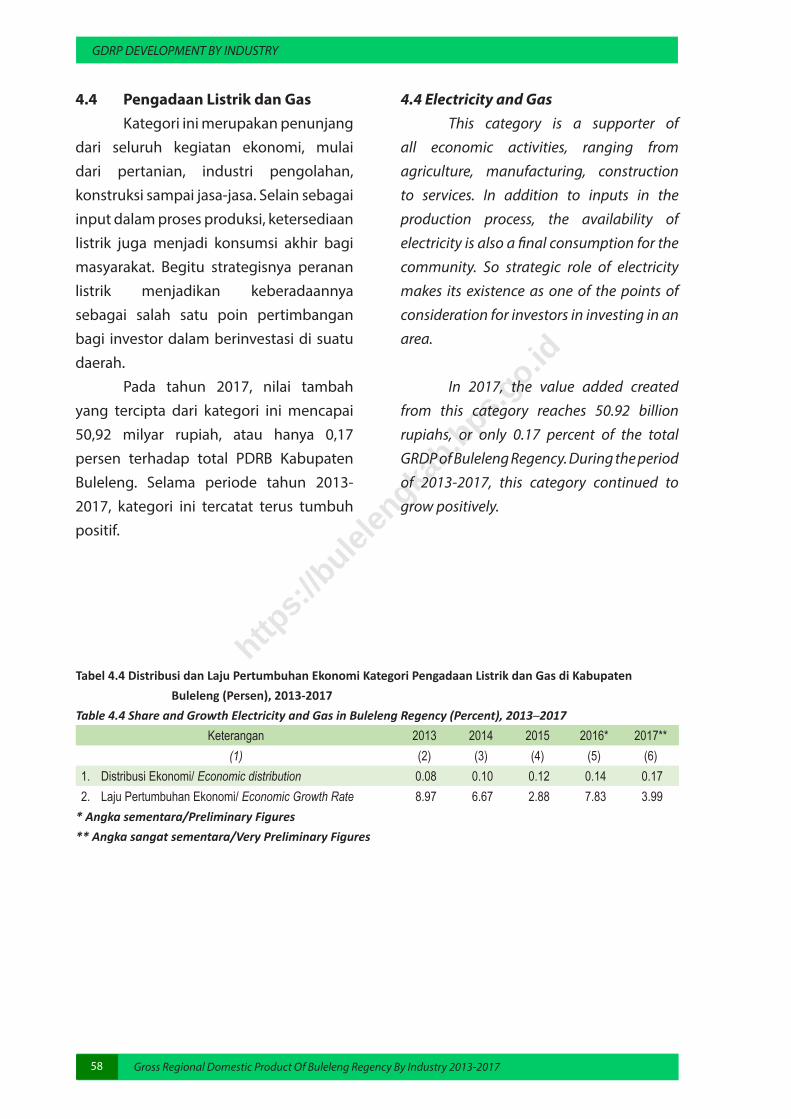
GDRP DEVELOPMENT BY INDUSTRY
Gross Regional Domestic Product Of Buleleng Regency By Industry 2013-201758
4.4 Electricity and Gas This category is a supporter of all economic activities, ranging from agriculture, manufacturing, construction to services. In addition to inputs in the production process, the availability of electricity is also a final consumption for the community. So strategic role of electricity makes its existence as one of the points of consideration for investors in investing in an area.
In 2017, the value added created from this category reaches 50.92 billion rupiahs, or only 0.17 percent of the total GRDP of Buleleng Regency. During the period of 2013-2017, this category continued to grow positively.
4.4 Pengadaan Listrik dan Gas Kategori ini merupakan penunjang dari seluruh kegiatan ekonomi, mulai dari pertanian, industri pengolahan, konstruksi sampai jasa-jasa. Selain sebagai input dalam proses produksi, ketersediaan listrik juga menjadi konsumsi akhir bagi masyarakat. Begitu strategisnya peranan listrik menjadikan keberadaannya sebagai salah satu poin pertimbangan bagi investor dalam berinvestasi di suatu daerah. Pada tahun 2017, nilai tambah yang tercipta dari kategori ini mencapai 50,92 milyar rupiah, atau hanya 0,17 persen terhadap total PDRB Kabupaten Buleleng. Selama periode tahun 2013-2017, kategori ini tercatat terus tumbuh positif.
Tabel 4.4 Distribusi dan Laju Pertumbuhan Ekonomi Kategori Pengadaan Listrik dan Gas di Kabupaten Buleleng (Persen), 2013-2017Table 4.4 Share and Growth Electricity and Gas in Buleleng Regency (Percent), 2013─2017
Keterangan 2013 2014 2015 2016* 2017**(1) (2) (3) (4) (5) (6)
1. Distribusi Ekonomi/ Economic distribution 0.08 0.10 0.12 0.14 0.17 2. Laju Pertumbuhan Ekonomi/ Economic Growth Rate 8.97 6.67 2.88 7.83 3.99
* Angka sementara/Preliminary Figures** Angka sangat sementara/Very Preliminary Figures
https:
//bulel
engka
b.bps.g
o.id
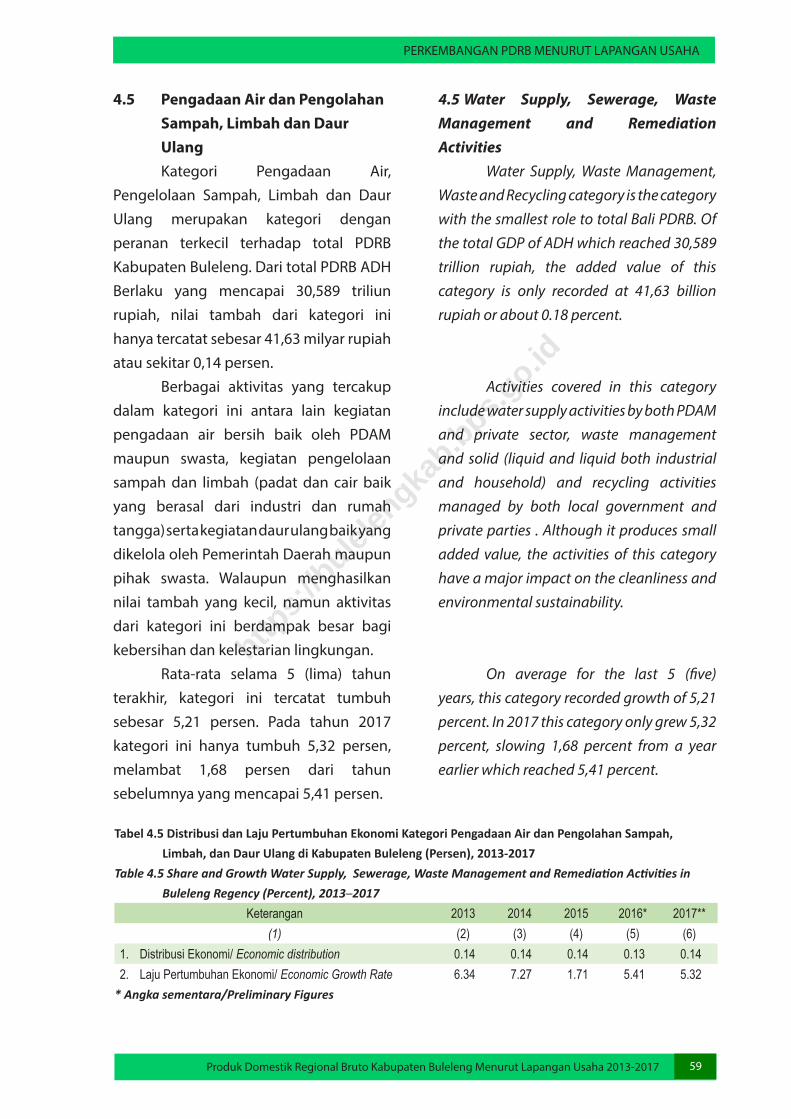
PERKEMBANGAN PDRB MENURUT LAPANGAN USAHA
Produk Domestik Regional Bruto Kabupaten Buleleng Menurut Lapangan Usaha 2013-2017 59
4.5 Pengadaan Air dan Pengolahan Sampah, Limbah dan Daur Ulang Kategori Pengadaan Air, Pengelolaan Sampah, Limbah dan Daur Ulang merupakan kategori dengan peranan terkecil terhadap total PDRB Kabupaten Buleleng. Dari total PDRB ADH Berlaku yang mencapai 30,589 triliun rupiah, nilai tambah dari kategori ini hanya tercatat sebesar 41,63 milyar rupiah atau sekitar 0,14 persen. Berbagai aktivitas yang tercakup dalam kategori ini antara lain kegiatan pengadaan air bersih baik oleh PDAM maupun swasta, kegiatan pengelolaan sampah dan limbah (padat dan cair baik yang berasal dari industri dan rumah tangga) serta kegiatan daur ulang baik yang dikelola oleh Pemerintah Daerah maupun pihak swasta. Walaupun menghasilkan nilai tambah yang kecil, namun aktivitas dari kategori ini berdampak besar bagi kebersihan dan kelestarian lingkungan. Rata-rata selama 5 (lima) tahun terakhir, kategori ini tercatat tumbuh sebesar 5,21 persen. Pada tahun 2017 kategori ini hanya tumbuh 5,32 persen, melambat 1,68 persen dari tahun sebelumnya yang mencapai 5,41 persen.
4.5 Water Supply, Sewerage, Waste Management and Remediation Activities Water Supply, Waste Management, Waste and Recycling category is the category with the smallest role to total Bali PDRB. Of the total GDP of ADH which reached 30,589 trillion rupiah, the added value of this category is only recorded at 41,63 billion rupiah or about 0.18 percent.
Activities covered in this category include water supply activities by both PDAM and private sector, waste management and solid (liquid and liquid both industrial and household) and recycling activities managed by both local government and private parties . Although it produces small added value, the activities of this category have a major impact on the cleanliness and environmental sustainability.
On average for the last 5 (five) years, this category recorded growth of 5,21 percent. In 2017 this category only grew 5,32 percent, slowing 1,68 percent from a year earlier which reached 5,41 percent.
Tabel 4.5 Distribusi dan Laju Pertumbuhan Ekonomi Kategori Pengadaan Air dan Pengolahan Sampah, Limbah, dan Daur Ulang di Kabupaten Buleleng (Persen), 2013-2017Table 4.5 Share and Growth Water Supply, Sewerage, Waste Management and Remediation Activities in Buleleng Regency (Percent), 2013─2017
Keterangan 2013 2014 2015 2016* 2017**(1) (2) (3) (4) (5) (6)
1. Distribusi Ekonomi/ Economic distribution 0.14 0.14 0.14 0.13 0.14 2. Laju Pertumbuhan Ekonomi/ Economic Growth Rate 6.34 7.27 1.71 5.41 5.32
* Angka sementara/Preliminary Figures
https:
//bulel
engka
b.bps.g
o.id
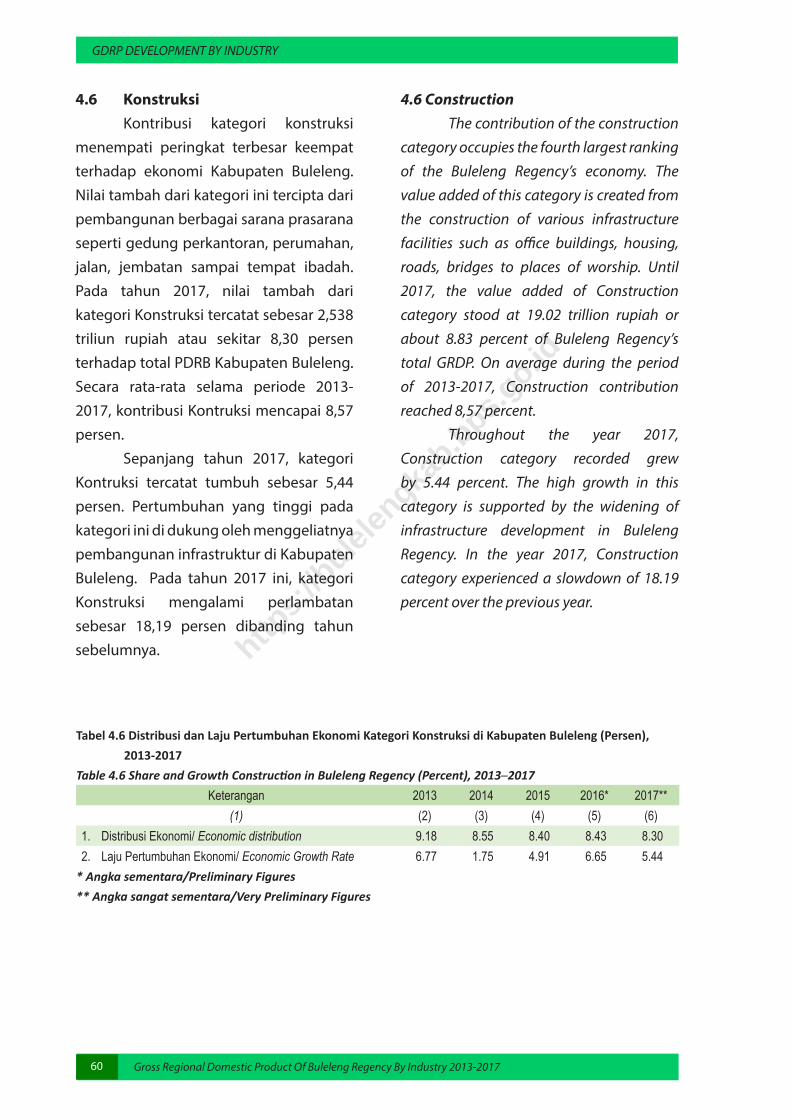
GDRP DEVELOPMENT BY INDUSTRY
Gross Regional Domestic Product Of Buleleng Regency By Industry 2013-201760
4.6 Konstruksi Kontribusi kategori konstruksi menempati peringkat terbesar keempat terhadap ekonomi Kabupaten Buleleng. Nilai tambah dari kategori ini tercipta dari pembangunan berbagai sarana prasarana seperti gedung perkantoran, perumahan, jalan, jembatan sampai tempat ibadah. Pada tahun 2017, nilai tambah dari kategori Konstruksi tercatat sebesar 2,538 triliun rupiah atau sekitar 8,30 persen terhadap total PDRB Kabupaten Buleleng. Secara rata-rata selama periode 2013-2017, kontribusi Kontruksi mencapai 8,57 persen. Sepanjang tahun 2017, kategori Kontruksi tercatat tumbuh sebesar 5,44 persen. Pertumbuhan yang tinggi pada kategori ini di dukung oleh menggeliatnya pembangunan infrastruktur di Kabupaten Buleleng. Pada tahun 2017 ini, kategori Konstruksi mengalami perlambatan sebesar 18,19 persen dibanding tahun sebelumnya.
4.6 Construction The contribution of the construction category occupies the fourth largest ranking of the Buleleng Regency’s economy. The value added of this category is created from the construction of various infrastructure facilities such as office buildings, housing, roads, bridges to places of worship. Until 2017, the value added of Construction category stood at 19.02 trillion rupiah or about 8.83 percent of Buleleng Regency’s total GRDP. On average during the period of 2013-2017, Construction contribution reached 8,57 percent. Throughout the year 2017, Construction category recorded grew by 5.44 percent. The high growth in this category is supported by the widening of infrastructure development in Buleleng Regency. In the year 2017, Construction category experienced a slowdown of 18.19 percent over the previous year.
Tabel 4.6 Distribusi dan Laju Pertumbuhan Ekonomi Kategori Konstruksi di Kabupaten Buleleng (Persen), 2013-2017Table 4.6 Share and Growth Construction in Buleleng Regency (Percent), 2013─2017
Keterangan 2013 2014 2015 2016* 2017**(1) (2) (3) (4) (5) (6)
1. Distribusi Ekonomi/ Economic distribution 9.18 8.55 8.40 8.43 8.30 2. Laju Pertumbuhan Ekonomi/ Economic Growth Rate 6.77 1.75 4.91 6.65 5.44
* Angka sementara/Preliminary Figures** Angka sangat sementara/Very Preliminary Figures
https:
//bulel
engka
b.bps.g
o.id
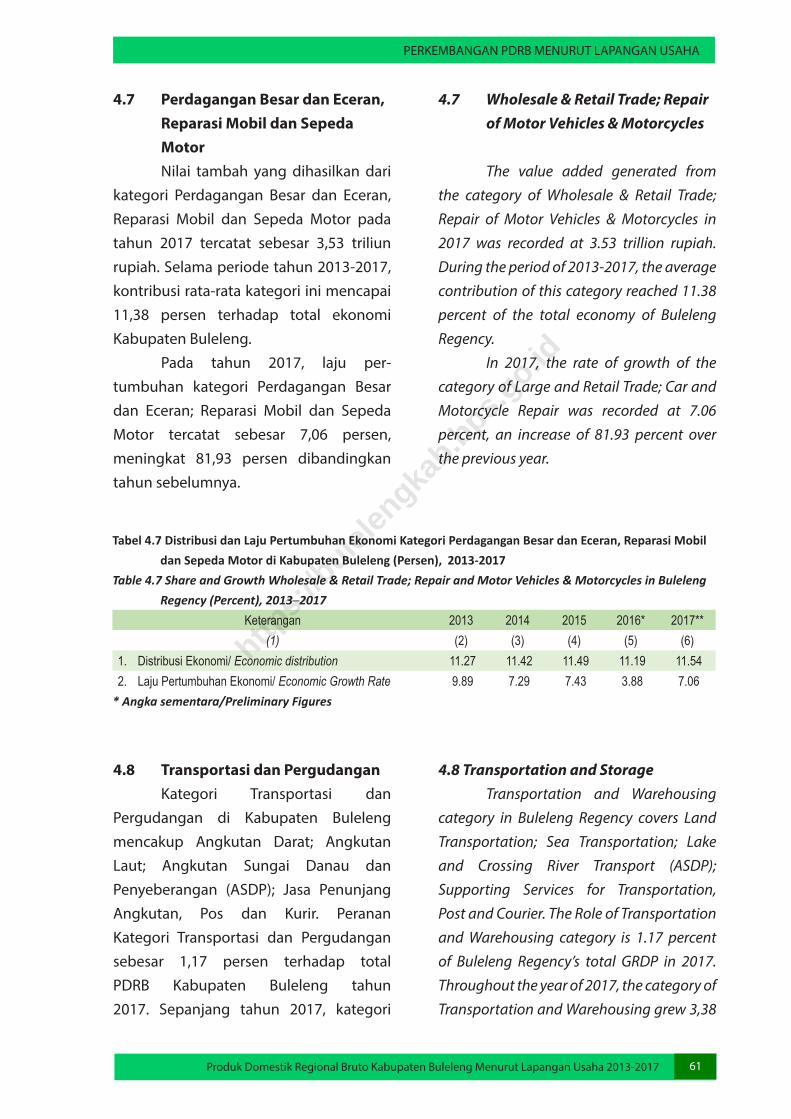
PERKEMBANGAN PDRB MENURUT LAPANGAN USAHA
Produk Domestik Regional Bruto Kabupaten Buleleng Menurut Lapangan Usaha 2013-2017 61
4.7 Wholesale & Retail Trade; Repair of Motor Vehicles & Motorcycles
The value added generated from the category of Wholesale & Retail Trade; Repair of Motor Vehicles & Motorcycles in 2017 was recorded at 3.53 trillion rupiah. During the period of 2013-2017, the average contribution of this category reached 11.38 percent of the total economy of Buleleng Regency. In 2017, the rate of growth of the category of Large and Retail Trade; Car and Motorcycle Repair was recorded at 7.06 percent, an increase of 81.93 percent over the previous year.
4.7 Perdagangan Besar dan Eceran, Reparasi Mobil dan Sepeda Motor Nilai tambah yang dihasilkan dari kategori Perdagangan Besar dan Eceran, Reparasi Mobil dan Sepeda Motor pada tahun 2017 tercatat sebesar 3,53 triliun rupiah. Selama periode tahun 2013-2017, kontribusi rata-rata kategori ini mencapai 11,38 persen terhadap total ekonomi Kabupaten Buleleng. Pada tahun 2017, laju per-tumbuhan kategori Perdagangan Besar dan Eceran; Reparasi Mobil dan Sepeda Motor tercatat sebesar 7,06 persen, meningkat 81,93 persen dibandingkan tahun sebelumnya.
Tabel 4.7 Distribusi dan Laju Pertumbuhan Ekonomi Kategori Perdagangan Besar dan Eceran, Reparasi Mobil dan Sepeda Motor di Kabupaten Buleleng (Persen), 2013-2017Table 4.7 Share and Growth Wholesale & Retail Trade; Repair and Motor Vehicles & Motorcycles in Buleleng Regency (Percent), 2013─2017
Keterangan 2013 2014 2015 2016* 2017**(1) (2) (3) (4) (5) (6)
1. Distribusi Ekonomi/ Economic distribution 11.27 11.42 11.49 11.19 11.54 2. Laju Pertumbuhan Ekonomi/ Economic Growth Rate 9.89 7.29 7.43 3.88 7.06
* Angka sementara/Preliminary Figures
4.8 Transportasi dan Pergudangan Kategori Transportasi dan Pergudangan di Kabupaten Buleleng mencakup Angkutan Darat; Angkutan Laut; Angkutan Sungai Danau dan Penyeberangan (ASDP); Jasa Penunjang Angkutan, Pos dan Kurir. Peranan Kategori Transportasi dan Pergudangan sebesar 1,17 persen terhadap total PDRB Kabupaten Buleleng tahun 2017. Sepanjang tahun 2017, kategori
4.8 Transportation and Storage Transportation and Warehousing category in Buleleng Regency covers Land Transportation; Sea Transportation; Lake and Crossing River Transport (ASDP); Supporting Services for Transportation, Post and Courier. The Role of Transportation and Warehousing category is 1.17 percent of Buleleng Regency’s total GRDP in 2017. Throughout the year of 2017, the category of Transportation and Warehousing grew 3,38
https:
//bulel
engka
b.bps.g
o.id
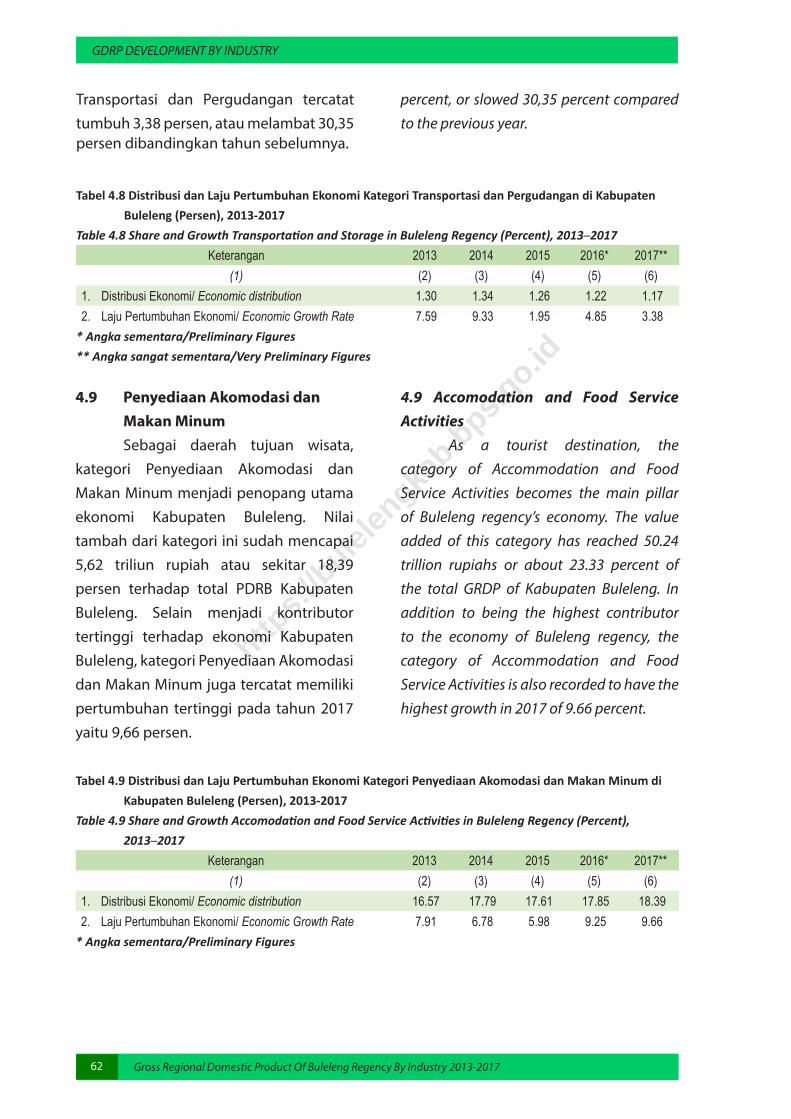
GDRP DEVELOPMENT BY INDUSTRY
Gross Regional Domestic Product Of Buleleng Regency By Industry 2013-201762
Transportasi dan Pergudangan tercatat tumbuh 3,38 persen, atau melambat 30,35 persen dibandingkan tahun sebelumnya.
percent, or slowed 30,35 percent compared to the previous year.
Tabel 4.8 Distribusi dan Laju Pertumbuhan Ekonomi Kategori Transportasi dan Pergudangan di Kabupaten Buleleng (Persen), 2013-2017Table 4.8 Share and Growth Transportation and Storage in Buleleng Regency (Percent), 2013─2017
Keterangan 2013 2014 2015 2016* 2017**(1) (2) (3) (4) (5) (6)
1. Distribusi Ekonomi/ Economic distribution 1.30 1.34 1.26 1.22 1.17 2. Laju Pertumbuhan Ekonomi/ Economic Growth Rate 7.59 9.33 1.95 4.85 3.38
* Angka sementara/Preliminary Figures** Angka sangat sementara/Very Preliminary Figures
4.9 Penyediaan Akomodasi dan Makan Minum Sebagai daerah tujuan wisata, kategori Penyediaan Akomodasi dan Makan Minum menjadi penopang utama ekonomi Kabupaten Buleleng. Nilai tambah dari kategori ini sudah mencapai 5,62 triliun rupiah atau sekitar 18,39 persen terhadap total PDRB Kabupaten Buleleng. Selain menjadi kontributor tertinggi terhadap ekonomi Kabupaten Buleleng, kategori Penyediaan Akomodasi dan Makan Minum juga tercatat memiliki pertumbuhan tertinggi pada tahun 2017 yaitu 9,66 persen.
4.9 Accomodation and Food Service Activities As a tourist destination, the category of Accommodation and Food Service Activities becomes the main pillar of Buleleng regency’s economy. The value added of this category has reached 50.24 trillion rupiahs or about 23.33 percent of the total GRDP of Kabupaten Buleleng. In addition to being the highest contributor to the economy of Buleleng regency, the category of Accommodation and Food Service Activities is also recorded to have the highest growth in 2017 of 9.66 percent.
Tabel 4.9 Distribusi dan Laju Pertumbuhan Ekonomi Kategori Penyediaan Akomodasi dan Makan Minum di Kabupaten Buleleng (Persen), 2013-2017Table 4.9 Share and Growth Accomodation and Food Service Activities in Buleleng Regency (Percent), 2013─2017
Keterangan 2013 2014 2015 2016* 2017**(1) (2) (3) (4) (5) (6)
1. Distribusi Ekonomi/ Economic distribution 16.57 17.79 17.61 17.85 18.39 2. Laju Pertumbuhan Ekonomi/ Economic Growth Rate 7.91 6.78 5.98 9.25 9.66
* Angka sementara/Preliminary Figures
https:
//bulel
engka
b.bps.g
o.id
PERKEMBANGAN PDRB MENURUT LAPANGAN USAHA
Produk Domestik Regional Bruto Kabupaten Buleleng Menurut Lapangan Usaha 2013-2017 63
4.10 Informasi dan Komunikasi Pesatnya perkembangan teknologi dan derasnya arus komunikasi di abad 20 ini, menjadikan peranan kategori Informasi dan Komunikasi menjadi demikian besar. Kebutuhan yang terus berkembang menjadikan para provider telekomunikasi semakin berlomba-lomba untuk memanjakan konsumen dengan sarana dan prasarana yang mumpuni. Selain telekomunikasi, kategori ini juga mencakup penyajian informasi melalui media elektronik (TV, Radio) serta penyiaran film di bioskop. Selama 5 (lima) tahun terakhir, peranan kategori Informasi dan Komunikasi tercatat pada kisaran 5 persen lebih atau secara rata-rata mencapai 5,28 persen. Pada tahun 2017, nilai tambah yang dihasilkan kategori ini mencapai 1,61 triliun rupiah. Laju pertumbuhan dari kategori Informasi dan Komunikasi menempati peringkat lima besar pada tahun 2017 yaitu sebesar 8,88 persen. Pada tahun 2013, Informasi dan Komunikasi hanya tumbuh 6,57 persen, meningkat menjadi 7,11 persen pada tahun 2014 dan mencapai pertumbuhan tertinggi sebesar 9,90 persen pada tahun 2015. Walaupun mengalami perlambatan selama 2 (dua) tahun terakhir, namun laju pertumbuhannya selalu menempati urutan ketiga tertinggi dibandingkan kategori lainnya.
4.10 Information and Communication The rapid development of technology and the rapid flow of communication in the 20th century, the role of the category of Information and Communication to be so great. The growing need to make telecommunication providers increasingly competing to pamper consumers with facilities and infrastructure that qualified. In addition to telecommunications, this category also includes the presentation of information through electronic media (TV, Radio) as well as broadcasting movies in theaters. Over the last 5 (five) years, the role of the Information and Communication category was recorded in the range of 5 percent more or an average of 5.28 percent. In 2017, the added value generated by this category reached 1,61 trillion rupiah. The growth rate of the Information and Communication category ranked third highest in 2017 at 8.88 percent. In 2013, Information and Communication grew only 6,57 percent, rising to 7.11 percent in 2014 and achieving the highest growth of 9.90 percent by 2015. Despite the slowdown over the past 2 years, always ranks third highest than any other category.
https:
//bulel
engka
b.bps.g
o.id

GDRP DEVELOPMENT BY INDUSTRY
Gross Regional Domestic Product Of Buleleng Regency By Industry 2013-201764
Tabel 4.10 Distribusi dan Laju Pertumbuhan Ekonomi Kategori Informasi dan Komunikasi di Kabupaten Buleleng (Persen), 2013-2017Table 4.10 Share and Growth Information and Communication in Buleleng Regency (Percent), 2013─2017
Keterangan 2013 2014 2015 2016* 2017**(1) (2) (3) (4) (5) (6)
1. Distribusi Ekonomi/ Economic distribution 5.38 5.17 5.23 5.29 5.30 2. Laju Pertumbuhan Ekonomi/ Economic Growth Rate 6.57 7.11 9.90 9.76 8.88
* Angka sementara/Preliminary Figures
4.11 Jasa Keuangan dan Asuransi Gambaran umum dari kondisi perekonomian suatu daerah dapat dilihat dari perkembangan kategori Jasa Keuangan dan Asuransi. Karena dari kategori ini, tercermin bagaimana posisi keuangan masyarakat yang secara tidak langsung menggambarkan aktivitas produksi dan konsumsinya. Secara total, peranan kategori ini terhadap ekonomi Kabupaten Buleleng tercatat sebesar 4,20 persen pada tahun 2017. Sementara laju pertumbuhan ekonomi kategori ini tercatat sebesar 2,85 persen.
4.11 Financial Services and Insurance An overview of the economic condition of a region can be seen from the development of the category of Financial Services and Insurance. Because of this category, reflected how the financial position of society that indirectly describes the activities of production and consumption.
Totally, the role of this category for the economy of Buleleng Regency is recorded at 4.20 percent in 2017. While the economic growth rate of this category was recorded at 2.85 percent.
Tabel 4.11 Distribusi dan Laju Pertumbuhan Ekonomi Kategori Informasi dan Komunikasi di Kabupaten Buleleng (Persen), 2013-2017Table 4.11 Share and Growth Information and Communication in Buleleng Regency (Percent), 2013─2017
Keterangan 2013 2014 2015 2016* 2017**(1) (2) (3) (4) (5) (6)
1. Distribusi Ekonomi/ Economic distribution 4.59 4.62 4.38 4.32 4.20 2. Laju Pertumbuhan Ekonomi/ Economic Growth Rate 14.35 9.66 3.66 6.55 2.85
* Angka sementara/Preliminary Figures
https:
//bulel
engka
b.bps.g
o.id
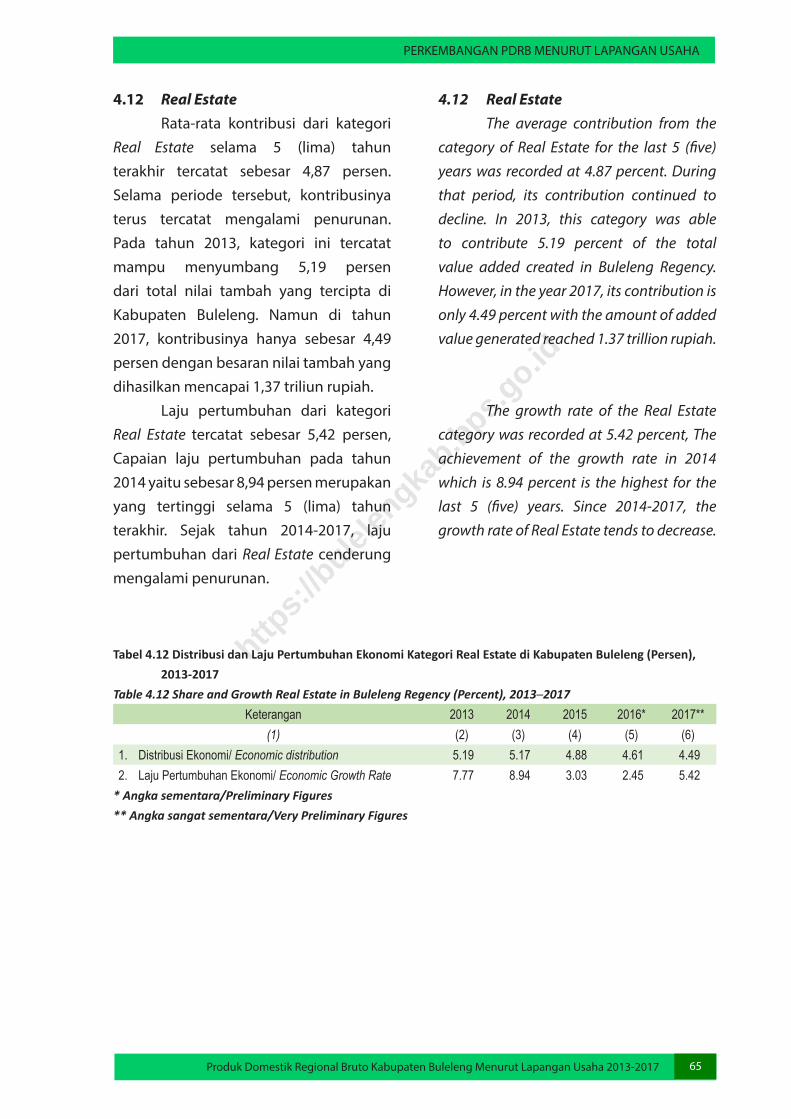
PERKEMBANGAN PDRB MENURUT LAPANGAN USAHA
Produk Domestik Regional Bruto Kabupaten Buleleng Menurut Lapangan Usaha 2013-2017 65
4.12 Real Estate Rata-rata kontribusi dari kategori Real Estate selama 5 (lima) tahun terakhir tercatat sebesar 4,87 persen. Selama periode tersebut, kontribusinya terus tercatat mengalami penurunan. Pada tahun 2013, kategori ini tercatat mampu menyumbang 5,19 persen dari total nilai tambah yang tercipta di Kabupaten Buleleng. Namun di tahun 2017, kontribusinya hanya sebesar 4,49 persen dengan besaran nilai tambah yang dihasilkan mencapai 1,37 triliun rupiah. Laju pertumbuhan dari kategori Real Estate tercatat sebesar 5,42 persen, Capaian laju pertumbuhan pada tahun 2014 yaitu sebesar 8,94 persen merupakan yang tertinggi selama 5 (lima) tahun terakhir. Sejak tahun 2014-2017, laju pertumbuhan dari Real Estate cenderung mengalami penurunan.
4.12 Real Estate The average contribution from the category of Real Estate for the last 5 (five) years was recorded at 4.87 percent. During that period, its contribution continued to decline. In 2013, this category was able to contribute 5.19 percent of the total value added created in Buleleng Regency. However, in the year 2017, its contribution is only 4.49 percent with the amount of added value generated reached 1.37 trillion rupiah.
The growth rate of the Real Estate category was recorded at 5.42 percent, The achievement of the growth rate in 2014 which is 8.94 percent is the highest for the last 5 (five) years. Since 2014-2017, the growth rate of Real Estate tends to decrease.
Tabel 4.12 Distribusi dan Laju Pertumbuhan Ekonomi Kategori Real Estate di Kabupaten Buleleng (Persen), 2013-2017Table 4.12 Share and Growth Real Estate in Buleleng Regency (Percent), 2013─2017
Keterangan 2013 2014 2015 2016* 2017**(1) (2) (3) (4) (5) (6)
1. Distribusi Ekonomi/ Economic distribution 5.19 5.17 4.88 4.61 4.49 2. Laju Pertumbuhan Ekonomi/ Economic Growth Rate 7.77 8.94 3.03 2.45 5.42
* Angka sementara/Preliminary Figures** Angka sangat sementara/Very Preliminary Figures
https:
//bulel
engka
b.bps.g
o.id
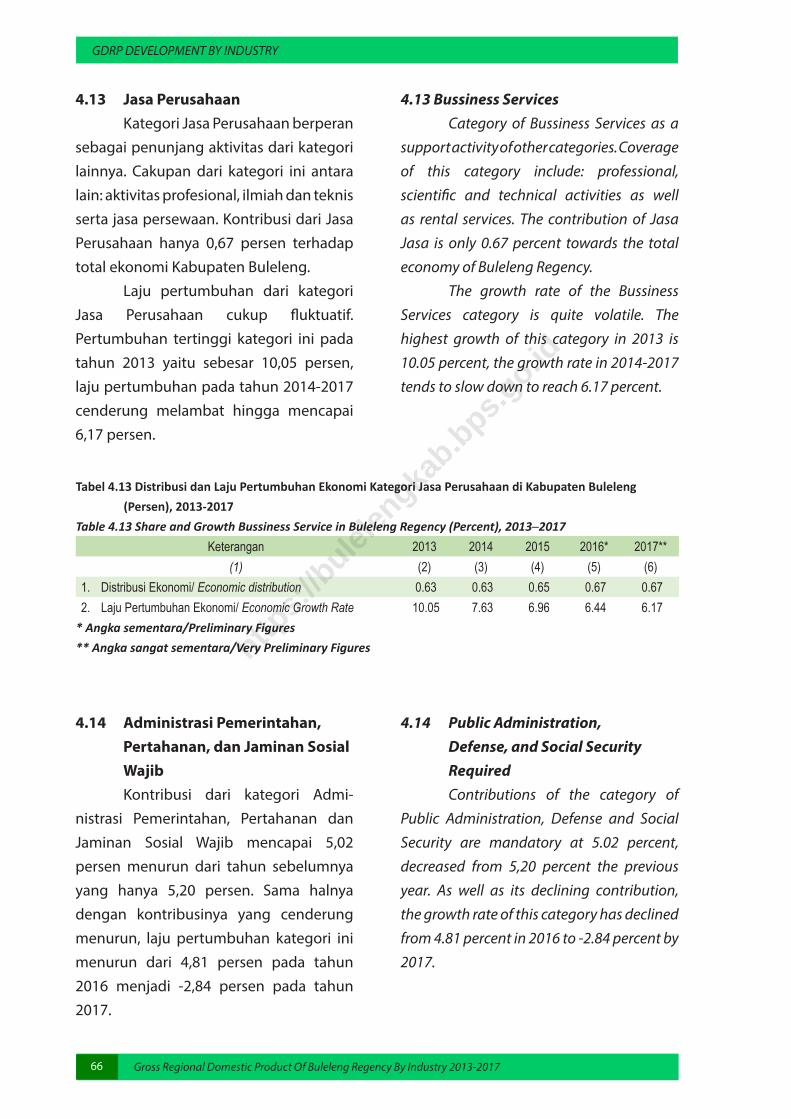
GDRP DEVELOPMENT BY INDUSTRY
Gross Regional Domestic Product Of Buleleng Regency By Industry 2013-201766
4.13 Jasa Perusahaan Kategori Jasa Perusahaan berperan sebagai penunjang aktivitas dari kategori lainnya. Cakupan dari kategori ini antara lain: aktivitas profesional, ilmiah dan teknis serta jasa persewaan. Kontribusi dari Jasa Perusahaan hanya 0,67 persen terhadap total ekonomi Kabupaten Buleleng. Laju pertumbuhan dari kategori Jasa Perusahaan cukup fluktuatif. Pertumbuhan tertinggi kategori ini pada tahun 2013 yaitu sebesar 10,05 persen, laju pertumbuhan pada tahun 2014-2017 cenderung melambat hingga mencapai 6,17 persen.
4.13 Bussiness Services Category of Bussiness Services as a support activity of other categories. Coverage of this category include: professional, scientific and technical activities as well as rental services. The contribution of Jasa Jasa is only 0.67 percent towards the total economy of Buleleng Regency. The growth rate of the Bussiness Services category is quite volatile. The highest growth of this category in 2013 is 10.05 percent, the growth rate in 2014-2017 tends to slow down to reach 6.17 percent.
Tabel 4.13 Distribusi dan Laju Pertumbuhan Ekonomi Kategori Jasa Perusahaan di Kabupaten Buleleng (Persen), 2013-2017Table 4.13 Share and Growth Bussiness Service in Buleleng Regency (Percent), 2013─2017
Keterangan 2013 2014 2015 2016* 2017**(1) (2) (3) (4) (5) (6)
1. Distribusi Ekonomi/ Economic distribution 0.63 0.63 0.65 0.67 0.67 2. Laju Pertumbuhan Ekonomi/ Economic Growth Rate 10.05 7.63 6.96 6.44 6.17
* Angka sementara/Preliminary Figures** Angka sangat sementara/Very Preliminary Figures
4.14 Administrasi Pemerintahan, Pertahanan, dan Jaminan Sosial Wajib Kontribusi dari kategori Admi-nistrasi Pemerintahan, Pertahanan dan Jaminan Sosial Wajib mencapai 5,02 persen menurun dari tahun sebelumnya yang hanya 5,20 persen. Sama halnya dengan kontribusinya yang cenderung menurun, laju pertumbuhan kategori ini menurun dari 4,81 persen pada tahun 2016 menjadi -2,84 persen pada tahun 2017.
4.14 Public Administration, Defense, and Social Security Required Contributions of the category of Public Administration, Defense and Social Security are mandatory at 5.02 percent, decreased from 5,20 percent the previous year. As well as its declining contribution, the growth rate of this category has declined from 4.81 percent in 2016 to -2.84 percent by 2017.
https:
//bulel
engka
b.bps.g
o.id
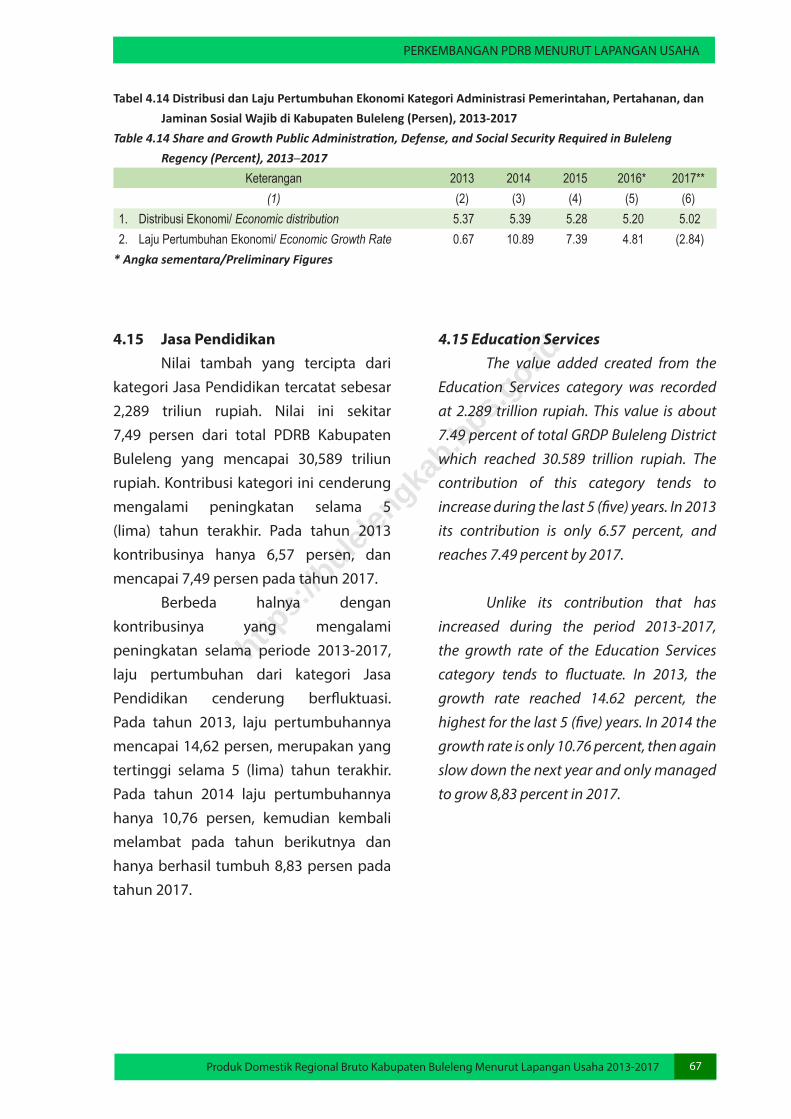
PERKEMBANGAN PDRB MENURUT LAPANGAN USAHA
Produk Domestik Regional Bruto Kabupaten Buleleng Menurut Lapangan Usaha 2013-2017 67
Tabel 4.14 Distribusi dan Laju Pertumbuhan Ekonomi Kategori Administrasi Pemerintahan, Pertahanan, dan Jaminan Sosial Wajib di Kabupaten Buleleng (Persen), 2013-2017Table 4.14 Share and Growth Public Administration, Defense, and Social Security Required in Buleleng Regency (Percent), 2013─2017
Keterangan 2013 2014 2015 2016* 2017**(1) (2) (3) (4) (5) (6)
1. Distribusi Ekonomi/ Economic distribution 5.37 5.39 5.28 5.20 5.02 2. Laju Pertumbuhan Ekonomi/ Economic Growth Rate 0.67 10.89 7.39 4.81 (2.84)
* Angka sementara/Preliminary Figures
4.15 Jasa Pendidikan Nilai tambah yang tercipta dari kategori Jasa Pendidikan tercatat sebesar 2,289 triliun rupiah. Nilai ini sekitar 7,49 persen dari total PDRB Kabupaten Buleleng yang mencapai 30,589 triliun rupiah. Kontribusi kategori ini cenderung mengalami peningkatan selama 5 (lima) tahun terakhir. Pada tahun 2013 kontribusinya hanya 6,57 persen, dan mencapai 7,49 persen pada tahun 2017. Berbeda halnya dengan kontribusinya yang mengalami peningkatan selama periode 2013-2017, laju pertumbuhan dari kategori Jasa Pendidikan cenderung berfluktuasi. Pada tahun 2013, laju pertumbuhannya mencapai 14,62 persen, merupakan yang tertinggi selama 5 (lima) tahun terakhir. Pada tahun 2014 laju pertumbuhannya hanya 10,76 persen, kemudian kembali melambat pada tahun berikutnya dan hanya berhasil tumbuh 8,83 persen pada tahun 2017.
4.15 Education Services The value added created from the Education Services category was recorded at 2.289 trillion rupiah. This value is about 7.49 percent of total GRDP Buleleng District which reached 30.589 trillion rupiah. The contribution of this category tends to increase during the last 5 (five) years. In 2013 its contribution is only 6.57 percent, and reaches 7.49 percent by 2017. Unlike its contribution that has increased during the period 2013-2017, the growth rate of the Education Services category tends to fluctuate. In 2013, the growth rate reached 14.62 percent, the highest for the last 5 (five) years. In 2014 the growth rate is only 10.76 percent, then again slow down the next year and only managed to grow 8,83 percent in 2017.
https:
//bulel
engka
b.bps.g
o.id
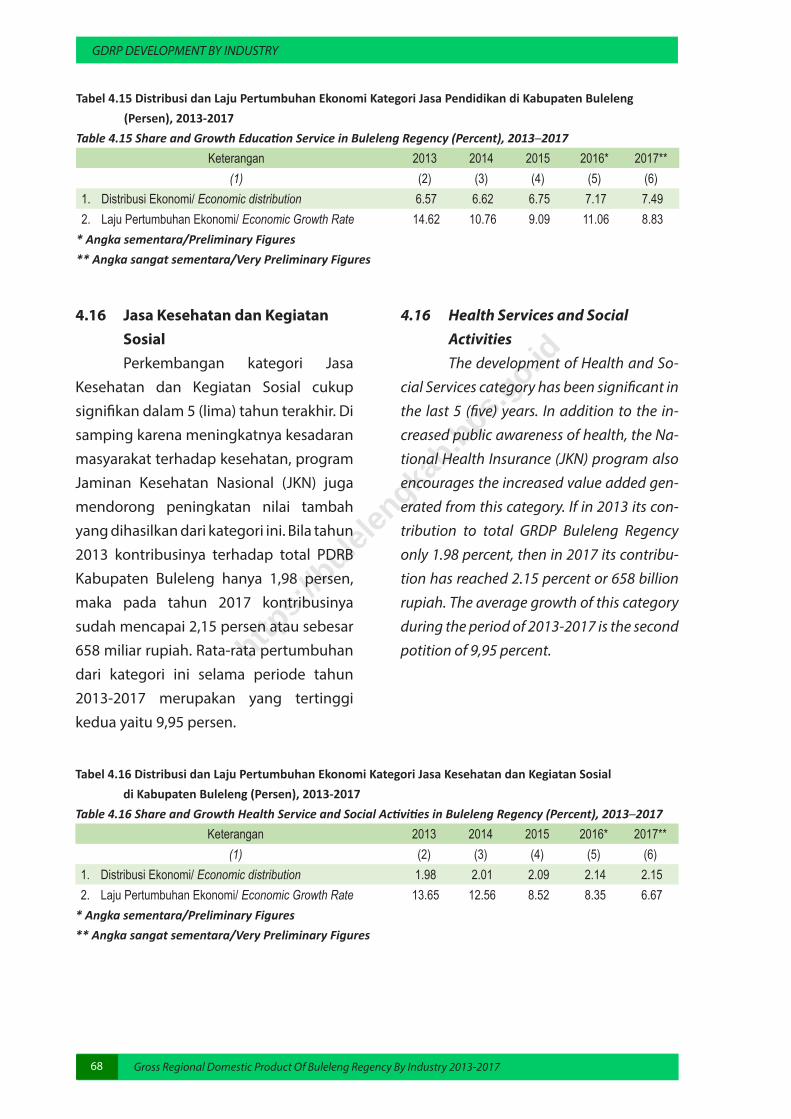
GDRP DEVELOPMENT BY INDUSTRY
Gross Regional Domestic Product Of Buleleng Regency By Industry 2013-201768
Tabel 4.15 Distribusi dan Laju Pertumbuhan Ekonomi Kategori Jasa Pendidikan di Kabupaten Buleleng (Persen), 2013-2017Table 4.15 Share and Growth Education Service in Buleleng Regency (Percent), 2013─2017
Keterangan 2013 2014 2015 2016* 2017**(1) (2) (3) (4) (5) (6)
1. Distribusi Ekonomi/ Economic distribution 6.57 6.62 6.75 7.17 7.49 2. Laju Pertumbuhan Ekonomi/ Economic Growth Rate 14.62 10.76 9.09 11.06 8.83
* Angka sementara/Preliminary Figures** Angka sangat sementara/Very Preliminary Figures
4.16 Jasa Kesehatan dan Kegiatan Sosial Perkembangan kategori Jasa Kesehatan dan Kegiatan Sosial cukup signifikan dalam 5 (lima) tahun terakhir. Di samping karena meningkatnya kesadaran masyarakat terhadap kesehatan, program Jaminan Kesehatan Nasional (JKN) juga mendorong peningkatan nilai tambah yang dihasilkan dari kategori ini. Bila tahun 2013 kontribusinya terhadap total PDRB Kabupaten Buleleng hanya 1,98 persen, maka pada tahun 2017 kontribusinya sudah mencapai 2,15 persen atau sebesar 658 miliar rupiah. Rata-rata pertumbuhan dari kategori ini selama periode tahun 2013-2017 merupakan yang tertinggi kedua yaitu 9,95 persen.
4.16 Health Services and Social Activities The development of Health and So-cial Services category has been significant in the last 5 (five) years. In addition to the in-creased public awareness of health, the Na-tional Health Insurance (JKN) program also encourages the increased value added gen-erated from this category. If in 2013 its con-tribution to total GRDP Buleleng Regency only 1.98 percent, then in 2017 its contribu-tion has reached 2.15 percent or 658 billion rupiah. The average growth of this category during the period of 2013-2017 is the second potition of 9,95 percent.
Tabel 4.16 Distribusi dan Laju Pertumbuhan Ekonomi Kategori Jasa Kesehatan dan Kegiatan Sosial di Kabupaten Buleleng (Persen), 2013-2017Table 4.16 Share and Growth Health Service and Social Activities in Buleleng Regency (Percent), 2013─2017
Keterangan 2013 2014 2015 2016* 2017**(1) (2) (3) (4) (5) (6)
1. Distribusi Ekonomi/ Economic distribution 1.98 2.01 2.09 2.14 2.15 2. Laju Pertumbuhan Ekonomi/ Economic Growth Rate 13.65 12.56 8.52 8.35 6.67
* Angka sementara/Preliminary Figures** Angka sangat sementara/Very Preliminary Figures
https:
//bulel
engka
b.bps.g
o.id
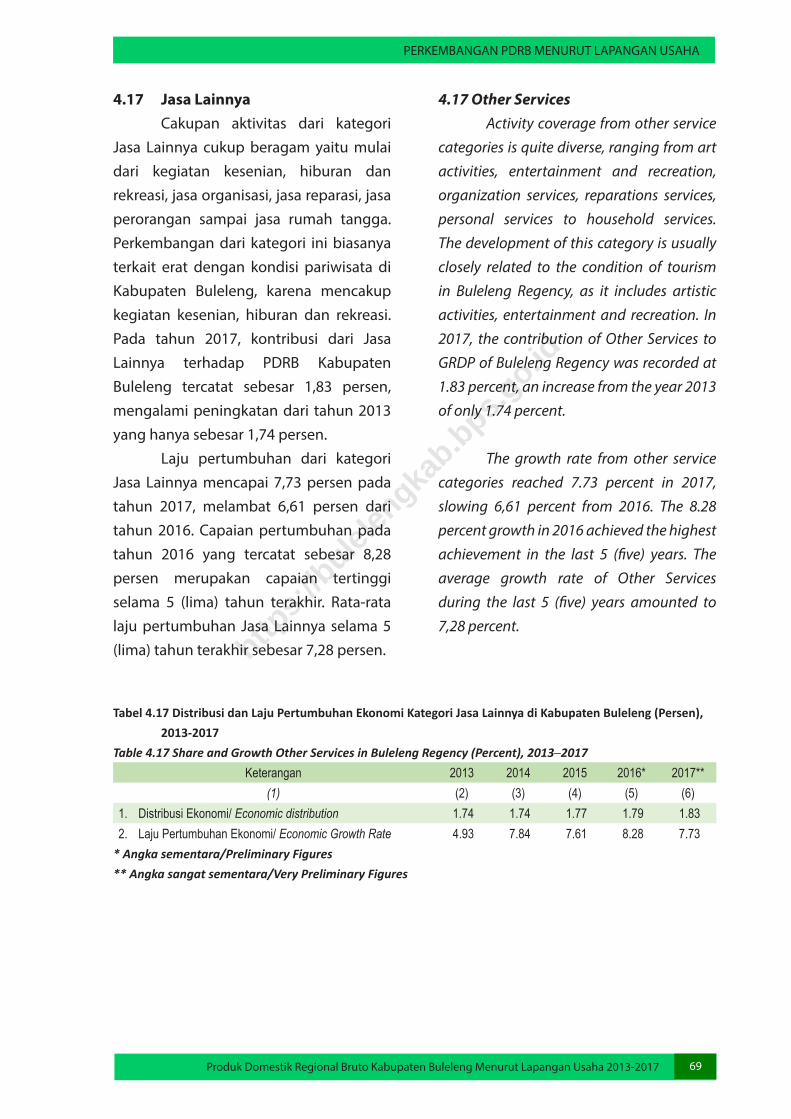
PERKEMBANGAN PDRB MENURUT LAPANGAN USAHA
Produk Domestik Regional Bruto Kabupaten Buleleng Menurut Lapangan Usaha 2013-2017 69
4.17 Jasa Lainnya Cakupan aktivitas dari kategori Jasa Lainnya cukup beragam yaitu mulai dari kegiatan kesenian, hiburan dan rekreasi, jasa organisasi, jasa reparasi, jasa perorangan sampai jasa rumah tangga. Perkembangan dari kategori ini biasanya terkait erat dengan kondisi pariwisata di Kabupaten Buleleng, karena mencakup kegiatan kesenian, hiburan dan rekreasi. Pada tahun 2017, kontribusi dari Jasa Lainnya terhadap PDRB Kabupaten Buleleng tercatat sebesar 1,83 persen, mengalami peningkatan dari tahun 2013 yang hanya sebesar 1,74 persen. Laju pertumbuhan dari kategori Jasa Lainnya mencapai 7,73 persen pada tahun 2017, melambat 6,61 persen dari tahun 2016. Capaian pertumbuhan pada tahun 2016 yang tercatat sebesar 8,28 persen merupakan capaian tertinggi selama 5 (lima) tahun terakhir. Rata-rata laju pertumbuhan Jasa Lainnya selama 5 (lima) tahun terakhir sebesar 7,28 persen.
4.17 Other Services Activity coverage from other service categories is quite diverse, ranging from art activities, entertainment and recreation, organization services, reparations services, personal services to household services. The development of this category is usually closely related to the condition of tourism in Buleleng Regency, as it includes artistic activities, entertainment and recreation. In 2017, the contribution of Other Services to GRDP of Buleleng Regency was recorded at 1.83 percent, an increase from the year 2013 of only 1.74 percent.
The growth rate from other service categories reached 7.73 percent in 2017, slowing 6,61 percent from 2016. The 8.28 percent growth in 2016 achieved the highest achievement in the last 5 (five) years. The average growth rate of Other Services during the last 5 (five) years amounted to 7,28 percent.
Tabel 4.17 Distribusi dan Laju Pertumbuhan Ekonomi Kategori Jasa Lainnya di Kabupaten Buleleng (Persen), 2013-2017Table 4.17 Share and Growth Other Services in Buleleng Regency (Percent), 2013─2017
Keterangan 2013 2014 2015 2016* 2017**(1) (2) (3) (4) (5) (6)
1. Distribusi Ekonomi/ Economic distribution 1.74 1.74 1.77 1.79 1.83 2. Laju Pertumbuhan Ekonomi/ Economic Growth Rate 4.93 7.84 7.61 8.28 7.73
* Angka sementara/Preliminary Figures** Angka sangat sementara/Very Preliminary Figures
https:
//bulel
engka
b.bps.g
o.id

https:
//bulel
engka
b.bps.g
o.id

LAMPIRAN
Produk Domestik Regional Bruto Kabupaten Buleleng Menurut Lapangan Usaha 2013-2017 71
https:
//bulel
engka
b.bps.g
o.id

https:
//bulel
engka
b.bps.g
o.id
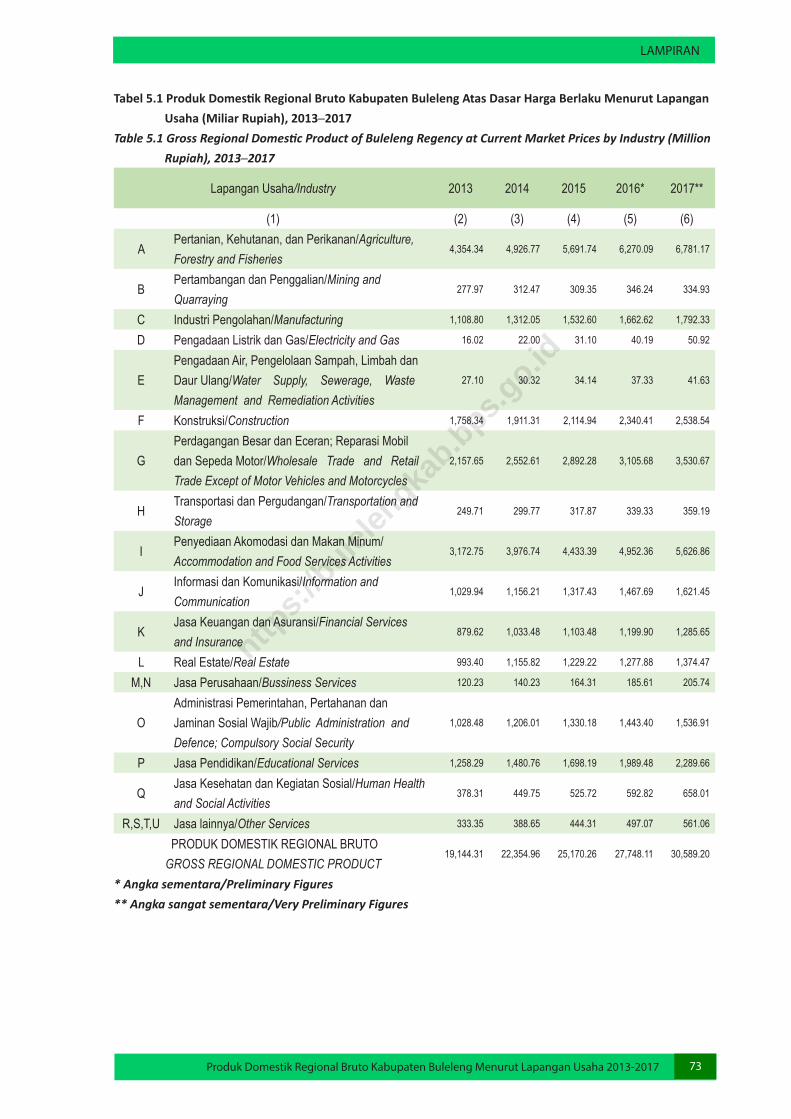
LAMPIRAN
Produk Domestik Regional Bruto Kabupaten Buleleng Menurut Lapangan Usaha 2013-2017 73
Tabel 5.1 Produk Domestik Regional Bruto Kabupaten Buleleng Atas Dasar Harga Berlaku Menurut Lapangan Usaha (Miliar Rupiah), 2013─2017Table 5.1 Gross Regional Domestic Product of Buleleng Regency at Current Market Prices by Industry (Million Rupiah), 2013─2017
Lapangan Usaha/Industry 2013 2014 2015 2016* 2017**
(1) (2) (3) (4) (5) (6)
APertanian, Kehutanan, dan Perikanan/Agriculture, Forestry and Fisheries
4,354.34 4,926.77 5,691.74 6,270.09 6,781.17
BPertambangan dan Penggalian/Mining and Quarraying
277.97 312.47 309.35 346.24 334.93
C Industri Pengolahan/Manufacturing 1,108.80 1,312.05 1,532.60 1,662.62 1,792.33
D Pengadaan Listrik dan Gas/Electricity and Gas 16.02 22.00 31.10 40.19 50.92
EPengadaan Air, Pengelolaan Sampah, Limbah dan Daur Ulang/Water Supply, Sewerage, Waste Management and Remediation Activities
27.10 30.32 34.14 37.33 41.63
F Konstruksi/Construction 1,758.34 1,911.31 2,114.94 2,340.41 2,538.54
GPerdagangan Besar dan Eceran; Reparasi Mobil dan Sepeda Motor/Wholesale Trade and Retail Trade Except of Motor Vehicles and Motorcycles
2,157.65 2,552.61 2,892.28 3,105.68 3,530.67
HTransportasi dan Pergudangan/Transportation and Storage
249.71 299.77 317.87 339.33 359.19
IPenyediaan Akomodasi dan Makan Minum/Accommodation and Food Services Activities
3,172.75 3,976.74 4,433.39 4,952.36 5,626.86
JInformasi dan Komunikasi/Information and Communication
1,029.94 1,156.21 1,317.43 1,467.69 1,621.45
KJasa Keuangan dan Asuransi/Financial Services and Insurance
879.62 1,033.48 1,103.48 1,199.90 1,285.65
L Real Estate/Real Estate 993.40 1,155.82 1,229.22 1,277.88 1,374.47
M,N Jasa Perusahaan/Bussiness Services 120.23 140.23 164.31 185.61 205.74
OAdministrasi Pemerintahan, Pertahanan dan Jaminan Sosial Wajib/Public Administration and Defence; Compulsory Social Security
1,028.48 1,206.01 1,330.18 1,443.40 1,536.91
P Jasa Pendidikan/Educational Services 1,258.29 1,480.76 1,698.19 1,989.48 2,289.66
QJasa Kesehatan dan Kegiatan Sosial/Human Health and Social Activities
378.31 449.75 525.72 592.82 658.01
R,S,T,U Jasa lainnya/Other Services 333.35 388.65 444.31 497.07 561.06
PRODUK DOMESTIK REGIONAL BRUTOGROSS REGIONAL DOMESTIC PRODUCT
19,144.31 22,354.96 25,170.26 27,748.11 30,589.20
* Angka sementara/Preliminary Figures** Angka sangat sementara/Very Preliminary Figures
https:
//bulel
engka
b.bps.g
o.id
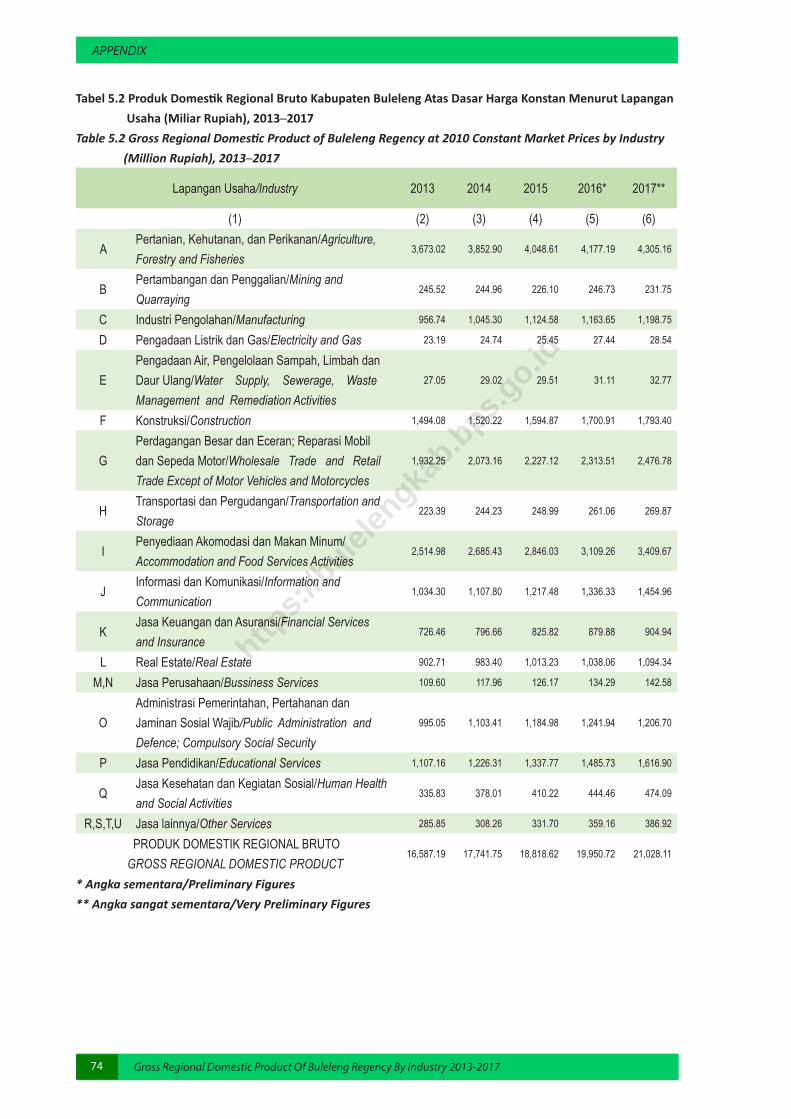
APPENDIX
Gross Regional Domestic Product Of Buleleng Regency By Industry 2013-201774
Tabel 5.2 Produk Domestik Regional Bruto Kabupaten Buleleng Atas Dasar Harga Konstan Menurut Lapangan Usaha (Miliar Rupiah), 2013─2017Table 5.2 Gross Regional Domestic Product of Buleleng Regency at 2010 Constant Market Prices by Industry (Million Rupiah), 2013─2017
Lapangan Usaha/Industry 2013 2014 2015 2016* 2017**
(1) (2) (3) (4) (5) (6)
APertanian, Kehutanan, dan Perikanan/Agriculture, Forestry and Fisheries
3,673.02 3,852.90 4,048.61 4,177.19 4,305.16
BPertambangan dan Penggalian/Mining and Quarraying
245.52 244.96 226.10 246.73 231.75
C Industri Pengolahan/Manufacturing 956.74 1,045.30 1,124.58 1,163.65 1,198.75
D Pengadaan Listrik dan Gas/Electricity and Gas 23.19 24.74 25.45 27.44 28.54
EPengadaan Air, Pengelolaan Sampah, Limbah dan Daur Ulang/Water Supply, Sewerage, Waste Management and Remediation Activities
27.05 29.02 29.51 31.11 32.77
F Konstruksi/Construction 1,494.08 1,520.22 1,594.87 1,700.91 1,793.40
GPerdagangan Besar dan Eceran; Reparasi Mobil dan Sepeda Motor/Wholesale Trade and Retail Trade Except of Motor Vehicles and Motorcycles
1,932.25 2,073.16 2,227.12 2,313.51 2,476.78
HTransportasi dan Pergudangan/Transportation and Storage
223.39 244.23 248.99 261.06 269.87
IPenyediaan Akomodasi dan Makan Minum/Accommodation and Food Services Activities
2,514.98 2,685.43 2,846.03 3,109.26 3,409.67
JInformasi dan Komunikasi/Information and Communication
1,034.30 1,107.80 1,217.48 1,336.33 1,454.96
KJasa Keuangan dan Asuransi/Financial Services and Insurance
726.46 796.66 825.82 879.88 904.94
L Real Estate/Real Estate 902.71 983.40 1,013.23 1,038.06 1,094.34
M,N Jasa Perusahaan/Bussiness Services 109.60 117.96 126.17 134.29 142.58
OAdministrasi Pemerintahan, Pertahanan dan Jaminan Sosial Wajib/Public Administration and Defence; Compulsory Social Security
995.05 1,103.41 1,184.98 1,241.94 1,206.70
P Jasa Pendidikan/Educational Services 1,107.16 1,226.31 1,337.77 1,485.73 1,616.90
QJasa Kesehatan dan Kegiatan Sosial/Human Health and Social Activities
335.83 378.01 410.22 444.46 474.09
R,S,T,U Jasa lainnya/Other Services 285.85 308.26 331.70 359.16 386.92
PRODUK DOMESTIK REGIONAL BRUTOGROSS REGIONAL DOMESTIC PRODUCT
16,587.19 17,741.75 18,818.62 19,950.72 21,028.11
* Angka sementara/Preliminary Figures** Angka sangat sementara/Very Preliminary Figures
https:
//bulel
engka
b.bps.g
o.id
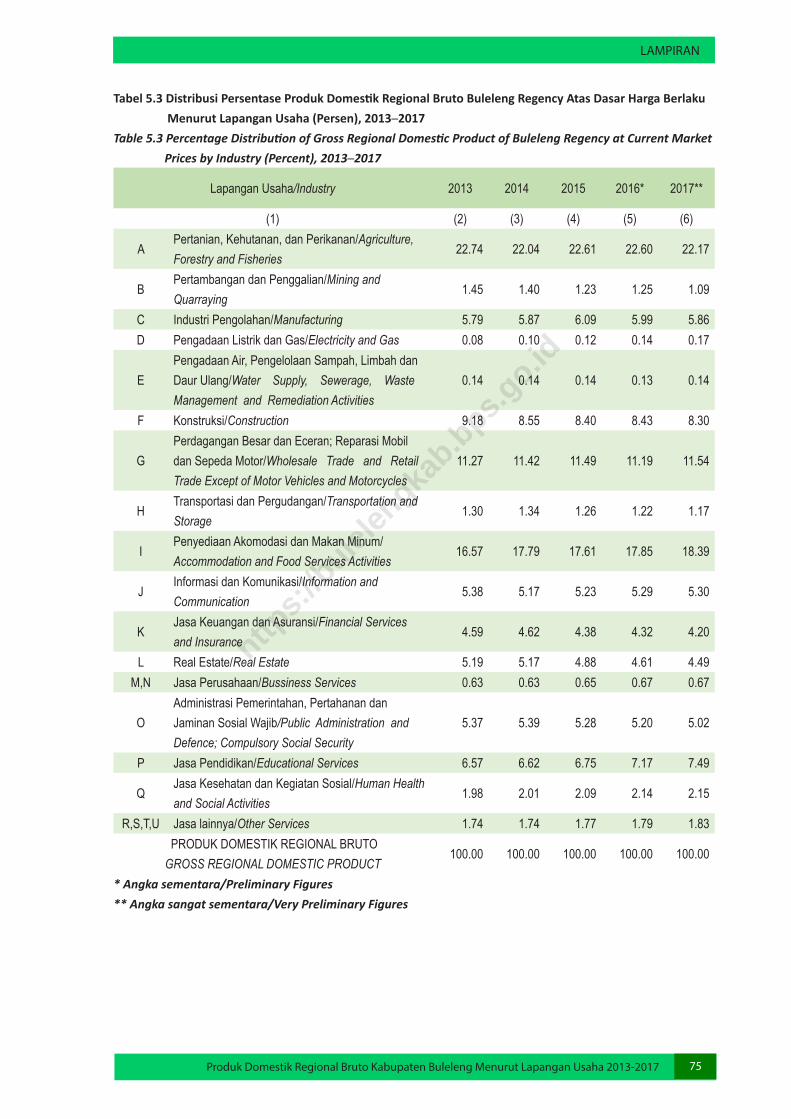
LAMPIRAN
Produk Domestik Regional Bruto Kabupaten Buleleng Menurut Lapangan Usaha 2013-2017 75
Tabel 5.3 Distribusi Persentase Produk Domestik Regional Bruto Buleleng Regency Atas Dasar Harga Berlaku Menurut Lapangan Usaha (Persen), 2013─2017Table 5.3 Percentage Distribution of Gross Regional Domestic Product of Buleleng Regency at Current Market Prices by Industry (Percent), 2013─2017
Lapangan Usaha/Industry 2013 2014 2015 2016* 2017**
(1) (2) (3) (4) (5) (6)
APertanian, Kehutanan, dan Perikanan/Agriculture, Forestry and Fisheries
22.74 22.04 22.61 22.60 22.17
BPertambangan dan Penggalian/Mining and Quarraying
1.45 1.40 1.23 1.25 1.09
C Industri Pengolahan/Manufacturing 5.79 5.87 6.09 5.99 5.86 D Pengadaan Listrik dan Gas/Electricity and Gas 0.08 0.10 0.12 0.14 0.17
EPengadaan Air, Pengelolaan Sampah, Limbah dan Daur Ulang/Water Supply, Sewerage, Waste Management and Remediation Activities
0.14 0.14 0.14 0.13 0.14
F Konstruksi/Construction 9.18 8.55 8.40 8.43 8.30
GPerdagangan Besar dan Eceran; Reparasi Mobil dan Sepeda Motor/Wholesale Trade and Retail Trade Except of Motor Vehicles and Motorcycles
11.27 11.42 11.49 11.19 11.54
HTransportasi dan Pergudangan/Transportation and Storage
1.30 1.34 1.26 1.22 1.17
IPenyediaan Akomodasi dan Makan Minum/Accommodation and Food Services Activities
16.57 17.79 17.61 17.85 18.39
JInformasi dan Komunikasi/Information and Communication
5.38 5.17 5.23 5.29 5.30
KJasa Keuangan dan Asuransi/Financial Services and Insurance
4.59 4.62 4.38 4.32 4.20
L Real Estate/Real Estate 5.19 5.17 4.88 4.61 4.49 M,N Jasa Perusahaan/Bussiness Services 0.63 0.63 0.65 0.67 0.67
OAdministrasi Pemerintahan, Pertahanan dan Jaminan Sosial Wajib/Public Administration and Defence; Compulsory Social Security
5.37 5.39 5.28 5.20 5.02
P Jasa Pendidikan/Educational Services 6.57 6.62 6.75 7.17 7.49
QJasa Kesehatan dan Kegiatan Sosial/Human Health and Social Activities
1.98 2.01 2.09 2.14 2.15
R,S,T,U Jasa lainnya/Other Services 1.74 1.74 1.77 1.79 1.83 PRODUK DOMESTIK REGIONAL BRUTOGROSS REGIONAL DOMESTIC PRODUCT
100.00 100.00 100.00 100.00 100.00
* Angka sementara/Preliminary Figures** Angka sangat sementara/Very Preliminary Figures
https:
//bulel
engka
b.bps.g
o.id
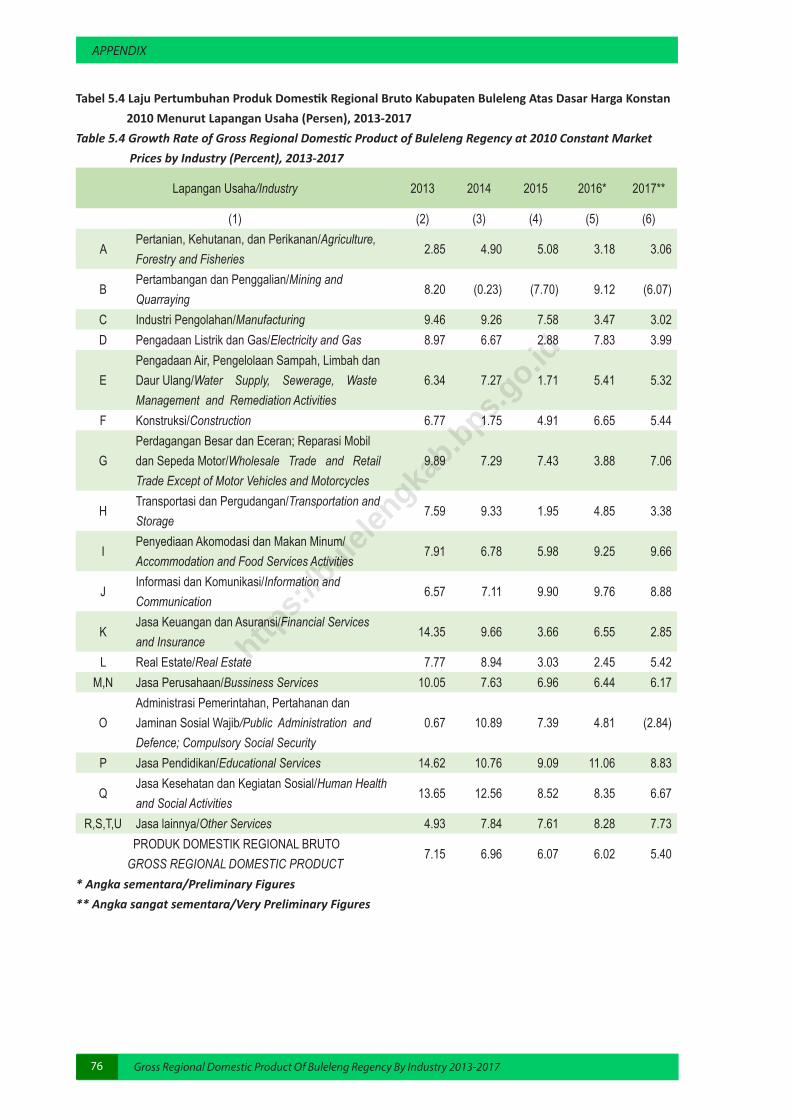
APPENDIX
Gross Regional Domestic Product Of Buleleng Regency By Industry 2013-201776
Tabel 5.4 Laju Pertumbuhan Produk Domestik Regional Bruto Kabupaten Buleleng Atas Dasar Harga Konstan 2010 Menurut Lapangan Usaha (Persen), 2013-2017 Table 5.4 Growth Rate of Gross Regional Domestic Product of Buleleng Regency at 2010 Constant Market Prices by Industry (Percent), 2013-2017
Lapangan Usaha/Industry 2013 2014 2015 2016* 2017**
(1) (2) (3) (4) (5) (6)
APertanian, Kehutanan, dan Perikanan/Agriculture, Forestry and Fisheries
2.85 4.90 5.08 3.18 3.06
BPertambangan dan Penggalian/Mining and Quarraying
8.20 (0.23) (7.70) 9.12 (6.07)
C Industri Pengolahan/Manufacturing 9.46 9.26 7.58 3.47 3.02 D Pengadaan Listrik dan Gas/Electricity and Gas 8.97 6.67 2.88 7.83 3.99
EPengadaan Air, Pengelolaan Sampah, Limbah dan Daur Ulang/Water Supply, Sewerage, Waste Management and Remediation Activities
6.34 7.27 1.71 5.41 5.32
F Konstruksi/Construction 6.77 1.75 4.91 6.65 5.44
GPerdagangan Besar dan Eceran; Reparasi Mobil dan Sepeda Motor/Wholesale Trade and Retail Trade Except of Motor Vehicles and Motorcycles
9.89 7.29 7.43 3.88 7.06
HTransportasi dan Pergudangan/Transportation and Storage
7.59 9.33 1.95 4.85 3.38
IPenyediaan Akomodasi dan Makan Minum/Accommodation and Food Services Activities
7.91 6.78 5.98 9.25 9.66
JInformasi dan Komunikasi/Information and Communication
6.57 7.11 9.90 9.76 8.88
KJasa Keuangan dan Asuransi/Financial Services and Insurance
14.35 9.66 3.66 6.55 2.85
L Real Estate/Real Estate 7.77 8.94 3.03 2.45 5.42 M,N Jasa Perusahaan/Bussiness Services 10.05 7.63 6.96 6.44 6.17
OAdministrasi Pemerintahan, Pertahanan dan Jaminan Sosial Wajib/Public Administration and Defence; Compulsory Social Security
0.67 10.89 7.39 4.81 (2.84)
P Jasa Pendidikan/Educational Services 14.62 10.76 9.09 11.06 8.83
QJasa Kesehatan dan Kegiatan Sosial/Human Health and Social Activities
13.65 12.56 8.52 8.35 6.67
R,S,T,U Jasa lainnya/Other Services 4.93 7.84 7.61 8.28 7.73 PRODUK DOMESTIK REGIONAL BRUTOGROSS REGIONAL DOMESTIC PRODUCT
7.15 6.96 6.07 6.02 5.40
* Angka sementara/Preliminary Figures** Angka sangat sementara/Very Preliminary Figures
https:
//bulel
engka
b.bps.g
o.id

LAMPIRAN
Produk Domestik Regional Bruto Kabupaten Buleleng Menurut Lapangan Usaha 2013-2017 77
Tabel 5.5 Indeks Perkembangan Produk Domestik Regional Bruto Kabupaten Buleleng Atas Dasar Harga Konstan 2010 Menurut Lapangan Usaha, 2013─2017Table 5.5 Trend of Gross Regional Domestic Product of Buleleng Regency at 2010 Constant Market Prices by Industry, 2013─2017
Lapangan Usaha/Industry 2013 2014 2015 2016* 2017**
(1) (2) (3) (4) (5) (6)
APertanian, Kehutanan, dan Perikanan/Agriculture, Forestry and Fisheries
109.04 114.38 120.19 124.01 127.81
BPertambangan dan Penggalian/Mining and Quarraying
139.36 139.04 128.33 140.04 131.54
C Industri Pengolahan/Manufacturing 117.93 128.84 138.62 143.43 147.76 D Pengadaan Listrik dan Gas/Electricity and Gas 132.86 141.73 145.81 157.23 163.50
EPengadaan Air, Pengelolaan Sampah, Limbah dan Daur Ulang/Water Supply, Sewerage, Waste Management and Remediation Activities
110.77 118.83 120.85 127.40 134.18
F Konstruksi/Construction 136.81 139.21 146.04 155.75 164.22
GPerdagangan Besar dan Eceran; Reparasi Mobil dan Sepeda Motor/Wholesale Trade and Retail Trade Except of Motor Vehicles and Motorcycles
123.72 132.74 142.60 148.13 158.58
HTransportasi dan Pergudangan/Transportation and Storage
119.68 130.84 133.39 139.86 144.58
IPenyediaan Akomodasi dan Makan Minum/Accommodation and Food Services Activities
123.76 132.15 140.05 153.00 167.78
JInformasi dan Komunikasi/Information and Communication
126.24 135.21 148.60 163.11 177.59
KJasa Keuangan dan Asuransi/Financial Services and Insurance
131.95 144.70 149.99 159.81 164.36
L Real Estate/Real Estate 120.50 131.27 135.25 138.57 146.08 M,N Jasa Perusahaan/Bussiness Services 116.69 125.59 134.33 142.98 151.81
OAdministrasi Pemerintahan, Pertahanan dan Jaminan Sosial Wajib/Public Administration and Defence; Compulsory Social Security
128.72 142.73 153.28 160.65 156.09
P Jasa Pendidikan/Educational Services 128.32 142.13 155.05 172.20 187.40
QJasa Kesehatan dan Kegiatan Sosial/Human Health and Social Activities
129.07 145.28 157.66 170.82 182.21
R,S,T,U Jasa lainnya/Other Services 118.68 127.98 137.72 149.12 160.64 PRODUK DOMESTIK REGIONAL BRUTOGROSS REGIONAL DOMESTIC PRODUCT
121.78 130.26 138.17 146.48 154.39
* Angka sementara/Preliminary Figures** Angka sangat sementara/Very Preliminary Figures
https:
//bulel
engka
b.bps.g
o.id
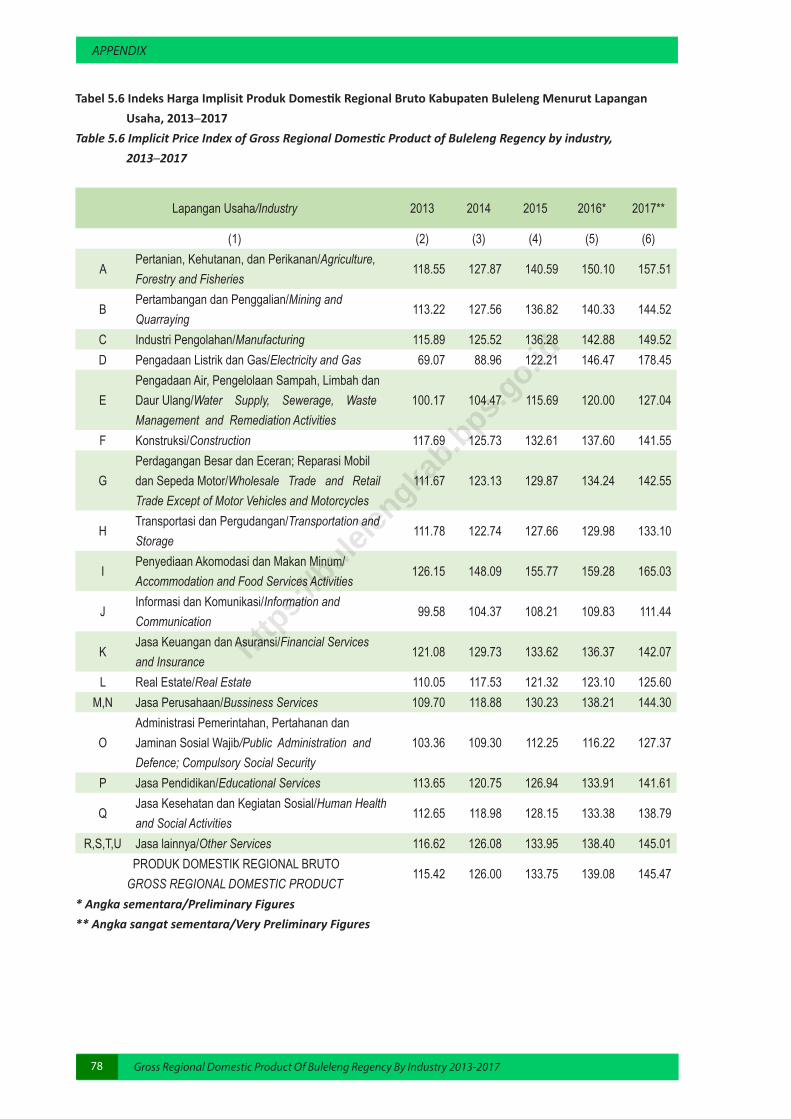
APPENDIX
Gross Regional Domestic Product Of Buleleng Regency By Industry 2013-201778
Tabel 5.6 Indeks Harga Implisit Produk Domestik Regional Bruto Kabupaten Buleleng Menurut Lapangan Usaha, 2013─2017Table 5.6 Implicit Price Index of Gross Regional Domestic Product of Buleleng Regency by industry, 2013─2017
Lapangan Usaha/Industry 2013 2014 2015 2016* 2017**
(1) (2) (3) (4) (5) (6)
APertanian, Kehutanan, dan Perikanan/Agriculture, Forestry and Fisheries
118.55 127.87 140.59 150.10 157.51
BPertambangan dan Penggalian/Mining and Quarraying
113.22 127.56 136.82 140.33 144.52
C Industri Pengolahan/Manufacturing 115.89 125.52 136.28 142.88 149.52 D Pengadaan Listrik dan Gas/Electricity and Gas 69.07 88.96 122.21 146.47 178.45
EPengadaan Air, Pengelolaan Sampah, Limbah dan Daur Ulang/Water Supply, Sewerage, Waste Management and Remediation Activities
100.17 104.47 115.69 120.00 127.04
F Konstruksi/Construction 117.69 125.73 132.61 137.60 141.55
GPerdagangan Besar dan Eceran; Reparasi Mobil dan Sepeda Motor/Wholesale Trade and Retail Trade Except of Motor Vehicles and Motorcycles
111.67 123.13 129.87 134.24 142.55
HTransportasi dan Pergudangan/Transportation and Storage
111.78 122.74 127.66 129.98 133.10
IPenyediaan Akomodasi dan Makan Minum/Accommodation and Food Services Activities
126.15 148.09 155.77 159.28 165.03
JInformasi dan Komunikasi/Information and Communication
99.58 104.37 108.21 109.83 111.44
KJasa Keuangan dan Asuransi/Financial Services and Insurance
121.08 129.73 133.62 136.37 142.07
L Real Estate/Real Estate 110.05 117.53 121.32 123.10 125.60 M,N Jasa Perusahaan/Bussiness Services 109.70 118.88 130.23 138.21 144.30
OAdministrasi Pemerintahan, Pertahanan dan Jaminan Sosial Wajib/Public Administration and Defence; Compulsory Social Security
103.36 109.30 112.25 116.22 127.37
P Jasa Pendidikan/Educational Services 113.65 120.75 126.94 133.91 141.61
QJasa Kesehatan dan Kegiatan Sosial/Human Health and Social Activities
112.65 118.98 128.15 133.38 138.79
R,S,T,U Jasa lainnya/Other Services 116.62 126.08 133.95 138.40 145.01 PRODUK DOMESTIK REGIONAL BRUTOGROSS REGIONAL DOMESTIC PRODUCT
115.42 126.00 133.75 139.08 145.47
* Angka sementara/Preliminary Figures** Angka sangat sementara/Very Preliminary Figures
https:
//bulel
engka
b.bps.g
o.id
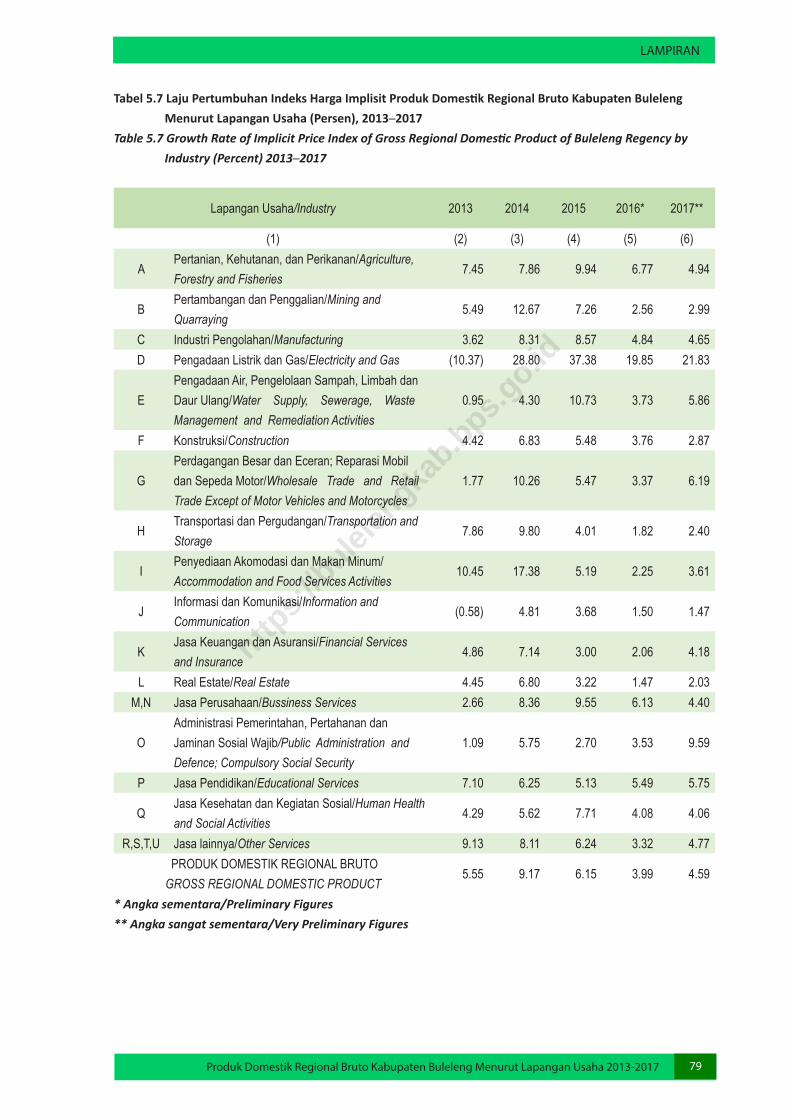
LAMPIRAN
Produk Domestik Regional Bruto Kabupaten Buleleng Menurut Lapangan Usaha 2013-2017 79
Tabel 5.7 Laju Pertumbuhan Indeks Harga Implisit Produk Domestik Regional Bruto Kabupaten Buleleng Menurut Lapangan Usaha (Persen), 2013─2017Table 5.7 Growth Rate of Implicit Price Index of Gross Regional Domestic Product of Buleleng Regency by Industry (Percent) 2013─2017
Lapangan Usaha/Industry 2013 2014 2015 2016* 2017**
(1) (2) (3) (4) (5) (6)
APertanian, Kehutanan, dan Perikanan/Agriculture, Forestry and Fisheries
7.45 7.86 9.94 6.77 4.94
BPertambangan dan Penggalian/Mining and Quarraying
5.49 12.67 7.26 2.56 2.99
C Industri Pengolahan/Manufacturing 3.62 8.31 8.57 4.84 4.65 D Pengadaan Listrik dan Gas/Electricity and Gas (10.37) 28.80 37.38 19.85 21.83
EPengadaan Air, Pengelolaan Sampah, Limbah dan Daur Ulang/Water Supply, Sewerage, Waste Management and Remediation Activities
0.95 4.30 10.73 3.73 5.86
F Konstruksi/Construction 4.42 6.83 5.48 3.76 2.87
GPerdagangan Besar dan Eceran; Reparasi Mobil dan Sepeda Motor/Wholesale Trade and Retail Trade Except of Motor Vehicles and Motorcycles
1.77 10.26 5.47 3.37 6.19
HTransportasi dan Pergudangan/Transportation and Storage
7.86 9.80 4.01 1.82 2.40
IPenyediaan Akomodasi dan Makan Minum/Accommodation and Food Services Activities
10.45 17.38 5.19 2.25 3.61
JInformasi dan Komunikasi/Information and Communication
(0.58) 4.81 3.68 1.50 1.47
KJasa Keuangan dan Asuransi/Financial Services and Insurance
4.86 7.14 3.00 2.06 4.18
L Real Estate/Real Estate 4.45 6.80 3.22 1.47 2.03 M,N Jasa Perusahaan/Bussiness Services 2.66 8.36 9.55 6.13 4.40
OAdministrasi Pemerintahan, Pertahanan dan Jaminan Sosial Wajib/Public Administration and Defence; Compulsory Social Security
1.09 5.75 2.70 3.53 9.59
P Jasa Pendidikan/Educational Services 7.10 6.25 5.13 5.49 5.75
QJasa Kesehatan dan Kegiatan Sosial/Human Health and Social Activities
4.29 5.62 7.71 4.08 4.06
R,S,T,U Jasa lainnya/Other Services 9.13 8.11 6.24 3.32 4.77 PRODUK DOMESTIK REGIONAL BRUTOGROSS REGIONAL DOMESTIC PRODUCT
5.55 9.17 6.15 3.99 4.59
* Angka sementara/Preliminary Figures** Angka sangat sementara/Very Preliminary Figures
https:
//bulel
engka
b.bps.g
o.id

https:
//bulel
engka
b.bps.g
o.id
https:
//bulel
engka
b.bps.g
o.id