presentación a inversionistas gira para la emisión de bono por us$350 millones (inglés)
TRANSCRIPT

Bladex Investor Presentation
April 2015
Strictly Private & Confidential
Color
Scheme
234 93 46
225 26 88
92 47 136
109 179 63
235 235 235
0 75 141
253 185 36
Accent
Color

Disclaimer
“This presentation contains forward-looking statements. These statements are made under the “safe harbor” provisions
established by the U.S. Private Securities Litigation Reform Act of 1995. Forward-looking statements involve inherent risks
and uncertainties. The forward-looking statements in this presentation reflect the expectations of the Bank’s management
and are based on currently available data; however, actual experience with respect to these factors is subject to future
events and uncertainties, which could materially impact the Bank’s expectations. A number of factors could cause actual
performance and results to differ materially from those contained in any forward-looking statement, including but not limited
to the following: the anticipated growth of the Bank’s credit portfolio, including its trade finance portfolio; the continuation of
the Bank’s preferred creditor status; the impact of increasing interest rates and of improving macroeconomic environment in
the Region on the Bank’s financial condition; the execution of the Bank’s strategies and initiatives, including its revenue
diversification strategy; the adequacy of the Bank’s allowance for credit losses; the need for additional provisions for credit
losses; the volatility of the Bank’s Treasury trading revenues; the Bank’s ability to achieve future growth and increase its
number of clients, the Bank’s ability to reduce its liquidity levels and increase its leverage; the Bank’s ability to maintain its
investment-grade credit ratings; the availability and mix of future sources of funding for the Bank’s lending operations;
potential trading losses; existing and future governmental banking and tax regulations; the possibility of fraud; and the
adequacy of the Bank’s sources of liquidity to replace large deposit withdrawals.”
1

Management Representatives – Team A
In current role since 2012
Responsible for the overall relationship with international financial institutions and has an active
role in funding/liquidity and asset liability management
Joined Bladex in 2005 and, until 2012, acted as Business Manager for the Asset Management
Division. She has an extensive background in the banking industry as well as in the Project
Management field
Christopher Schech Executive Vice President
Chief Financial Officer
Annette de Solis Vice President
Treasury and Capital
Markets
In current role since 2009, with 25 years of financial services experience with assignments in
Latin America, the United States, Europe and Asia
CFO, Region International Division at Volvo Financial Services (2008-2009)
Various capacities in General Electric Company (1996-2008) and Coopers & Lybrand
Deutsche Revision (1990-1996)
2

Management Representatives – Team B
In current role since 2002, alternate to the Chief Financial Officer, heading Financial Planning
and Analysis and Investor Relations
25 years of experience at Bladex (1990 to date) serving in various capacities in the finance,
commercial and economic studies areas
Significant institutional knowledge of the Bank’s financial background, business development
and strategic evolution
Eduardo Vivone Senior Vice President
Treasurer
Ana Graciela de
Mendez Senior Vice President
Finance
In current role since 2013 with extensive background in the banking industry, having covered
different senior roles in Latin America, Europe and the United States
Head of Global Markets at HSBC Panama from 2010 to 2012 and Regional Head of
Government Sector Coverage at HSBC New York from 2007 to 2010
Previously served as Treasurer of HSBC Spain and Head of Balance Sheet Management at
HSBC Bank Argentina
3
1979
A Leading Franchise with a Solid Track
Record
The Latin America Trade Finance Bank Key Financial Highlights
Remarkable Trajectory: 35 years of Success
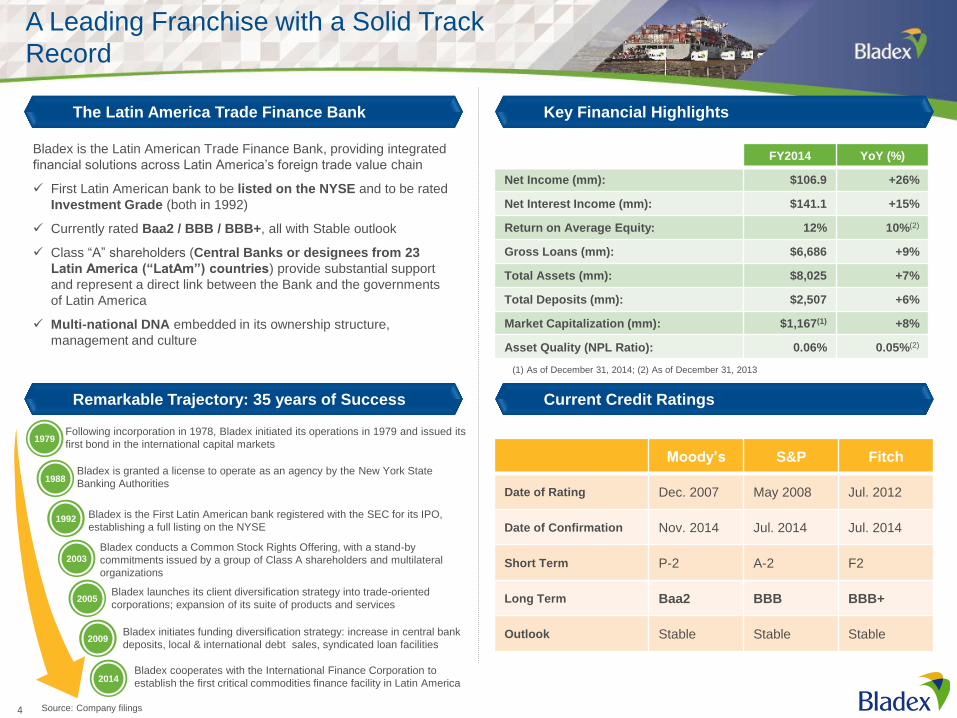
Bladex is the Latin American Trade Finance Bank, providing integrated
financial solutions across Latin America’s foreign trade value chain
First Latin American bank to be listed on the NYSE and to be rated
Investment Grade (both in 1992)
Currently rated Baa2 / BBB / BBB+, all with Stable outlook
Class “A” shareholders (Central Banks or designees from 23
Latin America (“LatAm”) countries) provide substantial support
and represent a direct link between the Bank and the governments
of Latin America
Multi-national DNA embedded in its ownership structure,
management and culture
Current Credit Ratings
FY2014 YoY (%)
Net Income (mm): $106.9 +26%
Net Interest Income (mm): $141.1 +15%
Return on Average Equity: 12% 10%(2)
Gross Loans (mm): $6,686 +9%
Total Assets (mm): $8,025 +7%
Total Deposits (mm): $2,507 +6%
Market Capitalization (mm): $1,167(1) +8%
Asset Quality (NPL Ratio): 0.06% 0.05%(2)
1988
1992
2003
2005
2009
2014
Following incorporation in 1978, Bladex initiated its operations in 1979 and issued its
first bond in the international capital markets
Bladex is granted a license to operate as an agency by the New York State
Banking Authorities
Bladex is the First Latin American bank registered with the SEC for its IPO,
establishing a full listing on the NYSE
Bladex conducts a Common Stock Rights Offering, with a stand-by
commitments issued by a group of Class A shareholders and multilateral
organizations
Bladex launches its client diversification strategy into trade-oriented
corporations; expansion of its suite of products and services
Bladex initiates funding diversification strategy: increase in central bank
deposits, local & international debt sales, syndicated loan facilities
Bladex cooperates with the International Finance Corporation to
establish the first critical commodities finance facility in Latin America
(1) As of December 31, 2014; (2) As of December 31, 2013
Moody’s S&P Fitch
Date of Rating Dec. 2007 May 2008 Jul. 2012
Date of Confirmation Nov. 2014 Jul. 2014 Jul. 2014
Short Term P-2 A-2 F2
Long Term Baa2 BBB BBB+
Outlook Stable Stable Stable
4 Source: Company filings
… and a Strong and Unique Shareholder
Structure
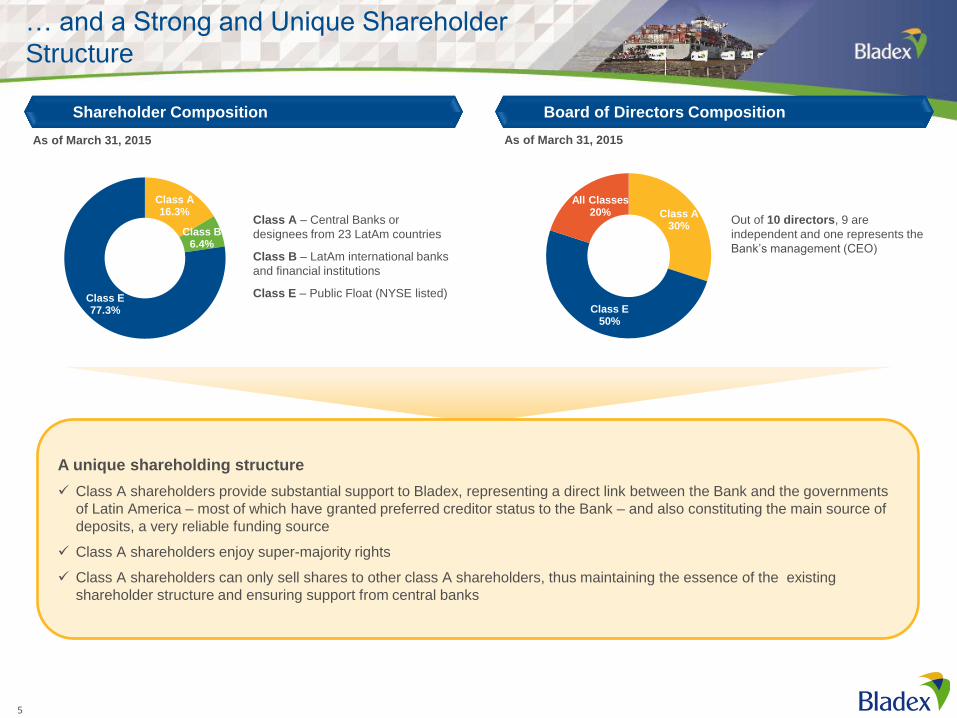
A unique shareholding structure
Class A shareholders provide substantial support to Bladex, representing a direct link between the Bank and the governments
of Latin America – most of which have granted preferred creditor status to the Bank – and also constituting the main source of
deposits, a very reliable funding source
Class A shareholders enjoy super-majority rights
Class A shareholders can only sell shares to other class A shareholders, thus maintaining the essence of the existing
shareholder structure and ensuring support from central banks
Shareholder Composition Board of Directors Composition
As of March 31, 2015 As of March 31, 2015
Class A 30%
Class E 50%
All Classes 20%
Class A 16.3%
Class B 6.4%
Class E 77.3%
Class A – Central Banks or
designees from 23 LatAm countries
Class B – LatAm international banks
and financial institutions
Class E – Public Float (NYSE listed)
Out of 10 directors, 9 are
independent and one represents the
Bank’s management (CEO)
5

Investment Highlights
Diversified Commercial Portfolio with Robust Asset Quality
Defined Strategy to Achieve Sustainable Growth
Diversified Funding & Conservative Liquidity
Management
Experienced Management and Conservative Risk Management
Practices
Compelling Returns sustained by Strong and Reliable Performance
Metrics*
Leading Franchise in LatAm with Solid Track Record and a Tailored Business Model
Trade Finance Bank in Latin America with 35 years of Remarkable Success
Investment Grade Profile with Strong and Unique Shareholding Structure
Deep knowledge of Latin America with Core in Trade Finance
Strategically Positioned to Capture Growth Opportunities
Sustainable Portfolio Strategy focused on Diversification
Strong Asset Quality Management and a Low Risk Core Business Focus
Increased diversification of Regional and Global Funding Sources
Advanced Liquidity Management operating under Basel III Framework
Net Income of $106.9 million as of December 2014 (+26% YoY)
Return on Average Equity of 12%
Solid 15.6% Tier 1 Capitalization Ratio (Basel III)
Seasoned Senior Management with more than 45 years in C-Suite roles
World-Class Standards in Corporate Governance, focused on Enterprise-Wide Risk Management
(*) As of December 2014
6

Defined Value Proposition with Strong
Business Fundamentals…
Business Value Proposition Strong Underlying Business Fundamentals
Business Products & Services Multi-Pronged Business Segmentation
Global provider of natural
resources with positive
demographics
Sustained growth
and sound
economic
policies
Pan Regional
Reach
Product & Market
Expertise
Agility &
Efficiency
Client Focused
In-depth knowledge of Latin America’s local markets
Backed by 23 Latin American governments
Vast correspondent banking network throughout LatAm
Uniquely qualified staff with strong product expertise in
Trade Value Chain, Cross-border Finance, Supply-side &
Distribution, both intra-regional and inter-regional
Efficient organizational structure
LEAN workflows
LEAN, client focused culture with a single point of contact
Providing client-specific solutions
Focused on long-term relationships
COUNTRIES
REGIONS
CLIENT
BASE
INDUSTRY
SECTORS
Financial Institutions
Among top 10 in all
countries
Corporate banking
activity
Corporations
Foreign exchange
generation capacity
Growth oriented beyond
domestic market
Among top 10 in
respective industry
sector
Corporate governance
Focus on Strategic Sectors for the Region
O&G, Agribusiness, Food processing, Manufacturing
Driver of progress,
economic growth and
development
Supporting
specialization in
both primary and
manufacturing
sectors
Enhancing LatAm’s
role in global and
regional value chains
Growth of ‘Multi-latinas’ as
drivers of business expansion
Supporting business
integration boosted by
free trade agreements
Pre-export and
export finance
Import financing
Term loans and
revolving credit
facilities
Letters of credit
and guarantees
Banker's
acceptances
Tra
de F
inancin
g
Pre-export
financing with
contract
assignment and
other
guarantees
Vendor finance
(factoring,
reverse
factoring and
forfaiting)
Financing
guaranteed by
ECAs and/or
private
insurance
programs
Str
uctu
red T
rade S
olu
tions
Medium- and
long-term loans
Acquisition
finance
Trade-related
term loans
Trade & non-
trade revolving
credit facilities
Liability
management
Bridge loans
Syndic
ations
Leasing
Term loans
Guarantees
A/B financing
with
multilaterals
Working capital
loans
Fin
ancia
l Loans
Trade Non-Trade
7

Proven Business Model
Leverage Proven
Origination Capacity
LatAm GDP
Growth
LatAm Trade
Flow Growth
Bladex Client
Base Growth
Valued Products
& Services
3%+
ROAE
15%+
ROAE
12%+
ROAE
Bladex
Origination
Active
Portfolio
Management
~ 2%
NIM
~ 1.5%
ROAA
< 1.4%
Cost of Credit
< 30%
Efficiency
~ 10%
Growth
On-book Portfolio
> 13.5%
Tier 1 BIII
Target Consistent
Core Performance
Financial
Institutions Structuring
Partners Trade
Services
Distribution
Asset Distribution & Services
Fee Based
Services
Investors Other
Tap Additional
Income Sources
15%+
ROAE
12%+
ROAE
3%+
ROAE
8

Defined Strategy & Positioning to Capture
Further Growth Opportunities
Develop Emerging Businesses
• Develop robust syndication
platform
• Expand diversified markets
distribution capabilities
IFC program
• Expand vendor finance and
leasing capabilities
SOFOM in Mexico
Contribute towards sustainable 15% ROAE
Build New Businesses
• Explore adjacent markets &
create pipeline of new business
opportunities within foreign trade
and regional integration approach,
such as:
Insurance
Capital Markets
Trade-related Services
Factoring
Infrastructure Projects
Ensure Long Term Viability
Strengthen Core Business
• Improve Operating Efficiency
through LEAN Processes,
Structure & Organization
• Active credit portfolio
management
Maximize return on equity
Improve the quality of earnings
Achieve well diversified
concentration of risk
• Expand Contingency Business
Guarantee and L/C Issuance
Platform
Ensure sustainable 12% Core ROAE
+
+
9

Reducing Risk within an Improved Risk Profile
in the Region…
Improved Risk Profile in the Region
Credit Portfolio Concentration by International Risk Rating
of Country of Exposure
Contributing to Growth and Prosperity in LatAm
Accumulated Credit Disbursements (in US$ billions)
Improved risk perception of the Latin American
Region over the past 20 years
Currently, 77% of the Credit Portfolio is in investment-
grade countries, compared to 21% and 14% in 2003
and 1993, respectively
Contributing to the growth and prosperity in Latin
America for more than 30 years, Bladex has
accumulated credit disbursements of US$222 billion
since inception
Disbursement volumes surpass or rival those of much
larger institutions, both private sector and multilateral
Source: Company filings
9% 5% 14% 12%
72% 43% 15%
11%
31%
45%
9% 11% 19%
4%
1993 2003 1Q 2015
AAA - A+ BBB BB B CCC - D SD
0
1
2
3
4
5
6
7 9 11
14
17
22
29
37
46
56 67 79
89
97
105
114
120
124
129
135
144
152
158
162
169
180
191
205
219
222
1979
1980
1981
1982
1983
1984
1985
1986
1987
1988
1989
1990
1991
1992
1993
1994
1995
1996
1997
1998
1999
2000
2001
2002
2003
2004
2005
2006
2007
2008
2009
2010
2011
2012
2013
2014
1Q
15
10

27.7% 13.0%
10.9% 8.4%
4.7% 4.5% 4.4% 4.2%
3.6% 2.8% 2.6% 2.6%
2.3% 1.8% 1.6% 1.4% 1.3%
2.2%
BrazilMexico
ColombiaPeru
PanamaCosta Rica
EcuadorGuatemala
Dom RepUruguay
ChileArgentina
T & TParaguay
El SalvadorGermanyHonduras
Other
35.8% 7.1%
6.6% 6.0%
5.4% 5.2%
4.3% 4.2% 4.1% 4.0%
3.0% 2.9%
2.0% 1.7% 1.5% 1.2% 1.1% 1.1% 1.1% 0.9% 0.8%
Financial InstitutionsGrains and Oilseeds
Oil & Gas (Downstream)Oil & Gas (Integrated)
Metal ManufacturingFood & Beverage
CoffeeSugar
Other Manu. IndustriesOther Services
AirlinesElectric Power
Oil & Gas (Upstream)Retail Trade
ShippingTelecommunications
PetrochemicalWholesalers
Plastics & PackagingPaper
Mining
…through a Sustainable Portfolio Strategy
Focused on Diversification…
As of December 31, 2014
By Country
As of December 31, 2014
By Industry
Sustained Portfolio Growth
Reduced exposure to Brazil by
10 percentage points between
2010 and 2014
Commercial Portfolio (EOP balances, in US$ millions)
Commercial Portfolio Composition
As of December 31, 2014
56%
44% Trade
Non-trade
*Short-term is defined as original maturities of <1 year; current portion of long-term is defined as remaining tenor is <1 year
**Exposures in countries outside LatAm corresponds to credit extended to subsidiaries in LatAm with head office guarantee
Source: Company filings
82%
18%
Trade Non-trade
18%
28% 54%
Long-term(current)*
Long-term
Short-term*
27%
13%
10% 24%
23%
3% Brazil
Mexico
SoCo
Andean
CCA
Other**
36%
7%
57%
FinancialInstitutions
Middle-Market Corp
Corporations
4,064 4,960
5,716 6,148 6,686
382
394 237
482 501
$4,446
$5,354 $5,953
$6,630 $7,187
2010 2011 2012 2013 2014
Loans Acceptances and Contingencies
11
71%
29%
Maturity < 1 yrMaturity > 1 yr

…a Strong Asset Quality Management and a
Low Risk Core Business Focus
Commercial Portfolio by Type of Transaction
Non-Performing Loans Evolution
Commercial Portfolio by Remaining Term
Rigorous Non-Performing Loans (NPL) monitoring, pro-
active loss prevention and diligent recovery processes -
minimal historical losses and NPL balances
Reserve Coverage Ratio reverting to historical pre-crisis
levels
Low Risk Core: privileged asset class, short-term nature,
superior loss performance, minimal interest rate exposure
*Short-term is defined as original maturities of <1 year; current portion of long-term is defined as remaining tenor is <1 year
Source: Company filings
Bladex portfolio is mostly trade related, a privileged asset class due to its
short-term nature and superior comparative performance
57% 58% 64% 59% 54% 53%
14% 12% 13% 14% 18% 20%
28% 30% 23% 27% 28% 27%
2010 2011 2012 2013 2014 1Q 2015
Short-term* Long-term (current)* Long-term
59% 59% 61% 58% 56% 54%
41% 41% 39% 42% 44% 46%
2010 2011 2012 2013 2014 1Q 2015
Trade Non-trade
As of March 31, 2015, 73% of the loan portfolio had a residual time to
maturity no longer than one year, with an average tenor of 113 days. The
average residual tenor of the medium term portfolio was 2.2 years. The
average time to maturity of the total loan portfolio was 307 days
12
(US$ millions)
29.0 32.0
3.1 4.0
21.0
0.71% 0.65%
0.05% 0.06%
0.32%
3.2x 3.0x
25.0x
21.4x
4.2x
-
5.0
10.0
15.0
20.0
25.0
30.0
35.0
0
0.001
0.002
0.003
0.004
0.005
0.006
0.007
0.008
2010 2011 2012 2013 2014 1Q 2015
Non-performing loan balanceNon-performing loans to total loan portfolio, net of discountsCredit provision to non-performing loan balances (times)
Diversified Regional and Global Funding
Sources…
Funding Highlights
Deposits by Type of Client
Funding Sources & Cost of Funds
Diversified Funding Sources
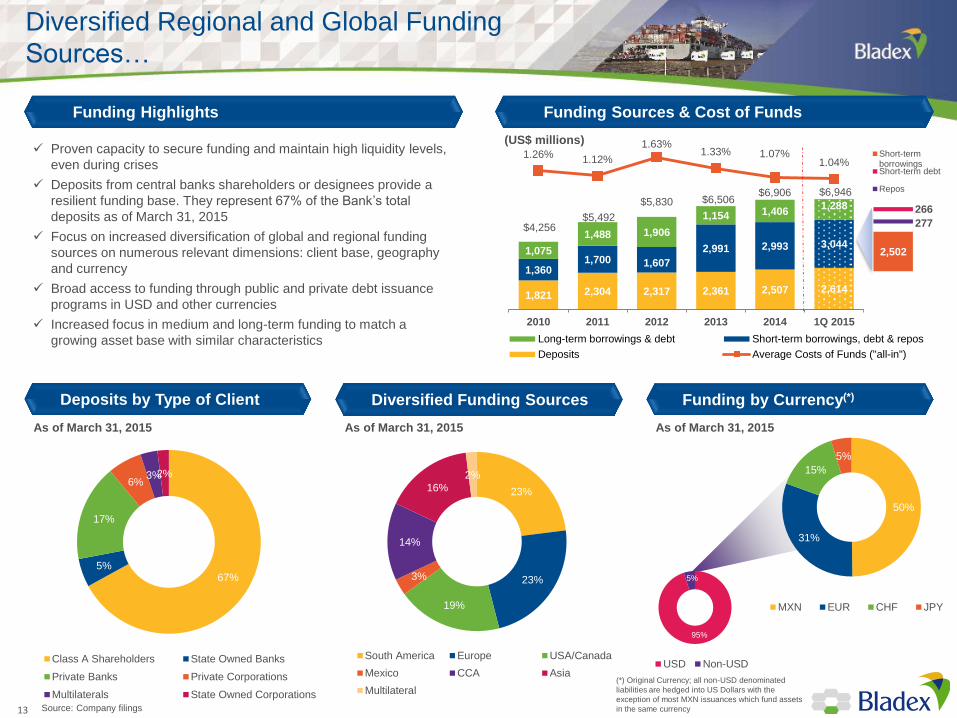
Proven capacity to secure funding and maintain high liquidity levels,
even during crises
Deposits from central banks shareholders or designees provide a
resilient funding base. They represent 67% of the Bank’s total
deposits as of March 31, 2015
Focus on increased diversification of global and regional funding
sources on numerous relevant dimensions: client base, geography
and currency
Broad access to funding through public and private debt issuance
programs in USD and other currencies
Increased focus in medium and long-term funding to match a
growing asset base with similar characteristics
Funding by Currency(*)
As of March 31, 2015 As of March 31, 2015 As of March 31, 2015
Source: Company filings
23%
23%
19%
3%
14%
16%
2%
South America Europe USA/Canada
Mexico CCA Asia
Multilateral
95%
5%
USD Non-USD
50%
31%
15%
5%
MXN EUR CHF JPY
(*) Original Currency; all non-USD denominated
liabilities are hedged into US Dollars with the
exception of most MXN issuances which fund assets
in the same currency 13
67% 5%
17%
6% 3% 2%
Class A Shareholders State Owned Banks
Private Banks Private Corporations
Multilaterals State Owned Corporations
(US$ millions) Short-termborrowingsShort-term debt
Repos
1,821 2,304 2,317 2,361 2,507 2,614
1,360 1,700 1,607
2,991 2,993 3,044 1,075
1,488 1,906
1,154 1,406 1,288
2,502
277
266
$4,256 $5,492
$5,830 $6,506 $6,906 $6,946
1.26% 1.12%
1.63% 1.33% 1.07%
1.04%
-2.50%
-2.00%
-1.50%
-1.00%
-0.50%
0.00%
0.50%
1.00%
1.50%
0
1,000
2,000
3,000
4,000
5,000
6,000
7,000
8,000
9,000
10,000
2010 2011 2012 2013 2014 1Q 2015
Long-term borrowings & debt Short-term borrowings, debt & repos
Deposits Average Costs of Funds ("all-in")

73%
16%
8% 3%
USD CHF EUR JPY
…with Ample Capital Markets Access through
EMTN and Mexico Programs…
Debt Issuance Highlights EMTN Issuance (Private Placements)
In 2012 Bladex issued its debut 144A/Reg S for US$400 millions
In 2013 the Bank re-launched its EMTN program with a maximum
size of US$2.3 billion, targeted to non-bank institutional investors
and providing a robust source of funding in various currencies and
across a diversified range of markets. It has since raised almost
US$900 million in private placements
A short- and long-term notes Mexican Program was established in
2012 with a maximum size of MX$10 billion (or equivalent). Two
issuances (“Certificados Bursátiles”) for MX$2 billion each were
executed in 2012 and 2014
(US$ millions equivalent)
Source: Bladex
EMTN Issuance by Currency & Maturity Average Nominal Rate of EMTN Placements
2013 – 1Q 2015 (US$ millions)
332
111 134
140
84
87
$472
$195 $221
0
50
100
150
200
250
300
350
400
450
500
2013 2014 1Q 2015
Fixed Floating
247 144
225
94
77 69
1.01%
0.72% 0.76%
1.38%
1.06%
1.24%
2.83%
$472
$195 $221
0
100
200
300
400
500
600
700
800
900
1000
0.00%
0.20%
0.40%
0.60%
0.80%
1.00%
1.20%
1.40%
1.60%
1.80%
2013 2014 1Q 2015
Placements < 1 year Placements 1 to 5 years Placements > 5 years
Average Nominal Rate Average Nominal Rate Average Nominal Rate
14
19%
25%
3%
40%
13%
≤ 3 months 6 months
9 months 1 year
Over 1 year
…with Conservative Liquidity Management
Liquidity Management Highlights Liquidity Placements
Liquidity Ratio Liquidity Coverage Ratio
(US$ millions)
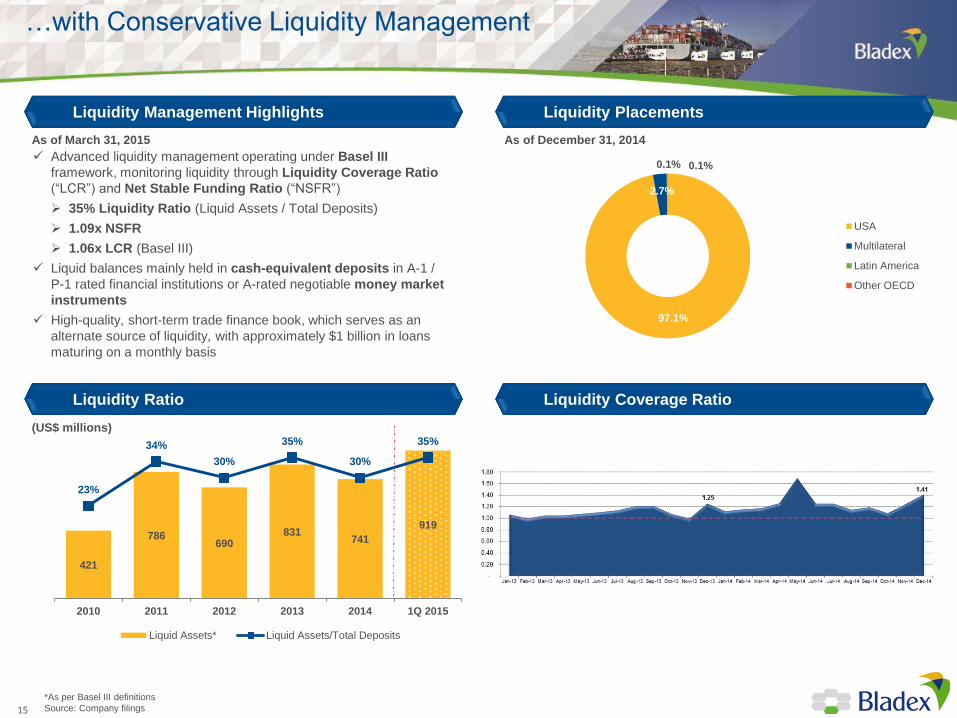
97.1%
2.7%
0.1% 0.1%
USA
Multilateral
Latin America
Other OECD
Advanced liquidity management operating under Basel III
framework, monitoring liquidity through Liquidity Coverage Ratio
(“LCR”) and Net Stable Funding Ratio (“NSFR”)
35% Liquidity Ratio (Liquid Assets / Total Deposits)
1.09x NSFR
1.06x LCR (Basel III)
Liquid balances mainly held in cash-equivalent deposits in A-1 /
P-1 rated financial institutions or A-rated negotiable money market
instruments
High-quality, short-term trade finance book, which serves as an
alternate source of liquidity, with approximately $1 billion in loans
maturing on a monthly basis
As of December 31, 2014
*As per Basel III definitions
Source: Company filings
As of March 31, 2015
421
786 690
831 741
919
23%
34%
30%
35%
30%
35%
0%
5%
10%
15%
20%
25%
30%
35%
40%
0
100
200
300
400
500
600
700
800
900
1000
2010 2011 2012 2013 2014 1Q 2015
Liquid Assets* Liquid Assets/Total Deposits
15
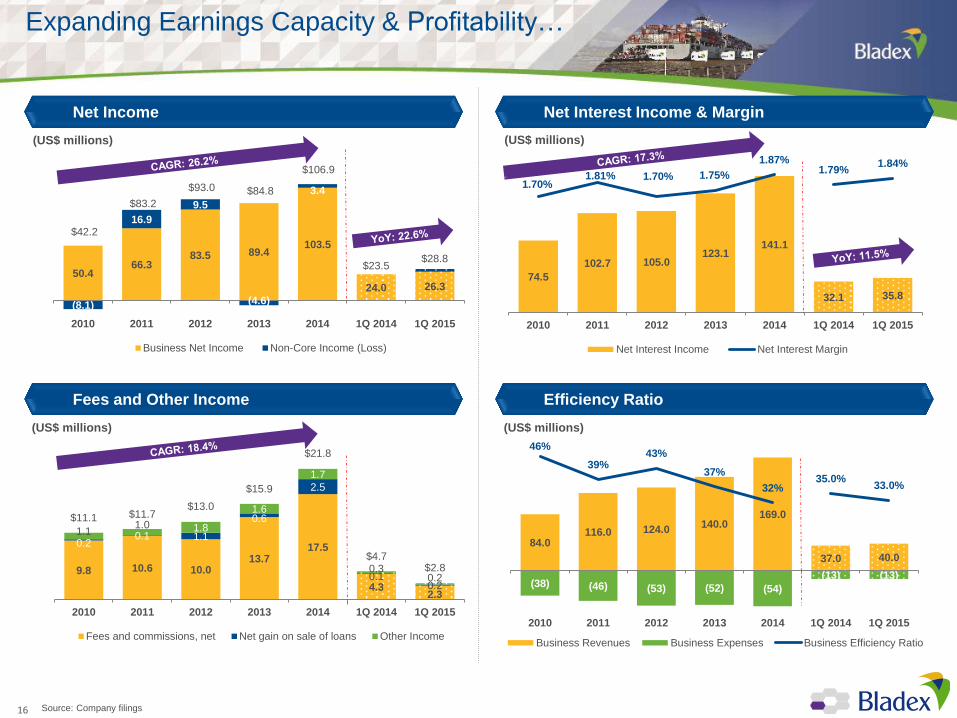
50.4 66.3
83.5 89.4 103.5
24.0 26.3
(8.1)
16.9
9.5
(4.6)
3.4
$42.2
$83.2
$93.0 $84.8
$106.9
$23.5 $28.8
2010 2011 2012 2013 2014 1Q 2014 1Q 2015
Business Net Income Non-Core Income (Loss)
Expanding Earnings Capacity & Profitability…
Net Income Net Interest Income & Margin
Fees and Other Income
(US$ millions)
Efficiency Ratio
(US$ millions)
(US$ millions) (US$ millions)
Source: Company filings
74.5
102.7 105.0 123.1
141.1
32.1 35.8
1.70% 1.81% 1.70% 1.75%
1.87% 1.79%
1.84%
0.80%
1.00%
1.20%
1.40%
1.60%
1.80%
2.00%
-
20.0
40.0
60.0
80.0
100.0
120.0
140.0
160.0
2010 2011 2012 2013 2014 1Q 2014 1Q 2015
Net Interest Income Net Interest Margin
84.0 116.0 124.0
140.0 169.0
37.0 40.0
(38) (46) (53) (52) (54)
(13) (13)
46%
39% 43%
37%
32% 35.0%
33.0%
0.0%
5.0%
10.0%
15.0%
20.0%
25.0%
30.0%
35.0%
40.0%
45.0%
50.0%
(60.0)
(10.0)
40.0
90.0
140.0
190.0
2010 2011 2012 2013 2014 1Q 2014 1Q 2015
Business Revenues Business Expenses Business Efficiency Ratio
16
9.8 10.6 10.0 13.7
17.5
4.3 2.3
0.2 0.1 1.1
0.6
2.5
0.1 0.2
1.1 1.0 1.8
1.6
1.7
0.3 0.2
$11.1 $11.7 $13.0
$15.9
$21.8
$4.7 $2.8
2010 2011 2012 2013 2014 1Q 2014 1Q 2015
Fees and commissions, net Net gain on sale of loans Other Income

…with a Solid and Growing Balance Sheet...
Total Assets Loan Portfolio
Deposits
(US$ millions)
Stockholder’s Equity
(US$ millions)
(US$ millions) (US$ millions)
Source: Company filings
$5,100
$6,360 $6,756
$7,471 $8,025
$7,179
$7,955
2010 2011 2012 2013 2014 1Q 2014 1Q 2015
$4,064
$4,960
$5,716 $6,148
$6,686
$6,098 $6,569
2010 2011 2012 2013 2014 1Q 2014 1Q 2015
$1,821
$2,304 $2,317 $2,361 $2,507 $2,511
$2,614
2010 2011 2012 2013 2014 1Q 2014 1Q 2015
$697 $759
$826 $858
$911 $885 $941
2010 2011 2012 2013 2014 1Q 2014 1Q 2015
17

…and Strong and Reliable Performance Metrics
Business Return on Average Equity (“ROAE”) Business Return on Average Assets (“ROAA”)
Tier 1 Capital Ratio Stockholder's Equity / Total Assets
The Bank’s Tier 1 capital ratio according to Basel III is only available as of December 31, 2014,
as the guidance on a number of regulatory reforms to the regulatory capital framework were
updates in 2013.
(US$ millions)
Source: Company filings
7.4%
9.1%
10.4% 10.6%
11.6% 11.2% 11.5%
2010 2011 2012 2013 2014 1Q 2014 1Q 2015
1.0%
1.2%
1.4% 1.3%
1.4% 1.3% 1.3%
2010 2011 2012 2013 2014 1Q 2014 1Q 2015
20.5% 18.6% 17.9%
15.9% 15.3%
15.6%
16.4% 16.2%
16.4%
7.3x
8.4x 8.2x 8.7x 8.8x
8.1x 8.4x
-
1.0
2.0
3.0
4.0
5.0
6.0
7.0
8.0
9.0
0.0%
5.0%
10.0%
15.0%
20.0%
25.0%
30.0%
2010 2011 2012 2013 2014 1Q 2014 1Q 2015
Tier 1 (Basel I)
Tier 1 (Basel III)
Leverage (times)
Regulatory Capital Ratio: 8.0%
18
697 759
826 858 911 885 941
13.7%
11.9% 12.2% 11.5% 11.4%
12.3% 11.8%
0.0%
2.0%
4.0%
6.0%
8.0%
10.0%
12.0%
14.0%
16.0%
-
100
200
300
400
500
600
700
800
900
1,000
2010 2011 2012 2013 2014 1Q 2014 1Q 2015Stockholder's Equity Stockholder's equity / Total assets

An Institution Adhering to World-Class
Standards…
(*) A substantial majority (nine out of ten Directors) of Bladex’s Board is
independent. Except for the Bank’s Chief Executive Officer (CEO), all other
members of the Board of Directors are independent.
An Institution Adhering to World-Class Standards
Second line of defense: Monitoring
Third line of defense: Assurance
First line of defense: Operating management
Board of Directors*
CEO
Risk Management Division
Commercial Division
Finance Division
Corporate Services
Internal Audit
Risk Policy and Assessment Committee
Finance & Business Committee
Nomination and Compensation
Committee
Audit and Compliance Committee
High corporate governance standards
Multiple regulators: FED, SEC, NYSDFS, Superintendence of Panama, and other
entities
Enterprise risk management & externally certified internal audit function
Internal alignment of corporate culture, measurement system and process
management to optimize total shareholder return
19
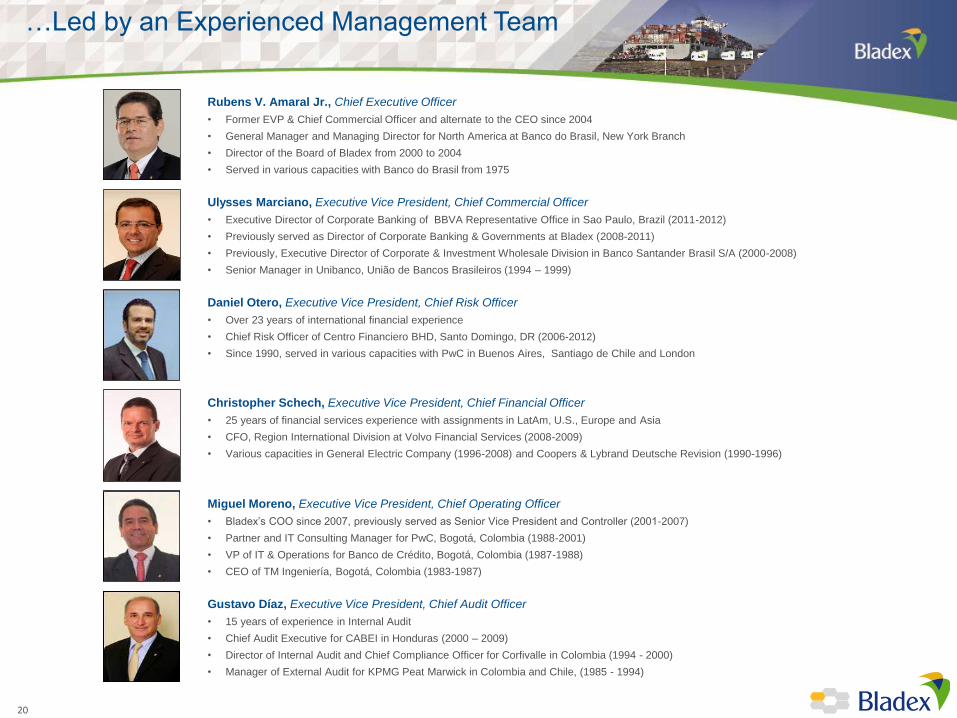
Ulysses Marciano, Executive Vice President, Chief Commercial Officer
• Executive Director of Corporate Banking of BBVA Representative Office in Sao Paulo, Brazil (2011-2012)
• Previously served as Director of Corporate Banking & Governments at Bladex (2008-2011)
• Previously, Executive Director of Corporate & Investment Wholesale Division in Banco Santander Brasil S/A (2000-2008)
• Senior Manager in Unibanco, União de Bancos Brasileiros (1994 – 1999)
Rubens V. Amaral Jr., Chief Executive Officer
• Former EVP & Chief Commercial Officer and alternate to the CEO since 2004
• General Manager and Managing Director for North America at Banco do Brasil, New York Branch
• Director of the Board of Bladex from 2000 to 2004
• Served in various capacities with Banco do Brasil from 1975
Daniel Otero, Executive Vice President, Chief Risk Officer
• Over 23 years of international financial experience
• Chief Risk Officer of Centro Financiero BHD, Santo Domingo, DR (2006-2012)
• Since 1990, served in various capacities with PwC in Buenos Aires, Santiago de Chile and London
Christopher Schech, Executive Vice President, Chief Financial Officer
• 25 years of financial services experience with assignments in LatAm, U.S., Europe and Asia
• CFO, Region International Division at Volvo Financial Services (2008-2009)
• Various capacities in General Electric Company (1996-2008) and Coopers & Lybrand Deutsche Revision (1990-1996)
Miguel Moreno, Executive Vice President, Chief Operating Officer
• Bladex’s COO since 2007, previously served as Senior Vice President and Controller (2001-2007)
• Partner and IT Consulting Manager for PwC, Bogotá, Colombia (1988-2001)
• VP of IT & Operations for Banco de Crédito, Bogotá, Colombia (1987-1988)
• CEO of TM Ingeniería, Bogotá, Colombia (1983-1987)
Gustavo Díaz, Executive Vice President, Chief Audit Officer
• 15 years of experience in Internal Audit
• Chief Audit Executive for CABEI in Honduras (2000 – 2009)
• Director of Internal Audit and Chief Compliance Officer for Corfivalle in Colombia (1994 - 2000)
• Manager of External Audit for KPMG Peat Marwick in Colombia and Chile, (1985 - 1994)
…Led by an Experienced Management Team
20

Conservative Risk Management Practices
Our “Enterprise-Wide Risk Management Framework” establishes that the identification and
valuation of all risks is essential for their management. The risk map covers the main
categories of risk where Bladex has material current or potential exposures.
Risk Map
Bladex Enterprise-Wide Risk Management
Default
Counterparty
Country
Sector
Concentration
Price
Liquidity
Interest Rates
Exchange rate
Internal Fraud
External fraud
Labor Policies
Business
Practices
Asset Damages
IT Failures
Process Failures
Legal
Reputational
Strategic
Credit Risk Market Risk Operational Risk Business Risk
1. Business and support areas are responsible for implementing business and risk-related
decisions, carrying out business within the risk limits set forth in policies, and reporting on their
results
2. Active monitoring through risk management, promoting independent review of the business with
heightened awareness of the risks involved
3. Assurance is conducted by Internal Audit, assessing effectiveness of the risk management
system in terms of:
Reliability and integrity of financial and operational information;
Effectiveness and efficiency of operations;
Protection of assets and compliance with laws, regulations and contracts
.
SECOND LINE
OF DEFENSEMonitoring
-------------------------
Risk function
FIRST LINE
OF DEFENSE
Operating
Management
-------------------------
Front-end &
enabling functions
THIRD LINE
OF DEFENSEAssurance
-------------------------
Audit function
21
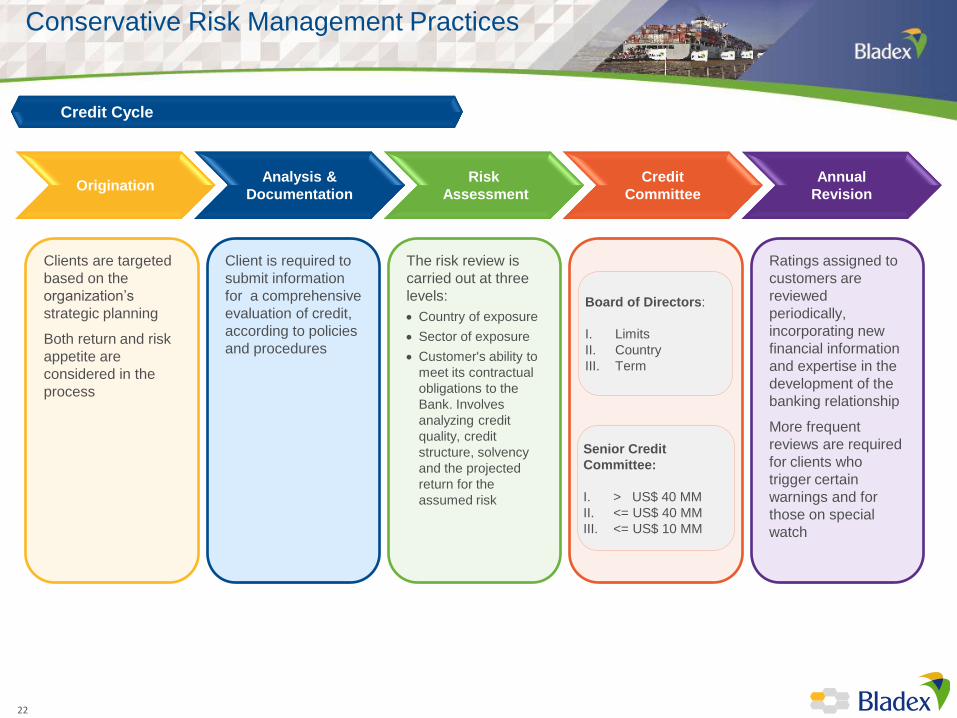
Conservative Risk Management Practices
Clients are targeted
based on the
organization’s
strategic planning
Both return and risk
appetite are
considered in the
process
Analysis &
Documentation Origination
Risk
Assessment
Credit
Committee
Annual
Revision
The risk review is
carried out at three
levels:
Country of exposure
Sector of exposure
Customer's ability to
meet its contractual
obligations to the
Bank. Involves
analyzing credit
quality, credit
structure, solvency
and the projected
return for the
assumed risk
Client is required to
submit information
for a comprehensive
evaluation of credit,
according to policies
and procedures
Ratings assigned to
customers are
reviewed
periodically,
incorporating new
financial information
and expertise in the
development of the
banking relationship
More frequent
reviews are required
for clients who
trigger certain
warnings and for
those on special
watch
Board of Directors:
I. Limits
II. Country
III. Term
Senior Credit
Committee:
I. > US$ 40 MM
II. <= US$ 40 MM
III. <= US$ 10 MM
Credit Cycle
22
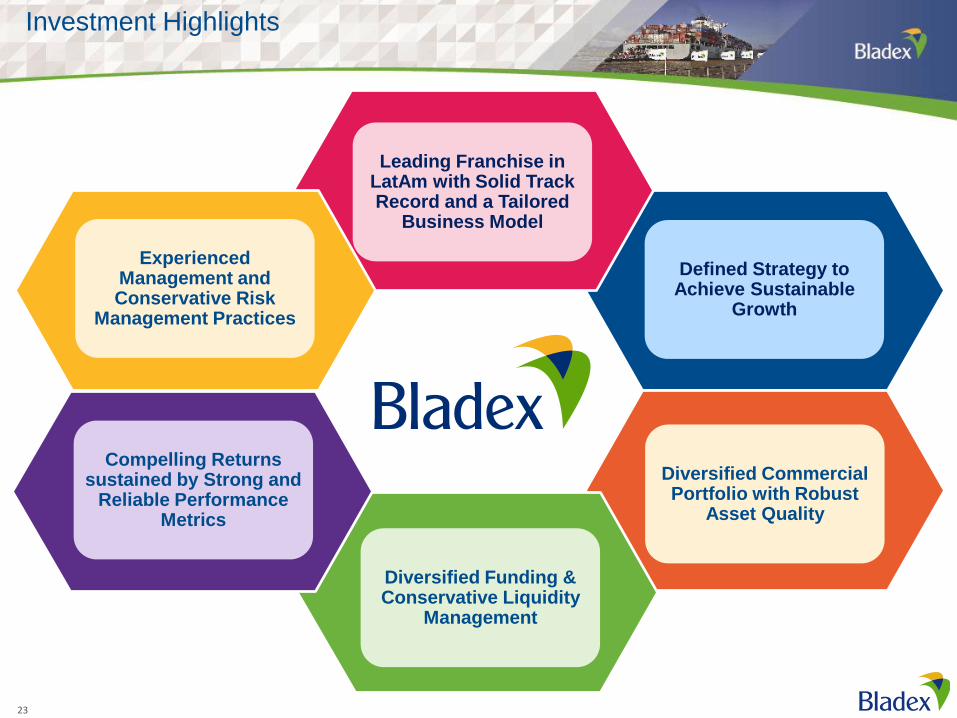
Investment Highlights
Diversified Commercial Portfolio with Robust
Asset Quality
Defined Strategy to Achieve Sustainable
Growth
Diversified Funding & Conservative Liquidity
Management
Experienced Management and Conservative Risk
Management Practices
Compelling Returns sustained by Strong and
Reliable Performance Metrics
Leading Franchise in LatAm with Solid Track Record and a Tailored
Business Model
23
Appendix
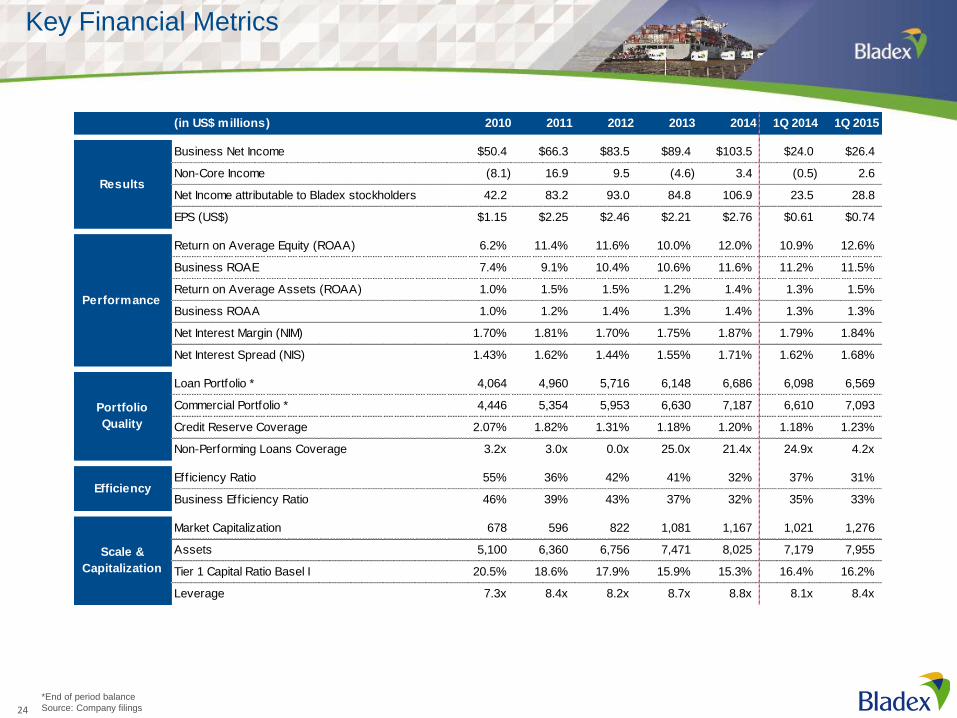
Key Financial Metrics
*End of period balance
Source: Company filings 24
(in US$ millions) 2010 2011 2012 2013 2014 1Q 2014 1Q 2015
Business Net Income $50.4 $66.3 $83.5 $89.4 $103.5 $24.0 $26.4
Non-Core Income (8.1) 16.9 9.5 (4.6) 3.4 (0.5) 2.6
Net Income attributable to Bladex stockholders 42.2 83.2 93.0 84.8 106.9 23.5 28.8
EPS (US$) $1.15 $2.25 $2.46 $2.21 $2.76 $0.61 $0.74
Return on Average Equity (ROAA) 6.2% 11.4% 11.6% 10.0% 12.0% 10.9% 12.6%
Business ROAE 7.4% 9.1% 10.4% 10.6% 11.6% 11.2% 11.5%
Return on Average Assets (ROAA) 1.0% 1.5% 1.5% 1.2% 1.4% 1.3% 1.5%
Business ROAA 1.0% 1.2% 1.4% 1.3% 1.4% 1.3% 1.3%
Net Interest Margin (NIM) 1.70% 1.81% 1.70% 1.75% 1.87% 1.79% 1.84%
Net Interest Spread (NIS) 1.43% 1.62% 1.44% 1.55% 1.71% 1.62% 1.68%
Loan Portfolio * 4,064 4,960 5,716 6,148 6,686 6,098 6,569
Commercial Portfolio * 4,446 5,354 5,953 6,630 7,187 6,610 7,093
Credit Reserve Coverage 2.07% 1.82% 1.31% 1.18% 1.20% 1.18% 1.23%
Non-Performing Loans Coverage 3.2x 3.0x 0.0x 25.0x 21.4x 24.9x 4.2x
Efficiency Ratio 55% 36% 42% 41% 32% 37% 31%
Business Efficiency Ratio 46% 39% 43% 37% 32% 35% 33%
Market Capitalization 678 596 822 1,081 1,167 1,021 1,276
Assets 5,100 6,360 6,756 7,471 8,025 7,179 7,955
Tier 1 Capital Ratio Basel I 20.5% 18.6% 17.9% 15.9% 15.3% 16.4% 16.2%
Leverage 7.3x 8.4x 8.2x 8.7x 8.8x 8.1x 8.4x
Results
Performance
Portfolio
Quality
Efficiency
Scale &
Capitalization
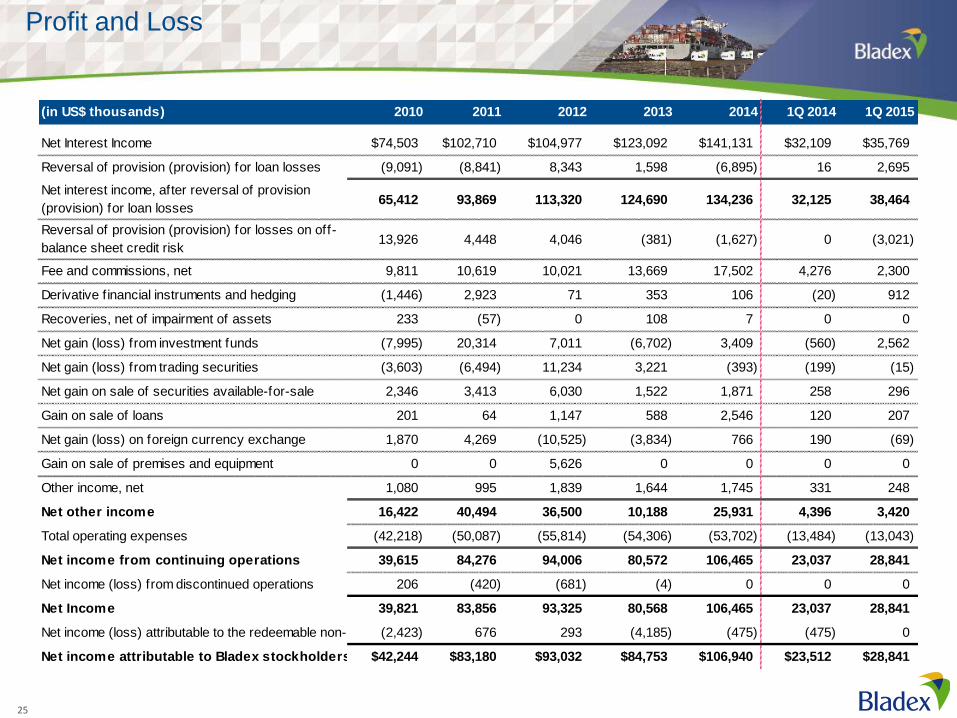
Profit and Loss
25
(in US$ thousands) 2010 2011 2012 2013 2014 1Q 2014 1Q 2015
Net Interest Income $74,503 $102,710 $104,977 $123,092 $141,131 $32,109 $35,769
Reversal of provision (provision) for loan losses (9,091) (8,841) 8,343 1,598 (6,895) 16 2,695
Net interest income, after reversal of provision
(provision) for loan losses65,412 93,869 113,320 124,690 134,236 32,125 38,464
Reversal of provision (provision) for losses on off-
balance sheet credit risk13,926 4,448 4,046 (381) (1,627) 0 (3,021)
Fee and commissions, net 9,811 10,619 10,021 13,669 17,502 4,276 2,300
Derivative f inancial instruments and hedging (1,446) 2,923 71 353 106 (20) 912
Recoveries, net of impairment of assets 233 (57) 0 108 7 0 0
Net gain (loss) from investment funds (7,995) 20,314 7,011 (6,702) 3,409 (560) 2,562
Net gain (loss) from trading securities (3,603) (6,494) 11,234 3,221 (393) (199) (15)
Net gain on sale of securities available-for-sale 2,346 3,413 6,030 1,522 1,871 258 296
Gain on sale of loans 201 64 1,147 588 2,546 120 207
Net gain (loss) on foreign currency exchange 1,870 4,269 (10,525) (3,834) 766 190 (69)
Gain on sale of premises and equipment 0 0 5,626 0 0 0 0
Other income, net 1,080 995 1,839 1,644 1,745 331 248
Net other income 16,422 40,494 36,500 10,188 25,931 4,396 3,420
Total operating expenses (42,218) (50,087) (55,814) (54,306) (53,702) (13,484) (13,043)
Net income from continuing operations 39,615 84,276 94,006 80,572 106,465 23,037 28,841
Net income (loss) from discontinued operations 206 (420) (681) (4) 0 0 0
Net Income 39,821 83,856 93,325 80,568 106,465 23,037 28,841
Net income (loss) attributable to the redeemable non-controlling interest(2,423) 676 293 (4,185) (475) (475) 0
Net income attributable to Bladex stockholders $42,244 $83,180 $93,032 $84,753 $106,940 $23,512 $28,841
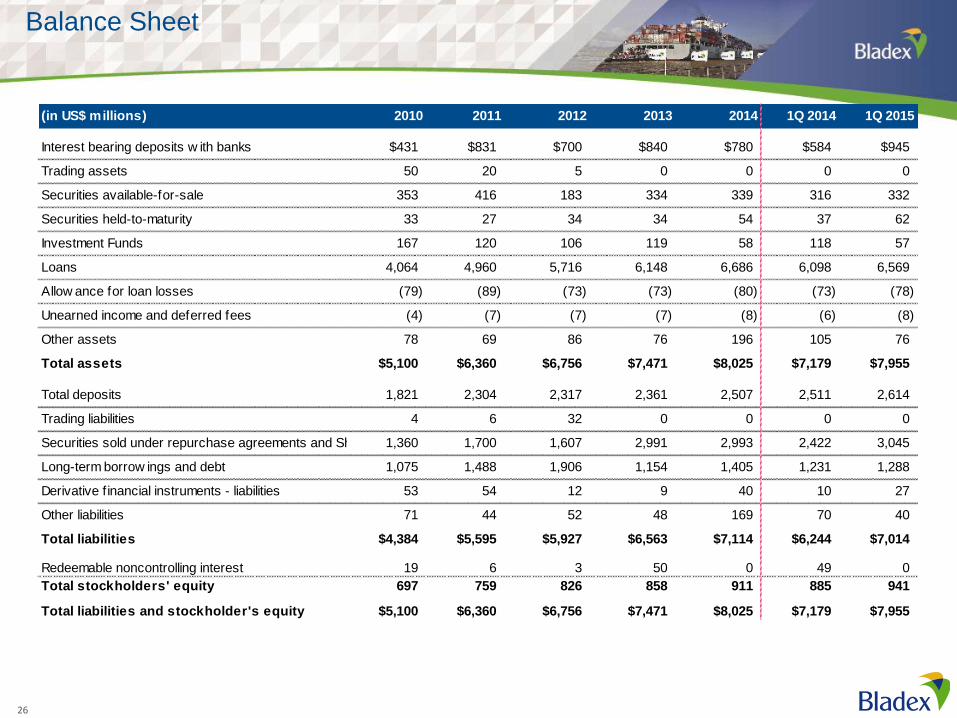
Balance Sheet
26
(in US$ millions) 2010 2011 2012 2013 2014 1Q 2014 1Q 2015
Interest bearing deposits w ith banks $431 $831 $700 $840 $780 $584 $945
Trading assets 50 20 5 0 0 0 0
Securities available-for-sale 353 416 183 334 339 316 332
Securities held-to-maturity 33 27 34 34 54 37 62
Investment Funds 167 120 106 119 58 118 57
Loans 4,064 4,960 5,716 6,148 6,686 6,098 6,569
Allow ance for loan losses (79) (89) (73) (73) (80) (73) (78)
Unearned income and deferred fees (4) (7) (7) (7) (8) (6) (8)
Other assets 78 69 86 76 196 105 76
Total assets $5,100 $6,360 $6,756 $7,471 $8,025 $7,179 $7,955
Total deposits 1,821 2,304 2,317 2,361 2,507 2,511 2,614
Trading liabilities 4 6 32 0 0 0 0
Securities sold under repurchase agreements and Short-term borrow ings1,360 1,700 1,607 2,991 2,993 2,422 3,045
Long-term borrow ings and debt 1,075 1,488 1,906 1,154 1,405 1,231 1,288
Derivative f inancial instruments - liabilities 53 54 12 9 40 10 27
Other liabilities 71 44 52 48 169 70 40
Total liabilities $4,384 $5,595 $5,927 $6,563 $7,114 $6,244 $7,014
Redeemable noncontrolling interest 19 6 3 50 0 49 0
Total stockholders' equity 697 759 826 858 911 885 941
Total liabilities and stockholder's equity $5,100 $6,360 $6,756 $7,471 $8,025 $7,179 $7,955
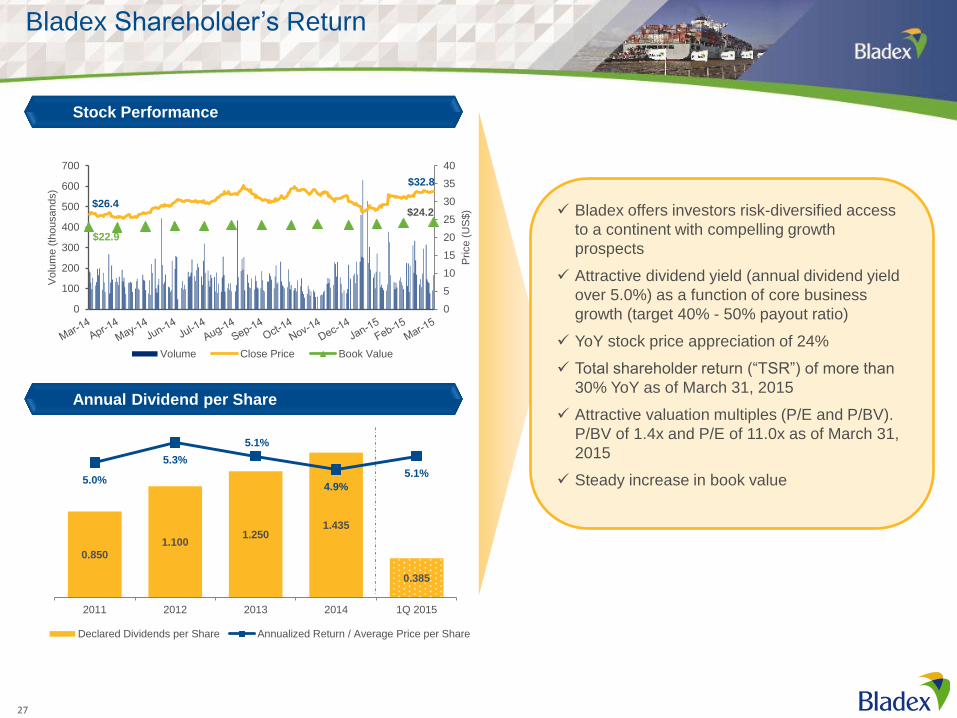
Bladex Shareholder’s Return
Stock Performance
Annual Dividend per Share
Bladex offers investors risk-diversified access
to a continent with compelling growth
prospects
Attractive dividend yield (annual dividend yield
over 5.0%) as a function of core business
growth (target 40% - 50% payout ratio)
YoY stock price appreciation of 24%
Total shareholder return (“TSR”) of more than
30% YoY as of March 31, 2015
Attractive valuation multiples (P/E and P/BV).
P/BV of 1.4x and P/E of 11.0x as of March 31,
2015
Steady increase in book value
0.850
1.100 1.250
1.435
0.385
5.0%
5.3%
5.1%
4.9%
5.1%
3.00%
3.50%
4.00%
4.50%
5.00%
0
0.2
0.4
0.6
0.8
1
1.2
1.4
1.6
2011 2012 2013 2014 1Q 2015
Declared Dividends per Share Annualized Return / Average Price per Share
$26.4
$32.8
$22.9
$24.2
0
5
10
15
20
25
30
35
40
0
100
200
300
400
500
600
700
Price (
US
$)
Volu
me (
thousands)
Volume Close Price Book Value
27
28