mckinsey redes sociales internas 2011
TRANSCRIPT
7/29/2019 McKinsey Redes Sociales Internas 2011
http://slidepdf.com/reader/full/mckinsey-redes-sociales-internas-2011 1/10
1
N O V E M B E R 2 0 11
How social technologies are
extending the organization
Our fifth annual survey on the way organizations use social
tools and technologies finds that they continue to seep into
many organizations, transforming business processes and
raising performance.
Jacques Bughin, Angela Hung Byers, and Michael Chui
m c k i n s e y g l o b a l i n s t i t u t e
7/29/2019 McKinsey Redes Sociales Internas 2011
http://slidepdf.com/reader/full/mckinsey-redes-sociales-internas-2011 2/10
2
Companies are improving their mastery of social technologies, using them to enhance
operations and exploit new market opportunities—key ndings of our fth annual survey
on these tools and technologies, in which we asked more than 4,200 global executives how
organizations deploy them and the benets they confer.1 When adopted at scale across
an emerging type of networked enterprise and integrated into the work processes of
employees, social technologies can boost a company’s nancial performance and market
share, respondents say, conrming last year’s survey results.
But this is a very dynamic environment, where the gains from using social technologies
sometimes do not persist, perhaps because it takes so much effort to achieve them at
scale. Some companies, respondents indicate, reaped fewer benets and thus became less
networked, while a smaller percentage learned how to deploy these technologies to become
even more networked. Executives say that their companies are using them to increase
their agility and to manage organizational complexity. Many believe that if organizational
barriers to the use of social technologies diminish, they could form the core of entirely new
business processes that may radically improve performance.
Usage at scale and continued benefits
Social technologies as a group have reached critical scale at the organizations represented
in our survey. Seventy-two percent of the respondents report that their companies are
deploying at least one technology, and more than 40 percent say that social networking
and blogs are now in use (Exhibit 1). These technologies are being deployed across
sectors, at the high level of 86 percent of the respondents’ companies in high tech and
telecommunications, but at 62 percent of companies even in the energy industry (Exhibit
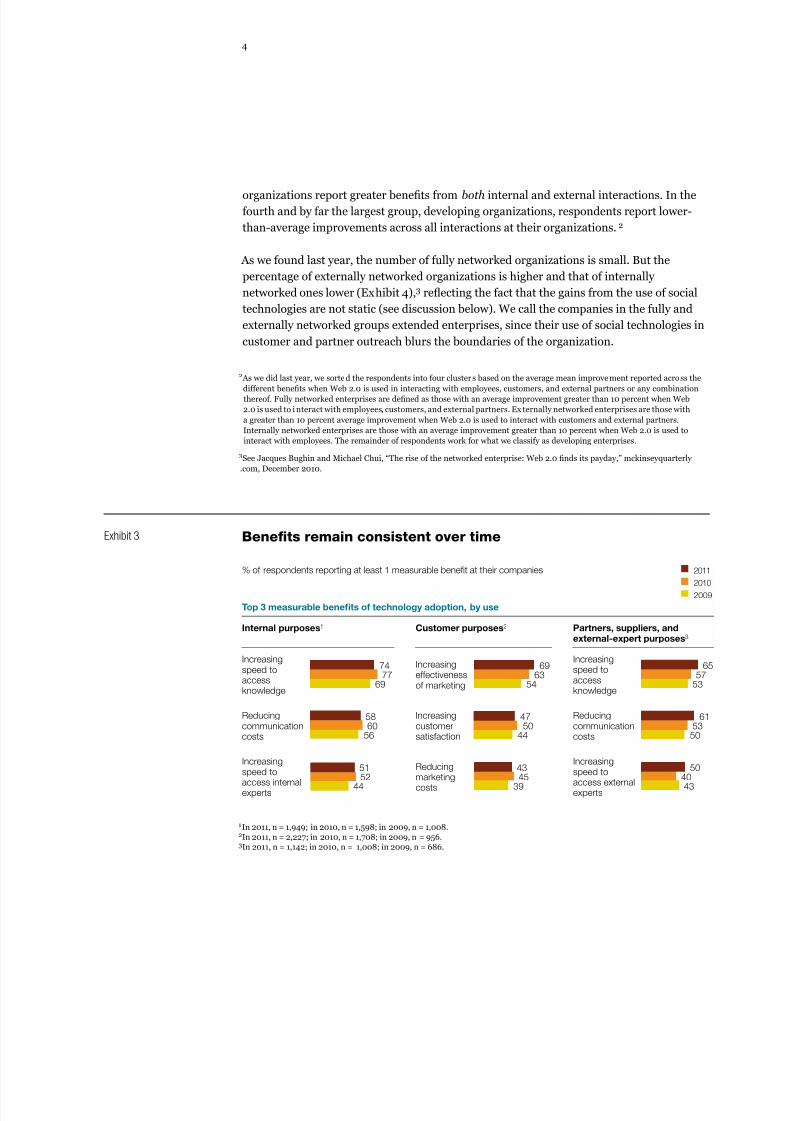
2). Levels of reported benets not only remain high when respondents’ organizations use
social tools for internal purposes but have also increased among those that use them for
communicating with customers or for integration with partners and suppliers (Exhibit 3).
The performance edge of networked enterprises
Last year, we identied a small group of respondents who indicated that their companies
had experienced superior performance from the use of social technologies across key
stakeholder groups. We repeated the analysis this year, looking at the average level of
improvements in business benets that executives reported. Four clusters emerge from our
analysis. Executives at internally networked organizations note the highest improvement
in benets from interactions with employees; those at externally networked organizations,
from interactions with customers, partners, and suppliers. Executives at fully networked
1 The online survey included 4,261 respondents across sectors, geographies, company sizes, tenures, and functional specialties.
As with sur veys in past years (when we referre d to social technologies as “Web 2.0”) the survey covers the adoption and usage
of technologies, their benets, and corporate performance. This year, we also asked about how organizations are using social
technologies and the types and magnitude of the organizational and process changes that could result.

7/29/2019 McKinsey Redes Sociales Internas 2011
http://slidepdf.com/reader/full/mckinsey-redes-sociales-internas-2011 3/10
3
Exhibit 2
% of respondents (n = 4,261)
High tech, telecommunications
Business, legal, professionalservices
Public administration
Pharmaceuticals
Retailing
Transportation
Health care, social services
Manufacturing
Financial services
Energy
86
77
74
74
69
69
67
64
64
62
Companies using at least 1 social-technology tool
Exhibit 1
% of respondents1 whose companies use each technology
1Respondents who answered “don’t know” are not shown.2Microblogging was not offered as a technology in the 2008 survey.
Social tools and technologies currently used by companies
Socialnetworking
Blogs
5040
2823
4138
3229
Microblogging
2319
12N/A 2
2011, n = 4,26
2010, n = 3,24
2009, n = 1,69
2008, n = 1,98
Video sharing
383331
27
Adoption o social technologies across industries
Rising adoption rates
7/29/2019 McKinsey Redes Sociales Internas 2011
http://slidepdf.com/reader/full/mckinsey-redes-sociales-internas-2011 4/10
4
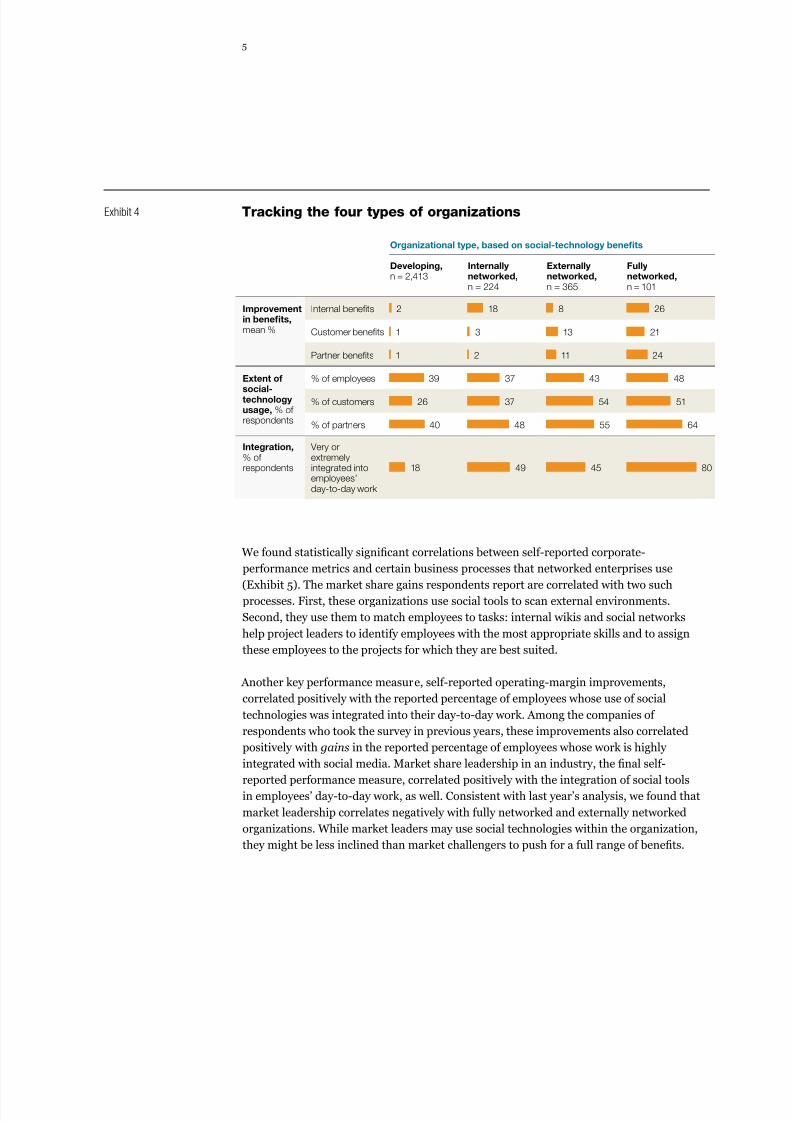
organizations report greater benets from both internal and external interactions. In the
fourth and by far the largest group, developing organizations, respondents report lower-
than-average improvements across all interactions at their organizations.2
As we found last year, the number of fully networked organizations is small. But the
percentage of externally networked organizations is higher and that of internally
networked ones lower (Exhibit 4),3 reecting the fact that the gains from the use of social
technologies are not static (see discussion below). We call the companies in the fully and
externally networked groups extended enterprises, since their use of social technologies in
customer and partner outreach blurs the boundaries of the organization.
Exhibit 3
% of respondents reporting at least 1 measurable benefit at their companies
Internal purposes1 Customer purposes2 Partners, suppliers, andexternal-expert purposes3
1In 2011, n = 1,949; in 2010, n = 1,598; in 2009, n = 1,008.2In 2011, n = 2,227; in 2010, n = 1,708; in 2009, n = 956.3In 2011, n = 1,142; in 2010, n = 1,008; in 2009, n = 686.
Increasingspeed toaccessknowledge
Increasingspeed toaccess internalexperts
Increasingspeed toaccess externalexperts
Reducingcommunicationcosts
7477
69
5860
56
5152
44
Increasingeffectivenessof marketing
Reducingmarketingcosts
Increasingcustomersatisfaction
6963
54
4750
44
4345
39
Increasingspeed toaccessknowledge
Reducingcommunicationcosts
657
53
615350
504043
201
201
200
Top 3 measurable benefits of technology adoption, by use
2 As we did last year, we sorted the respondents into four cluster s based on the average mean improvement reported across the
different benets when Web 2.0 is used in interacting with employees, customers, and external partners or any combination
thereof. Fully networked enterprises are dened as those with an average improvement greater than 10 percent when Web
2.0 is used to i nteract with employees, customers, and external partners. Ex ternally networked enterprises are those with
a greater than 10 percent average improvement when Web 2.0 is used to interact with customers and external partners.
Internally networked enterprises are those with an average improvement greater than 10 percent when Web 2.0 is used to
interact with employees. The remainder of respondents work for what we classify as developing enterprises.
3See Jacques Bughin and Michael Chui, “The rise of the networked enterprise: Web 2.0 nds its payday,” mckinseyquarterly
.com, December 2010.
Benefts remain consistent over time
7/29/2019 McKinsey Redes Sociales Internas 2011
http://slidepdf.com/reader/full/mckinsey-redes-sociales-internas-2011 5/10
5
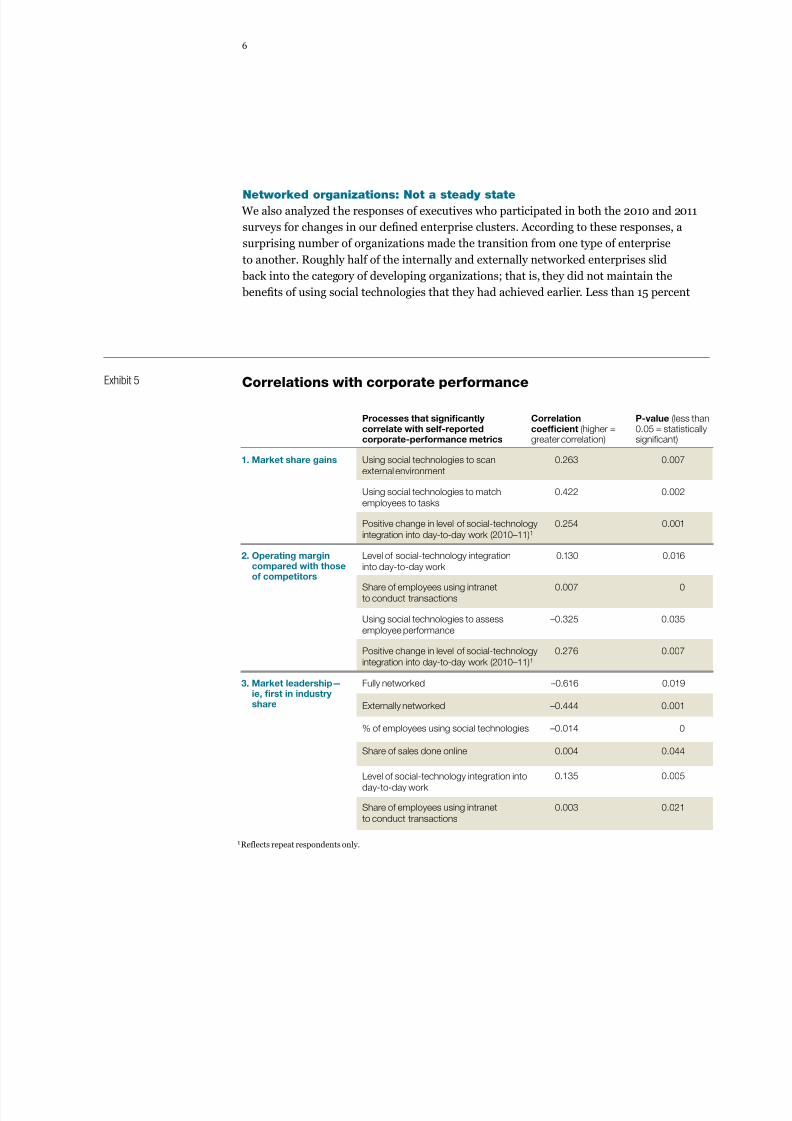
We found statistically signicant correlations between self-reported corporate-
performance metrics and certain business processes that networked enterprises use
(Exhibit 5). The market share gains respondents report are correlated with two such
processes. First, these organizations use social tools to scan external environments.
Second, they use them to match employees to tasks: internal wikis and social networks
help project leaders to identify employees with the most appropriate skills and to assign
these employees to the projects for which they are best suited.
Another key performance measure, self-reported operating-margin improvements,
correlated positively with the reported percentage of employees whose use of social
technologies was integrated into their day-to-day work. Among the companies of
respondents who took the survey in previous years, these improvements also correlated
positively with gains in the reported percentage of employees whose work is highly
integrated with social media. Market share leadership in an industry, the nal self-
reported performance measure, correlated positively with the integration of social tools
in employees’ day-to-day work, as well. Consistent with last year’s analysis, we found that
market leadership correlates negatively with fully networked and externally networked
organizations. While market leaders may use social technologies within the organization,
they might be less inclined than market challengers to push for a full range of benets.
Exhibit 4
Developing,n = 2,413
Internally networked,n = 224
Externally networked,n = 365
Fully networked,n = 101
Improvementin benefits,mean %
Integration,% of respondents
Extent ofsocial-technology usage, % of respondents
Very orextremelyintegrated intoemployees’day-to-day work
18 49 45 8
% of employees 39 37 43 48
% of partners 40 48 55 64
% of customers 26 37 54 51
Internal benefits 2 18 8 26
Customer benefits 1 3 13 21
Partner benefits 1 2 11 24
Organizational type, based on social-technology benefits
Tracking the our types o organizations
7/29/2019 McKinsey Redes Sociales Internas 2011
http://slidepdf.com/reader/full/mckinsey-redes-sociales-internas-2011 6/10
6
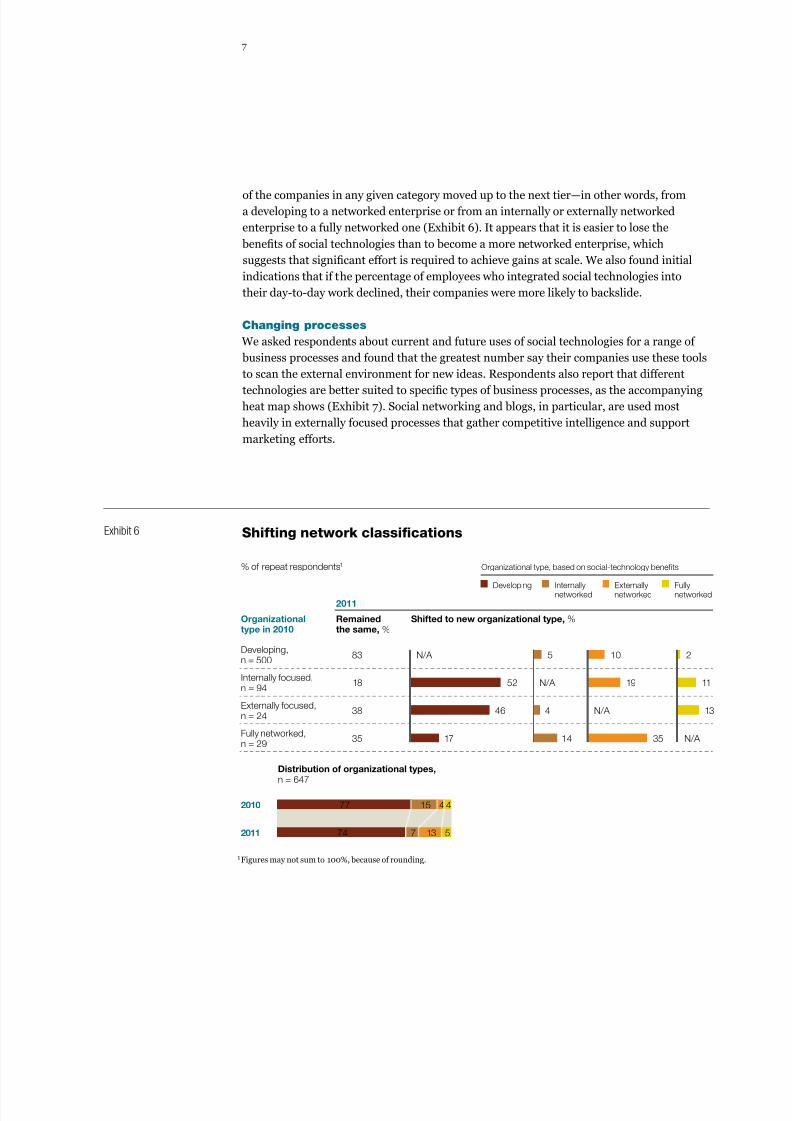
Networked organizations: Not a steady state
We also analyzed the responses of executives who participated in both the 2010 and 2011
surveys for changes in our dened enterprise clusters. According to these responses, a
surprising number of organizations made the transition from one type of enterprise
to another. Roughly half of the internally and externally networked enterprises slid
back into the category of developing organizations; that is, they did not maintain the
benets of using social technologies that they had achieved earlier. Less than 15 percent
Exhibit 5
P-value (less than0.05 = statisticallysignificant)
1Reflects repeat respondents only.
Correlationcoefficient (higher =greater correlation)
0.263 0.007
0.130 0.016
0.422 0.002
0.254 0.001
0.007 0
0.276 0.007
–0.325
–0.014
–0.325
0.035
Processes that significantly correlate with self-reportedcorporate-performance metrics
1. Market share gains Using social technologies to scan
external environment
2. Operating margincompared with thoseof competitors
Level of social-technology integration
into day-to-day work
Using social technologies to match
employees to tasks
Positive change in level of social-technology
integration into day-to-day work (2010–11)1
Share of employees using intranet
to conduct transactions
Positive change in level of social-technology
integration into day-to-day work (2010–11)1
Using social technologies to assess
employee performance
–0.616
0.001–0.444
0.019
0.004 0.044
0
3. Market leadership—ie, first in industry share
Fully networked
Externally networked
Share of sales done online
% of employees using social technologies
0.135 0.005Level of social-technology integration into
day-to-day work
0.003 0.021Share of employees using intranet
to conduct transactions
Correlations with corporate perormance
7/29/2019 McKinsey Redes Sociales Internas 2011
http://slidepdf.com/reader/full/mckinsey-redes-sociales-internas-2011 7/10
7
of the companies in any given category moved up to the next tier—in other words, from
a developing to a networked enterprise or from an internally or externally networked
enterprise to a fully networked one (Exhibit 6). It appears that it is easier to lose the
benets of social technologies than to become a more networked enterprise, which
suggests that signicant effort is required to achieve gains at scale. We also found initial
indications that if the percentage of employees who integrated social technologies into
their day-to-day work declined, their companies were more likely to backslide.
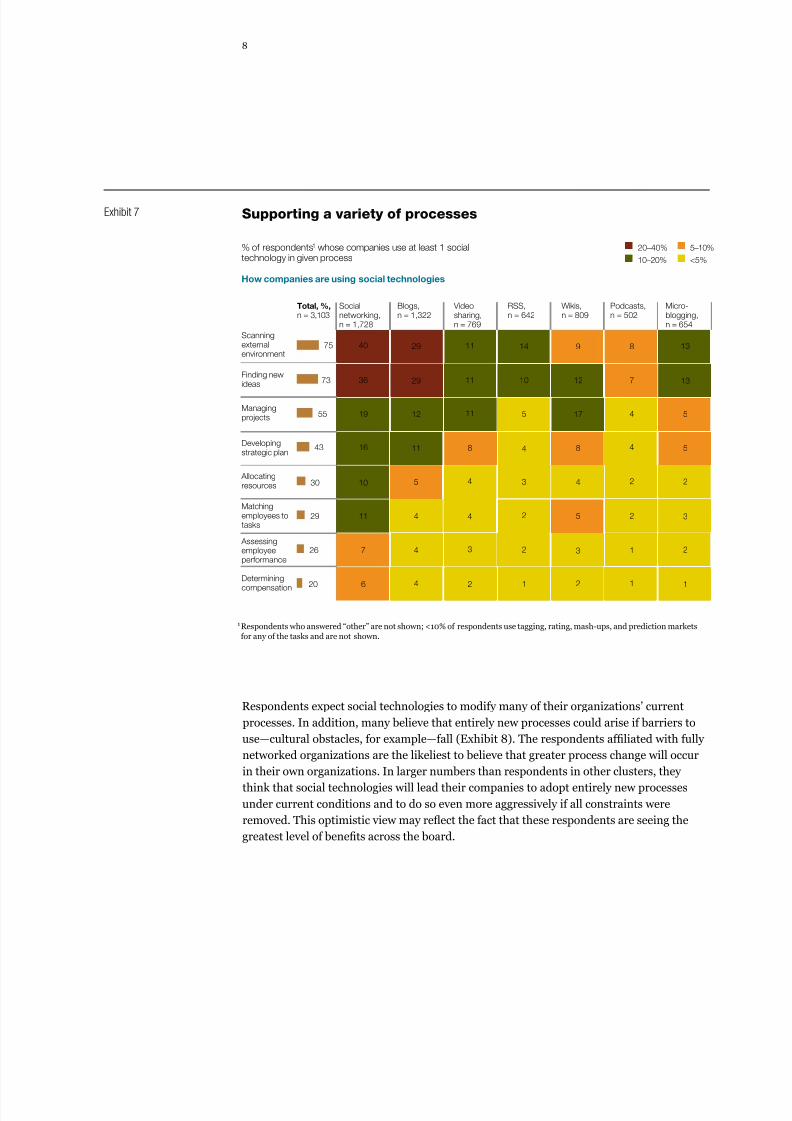
Changing processes
We asked respondents about current and future uses of social technologies for a range of
business processes and found that the greatest number say their companies use these tools
to scan the external environment for new ideas. Respondents also report that different
technologies are better suited to specic types of business processes, as the accompanying
heat map shows (Exhibit 7). Social networking and blogs, in particular, are used most
heavily in externally focused processes that gather competitive intelligence and support
marketing efforts.
Exhibit 6
% of repeat respondents1
Organizationaltype in 2010
Shifted to new organizational type, %Remainedthe same, %
2011
Developing Internallynetworked
Fullynetworke
Externallynetworked
Organizational type, based on social-technology benefits
Fully networked,n = 29
1417 3535
Externally focused,n = 24 438 146
Internally focused,n = 94
18 52 19 11
1Figures may not sum to 100%, because of rounding.
Developing,n = 500
83 25 10
2011
2010
Distribution of organizational types,n = 647
774 13 5
1577 4 4
N/A
N/A
N/A
N/A
Shiting network classifcations
7/29/2019 McKinsey Redes Sociales Internas 2011
http://slidepdf.com/reader/full/mckinsey-redes-sociales-internas-2011 8/10
8
Exhibit 7
% of respondents1 whose companies use at least 1 socialtechnology in given process
How companies are using social technologies
Total, %,n = 3,103
Blogs,n = 1,322
Micro-blogging,n = 654
Podcasts,n = 502
Socialnetworking,n = 1,728
Videosharing,n = 769
Wikis,n = 809
RSS,n = 642
Determiningcompensation 20 6 4 2 1 2 1 1
Allocatingresources 30 10 5 4 3 4 2 2
Assessingemployeeperformance
26 7 4 3 2 3 1 2
Matchingemployees totasks
29 11 4 4 2 5 2 3
Finding newideas 73 36 29 11 10 12 7 13
Scanningexternal
environment
75 40 29 11 14 9 8 13
Managingprojects 55 19 12 11 5 17 4 5
Developingstrategic plan
43 16 11 8 4 8 4 5
20–40%
10–20%
5–10
<5%
1Respondents who answered “other” are not shown; <10% of respondents use tagging, rating, mash-ups, and prediction marketsfor any of the tasks and are not shown.
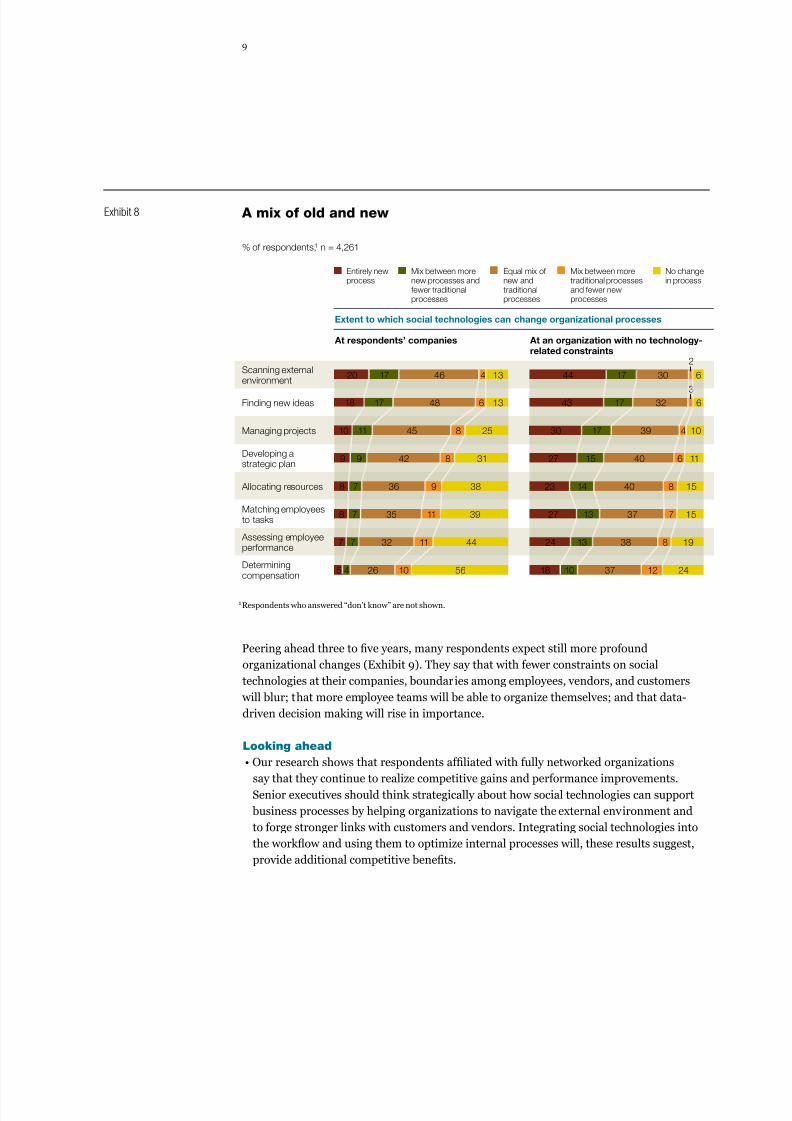
Respondents expect social technologies to modify many of their organizations’ currentprocesses. In addition, many believe that entirely new processes could arise if barriers to
use—cultural obstacles, for example—fall (Exhibit 8). The respondents afliated with fully
networked organizations are the likeliest to believe that greater process change will occur
in their own organizations. In larger numbers than respondents in other clusters, they
think that social technologies will lead their companies to adopt entirely new processes
under current conditions and to do so even more aggressively if all constraints were
removed. This optimistic view may reect the fact that these respondents are seeing the
greatest level of benets across the board.
Supporting a variety o processes
7/29/2019 McKinsey Redes Sociales Internas 2011
http://slidepdf.com/reader/full/mckinsey-redes-sociales-internas-2011 9/10
9
Exhibit 8
% of respondents,1 n = 4,261
At respondents’ companies
1Respondents who answered “don’t know” are not shown.
2
3
265 4 10 56Determiningcompensation
3718 10 12 24
327 7 11 44 Assessing employeeperformance
3824 13 8 19
358 7 11 39Matching employeesto tasks
3727 13 7 15
368 7 9 38 Allocating resources 4023 14 8 15
429 9 8 31Developing astrategic plan
4027 15 6 11
4818 17 6 13Finding new ideas 3243 17 6
4620 17 4 13Scanning externalenvironment
3044 17 6
4510 11 8 25 3930 17 4 10Managing projects
At an organization with no technology-
related constraints
Entirely newprocess
Mix between morenew processes andfewer traditionalprocesses
Equal mix of new andtraditionalprocesses
Mix between moretraditional processesand fewer newprocesses
No changein process
Extent to which social technologies can change organizational processes
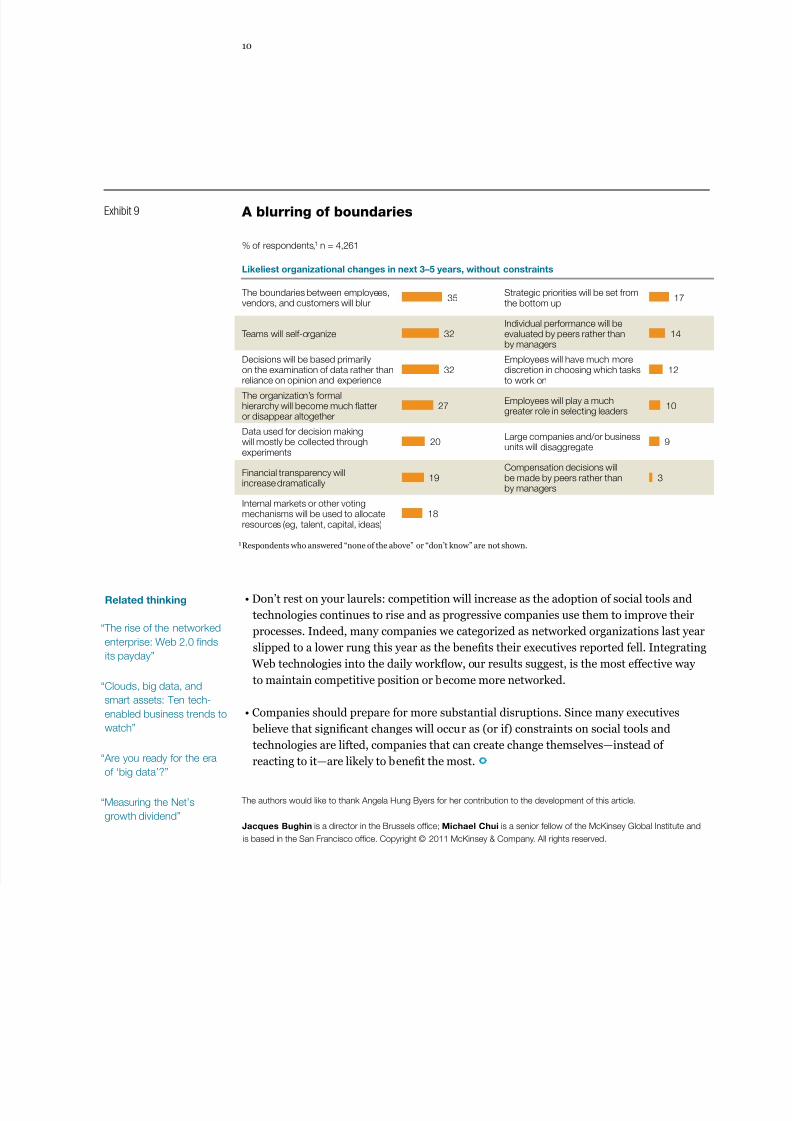
Peering ahead three to ve years, many respondents expect still more profound
organizational changes (Exhibit 9). They say that with fewer constraints on social
technologies at their companies, boundaries among employees, vendors, and customers
will blur; that more employee teams will be able to organize themselves; and that data-
driven decision making will rise in importance.
Looking ahead
• Our research shows that respondents afliated with fully networked organizations
say that they continue to realize competitive gains and performance improvements.
Senior executives should think strategically about how social technologies can support
business processes by helping organizations to navigate the external environment and
to forge stronger links with customers and vendors. Integrating social technologies into
the workow and using them to optimize internal processes will, these results suggest,
provide additional competitive benets.
A mix o old and new
7/29/2019 McKinsey Redes Sociales Internas 2011
http://slidepdf.com/reader/full/mckinsey-redes-sociales-internas-2011 10/10
10
• Don’t rest on your laurels: competition will increase as the adoption of social tools and
technologies continues to rise and as progressive companies use them to improve their
processes. Indeed, many companies we categorized as networked organizations last year
slipped to a lower rung this year as the benets their executives reported fell. Integrating
Web technologies into the daily workow, our results suggest, is the most effective way
to maintain competitive position or become more networked.
• Companies should prepare for more substantial disruptions. Since many executives
believe that signicant changes will occur as (or if) constraints on social tools and
technologies are lifted, companies that can create change themselves—instead of
reacting to it—are likely to benet the most.
The authors would like to thank Angela Hung Byers or her contribution to the development o this article.
Jacques Bughin is a director in the Brussels ofce; Michael Chui is a senior ellow o the McKinsey Global Institute and
is based in the San Francisco ofce. Copyright © 2011 McKinsey & Company. All rights reserved.
Related thinking
“The rise o the networked
enterprise: Web 2.0 fnds
its payday”
“Clouds, big data, and
smart assets: Ten tech-
enabled business trends to
watch”
“Are you ready or the era
o ‘big data’?”
“Measuring the Net’s
growth dividend”
Exhibit 9
% of respondents,1 n = 4,261
The boundaries between employees,vendors, and customers will blur
The organization’s formalhierarchy will become much flatteror disappear altogether
Internal markets or other votingmechanisms will be used to allocateresources (eg, talent, capital, ideas)
Strategic priorities will be set fromthe bottom up
Data used for decision makingwill mostly be collected throughexperiments
Decisions will be based primarilyon the examination of data rather thanreliance on opinion and experience
Financial transparency willincrease dramatically
Teams will self-organize
35
32
32
27
20
19
18
Individual performance will beevaluated by peers rather thanby managers
Large companies and/or businessunits will disaggregate
Compensation decisions willbe made by peers rather thanby managers
Employees will play a muchgreater role in selecting leaders
Employees will have much morediscretion in choosing which tasksto work on
14
12
10
9
3
17
1Respondents who answered “none of the above” or “don’t know” are not shown.
Likeliest organizational changes in next 3–5 years, without constraints
A blurring o boundaries