joan manel borràs comes - pompeu fabra...
TRANSCRIPT

The role of intonation and facial gesturesin conveying interrogativity
Joan Manel Borràs Comes
TESI DOCTORAL UPF / 2012
DIRECTORA DE LA TESI
Dra. Pilar Prieto i Vives
DEPARTAMENT DE TRADUCCIÓ I CIÈNCIES DEL LLENGUATGE


Als meus
I a prop la mar, la mar que tant estimo.Aquí he viscut i això conec.
GERARD VERGÉS


v
Acknowledgments
First and foremost, I would like to thank the director of this thesis,Dr. Pilar Prieto, for her trust and support and the long hours shehas devoted to guiding my progress as a researcher. In her I haveseen scientific research at its best. And thanks to her, I wasaccepted, while still a complete novice, into a team ofinternational prominence and well-deserved influence in thisfield. It is my experience in that context, under the leadership ofDr. Prieto, that has brought me to this moment of great personalachievement and satisfaction. For this I am profoundly grateful.
I give thanks also to the funding institutions and research projectsthat have made this work possible, in particular the Ministry ofEducation and Science project “Bilingualism and CognitiveNeuroscience” (CONSOLIDER-INGENIO 2010 Programme CSD2007-00012), under the direction of Núria Sebastián-Gallés and ItziarLaka, who very generously deposited their full trust in myabilities. I am also indebted to the projects “Estructura prosòdica iadquisició de la prosòdia en català i espanyol” (HUM2006-01758)and “The role of tonal scaling and tonal alignment indistinguishing intonational categories in Catalan and Spanish”(FFI2009-07648/FILO), funded respectively by the Ministry ofScience and Innovation and the Ministry of Education and Science.I also owe a great deal to the Grup de Recerca Emergent project“Grup d’Estudis de Prosòdia” (2009 SGR-701), funded by theGeneralitat de Catalunya through the Pla de Recerca de Catalunya.Finally, to I am grateful to the Catalan government’s Agència deGestió d’Ajuts Universitaris i de Recerca for having endowed me with aFellowship for Research Abroad (BE-DGR 2010, 2010 BE1 00207),which allows me to obtain official European Union accreditationfor this thesis.

vi
I give my thanks to Dr. Carles Escera and Dr. Jordi Costa-Faidella atthe Universitat de Barcelona, without whose expertise anddedication the electrophysiological study presented in this thesis— and much less its successful publication — would not have beenpossible. Thanks also to Dr. Marc Swerts and to the soon-to-be Dr.Constantijn Kaland, for their kind welcome at the University ofTilburg and their indispensable assistance in the development ofthe study that concludes this thesis.
Thanks to the Universitat Pompeu Fabra, and also to theUniversitat Autònoma de Barcelona, for the use of their resources.In particular, I would like to thank the Departament de Traducció iCiències del Llenguatge of the Universitat Pompeu Fabra for itsacademic goodwill and administrative effectiveness.
Thanks to all the teachers that I have had, each of whom gave metheir own special grain of courage in the course of my academictraining. Thank you, Dr. Miquel Àngel Pradilla and Dr. Josep MariaPujol, for the enthusiasm and knowledge that I have received. Andthanks to those all who goodheartedly agreed to participate in theseveral experiments that I have carried out.
Thanks to the various members of academia who as conferenceparticipants or reviewers for scientific journals have shown mehow to fine-tune my research (L. Aguilar, A. Chen, C. De-la-Mota,M. D’Imperio, L. Dilley, G. Elordieta, E. Estebas, S. Frota, J. Hualde,E. Krahmer, I. Mascaró, L. McNally, B. Post, J. Quer, Y. Rose, S. Soto,M. Vigário, etc.), and most especially the people associated withthe “Grup d’Estudis de Prosòdia”.
Thanks, grepets (M. Armstrong, R. Craviotto, V. Crespo, N. Esteve,S. González, P. Roseano, R. Sichel, M. Vanrell, etc.), for themoments, conversations, help and strength that you have givenme.

vii
Infinite thanks to my family, my parents and my sister Carme, whohave seen precious little of me but who never for an instant let mefeel alone. I hope my friends will also forgive me the neglect theyhave endured. And last but for from least, thank you, Mon, for allyou have given me in the six years that we have been together,despite all the time stolen from you by these pages.


ix
Abstract
This thesis investigates the role that different aspects ofaudiovisual prosody play in the production and perception ofinterrogativity. To this end, two types of statements and two typesof questions are analyzed: information and contrastive focusstatements (IFS, CFS), and information-seeking and counter-expectational questions (ISQ, CEQ). A multimodal approach is thusfollowed for the study of interrogativity, by means of a variety ofproduction and perception experiments, from games specificallydesigned to elicit spontaneous productions of specific discoursecategories to the analysis of event-related potentials. The firststudy reveals that pitch range differences are the mainintonational cue used by Central Catalan speakers in order todistinguish between IFS and CEQ. The second study shows thatsuch intonational contrasts are encoded automatically in theauditory cortex. Both studies strengthen the argument that pitchrange features need to be represented descriptively at thephonological level. The third study shows that facial gestures arethe most influential elements that Catalan listeners rely on todecide between CFS and CEQ interpretations, though bimodalintegration with acoustic cues is necessary in order for perceptualprocessing to be accurate and fast. The fourth study reveals thatCatalan and Dutch speakers mainly rely on language-specificauditory differences in order to detect IFS and ISQ, but also thatthe presence of gaze increases the identification of an utterance asa question. Finally, this study demonstrates that a concentrationof several response-mobilizing cues in a sentence is positivelycorrelated with the perceivers’ ratings of these utterances asinterrogatives.

x
Resum
Aquesta tesi investiga el rol que exercixen diversos aspectes de laprosòdia audiovisual en la producció i la percepció de lainterrogativitat. A tal efecte, s’analitzen dos tipus d’oracionsdeclaratives (de focus informatiu i de focus contrastiu; IFS i CFS) idos tipus d’oracions interrogatives (de cerca d’informació id’antiexpectació; ISQ i CEQ). Així, la tesi estudia la interrogativitatdes d’una perspectiva multimodal, amb diferents experiments deproducció i de percepció que van des de jocs especialmentdissenyats per elicitar produccions espontànies de determinadescategories discursives fins a l’anàlisi de potencials evocatscerebrals. El primer estudi revela que els parlants de català centralempren principalment el camp tonal per distingir entre IFS i CEQ.El segon, que el còrtex auditiu codifica automàticament talcontrast entonatiu. Ambdós estudis conclouen que cal explicitarles propietats del camp tonal quan es descriu fonològicamentl’entonació de la llengua. El tercer estudi mostra la majorinfluència dels gestos facials a l’hora de distingir CFS i CEQ encatalà, així com la necessitat d’integrar perceptivament lesvariables visuals i les acústiques perquè la idenficació siga acuradai ràpida. El quart estudi revela com els parlants de català i deneerlandès es basen principalment en les diferències auditives deles seues respectives llengües a l’hora de distingir IFS i ISQ, peròtambé com el fet que el parlant mire el seu interlocutorincrementa la interpretació interrogativa d’una oració. Finalment,l’estudi demostra que la presència de diversos indicismobilitzadors de resposta en una oració està positivamentcorrelacionada amb les interpretacions interrogatives que elsoients en fan.
xi
List of original publications
CHAPTER 2Borràs-Comes, J., Vanrell, M. M., & Prieto, P. (accepted pendingminor revisions). The role of pitch range in establishing intonationalcontrasts. Journal of the International Phonetics Association.
CHAPTER 3Borràs-Comes, J., Costa-Faidella, J., Prieto, P., and Escera, C. (2012).Specific neural traces for intonational discourse categories asrevealed by human-evoked potentials. Journal of CognitiveNeuroscience, 24(4), pp. 843-853.
CHAPTER 4Borràs-Comes, J., & Prieto, P. (2011). ‘Seeing tunes’. The role ofvisual gestures in tune interpretation. Journal of LaboratoryPhonology, 2(2), pp. 355-380.
CHAPTER 5Borràs-Comes, J., Kaland, C., Prieto, P., & Swerts, M. (submitted).Audiovisual correlates of interrogativity: a crosslinguistic study.Journal of Nonverbal Behavior.

xii
Table of contents
Acknowledgments vAbstract ixResum xList of original publications xiTable of contents xiiList of tables xivList of figures xvList of abbreviations xix
1. Introduction 12. The role of pitch range in establishing discourse categories 9
2.1. Introduction 92.2. Experiment 1 16
2.2.1. Methodology 162.2.2. Results 19
2.3. Experiment 2 242.3.1. Methodology 242.3.2. Results 25
2.4. Discussion 303. Specific neural traces for intonation-based discourse categories 35
3.1. Introduction 353.2. Experiment 1 39
3.2.1. Methodology 403.2.2. Results 42
3.3. Experiment 2 453.3.1. Methodology 453.3.2. Results 49
3.4. Discussion 524. The role of facial gestures in establishing discourse categories 59
4.1. Introduction 59

xiii
4.2. Recordings 644.3. Experiment 1 68
4.3.1. Methodology 684.3.2. Results 72
4.4. Experiment 2 764.4.1. Methodology 764.4.2. Results 78
4.5. Discussion 845. Audiovisual correlates of interrogativity: a crosslinguistic study 89
5.1. Introduction 895.2. Experiment 1 94
5.2.1. Methodology 945.2.2. Results 99
5.3. Experiment 2 1015.3.1. Methodology 1015.3.2. Results 102
5.4. Discussion 1076. General discussion and conclusions 111
6.1. The phonological status of pitch range 1116.2. Interaction between prosodic and gestural cues in sentenceprocessing 1156.3. The phonological status of pitch range 117
References 121Appendix 1 (Introducció en català) 139Appendix 2 (Discussió general i conclusions en català) 147

xiv
List of tables
Table 1. Sentence meanings analyzed in this thesis. 4
Table 2. Results of the Bonferroni deviance contrasts (over eachpossible pair of responses) within each stimulus ofExperiment 1. 22
Table 3. Results of the Bonferroni deviance contrasts (applied to‘appropriate’ and ‘inappropriate’ responses) within eachstimulus, for the three linguistic contexts. 28
Table 4. Mean MMN amplitudes and their standard deviations forthe three experimental contrasts (lower [within-category], central [across-category], and higher [within-category]). 51
Table 5. Original values of the duration (in ms.) of the targetsegments in the auditory sequence petita ‘small’ and theirdifference. 70
Table 6. Mean “CEQ” identification rates for each visual stimuluswhen combined with stimuli from each end of theauditory continuum in Experiment 79
Table 7. b1 values of the logistic regression applied to the six visualstimuli across the six auditory stimuli. 81
Table 8. Mean RTs in ms for each visual stimulus across auditorystimuli when combined with auditory stimuli from eachend of the continuum. 83
Table 9. Number of utterances containing the four labeled cues, foreach meaning, in Dutch and Catalan. 100
xv
List of figures
Figure 1. Waveforms and f0 contours of the proper name Marinaproduced with an IFS meaning (left), a CFS meaning(central position), and a CEQ meaning (right). 13
Figure 2. Idealized schema of the pitch manipulation in the nounphrase petita [p .'ti.t ] (‘little’-fem.). Duration of thesegments is shown at the top, and the correspondencewith each segment is shown at the bottom. The Hzvalues at the center of the image represent the finalfrequencies of the extreme stimuli (steps 1 and 11). 18
Figure 3. Absolute number of given responses for each stimulus,for Experiment 1. IFS = solid black line; CFS = dashed line;CEQ = solid grey line. 21
Figure 4 Averaged reaction time (RT) measures (in ms) forExperiment 1. 23
Figure 5. Mean rate of appropriateness for each type ofcommunicative situation (IFS context: solid black line,CFS context: dashed line, CEQ context: solid grey line). 27
Figure 6. Averaged reaction time (RT) measures (in ms), accordingto linguistic contexts (IFS: solid black line, CFS: dashedline, CEQ: solid grey line). 29
Figure 7. Idealized schema of the pitch manipulation in the nounphrase petita [p ti.t ] (‘little’-fem.). Duration of thesegments is shown at the top, and the link between eachsegment is shown at the bottom. The Hz values at thecenter of the image represent the final frequencies ofthe extreme stimuli (steps 00 and 15). 41
Figure 8. Experiment 1 results. The sixteen stimuli perceived bythe listeners are shown in the x axis. The left verticalaxis represent the mean ‘Question’ identificationresponses (Statement = 0 / Question = 1) for all subjects,which are plotted through the black line (error barsshowing ±1 Standard Error). The right vertical axis

xvi
represents the mean reaction times (in ms) for allsubjects, which are plotted through the grey area (errorbars showing ±1 Standard Error). 43
Figure 9. Idealized intonational contours of the four stimuli usedin the ERP study. Though the same physical differenceexists between the four high targets, the extreme pairsrepresent within-category contrasts, whereas the centralpair represents an across-category contrast betweenstatements (IFS) and questions (CEQ), as stated byExperiment 1. 46
Figure 10. Grand-average waveforms elicited to STD and DEVstimuli and their difference waves. The first row (in red)represents the lower [within-category] contrast, thesecond row (in green) represents the central [across-category] contrast, and the third row (in blue)represents de higher [within-category] contrast. In eachplot, STD and DEV responses are represented by coloredlines, STD with dotted lines and DEV with continuouslines. Also, DEV minus STD stimuli difference waveformsare plotted in black. Columns indicate the measures atFz, M1, and M2 (left, center and right columns,respectively). 50
Figure 11. DEV minus STD stimuli difference waves of eachcontrast, measured at Fz, M1 and M2 electrodes (left,center and right columns, respectively). MMN processesare observed at frontocentral electrodes (Fz) as negativedeflections of the ERP, and at mastoid electrodes aspositive deflections, as MMN inverts polarity below theSilvian fissure when the reference electrode is placed onthe tip of the nose (Näätänen & Michie 1979). 52
Figure 12. Scalp potential distribution maps at the MMN timewindow extracted from the DEV minus STD differencewaves (265-345 ms). 52
Figure 13. Bivariate correlations between CI and MMN, for allsubjects (left) and grand means (center), and the

xvii
bootstrap sampling distributions of the alternative andnull hypotheses (right). 53
Figure 14. Waveforms and F0 contours of the proper noun Marina‘person’s name’ produced with a CFS meaning (left) anda CEQ meaning (right). 63
Figure 15. Representative stills of a facial expression of one of ourspeakers while producing a CFS (left panel) and a CEQ(right panel). 67
Figure 16. Stills from video clips depicting facial gestures duringthe utterance of a CFS (upper panels) and a CEQ (lowerpanels). The three images correspond to three differentstages of the gestures: initial expression (left), centralexpression (centre) and final expression (right). 69
Figure 17. Schematic diagram with the pitch target manipulation. 71
Figure 18. Mean “CEQ” identification rate as a function of videostimulus (solid black line = CFS video; solid gray line =CEQ video) and auditory stimulus (x-axis), for the 20listeners. Error bars show ± 1 Standard Error. In the x-axis, stimulus 1 is a CFS and stimulus 11 is a CEQ. 73
Figure 19. Mean reaction times in ms as a function of videostimulus (solid black line = CFS video; solid gray line =CEQ video) and auditory stimulus (1 = CFS contour; 11 =CEQ contour), for the 20 listeners. 75
Figure 20. Inbetween frames resulting from the digital morphing ofthe central facial expression between the CFS gesturesequence (left) to the CEQ gesture sequence (right). 77
Figure 21. Mean “CEQ” identification rate as a function of videostimulus (different types of lines, ranging from the solidblack line = CFS video to the solid gray line = CEQ video)and auditory stimulus (x-axis), for the 20 listeners. In thex-axis, stimulus 1 is a CFS and stimulus 6 is a CEQ. 80
Figure 22. Mean reaction time measures as a function of videostimulus (black different types of lines, ranging from thesolid black line = CFS videotape to the solid gray line =

xviii
CEQ videotape) and auditory stimulus (1 = CFS contour; 6= CEQ contour), for the 20 listeners. 82
Figure 23. Example of the screen image used in the gameprocedure. At the left, the mystery person of ouropponent is shown (top) and buttons for starting a newgame or quitting it (middle). The 24 faces make up themain game panel. 96
Figure 24. Schematic (birdseye) drawing of the experimental setup. 98
Figure 25. Stills depicting one of the Dutch-speaking participant’svideo recordings while uttering a statement (left) and aquestion (right). 98
Figure 26. Mean correct identification rate (y-axis) as a function oflanguage group (Dutch, Catalan), condition (differentbars: VO, AO, AV), and intended meaning (x-axis:statement, question). 103
Figure 27. Mean identification as ‘question’ (y-axis) of the materialsin the perception experiment divided by the number ofinterrogative cues that they contain, in both Dutch (i.e.,VS + rise + gaze + eyebrow) and Catalan (i.e., rise+ gaze +eyebrow). 106

xix
List of abbreviations
AEP Auditory Evoked Potentials AM Autosegmental-Metrical AO Auditory-Only AU Action Unit AV Audiovisual CEQ Counter-expectational Question CFS Contrastive Focus Statement
CI Categorization Index DEV Deviant EEG Electroencephalography ERP Event-Related Potentials FACS Facial Action Coding System GLMM Generalized Linear Mixed Model IFS Information Focus Statement
IP Intonational Phrase ISQ Information-Seeking Question MMN Mismatch Negativity PSOLA Pitch Synchronous Overlap and Add RT Reaction Times SOA Stimulus-Onset Asynchrony STD Standard ToBI Tones and Break Indices VO Visual-Only

1
CHAPTER 1
Introduction
The main aim of this thesis is to deepen our knowledge aboutinterrogativity, specifically about how speakers mark it and,especially, how they detect it. This is to say, it seeks to determinethe elements that allow us to differentiate an interrogativesentence from a declarative sentence both in speech productionand in speech perception. The motivation behind this thesis isthus the desire to better understand one of the core aspects ofhuman communication, namely the mechanism by which wecomprehend whether information is being given or is being askedfor.
It is well known that different intonation contours serve asinterrogative markers in a number of languages. However, thoughone of the main functions of intonation is to convey the pragmaticmeaning of a sentence, many intonation studies have describedthe intonational phonology of a language without taking explicitlyinto account those pragmatic contexts. In this regard, previousintonation studies are based on read speech and also tend toignore other linguistic correlates, like gestures, which accompanyintonation patterns in normal face-to-face communication. Thisthesis deals with two types of statements and two types of yes-noquestions, which can be classified as neutral (i.e., nonbiased) andbiased depending on the way in which they convey their semanticcontent.
In the case of statements, we distinguish between informationfocus statements (IFS) and contrastive focus statements (CFS). By IFS,we refer to a neutral statement, i.e., a statement which carries newinformation in which there is a particular constituent that isfocalized with respect to the background. On the other hand, a CFSrefers to the marking of a constituent as “a direct rejection of analternative” (Gussenhoven 2007). A CFS typically corrects “the

2
value of the alternative assigning a different value” (Cruschina2011). Therefore, the main difference between the two focus typesis that while a CFS is dependent on a preceding assertion, which isdenied/corrected by the new focalized item, an IFS is not. Thisdenial or correction is often made explicit in the intonation andgestural planes of most intonational languages.
In the case of questions, we distinguish between information-seeking questions (ISQ) and counter-expectational questions (CEQ). ByISQ, we refer to the sort of question specifically designed to gatherinformation from a recipient, with no special intuitions requiredon its response on the part of the respondent. On the other hand,CEQs are related to echo questions. Echo questions are those inwhich the listener repeats information that s/he has just heard,generally either because s/he has not properly heard orunderstood what was said or because the implications of thatinformation are in conflict with his/her previous expectations.CEQs represent the latter type, and they are sometimescharacterized by a nuance of surprise or incredulity. As Cohen(2007: 133) states, “an incredulity question expresses the claimthat in none of the speaker’s belief (or normative) worlds is theechoed statement true — hence the incredulity (or indignation)expressed toward that statement” (see Cohen 2007 on the furtherdistinction between echo and incredulity questions). As in the case ofCFS, the nuance of unexpectedness, surprise or incredulity of aCEQ is often marked by intonation and specific gesture patterns inmany intonational languages.
In order to analyze intonational patterns, we use the Tone andBreak Indices (ToBI) transcription system, which based on theAutosegmental and Metrical (AM) theory of intonation. Briefly,this approach describes the intonation of a sentence bydistinguishing those tones associated with stressed syllables (pitchaccents) from those aligned at the right edge of a phrase (boundarytones and phrase accents). The two basic units that make up pitchaccents and edge tones are H[igh] and L[ow] tones, respectivelyinterpreted as an increase or decrease of pitch within an

3
utterance’s tune. In most languages, pitch accents are generallycomposed of one or two tones, the most prominent of which ismarked with an asterisk (T*). Edge tones are generally perceivedas falling or rising melodic patterns, or a combination thereof, andare generally transcribed as a percentage symbol (T%) or dash (T–). Because it is a phonological transcription system, ToBI requiresexpert human knowledge for the characterization of the prosodicevents specific to each language, and many language-specific ToBItranscription systems have been developed since the appearanceof Pierrehumbert’s (1980) dissertation on the English intonationalsystem (see Ohio State University Department of Linguistics 1999).
This thesis is organized in four main studies, which arepresented in Chapters 2 to 5. First, I analyze the role that a specificintonational feature plays in the distinction between statementsand counter-expectational questions in Catalan. This intonationalfeature is pitch range, namely the distance or span between thelowest and the highest f0 values observed in utterance pitchaccent (i.e., a valley and a peak; see Gussenhoven 2004). Thereason behind choosing Catalan as a test language is that in thislanguage, as in some other Romance languages, a rising-fallingnuclear pitch contour — i.e., a rising pitch accent associated withthe utterance-final stressed syllable followed by a low boundarytone — may be used to convey either IFS, CFS, or CEQ, dependingon the utterance’s pitch range properties. This intonation-basedcontrast will be analyzed in Chapters 2 and 3. Given that thesecontrasts can also be cued by means of specific facial gestures, theinteraction between auditory and gestural cues in the perceptionof statements and questions will be analyzed in Chapter 4. As theexperiments discussed up to Chapter 4 compare statements with abiased type of question, Chapter 5 analyzes how neutral questions(ISQ) are detected when compared with neutral statements (IFS).
Table 1 shows a summary of the types of declaratives andinterrogatives that are analyzed in this thesis.

4
Table 1. Sentence meanings analyzed in this thesis.
statementsneutral Information Focus Statement (IFS)biased Contrastive Focus Statement (CFS)
questionsneutral Information-Seeking Question (ISQ)biased Counter-Expectational Question (CEQ)
The aim of the first study (Chapter 2) is to investigate how IFS,CFS, and CEQ are distributed across the pitch range continuumand whether Catalan listeners use these pitch range distinctions toidentify such meanings. It is well known that different intonationcontours serve as interrogative markers in a number of languages,but whether pitch accent range differences are used by languagesto express such a discrete linguistic distinction is still anunresolved issue in the field of intonational phonology. To thisend, we performed two tasks especially appropriate for thispurpose. First, we used an identification task with three possibleresponse options, thus allowing for the simultaneous comparisonof the three categories (IFS, CFS, and CEQ). Second, we used acongruity task, which makes it possible to investigate the degreeto which listeners are aware of the semantic appropriateness of aparticular intonation contour to a given discourse context andwhether they are able to detect an incongruous use of thiscontour. In the two tasks, the identification responses arecomplemented with the analysis of the reaction time measures, asthese measures have been found to be useful to investigate thediscreteness of different intonational contours. Whereas theperceived difference between the two types of statements cannotbe exclusively explained by pitch range differences, the results ofthe first study show a clear contrast between IFS and CEQ.
Given the results in Chapter 2, Chapter 3 tests for theperception of this contrast using an electrophysiological brainexploration. A series of studies have indicated that segmental andtonal phonological distinctions can be represented in pre-attentive auditory sensory memory using the auditory mismatch

5
negativity (MMN) event-related brain potential (ERP). In thisstudy we tested whether within-category and across-categoryintonational contrasts between IFS and CEQ in an intonationlanguage will also elicit distinct neurophysiological patterns ofactivity, which would then support a distinct neurophysiologicalpattern for IFS and CEQ and the automatic encoding ofintonational contrasts in the auditory cortex. Moreover, thisfinding would represent evidence that the processing ofintonational contrasts by the human brain is done in a similarfashion to that of segmental contrasts.
As statements and questions are produced in normal face-to-face communication, they are associated with certain specificfacial gestures, such as head and eyebrow movements. In our thirdstudy (Chapter 4) we analyze another unresolved question in thefield of audiovisual prosody, namely how acoustic and visual cuesinteract in the native perception of such a pragmatic difference.Though the majority of studies on audiovisual prosody have founda complementary mode of processing whereby sight providesrelatively weak and redundant information in comparison withstrong auditory cues, other work has found that sight providesinformation more efficiently than hearing. In this chapter we takeinto account the roles of both pitch range and facial gestures inthe distinction between CFS and CEQ. After we had synthesizedthe auditory and gestural signals that are characteristic of theseparticular pragmatic meanings using recordings and a digitalimage-morphing technique, subjects participated in twomultimodal identification tasks in which they were presented withcongruent and incongruent combinations of such audiovisual cuesin order to analyze their perceived degree of interrogativity.
In our last study (Chapter 5) we further analyze the audiovisualperception of interrogativity, but this time confronting thecontrast between information focus statements (IFS) andinformation-seeking questions (ISQ), which each represent themost neutral types of the two pragmatic meanings. We used anatural setting in order to elicit a series of statements and

6
questions. Then, on the basis of these elicited materials, we hadsubjects participate in unimodal and multimodal identificationtasks (this time using only congruent audiovisual combinations).This methodology allowed us to investigate the core mechanismsinvolved in conveying interrogativity in both speech productionand perception. This investigation compared the respectivestrategies used by Catalan and Dutch speakers. While bothlanguages are known to use intonation for markinginterrogativity, Dutch also exploits syntactic inversion for thispurpose, which is the reason for comparing Dutch and Catalan inthis study. This task would allow us to assess whether participantsspeakers of the respective languages differentiate neutralstatements from questions unimodally and/or multimodally. Itwould also tell us which auditory and gestural features — i.e.,syntactic inversion when available, rising intonation contours,gaze, eyebrow raising — were most frequently used in productionand perception, and whether these strategies interacted in theparticipants’ identification of an utterance as a question.
One feature of our methodology that should be highlighted isour multimodal approach to the study of interrogativity. Mosttraditional studies have neglected the nonverbal component ofthe declarative / interrogative distinction and have mainlyfocused on its syntactic, morphological, and intonational marking.There is also thus far only limited research that takes into accountmore than one strategy at a time and explains their potentialinteraction as response-mobilizing features (see Stivers & Rossano2010).
The second feature that we regard as contributing particularvalue is the variety of methodologies that were applied in theseveral experiments analyzed in this thesis with the aim ofimproving the ‘ecological validity’ of our results. In ourproduction experiments, for example, we collected data throughboth Discourse Completion Tests, broadly used in pragmaticsresearch (Kasper & Dahl 1991, Cohen 1996, Billmyer & Varghese2000, Golato 2006, Nurani 2009) and games, like the version of

7
Guess Who, specifically adapted to elicit spontaneous productionsof specific discourse categories (Ahmad et al. 2011). As forperception experiments, we used different behavioral approaches,like congruency and identification tests (unimodal or multimodal,binomial or multinomial), from which we have analyzed bothresponses and reaction times, and an electrophysiologicalexploration using event-related potentials with the use of amismatch paradigm (Näätänen 2001).


9
CHAPTER 2
The role of pitch range in establishing discoursecategories
2.1. Introduction
As is well known, intonational languages use pitch variation toexpress differences in pragmatic and discourse meanings. Thoughearly approaches distinguished among four (Trager & Smith 1951)or three level tones (Stockwell et al. 1956), the Autosegmental-Metrical (AM) model takes as a central assumption that only twotones, Low and High, are necessary to distinguish pitch accent andboundary tone categories in English. This means that allremaining pitch range variation exclusively expresses differencesin emphasis or prominence (Pierrehumbert 1980, Beckman &Pierrehumbert 1986, Bolinger 1986, Dilley 2010, and others). Thisassumption relies on a version of the so-called Free GradientHypothesis (Ladd 1994, Ladd 1996, Gussenhoven 1999), whichholds that one of the most common effects of gradually expandingthe pitch range of a given pitch accent is the pragmaticreinforcement of the utterance (namely an increase in the degreeof the speaker’s involvement in the speech act). In line with this,Liberman and Pierrehumbert (1984) demonstrated in their studyof English pitch range that a gradual increase in emphasis wascorrelated with an increase in pitch range of the pitch accent.
Notwithstanding, work on English and other languages hasrevealed that pitch range variation can express categoricaldifferences in meaning even within the AM framework (Ward &Hirschberg 1985, Hirschberg & Ward 1992, Ladd 1994, Ladd 1996,Ladd & Morton 1997, Chen 2003, Braun 2006, Vanrell 2006, Savino& Grice 2011, Vanrell 2011). It is generally accepted that tones intonal languages behave as phonemic units and. In the last decades,

10
work within the intonational phonology field has shown thatintonational contrasts apply to intonational languages, the latterconveying “meanings that apply to phrases or utterances as awhole, such as sentence type or speech act, or focus andinformation structure” (Ladd 1996: 7). For example, Ladd andMorton (1997) investigated the contrast between normal vs.emphatic rising pitch accents in English. Though an abrupt shift inidentification from normal to emphatic interpretations was foundas pitch range increased, little evidence was provided of anassociated peak in discriminability between stimulus pairs. Chen’s(2003) replication of the experiment claimed that taking theidentification results together with an analysis of reaction time(RT) data revealed that the perceived distinction between anormal high accent and an emphatic high accent is of a discretenature. Hirschberg and Ward (1992) showed that a larger pitchrange of the English rise-fall-rise tune can change theinterpretation of an utterance from one of uncertainty to one ofincredulity. Finally, Calhoun (2004) found that themes and rhemesare marked by distinctive pitch accents and that the most reliablecue to the theme and rheme accents is pitch height.
Some recent work on Romance languages has found that pitchrange variation can also convey discrete intonational contrasts.Savino and Grice (2011) demonstrated that the pitch range of arising pitch accent was responsible for the difference betweeninformation-seeking and counter-expectational questions in BariItalian (where the latter are produced with an expanded pitchrange). The listeners’ responses and reaction times obtained bymeans of a semantically motivated identification task providedclear evidence for the categorical use of pitch range variation inBari Italian question interpretation. Similarly, by using the resultsof a gating experiment, Face (2005, 2007, 2011) claimed for Spanishthat the height of the initial f0 peak of an utterance allowslisteners to distinguish between declaratives and yes-no questions,thus arguing for the phonologization of pitch range. This wasconsistent with Prieto (2004), who found that the height of the

11
initial f0 peak varies depending on sentence type; specifically, yes-no questions, wh- questions, exclamatives, and imperatives allhave significantly higher initial f0 peaks than declaratives.Moreover, Vanrell (2011) showed for falling nuclear pitch accents(H+L* L%) that the pitch height of the high leading tone is themain cue used by Majorcan Catalan listeners to distinguishbetween a wh- question and two types of yes-no questions. That is,an upstepped leading high tone signals a yes-no question in whichthe speaker has no previous knowledge about the answer, whereasa non-upstepped leading tone signals that the speaker is asking ayes-no question about mutually shared information; in addition, adownstepped leading tone signals a wh- question.1
In general, these investigations demonstrate that pitch rangevariation can be perceived in a discrete fashion in some languagesand thus strengthen the arguments in favor of treating pitchrange differences in phonological terms in these languages. Theidea of enriching the traditional High-Low dichotomy with a finerdifferentiation of pitch range was already advocated byresearchers such as Ladd (1994:60), who pointed out that “theBruce-Pierrehumbert approach to intonational phonology must beenriched with a notion of categorical distinctions of pitch range.We need to get rid of the idea that any distinction that isorthogonal to the basic opposition between High and Low tones isipso facto gradient: both gradient factors and categorical ones playa role in the vertical scale of any given tone”.
In this chapter, we investigate more extensively the role ofpitch accent range variation in conveying intonational contrastsin Catalan. In our previous descriptive studies based on theanalysis of Catalan dialectal data from the Interactive Atlas of
1 Similar conclusions have been drawn when examining boundary tones.Crosslinguistic studies have reported active mid-level boundary tonescontrasting with high-level tones in the phonological domain of English(Beckman & Ayers Elam 1997), Greek (Arvaniti & Baltazani 2004), German(Grice et al. 2005), Spanish (Beckman et al. 2002), Korean (Lee 2004), andCatalan (Vanrell 2011).

12
Catalan Intonation (Prieto & Cabré 2007-2012, see also Prieto 2002)using Cat_ToBI (Prieto et al. 2009, Prieto in press, Aguilar et al.2009) we observed that the rising pitch accent of informationfocus statements (IFS) was produced with a narrow pitch range,while that of contrastive focus statements (CFS) and counter-expectational questions (CEQ) was produced with a wider pitchrange. In these three types of utterance, the alignment propertiesof the tones are found to be the same, i.e., a low tone is alignedwith the beginning of the accented syllable, the rising tone occurswithin this accented syllable, and the peak of this rise is alwaysaligned with the end of the accented syllable.2 Similarobservations have been made for other Romance languages suchas Friulian (Roseano et al. 2011) and Castilian Spanish (Estebas-Vilaplana & Prieto 2010). Examples of linguistic contexts elicitingthese three types of pragmatic meanings are shown in (1).3
2 The AM representation adopted for this rising accent is L+H* L%, as stated inPrieto (in press) and Prieto et al. (2009). These publications report that nodifferences in the peak alignment are found between the three contours (seealso Prieto 2005).
3 Even though Romance languages such as Catalan, Italian, and Spanish havebeen said to mark CFS through syntactic mechanisms (Vallduví 1991, Ladd1996), this does not exclude an active role for intonation, especially in thosecases in which word order remains the same (Estebas-Vilaplana 2009 forCatalan; Face & D’Imperio 2005 for Italian and Spanish). According toprevious research on this issue (Solà 1990, Vallduví 1991), since prominenceshift is a less-used strategy in Catalan to make the focused constituent fallunder prominence, other syntactic mechanisms such as dislocation (NO LES
TINC, les claus, lit. ‘NOT THEM I.HAVE, the keys’, ‘I do not have the keys’) orelision (NO LES TINC, lit. ‘NOT THEM I.HAVE’, ‘I do not have them’) of the nonfocalmaterial of a sentence (Solà 1990, Vallduví 1991, Prieto & Cabré 2007-2011),focus fronting (NEGRES, són, i no blanques, lit. ‘BLACKS, they.are, and not whites’,‘They are black, not white’) or clefting (És EL MARÇAL (que/el que/qui/el qui) nosuporto, lit. ‘Is THE MARÇAL who not I.stand’, ‘It is Marçal who I cannot stand’)(Solà 1990, Vallduví 1991) are proposed. Such sentence types arecharacterized by a similar intonation pattern L+H* L%, either produced inisolation or accompanied by the nonfocal material, which tends to undergotonal compression.

13
(1) a. (IFS) Com es diu, la seva filla? What’s their daughter’s name?Marina. Marina.
b. (CFS) Es diu Júlia, ella, no? Her name’s Júlia, isn’t it?Marina! [No! It’s] Marina!
c. (CEQ) Li posaran Marina. They’ll call her Marina.Marina? Marina? [Really?]
Figure 1 shows the waveforms and f0 contours of the proper nounMarina ([m in ]) obtained as responses to the contexts in (1).
Figure 1. Waveforms and f0 contours of the proper name Marina produced withan IFS meaning (left), a CFS meaning (central position), and a CEQ meaning(right).
With the aim of investigating the role of pitch range in theinterpretation of rising pitch accents in Catalan, we initiallycarried out two identification tasks with twenty native speakers ofCatalan, the results of which are reported in Borràs-Comes et al.(2010). These tasks were identification tasks with binomialidentification responses (two-way identification tasks), the firstdealing with the contrast between IFS and CEQ and the secondwith the contrast between IFS and CFS. The identification resultsshowed an S-shaped function for both comparisons, thussuggesting a discrete perception for three types of pragmaticmeanings. However, an analysis of the reaction times revealed a
5050
90
130
170
210
250
F0(H
z)
0 0.5 1 1.5 2
m i n m i n m i n

14
significant reaction time peak only when IFS was compared withCEQ. As Chen (2003: 98) pointed out, “if the identificationcategories emerging from the response frequencies are not task-induced but linguistically real, we will expect that the within-category stimuli are comparable in terms of cognitive load andtherefore will trigger similar mean RTs for identification”, andvice versa. This close correlation has also been found in manyother experiments (e.g., Falé & Hub Faria 2005 for EuropeanPortuguese, or Vanrell 2006 and Vanrell 2011 for Catalan). The factthat we found no peaks in RTs in the IFS vs. CFS comparison(Borràs-Comes et al. 2010) was interpreted as providing initialevidence for both a categorical effect in pitch range (i.e., thephonological difference between an IFS and a CEQ) and a gradienteffect (i.e., the difference in pitch range between an IFS and a CFS).
The goal of the present chapter is to investigate more deeplythe role of pitch accent range in conveying the abovementionedpragmatic meaning distinctions in Catalan (IFS, CFS, and CEQ) byusing two tasks that are especially appropriate for this purpose.First, we will use an identification task allowing for thesimultaneous comparison of the three categories (Experiment 1)and then we will take linguistic context explicitly into account inorder to test for the congruity of each target sentence occurring ina typical linguistic context for each pragmatic meaning(Experiment 2). These experiments are complemented with theresults of reaction time measures, as these measures have beenfound to be significantly useful to investigate the discreteness ofdifferent intonational contours. Following our initial findingsshowing that the comparisons between IFS/CFS and IFS/CEQ donot behave alike, we initially hypothesized that the threecategories would not be distributed in three well-differentiatedareas of the pitch height continuum depending on the height ofthe H tone, but rather in only two such areas.4
4 Note that a three-way distinction in pitch height does not represent a verymarked situation crosslinguistically if we consider the tonal heightdistinctions reported for tonal languages. For example, in some African
15
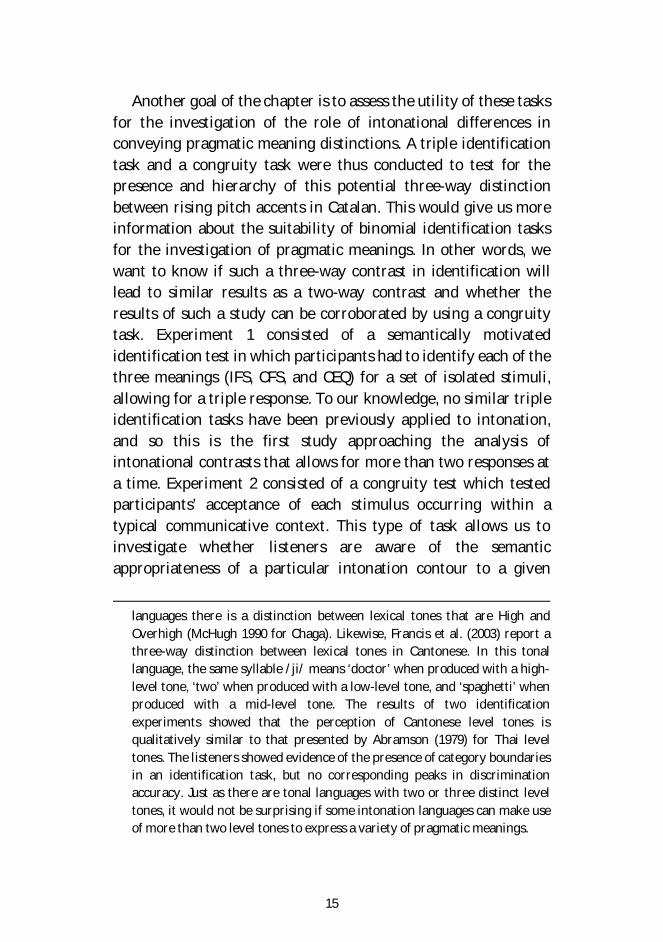
Another goal of the chapter is to assess the utility of these tasksfor the investigation of the role of intonational differences inconveying pragmatic meaning distinctions. A triple identificationtask and a congruity task were thus conducted to test for thepresence and hierarchy of this potential three-way distinctionbetween rising pitch accents in Catalan. This would give us moreinformation about the suitability of binomial identification tasksfor the investigation of pragmatic meanings. In other words, wewant to know if such a three-way contrast in identification willlead to similar results as a two-way contrast and whether theresults of such a study can be corroborated by using a congruitytask. Experiment 1 consisted of a semantically motivatedidentification test in which participants had to identify each of thethree meanings (IFS, CFS, and CEQ) for a set of isolated stimuli,allowing for a triple response. To our knowledge, no similar tripleidentification tasks have been previously applied to intonation,and so this is the first study approaching the analysis ofintonational contrasts that allows for more than two responses ata time. Experiment 2 consisted of a congruity test which testedparticipants’ acceptance of each stimulus occurring within atypical communicative context. This type of task allows us toinvestigate whether listeners are aware of the semanticappropriateness of a particular intonation contour to a given
languages there is a distinction between lexical tones that are High andOverhigh (McHugh 1990 for Chaga). Likewise, Francis et al. (2003) report athree-way distinction between lexical tones in Cantonese. In this tonallanguage, the same syllable /ji/ means ‘doctor’ when produced with a high-level tone, ‘two’ when produced with a low-level tone, and ‘spaghetti’ whenproduced with a mid-level tone. The results of two identificationexperiments showed that the perception of Cantonese level tones isqualitatively similar to that presented by Abramson (1979) for Thai leveltones. The listeners showed evidence of the presence of category boundariesin an identification task, but no corresponding peaks in discriminationaccuracy. Just as there are tonal languages with two or three distinct leveltones, it would not be surprising if some intonation languages can make useof more than two level tones to express a variety of pragmatic meanings.

16
communicative context and can detect an incongruous use of thiscontour. This methodology has been used successfully by otherresearchers investigating intonation contrasts (see Rathcke &Harrington 2010, Vanrell 2011, Crespo-Sendra 2011). A set oftwenty native speakers participated in the two experiments.Methodologically, we believe that a combination of congruity andidentification tasks with three possible responses (along withreaction time measures) can be profitably used to investigatemore than two intonational categories in context.
2.2. Experiment 1
2.2.1. Methodology
This experiment consisted of an identification task with threepossible response options. In other words, participants had toclassify each of the auditory stimuli as conveying one of the threepragmatic meanings of interest in our study, namely IFS, CFS, andCEQ. As noted above, as far as we know no similar tripleidentification task has thus far been used to investigate potentialdifferences in intonational pitch perception. We initiallyhypothesized that the triple response procedure would be able totest whether Catalan listeners would be capable of distributing theacoustic pitch range continuum into three or two discretecategories.
ParticipantsA set of twenty native speakers of Central Catalan participated inthe experiment. All subjects were undergraduates studyingjournalism or translation at the Campus de la Comunicació of theUniversitat Pompeu Fabra in Barcelona and were paid for theirparticipation. They were 7 men and 13 women. All were right-handed and none of them had previous experience with linguisticperception tasks. The age of the participants was between 19 and37 (average = 21.6, standard deviation = 4.07). The average Catalan

17
dominance of the participants (taken from a report on the dailyinteractions per day in Catalan provided by the participantsthemselves) was 86% (standard deviation = 12.83%).
MaterialsWe first recorded the three short dialogs shown in (2) in order toproduce an appropriate context for an IFS (2a), a CFS (2b), and aCEQ (2c). A male Catalan native speaker was recorded using aMarantz PMD-660 digital recorder in a quiet room at theUniversitat Pompeu Fabra. The productions were elicited usingthe discourse completion test method (Nurani 2009).
(2) a. (IFS) Com la vols, la cullera? What type of spoon do you want?Petita, [sisplau]. [I want a] little [spoon, please].
b. (CFS) Volies una cullera gran, no? You want a big spoon, don’t you?Petita, [la vull, i no gran]. [I want a] little [one, not a big one].
c. (CEQ) Jo la vull petita, la cullera I want a little spoon.Petita? [N’estàs segur?] [A] little [one]? [Are you sure?]
We then created a synthesized continuum for the noun phrasepetita [p .'ti.t ] (‘little’-fem) by modifying the f0 peak height in 11steps (distance between each one = 1.2 semitones).5 A single itemwas used so that listeners could easily keep in mind the threelinguistic contexts provided at the beginning of the task. Thespeech manipulation was performed on a single [p .'ti.t ]recording by means of the Pitch Synchronous Overlap and Add(PSOLA) resynthesis routine available in the Praat speech analysisand resynthesis software (Boersma & Weenink 2008), which keepsthe segmental information invariable, thus making it possible to
5 This target word (which contains voiceless plosives) was selected so that wewould be able to use the same target materials as in the electrophysiologicalexperiment that is presented in Chapter 3, which required to have avoiceless segment in order to adequately control for the specific point intime in which the auditory mismatch occurs.

18
test for only the changes in pitch height. Figure 2 shows anidealized schema of the pitch manipulation in the target nounphrase. As shown in the figure, pitch movements were realizedwith a rising tonal movement starting at onset of the accentedsyllable /'ti/, which was preceded by a low plateau for the syllable[p ] (102.4 Hz, 100 ms). The posttonic syllable [t ] was realizedwith a falling tonal movement (94.5 Hz, 180 ms). The peak heightcontinuum ranged from 105.3 Hz to 208.7 Hz, and the totalduration of each stimulus was 410 ms.
Figure 2: Idealized schema of the pitch manipulation in the noun phrase petita[p .'ti.t ] (‘little’-fem.). Duration of the segments is shown at the top, and thecorrespondence with each segment is shown at the bottom. The Hz values atthe center of the image represent the final frequencies of the extreme stimuli(steps 1 and 11).
ProcedureParticipants were instructed to pay attention to the intonation ofthe stimuli and indicate which interpretation was more likely foreach stimulus by pressing the corresponding computer key,namely “A” for Afirmació (‘Statement’, i.e., IFS), “C” for Correcció(‘Correction’, i.e., CFS) and “P” for Pregunta (‘Question’, i.e., CEQ).These three labels were chosen because they would suggestintuitive response labels to participants with no previousexperience with linguistic perception tasks. Prior to theexperiment, subjects gave verbal confirmation to the

19
experimenter of their understanding of the three differentlinguistic contexts.
The task consisted of 6 blocks in which all stimuli in thecontinuum were presented to the subjects in a randomized order,i.e., the order of the stimuli inside each trial list was different foreach block (with no order constraints) and for each subject. Aninterval of 15 seconds of silence was inserted between each block.The interstimulus interval was set at 1s. We obtained a total of1,320 responses for this experiment (11 steps × 6 blocks × 20listeners). The experiment lasted approximately 8 minutes. Thisincludes a brief training session intended to get subjects used tothe stimuli and the task, which consisted of the same procedure asthe experimental task with the difference that subjects were askedonly to identify isolated instances of extreme and central stimuli(specifically, stimuli 1, 2, 5, 7, 10, and 11). No feedback wasprovided. No counterbalancing was used between Experiments 1and 2 (see description below), and subjects performed a distractorbehavioral task between the two experimental segments whichconsisted of identifying which one was the stressed syllable of aset invented words produced with seven different intonationalcontours.
The experiment was set up by means of the psychologysoftware E-prime version 2.0 (Psychology Software Tools Inc.2009), and identification responses and RTs were automaticallyrecorded using this software. Subjects were instructed to press thebutton as quickly as they could. The experiment was set up in sucha way that the next stimulus was presented only after a responsehad been given.

20
2.2.2. Results
Identification resultsFigure 3 shows the results of Experiment 1. The y-axis representsthe absolute number of responses given to each stimulus. The x-axis represents the steps of the acoustic continuum. Different linetypes represent the different identification responses given (IFS:solid black line, CFS: dashed black line, CEQ: solid grey line). Thegraph actually presents a summary of how the participantscategorized the acoustic space into three parts. On the one hand, itshows that the distribution of IFS and CFS responses are closer andmore frequent for the lower stimuli, roughly differentiablebetween stimuli 1 and 4. On the other hand, the distribution ofCEQ responses is clearly different from that of statements andshows a great frequency between stimuli 8 and 11. Thus, the graphshows that responses present an unsettled distribution betweenstimuli 5 and 7.
A Generalized Linear Mixed Model (GLMM) analysis(multinomial distribution) was performed with identification ofthe three possible categories as the dependent variable.6 Stimuluswas set as the fixed factor, and subject × block were set as crossedrandom factors (thus avoiding at the same time inter-subjectvariation and possible effects of fatigue, boredom, and practice).Results showed a significant effect of stimulus over the responsegiven (F 20, 1299 = 19.014, p < .001).
6 All responses and RT were analyzed through a Generalized Linear MixedModel (GLMM) using IBM SPSS Statistics 19.0 (IBM Corp. 2010). As Baayen etal. (2008) and Quené and van den Bergh (2008) point out, mixed-effectsmodeling offers considerable advantages over repeated measures ANOVA.Specifically for our data, they are suitable to analyze noncontinuousdependent variables, such as binomial and multinomial responses. On theother hand, we can control for both fixed and random factors (in our case,SUBJECT and BLOCK) at the same time.

21
Figure 3: Absolute number of given responses for each stimulus, for Experiment1. IFS = solid black line; CFS = dashed line; CEQ = solid grey line.
Because a multinomial distribution of the dependent variabledoes not allow the extraction of estimated means, new GLMManalyses were conducted for each possible pair of responses(namely IFS vs. CFS, IFS vs. CEQ, and CFS vs. CEQ) in order todetermine whether identification responses, when compared oneto another, would show a significant distribution among thestimuli in the continuum. The overall test results showed a lowerresult of the Fisher’s F test when applied to the comparisonbetween the two types of statements: IFS vs. CFS (F 10, 808 = 4.706, p <.001), IFS vs. CEQ (F 10, 913 = 24.878, p < .001), and CFS vs. CEQ (F 10, 888 =25.891, p < .001). This means that the different distribution of IFSand CFS among the stimuli is less clear than when each of thesegiven responses are compared with the distribution of CEQresponses.

22
Table 2 shows the results of the Bonferroni deviation contrastswithin each stimulus in the continuum. These results provideimportant information for detecting that each pair of categorieshas a significantly different distribution along the acousticcontinuum, i.e., the distribution of responses is significantlydifferent between the three categories for each step in thecontinuum. We have two exceptions to this generalization,namely, that (a) as expected, at stimulus number 6, thecomparisons between IFS vs. CFS, IFS vs. CEQ, and CFS vs. CEQ arenot shown to be significant; and (b) at stimulus numbers 7-11,there is no significant difference between IFS and CFS, revealingthat the distributions of their responses are similar.
Table 2. Results of the Bonferroni deviance contrasts (over each possible pair ofresponses) within each stimulus of Experiment 1.
IFS vs. CFS IFS vs. CEQ CFS vs. CEQ
stimulus t Sig. t Sig. T Sig.
1 -3.332 .008 -4.761 <.001 -3.822 .001
2 -3.630 .003 -5.508 <.001 -4.114 <.001
3 -3.918 .001 -5.260 <.001 -4.110 <.001
4 -3.281 .009 -5.501 <.001 -4.371 <.001
5 -1.546 .613 -4.549 <.001 -3.564 .001
6 -0.092 1.000 -0.118 .906 0.001 .999
7 0.420 1.000 2.759 .012 2.905 .008
8 1.703 .533 5.814 <.001 5.748 <.001
9 1.973 .342 7.099 <.001 8.251 <.001
10 1.324 .743 5.600 <.001 8.670 <.001
11 0.699 1.000 5.669 <.001 7.954 <.001
In sum, the results of the triple response identification taskindicate that Catalan listeners clearly associate the higher end ofthe pitch range continuum with a CEQ interpretation, and thatthey perceive a greater degree of ambiguity when processing the

23
lower end of the pitch range continuum, with a very similardistribution between IFS and CFS interpretations.
Reaction timesFigure 4 shows the averaged RTs for each pair of responsesobtained in Experiment 1. The y-axis represents the mean RT, andthe x-axis represents the steps in the pitch continuum. The graphshows a clear RT peak at stimulus 6, with a more pronounced slopetowards the high end of the continuum than towards the low end.
Figure 4: Averaged reaction time (RT) measures (in ms) for Experiment 1.
A GLMM was applied with the RT measures as the dependentvariable, stimulus, response given and their interaction as fixedfactors, and subject × block as crossed random factors. There weresignificant effects for stimulus (F 10, 1211 = 2.732, p = .003), responsegiven (F 2, 1254 = 5.402, p = .005), and their interaction (F 20, 1227 = 2.379,

24
p = .001). In order to determine whether stimulus had a significantvariation within each response given, deviation contrasts wereextracted. The overall test results showed an effect of stimulus forIFS (F 10, 1288 = 5.917, p < .001) and CEQ (F 10, 1288 = 2.318, p = .011), butnot for CFS (F 10, 1288 = 1.766, p = .062). This means that we can onlyargue for a RT peak when IFS and CEQ responses were analyzed.
In sum, the results of the triple response identification taskindicate that Catalan listeners associate the higher end of thepitch range continuum with a CEQ interpretation, and that theydisplay more perceptual confusion in the lower end of the pitchrange continuum, which is distributed between the IFS and CFSresponses. Taking into account the RT measures, this suggests afairly close association of the lower end of the continuum with IFSresponses, but no clear conclusions about the role of pitch rangein determining a CFS interpretation.
2.3. Experiment 22.3.1. Methodology
This experiment consisted of a congruity task which had the goalof assessing participants’ preference for a particular stimulus asmore acceptable in a given communicative context. As notedabove, this task makes it possible to investigate whether listenersare aware of the semantic degree of appropriateness of aparticular intonation contour to a given discourse context andwhether they are able to detect an incongruous use of thiscontour.
ParticipantsFor this experiment, the same set of participants was presentedwith the three types of linguistic contexts shown in (2), each timefollowed by the target utterance Petita (‘little’-fem). The same setof subjects participated in both experiments because this wouldincrease the comparability between the results of the two tasks.

25
MaterialsThe context recordings were of a female native speaker of CentralCatalan. Each context was systematically combined with all thetarget utterances. Their duration was approximately 1,450 ms andtheir pitch range was between approximately 176.27 Hz and 299.17Hz. An interval of 300 ms of silence was inserted between thecontext and the target utterance.
In this experiment we used 6 stimuli only, specifically, stimuli1-3-5-7-9-11 from the continuum used in Experiment 1. Thus, thedistance between each step in the continuum in this case was 2.4semitones rather than 1.2.
ProcedureSubjects were asked to rate the target word as being semantically‘appropriate’ or ‘inappropriate’ within that specific linguisticcontext by pressing the corresponding computer key, namely “A”for adequat (‘appropriate’) and “I” for inadequat (‘inappropriate’).Thus, we obtained information about the perceived congruity ofeach combination of linguistic context + target stimulus. A brieftraining session was conducted prior to the task, consisting ofrating the acceptability of stimuli 3 and 9 within each of the threecommunicative contexts. As in Experiment 1, the aim of thetraining session was merely to get participants used to the taskand they received no feedback. (Stimuli 2 and 5 were chosenbecause they were neither extreme nor central in the auditorycontinuum and were equidistant from the midpoint.)
The task consisted of 5 blocks in which all stimuli in thecontinuum were presented twice within each of the threelinguistic contexts in a randomized order. We thus obtained a totalof 3,600 responses for this experiment (6 steps × 3 linguisticcontexts × 5 blocks × 2 repetitions × 20 listeners). The experimentlasted approximately 22 minutes.

26
2.3.2. Results
Congruity resultsFigure 5 shows the semantic congruity results of our experiment.The y-axis represents the mean perceived appropriatenessbetween the linguistic context and the target stimulus (x-axis).Different line types represent the linguistic contexts heard (IFS:solid black line, CFS: dashed black line, CEQ: solid grey line). Forinstance, stimulus 1 was accepted at a rate of .97 (i.e., 97% of thetime) when occurring in an IFS linguistic context, .77 whenoccurring in the CFS context, and only .09 when occurring in theCEQ context. And the opposite pattern of results was obtained forstimulus 11. Interestingly, the results reveal that stimuli 1-5 aregenerally rated as appropriate for both IFS and CFS contexts: whilethe IFS and CFS functions are similar, they sharply contrast withthe function found for the CEQ linguistic context. Subjects seem todivide the six-point continuum into two general categories, i.e.,‘statement’ and ‘question’, with the boundary located at stimulus 7(which corresponds to 158.5 Hz), thus assigning both IFS and CFSto stimuli 1-5 and CEQ to 9-11.
A GLMM analysis (binomial distribution) was conducted withappropriateness as the dependent variable, linguistic context,stimulus, and their interaction as fixed factors, and subject × blockas crossed random factors. Main effects of linguistic context (F 2, 3582
= 8.810, p < .001) and stimulus (F 5, 3582 = 29.284, p < .001) were foundand, crucially, an interaction between linguistic context andstimulus (F 10, 3582 = 92.269, p < .001) was also detected.In order to know how the three meanings are distributed in thepitch range continuum, we must analyze which part of thecontinuum contains a significant number of ‘appropriate’ and‘inappropriate’ responses for each discourse context separately.To this end, Bonferroni deviation contrasts were extracted (overthe two available responses, i.e., ‘appropriate’ and ‘inappropriate’)within each stimulus. The results of the deviation contrasts are

27
Figure 5. Mean rate of appropriateness for each type of communicativesituation (IFS context: solid black line, CFS context: dashed line, CEQ context:solid grey line).
presented in Table 3. The first column for each meaning containsthe results of the t tests (where a positive value indicates apreference for ‘appropriate’ responses), and the second columncontains the significance of this preference (all < .001 except whenstimulus 7 is presented with a CFS context). More specifically, it isshown that stimuli 1-5 were significantly categorized as‘appropriate’ for an IFS context, and 7-11 were considered‘inappropriate’. For CFS, stimuli 1-5 were considered ‘appropriate’,stimulus 7 was not associated with any response, and stimuli 9-11were considered ‘inappropriate’. For CEQ, stimuli 1-5 wereconsidered ‘inappropriate’, and stimuli 7-11 were considered‘appropriate’. The roughly parallel results for IFS and CFS indicatethat both meanings share the lower part (stimuli 1-5) asappropriate pitch range values, whereas CEQ occupy the higher

28
part (stimuli 7-11). This means that (a) the location of theboundary between statements (IFS and CFS) and questions (CEQ)falls immediately before stimulus 7, and (b) IFS and CFS contextsshare the same perceptual behavior, both contrasting with thedistribution of CEQ responses.
Table 3. Results of the Bonferroni deviance contrasts (applied to ‘appropriate’and ‘inappropriate’ responses) within each stimulus, for the three linguisticcontexts.
IFS context CFS context CEQ context
stimulus t Sig. t Sig. t Sig.
1 10.094 <.001 6.735 <.001 -9.227 <.001
3 9.981 <.001 8.272 <.001 -8.178 <.001
5 5.538 <.001 5.712 <.001 -5.181 <.001
7 -4.153 <.001 -1.207 .227 2.849 <.001
9 -10.210 <.001 -7.104 <.001 10.030 <.001
11 -10.304 <.001 -10.972 <.001 11.637 <.001
Reaction timesFigure 6 shows the averaged RTs obtained for each linguisticcontext in our congruity test (IFS: solid black line, CFS: dashedline, CEQ: solid grey line). The y-axis represents the mean RT, andthe x-axis represents the steps in the acoustic continuum.Specifically, the analysis of RT measures in a congruity test canshed light on the potential perceptual confusion of associating agiven pitch range with a specific linguistic context (i.e., a RT peakfor a specific meaning can be interpreted as indicating that thatmeaning has a specific pitch range for its production). The graphindicates a clear increase in RTs observed near stimulus 4 for bothIFS and CEQ contexts, but not for CFS. This coincides with ouranalysis of the RT of the identification task.

29
Figure 6. Averaged reaction time (RT) measures (in ms), according to linguisticcontexts (IFS: solid black line, CFS: dashed line, CEQ: solid grey line).
A GLMM analysis (binomial distribution) was conducted, with theRT as the dependent variable, linguistic context and stimulus asfixed factors, and subject × block as crossed random factors. Amain effect of stimulus (F 5, 3383 = 11,024, p < .001) was found. Therewas no effect of linguistic context (F 2, 3383 = 0.796, p = .451) and onlya near-significant interaction between linguistic context andstimulus (F 10, 3383 = 1.801, p = .055).
In order to analyze the patterns of RT obtained for eachdiscourse context, deviation contrasts were extracted, with asequential Bonferroni adjusted significance level at .05. Theoverall test results showed an effect of stimulus for IFS (F 5, 3582 =9.081, p < .001) and CEQ (F 5, 3582 = 4.437, p < .001), but not for CFS (F 5,
3582 = 1.108, p = .354). The sequential Bonferroni deviation contrasts(over the RT) showed that there was a significant RT peak in

30
stimulus 4 for IFS (t 3383 = 5.078, p < .001) and CEQ (t 3383 = 3.021, p =.015), but not for CFS (t 3383 = 0.047, p = 1).
In sum, the robustness of the RT results of the congruity testand its coincidence with the results of Experiment 2 shows thatthis type of task is very informative and useful when trying touncover the phonologically relevant contrasts in intonation.
2.4. Discussion
The main goal of this chapter was to investigate the role of pitchaccent range in conveying intonational differences in a languagewith a potential three-way pitch range contrast. We haveinvestigated the potential phonological distinction betweeninformation focus statements (IFS), contrastive focus statements(CFS), and counter-expectational questions (CEQ) in CentralCatalan by performing two complementary experimental tasks.
Experiment 1 tested the participants’ interpretation of eachisolated stimulus using a triple response identification task. Theresults of this experiment showed how participants distributedthe acoustic continuum across the three possible responses. Theyassociated IFS and CEQ with the lower and higher ends of thecontinuum respectively, while CFS responses were lessconsistently associated and skewed towards the lower stimuli (seeFigure 3). In order to corroborate the results from this tripleidentification task and also take explicitly into account thelinguistic context in which these three meanings can occur, asemantic congruity test was also conducted (Experiment 2). Theresults showed that the lower stimuli (1-5) were judgedsignificantly more appropriate for both IFS and CFS contexts,while the higher stimuli (7-11) were the most congruent withinthe CEQ context (see Figure 5). Thus these results confirm theresults from Experiment 1, namely that Catalan listeners associatethe lower end of the pitch range continuum with statements (i.e.,IFS and CFS) and the higher end of the continuum with questions.

31
Concerning the analysis of RT measures, as expected, they werefound to correlate with the identification results and to increasefor the stimuli located in the acoustic frontier betweenphonological distinctions. Experiment 1 showed a significant peaklocated at stimulus 6 and a significant role of pitch range only forIFS and CEQ interpretations. The analysis of RT measures fromExperiment 2 clarifies this result because only two RT peaks werefound, again for IFS and CEQ contexts (IFS: peak at stimulus 7; CEQ:peak-plateau at stimuli 5-9). Interestingly, the analysis of the RTfrom both experiments shows no significant role for the pitchrange when CFS is involved. Following Chen (2003), a mean RTpeak at the identification boundary indicates that an intonationalcontrast is discrete, so for the results of our experiments wecannot claim that CFS can be categorically determined by thepitch range (especially when it is compared to IFS, taking intoaccount the identification responses), and only a gradient effectfor pitch range is suggested in the identification of CFS.
Borràs-Comes et al. (2010) tested the participants’interpretation of similar isolated stimuli in a binomial way bycomparing the perception of IFS vs. CEQ and IFS vs. CFS. Nodifferences were found between the two identification functions,which meant that, according to identification responses, CFS andCEQ would be associated with similar pitch range values. However,the results of our present study show that, when participants areallowed to give any of the three possible responses, IFS and CFSshow a similar distribution in the pitch range continuum. In linewith this, we suggest that we need to use binomial identificationtasks with caution, as they might be unsuitable for investigatingdifferences in intonational categories if no additional measures(e.g., RTs or congruity tasks) are taken into account (see Chen2003). In our view, if listeners have only two responses availablefor responding they can easily train themselves to categorize thegiven acoustic space into the two categories available (Ladd, p.c.).We thus argue that the extra cognitive load that a triple-responseidentification task asks for significantly increases the reliability of

32
participants’ categorization responses. Notwithstanding, theresults of the congruity task are slightly different from those ofthe triple-identification task, especially in the distribution of IFSand CFS responses among lower stimuli (different in Experiment 1,but similar in Experiment 2). In this case, the triple-identificationtask might still lead participants to over-categorize the stimuliamong all available responses. By contrast, congruity taskscrucially take into account linguistic context, i.e., the stimuli arealways evaluated for their congruity or incongruity with thepreceding context.
Thus, concerning methodology we would like to highlight theusefulness of using triple-answer identification tasks togetherwith semantic congruity tests to investigate the phonologicalstatus of intonational contrasts. First, the results of these tasksreveal that listeners are not simply dividing the acoustic spaceinto three categories. Second, one of the main advantages of usinga congruity test is that it takes pragmatic context into account, byevaluating the degree of linguistic appropriateness of differentintonation patterns within different discourse contexts. We thusargue that the use of triple-identification tasks together withsemantic congruity tests can be a very effective strategy for theinvestigation of intonational phonology across languages.
Taken together, the two experiments have crucially shown thatvariation in pitch range is the main cue that Catalan listeners useto discriminate between IFS and CEQ, i.e., there is a thresholdalong a continuum of pitch range beyond which a CEQ meaning isconsistently understood.
In line with our results, it is important to note that theidentification of CFS in Catalan does not crucially rely on pitchheight differences. Recent production results reported by Vanrellet al. (2012) showed that pitch range is not a stable cue indistinguishing non-focal vs. contrastive focal accents in Catalan.The absence of a categorical difference between IFS and CFS withrespect to pitch height might thus be related with the reportedpreference for Catalan to use changes in syntactic structure for

33
contrastive focus marking (Vallduví 1991).7 Moreover, contextualpragmatic inference can be important to detect CFS online. Asstated in Levinson (2010), pragmatic inference works well enoughto detect more than half of all the yes-no questions that appear inEnglish spontaneous speech (see also Stivers 2010), so it is possibleto classify as a CFS any contradictory utterance provided as simplythe last word in a conversation (i.e., when someone contradictsthe assumption of the interlocutor, then it is assumed that theyknow the information at issue).
Beyond the specifics of Catalan intonation, which needs to beable to signal a phonological distinction between counter-expectational questions [L+¡H*] and statements [L+H*] (Aguilar etal. 2009), there is a more general issue that should be consideredwithin the AM system, which is the concept of upstep. Byincluding a category L+¡H* in the Cat_ToBI phonological analysis(and in any other ToBI analysis) — i.e., the upstepped high tone, asrepresented with a ‘¡’ initial exclamation mark —, the concept ofupstep becomes more ambiguous. This concept originallyrepresented the raising of a H tone caused by the presence of apreceding H tone in the same prosodic phrase. Yet the inclusion ofa tone like [L+¡H*] means that upstep is being used to expand theinventory of available pitch-accent phonological contrasts. This isalso the case with the now common use of !H (especially in thefield of boundary tones) to indicate a contrastive use of anotherlevel of pitch height. This has been also noted by Face (2011) forCastilian Spanish, who argues for an AM transcription systemwhich takes pitch range into account without altering thedichotomy between L and H targets that exists in the ToBI system.He proposes that an intonational domain (which can range from apitch accent to an intonational phrase) can be specified by a
7 Taking the example Vull TARONGES ‘I want ORANGES’ (extracted from Prieto &Cabré 2007-2012), if the speaker wants to focalize the constituent TARONGES
‘ORANGES’ (i.e., s/he wants ORANGES and not some other fruit), s/he will resortmost often to clause-external detachment (TARONGES, vull ‘ORANGES, I want’).

34
‘frame’ that sets “the space for the realization of the f0 rises andfalls” (Face 2011: 89). Following Face, the Catalan IFS contourmight be labeled [L+H*], while the Catalan CEQ contour might belabeled H+[L+H*], which would indicate that the high end of thecontinuum would be extended. This is an alternative transcriptionstrategy which should be evaluated with rigor but which is beyondthe scope of this investigation.
All in all, the results presented here represent new empiricalevidence that pitch accent range variation can express categoricaldifferences in meaning (Hirschberg & Ward 1992, Ward &Hirschberg 1985, Ladd 1994, Ladd 1996, Ladd & Morton 1997, Chen2003, Savino & Grice 2011, Vanrell 2006, 2011).8 As mentionedabove, the distinction between two levels of pitch height todistinguish statements from questions is very productive in otherRomance languages (Savino & Grice 2011 for Bari Italian, Roseanoet al. 2011 for Friulian, Estebas-Vilaplana & Prieto 2010 forCastilian Spanish), as well as in other languages, and thisdistinction needs to be reflected in the intonational phonology ofsuch languages.
8 The use of higher F0 peaks can be related to the general finding that theaverage pitch in questions is higher than the average pitch in non-questions(Bolinger 1986), what has been analyzed as a «discretised» manifestation ofthe so-called Frequency Code (Gussenhoven 1999).

35
CHAPTER 3
Specific neural traces for intonation-based discoursecategories
3.1. Introduction
A series of studies have indicated that segmental and tonalphonological distinctions can be represented in pre-attentiveauditory sensory memory. However, there is no conclusiveevidence with respect to the neurophysiological representation ofintonational discourse contrasts (i.e. between statements andquestions), and no previous research has dealt with the processingof intonational within-category and across-category contrasts. Inthis chapter we report a study that uses the auditory mismatchnegativity (MMN) event-related brain potential (ERP) to test thenative perception of within-category and across-categoryintonational contrasts between statement and questioninterpretations in Catalan. We hypothesize that discreteintonational information — as discrete phonological information— can be represented through symbolic memory traces (incontrast to mere acoustic memory traces) in the brain.
The MMN component is a negative deflection of the auditoryERP occurring between 100 and 250 ms after the onset of astimulus violating an established acoustic regularity.Traditionally, it is obtained by subtracting the ERP to a standardstimulus from that to a deviant stimulus that is presented in thesame block of trials. The MMN is generally elicited in non-attentive conditions and typically argued to reflect pre-attentivedetection of auditory changes and higher-level cognitiveprocesses in the auditory system (Näätänen 2001, Pulvermüller &Shtyrov 2006). Following Näätänen (2001), the MMN reflects theearly access to stored linguistic representations and indicates the

36
match or mismatch between a stimulus and its correspondingsymbolic memory trace in the brain. According to Pulvermüller &Shtyrov (2006), the MMN for language stimuli is composed of atleast two parts: a part which reflects the automatic detection of asound change and a part that reflects the activation of cortical cellassemblies forming the long-term memory traces for learnedcognitive representations (see Fournier et al. 2010 for a review ofthe studies on the lateralization of tonal and intonational pitchprocessing).
The MMN has been successfully applied in studies of segmentalphonetic and phonological analysis (e.g., Sharma & Dorman 2000,Dehaene-Lambertz 1997, Näätänen et al. 1997, Winkler et al. 1999)and abstract phonological features (Eulitz & Lahiri 2004, Phillips etal. 2000; for a review, see Näätänen et al. 2007, Näätänen, 2001).Näätänen et al. (1997) suggested that the identification of thedeviant as a native-language vowel enhanced the MMN amplitude,i.e. the phonological representation of a vowel sound can beprobed with the mismatch process. Native across-categoryconsonant contrasts also elicit a significant MMN compared tonon-native contrasts or within-category contrasts (Dehaene-Lambertz 1997). A series of studies have demonstrated thatacoustic contrasts that cross a phonemic boundary lead to largerMMN responses than comparable acoustic contrasts that do not(Aaltonen et al. 1997, Dehaene-Lambertz 1997, Phillips et al. 2000,Sharma & Dorman 1999). In fact, the MMN response is not justlarger but rather includes a separate subcomponent when thephoneme boundary is crossed. For example, the same voice onsettime span crossing an English phonemic category boundaryevokes a far larger MMN than one that does not (Phillips et al.2000). These results show that discrete phonologicalrepresentations can be accessed by the auditory cortex, thusproviding the basis for lexical storage and further linguisticcomputation.
Tonal languages have successfully explored experience-dependent effects on the automatic processing of phonologically

37
contrastive pitch (Gandour et al. 1994, Klein et al. 2001,Chandrasekaran et al. 2007, Chandrasekaran et al. 2009, Ren et al.2009, Xi et al. 2010). Chandrasekaran et al. (2007) showed thatearly cortical processing of pitch contours might be shaped by therelative saliency of acoustic dimensions underlying the pitchcontrasts of a particular language.
However, very few studies have examined suprasegmentalprosodic contrasts that convey discursive or pragmatic meaningsin intonational languages, like declarative vs. interrogative intent,and their results are controversial. In Doherty et al.’s (2004) study,a set of English speakers made judgments about falling statements(e.g., She was serving up the meal), rising declarative questions (withno word order change) and falling questions with thecorresponding word order change (e.g., Was she serving up themeal?). The authors found an increased BOLD activity for risingdeclarative questions over the falling counterparts, and theyargued that the differences may reflect the presence of a subtleaspect of illocutionary force (conduciveness) in the utteranceswith rising intonational contours (see also Post et al. in press).Fournier et al. (2010) examined the processing of lexical-tonal andintonational contrasts by speakers of an intonational language(standard Dutch) and of a tonal dialectal variety of Dutch(Roermond Dutch). They assumed that the brain responses to thestimuli would depend on the subjects’ language experience, but nogroup differences were found. The authors argued that theexpression and recognition of discourse meanings by means ofintonation, which is considered universal amongst languages, wasnot necessarily realized in an identical way in the human brain.Finally, Leitman et al. (2009) employed two artificial sequentialsinusoidal tones corresponding to English declaratives andinterrogatives. An “interrogative” deviant block and a“declarative” deviant block were presented, and authors foundsignificant MMN responses in both conditions.
In sum, the representation of segmental and tonal phonologicaldistinctions is found to be evident by means of the MMN, but this

38
is not the case of intonational discourse contrasts. Theabovementioned MMN results and its magneto-encephalographic(MEG) counterpart on intonational discourse contrasts could beinterpreted as detections of acoustic changes in the stimuli, andremain far from signaling intonationally-based phonologicaldistinctions indicating different meanings. Moreover, no previousstudy has examined the processing of intonational across-categorycontrasts (e.g. between statements and questions) and within-category contrasts (e.g. between two types of statements or twotypes of questions). The abovementioned studies exclusively usedminimal pairs as their basic stimuli and, furthermore, they did notshow any evidence for language-specific phonologicalrepresentations or traces for intonational contrasts.
Interestingly, in Catalan, a rising-falling intonational sequencecan be perceived as an information focus statement (IFS) or as acounter-expectational question (CEQ) depending exclusively onthe size of the pitch range interval of the rising movement. Thetwo rising-falling pitch contours consist of a rising movementassociated with the stressed syllable followed by a falling F0movement associated with the posttonic syllables (see Figure 7;also see Chapter 2). The following examples in (3) show two typicaldiscourse contexts in which these intonational configurationscould be found. An IFS context is shown in (3a), and a CEQ in (3b).In both cases, the target word petita [p ti.t ] (‘little’-fem.) istypically produced with a low tone on the first syllable, arising/high tone associated with the second (stressed) syllablefollowed by a falling/low tone associated with the third (posttonicsyllable). The prosodic difference between (3a) and (3b) lies on thepitch range difference between the low and the high tone, whichis expanded in the case of CEQ.
(3) a. Com la vols, la cullera? What type of spoon do you want?Petita, [sisplau]. [I want a] little [spoon, please].
b. Jo la vull petita, la cullera I want a little spoon.Petita? [N’estàs segur?] [A] little [one]? [Are you sure?]

39
In Chapter 2 we present a set of behavioral experiments(identification and congruity tasks) which confirm that acategorical phonological contrast exists between these two typesof rising-falling contours (compressed vs. expanded pitch range)and that they cue an IFS and a CEQ interpretation respectively.These results represent further evidence that pitch rangedifferences can be used to cue intonational distinctions at thephonological level, in line with the findings of other languages(Savino & Grice 2011, Vanrell et al. in press). In turn, this findingstrengthens the idea that pitch range differences can cuephonological distinctions in the intonational grammar of a non-tonal language like Catalan (Aguilar et al. 2009), thus expandingthe inventory of potential grammatical units in the description ofpitch movements.
The goal of the present chapter is to test whether theintonational contrasts differentiating IFS and CEQ in Catalan canelicit specific MMN responses, thus providing electrophysiologicalevidence in favor of the idea that the auditory cortex supportsdistinctive linguistic representations at the intonational level. Thearticle presents a behavioral identification experiment(Experiment 1) and an ERP study consisting of 3 oddball blockswith the aim of finding electrophysiological evidence for thisdiscrete distinction (Experiment 2).
3.2. Experiment 1
In Experiment 1, subjects participated in an identifications taskwhose goal was to identify each of the two meanings (Statementand Question) for a set of 16 stimuli in a pitch range continuum.The goal of Experiment 1 was twofold. First, to corroborate thephonological role of pitch range expansion in the interpretation ofrising-falling intonational contours in Catalan found in Chapter 2.Second, to determine the pitch region at which the change in

40
categorization occurs and thus select the target stimuli for theMMN oddball experiment. The same set of participants wasenrolled in the auditory event-related brain potential experimentseveral weeks later.
3.2.1. Methodology
ParticipantsFifteen healthy volunteers (3 male, aged 19-42 years, mean age22.5 years; one left handed) with no history of neurological,psychiatric or hearing impairment and with normal or corrected-to-normal visual acuity participated in the experiment. Subjectsreported not having any auditory deficiency and gave informedconsent and received monetary compensation for theirparticipation. The study was approved by the Ethics Committee ofthe University of Barcelona, according to the Code of Ethics of theWorld Medical Association (Declaration of Helsinki). Allparticipants were native speakers of Central Catalan andmusicians were excluded.
StimuliTo generate the auditory stimuli, a native speaker of Catalan (thefirst author of this study) read natural productions of the nounphrase petita [p .tí.t ] (‘little’-fem) with an IFS pitch contour and aCEQ pitch contour, and these utterances served as the sourceutterances for our stimuli (Figure 7). The original noun phraseutterances were pronounced with a rising-falling contour. Thisrising movement was of 0.9 semitones for the IFS and 9.9semitones for the CEQ. We then converted each syllables’ curve toa plateau (taking the mean Hz values for each segment) andnormalized the absolute pitch of the pretonic and posttonicsyllables of the two utterances (to their mean values). Then, werestored the observed differences of 0.9 and 9.9 semitones,respectively. The height of the accented syllable of the CEQ-based

41
stimuli was then adapted to the value of the IFS stimulus, and nonoticeable differences were observed between the stimuli. Afterthis, we normalized the durations of each syllable to the meanvalues of the two original utterances. The synthesized continuumwas created by modifying the F0 peak height in 16 steps (distancebetween each one = 0.6 semitones; see Figure 7). The speechmanipulation was performed by means of Praat (Boersma &Weenink 2008). Each stimulus lasted a total of 410 ms. Risingmovements were realized as a 100 ms high plateau starting 30 msafter the onset of the accented syllable /tí/, and were preceded bya low plateau for the syllable [p ] (102.4 Hz, 100 ms). The posttonicsyllable [t ] was realized with a low plateau (94.5 Hz, 180 ms). Thepretonic and posttonic F0 levels were maintained invariable in allmanipulations. The peak height continuum ranged from 105.3 Hzto 188.6 Hz.
Figure 7. Idealized schema of the pitch manipulation in the noun phrase petita[p ti.t ] (‘little’-fem.). Duration of the segments is shown at the top, and thelink between each segment is shown at the bottom. The Hz values at the centerof the image represent the final frequencies of the extreme stimuli (steps 00and 15).
ProcedureStimuli were presented to subjects over headphones and theiramplitude was adjusted to a comfortable level. Subjects wereinstructed to pay attention to the intonation of the stimuli anddecide which interpretation was more likely for each stimulus by

42
pressing the corresponding computer key, namely “A” forAfirmació (‘Statement’) and “P” for Pregunta (‘Question’).
The task consisted of 5 blocks in which all 16 stimuli in thecontinuum were presented to the subjects in a randomized order,for a total of 80 stimuli. We thus obtained a total of 1,200responses for Experiment 1 (16 steps × 5 blocks × 15 listeners). Theexperiment lasted approximately 8 minutes.
Response frequencies and reaction time (RT) measurementswere automatically recorded by means of E-prime version 2.0(Psychology Software Tools Inc. 2009). The experiment was set upin such a way that the next stimulus was presented only after aresponse had been given; yet subjects were instructed to press thebutton as quickly as they could.
3.2.2. Results
A one-way ANOVA was carried out with the proportion of“counterexpectational question” responses as the dependentvariable. The data were first checked for the occurrence ofpossible outliers on the basis of reaction time. Of a total of 1,200datapoints, 84 cases were treated as outliers, i.e. those cases wherethe reaction times were at a distance of at least three standarddeviations from the overall mean (RTs 1799). These cases wereexcluded from the analysis.
Figure 8 shows the identification rate (“y” axis) for the auditorycontinuum created (“x” axis). This rate is defined as theproportion of “Question” responses that were given over the total.The identification function presents a classic S-shape, revealingthat the lowest six stimuli belong to the category “Statement” andthe highest five stimuli to “Question”. The perceptual shift fromone category to another occurs in the range of stimuli 6 to 11; afull crossover from 16.92% to 85.92% is achieved between thesefive central steps.

43
Figure 8. Experiment 1 results. The sixteen stimuli perceived by the listenersare shown in the x axis. The left vertical axis represent the mean ‘Question’identification responses (Statement = 0 / Question = 1) for all subjects, whichare plotted through the black line (error bars showing ±1 Standard Error). Theright vertical axis represents the mean reaction times (in ms) for all subjects,which are plotted through the grey area (error bars showing ±1 Standard Error).

44
The analysis revealed a significant main effect of the auditorystimulus (F 15, 1100 = 117.624, p < .001). Tukey HSD post-hoc testsrevealed two main homogeneous subsets, namely betweenstimulus 0-6 and 11-15, so we can set an area of change ofcategorization between stimuli 6 and 11. In order to calculate theboundary value between the two categories, the set of data pointswas fitted to a logistic regression using SPSS (SPSS Inc. 2008). Thuswe obtained the boundary value calculated from the “b0” and “b1”values given for the logistic curve using the following formula:boundary = –ln(b0)/ln(b1). Hence, when “y” equals 0.5, “x” is 8.65(the boundary is therefore located between stimuli 8 and 9).
Figure 8 plots averaged RT responses in ms (“y” axis) for allstimuli (“x” axis). RT were measured from the start of theutterance playback (total length of the utterance = 380 ms). Thegraph indicates longer RTs for central stimuli, with a clearincrease observed for stimuli 7 to 9, which coincides with the areaof change reported in the identification function. As expected,listeners displayed faster RTs in identification of within-categoryexemplars than in exemplars representing the categoryboundaries.
Results of a univariate ANOVA indicated a statisticallysignificant effect of stimulus type on RT measures (F 15, 1100 = 2.678,p = .001). Duncan post-hoc tests revealed a homogeneous subsetbetween stimuli 0-6 and 10-15 and another one between stimuli 5-10. This second subset between stimuli 5-10 roughly coincideswith the area of change of perceptual categorization found in theidentification function.
Our behavioral results thus indicate that the variation in pitchrange is the main cue that Catalan listeners use to decide betweenan information focus interpretation (IFS) interpretation and acounter-expectational question (CEQ) interpretation. Takentogether, the identification and RT results clearly show that thetwo intonational categories under examination are categoricallyperceived. These results replicate the findings presented in

45
Chapter 2. Experiment 2 will test whether this intonationalcontrast can be neurophysiologically represented as measuredwith the MMN.
3.3. Experiment 2
3.3.1. Methodology
The aim of Experiment 2 was to test whether the intonationalcontrasts differentiating IFS and CEQ in Catalan can elicit aspecific MMN response, thus showing electrophysiologicalevidence supporting that the auditory cortex supports distinctivelinguistic representations at the intonational level. Wehypothesize that discrete intonational representations, as well asdiscrete phonological representations, can be representedthrough symbolic memory traces in the brain (see Pulvermüller &Shtyrov 2006).
ParticipantsThe same sample of fifteen Catalan speakers that participated inthe first experiment volunteered in the present experiment. Aperiod of time of 4 to 9 weeks was elapsed between the twoexperiments.
Stimuli and procedureBased on the results of Experiment 1 (i.e., a central area of changeof categorization and two tails of within-category variation), fourauditory stimuli were selected to be contrasted by pairs in threedifferent oddball blocks (stimuli 00, 05, 10 and 15). The choice wasmade according to two criteria: 1) the physical distance insemitones between two stimuli within a pair was kept constant (3semitones); and 2) two stimuli had to be classified as belonging tothe “statement” category, and two to the “question” category.Thus, all contrasts involved the same physical difference but thecentral one (stimuli 05 and 10) involved a categorical difference as

46
well. The idealized intonational contours of the stimuli used aredisplayed in Figure 9.
Figure 9. Idealized intonational contours of the four stimuli used in the ERPstudy. Though the same physical difference exists between the four hightargets, the extreme pairs represent within-category contrasts, whereas thecentral pair represents an across-category contrast between statements (IFS)and questions (CEQ), as stated by Experiment 1.
The experiment consisted of 3 oddball blocks presented in randomorder, with short pauses in between. Each oddball block lasted 21minutes approximately, and contained 720 standard (STD) stimuliand 180 deviant (DEV) stimuli (80% STD – 20% DEV). STD and DEVstimuli were presented pseudo randomly, with the constraint thata deviant stimulus was preceded by a minimum of two standardstimuli. While the lower pitch stimulus acted as a STD, the higheracted as a DEV, resulting in the following oddball blocks: lower[within-category] (step 00 STD, step 05 DEV), central [across-category] (step 05 STD, step 10 DEV), higher [within-category](step 10 STD, step 15 DEV).
All stimuli were presented with a fixed SOA of 1400 ms. Theonset of the deviance between a pair of stimuli appeared at thesecond syllable of the token (120 ms after stimulus onset). The useof occlusive phonemes at the beginning of each syllable allowed usto obtain reliably time-locked ERPs (see Pulvermüller 2005).Participants sat in a comfortable chair in a sound-attenuated andelectrically shielded room. They were instructed to ignore the

47
sounds delivered by headphones and watch a silent movie withsubtitles. The amplitude of the stimuli was adjusted to acomfortable level. The total duration of the experiment wasapproximately 100 minutes, including the EEG recordingpreparation.
EEG RecordingThe EEG was continuously recorded with frequency limits of 0-138Hz and digitized at a sampling rate of 512 Hz (EEmagine, ANTSoftware b.v., Enschede, Netherlands). Ag/AgCl electrodes wereused for the EEG acquisition, 33 of which were mounted in a nyloncap (Quik-Cap; Compumedics, Abbotsford, VIC, Australia)according to the international 10-20 system. Vertical andhorizontal electrooculogram (EOG) were measured frommonopolar electrodes placed respectively below (VEOG) andlaterally (HEOG) to the right eye. The ground electrode waslocated on the chest and the common reference electrode wasattached to the tip of the nose. All impedances were kept below 5k during the whole recording session.
The continuous EEG was further bandpass-filtered off-linebetween 1 and 20 Hz and cut in epochs of 700ms duration,including a pre-stimulus baseline of 100ms, for each deviant andstandard in all 3 conditions (except for the standard following adeviant stimulus; 180 deviant epochs and 540 standard epochs percondition). Epochs with a signal range exceeding 100 µV at anyEEG or EOG channel were excluded from the averages, resulting ina mean of 143 deviant epochs (SD = 20.3; 94 minimum) and 325standard epochs (SD = 47.4; 213 minimum) after rejection.
MMN difference waveforms were obtained by subtracting theERPs elicited by standard stimuli from those elicited by deviantstimuli. The MMN peak was determined from the Fz electrode asthe largest negative peak in the interval of 200-400ms (80-280msafter stimulus onset) for all difference waves and subjectsseparately. Because MMN peak latencies were not significantlydifferent across conditions, MMN mean amplitudes were derived

48
in a 80ms time window centered on the mean peak latency of thegrand-average waveforms for all the 3 conditions (265-345ms).
Data AnalysisThe presence of a significant MMN elicited to each intonationalcontrast was analyzed by means of one-sample t-tests on the MMNamplitude at Fz in each of the three conditions separately. Theintonational contrast effects on the MMN peak latencies and meanamplitudes at Fz electrode were evaluated with separate repeatedmeasures ANOVAs including the factor: Contrast (lower [within-category], central [across-category], higher [within-category]).Because MMN inverts its polarity below the Silvian fissure (ref),another repeated measures ANOVA was conducted to assess theeffects on the MMN mean amplitude retrieved at Mastoidelectrodes, with the factors: Channel (M1, M2) x Contrast (lower,central, higher). The Greenhouse-Geisser correction was appliedwhen appropriate.
In an attempt to relate the electrophysiological responses withbehavioral measures, a bivariate correlation analysis wasperformed between the MMN mean amplitude and theCategorization Index (CI) for all subjects as well as for the grandmean data. For these specific analyses, the EEG data were re-referenced to combined Mastoids in order to better assess thepower of the effects. We defined the CI as the difference betweenthe categorization scores to each of the two stimuli in a pair, thusresulting in three measures per subject: lower [within-category](step 05 – step 00 scores), central [across-category] (step 10 – step05 scores) and higher [within-category] (step 15 – step 10 scores).The higher the CI, the higher the categorical difference a subjectmade between a pair of stimuli (please note that we have steps of0.2 CI because each stimulus in experiment 1 was presented fivetimes to each subject). To further test the significance of theobtained correlation values, we estimated the variability of thecorrelation statistic (Pearson’s correlation coefficient) with thebootstrap method. Bootstrapping is a resampling method that

49
helps to perform statistical inferences without assuming a knownprobability distribution for the data. In short, the correlationindex was calculated for 10000 randomly chosen samples (withreplacement) of N=45 (15 subjects x 3 conditions) of MMNamplitude values and CI scores respectively. The obtaineddistribution (H1; centered at the Pearson’s coefficient value that isobtained performing a simple correlation with the raw data) wastested for significance against the null hypothesis distribution(H0), which arises from performing the correlation analysis in10000 random samples of MMN and CI scores (N=45) pooledtogether. Thus, the bootstrap method yields a mean of thecorrelation statistic for the H0 centered at 0, with the confidenceintervals (95%) that are used to test the significance of theobtained H1.
3.3.2. Results
Grand average waveforms elicited to STD (dotted line) and DEV(continuous line) stimuli at Fz, M1 and M2 electrodes are shown inFigure 10. DEV minus STD stimuli difference waveforms are shownin Figure 11. The mean values of the DEV minus STD waveforms atthe 266-346 ms window (and their standard deviations) are shownin Table 4. The amplitude enhancement of the DEV stimuli AEPscompared to the STD stimuli ERPs, around 180 ms post-devianceonset and identified as the MMN, was statistically significant ineach intonational contrast (lower [within-category] contrast, t14 = –6.217, p < .0005; central [across-category] contrast, t14 = –8.875, p <10-6; higher [within-category] contrast, t14 = –6.551, p < .0005). Arepeated measures ANOVA on the MMN peak latencies did notyield any difference between the three conditions (F 2, 28 = 2.828, p =n.s., 2 = .168). As we hypothesized, the mean amplitude of theMMN was larger for the central [across-category] intonationalcontrast (steps 05 - 10) compared to the within-category contrasts:Intonational contrast effect at Fz, F 2, 28 = 3.417, p < .05, 2 = .196

50
(within subject contrasts: lower vs. central, F 1, 14 = 6.256, p < .05, 2
= .309; central vs. higher, F 1, 14 = 4.898, p < .05, 2 = .259; lower vs.higher , F 1, 14 = 0.172, p = n.s., 2 = .012). The analysis at the Mastoidelectrodes yielded similar results to those obtained at Fz: F 2, 28 =6.978, = .679, p = .01, 2 = .333 (within subject contrasts: lower vs.central, F 1, 14 = 43.403, p < .00001, 2= .756; central vs. higher, F 1, 14 =4.323, p = .056, 2 = .236; lower vs. higher, F 1, 14 = 1.203, p = n.s., 2 =.079). The scalp distribution maps of the MMN are shown in Figure12.
Figure 10. Grand-average waveforms elicited to STD and DEV stimuli and theirdifference waves. The first row (in red) represents the lower [within-category]contrast, the second row (in green) represents the central [across-category]contrast, and the third row (in blue) represents de higher [within-category]contrast. In each plot, STD and DEV responses are represented by colored lines,STD with dotted lines and DEV with continuous lines. Also, DEV minus STDstimuli difference waveforms are plotted in black. Columns indicate themeasures at Fz, M1, and M2 (left, center and right columns, respectively).

51
Figure 11. DEV minus STD stimuli difference waves of each contrast, measuredat Fz, M1 and M2 electrodes (left, center and right columns, respectively). MMNprocesses are observed at frontocentral electrodes (Fz) as negative deflectionsof the ERP, and at mastoid electrodes as positive deflections, as MMN invertspolarity below the Silvian fissure when the reference electrode is placed on thetip of the nose (Näätänen & Michie 1979).
Table 4. Mean MMN amplitudes and their standard deviations for the threeexperimental contrasts (lower [within-category], central [across-category], andhigher [within-category]).
Mean (Std. Deviation)
Contrast FZ M1 M2
lower (00-05) -.21 (.726) .17 (.584) .33 (.603)
central (05-10) -.73 (.474) .96 (.606) .73 (.396)
higher (10-15) -.31 (.765) .38 (.875) .52 (.671)
Figure 12. Scalp potential distribution maps at the MMN time window extractedfrom the DEV minus STD difference waves (265-345 ms).

52
Furthermore, an analysis between the CI and the MMN meanamplitude (electrophysiological measure) yielded a significantnegative correlation: Pearson’s correlation statistic = –.308; p < .05(one-tailed). This means that the higher the amplitude of theMMN elicited in an oddball sequence with that pair of stimuliacting as DEV and STD stimuli, the more a subject categorizeddifferently the two stimuli within a pair. The significance of thiscorrelation was further supported by an analysis using thebootstrap method: Pearson’s correlation statistic samplingdistribution centered at –.308; confidence interval of the nullhypothesis with 95% confidence bounds, [–.289, .297]; p = .018.Additionally, we performed a bivariate correlation between thegrand mean of the CI and the grand mean of the MMN, yielding asignificant Pearson’s correlation of –.999; p = .011. Weacknowledge that the statistics on the grand mean cannot betaken as a real proof of the existence of a correlation between theCI and the MMN; however, it serves us to illustrate more clearlythe direction of the effects. Bivariate correlations between CI andMMN for all subjects and grand means respectively, and thebootstrap sampling distributions of the alternative and nullhypotheses can be seen in Figure 13.
3.4. Discussion
Previous electrophysiological studies on vocalic and consonantalphonological contrasts have found evidence that native linguisticcontrasts elicit significantly larger MMN responses than non-native contrasts (Näätänen et al. 1997, Winkler et al. 1999, Eulitz &Lahiri 2004). In addition, acoustic contrasts that cross a categoryboundary lead to larger MMN responses than comparable acousticcontrasts that did not cross these category boundaries (Dehaene-Lambertz 1997, Sharma & Dorman 2000; Phillips et al. 2000).Similarly, it is an established result that tone contrasts in tonallanguages obtain larger MMN responses when listeners are

53
Figure 13. Bivariate correlations between CI and MMN, for all subjects (top) andgrand means (botoom-left), and the bootstrap sampling distributions of thealternative and null hypotheses (bottom-right).
exposed to native tonal contrasts (Gandour et al. 1994, Klein et al.2001, Chandrasekaran et al. 2009, Ren et al. 2009) and also in tonalstimuli crossing the category boundaries (Chandrasekaran et al.2007, Xi et al. 2010). Thus a substantial set of empirical resultsdemonstrate the larger activation of memory traces for linguisticelements in the human brain. In line with this, Näätänen (2001)proposed that the MMN reflects the early access to storedlinguistic representations. In the recent years, more evidence has

54
been accumulating that MMN reflects the early access of linguisticinformation, reflecting early automatic processes of lexical accessand selection, semantic information processing and syntacticanalysis (see Pulvermüller & Shtyrov 2006 for a review). Yetprevious electrophysiological results on the representation ofphonological contrasts at the level of intonation are stillcontroversial. Doherty et al. (2004) and Leitman et al. (2009)argued that the large MMN elicited only by interrogative stimuli(and not by the declarative stimuli) “may underlie the ability ofquestions to automatically capture attention even when thepreceding declarative information has been ignored” (Leitman etal. 2009: 289). Fournier et al. (2010) argued that the recognition ofdiscourse meanings by means of intonation was not necessarilyclear by looking at the human brain.
Our results go beyond the body of evidence presented byprevious experiments and provide electrophysiological evidencethat phonological contrasts at the intonational level (based on apitch range difference) are encoded in the auditory cortex. Theempirical data in our study was based on an intonational contrastbetween statements and questions in Catalan. The results ofExperiment 1, which tested the participants’ interpretation ofisolated stimuli in a binary way (statement vs.counterexpectational question), corroborated the findingspresented in Chapter 2 by indicating a clear nonmonotonicidentification. Specifically, a perceptual shift from one category toanother occurred in the range of stimuli 6 to 11, with a fullcrossover from 16.92% to 85.92% achieved between these fivecentral steps. Moreover, post-hoc tests revealed two mainhomogeneous subsets, namely between stimulus 0-6 and 11-15.Concerning reaction times, listeners displayed faster RTs inidentification of within-category exemplars than in exemplarsrepresenting the category boundaries (specially for stimuli 7 to 9).
For Experiment 2, four auditory stimuli were selected to becontrasted by pairs in three different oddball blocks. Though thephysical distance between each pair of stimuli was kept constant,

55
the central pair represented an across-category contrast whereasthe other pairs represented within-category contrasts. The meanamplitude of the MMN was found to be larger for the across-category contrast compared to the other contrasts, suggestingthat intonational contrasts in the target language can be encodedautomatically in the auditory cortex. Moreover, our resultsshowed that the activation of these auditory cortex intonationalrepresentations was related to the individuals’ subjectiveperception and performance. As Pulvermüller & Shtyrov (2006)proposed, the MMN might reflect not only the automaticdetection of a change, but also the activation of a certain symbolicmemory trace in the brain. Finding a MMN for within-categorycontrasts would indicate that a change in the acousticenvironment has been detected, but the symbolic memory trace isstill the same called by the standard. By contrast, finding asignificantly larger MMN in an across-category contrast wouldthus not only indicate a reactivation of the attentional system, butalso an activation of different cortical cell assemblies supportinganother long-term memory trace.
It is also important to note that our data can also support analternative explanation, i.e., that the MMN results may reflectperceptual saliencies or distinctiveness that may be consistentacross languages. While external evidence suggests that the MMNmay reflect symbolic memory traces, others have suggested thatthe MMN robustness may reflect individual differences indimensional weighting (e.g. Chandrasekaran et al. 2007,Chandrasekaran et al. 2009). For example, animals showcategorical perception (Kuhl & Miller 1978), and thus theincreased MMN for across-category contrasts may reflect auditorydiscontinuities (e.g. Holt et al. 2004, for voice onset time), i.e.,natural boundaries within which distinctiveness is enhanced,reflecting a warped acoustic space (Kuhl & Miller 1975). Onepossibility for demonstrating the explanation based on symbolicmemory traces would be the application of a cross-languagedesign, but this should be addressed in future studies.

56
The present experiment design does not allow us to draw anyconclusions regarding the specific neural network supporting theacross-category intonation contrasts observed here as enhancedMMNs and therefore we can only speculate. The MMN hasmultiple cerebral sources, including the auditory cortex (Alho1995, Escera et al. 2000) and frontal regions (Deouell 2007), andrecent results from animal (Ulanovsky et al. 2003, Pérez-Gonzálezet al. 2005, Malmierca et al. 2009, Antunes et al. 2010) and humanstudies (Grimm et al. 2011, Slabu et al. 2010) have suggested thatdeviance detection yielding to MMN generation might encompassthe whole auditory hierarchy (Grimm & Escera 2012). Moreover,recent studies have suggested that processing linguistic deviantfeatures recruits not only auditory but also motor cortical regionsin a somatotopic fashion (Hauk et al. 2006, Shtyrov et al. 2004), andthat category-based enhancement is often found in prefrontalregions (Freedman et al. 2001). In addition, Raizada & Poldrack(2007) found that lower-level auditory areas show littleenhancement of across-category phonetic pairs relative to higherorder areas, and Zhang et al. (2011) have shown that across-category variation on a lexical tonal continuum activated the leftmiddle temporal gyrus, apparently reflecting abstractphonological representations, whereas the within-categorycontrasts activated the superior temporal and Heschl gyribilaterally. Therefore, it is possible that the cross-categoryintonational effects observed here as a frontally distributedenhanced MMN, compared to the within category one, mightreflect the activation of a distributed cortical network includinghigher-order auditory areas, such as the posterior superiortemporal gyrus and the middle temporal gyrus, and frontalregions.
In sum, the MMN findings reported in this chapter show that adistributed auditory-frontal cortical network supports not onlyphonological representations at the segmental level but also at theintonational level. Catalan listeners showed a larger MMNresponse to differences in pitch activating the semantic contrast

57
between a question and a statement. To our knowledge, this is thefirst study showing a clear electrophysiological response to achange of intonational category. This result agrees withPulvermüller & Shtyrov’s (2006) hypothesis that MMN responsesreflect early automatic processes not only affecting lexical accessand selection, but also semantic and discourse informationprocessing.


59
CHAPTER 4
The role of facial gestures in establishing discoursecategories
4.1. Introduction
The strong influence of visual cues upon speech perception innormal verbal communication has increasingly been recognized.Audiovisual speech studies have revealed that the visualcomponent plays an important role in various aspects ofcommunication typically associated with verbal prosody. Thevisual correlates of prominence and focus (movements such aseyebrow flashes, head nods, and beat gestures) boost theperception of these elements (Cavé et al. 1996, Hadar et al. 1983,Krahmer & Swerts 2007, Swerts & Krahmer 2008, Dohen &Lœvenbruck 2009). Similarly, audiovisual cues for prosodicfunctions such as face-to-face grounding (Nakano et al. 2003) andquestion intonation (Srinivasan & Massaro 2003) have beensuccessfully investigated, as have the audiovisual expressions ofaffective meanings such as uncertainty (Krahmer & Swerts 2005)and frustration (Barkhuysen et al. 2005).
In the last few decades, an important research topic in the fieldof audiovisualprosody has been the relative importance of facialcues with respect to auditory cues for signaling communicativelyrelevant information. A large number of studies have described acorrelated mode of processing, whereby vision partially duplicatesacoustic information and helps in the decoding process. Forexample, it is well known that visual information provides apowerful assist in decoding speech in noisy environments,particularly for the hearing impaired (Sumby & Pollack 1954,Breeuwer & Plomp 1984, Massaro 1987, Summerfield 1992, Grant &Walden 1996, Grant et al. 1998, Assmann & Summerfield 2004).

60
Another set of studies has found a weak visual effect relative to arobustly strong auditory effect. For example, it has been foundthat observers extract more cue value from auditory featureswhen it comes to marking prominent information in an utterance(Scarborough et al. 2009). Krahmer et al. (2002) found that peoplepay much more attention to auditory than to the eyebrowinformation when they have to determine which word in anutterance represents new information, and other follow-upstudies confirmed the relatively weak cue value of these visualfeatures, yet at the same time provided evidence that visual cuesdo have some perceptual importance (given that a visual-cue-onlyidentification task yielded 92.4% correct guesses; see Krahmer &Swerts 2004).
Srinivasan and Massaro (2003) showed for English thatstatements and questions are discriminated both auditorily (onthe basis of the F0 contour, amplitude and duration) and visually(based on the eyebrow raise and head tilt), but they also found amuch larger influence of the auditory cues than visual cues in thisjudgment. Their results were consistent with those reported byHouse (2002) for Swedish, who found that visual cues (consistingof a slow up-down head nod and eyebrow lowering for questions,and a smile throughout the whole utterance, a short up-downhead nod and eye narrowing for statements) did not stronglysignal interrogative meanings, compared to auditory informationlike pitch range and peak alignment differences. Dohen andLœvenbruck (2009) showed that adding vision to audition forperception of prosodic focus in French can both improve focusdetection and reduce reaction times. When the experimentalparadigm was applied to whispered speech, results showed anenhanced role for visual cues in this type of speech. However,when evaluating the auditory-visual perceptual processesinvolved in normal speech, they found that auditory-onlyperception was nearly perfect, which suggests a ceiling effect forvisual information. These results were in line with those fromKrahmer and Swerts (2004), which showed that prosodic

61
prominence was very well perceived auditorily only for normalspeech in Dutch and Italian. In relation to this, fMRI studies haveshown that when visual and audio channels share time-varyingcharacteristics this results in a perceptual gain which is realizedby subsequent amplification of the signal intensity in the relevantsensory-specific cortices (auditory and visual) (see Calvert &Campbell 2003, Colin et al. 2002).
The abovementioned results could lead to the conclusion thatvisual information from the face is essentially redundant toauditory information, by using a set of audiovisual properties thatcan be found in most intonational languages. However, there are afew studies that have found that visual information is crucial insignaling certain types of attitudinal or emotional correlates.Studies like those of Swerts and Krahmer (2005), Dijkstra et al.(2006) and Mehrabian and Ferris (1967) have found that visualinformation is far more important for communicative purposesthan acoustic information. In the first study, Dijkstra et al. (2006)studied speakers’ signs of uncertainty about the correctness oftheir answer when answering factual questions. They noted theuse of prosodic cues such as fillers (“uh”), rising intonationcontours or marked facial expressions. Results showed that, whileall three prosodic factors had a significant influence on theperception results, this effect was by far the largest for facialexpressions. Similarly, Swerts and Krahmer (2005) showed thatthere are clear visual cues for a speaker’s uncertainty and thatlisteners are more capable of estimating their feeling of aninterlocutor’s uncertainty on the basis of combined auditory andvisual information than on the basis of auditory informationalone. When visual expressions such as funny faces and eyebrowmovements occurred, they seemed to offer a very strong cue forestimating uncertainty.9 Mehrabian and Ferris (1967) analyzed
9 Authors refer to uncertainty with the term “feeling of knowing”, which isdefined as the ability to monitor the accuracy of one’s own knowledge or theability to monitor the feeling of knowing of someone else (“feeling ofanother’s knowing”) (see, e.g., Litman & Forbes-Riley 2009).

62
how listeners got their information about a speaker’s generalattitude in situations where the facial expression, tone of voiceand/or words were sending conflicting signals.10 Three differentspeakers were instructed to say “maybe” with three differentattitudes towards their listener (positive, neutral or negative).Next, photographs of the faces of three female models were takenas they attempted to convey the emotions of like, neutrality anddislike. Test groups were then instructed to listen to the variousrenditions of the word “maybe,” with the pictures of the models,and were asked to rate the attitude of the speakers. Significanteffects of facial expression and tone were found such that thestudy suggested that the combined effect of simultaneous verbal,vocal and facial attitude communications is a weighted sum oftheir independent effects with the coefficients of .07, .38 and .55,respectively. Nevertheless, these results do not mean that thecoefficients derived may not vary greatly depending upon anumber of other factors, such as actions, context of thecommunication and how well the interpreting individual knew theother person (see also Lapakko 1997).
Thus, an overview of the literature reveals that visual cues arepotentially useful as markers of prosodic information, yet it is stillunclear how important they are compared to auditory cues. In thepresent chapter, we address this question by analyzing thepatterns of prosodic perception of contrastive focus statements vs.counter-expectational questions in a group of Catalan speakers.The main goal of the chapter will be to investigate the relativecontribution of visual and pitch accent cues in conveying thisspecific prosodic distinction in Catalan. In this language, aspresented in Chapters 2 and 3, a pitch range difference in a rising-falling nuclear configuration is the main intonational cue for the
10 The term ‘tone of voice’ has to be understood in a non-technical way. In thisexperiment, subjects were asked to listen to a recording of a female sayingthe single word ‘maybe’ in three tones of voice conveying liking, neutralityand disliking.

63
distinction between statements (both information and contrastivefocus statements) and counter-expectational questions (seeChapter 2). Figure 14 shows the waveforms and F0 contours of theproper noun Marina produced with a CFS meaning (left) and a CEQmeaning (right). In line with this, a L+H* L% nuclear configurationfor the expression of contrastive focus statements (CFS) and aL+¡H* L% nuclear configuration for a counter-expectationalquestion (CEQ) (see the Cat_ToBI proposal in Prieto in press andAguilar et al. 2009).
Figure 14. Waveforms and F0 contours of the proper noun Marina ‘person’sname’ produced with a CFS meaning (left) and a CEQ meaning (right).
This chapter addresses two related questions regarding theperceptual processing of the audiovisual markers of CFS vs. CEQmeanings in Catalan. First, how important are facial gesturalcorrelates to this distinction with respect to pitch accent cues?Second, are there differences in the relative weight of the acousticinformation when facial cues are less prominent and thus moreambiguous? The advantage of using the Catalan distinctionbetween CFS and CEQ meanings is that we will be assessing therelative perceptual importance of a well-known pitch accentcontrast in the intonational phonology of Catalan (L+H* forstatements and L+¡H* for questions) in conjunction withcongruent and incongruent facial gesture information. To ourknowledge, no previous studies have examined the bimodal
5050
90
130
170
210
250
F0 (H
z)
0 0.5 1 1.5
m i n m i n

64
perception of a prosodic contrast by using congruent andincongruent pitch accent and facial cue information. Thismethodology will allow us to create a very controlled situationwhere both pitch accent contrasts and visual information arecarefully controlled for in a bimodal identification task.
The following sections describe the two experiments that wereconducted to address these questions. Experiment 1 tackled therelative contribution of visual and auditory information to thetarget prosodic contrast by means of an identification experiment.For this task, subjects were presented with two video clips of aperson’s face as they spoke the word Petita(?) ‘small’ with theirexpression conveying one or the other of the two target meanings.The visual material was coupled with an audio track selected froma continuum of varying degrees of pitch range for the rising-falling configuration (the main acoustic cue to the distinctionbetween the two meanings). Subjects were thus presented witheither congruent or incongruent audio and visual target stimuli.Experiment 2 also investigated the role of auditory and visualinformation using the same stimuli but this time the continuum ofaudio cues was combined with a continuum of facial expressionscreated using a digital image-morphing technique. The task of theparticipants was again to identify the intended meaning (CFS orCEQ), for each combined audio + visual stimulus.
4.2. Recordings
Little research has been undertaken on the description of gesturalpatterns in Catalan. Most of the studies have been devoted to thedescription of Catalan emblems, i.e. specific hand/arm gestureswhich convey standard meanings that are used as substitutes forwords (for example, holding up the hand with all fingers closed

65
except the index and middle finger, which are extended andspread apart, can mean ‘V for victory’ or ‘peace’).11
There has been no previous research dealing specifically withthe facial gestures that characterize CFS and CFS meanings inCatalan. Thus in order to decide which gestural patterns would beused as target facial expressions in our visual materials, ten nativespeakers of Catalan between the ages of 20 and 47 were videotapedpronouncing both possible interpretations of the utterance. Twoof the ten speakers were the authors, and the other eight weregraduate students and professors, with no previous experience inaudiovisual research. In order to prompt the correspondinganswer, subjects were asked to read in an expressive way the twodialogues in (4), with dialogue (4a) involving CFS and dialogue (4b)exemplifying a CEQ. As is well known, in this type of echoquestions, the listener repeats information that s/he has justheard, and these questions are sometimes marked by a nuance ofsurprise or incredulity. Subjects were given no instructions as tohow to express these pragmatic meanings in audiovisual prosody.The audiovisual recordings of all ten speakers were carried out inquiet research rooms at the Universitat Autònoma de Barcelonaand the Universitat Pompeu Fabra. Speakers were seated on achair in front of a digital camera that recorded their upper bodyand face at 25 frames per second.
(4) a. Volies una cullera gran, no? You wanted a big spoon, didn’t you? Petita, [la vull, i no gran]. [I want a] little [one, not a big one].b. Jo la vull petita, la cullera. I want a little spoon. Petita? [N’estàs segur?] [A] little [one]? [Are you sure?]
11 Of particular note is the work by Amades (1957), Mascaró (1978, 1981) andespecially Payrató (1989, 1993), which contains a description of a repertoireof 221 emblems and pseudoemblems of Central Catalan. Since the 1990s, twoprojects lead by Lluís Payrató and financed by the varcom and pragmaestilhave analyzed the system of Catalan gestures but have mainly focused oncoverbal manual gestures (see e.g. Payrató et al. 2004).

66
From these twenty visual tokens (ten for each pragmaticmeaning), the authors assessed qualitatively the facial gesturecorrelates that were most effective and representative for eachpragmatic meaning. One of the facial expressions that correlatemost clearly with the perception of CFS is the upward eyebrowmovement and forward head movement. For a CEQ, the facialexpression is characterized by a furrowing of the brows and asquinting of the eyes, often accompanied by a head shake. Figure15 shows two representative stills of the facial expression as one ofour speakers spoke a CFS (left panel) and a CEQ (right panel). Fordescribing the facial gestures, we have used the Facial ActionCoding System (FACS), developed by Paul Ekman and hiscolleagues, which allows coding of all visually distinguishablefacial expressions (Ekman & Friesen 1978, Ekman et al. 2002). FACSgroups muscle activity into so-called Action Units (AUs) thatbundle uniquely identifiable facial movements, the articulatorybasis of these movements can thus be the activity of one ormultiple muscles. Three AUs are relevant in the production ofeyebrow movements (see also De Vos et al. 2009): AU 1, the InnerBrow Raiser; AU 2, the Outer Brow Raiser; and AU 4, the BrowLowerer. For CFS interpretations, the most common facialexpression consisted of a combination of action units AU1+2(Inner and Outer Brow Raisers) and M57 (Head Forward). For CEQinterpretation, the most common pattern was a combination ofAU4 (Brow Lowerer) and M58 (Head Backward).12
12 Please note that there is a noticeable lip stretching in the case of the CFSgesture. It is interesting to point that the gestural overarticulation of thesegments in accented position (in our case, the vowel /i/) is a commonphenomenon among the production of CFS (as described by Dohen &Lœvenbruck 2009, Prieto et al. 2011, and Borràs-Comes et al. 2011). In fact,this specific aspect lead us to compare CEQ with CFS, as both categories areproduced in face-to-face communication with a specific facial configuration(which is not the case of their nonbiased counterparts, i.e., IFS and ISQ).

67
Figure 15. Representative stills of a facial expression of one of our speakerswhile producing a CFS (left panel) and a CEQ (right panel).
From the results of the production test it was thus clear that oneof the most effective gestural cues for the distinction between CFSand CEQ was the pattern of eyebrow movements. A number ofcrosslinguistic studies have shown that eyebrow movementscombine with facial gestures (Beskow et al. 2006, Cavé et al. 1996,Graf et al. 2002, Scarborough et al. 2009, Armstrong 2012) or headmovements (Beskow et al. 2006, Graf et al. 2002, Hadar et al. 1983,Scarborough et al. 2009, Munhall et al. 2004) to express prosodicfocus. For instance, it has been found that focus production isaccompanied by eyebrow raising and/or a head nod (Krahmer &Swerts 2004 for Dutch, Dohen et al. 2006 for French).
It is also interesting to note that in sign languages, eyebrowmovements serve various grammatical functions. For example,eyebrows are furrowed in wh-questions and raised in yes/noquestions in American Sign Language (Baker-Shenk 1983,Grossman 2001, Grossman & Kegl 2006), Swedish Sign Language(Bergman 1984), British Sign Language (Kyle & Woll 1985) and SignLanguage of the Netherlands (Coerts 1992) — see Pfau and Quer(2010) for a review.
The prosodic information obtained in this set of audiovisualrecordings was used as a basis for the preparation of audiovisualstimuli for use in our two perception experiments. While theacoustic information was almost identical in the two experiments

68
(a set of either 11 or 6 pitch range differences created with PSOLAmanipulation), the visual information was different, in that weused two unmanipulated video recordings for the contrast forExperiment 1 but used six videos in Experiment 2, with four ofthese clips being digitally-generated interpolations between partof the two used in Experiment 1.
4.3. Experiment 14.3.1. Methodology
The first experiment tested the role of auditory and visualinformation in pragmatic identification of CFS and CEQ by meansof an auditory continuum of pitch range which was combined withtwo video clips depicting the facial gestures characteristic of thetwo pragmatic meanings in such a way that the audio cue might becongruent or incongruent to a greater or lesser degree with thevisual cue.
ParticipantsA total of twenty native speakers of Central Catalan participated inthe experiment. The ages of the participants ranged from 18 to 36.All of them were undergraduate or graduate students with noprevious experience in audiovisual research.
MaterialsTo make sure that participants in our experiments could focus asmuch as possible on the audiovisual correlates of the two targetpragmatic meanings, we selected a very short utterance thatwould contain the target intonational cues and facial gestures. Togenerate the audiovisual stimuli for the experiment, a nativespeaker of Catalan was videotaped several times producing naturalproductions of the noun phrase petita [p ti.t ] (‘small’-fem) witheither a CFS contour or a CEQ contour. The author tried to imitatethe two gestural patterns selected from among our preliminary

69
video recordings as representative of the CFS and CEQ meanings.The two authors of the original paper then selected the twoexemplars that best characterized the contrast, while at the sametime making sure that syllabic durations were similar in the tworecordings. Figure 16 shows three representative stills from thevideo clips as the subject utters first a CFS (upper panels) and thena CEQ (lower panels). The three images in each set correspond tothree different stages of the facial gesture: initial expression (left),central expression (centre; approximately coinciding with thebeginning of the stressed syllable) and final expression (right).
Figure 16. Stills from video clips depicting facial gestures during the utteranceof a CFS (upper panels) and a CEQ (lower panels). The three images correspondto three different stages of the gestures: initial expression (left), centralexpression (centre) and final expression (right).
Focu
s seq
uenc
eQu
estio
n se
quen
ce
The target utterances were inspected for their prosodicproperties. As expected, both target sentences were pronouncedwith a rising-falling intonational contour (L+H* L%) but differed inpitch range. The observed values for the high tone were 148.1 Hzfor the CFS example and 208.7 Hz for the CEQ example. As notedabove, duration patterns had been controlled for in the original

70
materials. Table 5 shows the duration values of each of the targetsegments of the utterance petita in both readings (CFS and CEQ),revealing very small differences across the two utterances.
Table 5. Original values of the duration (in ms.) of the target segments in theauditory sequence petita ‘small’ and their difference.
original CFS original CEQ difference
p 13 17 4
68 80 13
t 41 39 2
i 116 110 6
t 35 39 3
116 124 8
Sum 389 409
To prepare the target auditory stimuli for the experiments, wechose one of the two auditory recordings (the CEQ) andmanipulated the pitch by means of Praat (Boersma & Weenink2008). A synthesized continuum was created by modifying the F0peak height in 11 steps (distance between each one = 0.6semitones). The pitch values corresponding to the accentedsyllable of the word petita were manipulated so that they would berealized as a 110 ms plateau starting 39 ms after the onset of theaccented syllable /’ti/, and were preceded by a low plateau for thesyllable [p ] (102.4 Hz, 97 ms). The posttonic syllable [t ] wasproduced with a low plateau (94.5 Hz, 163 ms). A schematicdiagram of these manipulations is shown in Figure 17.

71
Figure 17. Schematic diagram with the pitch target manipulation.
Each one of the auditory steps was then combined with the twotarget visual stimuli (see Figure 16), for a total of 22 targetaudiovisual stimuli. Since the video materials were recorded at 25frames per second and the observed differences between naturalauditory stimuli never surpassed 40 ms., no visual manipulationswere needed to prepare the final audiovisual stimuli. An informalinspection of the data did not reveal cases of undesired lip-syncproblems and visually the manipulated stimuli appeared natural.To confirm these impressions, we asked a panel of twoindependent judges to check all the stimuli in terms of whetherthey felt that either auditory or visual signals lagged behind, orinstead appeared perfect synchronized. This additional check didnot reveal any problematic cases of audiovisual mismatches.
ProcedureExperiment 1 consisted of 5 blocks in which all 22 stimuli werepresented to the subjects in a randomized order. A brief trainingsession was conducted prior to the task in order to get subjectsaccustomed to the stimuli and the task. In this session, subjectswere shown two repetitions of the fully congruent and fullyincongruent audio + visual combinations.
Stimuli were presented to subjects using a laptop computerequipped with headphones. Subjects were instructed to payattention to the auditory stimuli and facial gestures as a whole and

72
decide which interpretation was more likely for each stimulus bypressing the corresponding computer key, “0” for CFS and “1” forCEQ.
The experiment was set up by means of E-Prime version 2.0(Psychology Software Tools Inc. 2009), which allowed us to recordresponse frequencies automatically. A timer with 1 ms accuracywas activated at the beginning of each stimulus, and the time thatelapsed from the beginning of each playback to the striking of aresponse key was recorded, thus giving reaction time (RT)measurements. Subjects were instructed to press one of the twocomputer keys as quickly as they could. The experiment was setup in such a way that the next stimulus was presented only after aresponse had been given.
The experiment was set up in a quiet research room at theUniversitat Pompeu Fabra. We obtained a total of 2,200 responses(11 auditory steps × 2 visual sequences × 5 blocks × 20 listeners).The experiment lasted approximately 8 minutes.
4.3.2. Results
Identification responsesThe graph in Figure 18 shows the mean “CEQ” identification rateas a function of video stimulus (solid black line = CFS video; solidgray line = CEQ video) and auditory stimulus (x-axis), for the 20subjects. The graph reveals that subjects mostly decided on theinterrogativity of the utterance by relying on the visual materials,as the CEQ video and the CFS video responses are clearly separatedin the graph (the CEQ video elicited from 56% to 96% of “CEQ”identification responses and the CFS video elicited from 3% to 45%“CEQ” identifications). Interestingly, there is also a clear effect ofthe auditory information but it is less robust: the preference foridentifications is stronger for congruent audio + visualcombinations (that is, a CEQ video combined with a CEQ pitchcontour obtains a 96% of “CEQ” responses, and a CFS video

73
combined with a CFS pitch contour obtains a 3% of “CEQ”responses). By contrast, most confusion arises in cases where theauditory cue is incongruent with the visual cue (that is, a CEQvideo with a CFS audio track, or a CFS video with CEQ audio track).In other words, the congruent stimuli reveal more accurateresponses than the incongruent ones. The clear congruity effectscan be interpreted as evidence for a bimodal integration process.
Figure 18. Mean “CEQ” identification rate as a function of video stimulus (solidblack line = CFS video; solid gray line = CEQ video) and auditory stimulus (x-axis), for the 20 listeners. Error bars show ± 1 Standard Error. In the x-axis,stimulus 1 is a CFS and stimulus 11 is a CEQ.
A two-factor ANOVA with a 2 × 11 design was carried out with thefollowing within-subjects independent factors: visual stimulus(two levels: CFS, CEQ) and audio stimulus (eleven levels: 11 steps inthe pitch range). The dependent variable was the proportion of“CEQ” responses. The data were first checked for the occurrence

74
of possible outliers on the basis of reaction time. Of a total of 2200datapoints, 193 cases were treated as outliers, i.e. those caseswhere the reaction times were at a distance of at least threestandard deviations from the overall mean. These cases wereexcluded from the analysis.
The analysis revealed a significant main effect of visualstimulus (F 1, 2007 = 1306.798, p < .001) and of auditory stimulus (F 10,
2007 = 31.119, p < .001) on statement/question identification. Theinteraction between the two factors was not significant (F 10, 2007 =1.059, p = .391), meaning that the effects of both factors areconsistent across factor groups. Thus we can observe a clearpreference for visual cues in the listener’s main decisions, but alsoa crucial effect of the auditory stimuli.
Reaction timesFigure 19 shows mean reaction times (in ms) as a function of videostimulus (solid black line = CFS video; solid gray line = CEQ video)and auditory stimulus (1 = CFS contour; 11 = CEQ contour), for the20 listeners. In general, mean RT patterns show that congruentaudiovisual stimuli differ significantly from incongruent ones inthat the latter trigger consistently slower reaction times. That is,when a CEQ-based visual stimulus occurred with a low-pitchedauditory stimulus, this triggered an important time delay in theresponse (mean RT: 786 ms). This is also the case when CFS-basedvisual stimuli occurred with high-pitch auditory stimuli (mean RT:722 ms). By contrast, congruent audio + visual combinationstriggered very fast responses, namely in the combinations of a CEQvideo with the highest peak (mean RT: 578 ms) and of a CFS videowith the lowest peak (mean RT: 545 ms).

75
Figure 19. Mean reaction times in ms as a function of video stimulus (solid blackline = CFS video; solid gray line = CEQ video) and auditory stimulus (1 = CFScontour; 11 = CEQ contour), for the 20 listeners.
To get a first insight into the patterns of the reaction times, weconducted a t-test which compared averages for congruent andincongruent stimuli. Thus, for this test, we combined the twoconditions for the extreme congruent stimuli (CFS video withauditory stimulus 1 & CEQ video with auditory stimulus 11) andpaired those with that for the most incongruent stimuli (CFS videowith auditory stimulus 11 & CEQ video with auditory stimulus 1).This t-test revealed that congruent stimuli differed significantlyfrom incongruent ones in that the latter yielded consistentlyslower reaction times (congruent: 670 ms; incongruent: 979 ms)(t183 = –3.619, p < .001).
A two-factor ANOVA was carried out on the results. Thedependent variable was reaction time measures. The within-subject independent variables were the visual stimulus (two levels:

76
CFS, CEQ) and the auditory stimuli (eleven steps in the pitchrange). The analysis revealed a clear effect of the visual factor forreaction times (F 1, 2173 = 6.362, p = .012), and no effect for theauditory stimuli (F 10, 2173 = .671, p = .752). The interaction betweenthe two factors was statistically significant (F 10, 2173 = 2.815, p =.002). Thus we clearly observe a preference for visual cues in thelistener’s main decisions, but also a crucial interaction betweenthe visual and auditory information.
4.4. Experiment 24.4.1. Methodology
Experiment 2 analyzed the identification of CFS and CEQ by meansof the same auditory continuum used in Experiment 1 but thistime in combination with a continuum of facial gestures producedusing a digital image-morphing technique. The goal of thisexperiment was to test whether the creation of intermediate stepsin facial gestures would affect the interpretation of the stimulusmaterials and how this gradient visual information would interactwith the processing of the auditory information.
MaterialsTo produce the target visual materials for Experiment 2, fourstatic images were extracted from the target recordings used inExperiment 1, namely the first one for the initial neutral facialgesture, the second at the beginning of the stressed syllable, thethird at the beginning of the post-tonic syllable and the last one atthe end of the utterance (see Figure 16 above, which illustrates thefirst, second and fourth moments in time for each gesturepattern). Then, a face morphing technique was applied to thesecond, third and fourth stills selected (since the first onerepresented a neutral facial gesture; see Figure 16) in order tocreate four intermediate videos in between the two original videoclips. The morphing was performed by means of Sothink SWF
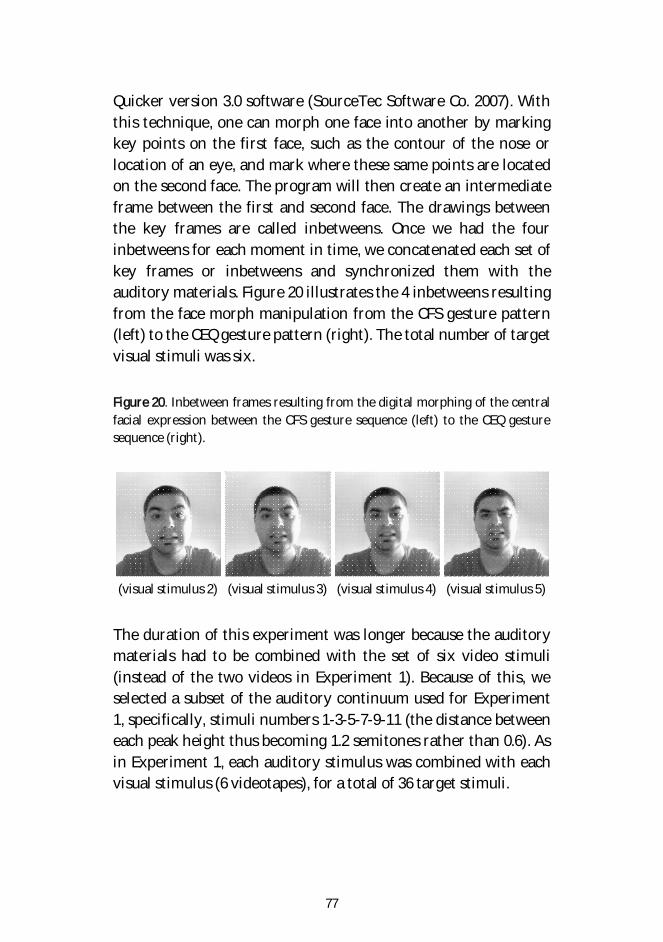
77
Quicker version 3.0 software (SourceTec Software Co. 2007). Withthis technique, one can morph one face into another by markingkey points on the first face, such as the contour of the nose orlocation of an eye, and mark where these same points are locatedon the second face. The program will then create an intermediateframe between the first and second face. The drawings betweenthe key frames are called inbetweens. Once we had the fourinbetweens for each moment in time, we concatenated each set ofkey frames or inbetweens and synchronized them with theauditory materials. Figure 20 illustrates the 4 inbetweens resultingfrom the face morph manipulation from the CFS gesture pattern(left) to the CEQ gesture pattern (right). The total number of targetvisual stimuli was six.
Figure 20. Inbetween frames resulting from the digital morphing of the centralfacial expression between the CFS gesture sequence (left) to the CEQ gesturesequence (right).
(visual stimulus 2) (visual stimulus 3) (visual stimulus 4) (visual stimulus 5)
The duration of this experiment was longer because the auditorymaterials had to be combined with the set of six video stimuli(instead of the two videos in Experiment 1). Because of this, weselected a subset of the auditory continuum used for Experiment1, specifically, stimuli numbers 1-3-5-7-9-11 (the distance betweeneach peak height thus becoming 1.2 semitones rather than 0.6). Asin Experiment 1, each auditory stimulus was combined with eachvisual stimulus (6 videotapes), for a total of 36 target stimuli.

78
ProcedureExperiment 2 consisted of 5 blocks in which all stimuli (36 in total)were presented to the subjects in a randomized order. Again, abrief training session was conducted prior to the task, in whichparticipants were shown two repetitions of the most congruentand incongruent audio + visual stimuli.
The conditions for Experiment 2 and the instructions forsubjects were the same as for Experiment 1, and the same group oftwenty native Catalan speakers participated. We obtained a totalof 3,600 responses (6 auditory steps × 6 visual sequences × 5 blocks× 20 listeners). The order of the two tasks was counterbalanced.The experiment lasted approximately 10 minutes.
4.4.2. Results
Identification responsesFigure 21 shows the mean “CEQ” identification rate as a functionof video stimulus (different types of lines, ranging from the solidblack line = CFS video to the solid gray line = CEQ video) andauditory stimulus (x-axis), for the 20 listeners. The graph reveals avery similar pattern of responses to that obtained in Experiment 1.First, it is clear that the visual materials were crucial in theparticipants’ decision on the interrogativity of the utterance, asagain the CEQ video responses and the CFS video responses areclearly separated in the graph (the CEQ video elicits from 58.2% to96% of “CEQ” responses while the CFS video elicits from 1% to47.5% of “CEQ” responses). Table 6 shows the mean “CEQ”identification rate for each visual stimulus (visual stimulus 1 = CFSvideo; visual stimulus 6 = CEQ video) when combined withauditory stimuli from both ends of the continuum, i.e. lowest pitchrange and highest pitch range.

79
Table 6. Mean ‘CEQ’ identification rates for each visual stimulus when combinedwith stimuli from each end of the auditory continuum in Experiment 2
lowest aud. stim. (CFS) highest aud. stim. (CEQ)
v1 (CFS) .010 .475
v2 .030 .515
v3 .050 .592
v4 .340 .888
v5 .536 .970
v6 (CEQ) .582 .960
Importantly, in all cases we obtain the same effect of the auditoryinformation as in Experiment 1: the preference for interrogativityis stronger for congruent audiovisual combinations (that is, a CEQvideo combined with a CEQ pitch contour obtains 96% of “CEQ”responses, and a CFS video combined with a CFS pitch contourobtains 1% of “CEQ” responses). By contrast, most confusion arisesin cases where the auditory cue is incongruent with the visual cue.
Interestingly, the tendency to rely on acoustic input is moredetectable when the ambiguity of the visual stimulus is moreextreme (see Table 6) as can be seen with visual stimulus 4. Thiselicits 88.8% of “CEQ” responses when the audio cue shows an F0contour with the highest peak (i.e. when the audio track is indeeda CEQ), and 34% of “CEQ” responses when the F0 contour has thelowest peak (i.e. the audio track is a CFS).
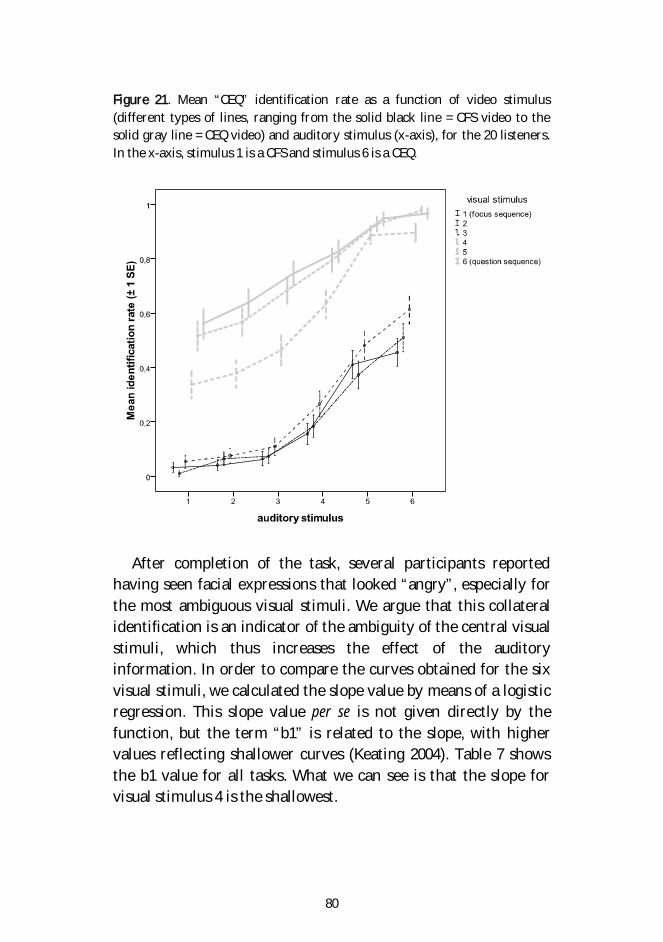
80
Figure 21. Mean “CEQ” identification rate as a function of video stimulus(different types of lines, ranging from the solid black line = CFS video to thesolid gray line = CEQ video) and auditory stimulus (x-axis), for the 20 listeners.In the x-axis, stimulus 1 is a CFS and stimulus 6 is a CEQ.
After completion of the task, several participants reportedhaving seen facial expressions that looked “angry”, especially forthe most ambiguous visual stimuli. We argue that this collateralidentification is an indicator of the ambiguity of the central visualstimuli, which thus increases the effect of the auditoryinformation. In order to compare the curves obtained for the sixvisual stimuli, we calculated the slope value by means of a logisticregression. This slope value per se is not given directly by thefunction, but the term “b1” is related to the slope, with highervalues reflecting shallower curves (Keating 2004). Table 7 showsthe b1 value for all tasks. What we can see is that the slope forvisual stimulus 4 is the shallowest.

81
Table 7. b1 values of the logistic regression applied to the six visual stimuliacross the six auditory stimuli.
v1 v2 v3 v4 v5 v6
b1 .482 .418 .489 .525 .472 .511
A two-factor ANOVA with a 6 × 6 design was carried out with thefollowing within-subjects independent factors: visual stimulus (sixlevels: 6 steps from CFS to CEQ) and audio stimulus (six levels: 6steps in the pitch range). The dependent variable was theproportion of “CEQ” responses. Again, the data were first checkedfor the occurrence of possible outliers on the basis of reactiontime. Of a total of 3600 datapoints, 280 cases were treated asoutliers.
Parallel to the results of Experiment 1, the analysis revealed aneffect of visual stimulus (F 5, 3404 = 289.617, p < .001) and an effect ofauditory stimulus (F 5, 3404 = 149.821, p < .001). However, theinteraction between the two factors was not significant (F 25, 3404 =1.391, p = .093).
Reaction timesFigure 22 shows the mean reaction times (in ms) as a function ofvideo stimulus (different types of lines, ranging from the solidblack line = CFS video to the solid gray line = CEQ video) andauditory stimulus (1 = CFS contour; 6 = CEQ contour), for the 20listeners. Mean RTs patterns show that congruent audiovisualstimuli differ significantly from incongruent ones in that the lattertrigger consistently slower reaction times. First, the visualsequences closer to the focus gesture pattern (1 and 2) show anincreasing function across the auditory stimuli; second, the visualsequences closer to the question gesture pattern (5 and 6) show a
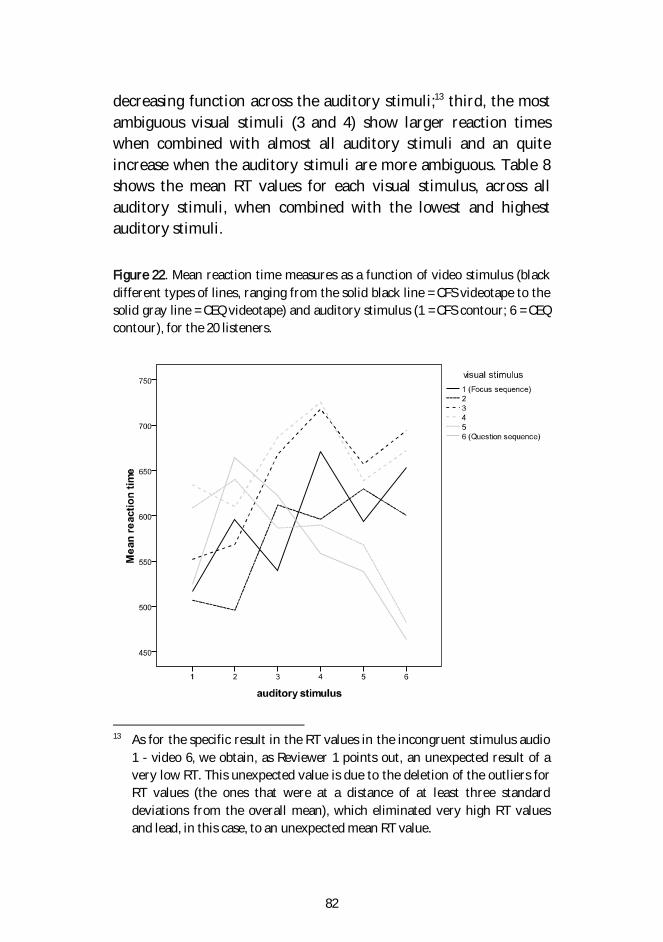
82
decreasing function across the auditory stimuli;13 third, the mostambiguous visual stimuli (3 and 4) show larger reaction timeswhen combined with almost all auditory stimuli and an quiteincrease when the auditory stimuli are more ambiguous. Table 8shows the mean RT values for each visual stimulus, across allauditory stimuli, when combined with the lowest and highestauditory stimuli.
Figure 22. Mean reaction time measures as a function of video stimulus (blackdifferent types of lines, ranging from the solid black line = CFS videotape to thesolid gray line = CEQ videotape) and auditory stimulus (1 = CFS contour; 6 = CEQcontour), for the 20 listeners.
13 As for the specific result in the RT values in the incongruent stimulus audio1 - video 6, we obtain, as Reviewer 1 points out, an unexpected result of avery low RT. This unexpected value is due to the deletion of the outliers forRT values (the ones that were at a distance of at least three standarddeviations from the overall mean), which eliminated very high RT valuesand lead, in this case, to an unexpected mean RT value.

83
Table 8. Mean RTs in ms for each visual stimulus (v1-6) across auditory stimuliwhen combined with auditory stimuli from each end of the continuum.
mean lowest aud. stim. (CFS) highest aud. stim. (CEQ)
v1 (CFS) 712 604 779
v2 687 575 743
v3 792 730 883
v4 900 853 925
v5 691 766 580
v6 (CEQ) 739 685 505
As with the results of Experiment 1, we conducted a t-test whichcompared averages for congruent and incongruent stimuli, thedifference being that in this case the auditory stimulusrepresenting the CEQ end of the continuum was stimulus 6(identical to stimulus 11 in Experiment 1). As in Experiment 1,again, this t-test revealed that congruent stimuli differedsignificantly from incongruent ones in that the latter yieldedconsistently slower reaction times (congruent: 591 ms;incongruent: 803 ms) (t(180) = –2.194, p = .029).
A two-factor ANOVA was carried out on the results with thedependent variable again reaction time. The within-subjectindependent variables were visual stimulus (six steps from CFS toCEQ) and audio stimulus (six levels this time, not eleven). Theanalysis again revealed a clear effect of the visual factor forreaction times (F 5, 3564 = 11.608, p = .012), and no effect for theauditory stimuli (F 25, 3564 = .730, p = .601). The interaction betweenthe two factors was again statistically significant (F 25, 3564 = 1.579, p= .034). Thus, we again observe a main effect of visual cues but alsoimportant interaction between the visual and auditory input.

84
4.5. Discussion
To what extent can gestural cues be crucial in encoding alinguistically relevant contrast such as the perception ofstatements and questions? This is a question that is still subject todebate among linguists and psycholinguists and has importantconsequences for models of multimodal language processing. Inthis chapter, we have explored the relative importance of pitchaccent contrasts and facial gestures in the perception of thecontrast between contrastive focus statements (CFS) and counter-expectational questions (CEQ) in Catalan, by using congruent andincongruent multimodal stimuli. Our general goal is to understandinteraction in the linguistic processing of audio and visual cuesduring speech perception.
This chapter has presented the results of two perceptual tasksthat investigated how Catalan listeners use pitch accentinformation and facial gestures in making this linguisticdistinction. Experiment 1 analyzed whether visual information is amore important cue than auditory information when a continuumof pitch range differences (the main acoustic cue to the distinctionbetween CFS and CEQ) co-occur with congruent and non-congruent facial gestures. Experiment 2 analyzed whether the roleof auditory information is stronger when visual information isparticularly ambiguous. In this case the visual stimuli werecreated by means of a digital image-morphing technique. Severalimportant conclusions can be drawn from the results of theseexperiments with regard to the perception of statement andquestion prosody.
First, in both experiments, the response frequencies given byCatalan listeners revealed a clear preference for giving priority tovisual cues when deciding between a CFS and CEQ interpretation.In both experiments, the listeners’ decisions were mainlydependent on whether the video component of the audio + visualmaterial they were watching show facial expressionscorresponding to a CFS or a CEQ. Thus the present results show

85
that CFS and CEQ can be discriminated predominantly from visualinformation, with auditory information (on the basis of an F0 pitchrange contrast) probably playing a secondary reinforcing role. Inthese experiments, the facial gesture acts as an integral part oflanguage comprehension and, as such, provides insight intofundamental aspects of prosodic interpretation.
A second result that is obtained in the two experiments (andwhich can be observed in Figures 20 and 22) is the effect ofbimodal audio + visual congruity. In both experiments, stimuliwere identified as a “CEQ” more quickly and more accuratelywhen CEQ-based visual stimuli occurred with a congruent audiostimulus (i.e. the upstepped pitch accent configuration L+¡H* L%).By contrast, identification became slower and less accurate (morechance-like) when the visual stimuli occurred with exemplars ofthe incongruent nuclear pitch configuration (i.e. L+H* L%). That is,when Catalan listeners saw a CEQ-based visual stimulus occurringwith an incongruent low-pitched auditory stimulus, an importanttime delay appeared in the response, and vice versa. Importantly,the strong effects of congruity/incongruity both in patterns ofresults and in reaction time measures represent a clear argumentin favor of the view that facial gestures and speech form a singleintegrated system.
Third, another important result refers to the enhancedimportance of acoustic stimuli when visual input is ambiguous.Attenuating the differences in the visual stimuli in Experiment 2triggered a stronger influence of the auditory signals. Concerningthe theories of speech perception, integration models predict thatboth auditory and visual information are used together in apattern recognition process. On the one hand, the weightedaveraging model of perception (WTAV; see Massaro 1998) predictsthat the sources are averaged according to weight assigned toeach modality. On the other hand, the fuzzy logical model ofperception (FLMP) predicts, moreover, that the influence of onemodality will be greater than the other when the latter is moreambiguous. According to the results of our Experiment 2, and in

86
line with the findings of Massaro and Cohen (1993), we argue thatthis model of speech perception accounts for the processing ofprosodic information better than competing models of perception(see also Srinivasan & Massaro 2003).
Our results showing a strong role for visual information in theperception of interrogativity seems to partially contradict theresults of a large number of studies in audiovisual prosody (e.g.Krahmer et al. 2002, Swerts & Krahmer 2004, Srinivasan & Massaro2003, House 2002, Dohen & Lœvenbruck 2009, and others). Webelieve that it is in fact surprising that previous literature onaudiovisual speech perception has not found more evidence of therole of visual information in linguistic interpretation. One possibleexplanation is that the use of real audiovisual recordings is betterthan the use of embodied conversational agents in avoiding theuncanny valley (the hypothesis in the field of robotics and 3Dcomputer animation which holds that when facsimiles of humanslook and act almost, but not perfectly, like actual humans, itcauses a response of revulsion among human observers; Mori1970, Prieto et al. 2011). Moreover, the claim that visual cuessimply provide redundant information seems to be at odds withthe famous McGurk audiovisual ‘illusion’ discovered by McGurkand MacDonald (1976). The basic McGurk effect found that anauditory [ba] stimulus combined with a visual [ga] stimulusresulted in a [da] percept. This effect is quite robust and has beenreplicated for many languages (see Burnham 1998, for anextensive review), thus suggesting that the brain tries to find themost likely stimulus given the conflicting auditory and visual cues,and that visual and auditory information are fused rather than thevisual information being superimposed on the auditory one (seealso MacDonald & McGurk 1978).
Virtually all studies that have found a complementary effect ofvisual cues have dealt with the perception of prominence or focus.Yet the studies that have focused on the role of facial expressionsas salient indicators of the individual’s emotional state (such asincredulity, counter-expectation or surprise in echo questions,

87
degree of uncertainty, etc.) have found a very strong effect ofthese cues. For example, the studies by Dijkstra et al. (2006),Swerts and Krahmer (2005), and Mehrabian and Ferris (1967),found that visual information is far more influential than acousticinformation. Dijkstra et al. (2006) dealt with speakers’ signs ofuncertainty about the correctness of their answer and showedthat facial expressions were the key factor in perception.Similarly, Swerts and Krahmer (2005) showed that there are clearvisual cues for a speaker’s uncertainty and that listeners are bettercapable of estimate another person’s uncertainty on the basis ofcombined auditory and visual information than on the basis ofauditory information alone.
Nevertheless, Srinivasan and Massaro (2003) showed thatstatements and echoic questions were discriminated auditorilyand visually, but they also found a much larger influence ofauditory cues than visual cues in these judgments. We argue thatthe discrepancies between our results and theirs might be relatedto the audiovisual materials used. First, their visual materials werebased on a synthetic talking head. The question face wascharacterized by a significant eyebrow raise and head tilt whichextended dynamically across the length of the utterance. Yet it iswell known that the eyebrow raise can also mark focalizedconstituents in statements, thus rendering the visual cuesambiguous between a question interpretation and a focusstatement interpretation. Second, their auditory materials weremanipulated on the basis of the F0 contour, amplitude andduration. Crucially, their difference in F0 contour impliedchanging a larger structure of nuclear and prenuclear tonalconfigurations (e.g. We owe you a yo-yo / Pat cooked Pete’s breakfast /We will weigh you / Chuck caught two cats), leading to largemodifications in the F0 stimulation, whereas our F0 changes werelimited to changes in the pitch range of a single tonal target thatalways created a rising-falling intonation sequence. Listenersmight have paid more attention to the sentential intonationcontour than to the facial cues. As the authors themselves point

88
out, “to assess whether the extended length of the sentence wasresponsible for nonoptimal integration, a shorter test stimulus(e.g.: “Sunny. / Sunny?”) might be used. A short utterance mightmake statement / question identification a more automaticperceptual task, and less of a cognitive decision-making process.This task might engage an optimal bimodal integration process.”(Srinivasan & Massaro 2003:20)
Summarizing, our results provide clear evidence for theimportance of visual cues in the perception of linguistic contrasts(in our case, the perception of statements and questions) and openthe way to new investigations in this area. One of the researchquestions is the relevance of potential facial cues and theircontributions to the judgments of statements and questions. Wehave also tested this question by using computer-generated 3Dtalking heads to simulate face gestures during speech production(Borràs-Comes et al. 2011). In that study, the visual stimuli areimplemented in a computer-generated 3D avatar in which eachintended facial gesture — in that case, eyebrow furrowing, eyelidclosure, and head movement — is manipulated separately andappears on a continuum of four levels of strength.
89
CHAPTER 5
Audiovisual correlates of interrogativity: acrosslinguistic study
5.1. Introduction
The world’s languages have different grammatical means to markan utterance as a yes-no question (e.g., Are you hungry?, Does theshop open on Saturday?), including the use of different lexical itemsor morphemes, changes in the syntactic structure, or prosodic andgestural marking. While declaratives are considered to be theunmarked sentence type, primarily used to convey informationwith no special illocutionary force markers (Levinson 2010: 2742),questions are primarily used to seek information.
Crosslinguistically, morphosyntactic features have been shownto constitute a common way to identify yes-no questions. Amongthese strategies, we find the presence of question particles (est-ceque in French, [li] in Russian), the presence of interrogativeclitics (ne in Latin, [ka] in Korean), a specific interrogative wordorder (as in most Germanic languages), or a combination of suchstrategies. As Dryer (2008) states, most languages using thesemorphosyntactic strategies also employ a distinct intonationpattern, though some do not (e.g., Imbabura Quechua, spoken inEcuador).
Prosody is also a very common resource to signal yes-noquestions across languages. It can be used to assign question statusto a declarative-formatted sentence (Stivers & Rossano 2010 forItalian), even in those languages that use morphosyntacticstrategies (as happens with the so-called declarative questions,which are those sentences that maintain the typical word order ofa declarative sentence but have been produced with a specificinterrogative intonation contour; see Englert 2010 for Dutch).

90
Bolinger (1986) argued that the presence of high pitch in questionsmay even be considered a linguistic universal (i.e., the fact thatthe average pitch in questions tends to be higher than the averagepitch in non-questions). Moreover, Cruttenden (1981) suggestedthat the universal dichotomy between falling and rising tunes maybe associated with the abstract notions of closed (for falls) vs. openstatus (for rises). However, some recent descriptive studies likeEnglert’s (2010) have pointed out that this prosodic feature is notexclusively tied to interrogativity but is also a common device forsignaling continuation in statements or, at the level of discourse,both turn-giving and turn-keeping. In contrast with Bolinger’sclaim mentioned above, Rialland’s (2007) analysis of 78 CentralAfrican languages showed that question prosodies without anyhigh-pitched correlates are widespread and include fallingintonations or low tones, lengthening, breathy termination, andopen vowels.
Though the analysis of morphosyntactic and prosodic markersof yes-no questions has received considerable attention in thelinguistics literature, less is known about the relevance ofnonverbal cues. Nonetheless, various studies in the last threedecades have taken into account the potential importance of eyegaze and certain facial and manual gestures. In fact, backchannelsignals like facial expressions, head movements and gaze, seem tobe critically linked to listeners’ attention, perception, andcomprehension (Peters et al. 2005, Lysander & Horton 2012).Argyle and Cook (1976) argued that gaze serves three mainpurposes during face-to-face communication: seekinginformation, receiving signals that accompany the speech, andcontrolling the flow of the conversation. Cosnier’s (1991) study ofFrench spontaneous speech revealed that the gestural traits thatcharacterize information-seeking questions are those thatnormally accompany informative verbal expressions, namely, eyegaze to the interlocutor, head elevation, an optional suspendedhand gesture facing the interlocutor, and a variety of facialexpressions which are then frozen while the speaker awaits a

91
response. Cosnier in fact argued that gaze is as important asintonation and pauses for question marking and turn-taking. AsVilhjálmsson pointed out (1997: 21-22), since the primary functionof the eyes is to gather sensory input, the most obvious function ofgaze is perhaps information-seeking, since the speaker will at leastlook at the listener when feedback is expected.
Eyebrow movements have also been associated withquestioning, though the results appear to be somewhatinconclusive. For instance, Srinivasan and Massaro (2003) madeuse of “talking heads” (synthetic representations of a human face)in which they varied specific auditory and visual characteristics toinvestigate whether these could differentiate statements fromdeclarative questions in English. They found that both eyebrowraising and head tilting could increase the perceivers’ detection ofa question, though participants tended to rely more on auditorycues. However, Flecha-García’s (2010) analysis of Englishspontaneous speech materials found that speakers do not useeyebrow raises in questions more often than in other types ofutterances. Yet, incidentally, she also suggested that eyebrowraises may add a questioning meaning to any utterance —somewhat like adding a tag question at the end — even if theutterance does not express a question or request, whetherverbally or prosodically (Flecha-Garcia 2010: 553).
In line with this crosslinguistic variation, recent studies preferto look at question marking as the set of features that contributeto response mobilization (Stivers & Rossano 2010: 29, Haan 2002).Stivers and Rossano (2010) found for both English and Italian thatno single feature is present in all cases and thus conclude that nosuch feature appears to be intrinsic to the action of requestinginformation (2010: 8). They state that if an assessment isaccompanied by several response-mobilizing features, thisincreases the response relevance of the action (2010: 28). From acrosslinguistic point of view, even though speakers of differentlanguages rely on different question marking correlates, the sameresponse-mobilizing resources — gaze, lexico-morphosyntax,

92
prosody, as well as contextual epistemic asymmetry — seem to beavailable across languages, ethnicities, and cultures (Stivers &Rossano 2010: 29). In general, Rossano (2010) observed a trade-offrelationship between mobilizing cues, and observed that Italianspeakers tend to look more often at recipients when thoseutterances do not have a clear intonational marking. In addition,he found that speakers looked more at recipients during yes-noquestions and alternative questions than during wh– questions,which can also be linked to the fact that the latter show a greateruse of interrogative verbal cues than the other two types ofquestions (i.e., wh- words). Moreover, Levinson (2010, see alsoStivers 2010) has shown that pragmatic inference is acrosslinguistic cue for interrogativity detection and can evenrepresent the main question marker in a language (Levinson 2010,for Yélî Dnye). If the speaker makes a statement about anything ofwhich the recipient has greater knowledge, this routinely attractsthe recipient’s response (Labov & Fanshel 1977, Pomerantz 1980).
To our knowledge, no controlled experimental studies havebeen undertaken to explore what role verbal and nonverbal cuesplay in the production and perception of questions and whetherthere exists a trade-off relationship between different mobilizingcorrelates. To date, the majority of descriptions have been basedon the analysis of controlled or natural corpora, and someperception studies have assessed the audiovisual identification of‘biased’ questions (i.e., those conveying, for instance, counter-expectation, incredulity, or surprise), most of them by means ofsynthetic materials (House 2002, Srinivasan & Massaro 2003,Borràs-Comes et al. 2011, Crespo-Sendra 2011, see also Chapter 4).There are still a number of open questions that have not receiveda complete answer, such as: Can we differentiate an information-seeking yes-no question from a broad focus statement by means ofvisual information alone? How does visual information contributeto question identification when added to auditory information?Does the simultaneous use of several questioning cues increase theperceiver’s identification of an utterance as a question? Do

93
nonverbal cues have a major role in those languages in whichintonation and syntactic cues do not play a defining role?
The present chapter aims to compare interrogativity-markingstrategies in Dutch and Catalan, two European languages that havebeen argued to rely on different resources for this distinction. Onethe one hand, Dutch yes-no interrogatives are characterized bysubject/verb inversion, without making use of an auxiliary verb asis the case in English (Dut. Heb je een man?, lit. ‘Have you a man?’,‘Do you have a man?’; Englert 2010: 2668). By contrast,subject/verb inversion is not available for yes-no questionsmarking in Catalan (Cat. *Té ell bigoti?, lit. ‘Has he moustache?’),and grammatical subjects are generally not produced whenrelated to a known referent (Cat. Té bigoti?, lit. ‘Has moustache?’,‘Does he have a moustache?’) or appear dislocated to a postfocalposition (Cat. Té bigoti, ell?, lit. ‘Has moustache, he?’) both instatements and questions. In terms of prosody, speakers of Dutchappear to draw on the overall set of phonological devices of theirlanguage for question-marking, though certain configurations aremore likely to occur in questions than in statements, as happenswith rising tunes (Haan 2002: 214). By contrast, in order to conveyinformation-seeking yes-no questions most Catalan dialects havebeen claimed to use a specific intonational contour which consistsof a low pitch accent followed by a rising boundary tone (Prieto &Rigau 2007).14 Drawing on Rossano’s (2010) hypothesis, we expectthat the use of prosodic and gestural cues by speakers of Catalanwill be more productive than the use of such cues by speakers ofDutch, since the latter language uses an additional syntacticstrategy to mark questions (see also Geluykens 1988).
This chapter has two related goals. First, we aim to describe thecombination of syntactic, prosodic, and gestural cues used by
14 Catalan can also mark interrogativity through the expletive particle que (cf.est-ce que in French and é que in Portuguese), which is especially found forCentral, Balearic, and North-western Catalan in confirmation-seekingquestions (Prieto & Rigau 2007).

94
Dutch and Catalan speakers for the marking of information focusstatements (IFS) and information-seeking yes-no questions (ISQ).In order to collect a series of IFS and ISQ for our perceptionexperiment, we conducted a production task using two variants ofthe Guess Who game. As Ahmad et al. (2011) point out, the dynamicnature of games make them a good tool for investigating humancommunication in different experimental setups, especially if theoutcome of a game is controllable in a systematic manner.
The second goal of the chapter is to test whether and howlisteners of the two languages differentiate (ISQ) questions from(IFS) statements, as well as to evaluate the relative importance ofthe different cues used in production and perception. A randomset of the stimuli obtained by means of the production task wastherefore used as stimulus materials for a test in whichparticipants had to guess whether an utterance was a statement ora question. Participants were presented with materials in threeperceptual conditions: one in which only the auditory informationwas available (AO), another one in which only the visualinformation was available (VO), and a third one which presentedsimultaneously the full auditory and visual information of theactual recordings (AV). This identification test allowed us to assessthe relevance of the various features and their potentialinteraction effects.
5.2. Experiment 15.2.1. Methodology
In order to obtain a set of natural productions of statements andquestions in Dutch and Catalan, we designed a production taskbased on two variants of the Guess Who game which would allow usto observe which prosodic cues are used by people when givinginstructions or asking yes-no questions. Especially, we areinterested in their perceptual importance when another group of

95
native listeners have to judge the specific materials in terms ofwhether they are statements or questions.
ParticipantsSixteen Dutch speakers and sixteen Central Catalan speakersparticipated in the production task. Participants played the gamein pairs, taking turns in adopting the roles of participant A and Bin the two procedures described below. Participants only playedthe game with other native speakers of their own language. Allsubjects were undergraduates at either the Tilburg University, TheNetherlands, or the Universitat Pompeu Fabra in Barcelona, Spain.All participants played both variants of the game.
ProcedureIn order to elicit IFS and ISQ in a natural manner, we used twodigital variants of the “Guess Who” board game as created bySuleman Shahid, from Tilburg University, and some colleagues(see Ahmad et al. 2011). In this game, participants were presentedwith a board containing 24 colored drawings of human faces (seean example in Figure 23). These faces differed regarding variousparameters, such as gender or color of their skin, hair, and eyes.Some faces were bald, some had beards or moustaches, and somewere wearing hats, glasses, or earrings. In the traditional versionof “Guess Who”, the purpose of the game is to try to guess theopponent’s mystery person before s/he guesses yours.15
15 This experimental setup provides a clear advantage over real situations. AsRichardson et al. (2009) state, a question typically implies turn transition,and several studies have shown that gaze is related with turn-giving(Kendon 1967, Kendon 1990, Argyle & Cook 1976, Duncan & Fiske 1977).Moreover, Englert (2010) has shown for Dutch that questioners relyoverwhelmingly on speaker gaze (90%) for next speaker selection. Thus, inorder to describe the nonverbal patterns that characterize questions onehas to focus on those cases in which gaze plays no addressee-selection role,and this is controlled in our study since participants are engaged in dyadicsituations.

96
Figure 23. Example of the screen image used in the game procedure. At the left,the mystery person of our opponent is shown (top) and buttons for starting anew game or quitting it (middle). The 24 faces make up the main game panel.
Given our need to elicit either information focus statements orinformation-seeking questions, we asked participants to play oneof two different variations of the game. In the question-elicitationvariation, participant A had to ask Participant B questions to try todetermine the mystery person on B’s face card. Players took turnsasking questions about the physical features of their respective“mystery persons” in an effort to eliminate the wrong candidates.The winner is the player who guesses his/her mystery personfirst. In the statement-elicitation variation of the game, participantstake turns making statements about their mystery person, whilethe other player listens and eliminates all characters that do notexhibit a particular physical feature. Again, it is the player who
TimerSoundOn/Off
New
Quit
Change Deck
Change Theme

97
guesses the identity of their “mystery person” first that wins.16
Note that both participants within a pair took turns in the courseof both variations of the game and therefore both providedexamples of questions and statements. Prototypical dialogs ofthese two procedures are shown in (5); target sentences appear inboldface.
(5) a. Question-elicitation procedure(A looks at his/her board and thinks of a question that may be useful forhim/her to narrow down the number of candidates for “mystery person”)
A: Does your mystery person have brown eyes?(B checks for this feature on his/her mystery person)
B: Yes.(A unchecks all the faces on his/her screen that do not have brown eyes. Nowit is B’s turn to ask a question)
b. Statement-elicitation procedure(A thinks of a physical feature that will help participant B eliminate somecandidates)
A: He has brown eyes.(B unchecks all the faces on his/her screen that do not have brown eyes. ThenB tries to guess who the mystery person is)
B: Could it be Bob?(A checks to see if the mystery person is called Bob)
A: No.(Now it is B’s turn to describe a feature of his/her own mystery person for A)
Participants sat in the same room, facing each other across a tableand in front of two laptop computers arranged so that they couldnot see each other’s screen. Two camcorders were placed in such away that they could record the upper part of each participant’s
16 In order to increase the number of interactions and communication flowbetween participants — and to avoid continuation rises in the intonationpatterns they produced — we added an additional rule to the game: at theend of each turn, players had to try to guess the mystery person’s name.This additional set of questions was not subjected to analysis.

98
body (see Figures 24 and 25). Before the start of each experiment,the camera was raised or lowered according to the participant’sheight. Once the participants were seated, the experimenter gavespoken instructions, telling the participants about the game andprocedure to be followed for each variation. Each game lastedapproximately twenty minutes, the time it took for both variantsof the game to be played and won (4 to 6 times each).
Figure 24. Schematic (birdseye) drawing of the experimental set up.
Figure 25. Stills depicting one of the Dutch-speaking participant’s videorecordings while uttering a statement (left) and a question (right).
Analysis

99
From the production recordings, 35 statements and 35 questionsrelated to gender (e.g., It is a man vs. Is it a man?) were randomlyselected for each language in order to be included in thesubsequent rating task. One participant from each language groupinvolved in the production experiment did not produce any ofthese utterances, so the final set of materials came from 15 Dutchspeakers and 15 Central Catalan speakers. Whenever available, weguaranteed that each speaker provided a similar number ofstatements and questions.
With the aim of assessing the discrimination power of prosodicand gestural cues, the first two authors of the original article —native speakers of Catalan and Dutch, respectively, but with someknowledge of each other’s language — independently coded theselected audiovisual materials (a total of 70 utterances) in terms ofthe following cues (based on Cosnier 1991):
- order of the sentence constituents (SV, VS, V)
- intonation (falling or rising boundary tone; i.e., L% vs. H%)
- gaze to interlocutor (presence, absence)
- eyebrow raising movement (presence, absence)The inter-transcriber agreement between the two labelers’
coding was quantified by means of the Cohen’s kappa coefficient(Cohen 1960), which gave an overall coefficient of .838, whichmeans that the strength of the agreement was very good (Landis &Koch 1977). The coefficient was .855 for Dutch and .822 for Catalan.Concerning the different cues, it was .721 for the boundarycontour, .914 for gaze, and .701 for eyebrow raising.
5.2.2. Results
Table 9 presents the results of the presence of cues found in thedatabase. Regarding syntax, the subject was omitted in all Catalansentences, which only displayed the verb and predicate (Cat. Ésuna dona, lit. ‘Is a woman’, ‘It is a woman’). In turn, all Dutchstatements presented a SV order (Dut. ‘t is een vrouw, ‘It is a

100
woman’) and all Dutch questions presented a VS order (Dut. is 'teen vrouw?, ‘Is it a woman?’). In terms of intonation, the samepattern of results was attained for statements in the twolanguages, showing a great number of falling tones (mostly L* L%and some H* L%).17 Rising tones (L* H%) were found more often inDutch questions than in Dutch statements (though Dutchquestions exhibited a larger number of falling tones than risingtones; see Geluykens 1988). In turn, Catalan showed a clearmajority of questions produced with a rising tone (L* H%, as in thecase of Dutch).
Concerning the two visual cues labeled (presence of gaze,eyebrow raising), the two languages showed similar distributionsof their uses in statements and questions. Crucially, the presenceof gaze and eyebrow raising were found to be more present inquestions. Overall, Catalan speakers also seem to use more non-syntactic cues than Dutch speakers.
Table 9. Number of utterances containing the four labeled cues, for eachmeaning, in Dutch and Catalan.
Dutch Catalan
statements questions statements questions
VS order 0 35 0 0
rising intonation 4 13 4 33
eye gaze 9 21 12 24
eyebrow raising 5 9 6 16
17 Please note that, although a broad ToBI analysis was applied for analyzingDutch intonation and it has properly accounted for the variation observed inthe present study, a language-specific system for transcribing Dutchintonation has been proposed in the literature, namely ToDI (Gussenhovenin press). ToDI parallels our broad ToBI analysis by showing a distinctionbetween L% and H% IP-final tones, which can be specified or not. Moreover,the falling patterns observed in our study can be transcribed as H*L L% andthe rising patterns as L*H H%.

101

102
5.3. Experiment 2
5.3.1. Methodology
ParticipantsIn the perception experiment, twenty Dutch listeners (between 18and 35, average = 24.6, standard deviation = 3.82) and twentyCatalan listeners (between 18 and 25, average = 22.1, standarddeviation = 1.80) rated the selection of 70 stimuli in their own L1 asbeing statements or questions. As the stimuli were excerpts fromrecordings made during the first experiment. None of theparticipants in the first experiment took part in the second one.
MaterialsA selection 35 statements and 35 questions related to gender (e.g.,It is a man vs. Is it a man?), for each language, randomly selectedfrom the production recordings.
ProcedureThe target 70 stimuli were presented to each group of same-language participants in three different conditions in a within-subjects design: Auditory-Only (AO), Visual-Only (VO), andAudioVisual (AV). In order to control for a possible learning effect,the AV condition was always the last to be presented to theparticipants, and the order of the two unimodal conditions wascounterbalanced among subjects. Inside each condition, thedifferent sentences were presented in a randomized order.
Stimuli were presented to subjects using a desktop computerequipped with headphones. Subjects were instructed to payattention to the stimuli and decide which interpretation was morelikely for each stimulus by pressing the corresponding computerkey for statement and question: ‘A’/‘P’ (afirmació, pregunta) forCatalan, and ‘S’/‘V’ (stelling, vraag) for Dutch. No feedback wasgiven on the “correctness” of their responses. Participants couldtake as much time as they wanted to make a decision, but could

103
not return to an earlier stimulus once they had made a decision onit.
The experiment was set up by means of E-Prime version 2.0(Psychology Software Tools Inc. 2009), which allowed us to recordresponses automatically. A new stimulus was presented only aftera response to the previous one had been given. The experimentwas set up in a quiet research room at either Tilburg Universityand or the Universitat Pompeu Fabra, respectively. It lastedapproximately 17 minutes. The total number of responsesobtained was 8,400 (70 stimuli × 20 subjects × 3 conditions × 2languages).
5.3.2. Results
General perception resultsFigure 26 shows the mean correct identification rates of theperception experiment broken down by language (Dutch, Catalan),condition (AO, VO, AV), and meaning (statement, question). Theresults in the graph show that participants in both languages wereable to identify the two categories above chance level in all threepresentation conditions. However, materials that includedauditory information (i.e., VO and AV) were consistently morereliable conveyors of question identification.
A Generalized Linear Mixed Model (GLMM) analysis was runwith the correct identification of the utterance category as thedependent variable, with language, condition, meaning, and allthe possible interactions as fixed factors and subject anditem(speaker) as random factors. Main effects for language (F 1, 155 =6.578, p = .011) and condition (F 2, 8388 = 417.403, p < .001) were found,but not for meaning (F 1, 152 = 0.462, p = .498). Two interactions werealso found to be significant: language × condition (F 2, 8388 = 21.504, p< .001) and condition × meaning (F 2, 8388 = 33.481, p < .001).

104
Figure 26. Mean correct identification rate (y-axis) as a function of languagegroup (Dutch, Catalan), condition (different bars: VO, AO, AV), and intendedmeaning (x-axis: statement, question).
Bonferroni post-hoc tests were extracted in order to know thedirection of the significant main effects and interactions. Theyshow an effect of condition such that AV > AO > VO (all pairedcomparisons, p < .001). Concerning the interaction language ×condition, Dutch participants were more accurate than Catalanparticipants only when auditory information was available: AO (p =.002) and AV (p < .001), and not in VO (p = .529). Concerning theinteraction condition × meaning, statements were more accuratelyidentified than questions only when visual information wasavailable: VO (p = .001) and AV (p = .006), and not in the AOcondition (p = .128).
In sum, the perception results shown here reveal thatparticipants could identify questions and statements above chance
105
level in all conditions. Specifically, participants’ responses werebetter when auditory information was present, but a beneficialeffect of visual cues was also shown when they were added to theauditory ones. In addition, Dutch participants’ perception ofauditory materials was found to be better than that of Catalanparticipants, with less of a difference between language groupswhen they were presented with VO materials, which allows us tohypothesize that language differences were most pronouncedwhen the auditory components of the experiment materials wereinvolved. Importantly, our results show that when visualinformation is present, statements are better identified thanquestions. These questions are further investigated in the nextsection, where we analyze the materials in terms of their specificauditory and visual features.
Unimodal perception of auditory and visual featuresThe lack of syntactic marking in Catalan (i.e., zero degrees offreedom) makes it impossible for us to compute the interactions inwhich language and syntax are implied.18 As for the perception ofthese intonation differences, a GLMM analysis was conducted onthe results of the AO task, with identification as the dependentvariable, language, contour, and their interaction as fixed effects,and subject and speaker as random factors. There were maineffects for language (F 1, 26 = 11.665, p = .002), contour (F 1, 2796 =601.409, p < .001), and their interaction (F 1, 2796 = 79.249, p < .001).
18 In order to know the effect of both syntax and intonation within Dutch, alanguage-specific GLMM analysis of the AO task was performed, withIDENTIFICATION as the dependent variable, SYNTAX, CONTOUR, and theirinteraction as fixed effects, and SUBJECT and SPEAKER as random factors. Allfactors were significant: SYNTAX (F 1, 107 = 331.192, p < .001), CONTOUR (F 1, 32 =16.989, p < .001), and their interaction (F 1, 59 = 6.087, p = .017). Bonferronipaired contrasts crucially showed that the interaction SYNTAX × CONTOUR wasrelated to the fact that a rising contours caused more questionidentifications when applied to a SV structure (p < .001), but not whenapplied to a VS structure (p = .180).

106
The significant interaction is due to the fact that Catalan listenersrated more falling contours as statements than Dutch listeners (p <.001) but this difference does not hold for rising contours (p =.328), suggesting that rising contours are perceived equally oftenas question-conveyors for both language groups. This is consistentwith the patterns found in production.
Another GLMM analysis was conducted on the results of the VOtask, with identification as the dependent variable, and subjectand speaker as random factors. The fixed effects were language,gaze, eyebrow, and all the possible interactions. Main effects werefound for gaze (F 1, 2080 = 283.044, p < .001), eyebrow (F 1, 2792 = 21.042,p = .004) and language (F 1, 37 = 8.879, p = .005). Two interactionswere also found to be significant: gaze × eyebrow (F 1, 2792 = 16.094, p< .001), and the triple interaction gaze × eyebrow × language (F 1, 2792
= 4.425, p = .035). The main effects of gaze and eyebrow are relatedto the patterns observed in production, i.e., that the presence ofthese cues increased ‘question’ responses. The main effect oflanguage suggests that Dutch participants gave overall more‘question’ responses than Catalan participants. As for the gaze ×eyebrow interaction, eyebrow had a significant effect on ‘question’identification when in the presence of gaze (p < .001), but not in itsabsence (p = .678). Regarding the triple interaction, a languagedifference is found, such that Dutch participants provided more‘question’ responses than Catalan participants when gaze (p = .003)and eyebrow (p = .006) appeared alone in the perceived materials,but not when these features co-appeared (p = .331) or were bothabsent (p = .058).
Auditory and visual features combinedA main question related to cue interaction is whether the presenceof different cues related to questioning can significantly increasethe detection of questions. To this end we created a new column inour results database that contained the sum of the different cuesto questioning found in both languages (i.e., VS syntax, risingintonation contour, presence of gaze, and eyebrow raising). The

107
graph in Figure 27 shows that the incremental presence of cues toquestioning does increase participants’ ‘question’ responses inboth languages.
Figure 27. Mean identification as ‘question’ (y-axis) of the materials in theperception experiment divided by the number of interrogative cues that theycontain, in both Dutch (i.e., VS + rise + gaze + eyebrow) and Catalan (i.e., rise+gaze + eyebrow).
A Pearson correlation (2-tailed) was conducted between thenumber of interrogative cues and the identification responses. Thetest identified a positive correlation of .736 in the case of Dutchand a correlation of .709 in the case of Catalan (in both cases, p <.001), which means that there is a high correlation of the twovariables in each language.

108
5.4. Discussion
The first goal of the present chapter was to describe the syntactic,prosodic, and gestural strategies used by Dutch and Catalanspeakers for marking information-seeking yes-no questions (ISQ)and information focus statements (IFS). These two languages havebeen argued to mark interrogativity in two different ways.Whereas Dutch yes-no questions are characterized by the use of asyntactic verb fronting strategy and optional intonational marks(e.g., Hij heeft een baard vs. Heeft hij een baard?, lit. ‘He has a beard’vs. ‘Has he a beard?’), Catalan yes-no questions do not allow SVinversion and the main strategy in this language is the use ofspecific intonational patterns (e.g., Té barba vs. Té barba?, lit. ‘Hasbeard’ vs. ‘Has beard?’). On the one hand, the fact that Dutchindeed has a systematic syntactic strategy as described in theliterature was confirmed by the results of our production task. Asfor prosody, both languages showed a great number of rising tonesin questions, though Catalan (because of the lack of any lexico-morphosyntactic distinction in our target sentences) showed astronger effect of intonation for interrogativity marking.Concerning gestures, both languages showed similar distributionsof the use of gaze and eyebrow raisings, which were mainly foundin questions.
The second and main goal of this investigation was to testwhether listeners of the two languages could differentiatequestions from statements in the different presentationconditions (AO, VO, AV), as well as to evaluate the relevance of thedifferent cues used in perception. The results of our perceptionexperiment with 20 Dutch listeners and 20 Catalan listenersconfirmed that participants can identify questions and statementsabove chance level in all conditions. Importantly, perceiversshowed a great reliance on auditory information, but also showedthat (a) visual-only utterances were classified above chance; and(b) better accuracy in responses was exhibited when visualinformation was added to auditory information. This result

109
confirms the importance of nonverbal cues in speakers’identification of pragmatic intentions but also suggests a higherimportance of auditory cues in the perception of interrogativity.
Focusing on the auditory-only perception, Dutch participantswere found to be more accurate than Catalan participants, whichcan be linked to the fact that Dutch uses an unambiguous syntacticstrategy. With respect to the perceptual importance of syntax andintonation in Dutch, an analysis of the Dutch listeners’ perceptionof AO information revealed that both factors were significant.Moreover, there was an interaction between the two, in the sensethat rising contours led to more ‘question’ identification responsesonly when applied to an unmarked (SV) syntactic structure. Thisdemonstrates that when both markings are available syntax hasgreater importance relative to intonation.
When focusing on the visual-only perception, gaze played anespecially strong role in ‘question’ identification responses in bothlanguages. This is in line with Rossano’s (2010) production resultsfor Italian, which showed that the occurrence of speaker gazetowards the recipient in dyadic interactions increases thelikelihood of obtaining a response. As for eyebrow raising, asecondary role was found such that it powered ‘question’responses only when in the presence of gaze.
More crucially, in the AV presentation, we found a positivecorrelation between the concentration of mobilizing cues in asentence and its rating as an interrogative utterance, for bothlanguages. This result is especially relevant for the theory ofresponse relevance put forward by Stivers and Rossano (2010).While suggesting four main response-mobilizing features —namely interrogative lexico-morphosyntax, interrogative prosody,recipient-directed speaker gaze, and recipient-tilted epistemicasymmetry — they argue that the inclusion of multiple response-mobilizing features leads to higher response relevance than theinclusion of fewer or no features. In their own words, “a request(or an offer or information request) is high in response relevance,but a request designed ‘directly’ (e.g., with interrogative

110
morphosyntax and/or prosody) would be still higher. Similarly, anassessment (or a noticing or announcement) would be low inresponse relevance. However, if it were designed with multipleresponse-mobilizing features, this would increase the responserelevance of the action” (Stivers & Rossano 2010: 27–28). In ourdata, a higher concentration of lexico-morphosyntactic, prosodic,and gestural cues increases the chances that utterances will beperceived as questions.
To our knowledge, the present chapter provides the firstresults of a controlled investigation on the crosslinguisticperception of information-seeking yes-no questions comparedwith broad focus statements. First, we have found that auditoryinformation has a greater effect in question identification(auditory cues > visual cues). As for visual cues, we haveempirically shown that both auditory and visual cues play a role inthis distinction in both Catalan and Dutch. Specifically, theaddition of non-verbal cues to auditory cues enhances theperception of information-seeking questions. Also, a visual-onlypresentation of the materials led to successful interrogativitydetection. In terms of its perceptual relevance, a greater effect wasfound for gaze compared to eyebrow raising. This pattern ofresults suggests, at least when taking into account Dutch andCatalan data, a cue value scale for interrogativity marking suchthat syntax > intonation > gaze > eyebrow. In conclusion, thischapter shows how several verbal and nonverbal cues aresystematically used in the production of interrogativity and howthey crucially interact in its perception.

111
CHAPTER 6
General discussion and conclusions
6.1. The phonological status of pitch range
One of the main goals of this thesis was to describe the role ofpitch range in conveying interrogativity. In Catalan, the samesequence of low and high tones in a nuclear pitch configurationcan express three different pragmatic meanings depending on itspitch range properties: information focus statement (IFS),contrastive focus statement (CFS), and counter-expectationalquestion (CEQ). Given this three-way contrast in meaningpotentially triggered by pitch range, we ran a series of behavioraland electrophysiological experiments in order to find out whetherthe difference between these three meanings is cued by pitchrange in a discrete fashion.
Our investigation of the role of pitch range in the intonationalgrammar of this language has been couched in the Autosegmental-Metrical (AM) model of prosodic analysis, which takes as a centralassumption that only two tones, Low and High, are necessary todistinguish intonational categories in a language like English. Inthis regard, the role of pitch range has often been relegated toexpress differences in emphasis or prominence (Pierrehumbert1980, Beckman & Pierrehumbert 1986). However, work ondifferent Romance and Germanic languages has revealed thatpitch range variation can express categorical differences inmeaning (Hirschberg & Ward 1992, Ladd & Morton 1997, Savino &Grice 2011, Vanrell 2011), and some authors have suggested thatthe AM framework has to take this tonal feature explicitly intoaccount as conveyor of categorical distinctions (Ladd 1994, Face2011). Chapters 2 and 3 were devoted to investigate thephonological role of pitch range in Catalan.

112
Chapter 2 described two behavioral experiments in whichparticipants were presented with an acoustic continuum of pitchrange and had to decide among three possible responses (IFS, CFS,CEQ). From these two experiments we analyzed responsefrequencies and subjects’ reaction times (RTs). In the firstexperiment, participants had to identify which meaning wasunderstood for each isolated stimulus; on the other hand, in thesecond one participants had to rate the degree of perceivedappropriateness between the stimulus and correspondingcongruent (and potentially incongruent) discourse contexts, foreach of the three potential meanings. In both experiments,participants associated IFS and CEQ with the low and high ends ofthe pitch range continuum respectively, while CFS was lessconsistently associated with a specific range though skewedtowards an IFS interpretation.
As for reaction times patterns, the first experiment showed aclear peak in the perceived acoustic boundary between CEQ andthe other two types of statements (namely IFS and CFS) and in thesecond experiment a RT peak emerged only for IFS and CEQ, butnot for CFS. Following Chen (2003), if a RT peak located at anidentification boundary is taken as an indication of thediscreteness of a perceived contrast, we cannot claim thatparticipants’ decisions on the appropriateness of CFS sentencesare discretely distributed depending on pitch range.
Therefore, the results of Chapter 2 reveal that IFSinterpretations are induced by contours with narrow pitch range,whereas CEQ interpretations are triggered by contours with awider pitch range. Concerning the role of pitch range in CFSmarking, our results show that CFS behaves approximately like IFSin terms of pitch range values. The congruity experiment showedthat there is no RT peak between the ‘appropriate’ and‘inappropriate’ decisions that affect the role of pitch range for CFSmarking, which means that these two responses are not discretelydivided by native listeners and so the role of pitch range for CFSmarking is simply a gradient phenomenon. The IFS-like behavior

113
and absence of a RT peak might thus be interpreted as meaningthat pitch range distinguishes CFS from IFS in a gradient fashion.We argue that the detection of an utterance as being a CFS reliesto a greater extent on a pragmatic inferencing process, such thatCFS is understood when contrastive information is added to thediscourse in normal conversation. Finally, the speaker can alsomark the corrective status of that utterance with morphosyntacticstrategies like focus fronting, as well as with postfocal prosodicreduction.
Chapter 3 presented two experiments intended to show thatthe perceived discreteness between IFS and CEQ described inChapter 2 have a significant electrophysiological correlate.Previous electrophysiological studies of segmental phonologicalcontrasts and tone contrasts from tone languages found evidencethat native linguistic contrasts of this sort elicited significantlylarger mismatch negativity (MMN) responses than non-nativecontrasts (Näätänen et al. 1997, Gandour et al. 1994) and thatacoustic contrasts that crossed a category boundary lead to largerMMN responses than comparable acoustic contrasts that did notcross these category boundaries (Dehaene-Lambertz 1997,Chandrasekaran et al. 2007). Such results have not yet beenobtained for intonational contrasts. Doherty et al. (2004) andLeitman et al. (2009) argued that the large MMN elicited only byinterrogative stimuli (and not by the declarative stimuli) “mayunderlie the ability of questions to automatically captureattention even when the preceding declarative information hasbeen ignored” (Leitman et al. 2009: 289). Fournier et al. (2010)argued that electrophysiological information taken from thehuman brain did not provide clear evidence for the recognition ofdiscourse meanings by means of intonation.
However, the findings presented in Chapter 3 confirmed theresults reported in Chapter 2. In a first identification experiment,a clear nonmonotonic identification of the contrast between IFSand CEQ was found, as well as faster RTs in the identification ofwithin-category exemplars than in more ambiguously-interpreted
114
exemplars. In the second experiment presented in Chapter 3, themean amplitude of the MMN was found to be larger for the across-category contrast compared to the within-category contrasts,suggesting that intonational contrasts in the target language canbe encoded automatically in the auditory cortex. Moreover, ourresults showed that the activation of these auditory cortexintonational representations was related to the individuals’subjective perception and performance (i.e., that a significantcorrelation was obtained between the electrophysiologicalresponses and the behavioral measures obtained in the firstexperiment, both for individuals as well as for the grand meandata). Thus, our results provided electrophysiological evidencethat phonological contrasts at the intonational level (based on apitch range difference) are also encoded in the auditory cortex,which is in line with a substantial set of empirical results thatdemonstrate the larger activation of memory traces for linguisticelements in the human brain.
Taken together, Chapters 2 and 3 showed that variation in pitchrange is the main cue that Catalan listeners use to discriminatebetween IFS and CEQ, i.e., there is a threshold along a continuumof pitch range beyond which a CEQ meaning is consistentlyattained. This contrast in pitch range for distinguishing questionsand statements has been shown to also signal phonologicaldistinctions in other Romance languages (Savino & Grice 2011 forBari Italian, Roseano et al. 2011 for Friulian, Estebas-Vilaplana &Prieto 2010 for Castilian Spanish, etc.), as well as in otherlanguages.
These results indicate that an accurate prosodic transcriptionsystem for these languages — at least for Catalan — needs to signalthe distinction between the IFS patterns (L+H*) and the CEQpatterns (L+¡H*) (Aguilar et al. 2009 for Catalan). In line with this,and following recent work by Vanrell (2011), the inclusion of atone like [L+¡H*] (with the upstep diacritic), has been proposed toexpand the inventory of available pitch-accent phonologicalcontrasts (i.e., three phonologically different tones are thus

115
available in the intonational transcription system for Catalan: L, H,and ¡H).
6.2. Interaction between prosodic and gestural cues insentence processing
The main goal of Chapters 4 and 5 was to understand theinteraction between acoustic and visual cues in the linguisticperception of interrogativity. In Chapter 4, we explored therelative importance of pitch accent range and facial gestures inthe perception of the contrast between CFS and CEQ by usingcongruent and incongruent multimodal stimuli.
The main question to be answered by Chapter 4 was to whatextent gestural cues could be central in encoding a linguisticallyrelevant distinction between CFS vs. CEQ. In the two identificationexperiments included in that chapter, Catalan listeners werepresented with congruent and incongruent audiovisual materials.The analysis of their response frequencies revealed a clearpreference for visual cues when deciding between a CFS and CEQinterpretation, whereas the pitch range contrast in intonation wasobserved to play a secondary reinforcing role. These results showthat in some circumstances facial gestures can act as centralconveyors of prosodic interpretation and compete with prosodiccues, which seems to partially contradict the results of a largenumber of studies in audiovisual prosody that have found acomplementary effect of visual cues (Krahmer et al. 2002, Swerts &Krahmer 2004, Srinivasan & Massaro 2003, House 2002, Dohen &Lœvenbruck 2009, and others).
It is worth mentioning that audiovisual integration effects havebeen well observed at the segmental level in other research,mostly since the publication of McGurk & MacDonald’s (1976)study. That study showed that when hearing [ba] while looking atlip movements pronouncing [ga] adult English-speakers perceived[da], a phonematic sequence which was not actually present in
116
either the acoustic or the visual input provided to participants.Yet when these same subjects were presented with the samematerials unimodally, [ba] and [ga] were perceived respectively.Our results are related to the McGurk effect in the sense that bothmodalities compete and interact in our participants’ decisions, butare different from a ‘classic’ McGurk effect in that we do notobtain a category that is intermediate between our contrastedstatements and questions.
Another interesting result from the two experiments inChapter 4 is that the role of auditory information is stronger whenvisual information is particularly ambiguous, which suggests apattern of audiovisual integration in normal face-to-facecommunication. This means that when participants werepresented with unclear exemplars of CFS and CEQ gestures theirreliance on acoustic information was enhanced. Another studyusing synthetic materials comparing the perception of IFS vs. CEQin Catalan (Borràs-Comes et al. 2011) provides additional evidencefor the pattern observed here. In that study, the reliance onacoustic cues was generally enhanced when they co-occurred withan IFS facial configuration and decreased when presented with aCEQ facial configuration. As expected, given that IFS is a neutraltype of statement and a CEQ is a biased type of question,participants relied more heavily on the CEQ facial gestures than onthe practically nonexistent IFS gestures.
On the other hand, when gestural and intonational features aresalient, listeners tend to rely on both acoustic and visual signals ina more balanced way. Support for this explanation comes from theanalysis of the distinction between IFS and CFS in Central Catalanusing avatars reported in Prieto et al. (2011). The difference foundbetween IFS and CFS is based both on a gradient activation inpitch range and on the strength of activation of two specificgestures: forward head movement and eyebrow raising. Becauseboth modalities showed a gradient and equally salient distinctionconcerning the linguistic contrasts studied (IFS vs. CFS), abalanced use of auditory and visual cues was found in the

117
participants’ identification of both categories (with headmovement being a clearer correlate of CFS marking than eyebrowraising in terms of gestural correlates).
This compensatory interpretation is linked to Crespo-Sendra’s(2011) results regarding the audiovisual perception of IFS vs. CEQin Valencian Catalan and Dutch. Whereas the facial gesturescharacteristic of the two meanings are found to be similar to thosediscussed in the present thesis, a clear difference between the twolanguages is reported concerning intonational marking: whereasValencian Catalan marks the distinction between the two types ofinterrogatives with pitch scaling differences over the same risingconfiguration (L* H%), Dutch uses two very different contours todistinguish between the two meanings (namely L* H% for ISQ andL+H* LH% for CEQ). When both populations were presented withcongruent and incongruent combinations of those audiovisualmaterials, Valencian Catalan speakers relied significantly more onvisual cues, whereas Dutch speakers crucially showed a morebalanced effect between the two cues in interaction.
6.3. The role of verbal and nonverbal cues in questiondetection
In Chapter 5, we explored the relative importance of differenttypes of boundary tones and both eye gaze and eyebrow raising inthe perception of the contrast between IFS and ISQ in two types oflanguages, one that exhibits a syntactic strategy (i.e., subject/verbinversion) for question marking (Dutch) and one that does not(Catalan). The results of our perception experiment showed thatboth Dutch and Catalan participants can identify questions andstatements above chance level in all conditions. Importantly, theyshowed a great reliance on auditory information, but also betteraccuracy in identification responses when the visual informationwas added to the auditory one.

118
This pattern of results, though, is partially in contradictionwith those reported in Chapter 4. When participants had todistinguish between IFS and ISQ — nonbiased types of statementsand questions respectively — they showed a greater reliance onauditory information compared to visual information (though avisual-only presentation of the materials also yielded asignificantly accurate identification rate). In line with what ismentioned above, I suggest that these partially contradictoryresults are related with the properties of the acoustic and visualcues analyzed in both sets of experiments.
Concerning the contrast between CFS and CEQ (Chapter 4), thevisual information contained in each of the two facial patterns wasvery different, though both are characterized by salient head andeyebrow movements (a forward/backward head movement and araising/furrowing eyebrow movement); as for the acousticproperties of the two utterance types, though they represent aphonological contrast in the intonational phonology of Catalan(see Chapters 2 and 3), they are based on a single difference in thepitch range properties of the intonational contour. Concerning thecontrast between IFS and ISQ analyzed in Chapter 5, the visualinformation characterizing this difference was perceptually lesssalient and determined only by the presence or absence of a singlefeature, namely eye gaze, whose role was found to be improvedwhen adding a raising eyebrow movement; as for the acousticinformation, it was based on one of the most commonly appliedcrosslinguistic dichotomies in intonational languages for questionmarking, the rising vs. falling distinction within the boundarytone domain, and even syntactic differences when available.
In this regard, it can be argued that the difference found in theperceptual weight of auditory and visual information in these twochapters is especially linked to the saliency expressed by thesecues. For instance, the difference between two types of fallingtones (even if they show a difference in pitch range) will be lesssalient than the difference existing between a falling tone and arising one. In addition, the difference between a raised eyebrow

119
and a furrowed brow will be more salient than the differencebetween a raised brow and its default configuration.
Interestingly, the results described in Chapter 5 showed thatinteraction effects such as those existing between acoustic andvisual information were found within a single modality whencomparing the perception of IFS vs. ISQ. Even though in our Dutchmaterials there were no ISQ were produced that did not manifestsubject/verb inversion, Dutch participants significantly classifiedSV utterances with a final rising intonation as being exemplars ofquestions. What is also important to note, though, is that thispreference for ‘question’ responses had no effect when risingintonation co-occurred with a (syntactically marked) VS structure,which also suggests a kind of hierarchical weight of the availablecues which plays a role in the detection of interrogativity. Finally,the same result was obtained when comparing eye gaze withintonation both in Dutch and Catalan, namely, the presence ofgaze significantly increased participants’ ‘question’ responses onlywhen gaze co-occurred with a falling contour.
This result is in line with recent investigations on the role ofverbal and nonverbal cues as response-mobilizing features usingcorpus analysis. Stivers & Rossano (2010) stated that “a request (oran offer or information request) is high in response relevance, buta request designed ‘directly’ (e.g., with interrogativemorphosyntax and/or prosody) would be still higher [in responserelevance]. Similarly, an assessment (or a noticing orannouncement) would be low in response relevance. However, if itwere designed with multiple response-mobilizing features, thiswould increase the response relevance of the action” (Stivers &Rossano 2010: 27–28).
This principle of response relevance takes into considerationthe role location of “interrogative morphosyntax and/or prosody”at a higher rank in the hierarchy, but also takes into considerationthe incremental effect of other available cues. Stivers & Rossano(2010) found for both English and Italian that no single feature ispresent in all cases and thus concluded that no feature appeared

120
to be intrinsic to the action of requesting information. Moreover,they stated that the use of a number of response-mobilizingfeatures increases the response relevance of an action. In fact,when analyzing the AV perception results in our Chapter 5, wefound a positive correlation between the concentration ofinterrogative cues in a sentence and its rating as an interrogativeutterance, for both languages. This pattern of results suggests — atleast when taking into account in terms of the data for Dutch andCatalan — that there exists a cue value scale for interrogativitymarking such that syntax > intonation > gaze (eyebrow).
In sum, the present thesis has provided results that are relevantfor the issue of the interaction between auditory and facial cues inspeakers’ perception of an utterance as being a statement or aquestion, which I suggest can ultimately be linked to conceptssuch as hierarchical weight. The results presented here allow for abetter understanding of human communication and the role thatfacial gestures and intonational features — especially pitch range— play in this system.
121
References
Aaltonen, O., Eerola, O., Hellström, Å., Uusipaikka, E., & Lang, A. H.(1997). Perceptual magnet effect in the light of behavioral andpsychophysiological data. Journal of the Acoustical Society ofAmerica, 101(2), 1090–1105.
Abramson, A. S. (1979). The noncategorical perception of tonecategories in Thai. In B. Lindblom & S. Öhman (Eds.), Frontiers ofspeech communication research. London: Academic Press, 127–134.
Aguilar, L., De-la-Mota, C., & Prieto, P. (Coords.) (2009). Cat_ToBITraining Materials. Web page. http://prosodia.upf.edu/cat_tobi/
Ahmad, M. I., Tariq, H., Saeed, M., Shahid, S., & Krahmer, E. (2011).Guess Who? An interactive and entertaining game-like platformfor investigating human emotions. Human-computer interaction.Towards mobile and intelligent interaction environments. LectureNotes in Computer Science, 6763, 543–551.
Alho, K. (1995). Cerebral generators of mismatch negativity (MMN)and its magnetic counterpart (MMNm) elicited by soundchanges. Ear and Hearing, 16(1), 38–51.
Amades, J. (1957). El gest a Catalunya. Anales del Instituto deLingüística, VI, 88–148.
Antunes, F. M., Nelken, I., Covey, E., & Malmierca, M. S. (2010).Stimulus-specific adaptation in the auditory thalamus of theanesthetized rat. PLoS one, 5(11), e14071.
Argyle, M., & Cook, M. (1976). Gaze and mutual gaze. Cambridge:Cambridge University Press.
Armstrong, M. E. (2012). The development of yes-no question intonationin Puerto Rican Spanish. PhD dissertation. Columbus: The OhioState University.
Arvaniti, A., & Baltazani, M. (2004). Greek ToBI. In S. A. Jun (Ed.),Prosodic models and transcription: Towards prosodic typology.Oxford: Oxford University Press, 84–117.

122
Assmann, P., & Summerfield, Q. (2004). The perception of speechunder adverse conditions. In S. Greenberg & W. A. Ainsworth(Eds.), Speech processing in the auditory system. New York:Springer Verlag, 231–308.
Baayen, R. H., Davidson, D. J., & Bates, D. M. (2008). Mixed-effectsmodeling with crossed random effects for subjects and items.Journal of Memory and Language, 59, 390–412.
Baker-Shenk, C. L. (1983). A microanalysis of the nonmanualcomponents of questions in American Sign Language. Berkeley:University of California.
Barkhuysen, P., Krahmer, E., & Swerts, M. (2005). Problemdetection in human-machine interactions based on facialexpressions of users. Speech Communication, 45(3), 343–359.
Beckman, M. E., & Pierrehumbert, J. (1986). Intonational structurein Japanese and English. Phonology Yearbook, 3, 255–310.
Beckman, M. E., Díaz-Campos, M., McGory, J. T., & Morgan, T. A.(2002). Intonation across Spanish, in the Tones and BreakIndices framework. Probus, 14, 9–36.
Beckman, Mary E. & Gayle Ayers Elam. 1997. Guidelines for ToBIlabeling (version 3). Manuscript. Ohio State University.
Bergman, B. (1984). Non-manual components of signed language:Some sentence types in Swedish Sign Language. In F. Loncke, P.Boyes Braem & Y. Lebrun (Eds.), Recent research on European signlanguages (Proceedings of the European Meeting of Sign LanguageResearch, Brussels). Lisse: Swets & Zeitlinger, 49–59.
Beskow, J., Granström, B., & House, D. (2006). Visual correlates toprominence in several expressive modes. Proceedings ofInterspeech 2006 (Pittsburgh), 1272–1275.
Billmyer, K., & Varghese, M. (2000). Investigating instrument-based pragmatic variability: Effects of enhancing DiscourseCompletion Tests. Applied Linguistics, 21(4), 517–52.
Boersma, P., & Weenink, D. (2008). Praat: doing phonetics by computer(version 5.0.09). Computer Program.

123
Bolinger, D. L. (1986). Intonation and its uses: Melody in grammar anddiscourse. Palo Alto: Stanford University Press.
Borràs-Comes, J., Puglesi, C., & Prieto, P. (2011). Audiovisualcompetition in the perception of counter-expectationalquestions. In G. Salvi, J. Beskow, O. Engwall & S. Al Moubayed(Eds.), Proceedings of the 11th International Conference on Auditory-Visual Speech Processing 2011 (Volterra, Italy), 43–46.
Borràs-Comes, J., Vanrell, M. M., & Prieto, P. (2010). The role ofpitch range in establishing intonational contrasts in Catalan.Proceedings of the Fifth International Conference on Speech Prosody(Chicago), 100103, 1–4.
Braun, B. (2006). Phonetics and phonology of thematic contrast inGerman. Language and Speech, 49(4), 451–493.
Breeuwer, M. & Plomp, R. (1984). Speechreading supplementedwith frequency-selective soundpressure information. Journal ofthe Acoustical Society of America 76(3), 686–691.
Burnham, D. (1998). Language specificity in the development ofauditory–visual speech perception. In R. Campbell, B. Dodd & D.Burnham (Eds.), Hearing by eye II: advances in the psychology ofspeechreading and auditory-visual speech. New York: PsychologyPress, 29–60.
Calhoun, S. (2004). Phonetic dimensions of intonational categories:The case of L+H* and H*. In B. Bel & I. Marlien (Eds.), Proceedingsof Speech Prosody 2004, 103–106. Nara (Japan).
Calvert, G. A., & Campbell, R. (2003). Reading speech from still andmoving faces: the neural substrates of visible speech. Journal ofCognitive Neuroscience, 15(1), 57–70.
Cavé, C., Guaïtella, I., Bertrand, R., Santi, S., Harlay, F., & Espesser,R. (1996). About the relationship between eyebrow movementsand F0 variations. In T. Bunnell & W. Idsardi (Eds.), Proceedingsof the Fourth International Conference on Spoken Language Processing(Philadelphia), 2175–2179.

124
Chandrasekaran, B., Krishnan, A., & Gandour, J. (2007). Mismatchnegativity to pitch contours is influenced by languageexperience. Brain Research, 1128(1), 148–156.
Chandrasekaran, B., Krishnan, A., & Gandour, J. (2009). Relativeinfluence of musical and linguistic experience on early corticalprocessing of pitch contours. Brain and Language, 108(1), 1–9.
Chen, A. (2003). Reaction time as an indicator of discreteintonational contrasts in English. Proceedings of the EighthEuropean Conference on Speech Communication and Technology(Geneva), 97–100.
Coerts, J. (1992). Nonmanual grammatical markers. An analysis ofinterrogatives, negations and topicalisations in Sign Language of theNetherlands. Amsterdam: Universiteit van Amsterdam.
Cohen, J. (1960). A coefficient of agreement for nominal scales.Educational and Psychological Measurement, 20(1), 37–46.
Cohen, A. (1996). Investigating the production of speech act sets.In S. M. Gass & J. Neu (Eds.), Speech Acts across cultures. Berlin,Germany: Mouton de Gruyter, 23–43.
Cohen, A. (2007). Incredulity questions. In R. Artstein & L. Vieu(Eds.), Proceedings of the 11th Workshop on the Semantics andPragmatics of Dialogue (Rovereto), 133–140.
Colin, C., Radeau, M., Soquet, A., Demolin, D., Colin, F., & Deltenre,P. (2002). Mismatch negativity evoked by the McGurk-MacDonald effect: a phonetic representation within short-termmemory. Clinical Neurophysiology, 113(4), 495–506.
Cosnier, J. (1991). Les gestes de la question. In C. Kerbrat-Orecchioni (Dir.), La question. Lyon: Presses Universitaires deLyon, 163–171.
Crespo-Sendra, V. (2011). Aspectes de l’entonació del valencià. PhDdissertation. Barcelona: Universitat Pompeu Fabra.
Cruschina, S. (2011). Focalization and word order in Old Italo-Romance. Catalan Journal of Linguistics, 10, 92–135.
Cruttenden, A. (1981). Falls and rises: meanings and universals.Journal of Linguistics, 17(1), 77–91.

125
de Vos, C., van der Kooij, E., & Crasborn, O. (2009). Mixed Signals:Combining linguistic and affective functions of eyebrows inquestions in Sign Language of the Netherlands. Language andSpeech, 52, 315–339.
Dehaene-Lambertz, G. (1997). Electrophysiological correlates ofcategorical phoneme perception in adults. NeuroReport, 8, 919–924.
Deouell, L. Y. (2007). The frontal generator of the MismatchNegativity revisited. Journal of Psychophysiology, 21(3-4), 188–203.
Dijkstra, C., Krahmer, E., & Swerts, M. (2006). Manipulatinguncertainty: The contribution of different audiovisual prosodiccues to the perception of confidence. In R. Hoffmann & H.Mixdorff (Eds.), Proceedings of the Third International Conference onSpeech Prosody (Dresden). Dresden: TUDpress.
Dilley, L. C. (2010). Pitch range variation in English tonal contrasts:Continuous or categorical? Phonetica, 67, 63–81.
Dohen, M., & Lœvenbruck, H. (2009). Interaction of audition andvision for the perception of prosodic contrastive focus.Language and Speech, 52(2–3), 177–206.
Dohen, M., Lœvenbruck, H., & Hill, H. (2006). Visual correlates ofprosodic contrastive focus in French: Description and inter-speaker variabilities. In R. Hoffmann & H. Mixdorff (Eds.),Proceedings of the Third International Conference on Speech Prosody(Dresden). Dresden: TUDpress, 221–224.
Doherty, C. P., West, W. C., Dilley, L. C., Shattuck-Hufnagel, S., &Caplan, D. (2004). Question/statement judgments: an fMRIstudy of intonation processing. Human Brain Mapping, 23, 85–98.
Dryer, M. S. (2008). Polar questions. In M. Haspelmath, M. S. Dryer,D. Gil, & B. Comrie (Eds.), The World Atlas of Language StructuresOnline (chapter 116). Munich: Max Planck Digital Library.http://wals.info/feature/116
Duncan, S., & Fiske, D. W. (1977). Face-to-Face Interaction: Research,Methods, and Theory. New York: Wiley.

126
Ekman, P., & Friesen, W. V. (1978). The Facial Action Coding System: Atechnique for the measurement of facial movement. Palo Alto:Consulting Psychologists Press.
Ekman, P., Friesen, W. V., & Hager, J. C. (2002). The Facial ActionCoding System CD-ROM. Salt Lake City: Research Nexus.
Englert, C. (2010). Questions and responses in Dutch conversations.Journal of Pragmatics, 42(10), 2666–2684.
Escera, C., Alho, K., Schröger, E., & Winkler, I. (2000). Involuntaryattention and distractibility as evaluated with event-relatedbrain potentials. Audiology & Neuro-Otology, 5(3-4), 151–166.
Estebas-Vilaplana, E. (2009). The use and realization of accentual focusin Central Catalan with a comparison to English. Munich: LincomEuropa.
Estebas-Vilaplana, E., & Prieto, P. (2010). Castilian Spanishintonation. In P. Prieto & P. Roseano (Eds.), Transcription ofintonation of the Spanish language. München: Lincom Europa, 17–48.
Eulitz, C., & Lahiri, A. (2004). Neurobiological evidence for abstractphonological representations in the mental lexicon duringspeech recognition. Journal of Cognitive Neuroscience, 16(4), 577–583.
Face, T. L. (2005). F0 peak height and the perception of sentencetype in Castilian Spanish. Revista de Lingüística Iberoamericana,2(6), 49–65.
Face, T. L. (2007). The role of intonational cues in the perception ofdeclaratives and absolute interrogatives in Castilian Spanish.Estudios de Fonética Experimental, 16, 185–225.
Face, T. L. (2011). Perception of Castilian Spanish Intonation:Implications for Intonational Phonology. Munich: Lincom Europa.
Face, T. L., & D’Imperio, M. (2005). Reconsidering a focal typology:Evidence from Spanish and Italian. Italian Journal of Linguistics,17(2), 271–289.
Falé, I., & Hub Faria, I. (2005). Intonational contrasts in EP: acategorical perception approach. Proceedings of the Ninth

127
European Conference on Speech Communication and Technology(Lisboa), 1705–1708.
Flecha-García, M. L. (2010). Eyebrow raises in dialogue and theirrelation to discourse structure, utterance function and pitchaccents in English. Speech Communication, 52, 542–554.
Fournier, R., Gussenhoven, C., Jensen, O., & Hagoort, P. (2010).Lateralization of tonal and intonational pitch processing: anMEG study. Brain Research, 1328, 79–88.
Francis, A. L., Ciocca, V., & Ng, B. K. C. (2003). On the(non)categorical perception of lexical tones. Perception &Psychophysics, 65(7), 1029–1044.
Freedman, D. J., Riesenhuber, M., Poggio, T., & Miller, E. K. (2001).Categorical representation of visual stimuli in the primateprefrontal cortex. Science, 291(5502), 312–316.
Gandour, J., Dechongkit, S., Ponglorpisit, S., & Khunadorn, F.(1994). Speech timing at the sentence level in Thai afterunilateral brain damage. Brain and Language, 46(3), 419–438.
Geluykens, R. (1988). On the myth of rising intonation in polarquestions. Journal of Pragmatics, 12, 467–485.
Golato, A. (2006). Studying compliment responses: A comparisonof DCTs and recordings of naturally occurring talk. AppliedLinguistics, 24(1), 90–121.
Graf, H. P., Cosatto, E., Strom, V., & Huang, F. J. (2002). Visualprosody: Facial movements accompanying speech. Proceedings ofthe Fifth IEEE International Conference on Automatic Face andGesture Recognition (Washington), 396–401.
Grant, K. W., & Walden, B. E. (1996). Spectral distribution ofprosodic information. Journal of Speech and Hearing Research, 39,228–238.
Grant, K. W., Walden, B. E., &, Seitz, P. F. (1998). Auditory-visualspeech recognition by hearing-impaired subjects: consonantrecognition, sentence recognition, and auditory-visualintegration. Journal of the Acoustical Society of America, 103, 2677–2690.

128
Grice, M., D’Imperio, M., Savino, M., & Avesani, C. (2005). Towardsa strategy for labeling varieties of Italian. In S. A. Jun (Ed.),Prosodic models and transcription: Towards prosodic typology.Oxford: Oxford University Press, 55–83.
Grimm, S., & Escera, C. (2012). Auditory deviance detectionrevisited: Evidence for a hierarchical novelty system.International Journal of Psychophysiology, 85(1), 88–92.
Grimm, S., Escera, C., Slabu, L., & Costa-Faidella, J. (2011).Electrophysiological evidence for the hierarchical organizationof auditory change detection in the human brain.Psychophysiology, 48(3), 377–384.
Grossman, R. B. (2001). Dynamic facial expressions in American SignLanguage: Behavioral, neuroimaging, and facial coding analyses fordeaf and hearing participants. PhD dissertation. Boston: BostonUniversity.
Grossman, R. B., & Kegl, J. (2006). To capture a face: A noveltechnique for the analysis and quantification of facialexpressions in American Sign Language. Sign Language Studies,6(3), 273–305.
Gussenhoven, C. (1999). Discreteness and gradience in intonationalcontrasts. Language and Speech, 42(2-3), 283–305.
Gussenhoven, C. (2004). The Phonology of Tone and Intonation.Cambridge: Cambridge University Press.
Gussenhoven, C. (2007). Types of Focus in English. In C. Lee, M.Gordon & D. Büring (Eds.), Topic and focus: Cross-linguisticperspectives on meaning and intonation. Heidelberg/NewYork/London: Springer, 83–100.
Gussenhoven, C. (in press). Transcription of Dutch intonation. InS.-A. Jun (Ed.), Prosodic Typology 2. The Phonology of Intonation andPhrasing. Oxford: Oxford University Press.
Haan, J. (2002). Speaking of questions. An exploration of Dutch questionintonation. LOT Dissertation Series 52. Utrecht: LOT.

129
Hadar, U., Steiner, T. J., Grant, E. C., & Rose, F. C. (1983). Headmovements correlates of juncture and stress at sentence level.Language and Speech, 26, 117–129.
Hauk, O., Shtyrov, Y., & Pulvermüller, F. (2006). The sound ofactions as reflected by mismatch negativity: rapid activation ofcortical sensory-motor networks by sounds associated withfinger and tongue movements. The European Journal ofNeuroscience, 23(3), 811–821.
Hirschberg, J., & Ward, G. (1992). The influence of pitch range,duration, amplitude and spectral features on the interpretationof the rise-fall-rise intonation contour in English. Journal ofPhonetics, 20, 241–251.
Holt, H. H., Lotto, A. J., Diehl, R. L. (2004). Auditory discontinuitiesinteract with categorization: implications for speechperception. Journal of the Acoustical Society of America, 116(3),1763–1773.
House, D. (2002). Perception of question intonation and facialgestures. Fonetik, 44(1), 41–44.
IBM Corporation (2010). IBM SPSS Statistics (version 19.0.0).Computer Program.
Kasper, G., & Dahl, M. (1991). Research methods in interlanguagepragmatics. Studies in Second Language Acquisition, 18(21), 49–69.
Keating, P. A. (2004). Statistics. Manuscript. UCLA Phonetics Lab.Web page.http://www.linguistics.ucla.edu/faciliti/facilities/statistics/statistics.html
Kendon, A. (1967). Some functions of gaze direction in socialinteraction. Acta Psychologica, 26, 22–63.
Kendon, A. (1990). Conducting interaction: patterns of behavior infocused encounters. New York: Cambridge University Press.
Klein, D., Zatorre, R., Milner, B., & Zhao, V. (2001). A cross-linguistic PET study of tone perception in Mandarin Chineseand English speakers. NeuroImage, 13, 646–653.

130
Krahmer, E., & Swerts, M. (2004). More about brows: a cross-linguistic analysis-by-synthesis study. In Z. Ruttkay & C.Pelachaud (Eds.), From brows to trust: Evaluating EmbodiedConversational Agents. Kluwer Academic Publishers, 191–216.
Krahmer, E., & Swerts, M. (2005). How children and adults produceand perceive uncertainty in audiovisual speech. Language andSpeech, 48(1), 29–54.
Krahmer, E., & Swerts, M. (2007). The effects of visual beats onprosodic prominence: Acoustic analyses, auditory perceptionand visual perception. Journal of Memory and Language, 57(3),396–414.
Krahmer, E., Ruttkay, Z., Swerts, M., & Wesselink, W. (2002). Pitch,eyebrows and the perception of focus. In B. Bel & I. Marlien(Eds.), Proceedings of the First International Conference on SpeechProsody, Aix en Provence.
Kuhl, P. K., & Miller, J. D. (1975). Speech perception by thechinchilla: voiced-voiceless distinction in alveolar plosiveconsonants. Science, 190(4209), 69–72.
Kuhl, P. K., & Miller, J. D. (1978). Speech perception by thechinchilla: Identification functions for synthetic VOT stimuli.Journal of the Acoustical Society of America, 63(3), 905–917.
Kyle, J. G., & Woll, B. (1985). Sign language: The study of deaf peopleand their language. Cambridge: Cambridge University Press.
Labov, W., & Fanshel, D. (1977). Therapeutic Discourse. New York:Academic Press.
Ladd, D. R. (1994). Constraints on the gradient variability of pitchrange, or, pitch level 4 lives! In P. Keating (Ed.), Phonologicalstructure and phonetic form. Papers in Laboratory Phonology III.Cambridge: Cambridge University Press, 43–63.
Ladd, D. R. (1996). Intonational phonology. Cambridge: CambridgeUniversity Press.
Ladd, D. R., & Morton, R. (1997). The perception of intonationalemphasis: continuous or categorical? Journal of Phonetics, 25,313–342.

131
Landis, J. R., & Koch, G. G. (1977). The measurement of observeragreement for categorical data. Biometrics, 33, 159–74.
Lapakko, D. (1997). Three cheers for language: A closerexamination of a widely cited study of nonverbalcommunication. Communication Education, 46, 63–67.
Lee, H.-Y. (2004). H and L are not enough in intonationalphonology. Eoneohag, 39, 71-79.
Leitman, D., Sehatpour, P., Shpaner, M., Foxe, J., & Javitt, D. (2009).Mismatch negativity to tonal contours suggests preattentiveperception of prosodic content. Brain Imaging and Behavior, 3,284–291.
Levinson, S. C. (2010). Questions and responses in Yélî Dnye, thePapuan language of Rossel Island. Journal of Pragmatics, 42(10),2741–2755.
Liberman, M. Y., & Pierrehumbert, J. (1984). Intonationalinvariance under changes in pitch range and length. In M.Aronoff & R. T. Oehrle (Eds.), Language Sound Structure. Studies inphonology presented to Morris Halle. Cambridge: MIT Press, 157–233.
Litman, D. & Forbes-Riley, K. (2009). Spoken tutorial dialogue andthe Feeling of Another’s Knowing. Proceedings of the Tenth AnnualMeeting of the Special Interest Group in Discourse and Dialogue(London), 286–289.
Lysander, K., & Horton, W. S. (2012). Conversational grounding inyounger and older adults: the effect of partner visibility andreferent abstractness in task-oriented dialogue. DiscourseProcesses, 49(1), 29–60.
MacDonald, J., & McGurk, H. (1978). Visual influences on speechperception processes. Perception and Psychophysics, 24(3), 253–257.
Malmierca, M. S., Cristaudo, S., Perez-Gonzalez, D., & Covey E.(2009). Stimulus-specific adaptation in the inferior colliculus ofthe anesthetized rat. The Journal of Neuroscience, 29(17), 5483–5493.

132
Mascaró, J. (1978). Expresión y comunicación no verbal. Metodología ycrítica. PhD dissertation. Barcelona: Universitat de Barcelona.
Mascaró, J. (1981). Notes per a un estudi de la gestualitat catalana.Serra d’Or, 259, 25–28.
Massaro, D. W. (1987). Speech perception by ear and by eye. Hillsdale:Erlbaum.
Massaro, D. W. (1998). Perceiving talking faces: From speech perceptionto a behavioral principle. Cambridge: MIT Press.
Massaro, D. W., & Cohen, M. M. (1993). The paradigm and the fuzzylogical model of perception are alive and well. Journal ofExperimental Psychology: General, 122(1), 115–124.
McGurk, H., & MacDonald, J. (1976). Hearing lips and seeing voices:A new illusion. Nature, 264, 746–748.
McHugh, B. D. (1990). The phrasal cycle in Kivunjo Chaga tonology.In S. Inkelas & D. Zec (Eds.), The phonology-syntax connection.Chicago: University of Chicago Press, 217–242.
Mehrabian, A., & Ferris, S. R. (1967). Inference of attitudes fromnonverbal communication in two channels. Journal of ConsultingPsychology, 31, 248–252.
Mori, M. (1970). The uncanny valley. Energy, 7(4), 33–35.Munhall, K. G., Jones, J. A., Callan, D. E., Kuratate, T., & Vatikiotis-
Bateson, E. (2004). Visual prosody and speech intelligibility.Head movement improves auditory speech perception.Psychological Science, 15, 133–137.
Näätänen, R. (2001). The perception of speech sounds by thehuman brain as reflected by the mismatch negativity (MMN)and its magnetic equivalent (MMNm). Psychophysiology, 38, 1–21.
Näätänen, R., & Michie, P. T. (1979). Early selective-attentioneffects on the evoked potential: a critical review andreinterpretation. Biological Psychology, 8(2), 81–136.
Näätänen, R., Lehtokoski, A., Lennes, M., Cheour-Luhtanen, M.,Huotilainen, M., Iivonen, A., Vainio, M., Alku, P., Ilmoniemi, R.J., Luuk, A., Allik, J., Sinkkonen, J., & Alho, K. (1997). Language-

133
specific phoneme representations revealed by electric andmagnetic brain responses. Nature, 385(6615), 432–434.
Näätänen, R., Paavilainen, P., Rinne, T., & Alho, K. (2007). Themismatch negativity (MMN) in basic research of centralauditory processing: A review. Clinical Neurophysiology, 118,2544–2590.
Nakano, Y. I., Reinstein, G., Stocky, T., & Cassell, J. (2003). Towardsa model of face-to-face grounding. Proceedings of the 41st AnnualMeeting of the Association for Computational Linguistics (Sapporo),553–561.
Nurani, L. M. (2009). Methodological issue in pragmatic research:is discourse completion test a reliable data collectioninstrument? Jurnal Sosioteknologi, 17(8), 667–678.
(The) Ohio State University Department of Linguistics (1999).ToBI. Web page. http://www.ling.ohio-state.edu/~tobi/
Payrató, L. (1989). Assaig de dialectologia gestual. Aproximaciópragmàtica al repertori bàsic d’emblemes del català de Barcelona. PhDdissertation. Barcelona: Universitat de Barcelona.
Payrató, L. (1993). A pragmatic view on autonomous gestures: Afirst repertoire of Catalan emblems. Journal of Pragmatics, 20,193–216.
Payrató, L., Alturo, N., & Payà, M. (Eds.) (2004). Les fronteres delllenguatge. Lingüística i comunicació no verbal. Barcelona:Promociones y Publicaciones Universitarias.
Pérez-González, D., Malmierca, M. S., & Covey, E. (2005). Noveltydetector neurons in the mammalian auditory midbrain. TheEuropean Journal of Neuroscience, 22(11), 2879–2885.
Peters, C., Pelachaud, C., Bevacqua, E., Mancini, M., & Poggi, I.(2005). A model of attention and interest using gaze behavior.Proceedings of Intelligent Virtual Agents 2005 (Kos), 229–240.
Pfau, R., & Quer, J. (2010). Nonmanuals: their grammatical andprosodic roles. In D. Brentari (Ed.), Sign Languages (CambridgeLanguage Surveys). Cambridge: Cambridge University Press, 381–402.

134
Phillips, C., Pellathy, T., Marantz, A., Yellin, E., Wexler, K., Poeppel,D., McGinnis, M., & Roberts, T. (2000). Auditory cortex accessesphonological categories: an MEG mismatch study. Journal ofCognitive Neuroscience, 12(6), 1038–1055.
Pierrehumbert, J. (1980). The Phonetics and Phonology of EnglishIntonation. PhD dissertation. Cambridge: Massachusetts Instituteof Technology.
Pomerantz, A. M. (1980). Telling my side: “Limited access” as a“fishing” device. Sociological Inquiry, 50, 186–198.
Post, B. Stamatakis, E., Bohr, I., Nolan, F. & Cummins, C. (in press).Categories and gradience in intonation: an fMRI study. In J.Romero & M. Riera (Eds.), Phonetics and Phonology in Iberia.
Prieto, P. (2002). Entonació. In J. Solà, M. R. Lloret, J. Mascaró & M.Pérez Saldanya (Eds.), Gramàtica del català contemporani, vol. 1.Barcelona: Empúries, 1395–1462.
Prieto, P. (2004). The search for phonological targets in the tonalspace: H1 scaling and alignment in five sentence-types inPeninsular Spanish. In T. L. Face (Ed.), Laboratory approaches toSpanish phonology. Berlin: Mouton de Gruyter, 29–59.
Prieto, P. (2005). Stability effects in tonal clash contexts in Catalan.Journal of Phonetics, 33(2), 215–242.
Prieto, P. (in press). The intonational phonology of Catalan. In S.-A. Jun (Ed.), Prosodic Typology 2. The Phonology of Intonation andPhrasing. Oxford: Oxford University Press.
Prieto, P., & Cabré, T. (Coords.) (2007-2012). Atles interactiu del’entonació del català. Web page.http://prosodia.upf.edu/atlesentonacio/
Prieto, P., & Rigau, G. (2007). The syntax-prosody interface:Catalan interrogative sentences headed by que. Journal ofPortuguese Linguistics, 6(2), 29–59.
Prieto, P., Aguilar, L., Mascaró, I., Torres-Tamarit, F., & Vanrell, M.M. (2009). L’etiquetatge prosòdic Cat_ToBI. Estudios de FonéticaExperimental, 18, 287–309.

135
Prieto, P., Puglesi, C., Borràs-Comes, J., Arroyo, E., & Blat, J. (2011).Crossmodal prosodic and gestural contribution to theperception of contrastive focus. Proceedings of the 12th AnnualConference of the International Speech Communication Association(Florence), 977–980.
Psychology Software Tools Inc. (2009). E-Prime (version 2.0).Computer Program.
Pulvermüller, F. (2005). Brain mechanisms linking language andaction. Nature Reviews Neuroscience, 6, 576–582.
Pulvermüller, F., & Shtyrov, Y. (2006). Language outside the focusof attention: The mismatch negativity as a tool for studyinghigher cognitive processes. Progress in Neurobiology, 79(1), 49–71.
Quené, H., & van der Bergh, H. (2008). Examples of mixed-effectsmodeling with crossed random effects and with binomial data.Journal of Memory and Language, 59, 413–425.
Raizada, R. D., & Poldrack, R. A. (2007). Selective amplification ofstimulus differences during categorical processing of speech.Neuron, 56(4), 726-740.
Rathcke, T., & Harrington, J. (2010). The variability of early accentpeaks in Standard German. In C. Fougeron, B. Kühnert, M.D’Imperio, & N. Vallée (Eds.), Laboratory Phonology 10, 533–555.Berlin – New York: Mouton de Gruyter.
Ren, G.-Q., Yang, Y., & Li, X. (2009). Early cortical processing oflinguistic pitch patterns as revealed by the mismatchnegativity. Neuroscience, 162, 87–95.
Rialland, A. (2007). Question prosody: an African perspective. In C.Gussenhoven & C. Riad (Eds.), Tones and tunes, vol. 2. Mouton:Berlin, 35–62.
Richardson, D. C., Dale, R., & Tomlinson, J. M. (2009). Conversation,gaze coordination, and beliefs about visual context. CognitiveScience, 33(8), 1468–1482.
Roseano, P., Vanrell, M. M., & Prieto, P. (2011). Fri_ToBI. Workshopon Romance ToBI. Transcription of intonation of the Romancelanguages (Tarragona).
136
Rossano, F. (2010). Questioning and responding in Italian. Journal ofPragmatics, 42(10), 2756–2771.
Savino, M., & Grice, M. (2011). The perception of negative bias inBari Italian questions. In S. Frota, P. Prieto & G. Elordieta (Eds.),Prosodic categories: production, perception and comprehension.Springer Verlag, 187–206.
Scarborough, R., Keating, P., Mattys, S. L., Cho, T., & Alwan, A.(2009). Optical phonetics and visual perception of lexical andphrasal stress in English. Language and Speech, 52(2–3), 135–175.
Sharma, A., & Dorman, M. (1999). Cortical auditory evokedpotential correlates of categorical perception of voice-onsettime. Journal of the Acoustical Society of America, 106(2), 1078–1083.
Sharma, A., & Dorman, M. (2000). Neurophysiologic correlates ofcross-language phonetic perception. Journal of the AcousticalSociety of America, 107(5.1), 2697–2703.
Shtyrov, Y., Hauk, O., & Pulvermüller, F. (2004). Distributedneuronal networks for encoding category-specific semanticinformation: the mismatch negativity to action words. TheEuropean Journal of Neuroscience, 19(4), 1083–1092.
Slabu, L., Escera, C., Grimm, S., & Costa-Faidella, J. (2010). Earlychange detection in humans as revealed by auditory brainstemand middle-latency evoked potentials. The European Journal ofNeuroscience, 32(5), 859–865.
Solà, J. (1990). L’ordre dels mots en català. Notes pràctiques. In J.Solà (Ed.), Lingüística i normativa. Barcelona: Empúries, 91–124.
SourceTec Software Co. (2007). Sothink SWF Quicker (version 3.0).Computer Program.
Srinivasan, R. J., & Massaro, D. W. (2003). Perceiving prosody fromthe face and voice. Distinguishing statements from echoicquestions in English. Language and Speech, 46(1), 1–22.
Stivers, T. (2010). An overview of the question–response system inAmerican English conversation. Journal of Pragmatics, 42(10),2772–2781.

137
Stivers, T., & Rossano, F. (2010). Mobilizing Response. Research onLanguage and Social Interaction, 43(1), 1–31.
Stockwell, R. P., Bowen, D. J., & Silva-Fuenzalida, I. (1956). Spanishjuncture and intonation. Language, 32(4), 641–665.
Sumby, W. H., & Pollack, I. (1954). Visual contribution to speechintelligibility in noise. Journal of the Acoustical Society of America,26, 212–215.
Summerfield, Q. (1992). Lipreading and audio-visual speechperception. In V. Bruce, A. Cowey, W. Ellis & D. I. Perrett (Eds.),Processing the facial image. Oxford: Oxford University Press, 71–78.
Swerts, M., & Krahmer, E. (2004). Congruent and incongruentaudiovisual cues to prominence. Proceedings of the SecondInternational Conference on Speech Prosody (Nara), 69–72.
Swerts, M., & Krahmer, E. (2005). Audiovisual prosody and feelingof knowing. Journal of Memory and Language, 53(1), 81–94.
Swerts, M., & Krahmer, E. (2008). Facial expressions and prosodicprominence: Comparing modalities and facial areas. Journal ofPhonetics, 36(2), 219–238.
Trager, G. L., & Smith, H. L. (1951). An outline of English structure.Studies in Linguistics occasional papers 3. Norman: BattenbergPress.
Ulanovsky, N., Las, L., & Nelken, I. (2003). Processing of low-probability sounds by cortical neurons. Nature Neuroscience,6(4), 391–398.
Vallduví, E. (1991). The role of plasticity in the association of focusand prominence. In Y. No & M. Libucha (Eds.), Proceedings of theSeventh Eastern States Conference on Linguistics. Columbus: OhioState University Press, 295–306.
Vanrell, M. M. (2006). A tonal scaling contrast in Majorcan Catalaninterrogatives. Journal of Portuguese Linguistics, 6(1), 147–178.
Vanrell, M. M. (2011). The phonological relevance of tonal scaling in theintonational grammar of Catalan. PhD dissertation. Cerdanyola delVallès: Universitat Autònoma de Barcelona.

138
Vanrell, M. M., Mascaró, I., Torres-Tamarit, F., & Prieto, P. (inpress). Intonation as an encoder of speaker certainty:information and confirmation yes-no questions in Catalan.Language and Speech.
Vanrell, M. M., Stella, A., Gili-Fivela, B., & Prieto, P. (2012).Prosodic cues for the recognition of contrastive focus. In B. Gili-Fivela, A. Stella, L. Garrapa & M. Grimaldi (Eds.), Contestocomunicativo e variabilità nella produzione e percezione della lingua.Atti del 7 Convegno AISV. Lecce: Bulzoni.
Vilhjálmsson, H. H. (1997). Autonomous communicative behaviorsin avatars. Master of Science Thesis. Cambridge: MassachusettsInstitute of Technology
Ward, G., & Hirschberg, J. (1985). Implicating uncertainty. Thepragmatics of fall-rise intonation. Language, 61, 747–776.
Winkler, I., Lehtokoski, A., Alku, P., Vainio, M., Czigler, I., Csépe, V.,Aaltonen, O., Raimo, I., Alho, K., Lang, A. H., Iivonen, A., &Näätänen, R. (1999). Pre-attentive detection of vowel contrastsutilizes both phonetic and auditory memory representations.Cognitive Brain Research, 7, 357–369.
Xi, J., Zhang, L., Shu, H., Zhang, Y., & Li, P. (2010). Categoricalperception of lexical tones in Chinese revealed by mismatchnegativity. Neuroscience, 170, 223–231.
Zhang, L., Xi, J., Xu, G., Shu, H., Wang, X., & Li, P. (2011) Corticaldynamics of acoustic and phonological processing in speechperception. PLoS one, 6(6): e20963.
139
Appendix 1
Introducció en català
L’objectiu principal d’aquesta tesi és aprofundir en el coneixementde la interrogativitat. Concretament, es pretén esbrinar com elsparlants la marquen i, especialment, com la detecten. És a dir,volem saber quins són els elements que ens permeten diferenciaruna oració interrogativa d’una declarativa, tant en la fase deproducció de la parla com en la fase de percepció. D’aquestamanera, la motivació central de la tesi és entendre millor un delsaspectes centrals de la comunicació humana: el mecanisme segonsel qual sabem si se’ns dóna informació o si se’ns en demana.
És ben sabut que moltes llengües empren l’entonació permarcar la interrogació. No obstant això, encara que una de lesfuncions principals de l’entonació siga vehicular significatspragmàtics, molts dels estudis sobre entonació l’han descrit sensetindre explícitament en compte aquests contextos pragmàtics. Apart, diferents estudis previs sobre l’entonació de les llengüess’han basat en parla llegida i han ignorat molt sovint altrescorrelats lingüístics que acompanyen l’entonació, com és el casdels gestos. En aquesta tesi es tracten dos tipus de declaratives idos tipus d’interrogatives absolutes, que poden ser classificadescom a neutres (és a dir, no marcades) i marcades depenent de lamanera com vehiculen el seu contingut semàntic.
Pel que fa a les declaratives, distingim entre declaratives de focusinformatiu (IFS, information focus statements) i declaratives de focuscontrastiu (CFS, contrastive focus statements). Les IFS sónconsiderades les declaratives neutres, és a dir, aquelles oracionsque vehiculen informació nova i que contenen un constituent quees focalitza respecte al background. En canvi, en una CFS es marcaun dels constituents com a “desestimació directa d’unaalternativa” (Gussenhoven 2007); es corregix “el valor del’alternativa assignant un valor diferent” (Cruschina 2011). Per

140
tant, la principal diferència entre els dos tipus de focus és que,mentre el CFS depèn de l’asserció prèvia, que és rebutjada ocorregida, l’IFS no mostra aquest requisit. Aquest rebuig ocorrecció s’explicita sovint pels mitjans entonatius i gestuals de lamajoria de llengües entonatives.
Pel que fa a les interrogatives, distingim entre interrogatives decerca d’informació (ISQ, information-seeking questions) i interrogativesantiexpectatives (CEQ, counter-expectational questions). D’una banda,una ISQ és aquella interrogativa que té la funció específicad’obtenir informació d’un receptor, sense cap matís especial queindique les expectatives del parlant. D’altra banda, les CEQ estanrelacionades amb les interrogatives ecoiques, que són aquelles enquè l’oient repetix informació que acaba de sentir per diversesraons possibles, com ara perquè no ho ha sentit bé o no ha entèsbé el que se li ha dit o perquè el que implica aquella informacióentra en conflicte amb les seues expectatives prèvies. Les CEQconstituïxen aquest darrer tipus, i poden ser marcades amb unmatís de sorpresa o d’incredulitat. Tal com establix Cohen (2007:133), “una interrogativa d’incredulitat expressa la noció que ladeclaració de què es fa eco no és certa en cap dels mons creguts (onormatius) pels parlants — d’ací la incredulitat (o indignació)expressada cap a aquella declaració” (v. Cohen 2007 per a mésdistincions entre interrogatives ecoiques i d’incredulitat). Com en elcas de les CFS, els matisos d’antiexpectació, sorpresa o incredulitatd’una CEQ es marquen sovint amb patrons entonatius i gestualsespecífics en moltes llengües entonatives.
Per tal d’analitzar els patrons entonatius, hem emprat elsistema de transcripció Tone and Break Indices (ToBI), basat en elmodel Mètric i Autosegmental (AM). De manera breu, aquestaaproximació descriu l’entonació d’una oració distingint entreaquells tons associats a les síl·labes accentuades (accents tonals) iaquells altres que s’alineen a la frontera prosòdica de les frasesentonatives (tons de frontera i accents de frase). Les dues unitatsbàsiques que conformen els accents tonals i els tons de fronterasón els tons H (high, ‘alt’) i L (low, ‘baix’), interpretats

141
respectivament com un augment o una davallada del to en eltranscurs d’una melodia oracional. En la majoria de llengües, elsaccents tonals estan compostos d’un o dos tons, el més prominentdels quals és marcat amb un asterisc (T*). Els tons de frontera sónpercebuts generalment com a excursions descendents oascendents, o com una combinació d’aquestes, i són generalmenttranscrits amb el símbol del percentatge (T%) o amb un guionet(T–). Pel fet de ser un sistema de transcripció fonològica, el ToBIrequerix un coneixement humà expert per tal de caracteritzar elsesdeveniments prosòdics de cada llengua, i és per això que s’handesenvolupat diferents sistemes de transcripció ToBI específicsper a cada llengua des de l’aparició de la tesi de Pierrehumbert(1980) sobre el sistema entonatiu de l’anglès (v. Ohio StateUniversity Department of Linguistics 1999).
Aquesta tesi s’organitza en quatre estudis principals, presentatsdels capítols 2 al 5. Primer, analitzem el rol que exercix unapropietat específica de l’entonació en la distinció entredeclaratives i interrogatives antiexpectatives en català. Aquestapropietat entonativa és el camp tonal, que fa referència a ladistància tonal entre els valors d’f0 més baix i més alt observats enl’accent tonal d’una oració (és a dir, una vall i un pic; v.Gussenhoven 2004). La raó per triar el català per analitzar aquestfenomen és que en aquesta llengua, com en d’altres llengüesromàniques, un contorn entonatiu nuclear ascendent-descendent—és a dir, un accent tonal ascendent associat amb la darrerasíl·laba accentuada d’una oració seguit d’un to de frontera baix—és emprat per vehicular ‘IFS’, ‘CFS’ i ‘CEQ’ depenent de lescaracterístiques de camp tonal que presenta. Aquest contrastentonatiu s’analitza en els capítols 2 i 3. Atès que aquestscontrastos també es poden expressar mitjançant gestos facialsespecífics, en el capítol 4 analitzem la interacció entre els indicisacústics i visuals en la percepció de la interrogativitat. Així com enels experiments presentats als capítols 2, 3 i 4 s’han comparatdeclaratives amb interrogatives marcades, en el capítol 5

142
analitzem com es detecten les interrogatives neutres (ISQ) quan escomparen amb declaratives neutres (IFS).
La Taula 1 mostra un resum dels tipus de declaratives iinterrogatives que s’analitzen en aquesta tesi.
Taula 1. Significats oracionals analitzats en aquesta tesi.
declarativesneutres declarativa de focus informatiu (IFS)
marcades declarativa de focus contrastiu (CFS)
interrogativesneutres interrogativa de cerca d’informació (ISQ)
marcades interrogativa antiexpectativa (CEQ)
L’objectiu del primer estudi (capítol 2) és investigar com esdistribuïxen les percepcions d’IFS, CFS i CEQ al llarg d’uncontínuum de camp tonal, i si els oients de català empren aquestadistinció en camp tonal per identificar aquests significats. És bensabut que diferents llengües empren diferents contorns entonatiuscom a marcadors interrogatius, però en el camp de la fonologiaentonativa encara és un tema controvertit si les diferències encamp tonal també s’utilitzen per expressar una distinciócategòrica com aquesta. Amb aquest propòsit, vam dur a termedues tasques experimentals. Primer, vam emprar una tascad’identificació amb tres possibles opcions de resposta. Així,permetíem la comparació simultània de les tres categories (IFS,CFS i CEQ). En segon lloc, vam emprar una tasca de congruència, laqual fa possible conèixer el grau en què els oients considerenadequat o inadequat l’ús de cadascun d’aquests contorns quans’inserixen en un determinat context discursiu. En totes duestasques, l’anàlisi de les respostes d’identificació es complementaamb el de les mesures de temps de reacció, pel fet que aquestesmesures són útils per investigar la categorialitat d’una diferènciaen entonació. Malgrat que la diferència percebuda entre els dostipus de declaratives no pot ser explicada exclusivament per

143
diferències de camp tonal, els resultats d’aquest primer estudimostren un contrast fonològic clar entre ‘IFS’ i ‘CEQ’.
Així, atesos els resultats del capítol 2, el capítol 3 examina lapercepció del contrast entre ‘IFS’ i ‘CEQ’ amb una exploracióelectrofisiològica de l’activitat cerebral. Diferents estudis hanindicat que els correlats i tonals que marquen distincions lèxiquespoden ser representades en la memòria sensorial auditivapreatencional emprant el potencial evocat cerebral (ERP, event-related potential) de la negativitat de disparitat (MMN, mismatchnegativity). En aquest estudi examinem si els contrastosintracategorials i intercategorials entre IFS i CEQ d’una llenguaentonativa com el català també provoquen patrons d’activitatneurofisiològica diferents, la qual cosa indica la codificacióautomàtica d’aquests contrastos entonatius en el còrtex auditiu. Amés, aquest resultat evidencia que el processament cerebral delscontrastos entonatius funciona de manera similar al delscontrastos segmentals.
Com que les declaratives i interrogatives es produïen en lacomunicació cara a cara, poden anar associades amb uns gestosfacials determinats, com ara moviments del cap i de les celles. Enel nostre tercer estudi (capítol 4) analitzem una altra qüestióirresolta en el camp de la prosòdia audiovisual: com interactuenels indicis acústics i visuals en la percepció d’aquesta diferènciapragmàtica. Encara que la majoria d’estudis sobre prosòdiaaudiovisual han descrit un mode complementari de processamenten el qual la visió proporciona una informació feble i relativamentredundant si es compara amb la que proporcionen els indicisacústics, d’altres treballs troben el patró invers. En aquest capítolprenem en consideració el camp tonal i els gestos facials en ladistinció entre ‘CFS’ i ‘CEQ’. Vam sintetitzar diferents realitzacionsacústiques i gestuals d’aquests dos significats mitjançant unatècnica de transformació digital d’imatges. Després, elsparticipants van realitzar dues tasques d’identificació multimodalen què se’ls presentaven combinacions congruents i incongruents

144
dels materials audiovisuals i se’ls demanava que els classifiquessencom a realitzacions possibles de ‘CFS’ i ‘CEQ’.
En el nostre darrer estudi (capítol 5) aprofundim en l’anàlisi dela percepció audiovisual de la interrogativitat, però aquest copcomparant declaratives de focus informatiu (IFS) i interrogativesde cerca d’informació (ISQ), les quals representen els tipus neutresd’ambdós significats pragmàtics. Vam utilitzar un entorn naturalper obtenir una sèrie de declaratives i interrogatives, el joc Qui ésqui?. Basats en aquests materials, els participants van realitzarunes tasques d’identificació unimodal i multimodal (aquest copnomés emprant combinacions audiovisuals congruents). Aquestametodologia ens permet conèixer com es vehicula lainterrogativitat tant en la producció com en la percepció de laparla. Aquesta investigació compara les estratègies emprades perpart de parlants de català i de neerlandès. Mentre ambduesllengües empren l’entonació per al marcatge de la interrogativitat,el neerlandès també compta amb la inversió sintàctica per a talpropòsit, raó per la qual comparem neerlandès i català en aquestestudi. Aquesta tasca ens permet avaluar si els participantsd’ambdues llengües poden diferenciar declaratives i interrogativesneutres unimodalment i multimodalment, així com identificarquins són els elements acústics i gestuals més emprats per marcaraquesta distinció en la producció i en la percepció (la inversiósintàctica quan està disponible, contorns entonatius ascendents,presència de mirada, aixecament de celles), i si aquestesestratègies interactuen en el procés d’identificació d’una oraciócom a interrogativa que fan els participants.
Una característica que cal subratllar de la nostra metodologiaés l’enfocament multimodal de l’estudi de la interrogativitat.Molts estudis tradicionals han obviat el component no verbal de ladistinció declarativa/interrogativa i s’han centrat principalmenten els marcatges sintàctic, morfològic i entonatiu. Hi ha tambépoca recerca que tinga en compte més d’una estratègia alhora ique explique la seua interacció potencial com a propietatsmobilitzadores de resposta (v. Stivers & Rossano 2010).

145
Una segona característica que cal emfasitzar és la varietat demetodologies experimentals utilitzades al llarg de la tesi, que tenial’objectiu d’assegurar la ‘validesa ecològica’ dels resultats. Pel quefa als experiments de producció, hem recollit dades a través deTests de Compleció de Discurs, àmpliament emprats en la recercaen pragmàtica (Kasper & Dahl 1991, Cohen 1996, Billmyer &Varghese 2000, Golato 2006, Nurani 2009) i jocs, com el Qui és qui?,específicament adaptats per obtenir produccions espontànies dedeterminades categories discursives (Ahmad et al. 2011). Pel que faals experiments de percepció, hem emprat diferents provesconductuals, d’identificació i de congruència (unimodals omultimodals, binomials o multinomials), de les quals hem analitzattant les respostes com els temps de reacció, i hem realitzat unaexploració electrofisiològica a través de potencials evocatscerebrals mitjançant un paradigma de disparitat (Näätänen 2001).


147
Appendix 2
Discussió general i conclusions en català
6.1. L’estatus fonològic del camp tonal
Un dels objectius principals de la tesi era descriure el paper delcamp tonal en l’expressió de la interrogativitat. En català, lamateixa seqüència de tons baixos i alts en el si d’una configuraciónuclear tonal pot expressar tres significats pragmàtics diferentsdepenent de les característiques del seu camp tonal: unadeclarativa de focus informatiu (IFS), una declarativa de focuscontrastiu (CFS), i una interrogativa antiexpectativa (CEQ). Atèsaquest triple contrast, s’han dut a terme diferents experiments peresbrinar si la diferència existent entre aquests tres significats esvehicula de manera categòrica mitjançant el camp tonal.
La investigació del paper del camp tonal s’emmarca en el modelMètric i Autosegmental de l’anàlisi de la prosòdia, que pren com aassumpció central que només es necessiten dos tons, baix (L) i alt(H), per distingir categories entonatives en una llengua coml’anglès. En aquest sentit, el paper del camp tonal ha estat sovintrelegat a l’expressió de diferències d’èmfasi o prominència(Pierrehumbert 1980, Beckman & Pierrehumbert 1986).Tanmateix, diferents treballs sobre llengües romàniques igermàniques han demostrat que la variació en camp tonal potexpressar diferències categòriques de significat (Hirschberg &Ward 1992, Ladd & Morton 1997, Savino & Grice 2011, Vanrell2011), i alguns autors han suggerit que l’enfocament mètric iautosegmental ha de marcar explícitament aquesta propietat enels sistemes de transcripció prosòdica fonològica (Ladd 1994, Face2011). Els capítols 2 i 3 s’han dedicat a investigar el paper fonològicdel camp tonal en català.
El capítol 2 ha presentat dos experiments conductuals en quèels participants havien de decidir entre tres possibles respostes

148
(IFS, CFS, CEQ) quan se’ls presentava amb una sèrie d’estímuls quepertanyien a un contínuum acústic de camp tonal. Hem analitzatles respostes i els temps de reacció d’aquests dos experiments. Enel primer experiment, els participants havien d’identificar quinsignificat atribuïen a cada estímul presentat aïlladament; en elsegon, havien d’avaluar el grau de congruència o adequaciópercebut per a cada estímul quan es presentava en un contextdiscursiu típic per a cadascun dels tres significats possibles. Enambdós experiments, els participants van associar IFS i CEQ ambels extrems inicial i final del contínuum de camp tonal,respectivament, mentre que el CFS va ser associat menysnítidament a un camp tonal específic i va ser percebut de manerasemblant a l’IFS.
Pel que fa als patrons de temps de reacció, el primerexperiment va mostrar un pic clar en la frontera acústicapercebuda entre ‘CEQ’ i els altres dos tipus d’oracions declaratives(IFS i CFS). En canvi, en el segon experiment només es va obtenirun pic de temps de reacció per a ‘IFS’ i ‘CEQ’, però no per a ‘CFS’.Seguint Chen (2003), si un pic de temps de reacció localitzat a unafrontera d’identificació indica la que un contrast és caregorial, nopodem defensar que les decisions dels participants sobrel’adequació i la inadequació de les oracions CFS presentades encontext estiguen distribuïdes categòricament pel que fa al camptonal.
Per tant, els resultats del capítol 2 demostren que els contornsque presenten un camp tonal induïxen interpretacions IFS, mentreque els contorns amb un camp tonal més ampli comporteninterpretacions CEQ. Pel que fa al CFS, en canvi, es mostra comaquest significat es comporta aproximadament com l’IFS pel que faals valors del camp tonal. L’experiment de congruència mostra queno hi ha un pic de temps de reacció entre les respostes ‘adequat’ i‘inadequat’ que es van donar per al context de CFS, la qual cosasignifica que aquestes dues respostes no estan divididescategòricament per part dels oients catalans, i indica, de retruc,que el paper del camp tonal en el marcatge del CFS és més aviat un

149
fenomen gradual. El comportament semblant a l’IFS i l’absènciad’un pic d’RT pot ser, aleshores, interpretat de la manera següent:el camp tonal distingix un CFS d’un IFS de manera gradual.Defensem que la detecció d’una oració com a representant d’unCFS pot estar relacionada en una major mesura amb un procésd’inferència pragmàtica, tal que l’oient entén CFS quan, en unaconversa normal, s’ha afegit informació que contrasta amb lainformació precedent. Finalment, el parlant pot marcar l’estatuscorrectiu d’aquella oració amb estratègies morfosintàctiques comla dislocació i la compressió tonal postfocal.
El capítol 3 ha presentat dos experiments que pretenienmostrar que la categorialitat percebuda entre IFS i CEQ —segonsels resultats del capítol 2— té un correlat electrofisiològic. Elsestudis electrofisiològics previs sobre contrastos fonològicssegmentals i contrastos tonals (aquells provinents de llengüestonals) han evidenciat que els contrastos fonològics existents en lallengua nativa provoquen respostes MMN significativament mésgrans que els mateixos contrastos no nadius (Näätänen et al. 1997,Gandour 1994). Alhora, també han mostrat que els contrastosacústics que traspassen una frontera entre categories comportenrespostes MMN més grans que aquells que no creuen aquestesfronteres (Dehaene-Lambertz 1997, Chandrasekaran et al. 2007).Aquests resultats no havien estat obtinguts per als contrastosentonatius fins ara. Doherty et al. (2004) i Leitman et al. (2009)defensaven que el MMN més gran elicitat pels estímulsinterrogatius (i no pas pels estímuls declaratius) “podria estardemostrant l’habilitat de les oracions interrogatives de captarautomàticament l’atenció fins i tot quan la informació declarativaprecedent ha estat ignorada” (Leitman et al. 2009: 289). Fournier etal. (2010) defensava, a part, que el reconeixement de significatsdiscursius mitjançant l’entonació no era necessàriament clarobservant el cervell humà.
Primer, els resultats presentats en el capítol 3 repliquen elsresultats del capítol 2. En un primer experiment d’identificació, esva trobar una identificació clarament no monotònica del contrast

150
entre IFS i CEQ, així com temps de reacció més ràpids per a laidentificació d’exemplars intracategorials que per a exemplarsinterpretats de manera més ambigua. En el segon experiment delcapítol 3, es troba una amplitud mitjana d’MMN més gran per alcontrast intercategorial que per als intracategorials. Amb això, sesuggerix que els contrastos entonatius de la llengua poden sercodificats automàticament en el còrtex auditiu. A més, els nostresresultats mostren que l’activació d’aquestes representacionsentonatives del còrtex auditiu està relacionada amb la percepció il’actuació subjectiva dels individus (és a dir, que s’obtenia unacorrelació significativa entre les respostes electrofisiològiques i lesmesures conductuals obtingudes en el primer experiment, tantper individus com pel que fa a la mitjana general de les dades).Així, els nostres resultats proporcionen evidènciaelectrofisiològica que els contrastos fonològics entonatius (basatsen una diferència de camp tonal) també són codificats en el còrtexauditiu, la qual cosa es relaciona amb un conjunt de resultatsempírics que demostren una activació més gran de traces dememòria per a elements lingüístics en el cervell humà.
Els capítols 2 i 3 mostren que la variació en camp tonal ésl’indici principal que els oients de català empren per discriminarentre IFS i CEQ, és a dir, que hi ha un límit al llarg d’un contínuumde camp tonal per damunt del qual interpretem consistentmentun significat CEQ. Aquest contrast en camp tonal entreinterrogatives i declaratives també s’ha documentat per a altresllengües romàniques (Savino & Grice 2011 per a l’italià de Bari,Roseano et al. 2011 per al friülà, Estebas-Vilaplana & Prieto 2010per al castellà peninsular, etc.) així com per a llengües noromàniques.
Aquests resultats indiquen que un sistema fiable per a latranscripció prosòdica d’aquestes llengües —almenys per alcatalà— ha de poder assenyalar la distinció entre els patrons IFS(L+H*) i els patrons CEQ (L+¡H*) (Aguilar et al. 2009 per al català).En aquest sentit, i seguint el treball recent de Vanrell (2011), esproposa la inclusió d’un to com [L+¡H*] (amb el diacrític d’augment

151
de l’altura tonal) per expandir l’inventari disponible de contrastosfonològics entre accents tonals. És a dir, que passen a ser tres elstons fonològicament diferents disponibles en el sistema detranscripció entonativa del català: L, H, i ¡H.
6.2. Interacció entre variables prosòdiques i gestuals en elprocessament oracional
L’objectiu principal dels capítols 4 i 5 era entendre la interaccióentre variables acústiques i visuals en la percepció lingüística de lainterrogativitat. En el capítol 4, hem investigat la importància delcamp tonal dels accents tonals i dels gestos facials en la percepciódel contrast entre CFS i CEQ a través d’estímuls multimodalscongruents i incongruents.
La qüestió principal que s’havia de respondre en el capítol 4 eraen quina mesura les variables gestuals podien ser centrals en lacodificació de la distinció lingüísticament rellevant entre CFS iCEQ. En els dos experiments d’identificació inclosos en el capítol,una sèrie de materials audiovisuals congruents i incongruents esva presentar a un grup d’oients nadius de català. L’anàlisi de lesseues respostes demostra una clara preferència pels indicis visualsa l’hora de decidir entre les interpretacions CFS i CEQ, mentre queel contrast entonatiu basat en el camp tonal acaba exercint unpaper secundari i de reforç. Els resultats també indiquen que, enalgunes circumstàncies, els gestos facials poden actuar com avehiculadors d’interpretació prosòdica i que competixen amb elsindicis prosòdics, la qual cosa sembla contradir parcialment elsresultats de nombrosos estudis en prosòdia audiovisual quetrobaven un efecte merament complementari dels indicis visuals(Krahmer et al. 2002, Swerts & Krahmer 2004, Srinivasan &Massaro 2003, House 2002, Dohen & Lœvenbruck 2009, i d’altres).
Val la pena mencionar que mentre que a nivell segmental s’hanobservat clars efectes d’integració audiovisual, sobretot des de lapublicació de l’estudi de McGurk & MacDonald (1976). Aquest

152
estudi clàssic mostrava que, quan els oients adults d’anglèsescoltaven [ba] a l’hora que veien els moviments labialscorresponents a [ga], percebien [da] de resultes, una seqüènciainicialment inexistent en els materials proporcionats alsparticipants. Tot i això, quan els mateixos subjectes escoltaven oveien els mateixos materials unimodalment, percebien tant [ba]com [ga], respectivament. Els nostres resultats estan relacionatsamb l’efecte McGurk en tant que ambdues modalitats, l’acústica ila visual, competixen i interactuen en les decisions dels nostresparticipants, però diferixen de l’efecte McGurk més ‘clàssic’ en elfet que no obtenim una categoria intermèdia entre les declarativesi interrogatives contrastades.
Un altre resultat interessant dels dos experiments del capítol 4és que el paper de la informació acústica és més fort quan lainformació visual és particularment ambigua, cosa que suggerixun patró d’integració audiovisual. Això significa que quan alsparticipants se’ls mostraven exemplars no gaire clars de gestosCFS i CEQ, la seua dependència en la informació acústicaaugmentava. Un altre estudi complementari, que empravamaterials sintètics i que comparava la percepció del contrast entreIFS i CEQ en català (Borràs-Comes et al. 2011), proporcionaevidència addicional per al patró observat ací. En aquell estudi, ladependència en els indicis acústics augmentava generalment quanaquests es presentaven simultàniament amb una configuraciófacial IFS, i decreixia quan es presentaven amb una configuraciófacial CEQ. Com seria d’esperar, com que l’IFS és un tipus neutre dedeclarativa i la CEQ és un tipus marcat d’interrogativa, elsparticipants depenien més fortament dels gestos facials de les CEQque dels gestos pràcticament inexistents de les IFS.
Per un altre cantó, quan les propietats gestuals i entonativessón igual de prominents, els oients tendixen a basar les seuesresposts tant en els senyals acústics com en els visuals d’unamanera més equilibrada. El suport per a aquesta explicació ve de ladistinció entre IFS i CFS en català central, també mitjançant l’úsd’avatars (Prieto et al. 2011). La diferència trobada entre IFS i CFS

153
es basava tant en una activació gradual del camp tonal com en laforça de l’activació de dos gestos concrets: l’avançament del cap il’aixecament de les celles. Com que ambdues modalitatsmostraven una distinció gradual i igualment prominent pel que faal contrast lingüístic estudiat (IFS vs. CFS), es va trobar un úsequilibrat de les variables acústiques i visuals en la identificació deles dues categories (si ens centrem en els correlats gestuals, amb elmoviment del cap representant un correlat més clar que l’elevacióde les celles per a la identificació de CFS).
Aquesta interpretació compensatòria està lligada als resultatsde Crespo-Sendra (2011) sobre la percepció audiovisual delcontrast entre IFS i CEQ en català valencià i neerlandès. Mentreque les característiques facials d’ambdós significats són similarsals que proporcionats en aquesta tesi, hi havia una clara diferènciaentre les dues llengües pel que fa al marcatge entonatiu: mentreque el català valencià marca la distinció entre els dos tipusd’interrogatives amb una diferència d’altura tonal aplicada a lamateixa configuració tonal ascendent (L* H%; transcrita L* HH%segons el sistema Cat_ToBI i L*H H% segons el sistema ToDI), elneerlandès empra dos contorns clarament diferenciats perdistingir entre els dos significats (L* H% per a ISQ, i L+H* LH% pera CEQ). Quan els dos grups de parlants van ser presentats ambcombinacions congruents i incongruents d’aquells materialsaudiovisuals, els parlants de català valencià depeniensignificativament més en les variables visuals, mentre que elsparlants de neerlandès mostraven un efecte més equilibrat entreles dues variables.
6.3. El rol de les variables verbals i no verbals en la deteccióde les interrogatives
En el capítol 5 s’ha explorat la importància relativa de diferentstipus de tons de frontera, de la mirada i de l’aixecament de lescelles en la percepció del contrast entre IFS i ISQ en dos tipus de

154
llengües: el neerlandès, que exhibix una estratègia sintàctica per almarcatge interrogatiu (la inversió subjecte/verb), i el català, queno compta amb aquesta estratègia. Els resultats del nostreexperiment de percepció mostren que tant els participantsneerlandesos com els catalans poden identificar interrogatives ideclaratives per sobre del nivell d’atzar en totes les condicions depresentació. Més concretament, mostren una dependència mésgran en la informació acústica, però també una millor precisió enles respostes d’identificació quan la informació visual s’afegix al’acústica.
Aquest patró de resultats està parcialment en contradicció ambel proporcionat en el capítol 4. Quan els participants havien dedistingir entre IFS i ISQ —tipus no marcats de declaratives id’interrogatives, respecticament— mostraven una dependènciamés gran en la informació acústica que en la informació visual(encara que una presentació només visual dels materials tambécomportava una identificació significativament bona). En líniaamb el que s’ha mencionat abans, suggerim que aquests resultatss’expliquen per les característiques específiques dels indicisacústics i visuals analitzats en ambdós capítols.
Pel que fa al contrast entre CFS i CEQ (capítol 4), la informacióvisual dels dos patrons facials era molt diferent l’una de l’altra,ambdues caracteritzades per moviments prominents del cap i deles celles (avançament o endarreriment del cap i aixecament ofrunziment de les celles), i les característiques acústiques —encaraque representen in contrast fonològic en la fonologia entonativadel català (v. capítols 2 i 3)— estan basades en una única diferènciaen el camp tonal del contorn entonatiu. En canvi, en el contrastentre IFS i ISQ (capítol 5), la informació visual que caracteritzaaquesta diferència és perceptivament menys prominent i estàdeterminada únicament per la presència o absència d’una solapropietat, la mirada, el rol de la qual millorava si se li afegia unmoviment ascendent de celles; la informació acústica, però, estavabasada en una de les dicotomies més interlingüístiques de lesllengües entonatives pel que fa al marcatge interrogatiu, la

155
distinció ascendent vs. descendent en el marc del to de frontera, ifins i tot en diferències sintàctiques quan estaven disponibles.
En aquest sentit, es pot defensar que la diferència trobada en elpes perceptiu de la informació auditiva i visual en aquests doscapítols està especialment lligada a la prominència perceptivaexpressada per aquests indicis. Per exemple, la diferència entredos tipus de contorns descendents (fins i tot si mostren unadiferència pel que fa al camp tonal) serà menys prominent quel’existent entre un contorn descendent i un d’ascendent.Altrament, la diferència que hi ha entre tenir les celles aixecades ofrunzides serà més prominent que la diferència entre unes cellesaixecades i la seua configuració per defecte.
El que és especialment interessant del capítol 5 és que, en el sid’una única modalitat, també es troben efectes d’interacció comels que s’han trobat trobats entre els indicis acústics i visuals.Encara que en els nostres materials en neerlandès no hi havia capISQ produïda sense inversió subjecte/verb, els participantsneerlandesos van classificar les oracions SV produïdes amb unaentonació final ascendent igualment com a exemplarsd’interrogatives. Aquesta preferència per les interpretacionsinterrogatives, en canvi, no es produïa si l’entonació ascendenthavia estat aplicada a una estructura (sintàcticament marcada) VS,cosa que suggerix un pes jeràrquic de les variables que tenimdisponibles en la nostra detecció de la interrogativitat. Finalment,obteníem el mateix resultat si comparàvem la mirada ambl’entonació, tant en neerlandès com en català; és a dir, que lapresència de mirada augmentava significativament lesinterpretacions interrogatives dels enunciats, però només si anavaacompanyada d’un contorn descendent.
Aquest resultat està en relació amb investigacions recents sobreel paper dels indicis verbals i no verbals com a elementsmobilitzadors de resposta realitzats a través de l’anàlisi de corpusde parla espontània. Stivers & Rossano (2010) concloïen que “unapetició (o un oferiment o una petició d’informació) és alta pel quefa a la rellevància que té proporcionar-hi una resposta, però que

156
una petició dissenyada ‘directament’ (p. ex., amb morfosintaxi i/oprosòdia interrogatives) serà encara més alta [pel que fa a larellevància de donar-hi una resposta]. Similarment, una valoració(o un avís o un anunci) serà baix pel que fa a la rellevància d’unaresposta. Tanmateix, si se l’acompanya d’uns quants elementsmobilitzadors de resposta, això incrementarà la rellevància d’unaresposta per a tal acció” (Stivers & Rossano 2010: 27–28).
Aquest principi de rellevància de resposta pren en consideracióel rol de la “morfosintaxi i/o prosòdia interrogatives” en el llocmés alt de la jerarquia, però també pren en consideració l’efecteincremental d’altres indicis disponibles. Stivers & Rossano (2010)trobaven tant per a l’anglès com per a l’italà que no hi havia cappropietat que estigués sempre present en tots els casos en quès’havia obtingut una resposta, de manera que concloïen que no hiha cap element que siga intrínsec a l’acte de demanar informació.A més, concloïen que l’ús d’un major nombre d’elementsmobilitzadors de resposta incrementava la rellevància d’unaresposta per a una determinada acció. De fet, quan nosaltresanalitzem els resultats de percepció AV del capítol 5, trobem unacorrelació positiva entre la concentració d’indicis interrogatius enuna oració i l’avaluació d’aquesta oració com a interrogativa, per atotes dues llengües. Aquest patró de resultats suggerix —almenyssi tenim en compte les dades del neerlandès i del català— lajerarquia següent dels diferents indicis per al marcatgeinterrogatiu SINTAXI > ENTONACIÓ > MIRADA (CELLES).
En resum, aquesta tesi ha proporcionat resultats que sónrellevants per a la qüestió de la interacció entre indicis auditius ifacials en la percepció d’una oració com a declarativa ointerrogativa, fet que suggerix, en darrera instància, la relació ambconceptes com pes jeràrquic. Els resultats presentats ací permetenun millor coneixement de la comunicació humana i del paper queexercixen els gestos facials i les propietats entonatives dinsd’aquest sistema, especialment el camp tonal.