groundwater and seeps remedy 60% design submittal
TRANSCRIPT

Groundwater and Seeps Remedy 60% Design Submittal Chemours Fayetteville Works
Prepared for
The Chemours Company FC, LLC 22828 NC Highway 87 Fayetteville, NC 28306
Prepared by
Geosyntec Consultants of NC, P.C. 2501 Blue Ridge Road, Suite 430 Raleigh, NC 27607 GEOServices, LLC 5559 North Lee Highway Cleveland, TN 37312
Geosyntec Project Number TR0795
August 2021
DocuSign Envelope ID: FD27F770-FF7C-4777-A2A6-A4923ABD4DD0

TR0795 i Aug-2021
Table of Contents
Executive Summary ................................................................................................................ES-1
1. Introduction and Objectives ................................................................................................1
1.1 Report Organization ................................................................................................... 3
1.2 Report Appendices ..................................................................................................... 4
1.3 Design Progression from 60% to 90% ....................................................................... 4
2. Background, Remedy Objectives and Overview .................................................................5
2.1 Site Background ......................................................................................................... 5 2.1.1 Site Geology and Hydrogeology ................................................................ 6
2.2 Remedy Objectives .................................................................................................... 7
2.3 Remedy Overview...................................................................................................... 8
3. Groundwater Interception Remedy Design .......................................................................11
3.1 Groundwater Interception Basis of Design .............................................................. 11 3.1.1 Summary of Pre-Design Investigation Report ......................................... 11 3.1.2 Groundwater Flow Model ........................................................................ 13 3.1.3 Groundwater Model – Remedy Development ......................................... 14
3.2 Groundwater Interception Design Elements ............................................................ 17 3.2.1 Groundwater Extraction System Design .................................................. 17 3.2.2 Groundwater Conveyance System Design ............................................... 18 3.2.3 Barrier Wall Design ................................................................................. 19 3.2.4 Constructability Considerations ............................................................... 19
4. Seeps A and B Ex-Situ Capture Remedy Design ..............................................................20
4.1 Seep Capture Basis of Design .................................................................................. 20
4.2 Seep Ex-Situ Capture Design ................................................................................... 21
5. Groundwater Treatment Design ........................................................................................22
5.1 Groundwater Treatment Basis of Design ................................................................. 22
5.2 Groundwater Treatment Design ............................................................................... 24
6. Permits ...............................................................................................................................26
6.1 NPDES Permit ......................................................................................................... 26
6.2 401/404 Permit ......................................................................................................... 27
6.3 Other Permits ........................................................................................................... 27
7. Performance Monitoring ...................................................................................................27
8. Operations and Maintenance .............................................................................................28
DocuSign Envelope ID: FD27F770-FF7C-4777-A2A6-A4923ABD4DD0

TR0795 ii Aug-2021
9. Adaptive Management .......................................................................................................28
10. Schedule ............................................................................................................................29
11. Summary and Closing .......................................................................................................30
12. References .........................................................................................................................31
DocuSign Envelope ID: FD27F770-FF7C-4777-A2A6-A4923ABD4DD0
TR0795 iii Aug-2021
List of Tables
Table 1 Summary of Attachments and Objectives Table 2 Hydraulic Loading of Representative Groundwater and Seep Sources Table 3 Influent Design Basis for the Groundwater Treatment System
List of Figures
Figure 1 Site Location Map Figure 2 Remedy Layout Overview Figure 3 Geologic Cross Section Figure 4 Model Particle Tracing Results Figure 5 Seep Channel Design Figure 6 GWTP Water Balance Figure 7 Proposed Project Schedule
List of Appendices
Appendix A Pre-Design Investigation Report Appendix B Groundwater Flow Model Report Appendix C Barrier Wall Design Report Appendix D Groundwater Extraction and Conveyance System Design Report Appendix E Seep Flow at Barrier Wall Memo Appendix F Seep Ex-Situ Capture Remedy Design Report Appendix G DEQ E-mail & Engineering Report – Treatment of Groundwater and Upgradient
Seeps Water
DocuSign Envelope ID: FD27F770-FF7C-4777-A2A6-A4923ABD4DD0

TR0795 iv Aug-2021
Acronyms and Abbreviations
3D three-dimensional
CAP Corrective Action Plan
CFRW Cape Fear River Watch
COA Consent Order Addendum
cm/s centimeters per second
E&SC Erosion and Sediment Control
FEMA Federal Emergency Management Agency
ft feet
GAC granular activated carbon
gpm gallons per minute
GWTP groundwater treatment plant
HFPO-DA hexafluoropropylene oxide dimer acid
IXM Ion Exchange Membranes
m meter
mg/L milligrams per liter
NC North Carolina
NCDEQ North Carolina Department of Environmental Quality
NPDES National Pollutant Discharge Elimination System
O&M Operations and Maintenance
Pc capillary pressure
PDI Pre-Design Investigation
PFAS per- and polyfluoroalkyl substances
PFMOAA perfluoro-1-methoxyacetic acid
PMP Project Monitoring Plan
PMPA perfluoro-2-methoxypropanoic acid
PPA Polymers Processing Area
PVC polyvinyl chloride
DocuSign Envelope ID: FD27F770-FF7C-4777-A2A6-A4923ABD4DD0
TR0795 v Aug-2021
PVF polyvinyl fluoride
Sw wetting phase saturation
UCC Upper Cape Fear Confining Unit
UCFA Upper Cape Fear Aquifer
USACE United States Army Corps of Engineers
DocuSign Envelope ID: FD27F770-FF7C-4777-A2A6-A4923ABD4DD0
TR0795 vi Aug-2021
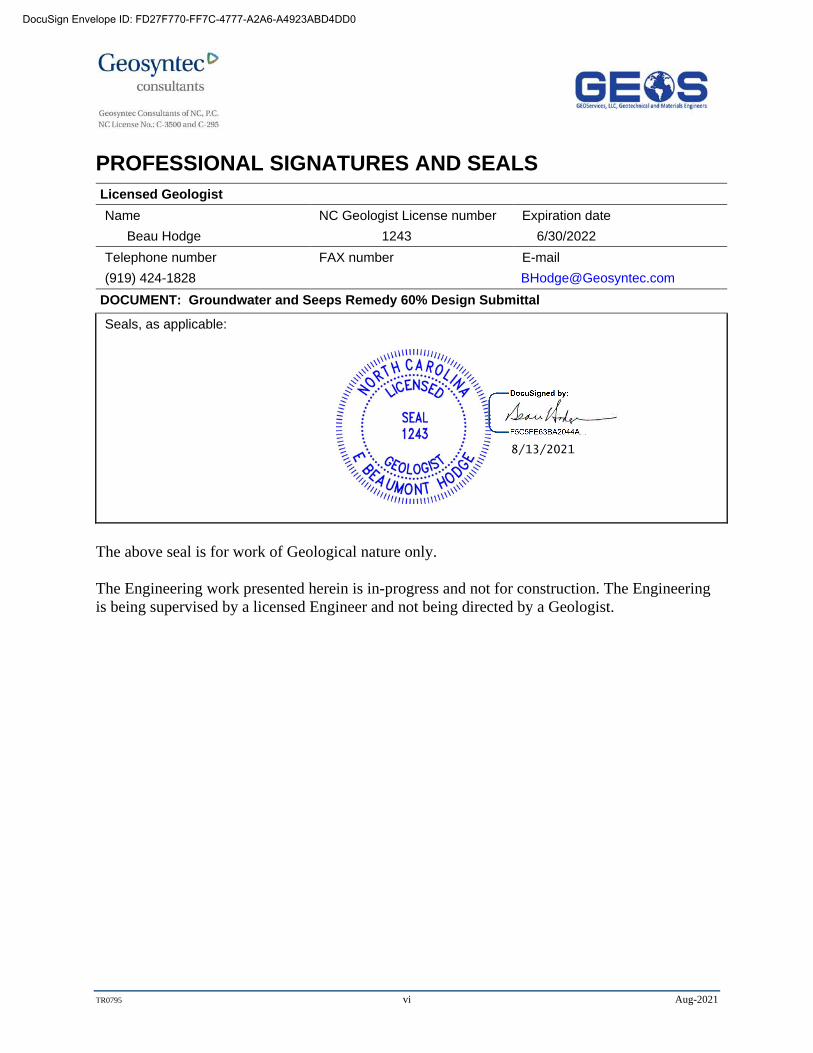
PROFESSIONAL SIGNATURES AND SEALS Licensed Geologist Name NC Geologist License number Expiration date Beau Hodge 1243 6/30/2022 Telephone number FAX number E-mail (919) 424-1828 [email protected]
DOCUMENT: Groundwater and Seeps Remedy 60% Design Submittal
Seals, as applicable:
The above seal is for work of Geological nature only. The Engineering work presented herein is in-progress and not for construction. The Engineering is being supervised by a licensed Engineer and not being directed by a Geologist.
DocuSign Envelope ID: FD27F770-FF7C-4777-A2A6-A4923ABD4DD0
8/13/2021
TR0795 ES-1 Aug-2021
Executive Summary
This 60% Design report, prepared by Geosyntec Consultants of NC, P.C. (Geosyntec) and GEOServices, LLC (GEOServices) for The Chemours Company FC, LLC (Chemours), describes the components of the remedial action being designed for implementation at the Site pursuant to the requirements of paragraph 3(b) of the Consent Order Paragraph 12 Addendum (COA) among Chemours, the North Carolina Department of Environmental Quality (NCDEQ), and Cape Fear River Watch (CFRW).
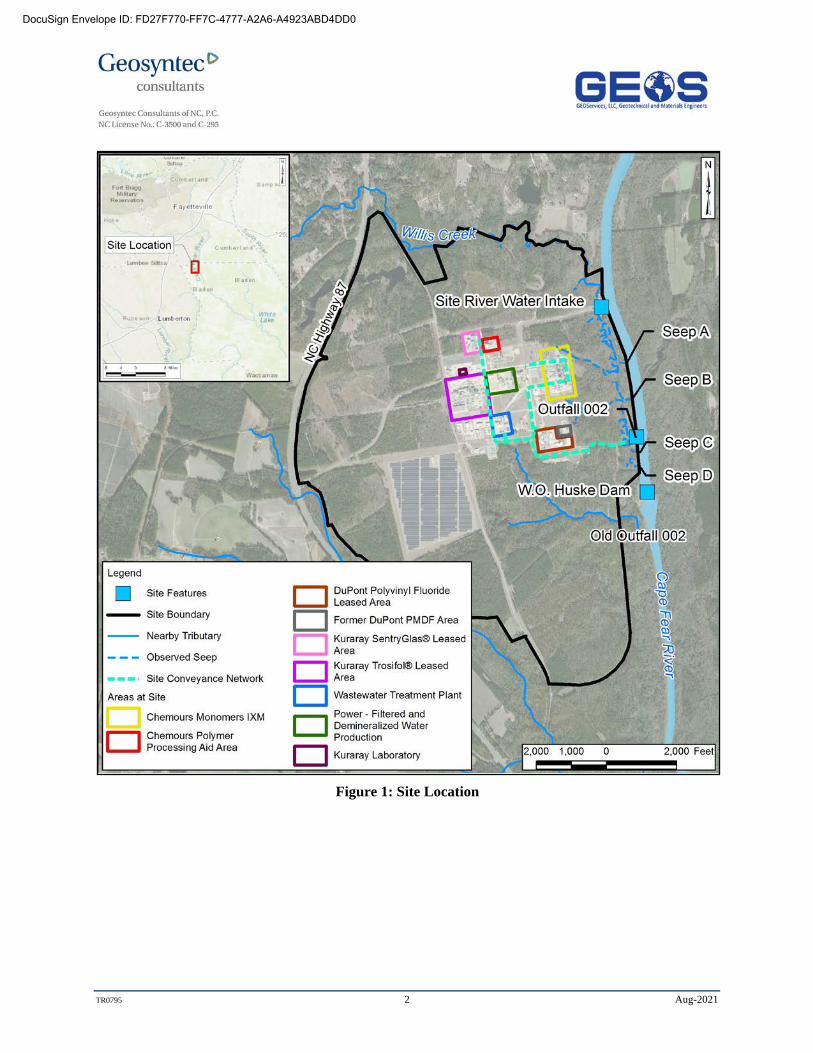
The Site is an active manufacturing facility and is located approximately 20 miles southeast of the city of Fayetteville along the Bladen-Cumberland county line in North Carolina. The Site is bounded by NC Highway 87 to the west, the Cape Fear River to the east, and on the north and south by forested areas, farmland and private residences. The Site’s manufacturing areas are located on relatively flat ground and are separated from the Cape Fear River by a relatively steep bluff face which descends over 100 feet down to the Cape Fear River with multiple aquifer units intersecting along the bluff face (see Figure ES1). The Site is located within the North Carolina Coastal Plain Hydrogeologic region. Site hydrogeology consists of three water bearing units:
• The Perched Zone: Uppermost unconfined hydrostratigraphic unit in the vicinity of the Site. Water from the perched zone migrates radially to the bluff face at the Site where it is expressed as groundwater fed seeps that then discharge to the Cape Fear River and it also migrates downwards to the surficial aquifer.
• The Surficial Aquifer: directly underlies the Perched Zone and constitutes the surface water table. Surficial aquifer groundwater discharges to the bluff face at the Site as groundwater fed seeps and then enters the Cape Fear River.
• The Black Creek Aquifer is separated from the Surficial Aquifer by the Black Creek confining unit. The Black Creek Aquifer is a delta plain deposit with lateral variability in grain size and transmissivity with the northern areas at the Site having finer grain sizes and lower transmissivity. Black Creek Aquifer groundwater discharges as both groundwater feed seeps at the toe of the bluff face near the Cape Fear River and directly into the Cape Fear River.
The remedy described in this report will control groundwater in both the Surficial and Black Creek Aquifers and the seeps that form from discharge of water at the bluff face (Seeps A, B, C and D).
The COA provides that Chemours shall proceed with the design and the installation of a barrier wall and groundwater extraction and treatment system to reduce per- and polyfluoroalkyl substances (PFAS) loading from groundwater flow from under the Facility to the Cape Fear River and Willis Creek. Similarly, the COA also outlines the objectives for a long-term seep remedy. The objective of the long-term seep remedy is to reduce the total annual mass loading of PFAS (as measured by the indicator parameters hexafluoropropylene oxide dimer acid [HFPO-DA],
DocuSign Envelope ID: FD27F770-FF7C-4777-A2A6-A4923ABD4DD0
TR0795 ES-2 Aug-2021
perfluoro-2-methoxypropanoic acid [PMPA] and perfluoro-1-methoxyacetic acid [PFMOAA]) to the Cape Fear River from Seeps A through D.
The remedy objectives outlined in the COA results in a remedy design with three components:
• The groundwater interception remedy
• The Seeps A and B ex-situ capture remedy
• The groundwater treatment plant
The groundwater interception remedy contains three key elements: (i) an underground barrier wall to create a vertical low permeability barrier to reduce the transmission of groundwater, (ii) a groundwater extraction system consisting of extraction wells in the Surficial and Black Creek aquifers, and (iii) a groundwater conveyance system to convey that groundwater to the treatment system (see Figure ES1). The seeps ex-situ capture remedy design consists of two seep capture locations where seep flow intersects the barrier wall alignment at Seep A and Seep B. The design uses impoundment and pumping systems along with equalization basins to accommodate dry weather flows and stormwater flows from rainfall events up to 0.5 inches over 24 hours. Last, the captured water is then conveyed to the groundwater treatment plant (GWTP) which is being designed to treat continuous maximum flow rates up to 1,500 gallons per minute (gpm) of water and to remove 99% of indicator parameters.
DocuSign Envelope ID: FD27F770-FF7C-4777-A2A6-A4923ABD4DD0

TR0795 ES-3 Aug-2021
Figure ES1: Remedy Layout Overview
DocuSign Envelope ID: FD27F770-FF7C-4777-A2A6-A4923ABD4DD0
TR0795 1 Aug-2021
1. Introduction and Objectives
Geosyntec Consultants of NC, P.C. (Geosyntec) and GEOServices, LLC (GEOServices) have prepared this 60% Design Report for The Chemours Company, FC, LLC (Chemours) Fayetteville Works facility in Bladen County, North Carolina (Figure 1, the Site). This report describes the components of the remedial action that is being designed for implementation at the Site. This report is submitted pursuant to the requirements of paragraph 3(b) of the Consent Order Paragraph 12 Addendum hereafter referred to as the Consent Order Addendum (COA) among Chemours, the North Carolina Department of Environmental Quality (NCDEQ), and Cape Fear River Watch (CFRW). The COA requires Chemours to proceed with the design and installation of a barrier wall and groundwater extraction and treatment system to reduce per- and polyfluoroalkyl substances (PFAS) loading from groundwater flow from under the Facility to the Cape Fear River and Willis Creek. The objective of this report is to present the 60% design of the remedy for NCDEQ review and subsequent approval.
The design concepts presented are expected to remain consistent between this report and the constructed remedy. However, some elements may be refined further in the COA required 90% design submittal. The designs are also subject to change based on permitting input provided by the appropriate regulatory agencies or conditions encountered during installation.
DocuSign Envelope ID: FD27F770-FF7C-4777-A2A6-A4923ABD4DD0
TR0795 2 Aug-2021
Figure 1: Site Location
DocuSign Envelope ID: FD27F770-FF7C-4777-A2A6-A4923ABD4DD0

TR0795 3 Aug-2021
1.1 Report Organization
The remainder of this document is organized as follows:
• Section 2 – Background, Remedy Objectives and Overview describes the overarching objectives of the remedy, a description of the Site, Site geologic and an outline of the remedy design.
• Section 3 – Groundwater Interception Remedy Design describes the basis of design and 60% design for the groundwater interception remedy comprised of an underground barrier wall, groundwater extraction wells and conveyance system.
• Section 4 – Seeps A and B Ex-Situ Capture Remedy Design describes the design of the seeps ex-situ capture systems to be located along the barrier wall.
• Section 5 – Groundwater Treatment Design describes the basis of design for the groundwater treatment plant as well as the specific components of the treatment train.
• Section 6 – Permits describes the permit submissions for National Pollutant Discharge Elimination System (NPDES), United States Army Corps of Engineers (USACE)/NCDEQ Clean Water Act Section 404 Permit and 401 Certification, and Bladen County permits for land disturbance and electrical connection.
• Section 7 – Performance Monitoring describes the development of a performance monitoring plan which will outline the methods by which the remedy effectiveness will be monitored.
• Section 8 – Contingency Planning describes the contingencies that are being incorporated as part of the design resiliency and flexibility.
• Section 9 – Schedule describes the timelines for the remedy design, installation and commissioning and COA milestone dates.
• Section 10 – Summary and Closing provides a summary of this design report.
DocuSign Envelope ID: FD27F770-FF7C-4777-A2A6-A4923ABD4DD0
TR0795 4 Aug-2021
1.2 Report Appendices
This report is accompanied by a series of appendices which provide the basis of design and 60% design details for the remedy components described in in Sections 2 through 5 of this report. The report appendices are listed below in Table 1.
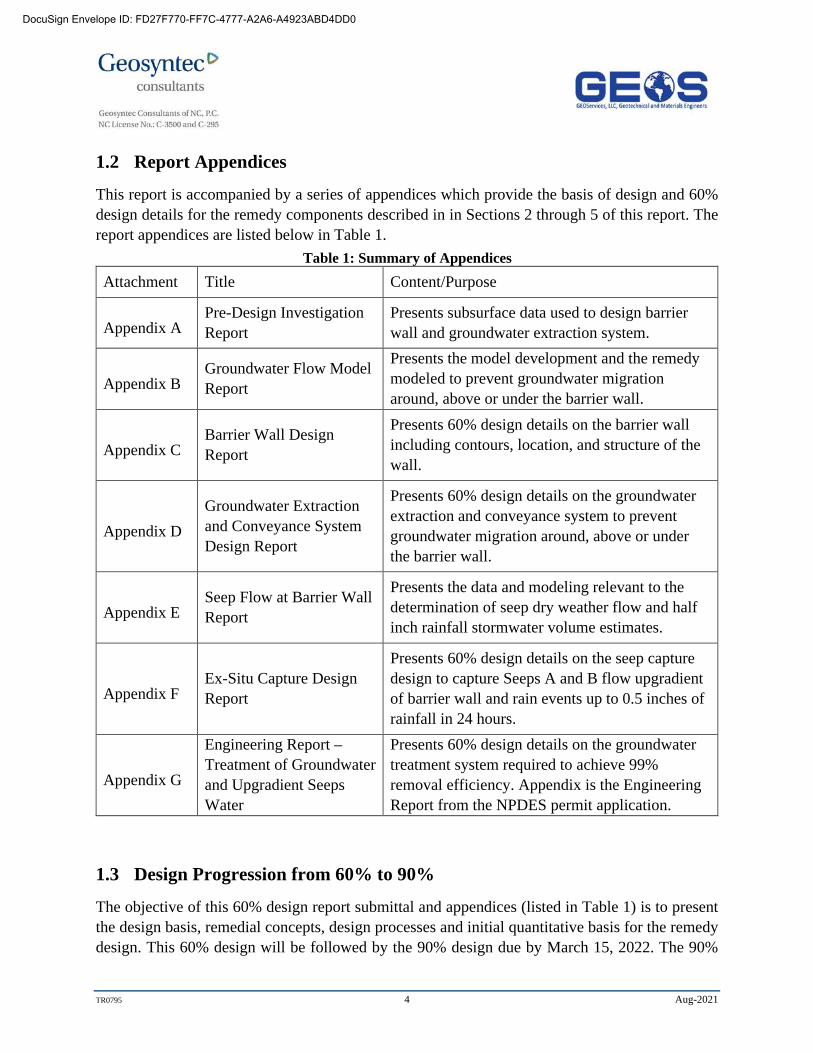
Table 1: Summary of Appendices Attachment Title Content/Purpose
Appendix A Pre-Design Investigation Report
Presents subsurface data used to design barrier wall and groundwater extraction system.
Appendix B Groundwater Flow Model Report
Presents the model development and the remedy modeled to prevent groundwater migration around, above or under the barrier wall.
Appendix C Barrier Wall Design Report
Presents 60% design details on the barrier wall including contours, location, and structure of the wall.
Appendix D Groundwater Extraction and Conveyance System Design Report
Presents 60% design details on the groundwater extraction and conveyance system to prevent groundwater migration around, above or under the barrier wall.
Appendix E Seep Flow at Barrier Wall Report
Presents the data and modeling relevant to the determination of seep dry weather flow and half inch rainfall stormwater volume estimates.
Appendix F Ex-Situ Capture Design Report
Presents 60% design details on the seep capture design to capture Seeps A and B flow upgradient of barrier wall and rain events up to 0.5 inches of rainfall in 24 hours.
Appendix G
Engineering Report – Treatment of Groundwater and Upgradient Seeps Water
Presents 60% design details on the groundwater treatment system required to achieve 99% removal efficiency. Appendix is the Engineering Report from the NPDES permit application.
1.3 Design Progression from 60% to 90%
The objective of this 60% design report submittal and appendices (listed in Table 1) is to present the design basis, remedial concepts, design processes and initial quantitative basis for the remedy design. This 60% design will be followed by the 90% design due by March 15, 2022. The 90%
DocuSign Envelope ID: FD27F770-FF7C-4777-A2A6-A4923ABD4DD0
TR0795 5 Aug-2021
design will propose the finalized remedy details and specifications for each design component. Chemours will be selecting a barrier wall installation contractor prior to the 90% design submittal. The two contractors at this stage have different access requirements for barrier wall installation, and therefore selection of this contractor will enable the completion of many of the final remedy details including the barrier wall roadway, barrier wall alignment, and positioning of groundwater extraction wells and conveyance system in the 90% design submittal.
2. Background, Remedy Objectives and Overview
This section provides a description of the Site location, remedy objectives and remedy overview and how remedy objectives will be fulfilled. Additional Site background details as well as Site and regional geography and geology are contained in the Corrective Action Plan (CAP; Geosyntec, 2019a), the On and Offsite Assessment Report (Geosyntec 2019b), and the Pre-Design Investigation (PDI) report (Geosyntec 2021a; Appendix A).
2.1 Site Background
The Site is located within a 2,177-acre property at 22828 North Carolina (NC) Highway 87, approximately 20 miles southeast of the city of Fayetteville along the Bladen-Cumberland county line in North Carolina. Figure 1 shown above presents the location of the Site.
The Site property was originally purchased by E.I. du Pont de Nemours and Company (DuPont) in 1970 for production of nylon strapping and elastomeric tape. DuPont sold its Butacite® and SentryGlas® manufacturing units to Kuraray America Inc. (Kuraray) in June 2014 and subsequently separated its specialty chemicals business, with Chemours becoming an independent operator in July 2015. The manufacturing area is approximately 312 acres, and the remaining areas are grassy areas, forests and wetlands. Presently, the Site consists of five manufacturing areas (Figure 1): Chemours Monomers Ion Exchange Membranes (IXM); Chemours Polymer Processing Aid (PPA); Kuraray Butacite®; Kuraray SentryGlas®; and DuPont Company polyvinyl fluoride (PVF) resin manufacturing unit. In addition to the manufacturing operations, Chemours operates two natural gas-fired boilers, a wastewater treatment plant for the treatment of sanitary wastewaters as well as process wastewaters from Kuraray and DuPont, and a thermal oxidizer for treatment of air emissions.
The Site is bounded by NC Highway 87 to the west, Cape Fear River to the east, and on the north and south by forested areas, farmland and private residences. Cumberland and Bladen County zoning maps indicate that the surrounding areas are zoned as residential, agricultural, conservation, industrial or commercial.
DocuSign Envelope ID: FD27F770-FF7C-4777-A2A6-A4923ABD4DD0
TR0795 6 Aug-2021
2.1.1 Site Geology and Hydrogeology
The Site is located within the North Carolina Coastal Plain Hydrogeologic region. Site and regional geology consist of four primary units in stratigraphic order from bottom to top; the Cretaceous Cape Fear formation (the oldest formation), the Cretaceous Black Creek formation, the Surficial Aquifer, and younger sediments along the Cape Fear River, designated as floodplain deposits. This section summarizes the geology and hydrogeology of the Site. A more detailed discussion of the site-specific geology and hydrogeology is presented in the PDI report (Geosyntec 2021a; Appendix A) as well as the CAP (Geosyntec, 2019a).
Geology
The four primary units listed in order of age (oldest to youngest; deepest to most shallow) are described below.
The Upper Cape Fear formation consists of an overlying confining unit (the UCC), the Upper Cape Fear Aquifer (UCFA), the Lower Cape Fear Confining Unit, and the Lower Cape Fear Aquifer. The depositional environment is interpreted to have been either a marginal marine or deltaic consisting of interbedded clays and sand. The clay beds are typically pale to medium gray which is consistent with clay beds identified in the base of onsite borings along the groundwater remedy alignment. Clay strata are up to 8 feet (ft) in thickness. The sands are either massive or poorly cross-bedded and commonly contain clay clasts. Sands range from fine to very coarse grained (Sohl & Owens, 1991).
The Tar Heel formation of the Black Creek Group overlies the Cape Fear unconformably and consists of the Black Creek Aquifer and the Black Creek Confining Unit. In the area of the Site, the Tar Heel formation is interpreted to be a delta plain depositional environment. Horizontal beds of black carbonaceous clays are interbedded with sands. Wood is especially common in these facies, with silicified logs present (petrified wood). The deltaic sequences generally have a mixture of higher energy channel sands and lower energy mud flats typical of transgressive and regressive sequences of sea water levels.
The Varina Grove unit of early Pleistocene age unconformably overlies the Black Creek group and in previous reports was designated the Surficial Aquifer. The Varina Grove unit consists of sands, very fine to fine grained, silty and clayey, grading downward through fine to medium to medium to coarse to very coarse-grained sands. The sands and clay are generally dark grayish orange and/or dark yellow brown. They are interpreted as terrace deposits. As the uppermost unconfined unit, this will continue to be designated as the Surficial Aquifer. The overlying Perched Zone is interpreted to be the result of a topographically isolated clay unit (Perched Zone Clay) from this unit.
DocuSign Envelope ID: FD27F770-FF7C-4777-A2A6-A4923ABD4DD0

TR0795 7 Aug-2021
The flood plain deposits are presented on the surficial geological map to be older alluvium of the late Pleistocene age. Deposits are described as gravel, with rounded to sub-rounded quartz clasts up to the 6 cm in diameter in a silty quartose. Color is typically dark grayish orange.
Hydrogeology
The sediments at Site give rise to three water bearing units from shallowest to deepest
• The Perched Zone: Uppermost unconfined hydrostratigraphic unit in the vicinity of the Site and is created by a topographically isolated bed of clay associated with the Varina Grove unit.
• The Surficial Aquifer: directly underlies the Perched Zone and constitutes the surface water table and follows the surface topography where the perched clay is not laterally present.
• The Black Creek Aquifer is separated from the Surficial Aquifer by the Black Creek confining unit, which consists of dark gray to black organic-rich clay. The Black Creek Aquifer is associated with the Black Creek Formation. The Black Creek Aquifer is interpreted to have a delta plain depositional area. The lateral variability and changing energy conditions expected of a delta plain is supported by the varying yield and thickness observed during the PDI. Monitoring wells installed along Willis Creek showed a significant thinning of Black Creek Aquifer material (Geosyntec 2021a; Appendix A).
2.2 Remedy Objectives
The COA states in Paragraph 3(b) that “Chemours shall proceed with the design and the installation of a barrier wall and groundwater extraction and treatment system to reduce PFAS loading from groundwater flow from under the Facility to the Cape Fear River and Willis Creek”. The schedule associated with Paragraph 3(b) outlines a submission date of August 15, 2021 for the 60% design of the barrier wall and extraction system and March 31, 2022 for the 90% design of the barrier wall and extraction system; and construction completion and commencement of operations by March 15, 2023.
In Paragraph 3(b)(i) and (ii) of the COA, objectives for the groundwater interception remedy are outlined:
• “Reduce PFAS loading from groundwater flow from under the Facility to the Cape Fear River and Willis Creek.”
• “Chemours shall construct a barrier wall located between the facility and the Cape Fear River and Willis Creek that is designed and constructed to intercept the groundwater flow under the Facility... It is understood that the precise contours, locations, and structure of the barrier wall will be determined as part of the design.“
DocuSign Envelope ID: FD27F770-FF7C-4777-A2A6-A4923ABD4DD0

TR0795 8 Aug-2021
• “Chemours shall construct an extraction system consisting of an adequate number of wells and/or interceptor trenches to pump groundwater at a rate and depth sufficient to prevent groundwater migration around, above, or under the barrier wall.”
• “The system shall be designed so that extracted groundwater shall be treated through a treatment system that removes PFAS compounds (as measured by the three indicator parameters [HFPO-DA1, PMPA2, and PFMOAA3]) at a minimum removal efficiency of 99%.”
Similarly, in Paragraph 2(c) of the COA, objectives for the long-term seep remedy are outlined. The primary objective of the long-term seep remedy is to reduce the total annual mass loading of PFAS (as measured by the indicator parameters) to the Cape Fear River from Seeps A through D as follows:
• During dry weather, reduce total mass loading by at least 99%.
• During dry weather and following rain events of 0.5 inches or less, reduce total mass loading by at least 95%.
• For seep water that daylights from Seeps A, B, C or D upgradient of the Barrier Wall, capture total dry weather flow plus rain events up to 0.5 inches in a 24-hour period upgradient of the Barrier Wall.
In order to address the groundwater and seep objectives, pre-design investigation and assessment activities were conducted as described in Section 3.1 and multiple design efforts are being advanced as described in Section 2.3.
2.3 Remedy Overview
The remedy objectives outlined in Paragraph 2(c) and 3(b) of the COA results in a remedy design with three components:
• The groundwater interception remedy
• The Seeps A and B ex-situ capture remedy
• The groundwater treatment plant
The first component listed above, the groundwater interception remedy, contains three key elements: an underground barrier wall to create a vertical low permeability barrier to reduce the transmission of groundwater, a groundwater extraction system consisting of extraction wells in the
1 HFPO-DA: hexafluoropropylene oxide dimer 2 PMPA: perfluoro-2-methoxypropanoic acid 3 PFMOAA: perfluoro-1-methoxyacetic acid
DocuSign Envelope ID: FD27F770-FF7C-4777-A2A6-A4923ABD4DD0

TR0795 9 Aug-2021
Surficial and Black Creek aquifers, and a groundwater conveyance system to convey that groundwater to the treatment system. Figure 2 provides an overview of the groundwater interception remedy. The barrier wall design extends from the facility water intake access road at the northern barrier wall extent to the old Outfall Channel on the southern extent. The extraction system design consists of 64 wells: 54 in the black creek aquifer and 10 in the surficial aquifer. This extraction well network and conveyance system are designed to be installed upgradient of the barrier wall and extend from Willis Creek at the north to the old Outfall Channel at the south. As described later in Section 3, modeling results indicate this remedy will intercept groundwater migrating to both Willis Creek and the Cape Fear River along the length of the remedy and control groundwater from going around, above, or under the barrier wall.
Next, the seeps ex-situ capture remedy design consists of two capture locations where the seep flow intersects the barrier wall alignment at Seep A and Seep B. The seep capture locations are shown in Figure 2 above. The design uses impoundment and pumping systems installed along with an equalization basin to accommodate dry weather flows and stormwater flows from rainfall events up to 0.5 inches over 24 hours.
Last, the captured water is then conveyed to the groundwater treatment plant (GWTP). The GWTP is being designed to treat maximum continuous flow rates up to 1,500 gallons per minute (gpm) of water from the seeps ex-situ capture remedy and the groundwater remedy. Groundwater treatment will include pre-treatment followed by granular activated carbon (GAC) to remove 99% of indicator parameters.
DocuSign Envelope ID: FD27F770-FF7C-4777-A2A6-A4923ABD4DD0

TR0795 10 Aug-2021
Figure 2: Remedy Layout Overview
DocuSign Envelope ID: FD27F770-FF7C-4777-A2A6-A4923ABD4DD0

TR0795 11 Aug-2021
3. Groundwater Interception Remedy Design
This section provides a summary of the basis of design elements which includes a summary of the PDI findings and of the groundwater flow model results. This is followed by a summary of the design elements of the groundwater interception remedy, including the groundwater extraction wells, the groundwater conveyance system, and the barrier wall.
3.1 Groundwater Interception Basis of Design
3.1.1 Summary of Pre-Design Investigation Report
The PDI was conducted between 2020 Q3 and 2021 Q2. The objective of the PDI was to collect additional subsurface geological and hydrogeological data relevant to the design of the proposed barrier wall and groundwater extraction system, such that the remedies would be able to achieve the remedial objectives outlined in the COA and described above in Section 2.2. Version 1 of the PDI Report was submitted to NCDEQ on March 24, 2021 based on pre-design data collected in 2020 Q3 and Q4. Version 2 of the PDI Report was submitted to NCDEQ on June 29, 2021 following additional investigations conducted in 2021 Q1 and Q2. Version 2 is included as Appendix A of this report. The main findings from the PDI that inform the design of the groundwater remedy are described below.
Site geology is highly variable along the groundwater remedy alignment. Consistent with the interpretation of a deltaic depositional environment, the Black Creek aquifer along the alignment is a mixture of high energy channel sands and lower energy mud flats. Geosyntec prepared a high-resolution cross section along the groundwater remedy alignment using a combination of data collected during the PDI and previous investigations (Figure 3). Three distinct sections of the groundwater remedy alignment are described as follows:
• The southern portion (0 to 3,000 ft on cross section) of the alignment where Black Creek aquifer soils are similar to the central portion of the alignment but are also hydraulically influenced by the Old Outfall.
• The central portion (3,000 to 7,500 ft on cross section) of the alignment where Black Creek aquifer soils are dominated by higher-energy channel sands and correlates to the locations of a majority of the seeps.
• The northern portion (7,500 to 8,500 ft on cross section) of the alignment adjacent to Willis Creek where Black Creek aquifer soils are dominated by more fine-grained materials indicative of a transition to a low-energy depositional environment.
DocuSign Envelope ID: FD27F770-FF7C-4777-A2A6-A4923ABD4DD0

TR0795 12 Aug-2021
DocuSign Envelope ID: FD27F770-FF7C-4777-A2A6-A4923ABD4DD0
TR0795 13 Aug-2021
Analytical results from surface water samples in Willis Creek, adjacent groundwater samples from monitoring wells MW-11 through MW-15, and the passive flux meters (PFMs) results provide multiple lines of evidence that Table 3+ PFAS flux is considerably lower along Willis Creek than those locations along the Cape Fear River
Aquifer properties are variable across the site. The northern portion of the proposed groundwater remedy alignment near Willis Creek is characterized by lower extraction yields compared to extraction wells further south. Extraction well EW-1, which is located adjacent to the road down to the river intake station, yields approximately 5 gpm during step testing relative to a range of 25-30 gpm at EW-5 near seep B. The variability in extraction rates is a function of finer aquifer materials and thinner transmissive units in the northern portion of the alignment.
The depth of the top of the UCC varies horizontally, present at shallower depths at the northern extent of the proposed barrier wall alignment as compared to the south. Seepage modeling indicates that at a key-in depth of 5 ft is suitable to control groundwater migration beneath the wall.
The data collected as part of the PDI informed remedy design in several ways. First, the PDI increased resolution on Table 3+ PFAS concentrations and flux to inform loading in groundwater along the proposed alignment. It allowed for improved estimation of aquifer transmissivity and storativity and zones of influence to inform extraction well design. The investigation also improved the characterization of soil properties to inform soil bearing capacity, design permeability performance criteria, and roadway stability. Last, the investigations provided an assessment of the depth of the top of the UCC to establish barrier wall depths along the proposed alignment.
3.1.2 Groundwater Flow Model
A three-dimensional (3D) transient-state finite element numerical groundwater flow model was developed to simulate groundwater flow at the site and allow for testing the effectiveness of different remedial scenarios. The model has been refined from the original model developed during preparation of the CAP (Geosyntec, 2019a) to evaluate the groundwater flow pathways at the Site under current conditions. Refinements in the model incorporate modification of the layer characteristics to match field observations and the results of the step-drawdown and constant-rate tests from the PDI.
The model was constructed in FEFLOW® version 7.2 (DHI-WASY), which incorporates the Richards’ equation, the conservation of mass, and nonlinear relationships between capillary pressure (Pc) and wetting phase saturation (Sw) and between Sw and K to solve for hydraulic heads. The model was constructed using field-observed parameters, which were interpolated to approximate aquifer conditions across the model domain and assumed to be representative in between measured locations.
DocuSign Envelope ID: FD27F770-FF7C-4777-A2A6-A4923ABD4DD0
TR0795 14 Aug-2021
The model domain covers an area approximately 72,690,473 square ft (2.61 square miles). The model uses 7 hydrostratigraphic units to represent, from surface downward, the Floodplain deposits, Perched Zone, Perched Clay, Surficial Aquifer, Black Creek Confining unit, Black Creek Aquifer, and Upper Cape Fear Confining unit. The model varies in thickness from about 170 ft near the plant to 55 ft at the base of the bluff adjacent to the Cape Fear River.
Updates were applied to the 3D groundwater flow model to incorporate the PDI data collected at the Site in 2020. The new data including soil borings, hydraulic conductivity (i.e. from the aquifer tests), and groundwater velocities were incorporated into the groundwater flow model. The 3D groundwater model was calibrated to groundwater conditions and measurements observed from 2018 to 2020.
The 3D flow model was calibrated to 139 Site Wells: 60 wells in the perched zone, 32 wells in the Surficial Aquifer and 47 wells in the Black Creek Aquifer. The calibration results and statistics show the flow model is well calibrated, based on a reasonable agreement between the observed and calculated heads and flows. A model is considered to be well calibrated when the normalized root mean square (NRMS) is below 10%. The RMS for the Surficial aquifer was 5.65 ft; the NRMS was 6.4% and the RMS for the Black Creek Aquifer was 4.58 ft; the NRMS was 5.2%. At the conclusion of the PDI, the flow model was considered adequately calibrated and field verified to properly evaluate different remedial simulations. Detailed information regarding the model construction, and calibration is presented in Appendix B.
3.1.3 Groundwater Model – Remedy Development
In order to aid in designing the remedy as described in the Paragraph 3 of the COA, the 3D numerical groundwater model developed in FEFLOW® was used to evaluate the hydraulic response to a barrier and changes to hydraulic gradients after the remedy is constructed. The groundwater model scenarios evaluated included:
• Scenario #1: Baseline condition calibration
• Scenario #2: Vertical Barrier Only
• Scenario #3: Hydraulic Barrier Only
• Scenario #4: Optimized Scenario
These model scenarios allowed for an evaluation of ambient conditions versus the groundwater interception remedy components individually then combined. Two approaches were utilized to assess remedial alternatives. Particle tracking was used to assess the strengths and weaknesses along the remedy alignment. Particle tracking was incorporated to display flow direction between the Site and Cape Fear River under ambient conditions and after the addition of the vertical barrier and the groundwater extraction system. After assessing performance of each of the remedial
DocuSign Envelope ID: FD27F770-FF7C-4777-A2A6-A4923ABD4DD0
TR0795 15 Aug-2021
components, an optimized remedial scenario was developed that supports the strengths of each approach. Figure 4 on the next page illustrates particle tracking without the remedy in place. A second illustration shows how the combination of a 0.5-meter (m) thick barrier wall from the river intake structure south to the Old Outfall along with a total of 64 extraction wells controls particle transport from reaching Willis Creek and the Cape Fear River. The independent use of groundwater extraction in the northern portion of the alignment controls particle transport while the central and southern portions, where aquifer transmissivity is higher, a barrier wall is needed in addition to groundwater extraction to control particle transport.
DocuSign Envelope ID: FD27F770-FF7C-4777-A2A6-A4923ABD4DD0

TR0795 16 Aug-2021
DocuSign Envelope ID: FD27F770-FF7C-4777-A2A6-A4923ABD4DD0

TR0795A 17 Aug-2021
Based on the groundwater model results, Scenario 4 was selected as the best option for controlling groundwater discharge to the Cape Fear River. Scenario 4 includes 64 extraction wells (10 wells located in the surficial aquifer and 54 wells located in the Black Creek aquifer) installed in conjunction with the vertical barrier wall. The scenario modeled the wells operating continuously and extracting between 5 to 35 gpm over a period of 5 years. The estimated simulated cumulative flow rates for the extraction well network is 980 gpm. The basis of design for the extraction wells systems is based on results of this three-dimensional groundwater modeling analysis (see Appendix B).
3.2 Groundwater Interception Design Elements
The groundwater interception design is comprised of the following key components (Figure 2):
• Groundwater Extraction System
• Groundwater Conveyance System
• Barrier Wall
This section provides a brief description of each of these components and then discusses constructability considerations.
3.2.1 Groundwater Extraction System Design
The groundwater extraction system design consists of 64 extraction wells (i.e., EW-01 through EW-64) installed along the barrier wall. Associated appurtenances include well vaults, well head fixtures, submersible pumps, and instrumentation.
Extraction wells will be installed to extract groundwater from the surficial and Black Creek aquifer upgradient of the barrier wall, the extraction wells are intended to be installed using sonic drilling techniques and the well construction design includes six-inch diameter stainless steel wire-wrapped well screens. Grain size sample data (Stations 5+00, 15+00, 20+00, 33+50, and 67+50) near the proposed extraction wells were evaluated to select an appropriately size filter pack and well screen slot size. Based on the analysis using methods presented by Driscoll (2008), approximately 60% of the material in the Black Creek Aquifer at each location is coarser than 0.020 in, and 90% retention is achieved when using 20-40 sand and a 0.020 slot screen or equivalent. Approximately 60% of the material in the Surficial at each location is coarser than 0.010 in in the southern half of the barrier wall alignment, and 90% retention is achieved when using 20-40 sand and a 0.010 slot screen or equivalent. Ten (10) of the extraction wells in the current design are screened in the Surficial Aquifer and fifty-four (54) wells are screened in the Black Creek Aquifer. A 20-40 graded silica sand will be used for the filter pack material that
DocuSign Envelope ID: FD27F770-FF7C-4777-A2A6-A4923ABD4DD0
TR0795A 18 Aug-2021
extends 2-3 feet above the screen unless the well design procedure described above indicates otherwise.
The wells will be enclosed in order to protect the wellhead fixtures. The extraction wells are designed to consist of 6-inch diameter Schedule 40 Polyvinyl Chloride (PVC) riser pipe set above ground surface. To accommodate installation of a submersible well pump discharge pipe, a 1-inch Schedule 40 PVC stilling tube to house a pressure transducer, a pump power cable, a steel pump support cable, and air release valve discharge tubing. The discharge from the pump is then connected to a sequence of valving and instrumentation in order to monitor system parameters.
Additionally, material compatibility for components of the system design directly in contact with the groundwater matrix at the Site is important to ensure long-term reliability during operation and has been incorporated into the design of the groundwater extraction system.
Refer to Appendix D for more details on well construction, well installation and development processes, as well as the design details on the well heads, pumps, and instrumentation.
3.2.2 Groundwater Conveyance System Design
The groundwater conveyance system design consists of two conveyance pipes, the North and South Forcemains, that connect the extraction wells to the GWTP.
The North Forcemain consists of a forcemain transitioning from 3-in to 10-in and conveys groundwater from EW-01 through EW-49 to the GWTP. The South Forcemain consists of a forcemain transitioning from 3-in to 8-in and conveys groundwater from EW-50 through EW-64 to the GWTP. Both forcemains will tie-in to each other prior to reaching an equalization tank located at the GWTP. The key design criteria used for the groundwater conveyance piping includes: (a) pipe flow velocity generally targeted in the range of 2 – 8 feet per second; (b) the design flow rate for the North Forcemain is 855 gpm; and (c) the design flow rate for the South Forcemain is 370 gpm. These design flow rates are the maximum possible yield from the aquifer for the extraction system based on the results of the numerical groundwater model. The operating flow rates are expected to be lower than the design flow rates. Based on the groundwater model, operating flow rates are expected to be 655 and 325 for the North and South Forcemains, respectively, yielding a total anticipated operating groundwater flow rate of 980 gpm.
Both forcemains were designed to accommodate additional flow rates while maintaining the velocity constraints mentioned previously. Material compatibility for components of the conveyance design in contact with the groundwater matrix at the Site has been incorporated into the design of the groundwater conveyance system. The design also includes details on pipe cleanouts, air release/vacuum breaker valves, associated fittings for the conveyance system, and the operations and control methodology. For relevant details on this design, refer to Appendix D.
DocuSign Envelope ID: FD27F770-FF7C-4777-A2A6-A4923ABD4DD0

TR0795A 19 Aug-2021
3.2.3 Barrier Wall Design
The barrier wall will provide a low permeability hydraulic barrier, impeding the flow of groundwater towards the Cape Fear River. The barrier wall design extends for approximately 6050 linear feet with an average depth of 70-80 ft below ground surface to key 5 ft deep into the Upper Cape Fear confining unit. The barrier wall extends from Outfall 003 in the southern portion of the alignment to the facility intake access road at the northern barrier wall extent. The designed alignment of the barrier wall roughly follows the contour for a 72-ft elevation between the facility and the Cape Fear River to allow construction and access above the 100-year flood level for the site. The alignment details will be finalized after the barrier wall contractor is selected. Finalized alignment details may include adjustments to the course of the alignment.
The barrier wall will be installed using one-pass wall installation method which continually mixes soil with binder along the entire wall depth. Maximum permeability and minimum wall thickness for the barrier for modeling and design is 1.0 x 10⁻⁶ centimeters per second (cm/s) and 0.5 m thick, respectively. The vertical barrier will be constructed out of a low permeability mix, which may include bentonite, site soils, and Portland cement.
Preliminary seepage modeling indicates that a minimum embedment depth of 5 ft into the Upper Cape Fear confining unit is sufficient to control exit gradients below the toe of the barrier wall to acceptable levels. Additionally, preliminary slope stability modeling of the barrier wall alignment indicates that final slopes of 3H:1V satisfy long term stability requirements but will require surface water management and maintenance to reduce the effects of erosion on access to the hydraulic barrier system once operational. Refer to Appendix C for details on the barrier wall design
3.2.4 Constructability Considerations
The design of the remedy considers resiliency needs related to severe weather/storm events. The 100-year flood plain described by the Federal Emergency Management Agency (FEMA) in this area for the Cape Fear River is at an elevation of approximately 68 ft above sea level (FEMA, 2007). The barrier wall and groundwater extraction and treatment components of the remedy will be situated above the 100-year flood plain to provide additional protection to the remedy components.
The barrier wall is planned to be installed approximately along the 72-ft elevation line. This elevation features areas with relatively flat sections between the Old Outfall 002 and the water intake plant road and provide a natural layout location to construct a barrier wall (Figure 2). However, in the northern portion of the alignment adjacent to Willis Creek the topography has much steeper natural grades. These steep grades along with the sandy soils at surface have already resulted in observed stability maintenance issues with the preliminary clearing for roadway access. Consequently, this section of the alignment poses significant challenges for the constructability and maintenance of installing a wide roadway.
DocuSign Envelope ID: FD27F770-FF7C-4777-A2A6-A4923ABD4DD0
TR0795A 20 Aug-2021
Additionally, in this northern portion of the alignment adjacent to Willis Creek, confining layers thicken and fine content increases in the Black Creek aquifer resulting in the lower transmissivity observed in the aquifer tests. Consequently, the modeling results indicate that the groundwater in this northern alignment portion can be intercepted using extraction wells alone and that a barrier wall, whose constructability would be significantly challenged, is not required. Groundwater extraction alone has shown through modeling to successfully address COA objectives (refer to Appendix B).
4. Seeps A and B Ex-Situ Capture Remedy Design
Chemours will capture and treat total dry weather base flow plus rain events up to 0.5 inches in a 24-hours period for the two seeps that daylight upgradient of the Barrier Wall. There are four onsite groundwater Seeps A, B, C, and D (Figure 3) that originate on the bluff at the facility and discharge into the Cape Fear River. Seeps C and D occur wholly down gradient of the proposed barrier wall location. Therefore, Seep A and Seep B flow rates and rain events up to 0.5 inches in a 24-hour period will be captured and treated.
The design of the system for capturing Seep flow is based on flume data collected from the site Seeps as well as stormwater calculations and hydrologic modeling. The remainder of this section describes the basis of design and the design for the seeps ex-situ capture remedy.
4.1 Seep Capture Basis of Design
Seep A and Seep B dry weather flow rates estimated by analysis of historical onsite flume data and the Stormwater flows and volumes from the drainage areas to Seep A and Seep B (upgradient of the barrier wall) were assessed based on North Carolina stormwater design guidance, in addition to the development and execution of a long-term continuous hydrologic model.
Chemours had previously installed several flumes at Seeps A and B including locations at the end of each seep, as close as practicable to the Cape Fear River, to estimate total Seep flow rates. Additionally, several other flumes were installed at various tributaries that feed the main seep channels. For the purposes of characterizing the seep flows at the barrier wall, only a subset of the flume installations were applicable. The flume locations that were used for this estimation provide a conservative estimate as they are slightly downgradient from the barrier wall intersection resulting in a larger catchment.
The results of the flume data collection and analysis indicated that during dry periods, the 95th percentile of the dry weather flow rate is 31 gpm at the Seep A intersection with the barrier wall and 130 gpm at the Seep B intersection with the barrier wall. Therefore, the total dry weather flow from Seeps A and B upgradient of the barrier wall that will require capture and treatment is 161 gpm.
DocuSign Envelope ID: FD27F770-FF7C-4777-A2A6-A4923ABD4DD0

TR0795A 21 Aug-2021
Stormwater runoff volumes were assessed, for both the Seep A and Seep B drainage areas upgradient of the barrier wall, for rain events up to 0.5 inches over a 24-hour period. Stormwater is defined as wet weather-driven flows that exclude dry weather flows (such as groundwater exfiltration or seeps).
Sizing a stormwater control measure involves calculating the volume and/or flowrate of runoff resulting from the specified design storm. Guidance from the NCDEQ Stormwater Design Manual (Manual) was followed to estimate stormwater volumes using the Simple Method for Runoff Volume based on guidance from the Manual (Part B, Calculation Guidance, Simple Method for Runoff Volume). The Simple Method is a conservative estimation, and an uncalibrated hydrologic model was run to serve as a check on the static calculation. Model stormwater volume results were lower than the Simple Method results suggesting that the Simple Method results did provide a conservative design basis.
The Simple Method estimated volume of stormwater resulting from 0.5 inches of rainfall over 24 hours was 110,000 gallons for Seep A and 46,000 gallons for Seep B. Since treatment of the captured seep flows incorporates temporary storage of captured stormwater for 24 hours (i.e., equalization), the volume is converted to a design flowrate is 108 gpm metered to the GWTP.
Therefore, the total design flow rate for the seeps ex-situ capture design is, at minimum, 269 gpm of flow with equalization and storage for rainfall events. Refer to Appendix E of this report for the entire Seep Flow at Barrier Wall memo and relevant details of the flume data and modeling.
4.2 Seep Ex-Situ Capture Design
Once the final barrier wall and groundwater extraction and conveyance system is installed, the dry weather flow for seeps A & B will be collected via a gravity system flowing from a concrete channel to an equalization basin. The concrete channel will include a small diversion weir to divert the dry weather flow into the collection structure. The flow from 0.5” rainfall events over 24 hours will be collected using a second gravity system that drains to an upper basin that will function as a detention and equalization basin. The upper basin will provide steady flow into the lower equalization basin removing large variability in the flow from the 0.5” rainfall while still capturing the rainfall event volume.
Flow from the collection system to the equalization basin will be controlled via an orifice. The orifice will be sized to allow the dry weather flow from each seep into the gravity pipe system. Flow above the dry weather flow rate will overtop the base flow diversion weir and continue to flow in the concrete channel. A second diversion weir in the channel will direct the stormwater flow up to the peak volume flow from the ½” event into the second collection structure (Figure 5). The flows to the second collection structure will be regulated by a mechanism once the 0.5” rainfall storm volume has entered the structure to protect the GWTP from receiving flows in excess of GWTP capacity.
DocuSign Envelope ID: FD27F770-FF7C-4777-A2A6-A4923ABD4DD0

TR0795A 22 Aug-2021
Figure 5: Seep Ex-situ Capture Channel Design
Each seep (A and B) will include a pump station. The pump station will provide a steady/known flow to the treatment plant via a forcemain system.
Refer to Appendix F of this report for details on the Seeps A and B ex-situ capture design.
5. Groundwater Treatment Design
The groundwater and seep flow associated with the proposed groundwater remedy will be collected and treated to 99% removal efficiency (as measured by the three indicator parameters) by physical/chemical precipitation, filtration and carbon adsorption. The treated water will exhibit a significant reduction in PFAS target compounds, in compliance with Paragraph 3 of the COA as well as with the expected NPDES permit requirements. This will reduce the impact of these pollutants in the Cape Fear River.
5.1 Groundwater Treatment Basis of Design
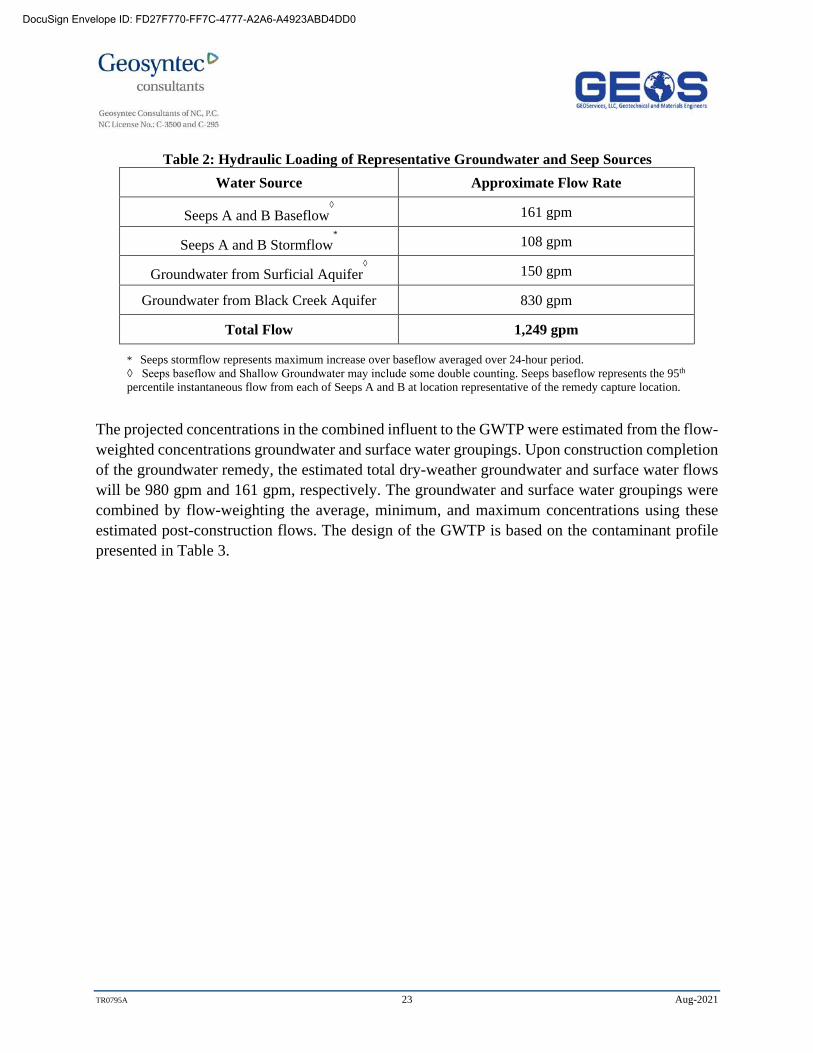
The source water to the GWTP will be the extracted groundwater and captured seep water. The estimated hydraulic loading in gpm from the two aquifers and four seeps, post remedy construction, is shown in Table 2. Note, the NPDES Permit application states 800 gpm of Black Creek Aquifer flow but after further refinement the flow is estimated to be 830 gpm. On August 12, 2021 Chemours sent an e-mail communication to DEQ informing them of this minor change. This additional flow originates from two additional groundwater wells added to the design after permit submittal. This additional flow will be treated by the GWTP which has a continuous maximum design flow rate of 1,500 gpm.
DocuSign Envelope ID: FD27F770-FF7C-4777-A2A6-A4923ABD4DD0
TR0795A 23 Aug-2021
Table 2: Hydraulic Loading of Representative Groundwater and Seep Sources Water Source Approximate Flow Rate
Seeps A and B Baseflow◊ 161 gpm
Seeps A and B Stormflow* 108 gpm
Groundwater from Surficial Aquifer◊ 150 gpm
Groundwater from Black Creek Aquifer 830 gpm
Total Flow 1,249 gpm
* Seeps stormflow represents maximum increase over baseflow averaged over 24-hour period. ◊ Seeps baseflow and Shallow Groundwater may include some double counting. Seeps baseflow represents the 95th percentile instantaneous flow from each of Seeps A and B at location representative of the remedy capture location.
The projected concentrations in the combined influent to the GWTP were estimated from the flow-weighted concentrations groundwater and surface water groupings. Upon construction completion of the groundwater remedy, the estimated total dry-weather groundwater and surface water flows will be 980 gpm and 161 gpm, respectively. The groundwater and surface water groupings were combined by flow-weighting the average, minimum, and maximum concentrations using these estimated post-construction flows. The design of the GWTP is based on the contaminant profile presented in Table 3.
DocuSign Envelope ID: FD27F770-FF7C-4777-A2A6-A4923ABD4DD0
TR0795A 24 Aug-2021
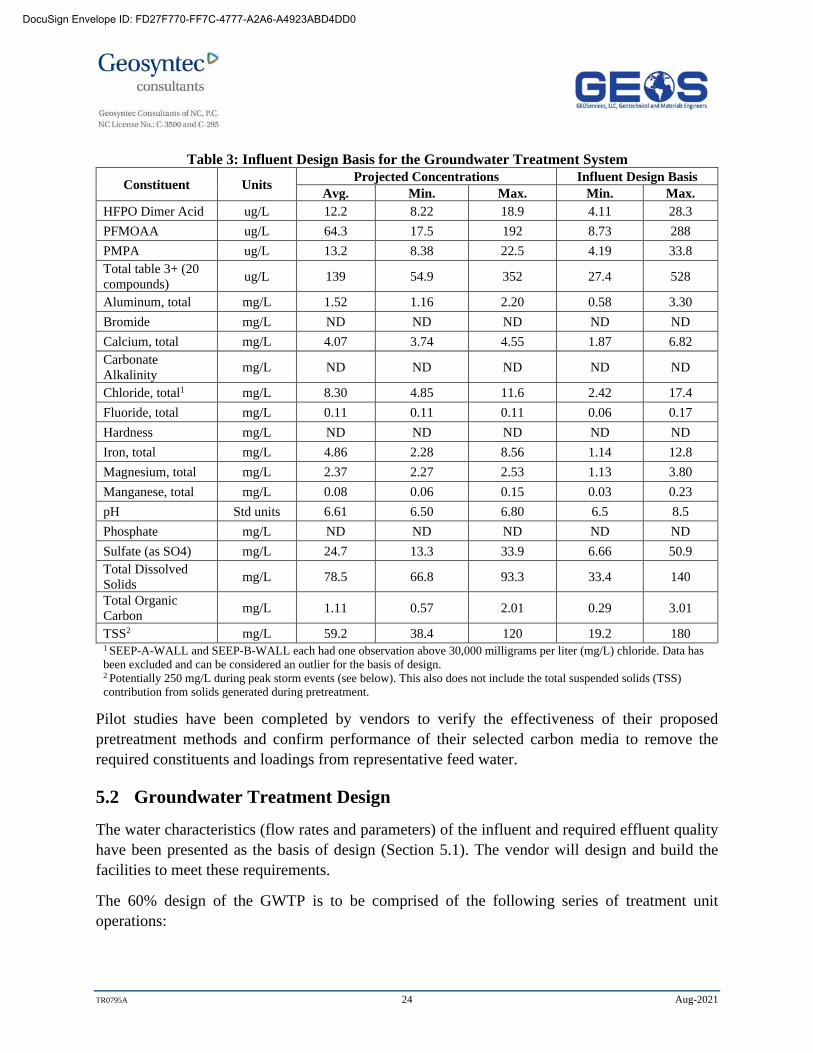
Table 3: Influent Design Basis for the Groundwater Treatment System
Constituent Units Projected Concentrations Influent Design Basis Avg. Min. Max. Min. Max.
HFPO Dimer Acid ug/L 12.2 8.22 18.9 4.11 28.3 PFMOAA ug/L 64.3 17.5 192 8.73 288 PMPA ug/L 13.2 8.38 22.5 4.19 33.8 Total table 3+ (20 compounds) ug/L 139 54.9 352 27.4 528
Aluminum, total mg/L 1.52 1.16 2.20 0.58 3.30 Bromide mg/L ND ND ND ND ND Calcium, total mg/L 4.07 3.74 4.55 1.87 6.82 Carbonate Alkalinity mg/L ND ND ND ND ND
Chloride, total1 mg/L 8.30 4.85 11.6 2.42 17.4 Fluoride, total mg/L 0.11 0.11 0.11 0.06 0.17 Hardness mg/L ND ND ND ND ND Iron, total mg/L 4.86 2.28 8.56 1.14 12.8 Magnesium, total mg/L 2.37 2.27 2.53 1.13 3.80 Manganese, total mg/L 0.08 0.06 0.15 0.03 0.23 pH Std units 6.61 6.50 6.80 6.5 8.5 Phosphate mg/L ND ND ND ND ND Sulfate (as SO4) mg/L 24.7 13.3 33.9 6.66 50.9 Total Dissolved Solids mg/L 78.5 66.8 93.3 33.4 140
Total Organic Carbon mg/L 1.11 0.57 2.01 0.29 3.01
TSS2 mg/L 59.2 38.4 120 19.2 180 1 SEEP-A-WALL and SEEP-B-WALL each had one observation above 30,000 milligrams per liter (mg/L) chloride. Data has been excluded and can be considered an outlier for the basis of design. 2 Potentially 250 mg/L during peak storm events (see below). This also does not include the total suspended solids (TSS) contribution from solids generated during pretreatment.
Pilot studies have been completed by vendors to verify the effectiveness of their proposed pretreatment methods and confirm performance of their selected carbon media to remove the required constituents and loadings from representative feed water.
5.2 Groundwater Treatment Design
The water characteristics (flow rates and parameters) of the influent and required effluent quality have been presented as the basis of design (Section 5.1). The vendor will design and build the facilities to meet these requirements.
The 60% design of the GWTP is to be comprised of the following series of treatment unit operations:
DocuSign Envelope ID: FD27F770-FF7C-4777-A2A6-A4923ABD4DD0

TR0795A 25 Aug-2021
• Metals oxidation
o One or more influent oxidation retention tanks will be selected to allow for a hydraulic retention time of 30 minutes at the peak design flow of 1,500 gpm. Multiple tanks may be configured in a duty, active-standby configuration, with the capability to take one or more tanks offline for maintenance and still process the total plant flow.
• Ultrafiltration or similar solids separation technology
o Used to remove fine solids and turbidity down to an appropriate control threshold upstream of the GAC beds, to prevent fouling and extend runtimes between carbon backwashes or media replacement. Solids retained by the filter will be backwashed to a thickening operation for further handling and disposal.
• Granular Activated Carbon (GAC) adsorption
o PFAS removal will be accomplished using GAC adsorption. Filtered effluent will be pumped from the pH adjustment tank to the GAC system and will enter three GAC adsorption trains, each designed to treat one third of the design flow (500 gpm).
• Solids Handling & Dewatering
o The thickened sludge from the bottom of the thickening operation will be pumped to a filter press or similar technology for dewatering.
• Ancillary processes for backwashing and residuals handling.
The design basis values and underlying design data, as summarized in Table 3, have been shared with prequalified water treatment vendors. Proposals have been solicited from each vendor to furnish a complete water treatment system on a turnkey basis, subject to the design criteria listed above. The turnkey, or “build own operate maintain” model selected means the system will be fully engineered, constructed, commissioned, and operated by the vendor subject to Chemours oversight.
Chemours expects to select a vendor in 2021 and will finalize design details with the vendor after selection. The selected vendor’s final design package will be shared at the 90% design submittal stage. The details on each of these treatment units in addition to operation and maintenance, and performance monitoring considerations are provided in Appendix G.
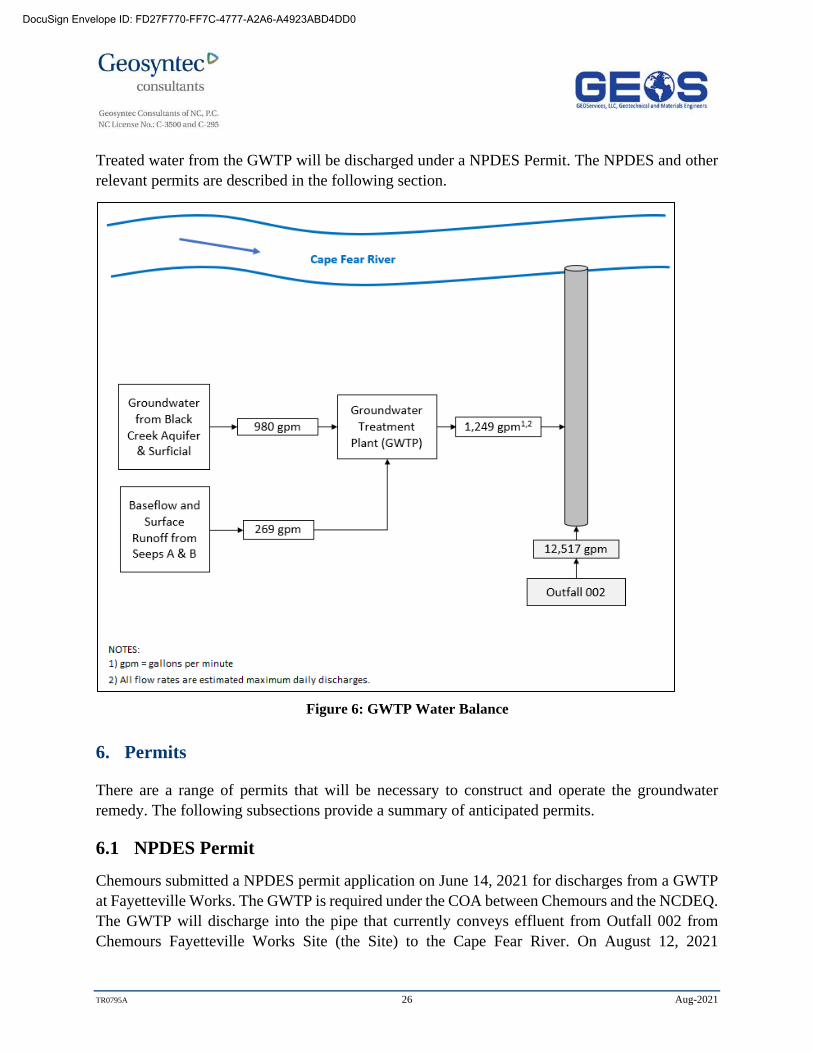
Treated groundwater and seeps water will be discharged to the same pipe which transmits the discharges from Chemours Fayetteville Site Outfall 002 to the Cape Fear River. This discharge will occur downgradient of the Outfall 002 discharge monitoring point (see Figure 6 below).
DocuSign Envelope ID: FD27F770-FF7C-4777-A2A6-A4923ABD4DD0
TR0795A 26 Aug-2021
Treated water from the GWTP will be discharged under a NPDES Permit. The NPDES and other relevant permits are described in the following section.
Figure 6: GWTP Water Balance
6. Permits
There are a range of permits that will be necessary to construct and operate the groundwater remedy. The following subsections provide a summary of anticipated permits.
6.1 NPDES Permit
Chemours submitted a NPDES permit application on June 14, 2021 for discharges from a GWTP at Fayetteville Works. The GWTP is required under the COA between Chemours and the NCDEQ. The GWTP will discharge into the pipe that currently conveys effluent from Outfall 002 from Chemours Fayetteville Works Site (the Site) to the Cape Fear River. On August 12, 2021
DocuSign Envelope ID: FD27F770-FF7C-4777-A2A6-A4923ABD4DD0
TR0795A 27 Aug-2021
Chemours sent an e-mail communication to DEQ informing them of a minor change to the flowrates.
Chemours is currently waiting for a draft of the NPDES permit from NCDEQ for review.
6.2 401/404 Permit
Chemours met with NCDEQ Water Resources Division and USACE on May 30, 2021, to perform a pre application walkdown of the Barrier Wall project. The site visit reviewed the current design and permit requirements. Based on conversations with NCDEQ and the USACE the proposed project will be a modification to the existing 401/404 permit (SAW-2019-00206) related to the interim seep remediation project. The USACE and NCDEQ requested additional information related to the groundwater and surface water drawdown/impacts.
On August 5, 2021, Chemours transmitted the groundwater and surface water drawdown/impact data to USACE along with our interpretation of the impacts related to the proposed project. Chemours is currently waiting on a review by USACE and NCDEQ. Chemours submitted a permit modification application on August 13, 2021.
6.3 Other Permits
Other permits will also be required to operate the remedy. These include land disturbance permits, Erosion and sediment control (E&SC) plans, and electrical permits. A Land Disturbance Permit under NCDEQ will be required to permit construction. That work will also be conducted in accordance with the Soil and Material Waste Management Plan prepared by Chemours on July 3, 2020 for work conducted in non-manufacturing areas of the Site. E&SC plans will be prepared in compliance with the latest 2013 updates to the Erosion and Sediment Control Planning and Design Manual and submitted to Bladen County representatives for review. A permit from Bladen County will be required for new electrical connections, which will also be subject to inspection by the electrical utility.
7. Performance Monitoring
A Performance Monitoring Plan (PMP) for the groundwater interception remedy is being prepared concurrently with the 60% and 90% design milestones in general accordance with 15A NCAC 02L.0110. Seep performance monitoring will be conducted pursuant to the Onsite Seeps Long-Term Loading Calculation Plan (Geosyntec, 2020) as required by COA paragraph 2(c)(ii). The groundwater PMP will include details on the number of monitoring locations, sampling phasing and frequency, sampling methodology, and target analytes. The development of this plan will take into account the numerous existing monitoring programs already performed at the site, including but not limited to annual groundwater monitoring; monthly groundwater sampling of a subset of
DocuSign Envelope ID: FD27F770-FF7C-4777-A2A6-A4923ABD4DD0
TR0795A 28 Aug-2021
wells; treatment efficiency as required by the NPDES permit; surface water monitoring; seeps long-term loading; and performance monitoring of the four seep flow-through cells.
As indicated in the 2019 CAP (Geosyntec, 2019a), it is anticipated that the effectiveness of the long-term groundwater remedial action will primarily be assessed through water level measurement conducted with transducers in a network of extraction wells and monitoring wells. Transducer monitoring may also be periodically supplemented with manual water levels from representative wells in target aquifers. Water level data will be used to monitor temporal and spatial variations in hydraulic gradient magnitudes and direction to demonstrate hydraulic containment. If necessary, the numerical groundwater model may be employed to perform a flow path analysis using measured water levels with particle tracking to demonstrate hydraulic capture. Additional lines of evidence could potentially include PFMs to evaluate post-remediation groundwater velocity and Table 3+ PFAS flux, as compared to PFMs deployed in the PDI phase.
8. Operations and Maintenance
The remedy components will require routine operation and maintenance (O&M) to ensure operation as designed. Draft O&M Plans will be prepared for the remedy components prior to their startup and then refined based on lessons learned from commissioning. The O&M Plans will describe routine preventative maintenance activities where appropriate, as well as conditions that may result in additional non-routine action. The O&M Plan will also include operating manuals and specifications of installed components for operator reference, checklists to support the routine inspection and logging remedy components, and checklists to track maintenance activities and instrument calibrations as needed.
9. Adaptive Management
A remedy on the scale described herein is infrequently implemented. In addition, considering the physical location of the Site, potential challenges, uncertainties, and changed conditions may be encountered during remedial construction, operation, and maintenance. Accordingly, as best practice in any engineering design and to the extent reasonable and practicable, contingency elements have been factored into the design. These factors include elements such as ensuring that the GWTP unit operations have the capacity to treat additional groundwater or seeps water if needed. Additionally, the groundwater extraction and conveyance components, including pumps with variable frequency drives and controls capacity, have built-in capacity to accommodate additional extraction wells and the associated flow, if needed in the future. Further adaptive management details will be described in the 90% design submittal.
DocuSign Envelope ID: FD27F770-FF7C-4777-A2A6-A4923ABD4DD0
TR0795A 29 Aug-2021
10. Schedule
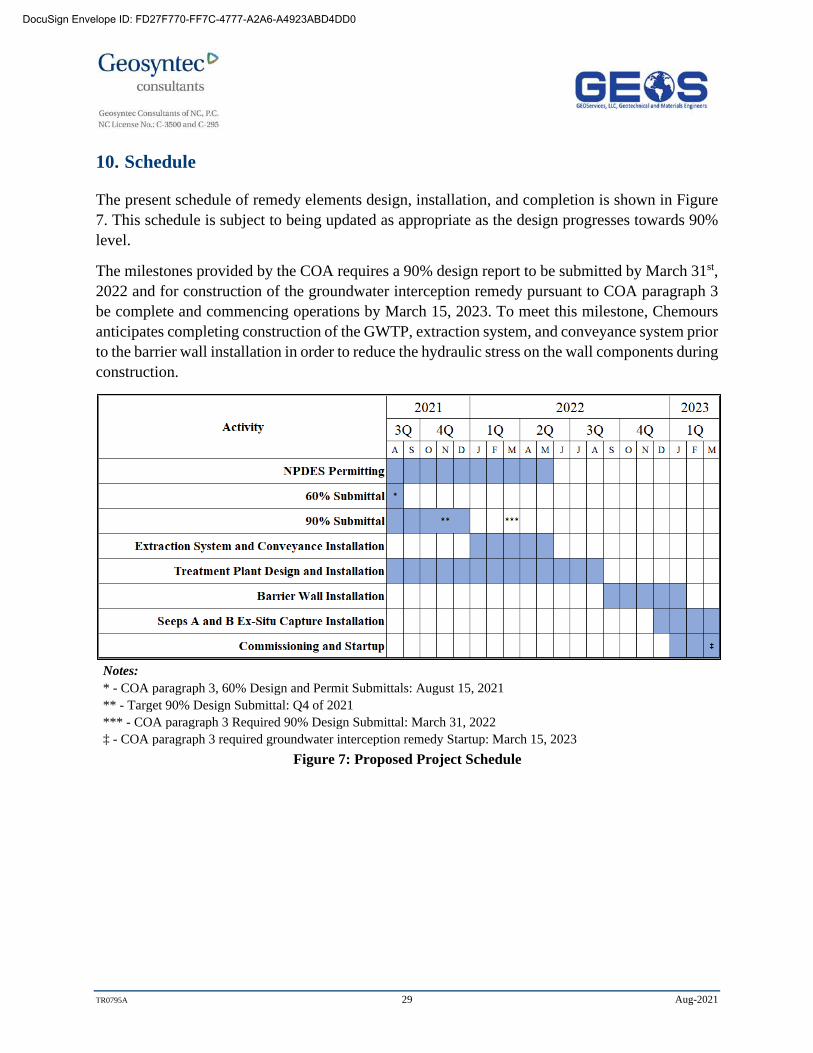
The present schedule of remedy elements design, installation, and completion is shown in Figure 7. This schedule is subject to being updated as appropriate as the design progresses towards 90% level.
The milestones provided by the COA requires a 90% design report to be submitted by March 31st, 2022 and for construction of the groundwater interception remedy pursuant to COA paragraph 3 be complete and commencing operations by March 15, 2023. To meet this milestone, Chemours anticipates completing construction of the GWTP, extraction system, and conveyance system prior to the barrier wall installation in order to reduce the hydraulic stress on the wall components during construction.
Notes: * - COA paragraph 3, 60% Design and Permit Submittals: August 15, 2021 ** - Target 90% Design Submittal: Q4 of 2021 *** - COA paragraph 3 Required 90% Design Submittal: March 31, 2022 ‡ - COA paragraph 3 required groundwater interception remedy Startup: March 15, 2023
Figure 7: Proposed Project Schedule
DocuSign Envelope ID: FD27F770-FF7C-4777-A2A6-A4923ABD4DD0
TR0795A 30 Aug-2021
11. Summary and Closing
Chemours is designing and implementing a remedy which will meet objectives described in COA paragraphs 3(b) and 2(c). This report summarizes the 60% design for the remedy which is further detailed in reports attached as appendices A through G to this report. The remedy for the site includes three important components: the groundwater interception remedy, the Seeps A and B ex-situ capture remedy, and the water treatment system. Modeling informed by predesign investigations show that these three remedy components are expected to achieve remedial objectives outlined in the COA.
The objective of the groundwater interception remedy is to reduce PFAS mass loading the Willis Creek and the Cape Fear River by intercepting groundwater flowing to these water bodies. The interception remedy involves constructing an underground barrier wall to create a low permeability barrier reduce groundwater transmission and installing a groundwater extraction system to intercept groundwater and control groundwater migration around, above, or under the barrier wall. The objective of the ex-situ seep capture remedy is to capture from seeps A and B upgradient of the barrier wall dry weather seep flows as well as stormwater flows from rain events up to 0.5 inches in a 24-hour period. Both the ex-situ seeps capture remedy and the groundwater interception remedy convey PFAS containing water to a GWTP where the indicated parameter PFAS will be removed to a 99% efficiency.
DocuSign Envelope ID: FD27F770-FF7C-4777-A2A6-A4923ABD4DD0
TR0795A 31 Aug-2021
12. References
Driscoll, F.G., 2008. Groundwater and Wells. New Brighton, MN. Johnson Screens
FEMA, 2007. Flood Insurance Rate Map (FIRM) Panel 0359 Map Number 3720035900J effective date 1/5/2007
Geosyntec, 2019a. Corrective Action Plan. Chemours Fayetteville Works. December 31, 2019.
Geosyntec, 2019b. On and Offsite Assessment (Version 2). Chemours Fayetteville Works. October 31, 2019.
Geosyntec, 2020. Onsite Seeps Long-Term Loading Calculation Plan. Chemours Fayetteville Works. October 2020.
Geosyntec, 2021a. Pre-Design Investigation Summary (Version 2). Chemours Fayetteville Works. June 29, 2021.
NCDEQ, 2019. Addendum to Consent Order Paragraph 12. General Court of Justice Superior Court Division. State of North Carolina. County of Bladen. February 25, 2019. NCDEQ, 2020.
NCDEQ Stormwater Design Manual. Part B: Calculations Guidance. Available at: https://deq.nc.gov/about/divisions/energy-mineral-and-land-resources/stormwater/stormwater-program/stormwater-design.
Sohl, N.F., and Owens, J.P., 1991, Cretaceous stratigraphy of the Carolina Coastal Plain, in Horton, J.W., Jr., and Zullo, V.A., eds., The Geology of the Carolinas (50th anniversary volume, Carolina Geological Society): Knoxville, Tenn., University of Tennessee Press, p. 191-220.
DocuSign Envelope ID: FD27F770-FF7C-4777-A2A6-A4923ABD4DD0

TR0795 Aug-2021
Appendix A Pre-Design Investigation Report
DocuSign Envelope ID: FD27F770-FF7C-4777-A2A6-A4923ABD4DD0
TR0795 Aug-2021
Appendix B Groundwater Flow Model Report
DocuSign Envelope ID: FD27F770-FF7C-4777-A2A6-A4923ABD4DD0

TR0795 Aug-2021
Appendix C Barrier Wall Design Report
DocuSign Envelope ID: FD27F770-FF7C-4777-A2A6-A4923ABD4DD0
TR0795 Aug-2021
Appendix D Groundwater Extraction and Conveyance System
Design Report
DocuSign Envelope ID: FD27F770-FF7C-4777-A2A6-A4923ABD4DD0

TR0795 Aug-2021
Appendix E Seep Flow at Barrier Wall Memo
DocuSign Envelope ID: FD27F770-FF7C-4777-A2A6-A4923ABD4DD0

TR0795 Aug-2021
Appendix F Seep Ex-Situ Capture Remedy Design Report
DocuSign Envelope ID: FD27F770-FF7C-4777-A2A6-A4923ABD4DD0
TR0795 Aug-2021
Appendix G DEQ E-mail Communication
& Engineering Report – Treatment of Groundwater
and Upgradient Seeps Water
DocuSign Envelope ID: FD27F770-FF7C-4777-A2A6-A4923ABD4DD0