free radicals and fast photochemistry during berlioz - ucla
TRANSCRIPT
Journal of Atmospheric Chemistry 42: 359–394, 2002.© 2002 Kluwer Academic Publishers. Printed in the Netherlands.
359
Free Radicals and Fast Photochemistryduring BERLIOZ
U. PLATT 1, B. ALICKE 1, R. DUBOIS 4, A. GEYER 1, A. HOFZUMAHAUS 2,F. HOLLAND 2, M. MARTINEZ, D. MIHELCIC 2, T. KLÜPFEL 3,B. LOHRMANN 4, W. PÄTZ 2, D. PERNER 3, F. ROHRER 2, J. SCHÄFER andJ. STUTZ 1�
1Institut für Umweltphysik, University of Heidelberg, INF 229, D-69120 Heidelberg, Germany2Forschungszentrum Jülich, Germany3MPI Chemie, Mainz, Germany4Institut für Troposphärenforschung, Leipzig, Germany
(Received: 13 October 2000; in final form: 8 May 2001)
Abstract. The free radicals OH, HO2, RO2, and NO3 are known to be the driving force for mostchemical processes in the atmosphere. Since the low concentration of the above radicals makesmeasurements particularly difficult, only relatively few direct measurements of free radical con-centrations have been reported to date. We present a comprehensive set of simultaneous radicalmeasurements performed by Laser Induced Fluorescence (LIF), Matrix Isolation – Electron spinResonance (MI-ESR), Peroxy Radical Chemical Amplification (PERCA), and Differential OpticalAbsorption Spectroscopy (DOAS) during the BERLIner OZonexperiment (BERLIOZ) during Julyand August of 1998 near Berlin, Germany. Most of the above radical species were measured by morethan one technique and an intercomparison gave good agreement. This data set offered the possibilityto study and quantify the role of each radical at a rural, semi-polluted site in the continental boundarylayer and to investigate interconnections and dependencies among these free radicals. In general(box) modelled diurnal profiles of the different radicals reproduced the measurements quite well,however measured absolute levels are frequently lower than model predictions. These discrepanciespoint to disturbing deficiencies in our understanding of the chemical system in urban air masses. Inaddition considerable night-time peroxy radical production related to VOC reactions with NO3 andO3 could be quantified.
Key words: free radicals, photochemistry, hydroxyl radical, nitrate radical, peroxy radical, spec-troscopy, modelling.
1. Introduction
Free radicals are known to be the driving force for most chemical processes inthe atmosphere. Since the pioneering work of Weinstock (1969) and Levy (1971)photochemically generated radical families HOX (= OH and HO2) and ROX (= HO2
+ RO2, where RO2 summarises organic peroxy radicals with R denoting an organicgroup, e.g., CH3) are thought to play a key role in tropospheric chemistry. For
� Present address: UC at Los Angeles, U.S.A.
360 U. PLATT ET AL.
instance OH radicals initiate the degradation of most air pollutants and ROX radi-cals catalyse ozone formation in the troposphere (e.g., Crutzen, 1974). In additionrecent investigations indicate a possibly important influence of several other rad-icals including NO3 and halogen oxides (Platt, 1997). In particular reactions ofthe nitrate radical (NO3) can be an important (predominantly night-time) sink oforganic species (e.g., Geyer et al., 2001a). Products of these reactions of NO3 withorganic species can be a night-time source of peroxy radicals (like HO2 or CH3O2)
and even OH radicals (Platt et al., 1990; Mihelcic et al., 1993, 2000; Carslaw etal., 1997; Geyer et al., 2001b).
Obviously, the knowledge of the concentration and chemical cycles of thesespecies in the atmosphere is essential for the understanding of atmospheric chem-istry. Unfortunately the low concentration of free radicals makes measurementsparticularly difficult, therefore only relatively few direct measurements of free radi-cal concentrations – in particular of comprehensive sets of radical species describedabove – have been reported to date.
Here we present a set of simultaneous radical measurements performed duringthe BERLIner OZonexperiment (BERLIOZ) during July and August of 1998 nearBerlin, Germany. Most free radical species were measured simultaneously (at leastduring part of the campaign) by more than one technique. The good agreement ofthe results gives us considerable confidence in the reliability of the data, despitethe difficulties in measuring free radicals. This comprehensive data set offeredthe possibility to study and quantify the role of each radical at a typical semi-polluted site in the continental boundary layer and to investigate interconnectionsand dependencies among these free radicals.
The following free radical measurements were performed during BERLIOZ:
• OH and HO2 by Laser Induced Fluorescence (LIF);• HO2- and RO2 by Matrix Isolation – Electron Spin Resonance (MI-ESR);• The ROX (i.e., HO2 + RO2) by chemical amplification (ROX-BOX);• NO3 by Differential Optical Absorption Spectroscopy (DOAS) and MI-ESR.
2. Chemistry and Cycles of Free Radicals in the Troposphere
In the following we discuss the central aspects of the reaction cycles of the OH-HO2-, RO2-, and NO3 free radicals. Table I summarises the relevant species andgives some indication about their role in atmospheric chemistry.
2.1. HYDROGEN- AND PEROXY RADICALS (OH, HO2, RO2)
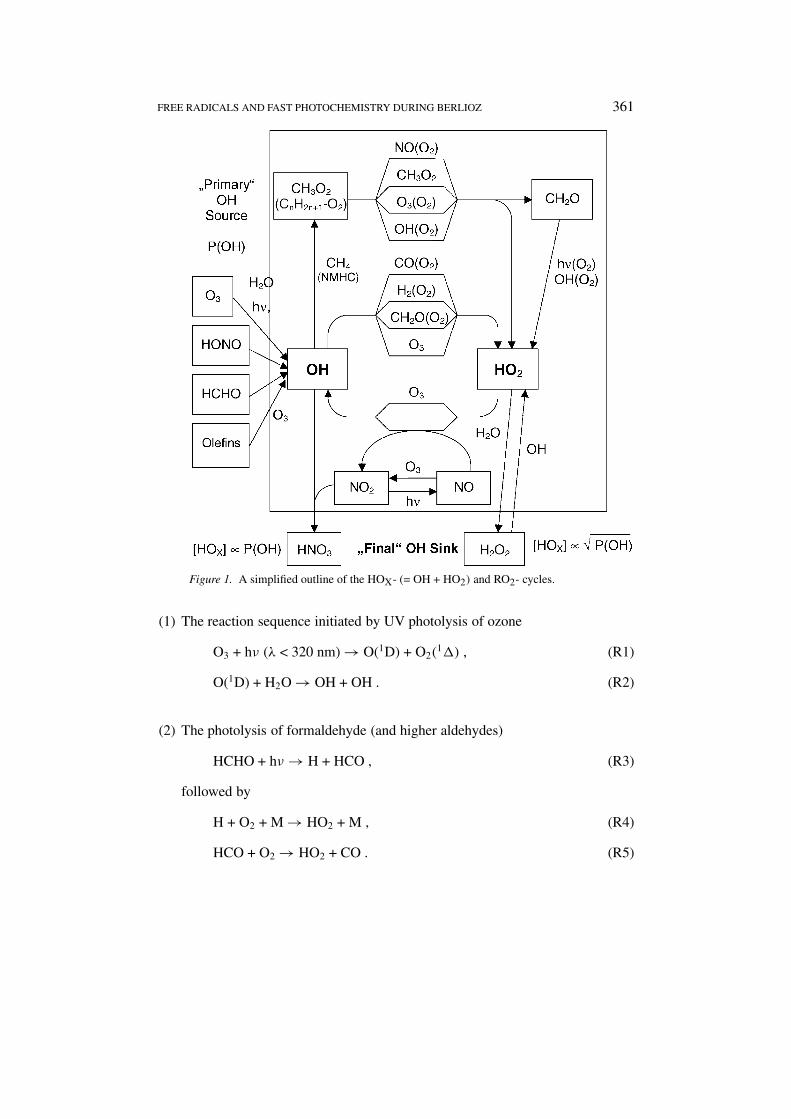
Figure 1 shows a simplified outline of the HOX (= OH + HO2) and RO2 (ROX)
cycles. In urban areas formation of HOX is dominated by mechanisms:
FREE RADICALS AND FAST PHOTOCHEMISTRY DURING BERLIOZ 361
Figure 1. A simplified outline of the HOX- (= OH + HO2) and RO2- cycles.
(1) The reaction sequence initiated by UV photolysis of ozone
O3 + hν (λ < 320 nm) → O(1D) + O2(1�) , (R1)
O(1D) + H2O → OH + OH . (R2)
(2) The photolysis of formaldehyde (and higher aldehydes)
HCHO + hν → H + HCO , (R3)
followed by
H + O2 + M → HO2 + M , (R4)
HCO + O2 → HO2 + CO . (R5)
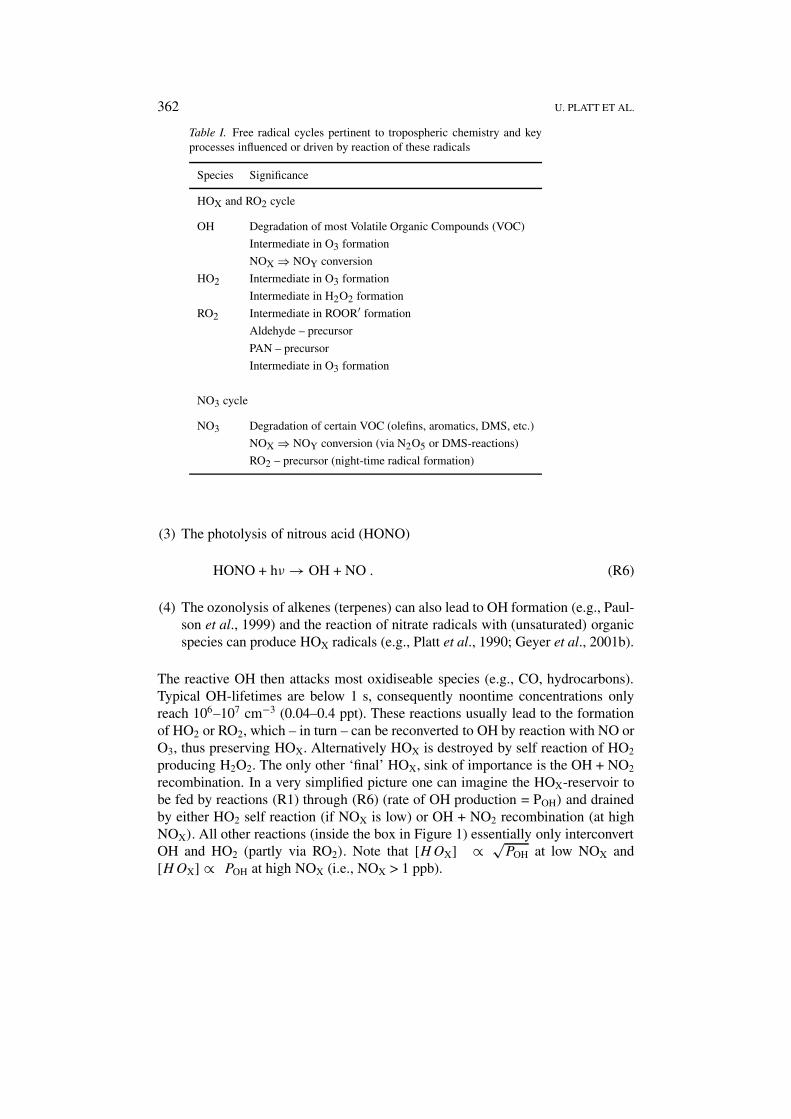
362 U. PLATT ET AL.
Table I. Free radical cycles pertinent to tropospheric chemistry and keyprocesses influenced or driven by reaction of these radicals
Species Significance
HOX and RO2 cycle
OH Degradation of most Volatile Organic Compounds (VOC)
Intermediate in O3 formation
NOX ⇒ NOY conversion
HO2 Intermediate in O3 formation
Intermediate in H2O2 formation
RO2 Intermediate in ROOR′ formation
Aldehyde – precursor
PAN – precursor
Intermediate in O3 formation
NO3 cycle
NO3 Degradation of certain VOC (olefins, aromatics, DMS, etc.)
NOX ⇒ NOY conversion (via N2O5 or DMS-reactions)
RO2 – precursor (night-time radical formation)
(3) The photolysis of nitrous acid (HONO)
HONO + hν → OH + NO . (R6)
(4) The ozonolysis of alkenes (terpenes) can also lead to OH formation (e.g., Paul-son et al., 1999) and the reaction of nitrate radicals with (unsaturated) organicspecies can produce HOX radicals (e.g., Platt et al., 1990; Geyer et al., 2001b).
The reactive OH then attacks most oxidiseable species (e.g., CO, hydrocarbons).Typical OH-lifetimes are below 1 s, consequently noontime concentrations onlyreach 106–107 cm−3 (0.04–0.4 ppt). These reactions usually lead to the formationof HO2 or RO2, which – in turn – can be reconverted to OH by reaction with NO orO3, thus preserving HOX. Alternatively HOX is destroyed by self reaction of HO2
producing H2O2. The only other ‘final’ HOX, sink of importance is the OH + NO2
recombination. In a very simplified picture one can imagine the HOX-reservoir tobe fed by reactions (R1) through (R6) (rate of OH production = POH) and drainedby either HO2 self reaction (if NOX is low) or OH + NO2 recombination (at highNOX). All other reactions (inside the box in Figure 1) essentially only interconvertOH and HO2 (partly via RO2). Note that [HOX] ∝ √
POH at low NOX and[HOX] ∝ POH at high NOX (i.e., NOX > 1 ppb).
FREE RADICALS AND FAST PHOTOCHEMISTRY DURING BERLIOZ 363
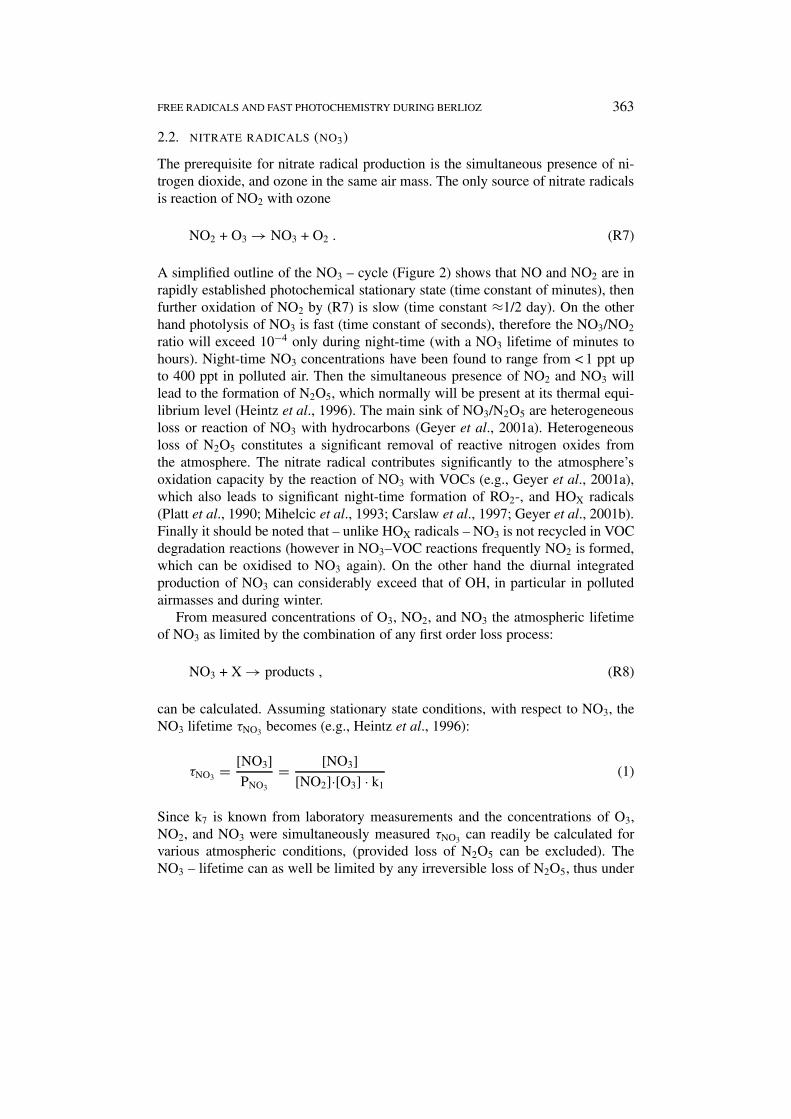
2.2. NITRATE RADICALS (NO3)
The prerequisite for nitrate radical production is the simultaneous presence of ni-trogen dioxide, and ozone in the same air mass. The only source of nitrate radicalsis reaction of NO2 with ozone
NO2 + O3 → NO3 + O2 . (R7)
A simplified outline of the NO3 – cycle (Figure 2) shows that NO and NO2 are inrapidly established photochemical stationary state (time constant of minutes), thenfurther oxidation of NO2 by (R7) is slow (time constant ≈1/2 day). On the otherhand photolysis of NO3 is fast (time constant of seconds), therefore the NO3/NO2
ratio will exceed 10−4 only during night-time (with a NO3 lifetime of minutes tohours). Night-time NO3 concentrations have been found to range from < 1 ppt upto 400 ppt in polluted air. Then the simultaneous presence of NO2 and NO3 willlead to the formation of N2O5, which normally will be present at its thermal equi-librium level (Heintz et al., 1996). The main sink of NO3/N2O5 are heterogeneousloss or reaction of NO3 with hydrocarbons (Geyer et al., 2001a). Heterogeneousloss of N2O5 constitutes a significant removal of reactive nitrogen oxides fromthe atmosphere. The nitrate radical contributes significantly to the atmosphere’soxidation capacity by the reaction of NO3 with VOCs (e.g., Geyer et al., 2001a),which also leads to significant night-time formation of RO2-, and HOX radicals(Platt et al., 1990; Mihelcic et al., 1993; Carslaw et al., 1997; Geyer et al., 2001b).Finally it should be noted that – unlike HOX radicals – NO3 is not recycled in VOCdegradation reactions (however in NO3–VOC reactions frequently NO2 is formed,which can be oxidised to NO3 again). On the other hand the diurnal integratedproduction of NO3 can considerably exceed that of OH, in particular in pollutedairmasses and during winter.
From measured concentrations of O3, NO2, and NO3 the atmospheric lifetimeof NO3 as limited by the combination of any first order loss process:
NO3 + X → products , (R8)
can be calculated. Assuming stationary state conditions, with respect to NO3, theNO3 lifetime τNO3 becomes (e.g., Heintz et al., 1996):
τNO3 = [NO3]PNO3
= [NO3][NO2]·[O3] · k1
(1)
Since k7 is known from laboratory measurements and the concentrations of O3,NO2, and NO3 were simultaneously measured τNO3 can readily be calculated forvarious atmospheric conditions, (provided loss of N2O5 can be excluded). TheNO3 – lifetime can as well be limited by any irreversible loss of N2O5, thus under
364 U. PLATT ET AL.
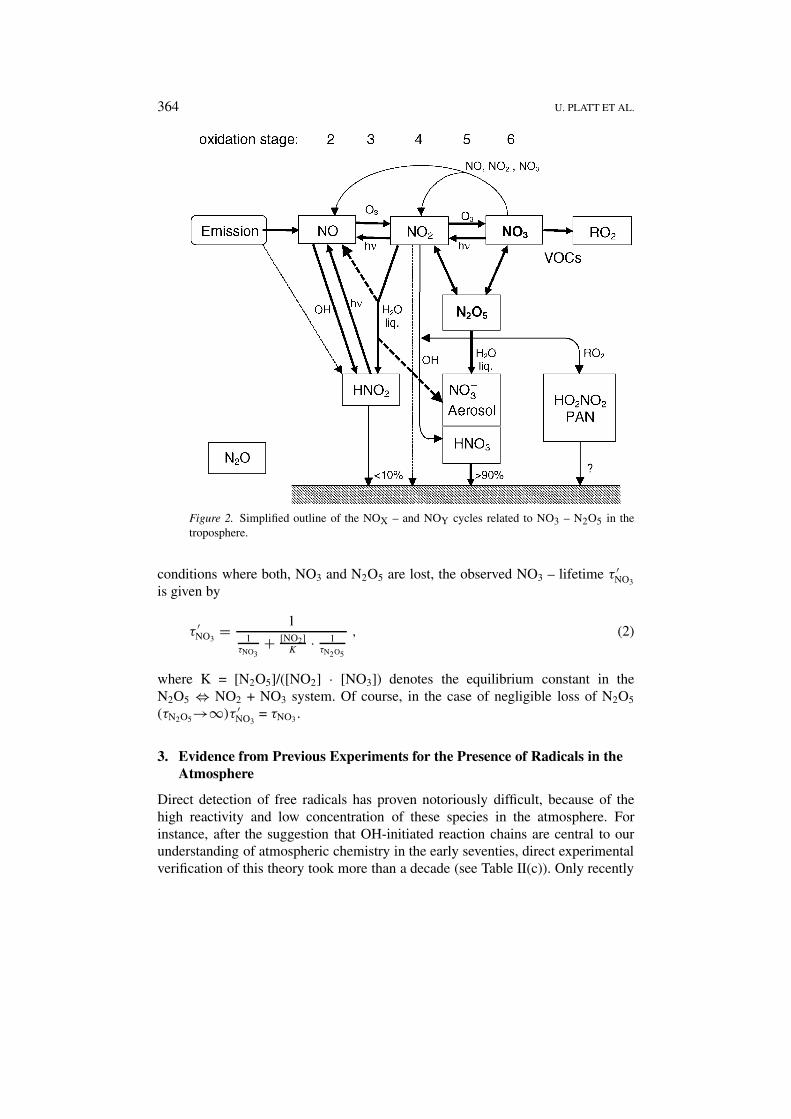
Figure 2. Simplified outline of the NOX – and NOY cycles related to NO3 – N2O5 in thetroposphere.
conditions where both, NO3 and N2O5 are lost, the observed NO3 – lifetime τ ′NO3
is given by
τ ′NO3
= 11
τNO3+ [NO2]
K· 1
τN2O5
, (2)
where K = [N2O5]/([NO2] · [NO3]) denotes the equilibrium constant in theN2O5 ⇔ NO2 + NO3 system. Of course, in the case of negligible loss of N2O5
(τN2O5→∞)τ ′NO3
= τNO3.
3. Evidence from Previous Experiments for the Presence of Radicals in theAtmosphere
Direct detection of free radicals has proven notoriously difficult, because of thehigh reactivity and low concentration of these species in the atmosphere. Forinstance, after the suggestion that OH-initiated reaction chains are central to ourunderstanding of atmospheric chemistry in the early seventies, direct experimentalverification of this theory took more than a decade (see Table II(c)). Only recently
FREE RADICALS AND FAST PHOTOCHEMISTRY DURING BERLIOZ 365
direct tropospheric OH measurements by spectroscopic techniques of high qualitywere reported (see Table II(c)). Although these data match model predictions theydo not yet constitute a data set that covers all conditions of the atmosphere. Onthe other hand, there has been a substantial amount of indirect evidence for thepresence of OH radicals in the atmosphere. In addition a number of techniqueswere developed which were not identifying the OH molecule directly, but gave agood and quantitative measure for the OH abundance (like monitoring the budgetsof species which are dominantly degraded by OH reactions, e.g., CO, 14CO (Volzet al., 1981; Brenninkmeijer et al., 1992) or CH3Cl (e.g., Prinn et al., 1987)). Thesemethods are referred to as semi-direct (see Table II(b)). Today it can be concludedthat there is an enormous amount of indirect evidence of their presence, althoughdirect, unequivocal identification of these species in the atmosphere could only beperformed in a few cases.
In the case of peroxy radicals to date there are also few direct measurements ofHO2 and some other peroxy radicals by matrix isolation–electron spin resonancedetection (MI-ESR, see Section 4.2 and Table III(c)). On the other hand there aretechniques for indirect detection of HO2 available that rely on conversion to OHvia reaction with NO (Table III(b)). Hydroxyl radicals can then be detected by thewell developed LIF technique. Another, now widely used ‘semi direct’ techniqueemploys a chemical amplifier (PERCA or ‘ROX-BOX’) converting NO, addedto the sampled airflow, into NO2. Although this – basically simple – techniqueappears to have severe limitations it has been demonstrated that it can be used toinvestigate the tropospheric HOX system, in particular in clean air (e.g., Monks etal., 1996). Recently a new instrument for the detection of peroxy radicals, based ona combination of chemical amplification (conversion of peroxy radicals to gaseoussulphuric acid via chain reaction with NO and SO2) and mass spectroscopic detec-tion of characteristic ions (HOxMAS = HOX Amplifying Chemical Conversion/IonMolecule Reaction – Mass Spectrometry), was successfully applied to atmosphericmeasurements (see e.g., Reiner et al. (1999) and references therein).
In the case of NO3 radicals the first direct detection (by DOAS) in the tro-posphere dates back to 1979 (see Table IV), but the idea of a considerable influenceof NO3 on tropospheric chemical cycles gained acceptance only slowly. The NO3
concentration was determined from long term measurement series, which haverecently begun (e.g., Heintz et al., 1996; Geyer et al., 2001c). Again there isconsiderable indirect evidence for the importance of NO3 radical reactions inthe troposphere, these include (1) the lack of seasonal dependence of the NOY
deposition (e.g., Calvert et al., 1985) suggesting non-photochemical NOX-NOY
conversion via NO3-N2O5 during winter; (2) observation of night-time radical for-mation (e.g., Mihelcic et al., 1993; Carslaw et al., 1997; Gölz et al., 2001; Geyeret al., 2001b); (3) degradation patterns of hydrocarbons (Penkett et al., 1993).
366 U. PLATT ET AL.
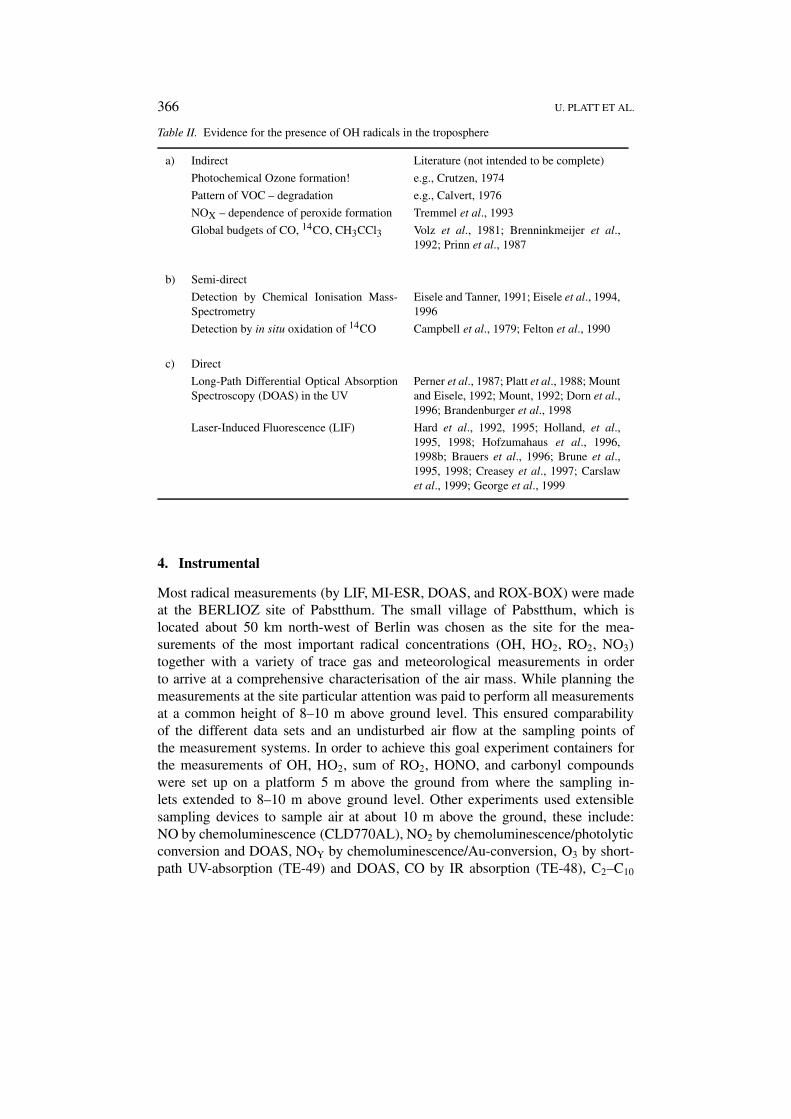
Table II. Evidence for the presence of OH radicals in the troposphere
a) Indirect Literature (not intended to be complete)
Photochemical Ozone formation! e.g., Crutzen, 1974
Pattern of VOC – degradation e.g., Calvert, 1976
NOX – dependence of peroxide formation Tremmel et al., 1993
Global budgets of CO, 14CO, CH3CCl3 Volz et al., 1981; Brenninkmeijer et al.,1992; Prinn et al., 1987
b) Semi-direct
Detection by Chemical Ionisation Mass-Spectrometry
Eisele and Tanner, 1991; Eisele et al., 1994,1996
Detection by in situ oxidation of 14CO Campbell et al., 1979; Felton et al., 1990
c) Direct
Long-Path Differential Optical AbsorptionSpectroscopy (DOAS) in the UV
Perner et al., 1987; Platt et al., 1988; Mountand Eisele, 1992; Mount, 1992; Dorn et al.,1996; Brandenburger et al., 1998
Laser-Induced Fluorescence (LIF) Hard et al., 1992, 1995; Holland, et al.,1995, 1998; Hofzumahaus et al., 1996,1998b; Brauers et al., 1996; Brune et al.,1995, 1998; Creasey et al., 1997; Carslawet al., 1999; George et al., 1999
4. Instrumental
Most radical measurements (by LIF, MI-ESR, DOAS, and ROX-BOX) were madeat the BERLIOZ site of Pabstthum. The small village of Pabstthum, which islocated about 50 km north-west of Berlin was chosen as the site for the mea-surements of the most important radical concentrations (OH, HO2, RO2, NO3)
together with a variety of trace gas and meteorological measurements in orderto arrive at a comprehensive characterisation of the air mass. While planning themeasurements at the site particular attention was paid to perform all measurementsat a common height of 8–10 m above ground level. This ensured comparabilityof the different data sets and an undisturbed air flow at the sampling points ofthe measurement systems. In order to achieve this goal experiment containers forthe measurements of OH, HO2, sum of RO2, HONO, and carbonyl compoundswere set up on a platform 5 m above the ground from where the sampling in-lets extended to 8–10 m above ground level. Other experiments used extensiblesampling devices to sample air at about 10 m above the ground, these include:NO by chemoluminescence (CLD770AL), NO2 by chemoluminescence/photolyticconversion and DOAS, NOY by chemoluminescence/Au-conversion, O3 by short-path UV-absorption (TE-49) and DOAS, CO by IR absorption (TE-48), C2–C10
FREE RADICALS AND FAST PHOTOCHEMISTRY DURING BERLIOZ 367
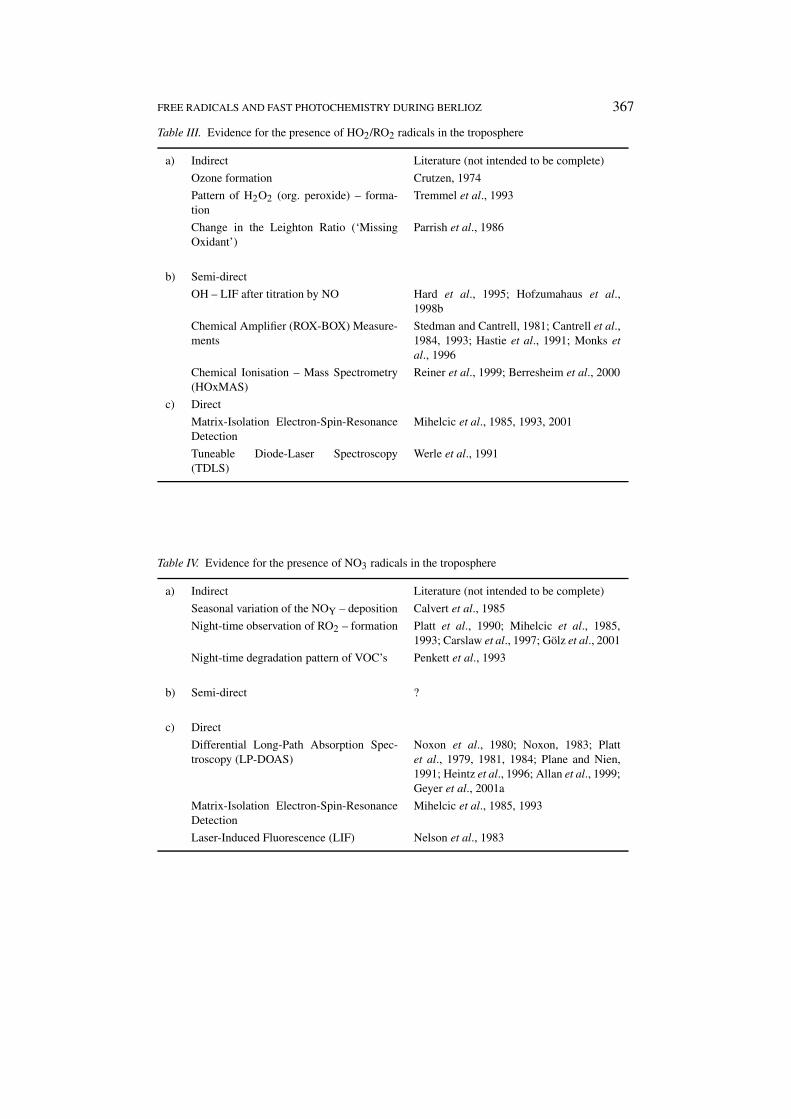
Table III. Evidence for the presence of HO2/RO2 radicals in the troposphere
a) Indirect Literature (not intended to be complete)
Ozone formation Crutzen, 1974
Pattern of H2O2 (org. peroxide) – forma-tion
Tremmel et al., 1993
Change in the Leighton Ratio (‘MissingOxidant’)
Parrish et al., 1986
b) Semi-direct
OH – LIF after titration by NO Hard et al., 1995; Hofzumahaus et al.,1998b
Chemical Amplifier (ROX-BOX) Measure-ments
Stedman and Cantrell, 1981; Cantrell et al.,1984, 1993; Hastie et al., 1991; Monks etal., 1996
Chemical Ionisation – Mass Spectrometry(HOxMAS)
Reiner et al., 1999; Berresheim et al., 2000
c) Direct
Matrix-Isolation Electron-Spin-ResonanceDetection
Mihelcic et al., 1985, 1993, 2001
Tuneable Diode-Laser Spectroscopy(TDLS)
Werle et al., 1991
Table IV. Evidence for the presence of NO3 radicals in the troposphere
a) Indirect Literature (not intended to be complete)
Seasonal variation of the NOY – deposition Calvert et al., 1985
Night-time observation of RO2 – formation Platt et al., 1990; Mihelcic et al., 1985,1993; Carslaw et al., 1997; Gölz et al., 2001
Night-time degradation pattern of VOC’s Penkett et al., 1993
b) Semi-direct ?
c) Direct
Differential Long-Path Absorption Spec-troscopy (LP-DOAS)
Noxon et al., 1980; Noxon, 1983; Plattet al., 1979, 1981, 1984; Plane and Nien,1991; Heintz et al., 1996; Allan et al., 1999;Geyer et al., 2001a
Matrix-Isolation Electron-Spin-ResonanceDetection
Mihelcic et al., 1985, 1993
Laser-Induced Fluorescence (LIF) Nelson et al., 1983
368 U. PLATT ET AL.
hydrocarbons by in situ GC (Airmotec HC1010 and HP-GC/cryogenic sampling),formaldehyde by liquid-phase fluorescence (AL4001) and DOAS, HONO and SO2
by DOAS. Meteorological parameters were also measured as well as photolysisfrequencies of O3 (to yield O1D), NO2, HONO, and NO3 by filter radiometers anda spectral radiometer.
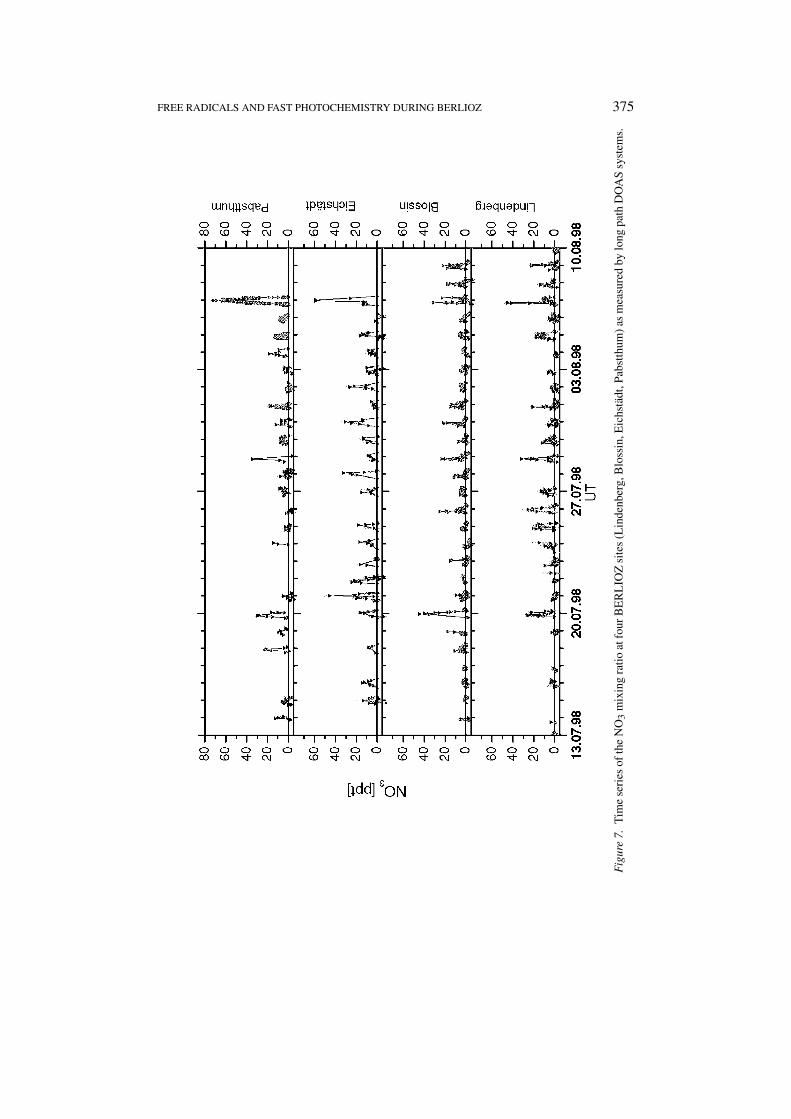
In addition NO3 measurements using DOAS were performed at three other sitesin the Berlin area: Lindenberg, Blossin (both south of Berlin), and Eichstädt (northof Berlin, but south of Pabstthum) (see Figure 7).
4.1. THE LASER INDUCED FLUORESCENCE (LIF) – INSTRUMENT
Laser induced fluorescence (LIF) was used to determine the ambient concentrationof OH and HO2 at the BERLIOZ site near Pabstthum. It is based on the fluorescencesignal of OH molecules excited from their ground state X2 into the first electron-ically excited state A2�. A laser beam at a wavelength of 308 nm was used forthe excitation. HO2 was measured by LIF after conversion to OH by reaction withNO added to the measurement air. In the field the instrument was calibrated onceper day. The accuracy of the measured OH concentration is estimated to be 10%.The 1σ – statistical error distributions of the OH and HO2 data have medians of3 × 105 and 9 × 10⁶, respectively. The instrument was tested in an intercomparisonexercise against DOAS OH-measurements (Brauers et al., 1996; Hofzumahaus etal., 1998a). A detailed description of the LIF measurement technique and evalua-tion algorithm for OH and HO2 as used during BERLIOZ, is given by Holland etal. (1995, 1998, 2001) and Hofzumahaus et al. (1996).
4.2. THE MATRIX ISOLATION – ELECTRON SPIN RESONANCE (MI-ESR)INSTRUMENT
Matrix isolation electron spin resonance was used to determine the concentrationof HO2, the sum of RO2 and NO3 at the BERLIOZ site Pabstthum. Quantitativedeterminations of free radicals in the troposphere using the MI-ESR techniquewere first reported by Mihelcic et al. (1985) with subsequent developments andapplications described by Mihelcic et al. (1990, 1993). The measurements involvein situ trapping of the radicals in ambient air in a D2O-ice matrix at –196 ◦Cfollowed by specification and quantification of the trapped radicals by ESR spec-troscopy. MI-ESR provides direct spectroscopic evidence for the presence of HO2
and higher peroxy-radicals in the atmosphere. The atmospheric sampling time was30 min. The 1σ -statistical error of the MI-ESR system was 2.5 × 107 cm−3 for allthree radicals. For a detailed description of the MI-ESR technique and evaluationprocedures, refer to Mihelcic et al. (1985) and Geyer et al. (1999).
FREE RADICALS AND FAST PHOTOCHEMISTRY DURING BERLIOZ 369
4.3. THE CHEMICAL AMPLIFIER (ROX-BOX)
ROX, mainly peroxy radicals (HO2 and RO2) were continuously measured at theBERLIOZ site Pabstthum by using the chemical amplification (PERCA). Thismeasurement technique is based on the conversion of peroxy radicals into an ampli-fied NO2 modulated signal which is detected by the chemoluminescence producedfrom the reaction of NO2 with a luminol solution. (Chain reaction of HO2/RO2 withNO producing NO2 and OH. Following the re-conversion of the OH radical to HO2
by reaction with CO, which is mixed into the sampled air just before the entranceto the reaction chamber, the reaction cycle is completed by a HO2 molecule of theorder of 100 times). The NO2 concentration behind the reaction chamber can thenbe easily determined by a commercial liquid-phase chemiluminescence detectionsystem. The PERCA measures the sum of all oxy- and peroxy-radicals (ROX:OH, HO2, CH3O, CH3O2, etc.). The amplification of the signal, i.e., the chainlength of the chain reactions, and the conversion factor for the organic radicalswas determined through radical calibrations. The radical calibration is based onH2O photolysis at 185 nm (Brune et al., 1995; Schultz et al., 1995). This widelyused method was first described by Cantrell et al. (1984). The PERCA instrumentdeveloped in our institute has been described in more detail elsewhere (Hastie etal., 1991; Arnold, 1997).
Besides HO2 and RO2 active chlorine supports chain amplification in thePERCA instrument as well (Arnold, 1997; Perner et al., 1999). In addition, thechain length appears to be strongly influenced by the ambient water vapour con-centration (Mihele and Hastie, 1998). The water dependence of the chain length istaken into account by using a calibration curve determined in the laboratory. The1σ -statistical error of the PERCA instrument was 3 × 107 cm−3 for an individualmeasurement.
4.4. THE DIFFERENTIAL OPTICAL ABSORPTION SPECTROMETER (DOAS)
Measurements of the NO3- and HONO (as well as O3, HCHO, and SO2) con-centrations in the boundary layer were made by DOAS, which identifies andquantifies the concentration of trace gases by observing their narrow band absorp-tion structures in the near UV and visible wavelength region. Basically a DOASinstrument consists of a broadband light source, an optical system to transfer thelight through the atmosphere, and a spectrograph-detector system to record the ab-sorption spectra. These spectra show absorptions from different trace gases as wellas extinction from air molecules and aerosol scattering. To extract the absorptions,and ultimately the concentration of the trace gases, DOAS separates the trace gasabsorption cross section into two parts, one that varies slowly with wavelength, anda fast varying differential cross section σ ′. Applying the same filtering procedure tothe absorption spectrum leads to a differential absorption spectrum which can thenbe analysed based on Lambert-Beer’s law and σ ′. For a detailed description of theDOAS technique refer to Platt (1994). For the NO3 measurements at Pabstthum a
370 U. PLATT ET AL.
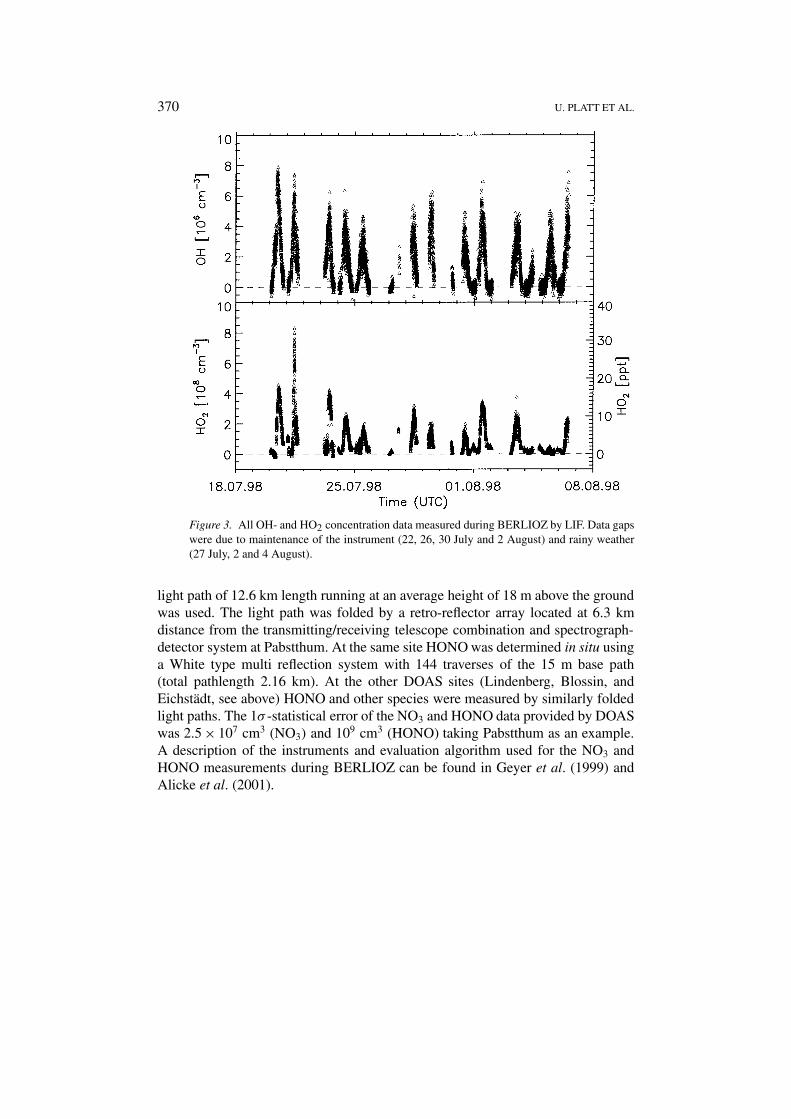
Figure 3. All OH- and HO2 concentration data measured during BERLIOZ by LIF. Data gapswere due to maintenance of the instrument (22, 26, 30 July and 2 August) and rainy weather(27 July, 2 and 4 August).
light path of 12.6 km length running at an average height of 18 m above the groundwas used. The light path was folded by a retro-reflector array located at 6.3 kmdistance from the transmitting/receiving telescope combination and spectrograph-detector system at Pabstthum. At the same site HONO was determined in situ usinga White type multi reflection system with 144 traverses of the 15 m base path(total pathlength 2.16 km). At the other DOAS sites (Lindenberg, Blossin, andEichstädt, see above) HONO and other species were measured by similarly foldedlight paths. The 1σ -statistical error of the NO3 and HONO data provided by DOASwas 2.5 × 107 cm3 (NO3) and 109 cm3 (HONO) taking Pabstthum as an example.A description of the instruments and evaluation algorithm used for the NO3 andHONO measurements during BERLIOZ can be found in Geyer et al. (1999) andAlicke et al. (2001).
FREE RADICALS AND FAST PHOTOCHEMISTRY DURING BERLIOZ 371
5. Results
5.1. OH- AND HO2 MEASUREMENTS BY LIF
Hydroxyl- and HO2 radical concentrations were measured at the Pabstthum siteusing laser induced fluorescence spectroscopy (LIF) from 20 July to 6 August,1998. The data set consists of more than 6000 simultaneous measurements of bothradicals among them nine diurnal cycle observations extending from dawn to duskwith only minor gaps. An overview of the measurements is shown in Figure 3. Amaximum OH concentration of 8 × 106 cm−3 was observed during the first inten-sive observation period (20 and 21 July), which was characterised by polluted airmasses moving in from the city of Berlin during the morning hours followed bya sudden change to much lower pollution levels around 10:00 UT. This is abouthalf of what has been measured during the previous field campaign POPCORN(Holland, et al., 1998) which took place in a rural environment in the north-east ofGermany.
Nocturnal OH concentration data were also frequently collected. The analysis ofthis data set shows that during the night of 21 and 22 July the mean OH concentra-tion (data averaged between 20:00 and 03:00 UT) was significantly different fromzero ((1.4 ± 0.5) × 105 cm−3). The concentration of HO2 radicals usually reachednoon-time values between 2 and 4 × 108 cm−3. Only on the second intensiveday (21 July) concentrations rose up to 8 × 108 cm−3. Throughout the campaignnight-time measurements yielded concentrations well above the detection limitof the instrument. In the course of the night mean HO2 levels decreased from5 × 107 cm−3 around sunset to about 2 × 107 cm−3 in the early morning hours.An analysis (see below) suggests that the elevated nocturnal HOX concentrationscan be explained by reactions of VOC’s with ozone and – to a minor extent – withNO3 radicals.
5.2. OBSERVATIONS OF HO2 AND �RO2 BY MI-ESR
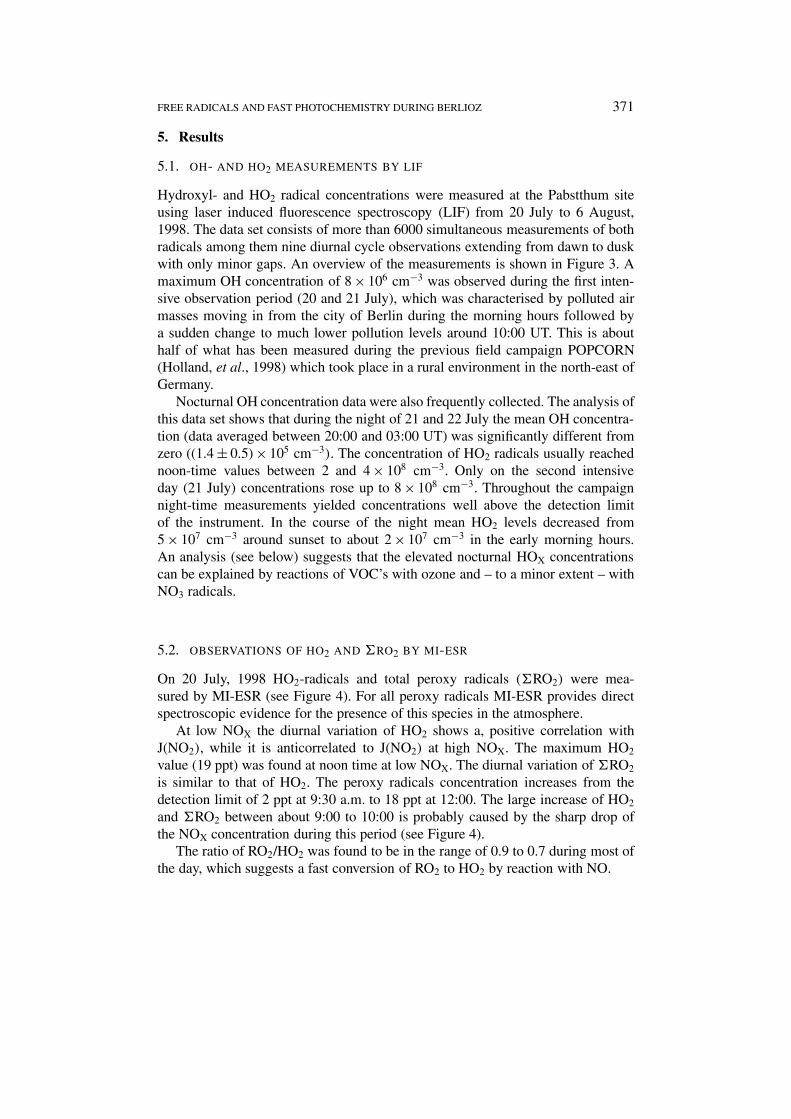
On 20 July, 1998 HO2-radicals and total peroxy radicals (�RO2) were mea-sured by MI-ESR (see Figure 4). For all peroxy radicals MI-ESR provides directspectroscopic evidence for the presence of this species in the atmosphere.
At low NOX the diurnal variation of HO2 shows a, positive correlation withJ(NO2), while it is anticorrelated to J(NO2) at high NOX. The maximum HO2
value (19 ppt) was found at noon time at low NOX. The diurnal variation of �RO2
is similar to that of HO2. The peroxy radicals concentration increases from thedetection limit of 2 ppt at 9:30 a.m. to 18 ppt at 12:00. The large increase of HO2
and �RO2 between about 9:00 to 10:00 is probably caused by the sharp drop ofthe NOX concentration during this period (see Figure 4).
The ratio of RO2/HO2 was found to be in the range of 0.9 to 0.7 during most ofthe day, which suggests a fast conversion of RO2 to HO2 by reaction with NO.
372 U. PLATT ET AL.
Figure 4. Time series of OH, HO2, RO2, NOX, HONO and J(O1D) levels observed on 20July, 1998 at the BERLIOZ site Pabstthum. The drawn lines in panels b, c and d are modelcalculations using the Master Chemical Mechanism (MCM), (Jenkin et al., 1997).
FREE RADICALS AND FAST PHOTOCHEMISTRY DURING BERLIOZ 373
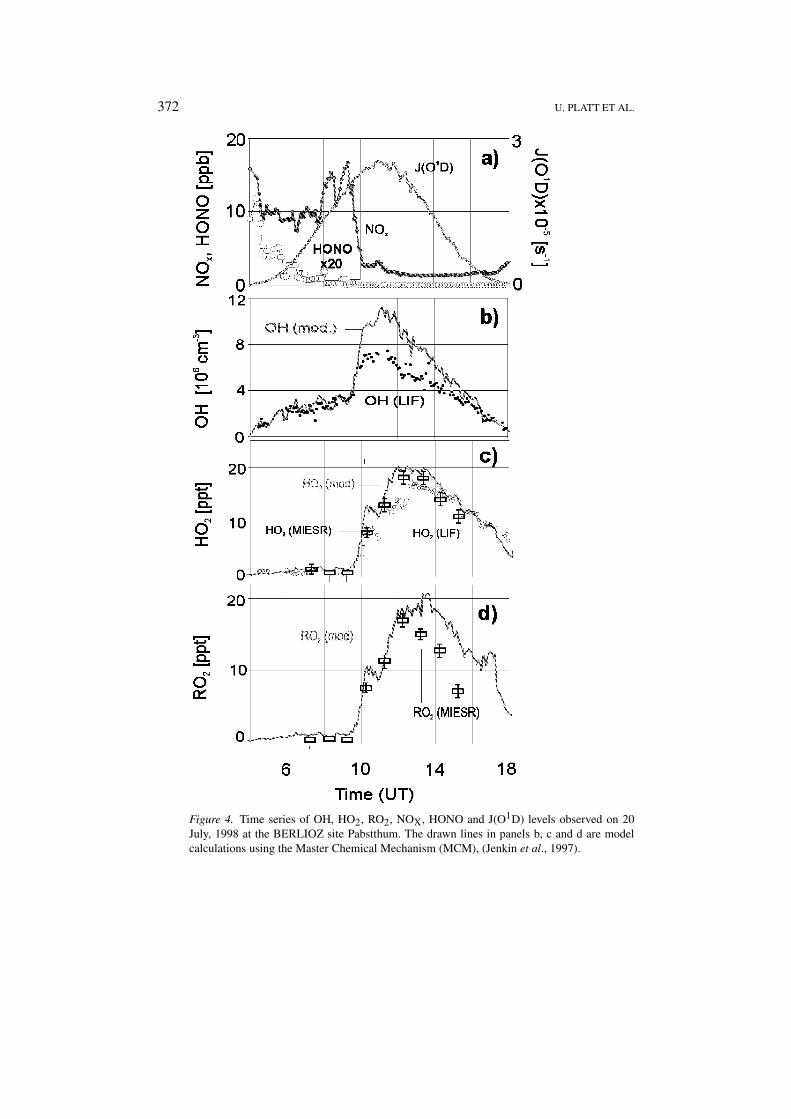
Figure 5. ROX time series from 12 July to 9 August, 1998 measured by chemical amplifica-tion (PERCA) at the BERLIOZ site Pabstthum. During most days a pronounced peak (up to53 ppt) around noontime was observed. The data gap from 4–8 August was due to instrumentfailure.
5.3. PEROXY RADICALS (ROx) BY CHEMICAL AMPLIFICATION
A chemical amplifier was used to continuously determine the concentration of ROX
from 12 July to 3 August. Figure 5 shows the ROX time series from 12 July to 10August. During most days a pronounced peak (up to 53 ppt) around local noontimewas observed.
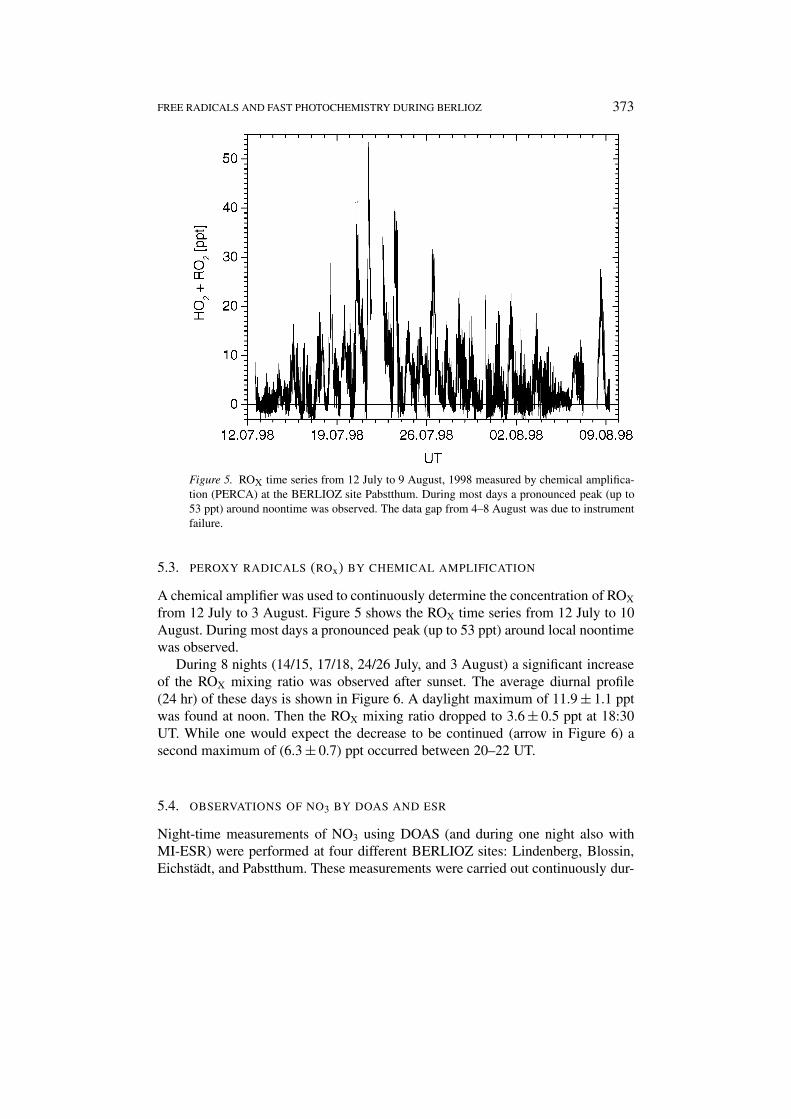
During 8 nights (14/15, 17/18, 24/26 July, and 3 August) a significant increaseof the ROX mixing ratio was observed after sunset. The average diurnal profile(24 hr) of these days is shown in Figure 6. A daylight maximum of 11.9 ± 1.1 pptwas found at noon. Then the ROX mixing ratio dropped to 3.6 ± 0.5 ppt at 18:30UT. While one would expect the decrease to be continued (arrow in Figure 6) asecond maximum of (6.3 ± 0.7) ppt occurred between 20–22 UT.
5.4. OBSERVATIONS OF NO3 BY DOAS AND ESR
Night-time measurements of NO3 using DOAS (and during one night also withMI-ESR) were performed at four different BERLIOZ sites: Lindenberg, Blossin,Eichstädt, and Pabstthum. These measurements were carried out continuously dur-
374 U. PLATT ET AL.
Figure 6. Average diurnal profile of the ROX mixing ratio as measured by the chemical am-plifier for 8 days (14 to 15, 17 to 18, 24 to 26 July, and 3 August, 1998). A second maximumbetween 20 to 22 UT largely exceeding the expected decay in ROX after sunset (arrow) is dueto enhanced night-time production of ROX at the BERLIOZ site Pabstthum.
ing the BERLIOZ campaign. The time series of the NO3 mixing ratio observed atthe four sites is shown in Figure 7.
A correlation of the night-time levels of NO3 among these time series is ap-parent from Figure 7. Night-time maxima of NO3 were usually of the order of10 ppt. In one night (6 and 7 August) the NO3 mixing ratio peaked at 70 ppt inPabstthum. During this night significantly elevated NO3 levels were also observedat the other sites. The night-time mixing ratios of N2O5 calculated for the NO3-NO2-N2O5 equilibrium varied e.g., at Pabstthum from 2 ppt to 900 ppt during thecampaign. Nitrate radical production – and total degradation rates were obtainedfrom steady state calculations (e.g., Geyer et al., 2001a). Taking the Pabstthum siteas an example the production rate varied from 4 × 105 cm−3 s−1 to almost 8 × 10⁶
cm−3 s−1. The total degradation frequency of NO3 was in the range of 2 × 10⁻³
s−1 to almost 0.1 s−1 (corresponding to NO3 lifetimes of 10–500 s).
5.5. INTERCOMPARISON OF RADICAL CONCENTRATIONS MEASURED BY
DIFFERENT INSTRUMENTS
A particular strength of this study was the opportunity to measure several radicalspecies by more than one instrument.
FREE RADICALS AND FAST PHOTOCHEMISTRY DURING BERLIOZ 375
Fig
ure
7.T
ime
seri
esof
the
NO
3m
ixin
gra
tio
atfo
urB
ER
LIO
Zsi
tes
(Lin
denb
erg,
Blo
ssin
,Eic
hstä
dt,P
abst
thum
)as
mea
sure
dby
long
path
DO
AS
syst
ems.
376 U. PLATT ET AL.
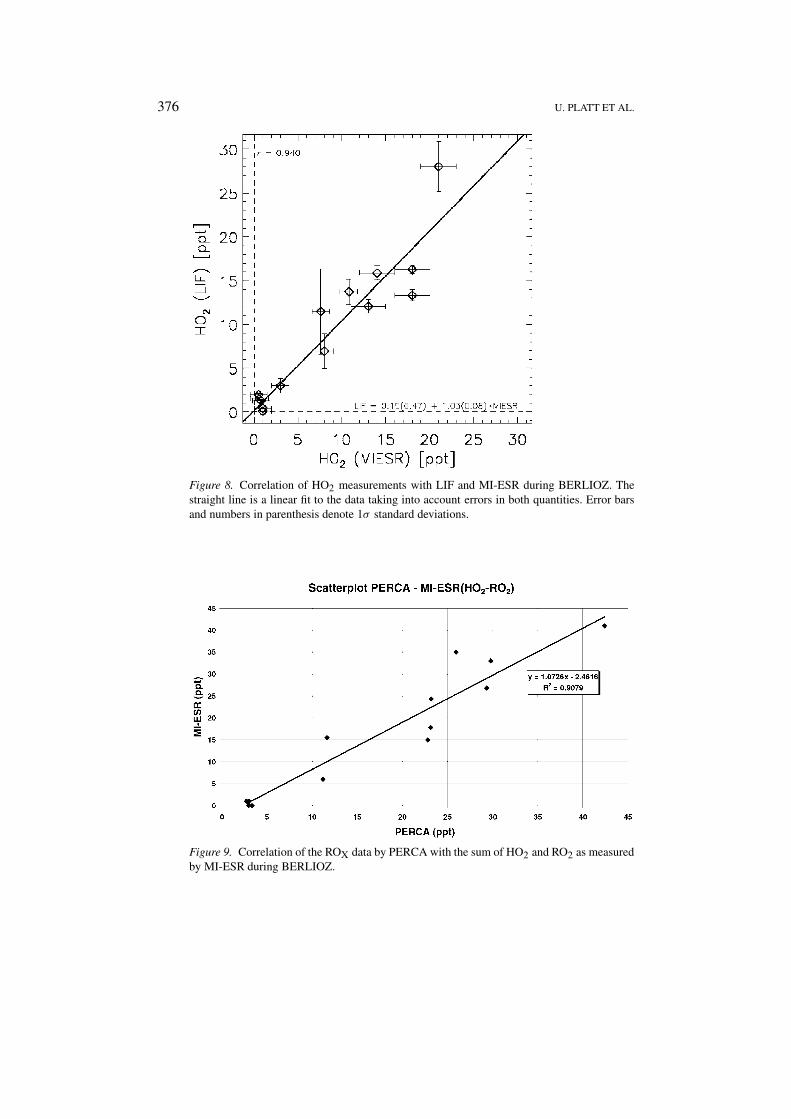
Figure 8. Correlation of HO2 measurements with LIF and MI-ESR during BERLIOZ. Thestraight line is a linear fit to the data taking into account errors in both quantities. Error barsand numbers in parenthesis denote 1σ standard deviations.
Figure 9. Correlation of the ROX data by PERCA with the sum of HO2 and RO2 as measuredby MI-ESR during BERLIOZ.
FREE RADICALS AND FAST PHOTOCHEMISTRY DURING BERLIOZ 377
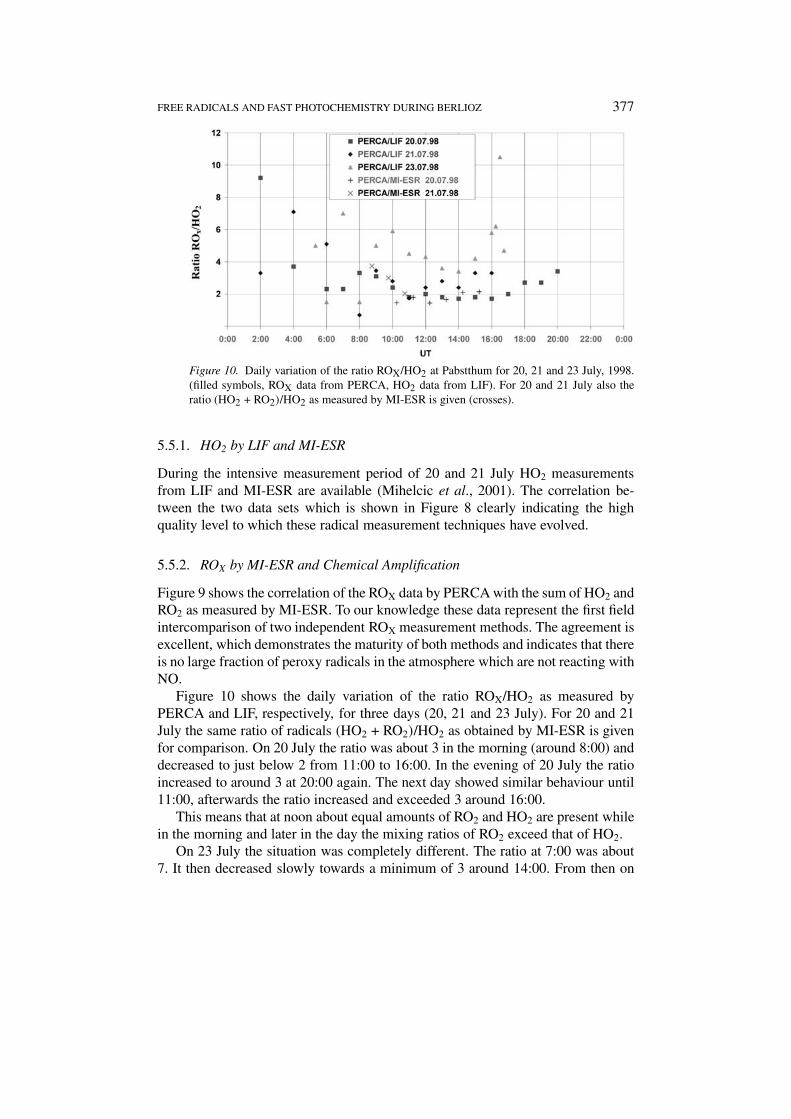
Figure 10. Daily variation of the ratio ROX/HO2 at Pabstthum for 20, 21 and 23 July, 1998.(filled symbols, ROX data from PERCA, HO2 data from LIF). For 20 and 21 July also theratio (HO2 + RO2)/HO2 as measured by MI-ESR is given (crosses).
5.5.1. HO2 by LIF and MI-ESR
During the intensive measurement period of 20 and 21 July HO2 measurementsfrom LIF and MI-ESR are available (Mihelcic et al., 2001). The correlation be-tween the two data sets which is shown in Figure 8 clearly indicating the highquality level to which these radical measurement techniques have evolved.
5.5.2. ROX by MI-ESR and Chemical Amplification
Figure 9 shows the correlation of the ROX data by PERCA with the sum of HO2 andRO2 as measured by MI-ESR. To our knowledge these data represent the first fieldintercomparison of two independent ROX measurement methods. The agreement isexcellent, which demonstrates the maturity of both methods and indicates that thereis no large fraction of peroxy radicals in the atmosphere which are not reacting withNO.
Figure 10 shows the daily variation of the ratio ROX/HO2 as measured byPERCA and LIF, respectively, for three days (20, 21 and 23 July). For 20 and 21July the same ratio of radicals (HO2 + RO2)/HO2 as obtained by MI-ESR is givenfor comparison. On 20 July the ratio was about 3 in the morning (around 8:00) anddecreased to just below 2 from 11:00 to 16:00. In the evening of 20 July the ratioincreased to around 3 at 20:00 again. The next day showed similar behaviour until11:00, afterwards the ratio increased and exceeded 3 around 16:00.
This means that at noon about equal amounts of RO2 and HO2 are present whilein the morning and later in the day the mixing ratios of RO2 exceed that of HO2.
On 23 July the situation was completely different. The ratio at 7:00 was about7. It then decreased slowly towards a minimum of 3 around 14:00. From then on
378 U. PLATT ET AL.
the ratio sharply rose to almost 11 at 16:30. Afterwards a thunderstorm moved ininterrupting the measurements. On this afternoon the RO2 exceeded the HO2 byfar. An explanation is given by the observation of unusually large mixing ratios ofisoprene increasing since noon. This result indicates the importance of hydrocarbonoxidation on the radical composition.
5.5.3. NO3 by MI-ESR and DOAS
Simultaneous measurements of nitrate radicals by MI-ESR and DOAS were per-formed in the night from 4 to 5 August 1998. During the first part of the nightboth data sets were in excellent agreement within their uncertainty: For instancethe average NO3 mixing ratio between 20:30 and 22:30 as measured by DOASwas (10.1 ± 0.8) ppt, while the MI-ESR technique found (10.3 ± 0.8) ppt. Becauseof increasing ground haze (which is an efficient NO3 sink) after 22:30 it is difficultto compare the absolute mixing ratios. Nevertheless the trend of both data sets isin good agreement. This intercomparison was published by Geyer et al. (1999).
6. Discussion
6.1. THE DAYTIME SOURCE OF HOx-RADICALS
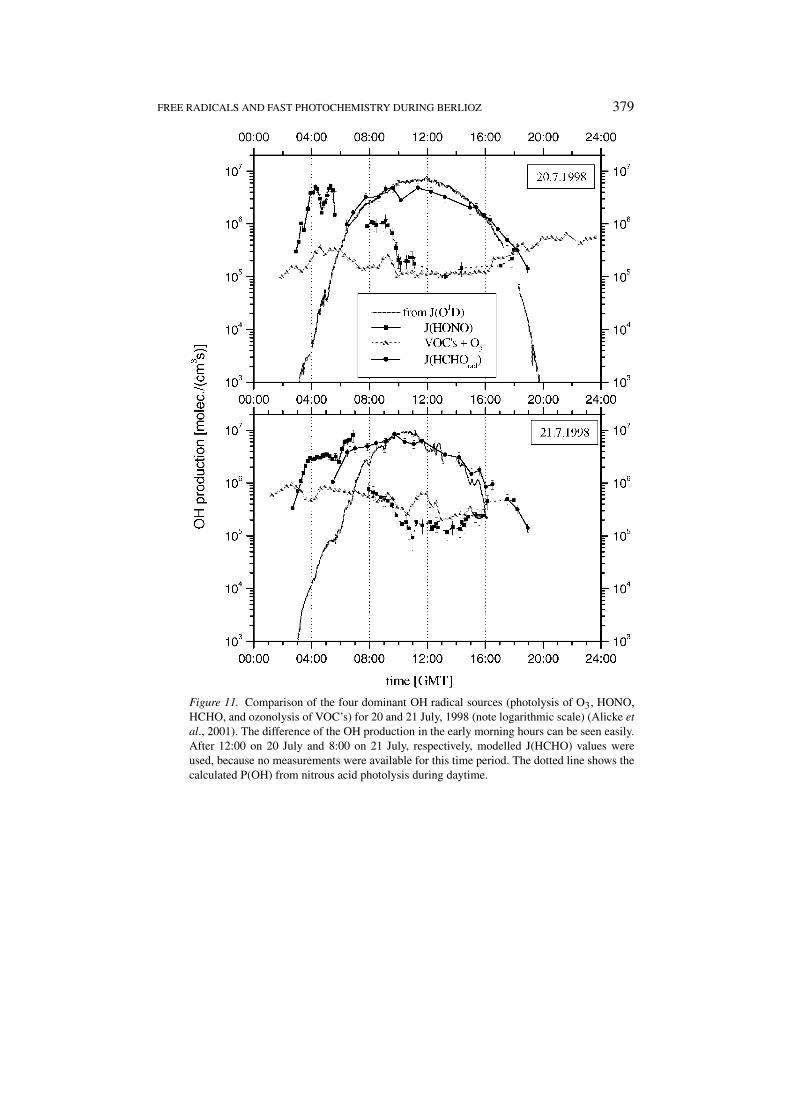
A comparison of the different OH formation mechanisms determined from mea-surements at Pabstthum during the BERLIOZ field campaign, shows the changingcontribution of the individual processes at different times of day. While ozone andHCHO photolysis are the most important mechanisms during most of the day, thedata (see Figure 11) clearly shows the importance of HONO in the early morninghours when it is almost the only source of OH radicals. The peak OH formationrate is comparable to the one by ozone photolysis at noon, but the formation onlylasts for about 3–4 hr. Although significant HONO levels are usually found inthe presence of elevated NO2 concentrations, which can remove the OH via theformation of HNO3, NO2 levels are typically not higher in the morning than duringthe day. Thus HONO – produced OH is no more likely to be consumed by reactionwith NO2 than OH from any other source. This shows that HONO photolysis canindeed start and accelerate the photochemical processes in the morning (see alsoAlicke et al., 2001).
The integrated morning OH formation from nitrous acid photolysis of(1.02 ± 0.18) ppb and (1.8 ± 0.25) ppb for 20 and 21 July, respectively has tobe compared to the 24 hr integrals of the other OH sources (J(HCHOrad) +J(O1D) + OH from the VOC’s) which together contribute (11.6 ± 1.9) ppb and(13.6 ± 2.5) ppb of OH for the two days. The morning HONO peak alone consti-tutes around 10–15% of the total daily OH formation. Calculating the nitrous acidsource strength from the increase of HONO during the night, we get an additionalOH production during daytime of (0.82 ± 0.4) ppb (respectively (1.4 ± 0.5) ppbfor 21 July) for the measured photolysis frequencies and NO2concentrations on the
FREE RADICALS AND FAST PHOTOCHEMISTRY DURING BERLIOZ 379
Figure 11. Comparison of the four dominant OH radical sources (photolysis of O3, HONO,HCHO, and ozonolysis of VOC’s) for 20 and 21 July, 1998 (note logarithmic scale) (Alicke etal., 2001). The difference of the OH production in the early morning hours can be seen easily.After 12:00 on 20 July and 8:00 on 21 July, respectively, modelled J(HCHO) values wereused, because no measurements were available for this time period. The dotted line shows thecalculated P(OH) from nitrous acid photolysis during daytime.
380 U. PLATT ET AL.
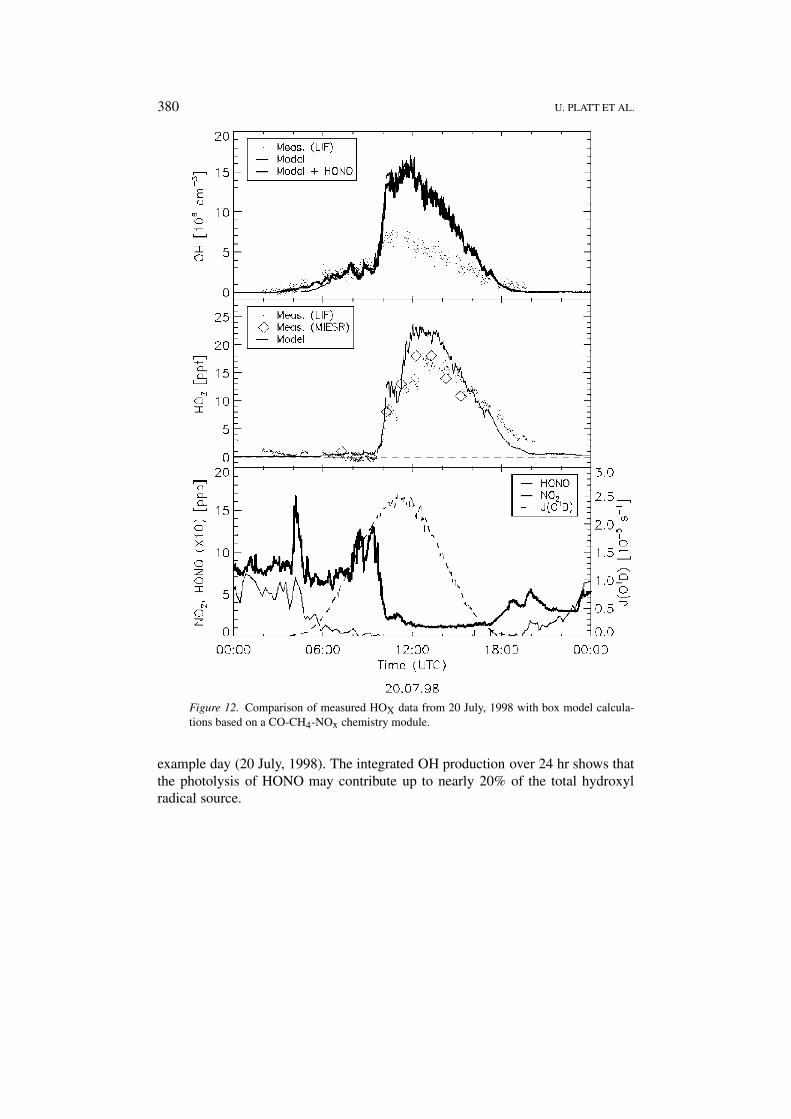
Figure 12. Comparison of measured HOX data from 20 July, 1998 with box model calcula-tions based on a CO-CH4-NOx chemistry module.
example day (20 July, 1998). The integrated OH production over 24 hr shows thatthe photolysis of HONO may contribute up to nearly 20% of the total hydroxylradical source.
FREE RADICALS AND FAST PHOTOCHEMISTRY DURING BERLIOZ 381
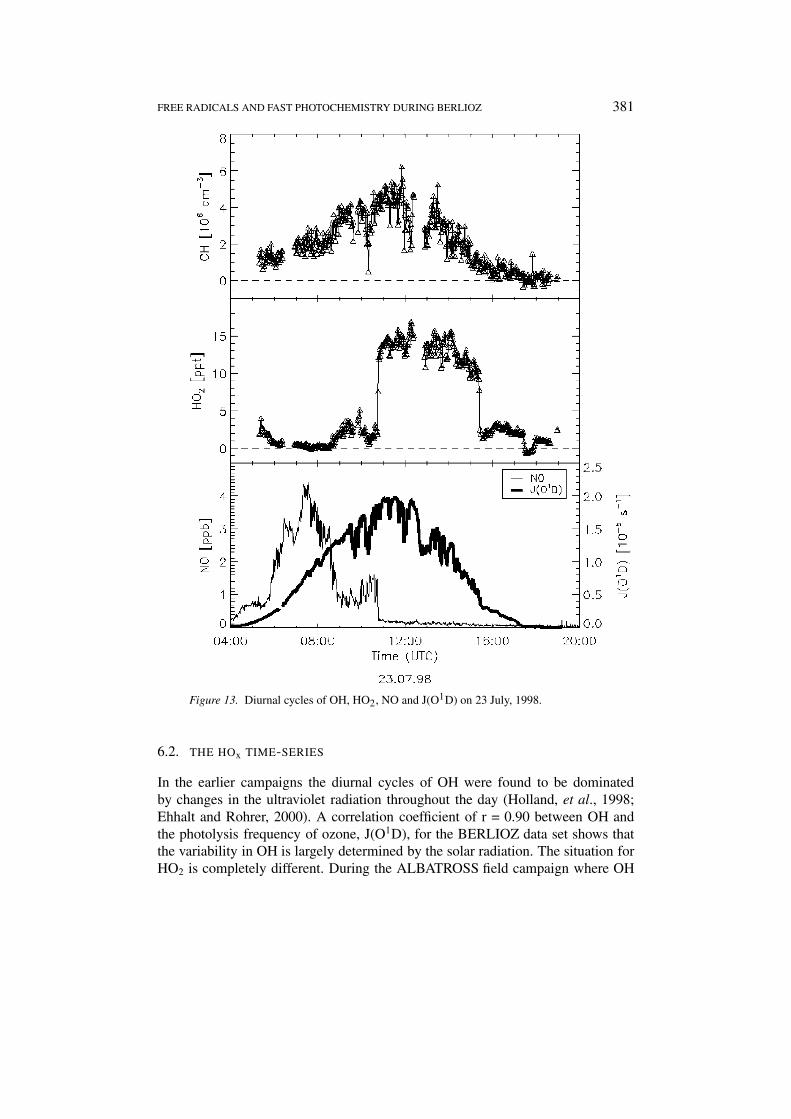
Figure 13. Diurnal cycles of OH, HO2, NO and J(O1D) on 23 July, 1998.
6.2. THE HOx TIME-SERIES
In the earlier campaigns the diurnal cycles of OH were found to be dominatedby changes in the ultraviolet radiation throughout the day (Holland, et al., 1998;Ehhalt and Rohrer, 2000). A correlation coefficient of r = 0.90 between OH andthe photolysis frequency of ozone, J(O1D), for the BERLIOZ data set shows thatthe variability in OH is largely determined by the solar radiation. The situation forHO2 is completely different. During the ALBATROSS field campaign where OH
382 U. PLATT ET AL.
and HO2 concentrations were measured in the remote marine boundary layer of theAtlantic Ocean we found a very high correlation between the HO2 concentrationand the square root of J(O1D) (Hofzumahaus and Webb, 1998). As is demonstratedin Figure 13 (showing OH, HO2, J(O1D), and NO on 23 July) this correlation isnot visible in Pabstthum. While the diurnal cycle of OH closely follows the ozonephotolysis frequency there is a striking mismatch between the profiles of J(O1D)and the HO2 concentration. On several days it was observed that HO2 lags behindJ(O1D) passing through its daytime maximum in the early afternoon when J(O1D)is already declining. The most prominent feature in the diurnal cycles of HO2,however, is the occurrence of rapid concentration changes (see Figure 13). Justbefore 11:00 UT the HO2 concentration increases by a factor of six within a coupleof minutes, remains at a high constant level for more than four hours and thensuddenly drops again by about 80%. While the increase can be understood in termsof the sudden drop of the NO level in the sampled air mass which is clearly visiblein the lower trace of Figure 13. However we have no explanation for the suddendecrease in the afternoon (about 15:30 UT), which is not accompanied by a similarincrease in NO or apparent change in any other measured parameter.
6.3. COMPARISON OF HOx DATA WITH PHOTOCHEMICAL MODELS
The measured HOX data were compared with the results of two box models (sinceOH and HOX reach their stationary state levels within seconds transport can beneglected):
(1) Employing simple CO-CH4-NOx chemistry including acetaldehyde and PAN.(2) Using the ‘Master Chemical Mechanism’ (MCM) (Jenkin et al., 1997), which
features very comprehensive VOC gas phase chemistry.
6.3.1. Modelling Based on Simple (Methane Only) Chemistry
A first attempt to model the HOX observations was made using a box model witha CO-CH4-NOx chemistry module including acetaldehyde and PAN. Any otherNMHC or VOC’s were neglected. This model was successfully tested in the past onthe POPCORN data set (Ehhalt, 1999). The model overestimated the OH measure-ments on average by 10%. Results for the present data set are displayed in Figure 12for 20 July, which was characterised by an air-mass change from high NOX levelsto significantly lower values shortly before 10:00 UT. The top- and centre panelshow measurements and model calculations for OH and HO2, while the bottompanel displays the corresponding diurnal cycles of J(O1D), NO2, and HONO. Theair-mass change which is the predominant feature in the NO2 trace is reflected inthe OH measurements by a sudden increase of the concentration from 3 × 106 cm−3
to 7 × 106 cm−3. The model – predicting much larger OH than measured – fails toreproduce the measurements after the drop in NOX. In the early morning hoursbefore 6:00 UT, while J(O1D) is still very low and NO2 levels are high the model

FREE RADICALS AND FAST PHOTOCHEMISTRY DURING BERLIOZ 383
underestimates the observations, followed by a 3-hour period of good agreement,where NO2 levels are still high and J(O1D) increases strongly. The time of thefollowing sudden OH increase is captured well by the model, however, the ampli-tude is clearly overestimated. Throughout the afternoon the model predicts muchhigher OH concentrations than measured. The disagreement in the early morninghours can be removed by including the photolysis of HONO – which acts as anOH source – into the model. Since the OH production via this process is drivenby longer-wavelength radiation than the ozone photolysis OH concentrations startto rise earlier in the morning than predicted by ozone photolysis alone. As can beseen in Figure 12 the model now nicely reproduces the OH measurements before6:00 UT.
In the case of HO2 the measurements show relatively low concentrations be-fore sunrise in the morning of 20 July. After sunrise HO2 concentrations evendrop to zero throughout the high NOX period. The air-mass change, however,dramatically changes this situation. Within minutes the HO2 concentration risesto 33 × 107 cm−3 and finally to 55 × 107 cm−3 at 13:00 UT. Two hours laterconcentrations start to decline again to about 6 × 107 cm−3 at 20:00 UT whenmeasurements stopped. Again the model can explain only part of the observations.It does capture the increase in HO2 when the air mass changes and reproducesthe time shift between the diurnal cycle of J(O1D) and HO2. Overall, however, themodel underestimates the night-time measurements at high NOX levels, overesti-mates HO2 at low NOX during noon time, and fails to explain the elevated HOX
level in the early evening.These first model studies show that a simple CO-CH4-NOx chemistry module,
which has performed well under clean-air conditions, is not capable of reproducingthe OH and HO2 observations in a more polluted environment as it was encounteredduring BERLIOZ. Therefore a second model study was performed using the verycomprehensive ‘Master Chemical Mechanism’ (MCM).
6.3.2. Modelling based on the Master Chemical Mechanism (MCM)
The MCM (Jenkin et al., 1997) was used to calculate the OH-, HO2-, and RO2-radical concentrations from the photolysis frequencies and trace gas concentrationsthat were simultaneously measured at the same location. The model was ini-tialised every 5 min (with NO, NO2, O3, PAN, CH2O, J(NO2) and J(O1D), whichwere measured with 1 min time resolution). In the model calculations measuredconcentrations of 71 different hydrocarbons were included. The hydrocarbon con-centrations were measured with a time resolution of 20 min, and oxygenatedhydrocarbons (carbonyls etc.) with a time resolution of one hour. The data wereintroduced in the model on the basis of 20 min or 1 hr values interpolated at timesteps of 5 min. In order to account for cloudiness modelled photolysis frequencies(calculated for clear-sky) were scaled to measured J(NO2) values. The J(O1D)values used in the model were averaged from 1-minute measured values. Resultsof measurements and model calculations are shown in Figures 4(a–d) for 20 July
384 U. PLATT ET AL.
at the Pabstthum station. In the morning between 6:00 and 9:30 two peaks of NOX
concentrations rise from 8 to 16 ppb (Figure 4(a)). There is some indication in thedata of NOX and CO (not shown here) that the substantial quantities of NOX, resultfrom emissions of Berlin transported to the station. After this time NOX concentra-tion dropped to usual daytime background levels in the range of 1 to 3 ppb. HighJ(NO2) values peaking at ≈ 9 × 10⁻³ (s−1) with low fluctuations indicate clear skyconditions.
Figure 4(b) shows the diurnal variations of measured OH concentrations (5 minaverages) on 20 July, superimposed on the MCM model calculated values (drawnlines). During the morning from 6 to 9:30, (the high NOX time period) modelcalculations agree with measurements within the uncertainty. During the high-NOX
period NO2 is the main reactant of OH (34% of total reactivity) followed by VOC(23% without CH4 which contributes another 4%) and CO (19%). Formaldehyde,acetaldehyde and other carbonyl compounds contribute 8, 3, and 9%, respectively.The most important VOC compounds during the high NOX period are isoprene andα-pinene, each of which accounts for about 20% of the total VOC reactivity. After10 UT the situation changes. The reaction of OH with NO2 becomes less importantnow (12%) and is outrun by the reactions with CO (27%), HCHO (18%), othercarbonyl compounds (19% with acetaldehyde accounting for 4%), VOC (15% withabout 1/3 due to the reaction with isoprene).
During the low NOX conditions the measured OH concentrations are about 25%smaller than the model results (at noon time). While the overestimation of OH bythe model is not as severe as in the case of the simple (CH4 only) model (seeSection 6.3.1), the reason for this disagreement is unclear. Particularly puzzlingis that the agreement between model calculations and measurements for HO2 andRO2 is much better. A consistent bias between calculated and measured OH forcontinental rural as well as urban locations has also been reported in several pre-vious publications (Perner et al., 1987; Poppe et al., 1994; Eisele et al., 1994;McKeen et al., 1997; Frost et al., 1998; Hauglustaine et al., 1999).
The measured HO2/OH ratio on 20 July starts off at about 20 just after sunrise, drops to nearly zero during the high NOX episode and then starts to rise withdecreasing NO levels to finally reach a maximum of about 200 in the late afternoon,when NO had dropped to 100 ppt. The MCM model calculation reproduces theincrease of the ratio quite well. On average it underestimates the measured ratio byabout 15%. However, the discrepancy depends on the NOX mixing ratio. At highNOX the model clearly overestimates the ratio (10 versus measured ≈ 0), while atlow NOX the observed ratio is slightly higher than the model data.
In order to estimate the influence of possible heterogeneous radical losses wecalculated the possible destruction of RO2 at aerosol surfaces during BERLIOZ.From measurements performed on 20 July a maximum surface area of 220 × 10−6
(m2 m−3) was derived. Based on an uptake coefficient γ (HO2) of 0.2 (DeMore etal., 1997) and assuming γ (RO2) to be similar a maximum loss rate of 0.005 s−1
corresponding to a minimum lifetime of 200 s due to loss at aerosol surfaces was
FREE RADICALS AND FAST PHOTOCHEMISTRY DURING BERLIOZ 385
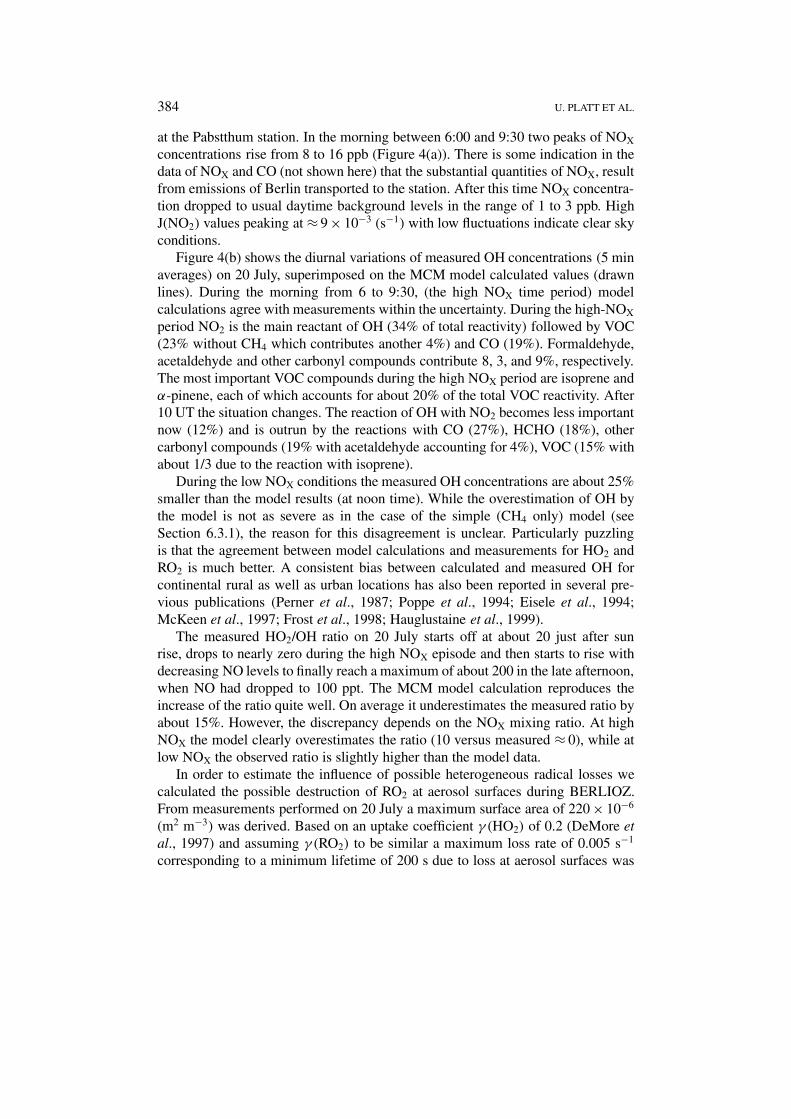
Figure 14. Diurnal variation of NOX (dashed line) and the ozone formation rate as derivedfrom MI-ESR ROX – data (P(O3)MIESR, dots) and from model calculations (P(O3)Model,drawn line) on 20 July, 1998.
obtained. Due to the much faster reaction of HO2 and RO2 with NO little differencewas observed in the modelled [OH], [HO2] and �[RO2] (<5%).
6.4. THE OZONE PRODUCTION RATE
The local ozone production rate P(O3) was calculated from the observed RO2, HO2,and NO concentrations by the equation:
P(O3) = [NO] × (k1[HO2] + �ki × [RO2]i) , (3)
using direct measurements of NO, HO2 and RO2 concentrations. Figure 14 showsthe diurnal variation of P(O3) and NOX on 20 July. P(O3) increases with increasingHO2- and RO2- concentrations, reaching a maximum value of 8 ppb hr−1 dur-ing noon time and at low NOX. The observed and calculated P(O3) shows goodagreement, except for two points at high NOX, where, however, the measured ROX
hardly exceeded the detection limit.
6.5. THE OXIDATION CAPACITY OF NO3
The relative contributions – during 24 hr – to the oxidation capacity of the conti-nental boundary layer of NO3, OH and ozone at the Pabstthum station near Berlinwere calculated using the measured concentrations of these radicals, of more than50 different VOC’s, CO, and a fixed CH4 mixing ratio of 1.8 ppm. For that purpose
386 U. PLATT ET AL.
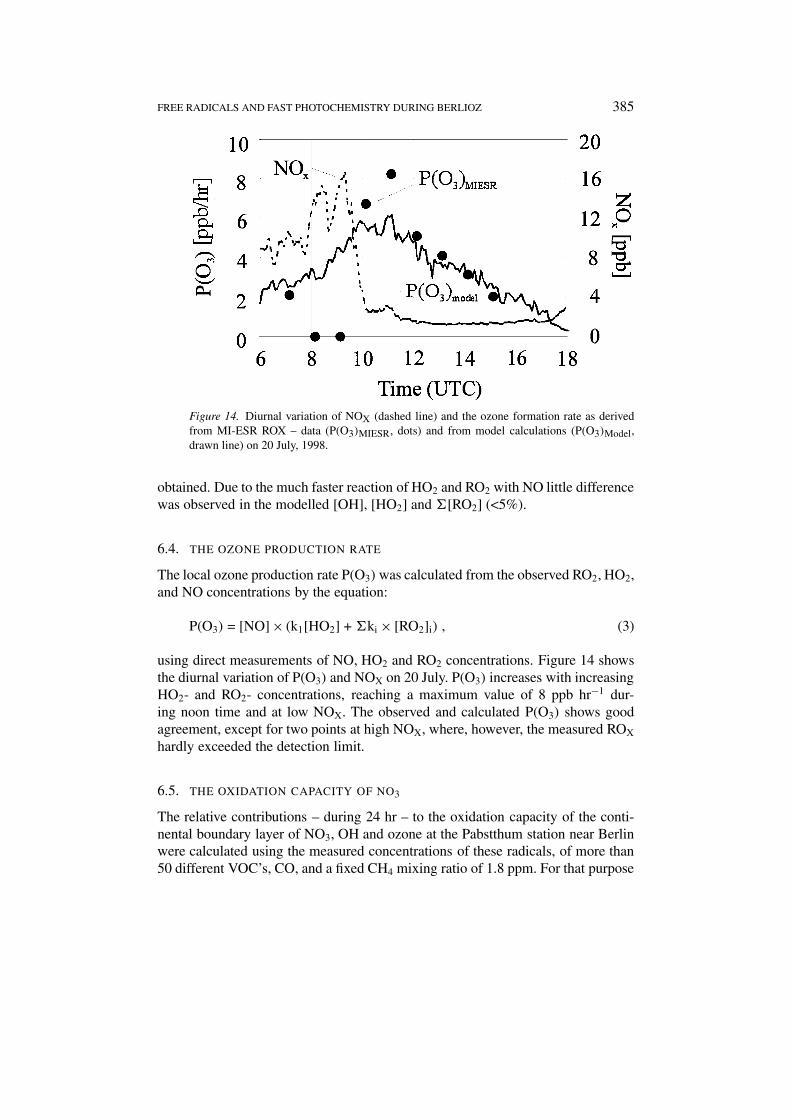
Figure 15. Comparison of the relative contribution of NO3, OH, and ozone to the 24 hrintegral of the oxidation capacity (see Equation (4)) at the station of Pabstthum. Data arecalculated for the oxidation of non-methane VOC’s only (dark bars) and VOC’s + CO +methane (grey bars).
NO3 daytime levels were modelled. During the campaign a mean daytime (SZA <85 ◦C) NO3 mixing ratio of 0.25 ppt was calculated with a corresponding averagenoontime value of 0.04 ppt.
The ‘oxidation capacity’ (OC) of an oxidising agent (e.g., NO3, OH radical orO3) X is defined as the sum of the respective oxidation rates of the molecules Yi
(in our case the 50 VOC species, CO, and CH4) by X (Geyer et al., 2001a):
OC =∑
i=1
kYi−X[Yi][X] . (4)
The OC is accordingly given in units of molecules cm−3 s−1. Due to the low mixingratios the daytime oxidation capacity of NO3 is almost negligible (about 0.5 × 10⁵
cm−3 s1). The night-time oxidation capacity of the nitrate radical at the station var-ied from 1.1–59 × 105 cm−3s−1 (night averages). An average 24 h-integral of thenitrate radical oxidation capacity of 4.5 × 105 cm−3 s−1 was obtained. Comparedto the oxidation capacity of OH and ozone, NO3 was responsible for 17% of theoxidation of VOC’s, CO and methane. Considering VOC’s alone, the 24 hr nitrateradical contribution to the total VOC depletion was 28% (Figure 15) (Geyer et al.,2001a).
The importance of night-time, non-photolytical conversion of NOX to HNO3 viaN2O5 hydrolysis was found to be comparable to the daytime reactions of NO2 with
FREE RADICALS AND FAST PHOTOCHEMISTRY DURING BERLIOZ 387
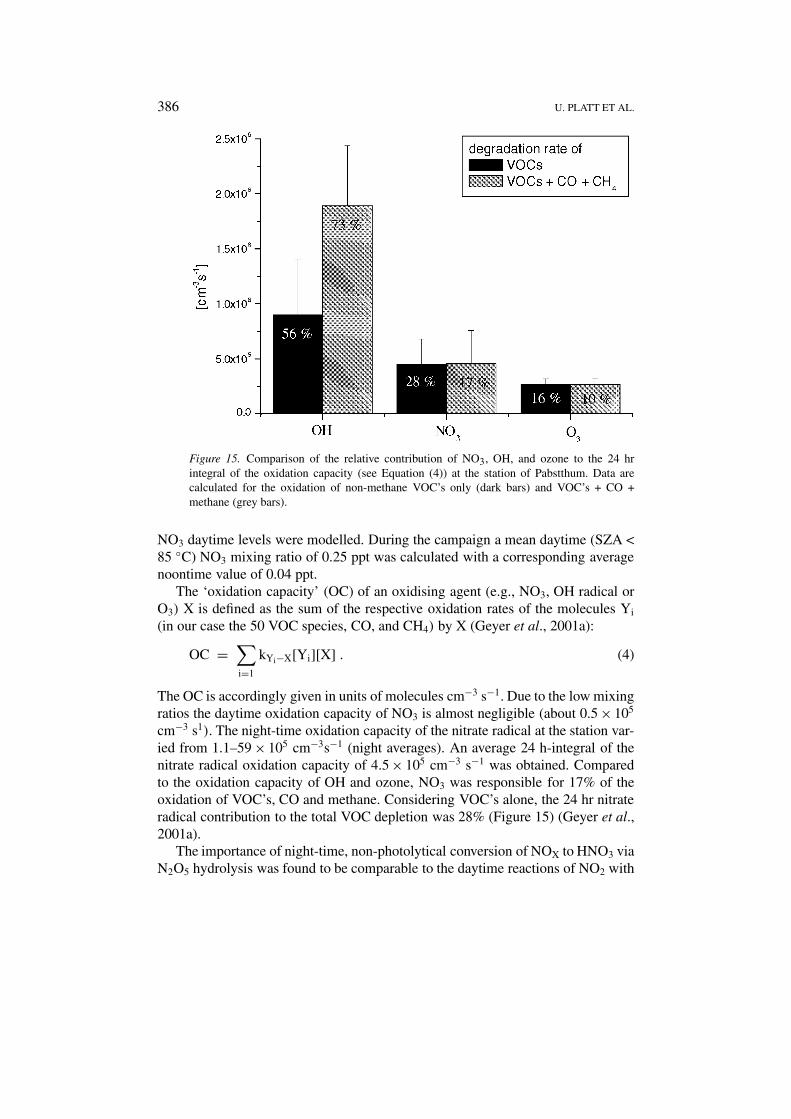
Figure 16. Correlation of the modelled mixing ratios of RO2 and NO3 for all nights ofBERLIOZ (grey lines). The nights of 20 and 21 July (night 1, squares) and 4 and 5 August,1998 (night 2, triangles) are discussed in the text.
OH, giving rise to an accumulated production of almost 2 ppb HNO3 (or NO−3 )
during the night (Geyer et al., 2001a).
6.6. INTERACTION NO3–ROx DURING THE NIGHT
At the BERLIOZ site Pabstthum simultaneous observations of NO3, RO2, HO2,and OH took place during several nights producing one of the most comprehensivedata sets of night-time radical measurements. A box model was used to studythe role of NO3 and other trace gases for the observed night-time concentrationsof ROX (Geyer et al., 2001b). Reactions of NO3 with VOC’s, mainly with bio-genic monoterpenes, were shown to constitute a considerable source of organicperoxy radicals during night-time. Average contributions during the campaign ofNO3 to the night-time production of OH, HO2 and RO2 of 36%, 53%, and 77%,respectively, were calculated (Geyer et al., 2001b).
Generally a positive, linear correlation of the mixing ratios of RO2 and NO3
was observed and modelled during the campaign (Figure 16). It is interesting tonote that a similar positive correlation has also been reported for a marine envi-ronment by Carslaw et al. (1997). The analysis showed that this dependency canbe attributed to the strong influence of NO on both radicals, which are depletedefficiently at increasing NO levels. In addition during nights, when VOC’s were ofminor importance for the NO3 removal, the production rate of RO2 increased withincreasing NO3 concentration. During many nights a significant increase of theROX mixing ratio was observed after sun set followed by a plateau of some hours
388 U. PLATT ET AL.
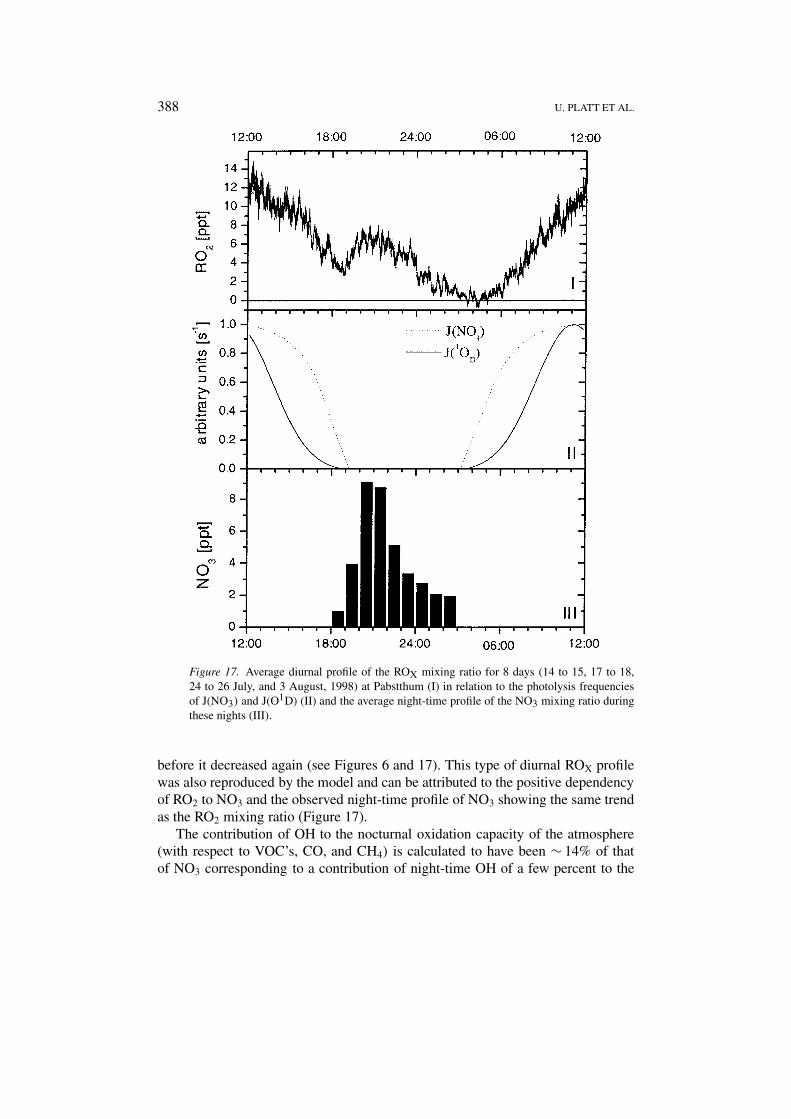
Figure 17. Average diurnal profile of the ROX mixing ratio for 8 days (14 to 15, 17 to 18,24 to 26 July, and 3 August, 1998) at Pabstthum (I) in relation to the photolysis frequenciesof J(NO3) and J(O1D) (II) and the average night-time profile of the NO3 mixing ratio duringthese nights (III).
before it decreased again (see Figures 6 and 17). This type of diurnal ROX profilewas also reproduced by the model and can be attributed to the positive dependencyof RO2 to NO3 and the observed night-time profile of NO3 showing the same trendas the RO2 mixing ratio (Figure 17).
The contribution of OH to the nocturnal oxidation capacity of the atmosphere(with respect to VOC’s, CO, and CH4) is calculated to have been ∼ 14% of thatof NO3 corresponding to a contribution of night-time OH of a few percent to the
FREE RADICALS AND FAST PHOTOCHEMISTRY DURING BERLIOZ 389
24 hr integral of the total atmospheric oxidation capacity (Geyer et al., 2001b).This study shows again that high concentrations of peroxy radicals and noticeableOH levels can be produced during night by reactions of nitrate radicals or ozonewith VOC’s. The production of these radicals raises the oxidation capacity of thenocturnal atmosphere. In addition VOC’s which are not oxidised by NO3 or O3,e.g., aromatics or alkanes, can be removed by night-time OH radicals.
7. Summary
A large set of direct and simultaneous radical- (OH, HO2, RO2, NO3) and precursormeasurements has been obtained in summer, 1998 during the BERLIOZ campaignin a rural environment close to the city of Berlin. To evaluate the processes andcompounds controlling the local photochemistry in polluted and background air,the broad database obtained during 20 July, was compared in a case study withbox model calculations using the MCM-, and CMC-model. The comparison ofthe measurements and model results confirms our qualitative understanding ofimportant processes of tropospheric chemistry on this day, but it also shows thatthere might be considerable gaps in our understanding of the atmospheric radicalchemistry under moderately polluted conditions. In particular we can summarisethe following points:
• An intercomparison of HO2 measurements by LIF and MI-ESR and of HO2
+ RO2 measurements by a chemical amplifier and MI-ESR was carried outsuccessfully and gives further confidence in the peroxy radical measurements.
• The master-chemical-mechanism (MCM) model yields a relative good qual-itative description of the measured diurnal profiles of OH, HO2, and RO2.In particular, the rapid change in the radical concentrations upon the suddenchange of the pollution level is well reproduced. The HO2 and RO2 concen-trations are quantitatively well described by the model. OH is well reproducedonly at NOX > 5 ppb, whereas it is overestimated by roughly a factor of 1.6 atlow NOX.
• Direct evidence has been found that the photolysis of HONO is an importantsource for OH in the early morning for a duration of about 2–3 hr with OHproduction rates similar to those from O3 photolysis during noontime.
• Biogenic and anthropogenic hydrocarbons were found to play an important,ambivalent role. During daytime they constitute a considerable sink for OH,but even the inclusion of the large set of measured VOC in the MCM mecha-nism cannot resolve the model overprediction of OH at low NOX conditions.This may indicate that the VOC – chemistry is incomplete (e.g., Lewis et al.,2000), both, with respect to species considered and as far as mechanisms areconcerned.
• At night-time, direct radical measurements have demonstrated that the bio-genic VOC’s constitute a significant source of peroxy radicals due to ozonoly-sis and reaction with NO3 radicals.
390 U. PLATT ET AL.
• Maximum ozone production is achieved by low NOX conditions with a maxi-mum value of 8 ppb hr−1. The MCM model correctly describes the measuredozone production.
In view of the important role that VOC’s play in the semi-polluted rural envi-ronment, what can be done to improve further our understanding? Based on theexperience gained during BERLIOZ, future campaigns should pay attention to thefollowing points:
• Better, and more comprehensive VOC – measurements are required, possiblywith higher time resolution.
• In particular improved HCHO – and higher aldehyde – measurements shouldbe made (this may require the development of new or improvement of existingtechnology).
• Speciated measurements of organic peroxy radicals would be very helpful toassess the role of VOC on the radical chemistry and their contribution to thephotochemical ozone production.
Acknowledgements
We gratefully acknowledge financial support granted by the Bundesministerium fürBildung und Forschung (BMBF) within the ‘ToposphärenforschungsschwerpunktTFS/LT3’.
References
Alicke, B., Geyer, A., Hofzumahaus, A., Holland, F., Konrad, S., Pätz, H. W., Schäfer, J., Stutz, J.,Volz-Thomas, A., and Platt, U., 2001: OH formation by HONO photolysis during the BERLIOZexperiment., J. Geophys. Res., submitted (BERLIOZ special section ‘PHOEBE’).
Allan, B. J., Carlslaw, N., Coe, H., Burgess, R. A., and Plane J. M. C., 1999: Observation of thenitrate radical in the marine boundary layer, J. Atm. Chem. 33, 129–154.
Berresheim, H., Elste, T., Plass-Dülmer, C., Eisele, F. L., and Tanner D. J., 2000: Chemical ionizationmass spectrometer for long-term measurements of atmospheric OH and H2SO4, Int. J. MassSpectrom. 202, 91–103.
Brandenburger, U., Brauers, T., Dorn H.-P., Hausmann, M., and Ehhalt, D. H., 1998: In situ mea-surements of tropospheric hydroxyl radicals by folded long-path laser absorption during the fieldcampaign POPCORN, J. Atmos. Chem. 31, 181–204.
Brauers, T., Aschmutat, U., Brandenburger, U., Dorn, H. P., Hausmann, M., Heßling, M., Hofzuma-haus, A., Holland, F., Plass-Dülmer, C., and Ehhalt, D. H., 1996: Intercomparison of troposphericOH radical measurements by multiple folded long-path laser absorption and laser inducedfluorescence, Geophys. Res. Lett. 23, 2545–2548.
Brenninkmeijer, C. A. M., Manning, M. R., Lowe, D. C., Wallace, G. A., Sparks R. J., and Volz-Thomas, A., 1992: Interhemispheric asymmetry in OH abundance inferred from measurementsof atmospheric 14CO, Nature 356, 50–52.
Brune, W. H., Stevens, P. S., and Mather, J. H., 1995: Measuring OH and HO2 in the troposphere bylaser-induced fluorescence at low pressure, J. Atmos. Sci. 52, 3328–3336.
FREE RADICALS AND FAST PHOTOCHEMISTRY DURING BERLIOZ 391
Brune, W. H., Faloona, I. C., Tan, D., Weinheimer, A. J., Campos, T., Ridley, B. A., Vay, S. A.,Collins, J. E., Sachse, G. W., Jaegle L., and Jacob, D. J., 1998: Airborne in situ OH and HO2observations in the cloud-free troposphere and lower stratosphere during SUCCESS, Geophys.Res. Lett. 25, 1701–1704.
Calvert, J. G., Lazrus, A., Kok, G. L., Heikes, B. G., Walega, J. G., Lind, J., and Cantrell, C., A.,1985: Chemical mechanisms of acid generation in the troposphere, Nature 317, 27–35.
Campbell, M. J., Farmer, J. C., Fitzner, C. A., Henry, M. N., Sheppard, J. C., Hardy R. J., Hopper J.F., and Muralidhar, V., 1986: Radiocarbon tracer measurements of atmospheric hydroxyl radicalconcentrations, J. Atmos. Chem. 4, 413–427.
Cantrell, C. A., Stedman, D. H., and Wendel, G. J., 1984: Measurement of atmospheric peroxyradicals by chemical amplification, Analyt. Chem. 56, 1496–1502.
Cantrell, C. A., Shetter, R. E., Lind, J. A., McDaniel, A. H., Calvert, J. G., Parrish, D. D., Fehsenfeld,F. C., Buhr, M. P., and Trainer, M., 1993: An improved chemical amplifier technique for peroxyradical measurements, J. Geophys. Res. 98, 2897–2909.
Carslaw, N., Carpenter, L. J., Plane, J. M. C., Allan, B. J., Burgess, R. A., Clemitshaw, K. C., Coe, H.,and Penkett, S. A., 1997: Simultaneous observations of nitrate and peroxy radicals in the marineboundary layer. J. Geophys. Res. 102, 18917–18933.
Carslaw, N., Creasey, D. J., Heard, D. E., Lewis, A. C., McQuaid, J. B., Pilling, M. J., Monks, P. S.,Bandy, B. J., and Penkett, S. A., 1999: Modelling OH, HO2, and RO2 radicals in the marineboundary layer: 1. Model construction and comparison with field measurements, J. Geophys.Res. 104, 30241–30255.
Chin, M. and Jacob, D. J., 1996: Anthropogenic and natural contributions to tropospheric sulphate:A global model analysis, J. Geophys. Res. 101, 18691–18699.
Creasey D. J., Heard D. E., Halford-Maw P. A., Pilling M. J., and Whitaker B. J., 1997: Imple-mentation and initial deployment of a field instrument for measurement of OH and HO2 in thetroposphere by laser-induced fluorescence, J. Chem. Soc., Faraday Trans. 93, 2907.
Crutzen, P. J., 1974: Photochemical reactions initiated by and influencing ozone in unpollutedtropospheric air, Tellus 26, 47–57.
DeMore, W. B., Sander, S. P., Howard, C. J., Ravishankara, A. R., Golden, D. M., Kolb, C. E.,Hampson, R. F., Kurylo, M. J., and Molina, M. J., 1997: Chemical Kinetics and PhotochemicalData for Use in Stratospheric Modeling, Evaluation Number 12, JPL Publication 97-4, NASA.
Dorn, H. P., Brandenburger, U., Brauers, T., Hausmann, M., and Ehhalt, D. H., 1996: In situ detectionof tropospheric OH radicals by folded long-path laser absorption. Results from the POPCORNfield campaign in August 1994, Geophys. Res. Lett. 23, 2537–2540.
Ehhalt, D. H., 1999: Photooxidation of trace gases in the troposphere, Phys. Chem. Chem. Phys. 1,5401–5408.
Ehhalt, D. H. and Rohrer, F., 2000: Dependence of the OH concentration on solar UV, J. Geophys.Res. 105, 3565–3571.
Eisele, F. L. and Tanner, D. J., 1991: Ion-assisted tropospheric OH measurements, J. Geophys. Res.D5, 9295–9308.
Eisele, F. L., Mount, G. H., Fehsenfeld, F. C., Harder, J., Madronich, E., Parrish, D. D., Roberts, J.,Trainer, M. and Tanner, D., 1994: Intercomparison of tropospheric OH and ancillary trace gasmeasurements at Fritz Peak Observatory, Colorado, J. Geophys. Res. 99, 18605–18626.
Eisele, F. L., Tanner, D. J., Cantrell, C. A., and Calvert, J. G., 1996: Measurements and steady statecalculations of OH concentrations at Mauna Loa Observatory, J. Geophys. Res. 101, 14665–14679.
Felton, C. C., Sheppard, J. C., and Campbell, M. J., 1990: The radiochemical hydroxyl radicalmeasurement method, Environ. Sci. Techn. 24, 1841–1847.
Frost, G. J., Tanner, D., Allwine, G., Buhr, M. P., Calvert, J. G., Cantrell, C., Fehsenfeld, F. C.,Goldan, P., Herwehe, J., Hübler, G., Kuster, W. C., Martin, R., McMillen, R. T., Montzka, S.A., Norton, R. B., Parrish, D. D., Ridley, B. A., Shetter, R. E., Walega, J. G., Watkins, B. A.,
392 U. PLATT ET AL.
Westberg, H. H., and Williams, E. J., 1998: Photochemical ozone production in the rural south-eastern United States during the 1990 Rural Oxidants in the Southern Environment (ROSE)program, J. Geophys. Res. 103, 22491–22508.
George, L. A., Hard, T. M. and O’Brien, R. J., 1999: Measurement of free radicals OH and HO2 inLos Angeles smog, J. Geophys. Res. 104, 11643–11655.
Geyer, A., Alicke, B., Mihelcic, D., Stutz, J., and Platt, U. 1999: Comparison of troposphericNO3 radical measurements by differential optical absorption spectroscopy and matrix isolationelectron spin resonance, J. Geophys. Res. 104, 26097–26105.
Geyer, A., Alicke, B., Konrad, S., Schmitz, T., Stutz, J., and Platt, U., 2001a: Chemistry and oxidationcapacity of the nitrate radical in the continental boundary layer near Berlin, J. Geophys. Res. 106,8013–8025.
Geyer, A., Hofzumahaus, A., Holland, F., Konrad, S., Klüpfel, T., Pätz, H.-W., Perner, D., Mihelcic,D., Schäfer, H.-J., Volz-Thomas, A., and Platt, U., 2001b: Night-time production of peroxy-and hydroxyl radicals during the BERLIOZ ampaign – observations and modelling studies, J.Geophys. Res., submitted (BERLIOZ special section ‘PHOEBE’).
Geyer, A., Ackermann, R., Dubois, R., Lohrmann, B., Müller, T., and Platt, U., 2001c: Long-termobservation of nitrate radicals in the continental boundary layer near Berlin, Atmos. Environ. 35,3619–3631.
Gölz, C., Senzig, J., and Platt, U., 2001: NO3 initiated oxidation of biogenic hydrocarbons: Anighttime source of peroxy radicals, CHEMOSPHERE, in press.
Hard, T. M., Chan, C. Y., Mehrabzadeh, A. A. and O’Brien, R. J., 1992: Diurnal HO2 cycles at cleanair and urban sites in the troposphere, J. Geophys. Res. 97, 9785–9794.
Hard, T. M., George, L. A., and O’Brien, R. J., 1995: FAGE Determination of Tropospheric HO andHO2, J. Atmos. Sciences 52, 3354–3372.
Hastie, D. R., Weißenmayer, M., Burrows, J. P., and Harris, G. W., 1991: Calibrated chemicalamplifier for atmospheric ROX measurements, Anal. Chem. 63, 2048–2057.
Hauglustaine, D. A., Madronich, S., Ridley, B. A., Flocke, S. J., Cantrell, C. A., Eisele, F. L., Shetter,R. E., Tanner, D. J., Ginoux, P., and Atlas, E. L., 1999: Photochemistry and budget of ozoneduring the Mauna Loa Observatory Photochemistry Experiment (MLOPEX 2), J. Geophys. Res.104, 30275–30307.
Heintz, F., Flentje, H., Dubois, R., and Platt, U., 1996: Long term observation of nitrate radicals atthe TOR station Kap Arkona (Rügen, J. Geophys. Res. 101, 22891–22910.
Hofzumahaus, A., Aschmutat, U., Heßling, M., Ehhalt, F., and Holland, D. H., 1996: The mea-surement of tropospheric OH radicals by laser-induced fluorescence spectroscopy during thePOPCORN field campaign, Geophys. Res. Lett. 23, 2541–2544.
Hofzumahaus, A., Aschmutat, U., Brandenburger, U., Brauers, T., Dorn, H.-P., Hausmann, M.,Heßling, M., Holland, F., Plass-Dülmer, C., and Ehhalt, D. H., 1998a: Intercomparison of tro-pospheric OH measurements by different laser techniques during the POPCORN Campaign1994, J. Atmos. Chem. 31, 227–246.
Hofzumahaus, A. and Webb, C. E., 1998b: Development of a compact transportable instrument forthe measurement of tropospheric OH and HO2 on remote and airborne platforms (DCHOR: Finalreport for EU project under contract no. ENV4-CT95-0003.
Holland, F., Hessling, M., and Hofzumahaus, A., 1995: In situ measurement of tropospheric OHradicals by laser-induced fluorescence – a description of the KFA instrument, J. Atmos. Sci. 52,3393–3401.
Holland, F., Aschmutat, U., Heßling, M., Hofzumahaus, A., and Ehhalt, D. H., 1998: Highly timeresolved measurements of OH during POPCORN using laser induced fluorescence spectroscopy,J. Atmos. Chem. 31, 205–225.
Holland, F., Hofzumahaus, A., Schäfer, J., Kraus, A., and Pätz, H.-W., 2001: Measurements of OHand HO2 radical concentrations and photolysis frequencies during BERLIOZ, J. Geophys. Res.,submitted (BERLIOZ special section ‘PHOEBE’).
FREE RADICALS AND FAST PHOTOCHEMISTRY DURING BERLIOZ 393
Jenkin, M. E., Saunder, S. M., and Pilling, M. J., 1997: The tropospheric degradation of volatileorganic compounds: A protocol for mechanism development, Atmos. Environ. 31, 81–104.
Levy, H., 1971: Normal atmosphere: Large radical and formaldehyde concentrations predicted,Science 173, 141–143.
Lewis, A. C. et al., 2000: A larger pool of ozone-forming carbon compounds in urban atmospheres,Nature 405, 778–781.
McKeen, S. A., Trainer, M., Hsie, E. Y., Tallamraju, R. K., and Liu, S. C., 1990: On the indirect de-termination of atmospheric OH radical concentrations from reactive hydrocarbon measurements,J. Geophys. Res. 95, 7493–7500.
McKeen, S. A., Mount, G., Eisele, F. L., Williams, E., Harder, J., Goldan, P., Kuster, W., Liu, S. C.,Baumann, K., Tanner, D., Fried, A., Sewell, S., Cantrell, C., and Shetter, R., 1997: Photochem-ical modelling of hydroxyl and its relationship to other species during the tropospheric OHphotochemistry experiment, J. Geophys. Res. 102, 6467–6493.
Mihelcic, D., Müsgen, P., and Ehhalt, D. H., 1985: An improved method of measuring troposphericNO2 and RO2 by matrix isolation and electron spin resonance, J. Atmos. Chem. 3, 341–361.
Mihelcic, D., Klemp, D., Müsgen, P., Pätz, H. W., and Volz-Thomas, A., 1993: Simultaneousmeasurements of peroxy and nitrate radicals at Schauinsland, J. Atmos. Chem. 16, 313–335.
Mihelcic, D., Müsgen, P., Pätz, H. W., Schmitz, T., Konrad, S., Volz-Thomas, A., Holland, F.,Hofzumahaus, A., Schäfer, H.-J., Geyer, A., Platt, U., Bächmann, K., Schlomski, S., Moortgat,G., Grossmann, D., Perner, D., and Klüpfel, T., 2001: Measurements and model calculationsof OH-, HO2-, RO2-radicals and local ozone production during the BERLIOZ campaign, J.Geophys. Res., submitted (BERLIOZ special section ‘PHOEBE’).
Mihele, C. M. and Hastie, D. R., 1998: The sensitivity of the radical amplifier to ambient watervapour, Geophys. Res. Lett. 25, 1911–1913.
Monks, P. S., Carpenter, L. J., Penkett, S. A., and Ayers, G. P., 1996: Night-time peroxy radicalchemistry in the remote marine boundary layer over the southern ocean, Geophys. Res. Lett. 23,535–538.
Mount, G. H., 1992: The measurement of tropospheric OH by long path absorption. 1. Instrumenta-tion, J. Geophys. Res. 97, 2427–2444.
Mount, G. H. and Eisele, F. L., 1992: An intercomparison of tropospheric OH. Measurements at FritzPeak Observatory, Colorado, Science 256, 1187–1190.
Nelson, H. H., Pasternack, L., and McDonald, J. R., 1983: Laser-induced excitation and emissionspectra of NO3, J. Phys. Chem. 87, 1286–1288.
Noxon, J. F., 1983: NO3 and NO2 in the mid-Pacific troposphere, J. Geophys. Res. 88, 11017–11021.Parrish, D. D., Trainer, M., Williams, E. J., Fahey, D. W., Hübler, G., Eubank, C. S., Liu, S. C.,
Murphy, P. C., Albritton, D. L., and Fehsenfeld, F. C., 1986: Measurements of the NOx-O3photostationary state at Niwot Ridge, Colorado, J. Geophys. Res. 91, 5361–5370.
Penkett, S. A., Blake, N. J., Lightman, P., Marsh, A. R. W., Anwyl, P., and Butcher, G., 1993: Theseasonal variation of nonmethane hydrocarbons in the free troposphere over the North AtlanticOcean: Possible evidence for extensive reaction of hydrocarbons with the nitrate radical, J.Geophys. Res. 98, 2865–2885.
Perner, D., Platt, U., Trainer, M., Hübler, G., Drummond, J. W., Junkermann, W., Rudolph, J.,Schubert, B., Volz, A., Ehhalt, D. H., Rumpel, K. J., and Helas, G., 1987: Measurement oftropospheric OH concentrations: A comparison of field data with model predictions, J. Atmos.Chem. 5, 185–216.
Perner, D., Arnold, T., Crowley, J., Klüpfel, T., Martinez, M., and Seuwen, R., 1999: The mea-surements of active chlorine in the atmosphere by chemical amplification, J. Atmos. Chem. 34,9–20.
Plane, J. M. C. and Nien, C. F., 1991: in H. I. Schiff (ed.), Study of Night-Time NO3 Chemistry byDifferential Optical Absorption Spectroscopy, SPIE Proc. Vol. 1433.
394 U. PLATT ET AL.
Platt, U., Perner, D., Harris, G. W., Winer, A. M., and Pitts, J. M., 1980: Detection of NO3 in thepolluted troposphere by differential optical absorption, Geophys. Res. Lett. 7, 89–92.
Platt, U., Perner, D., Schröder, H., Kessler, C., and Toenissen, A., 1981: The diurnal variation ofNO3, J. Geophys. Res. 86, 11965–11970.
Platt, U., Winer, A. M., Biermann, H. W., Atkinson, R., and Pitts, J. N., 1984: Measurement of nitrateradical concentrations in continental air, Environm. Sci. Techn. 18, 365–369.
Platt, U., Rateike, M., Junkermann, W., Rudolph, J., and Ehhalt, D. H., 1988: New tropospheric OHmeasurements, J. Geophys. Res. 93, 5159–5166.
Platt, U., LeBras, G., Poulet, G., Burrows, J. P., and Moortgat, G., 1990: Peroxy radicals from night-time reaction of NO3 with organic compounds, Nature 348, 147–149.
Platt, U. and Hausmann, M., 1994: Spectroscopic measurement of the free radicals NO3, BrO, IO,and OH in the troposphere, Res. Chem. Intermed. 20, 557–578.
Platt, U. and Janssen, C., 1996: Observation and role of the free radicals NO3, ClO, BrO and IO inthe Troposphere, Faraday Discuss 100, 175–198.
Platt, U., 1997: Free radicals in the tropospheric chemistry, in The Oxidation Capacity of the At-mosphere, Proc. 7th Europ. Symp. on Physico-Chemical Behaviour of Atmospheric Pollutants,Venice, 2–4 October 1996, pp. 16–27.
Reiner, T., Hanke, M., Arnold, F., Ziereis, H., Schlager, H., and Junkermann, W., 1999: Aircraft-borne measurements of peroxy radicals by chemical conversion/ion molecule reaction massspectrometry: Calibration, diagnostics, and results, J. Geophys. Res. 104, 18647–18660.
Schultz, M., Heitlinger, M., Mihelcic, D., and Volz-Thomas, A., 1995: Calibration source for peroxyradicals with built-in actinometry using H2O and O2 photolysis at 185 nm, J. Geophys. Res. 100,18811–18816.
Smith, N., Plane, J. M. C., Nien, C.-F., and Solomon, P. A., 1995: Night-time radical chemistry inthe San Joaquin valley, Atmos. Environ. 29, 2887–2897.
Tremmel, H. G., Junkermann, W., Slemr, F., and Platt, U., 1993: On the distribution of hydrogenperoxide in the lower troposphere over the Northeast United States during late summer 1988, J.Geophys. Res. 98, 1083–1099.
Volz, A., Ehhalt, D. H., and Derwent, R. G., 1981: Seasonal and latitudinal variation of 14CO andthe tropospheric concentration of OH radicals, J. Geophys. Res. 86, 5163–5171.
Wayne, R. P., Barnes, I., Biggs, P., Burrows, J. P., Canosa-Mas, C., Hjorth, J., LeBras, G., Moortgat,G., Perner, D., Poulet, G., Restelli, G., and Sidebottom, H., 1991: The nitrate radical: Physics,chemistry and the atmosphere, Atmos. Environ. 25A, 1–250.
Weinstock, B., 1969: Carbon monoxide: Residence time in the atmosphere, Science 166, 224–225.Werle, P. W., Josek, K., and Slemr, F., 1991: Application of FM spectroscopy in atmospheric trace
gas monitoring: A study of some factors influencing the instrument design, in H. I. Schiff (ed.),Measurement of Atmospheric Gases, Vol. 1433 SPIE, Bellingham, pp. 128–135.
Winer, A. M., Atkinson, R., and Pitts, J. N., 1984: Gaseous nitrate radical: Possible night-timeatmospheric sink for biogenic organic compounds, Science 224, 156–159.
Wingenter, O. W., Kubo, M. K., Blake, N. J., Smith, T. W., Blake, D. R., and Rowland, F. S., 1996:Hydrocarbon and halocarbon measurements as photochemical and dynamical indicators of at-mospheric hydroxyl, atomic chlorine, and vertical mixing obtained during Lagrangian flights, J.Geophys. Res. 101, 4331–4340.