estudio de la flotaciÓn para el destintado de la...
TRANSCRIPT

PROYECTO
FIN DE CARRERA
INGENIERÍA QUÍMICA
ESTUDIO DE LA FLOTACIÓN PARA EL
DESTINTADO DE LA FRACCIÓN DE
FIBRA CORTA EN PULPA PROCEDENTE
DE PAPEL RECUPERADO
Autor: Gabriel Cisneros Barriga
Director: Ari Ämmälä, Universidad de Oulu
Ponente: Alberto Gonzalo Callejo, Universidad de Zaragoza
Fibre and Particle Engineering Laboratory,
Department of Process and Environmental
Engineering,
University of Oulu
Zaragoza, Febrero de 2012

2
AGRADECIMIENTOS
El presente proyecto se llevó a cabo en el Laboratorio de Ingeniería de Fibra y
Partículas, Universidad de Oulu.
Me gustaría agradecer a toda la gente del departamento del Laboratorio de Ingeniería de
Fibra y Partículas de la Universidad de Oulu por su amabilidad y por hacer el invierno
más frío de mi vida un poquito más cálido. Especial agradecimiento para mis
supervisores Liisa Mäkinen y Mika Körkkö por su actitud calmada y positiva, y por su
incalculable ayuda y disponibilidad durante todo el proyecto. Sincero agradecimiento
para mi director Ari Ämmälä por su acogida en el departamento y por sus consejos
durante todo el trabajo.
Agradecer también a Alberto Gonzalo su amabilidad, disponibilidad y predisposición
desde el primer minuto en que le propuse ser mi ponente.
Finalmente, me gustaría agradecer a mi familia, especialmente mis padres, por su
paciencia y por darme la oportunidad de estudiar en el extranjero, y a mi hermano, por
ser mi apoyo y fuerza durante los buenos y los malos momentos. También me gustaría
agradecer a todos los amigos que he hecho durante mi Erasmus en Oulu, un año repleto
de recuerdos inolvidables. Especial agradecimiento para mis amigos del colegio, de la
universidad y de mi pueblo Malanquilla por su cariño, amistad y por todas las risas
compartidas.

3
TABLA DE CONTENIDOS
AGRADECIMIENTOS .................................................................................................... 2
TABLA DE CONTENIDOS ............................................................................................ 3
1 INTRODUCCIÓN Y OBJETIVOS .......................................................................... 5
2 ANTECEDENTES .................................................................................................... 7
2.1 LÍNEA DE DESTINTADO CONVENCIONAL .............................................. 7
2.1.1 Pulpeado ..................................................................................................... 7
2.1.2 Depuración por tamizado............................................................................ 8
2.1.3 Limpieza por centrifugado.......................................................................... 8
2.1.4 Flotación ..................................................................................................... 9
2.1.5 Dispersión ................................................................................................... 9
2.1.6 Blanqueado ................................................................................................. 9
2.1.7 Eliminación de agua ................................................................................. 10
2.2 LÍNEA DE DESTINTADO CON FRACCIONAMIENTO ............................ 10
2.2.1 Diferencias entre fraccionamiento y depuración por tamizado ................ 11
2.2.2 Propiedades de las fracciones ................................................................... 12
2.3 FUNDAMENTOS DE LA FLOTACIÓN ....................................................... 12
2.3.1 Fases de la flotación ................................................................................. 13
3 MATERIALES Y MÉTODOS ............................................................................... 15
3.1 Materiales ......................................................................................................... 15
3.1.1 Materia prima ........................................................................................... 15
3.1.2 Reactivos químicos ................................................................................... 15
3.2 Métodos ........................................................................................................... 16
3.2.1 Descripción del proceso............................................................................ 16
3.2.2 Análisis ..................................................................................................... 18
3.3 Desarrollo de la parte experimental ................................................................. 19
3.3.1 Experimentos de referencia ...................................................................... 19
3.3.2 Estudio del nivel de flotación y flujo de aire durante la flotación ............ 21
3.3.3 Estudio del acondicionamiento previo a la flotación................................ 22
3.3.4 Estudio del efecto del pH en la flotación .................................................. 23
3.3.5 Estudio de la adición de diferentes reactivos químicos de flotación ........ 24
4
4 RESULTADOS Y DISCUSIÓN ............................................................................. 26
4.1 Experimentos de referencia ............................................................................. 26
4.2 Nivel de flotación y flujo de aire durante la flotación ..................................... 28
4.3 Acondicionamiento previo a la flotación ......................................................... 29
4.4 Efecto del pH en la flotación ........................................................................... 31
4.5 Adición de diferentes reactivos químicos de flotación .................................... 35
5 CONLCUSIONES .................................................................................................. 38
6 BIBLIOGRAFÍA ..................................................................................................... 39
ANEXOS
ANEXO 1. Cisneros Barriga, Gabriel, 2011, Study of DIP fines fraction flotation,
University of Oulu.
5
1 INTRODUCCIÓN Y OBJETIVOS
El reciclado de papel es un proceso cada vez más importante dentro de la industria
papelera, debido tanto a razones económicas como medioambientales. De hecho en los
últimos 15-20 años, ha aumentado el uso de papel reciclado para la fabricación de papel
comercial: como el usado en pañuelos, periódicos, etc. Este papel reciclado requiere
unas condiciones mínimas de algunas de sus propiedades para su uso en papeles de alta
calidad, como por ejemplo brillo, contenido de cenizas o tinta residual. Actualmente,
alrededor de la mitad del papel y el cartón producido mundialmente se obtiene con
papel recuperado.
El principal componente del papel recuperado que ha de retirarse es la tinta, debido a
que produce una reducción en el brillo del papel y su blancura. Por ello, los procesos de
destintado de papel han sufrido progresivamente mejoras, y las líneas de reciclado cada
vez son más complejas. Como parte de dichas mejoras, diversas alternativas de
destintado están siendo consideradas con el objetivo de mejorar el proceso.
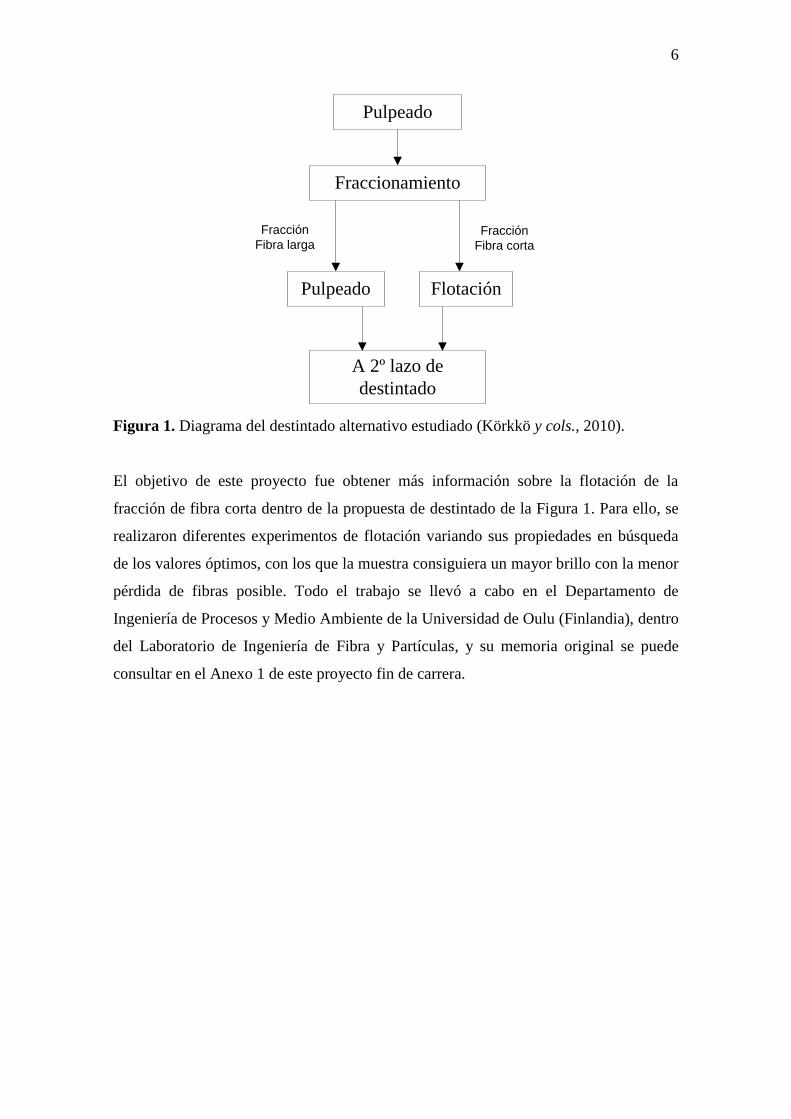
En este proyecto, se realizó un estudio en detalle de la flotación para la eliminación de
la tinta en la fracción de fibra corta de pasta procedente de papel recuperado, dentro de
una nueva propuesta de proceso de destintado. Esta propuesta se muestra
esquemáticamente en la Figura 1. Básicamente, el papel recuperado (mezcla entre
periódicos y revistas) es pulpeado durante un tiempo muy corto y posteriormente
separado en fracción de fibra corta (o fracción de finos) y fracción de fibra larga. Con
este corto pulpeado se evita que la tinta sufra una excesiva fragmentación y vuelva a
depositarse en las fibras. Tras el fraccionamiento, la fracción de fibra larga pasa por un
segundo pulpeado, y la fracción de fibra corta se limpia mediante un proceso de
flotación. Esta fracción de fibra corta ya flotada se puede combinar con la fracción de
fibra larga y ser realimentada a una segunda parte del proceso de producción de papel,
para mejorar la limpieza y el brillo de la pasta de papel. (Körkkö y cols., 2010).
6
Pulpeado
Fraccionamiento
Fracción
Fibra corta
FlotaciónPulpeado
Fracción
Fibra larga
A 2º lazo de
destintado
Figura 1. Diagrama del destintado alternativo estudiado (Körkkö y cols., 2010).
El objetivo de este proyecto fue obtener más información sobre la flotación de la
fracción de fibra corta dentro de la propuesta de destintado de la Figura 1. Para ello, se
realizaron diferentes experimentos de flotación variando sus propiedades en búsqueda
de los valores óptimos, con los que la muestra consiguiera un mayor brillo con la menor
pérdida de fibras posible. Todo el trabajo se llevó a cabo en el Departamento de
Ingeniería de Procesos y Medio Ambiente de la Universidad de Oulu (Finlandia), dentro
del Laboratorio de Ingeniería de Fibra y Partículas, y su memoria original se puede
consultar en el Anexo 1 de este proyecto fin de carrera.
7
2 ANTECEDENTES
2.1 LÍNEA DE DESTINTADO CONVENCIONAL
El propósito del destintado es eliminar la tinta y otras substancias contaminantes que
pueden afectar el proceso de fabricación de papel o sus propiedades finales. Por este
motivo, los procesos en los que se emplea papel recuperado son más complejos que los
que usan fibras vírgenes, ya que el papel recuperado es una mezcla de varios tipos de
papel con cierta cantidad de contaminantes. Las propiedades finales de la suspensión de
pasta de papel dependen directamente de la eliminación de contaminantes, de modo que
una baja separación de contaminantes lleva a valores bajos de brillo y calidad del
producto final (Lassus 2000 pp. 241, Holik 2000 pp.91). En la página 9 del Anexo 1 se
presenta un diagrama con las etapas del proceso de fabricación de papel de periódico.
Las diferentes etapas de una línea convencional de destintado son las siguientes:
pulpeado, depuración por tamizado, limpieza por centrifugado, flotación, dispersión,
blanqueado y eliminación de agua. Durante el pulpeado se aplican fuerzas mecánicas,
térmicas y químicas para despegar las impurezas de las fibras, como la tinta. Otras
etapas como la depuración por tamizado, la limpieza por centrifugado y la flotación son
etapas de separación en las que se elimina la tinta libre de la suspensión (Eul y cols.
1990, Doshi 1997 pp.3). A continuación se explican más detalladamente estas etapas.
2.1.1 Pulpeado
El objetivo del pulpeado es desintegrar el papel en fibras individuales para obtener una
suspensión que pueda ser bombeada. Las fuerzas de desintegración aplicadas durante el
pulpeado deben de ser mayores que la resistencia del papel o las fuerzas de unión de los
contaminantes a las fibras. Pero estas fuerzas de desintegración no deben de ser
excesivas para evitar que los contaminantes (como la tinta) se rompan en partículas
demasiado pequeñas, lo cual dificulta su posterior eliminación. (Holik 2000 pp. 95-97)

8
Se necesita que durante el pulpeado se consiga una buena separación entre las partículas
contaminantes y las fibras para que posteriormente la suspensión de pasta de papel sea
tratada eficientemente. Las fuerzas mecánicas separan la tinta mediante fricción entre
fibras y los reactivos químicos consiguen que algunas partículas se vuelvan más
hidrófobas. El objetivo es liberar la tinta de las fibras evitando que se vuelvan a adherir
a ellas o que se puedan fragmentar. Cuanto más baja es esta fragmentación de la tinta,
mayor brillo tiene la suspensión de papel tras la flotación (McKinney 1999 pp. 107,
Beneventi y cols. 2005, Holik 2000 pp. 151-153). En las páginas 10 y 11 del Anexo 1,
se amplía la información sobre el proceso de pulpeado.
2.1.2 Depuración por tamizado
El objetivo de la depuración por tamizado es eliminar los contaminantes sólidos de la
pasta de papel recuperado. Se emplean diferentes pantallas o tamices según el tamaño
de partícula y la forma de los contaminantes. Habitualmente se tamiza la misma
suspensión varias veces, para evitar en la medida de lo posible la pérdida de fibras. En
las páginas 11 y 12 del Anexo 1 se amplía la información de esta fase.
2.1.3 Limpieza por centrifugado
La limpieza por centrifugado es otro proceso de separación que complementa a la
depuración por tamizado, y su objetivo es eliminar partículas de la suspensión que
puedan afectar la calidad del papel. Como partículas contaminantes nos referimos a
arena, piezas de metal, grapas o materiales plásticos. Para una eliminación eficiente, es
necesario que los contaminantes tengan una densidad mayor a la del agua. Gracias a la
limpieza por centrifugado se pueden eliminar partículas más pequeñas que con la
depuración por tamizado. (Holik 2000 pp. 134-135)

9
2.1.4 Flotación
La flotación es el proceso más común para realizar la separación de la tinta de las fibras
sobre las que se encuentra depositada. Es un proceso de separación que se basa en la
probabilidad de que burbujas de aire se adhieran a las partículas de tinta y las lleven a la
superficie de la suspensión formando una capa de espuma. Este proceso es posible
gracias al comportamiento hidrófobo de las partículas permitiendo que puedan ser
eliminadas, mientras que las fibras son retenidas en la suspensión. (Holik 2000 pp. 151-
152, 241)
Una vez que se ha conseguido una buena separación de la tinta y las fibras en el
pulpeado, se introduce un flujo de aire a la suspensión y las partículas repelentes al agua
se adhieren a estas burbujas de aire formando una capa de espuma en la superficie de la
suspensión, partículas contaminantes como tinta, cargas, pigmentos, etc. La espuma
formada se retira de la suspensión o mecánicamente, o por rebose o por extracción al
vacío (Holik 2000 pp. 151-153, 244). La flotación se presenta más a fondo tanto en el
Apartado 2.3 de este proyecto, como en las páginas 13 y 14 del Anexo 1.
2.1.5 Dispersión
El objetivo de la dispersión es romper los contaminantes a un tamaño en el que no
interfieran en el proceso y evitar que se vean a simple vista. La dispersión hace que
ciertos contaminantes se hagan más pequeños y se favorezca su eliminación por
flotación, ya que mezcla reactivos blanqueantes y despega la tinta todavía adherida a las
fibras. (Holik 2000 pp. 185-186)
2.1.6 Blanqueado
La etapa de blanqueado mejora las propiedades ópticas de la pasta de papel destintada,
como por ejemplo el brillo y la luminosidad. Los reactivos más utilizados son peróxido
de hidrógeno (H2O2), hidrosulfito de sodio (Na2S2O4), cloro (Cl2), dióxido de cloro

10
(ClO2), hipoclorito de sodio (NaOCl) y ozono (O3). La elección del reactivo
blanqueante depende de la calidad del producto final. (Ackermann 2000 pp. 307)
2.1.7 Eliminación de agua
La eliminación de agua se lleva a cabo mediante un proceso de filtrado por presión y su
objetivo es quitar el agua de la suspensión de pasta de papel incrementando su
consistencia (porcentaje de masa de papel seco). Esta eliminación de agua produce un
ahorro en espacio para un posterior almacenaje de la pasta de papel. Los equipos más
comunes para la eliminación de agua en procesos de papel recuperado son los filtros de
disco y las prensas de tornillo. (Holik 2000 pp. 168-169, 171-172)
2.2 LÍNEA DE DESTINTADO CON FRACCIONAMIENTO
Como se ha comentado en este proyecto, se ha propuesto el estudio de un proceso
alternativo para el destintado. La separación de las fibras de papel, y el posterior
tratamiento de blanqueado de sus fracciones por separado (fracción de fibra corta y
larga) puede ser una manera eficiente de mejorar la pasta de papel destintada y sus
propiedades. La separación de las fibras mediante el fraccionamiento reduce el gasto en
reactivos químicos (al tratar las fracciones por separado) y también reduce el consumo
de energía, al realizar la dispersión sólo en la fracción de fibra larga (Mäkinen y cols.,
2010). Alcanzar las exigencias de brillo y blanqueado del producto final es el reto del
los procesos de destintado de papel recuperado (Eul y cols. 1989). La línea de destinado
con fraccionamiento es un desarrollo de la línea de destintado convencional. Con
fraccionamiento, la pasta de papel es separada mediante una separación por tamizado en
dos fracciones según el tamaño de las fibras: fracción de fibra larga y la fracción de
fibra corta (o fracción de finos). De este modo las fracciones pueden ser tratadas por
separado y ser empleadas en papeles de diferente grado o calidad. El principio del
fraccionamiento se presenta en la Figura 2.

11
Aceptado = Fracción
de fibra corta
Rechazo = Fracción
de fibra larga
Fraccionamiento
Alimentación =
Papel recuperado
Figura 2. Principio de fraccionamiento (Kraschowetz y cols., 2008).
Otro de los motivos de la introducción del fraccionamiento en las líneas de destintado es
el incremento del uso de papel recuperado para producir papel y cartón por razones
medioambientales. Al aumentar el uso de papel recuperado, se ha aumentado también la
cantidad de material no fibroso y contaminantes. Mediante el fraccionamiento, se
minimiza el gasto en limpieza y depuración por tamizado debido a que se concentran la
mayoría de los contaminantes en una fracción (Kraschowtz y cols. 2008, Meltzer 1999
pp. 153). La eficiencia del fraccionamiento depende tres diferentes grupos de factores:
propiedades de la fibra (longitud, grosor…), características del equipo de
fraccionamiento (tipo de cesta, diseño del rotor) y parámetros de operación (ratio de
rechazo, velocidad del rotor). (Meltzer 1999 pp. 156). Esta información se encuentra
ampliada en las páginas 16 y 17 del Anexo 1.
El lugar de la etapa de fraccionamiento dentro del proceso de destintado también fue
estudiado, como se puede comprobar en las páginas 19, 20 y 21 del Anexo 1.
2.2.1 Diferencias entre fraccionamiento y depuración por tamizado
Si bien físicamente ambos procesos son parecidos, los objetivos son muy diferentes.
Así, el objetivo de la depuración por tamizado es la eliminación de partículas y
contaminantes no deseados con la menor pérdida de fibras útiles. Por el contrario, el
fraccionamiento se centra en la separación de un flujo en dos o más fracciones con
diferentes características de fibra. La calidad de una buena depuración por tamizado está
determinada por las propiedades del aceptado, con los diversos contaminantes
eliminados en el flujo de rechazo. Sin embargo, las propiedades de la fracción de fibra
12
larga son las que determinan la calidad de un fraccionamiento. En la página 18 del
Anexo 1 se muestra una figura con conceptos y diferencias entre depuración por
tamizado y fraccionamiento.
2.2.2 Propiedades de las fracciones
Como se ha explicado antes, el fraccionamiento separa las fibras según sus
características, como su longitud o flexibilidad. De todos modos, no es posible tener una
separación total y estricta de las fibras cortas y largas mediante un fraccionamiento. Lo
que se consigue habitualmente es aumentar la concentración de fibras largas en una
fracción. (Holik 2000 pp. 127)
Las dos fracciones tienen diferentes características:
- Fracción de fibra corta: alta concentración de finos, ceniza y fibras cortas junto
con las partículas de tinta libres.
- Fracción de fibra larga: alta concentración de fibras largas junto con partículas
de tinta adheridas a las fibras.
Gracias al fraccionamiento, se pueden blanquear las fracciones por separado
obteniéndose mejores valores de brillo que al añadir estos reactivos químicos a la
suspensión de pasta de papel sin fraccionar. La fracción de fibra larga puede ser tratada
eficientemente con peróxido de hidrógeno (H2O2), y la fracción de fibra corta puede ser
blanqueada con blanqueantes reductores si fuera necesario. (Eul y cols. 1989, Eul y cols.
1990, Lapierre y cols. 2003, Kraschowetz y cols. 2008)
2.3 FUNDAMENTOS DE LA FLOTACIÓN
La flotación es un proceso que se emplea para separar la tinta de las fibras del papel
recuperado. Esta separación se basa en la probabilidad, y se emplean burbujas de aire
que se adhieren a las partículas de tinta y las transportan a la superficie de la suspensión,
donde se forma una capa de espuma que se le elimina mecánicamente, mediante succión

13
o por rebose. La eficiencia de la flotación depende estrictamente de las interacciones
hidrodinámicas y químicas entre las partículas de tinta y las burbujas de aire. Para
mejorar la selectividad de adhesión entre la tinta y el aire se añaden reactivos químicos
como colectores o espumantes. Por lo tanto mediante la flotación se eliminan la tinta y
otros contaminantes de la suspensión, gracias a la diferente hidrofobia de estas
partículas y las fibras. El principio de la flotación se presenta en la Figura 3.
Figura 3. Principio de la flotación (Carre & Galland 2007 pp.4)
Durante el destintado por flotación, además de tinta y otros contaminantes, también se
elimina material valioso de la suspensión como cenizas, fibras cortas y finos. Para una
mejor compresión de la eliminación de componentes durante el destintado por flotación,
en la página 23 del Anexo 1 se presentan los cuatro principales mecanismos de
transporte que describen la separación de partículas de la suspensión de papel gracias a
las burbujas de aire.
2.3.1 Fases de la flotación
Los pasos que conducen a una correcta flotación se ven afectados por múltiples factores
como la consistencia, el pH, la temperatura, el tamaño de las burbujas de aire, etc.
Según Beneventi (et al. 2005), Julien Saint Amand (et al. 1999, 2005) y McKinney
(1999, pp 107-109), una correcta flotación estaría compuesta por las siguientes fases:
14
- Separación de la tinta y la fibra (se muestra en el apartado 2.1.1).
- Choque entre la burbuja de aire y la partícula de tinta libre: Las burbujas de
aire y las partículas de tinta tienen que estar lo suficientemente cerca para
colisionar y formar aglomerados. La probabilidad de colisión se ve afectada por
los tamaños tanto de partícula como de las burbujas de aire, aumentando cuanto
menor sea el tamaño de burbuja de aire. En la página 24 del Anexo 1 se presenta
una gráfica con la influencia del tamaño de burbuja en el brillo.
- Formación del aglomerado partícula de tinta-burbuja de aire: El factor más
importante para la formación de este aglomerado es la interacción química
superficial entre la tinta y la burbuja. Se añaden reactivos químicos como
jabones de ácidos grasos no saturados que reaccionan con la tinta formando un
fuerte complejo hidrófobo que se adhiere a la burbuja de aire. Cuanto más
grande es el tamaño de la partícula de tinta menos eficiente es la eliminación por
flotación.
- Migración del aglomerado a la superficie: Pese a que el aglomerado partícula
de tinta-burbuja de aire se haya formado, esa unión ha de ser lo suficientemente
fuerte para llegar a la capa de espuma. La probabilidad de migración a la
superficie es mayor con burbujas de aire de menor tamaño, ya que aumenta el
área superficial de contacto.
- Eliminación de la espuma de la célula de flotación: Esta eliminación se produce
por rebose, ayudado por unas palas rotativas. La estabilidad de la espuma
depende de diversos factores, como la gravedad y la turbulencia de la
suspensión, que ayudan a que las partículas más grandes se despeguen de las
burbujas.
También se estudiaron las pérdidas de fibras y finos, sus mecanismos de pérdida
durante la flotación y la influencia del tamaño de burbuja. Toda esta información, así
como una pequeña introducción de los estudios previos de flotación de fibra corta (o
flotaciones de baja consistencia), se encuentra entre las páginas 26 y 30 del Anexo 1.
15
3 MATERIALES Y MÉTODOS
3.1 Materiales
3.1.1 Materia prima
El papel recuperado empleado en los experimentos consistió en una mezcla de
periódicos antiguos (ONP) y revistas (OMG). Se considera antiguo al papel recuperado
porque tenía más de tres meses. La alimentación para cada producción de pasta en el
desintegrador era de un 50% ONP y de un 50% OMG. Las revistas a su vez, estaban
compuestas equitativamente por dos tipos de papel revista, SC (Super Calendared) y
LWC (Light Weight Coated). El papel LWC se emplea habitualmente para propaganda
y el SC es un papel muy satinado, que se emplea en la producción de revistas debido a
su calidad superior.
3.1.2 Reactivos químicos
Se emplearon tres reactivos químicos comerciales diferentes – que aparecen
denominados en este proyecto como surfactante #1, surfactante #2 y jabón. Los
surfactantes #1 y #2 eran de tipo no iónico con diferente composición química, y el
reactivo denominado como “jabón” era una mezcla de jabones de sodio y ácidos grasos.
No es posible detallar la composición de estos reactivos por motivos de
confidencialidad. En cada experimento en el que se empleó jabón, se añadieron 7,2 g de
CaCl2 para ajustar la dureza de la suspensión. El lugar en el que se adicionaron los
reactivos y su cantidad variaron según cada experimento.
16
3.2 Métodos
3.2.1 Descripción del proceso
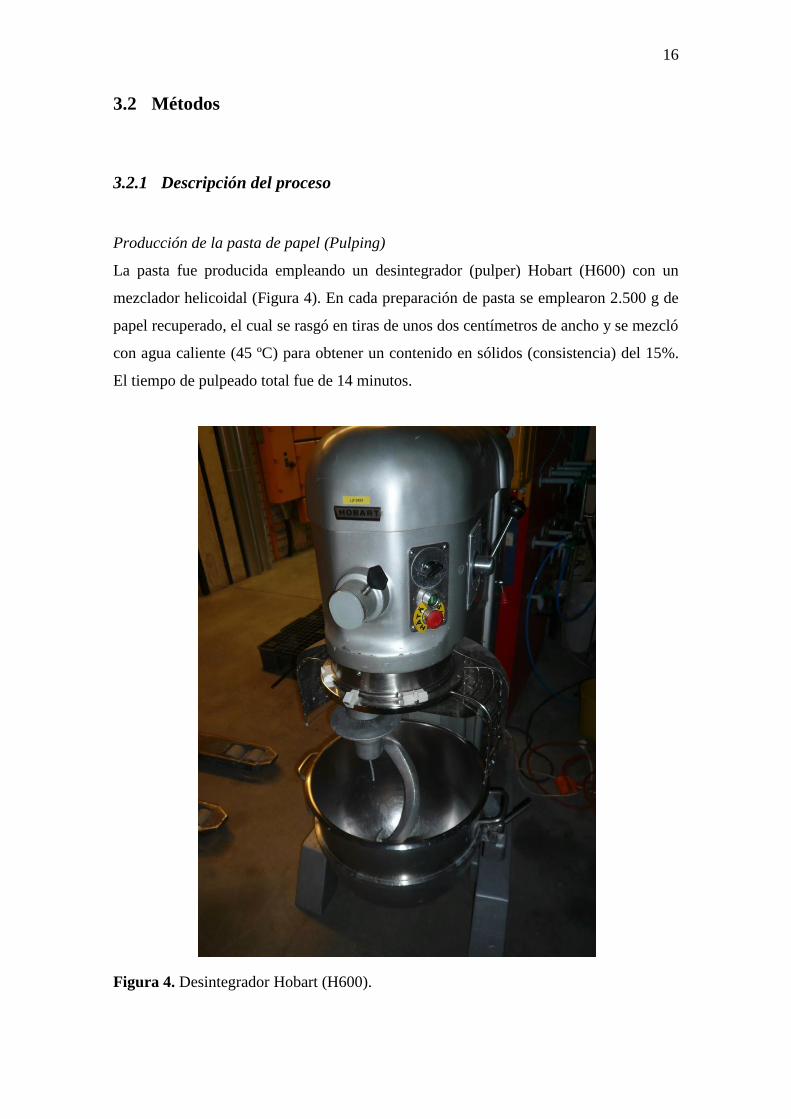
Producción de la pasta de papel (Pulping)
La pasta fue producida empleando un desintegrador (pulper) Hobart (H600) con un
mezclador helicoidal (Figura 4). En cada preparación de pasta se emplearon 2.500 g de
papel recuperado, el cual se rasgó en tiras de unos dos centímetros de ancho y se mezcló
con agua caliente (45 ºC) para obtener un contenido en sólidos (consistencia) del 15%.
El tiempo de pulpeado total fue de 14 minutos.
Figura 4. Desintegrador Hobart (H600).
17
Fraccionamiento
El fraccionamiento se llevo a cabo empleando el dispositivo piloto de fraccionamiento
PULA del laboratorio, consistente en un tanque de 300 litros, una bomba y una cesta
con ranuras de 0,15 mm de anchura. La pasta se diluyó en el tanque de alimentación con
agua caliente del grifo (45 ºC) hasta obtener una consistencia aproximada de 0,8%. La
pasta diluida se separó empleando una frecuencia de 50 hercios en el rotor de la cesta en
dos fracciones: fracción de fibra corta (aceptado) y fracción de fibra larga (rechazo).
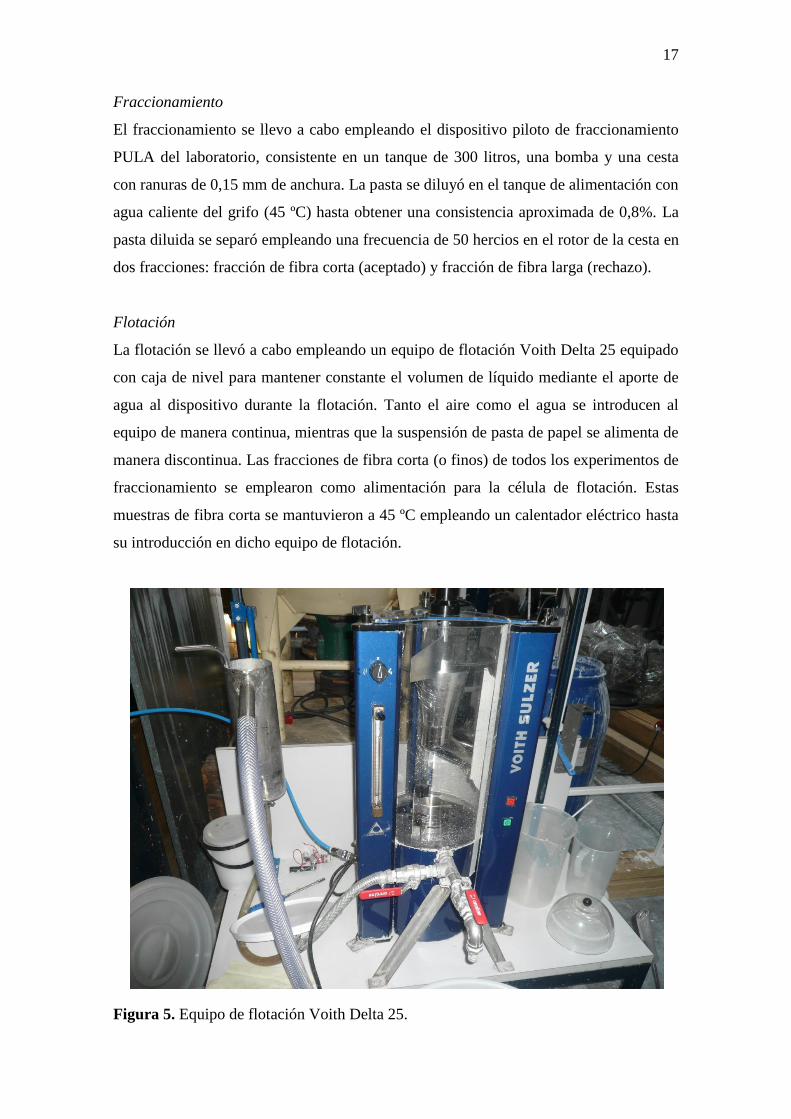
Flotación
La flotación se llevó a cabo empleando un equipo de flotación Voith Delta 25 equipado
con caja de nivel para mantener constante el volumen de líquido mediante el aporte de
agua al dispositivo durante la flotación. Tanto el aire como el agua se introducen al
equipo de manera continua, mientras que la suspensión de pasta de papel se alimenta de
manera discontinua. Las fracciones de fibra corta (o finos) de todos los experimentos de
fraccionamiento se emplearon como alimentación para la célula de flotación. Estas
muestras de fibra corta se mantuvieron a 45 ºC empleando un calentador eléctrico hasta
su introducción en dicho equipo de flotación.
Figura 5. Equipo de flotación Voith Delta 25.

18
3.2.2 Análisis
Consistencia y cenizas
La consistencia de las muestras de pasta de papel se realizó según la normativa SFS EN
ISO 4119. El contenido en cenizas se determinó mediante ignición de las muestras a
525 ºC según la normativa ISO 1762. Estos datos se emplearon para calcular otras
propiedades como la ratio de rechazo de masa (RRm) y la eliminación de cenizas, según
las ecuaciones de la página 34 del Anexo 1.
Hojas de mano
Éstas son muestras de papel, producidas a partir de la pasta obtenida en cada
experimento y realizadas en el laboratorio. A lo largo de este proyecto se ha trabajado
con dos clases diferentes de formetas u hojas de mano para la realización de ensayos.
Las hojas de mayor tamaño (165 mm x 165 mm) y bajo gramaje (30 g/m2) se
prepararon en un molde depositando las fibras de papel sobre un papel de filtro de alta
retención (Körkkö y cols., 2010); por otra parte, para las hojas de mano de menor
tamaño (ø 39 mm) y mayor gramaje (225 g/m2) se emplearon unos papeles de filtro de
membrana de nitratos de celulosa, que evitaban la pérdida de tinta (INGEDE Method
11p, 2009). Una vez preparadas, todas las hojas de mano se aclimataron en el
laboratorio antes de las mediciones ópticas, siguiendo la normativa SFS EN 20187.
Mediciones ópticas
Se midieron propiedades ópticas como el brillo o la tinta residual de las hojas de mano
empleando un espectrofotómetro L&W Elrepho. Los datos se calcularon con la media
entre dos mediciones de cada hoja.
- Brillo: Definida como la reflectancia de la luz azul. El brillo ISO es un factor
intrínseco de reflectancia determinado con un medidor cuya sensibilidad a la luz
concuerda con la normativa ISO estándar 2470.
- Tinta residual: La presencia de tinta varía el brillo y el color del papel reciclado.
La concentración de tinta fue determinada mediante el método ERIC
(concentración efectiva de tinta residual) según la normativa ISO 22754. Para
calcular ERIC se emplean las fórmulas de las páginas 35 y 36 del Anexo 1.

19
Hiperlavado (hyper washing, HW)
El hiperlavado se llevó a cabo lavando la pasta de papel con un caudal de agua de 8
L/min durante 20 minutos mediante un equipo de depuración por tamizado de tipo
Sommerville con un tamiz de 0.15 mm de malla, según la normativa Tappi T 275.
Variables como la retención en el hiperlavado y la eliminación de finos se calcularon
empleando las ecuaciones de la página 36 del Anexo 1.
3.3 Desarrollo de la parte experimental
La parte experimental del proyecto se dividió en cinco diferentes grupos de
experimentos de flotación. El primer grupo fueron los experimentos de referencia, tanto
para la flotación como para el fraccionamiento. Con el segundo grupo de experimentos
se determinaron los valores óptimos de nivel de agua y flujo de aire para la flotación de
la fracción corta de papel. En los otros tres grupos de experimentos se utilizaron
diferentes reactivos químicos durante la flotación de la fracción corta de papel.
3.3.1 Experimentos de referencia
Este bloque de experimentos se dividió en dos partes: flotaciones y fraccionamiento. De
esta manera se obtuvieron muestras de referencia para poder comparar con los
resultados obtenidos por muestras de otras flotaciones o fraccionamientos realizados en
diferentes condiciones.
Flotaciones de referencia
Pulpeado Flotación
Rechazo
AceptadoPasta de papel
Figura 6. Diagrama de las flotaciones de referencia.
20
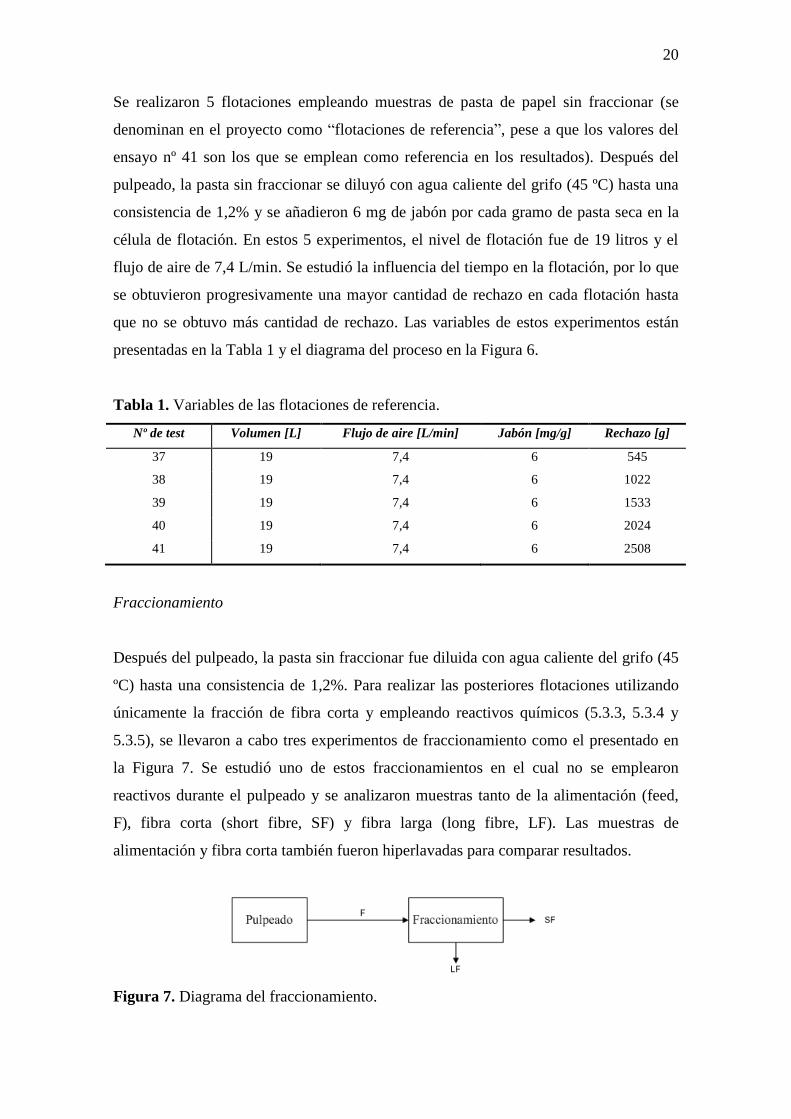
Se realizaron 5 flotaciones empleando muestras de pasta de papel sin fraccionar (se
denominan en el proyecto como “flotaciones de referencia”, pese a que los valores del
ensayo nº 41 son los que se emplean como referencia en los resultados). Después del
pulpeado, la pasta sin fraccionar se diluyó con agua caliente del grifo (45 ºC) hasta una
consistencia de 1,2% y se añadieron 6 mg de jabón por cada gramo de pasta seca en la
célula de flotación. En estos 5 experimentos, el nivel de flotación fue de 19 litros y el
flujo de aire de 7,4 L/min. Se estudió la influencia del tiempo en la flotación, por lo que
se obtuvieron progresivamente una mayor cantidad de rechazo en cada flotación hasta
que no se obtuvo más cantidad de rechazo. Las variables de estos experimentos están
presentadas en la Tabla 1 y el diagrama del proceso en la Figura 6.
Tabla 1. Variables de las flotaciones de referencia.
Nº de test Volumen [L] Flujo de aire [L/min] Jabón [mg/g] Rechazo [g]
37 19 7,4 6 545
38 19 7,4 6 1022
39 19 7,4 6 1533
40 19 7,4 6 2024
41 19 7,4 6 2508
Fraccionamiento
Después del pulpeado, la pasta sin fraccionar fue diluida con agua caliente del grifo (45
ºC) hasta una consistencia de 1,2%. Para realizar las posteriores flotaciones utilizando
únicamente la fracción de fibra corta y empleando reactivos químicos (5.3.3, 5.3.4 y
5.3.5), se llevaron a cabo tres experimentos de fraccionamiento como el presentado en
la Figura 7. Se estudió uno de estos fraccionamientos en el cual no se emplearon
reactivos durante el pulpeado y se analizaron muestras tanto de la alimentación (feed,
F), fibra corta (short fibre, SF) y fibra larga (long fibre, LF). Las muestras de
alimentación y fibra corta también fueron hiperlavadas para comparar resultados.
Figura 7. Diagrama del fraccionamiento.

21
3.3.2 Estudio del nivel de flotación y flujo de aire durante la flotación
Pulpeado FraccionamientoSF
Flotación
Rechazo
Aceptado
LF
Figura 8. Diagrama del proceso para el etudio del nivel de flotación y flujo de aire.
Después del pulpeado y del fraccionamiento, se llevaron a cabo 12 experimentos de
flotación separados en 4 grupos de 3 experimentos cada uno. En cada uno de los grupos
se modificó el nivel de flotación y el flujo de aire, buscando los valores óptimos de
ambas variables (se emplea “nivel de flotación” en el proyecto pese a que se refiere al
volumen de carga dentro de la célula de flotación). Una vez fijados tanto el nivel de
flotación como el flujo de aire para cada grupo, se realizaron las tres flotaciones. En
ellas se estudió la influencia del tiempo en la flotación, por lo que se obtuvo
progresivamente una mayor cantidad de rechazo hasta que no se obtuvo más cantidad de
rechazo. No se emplearon reactivos químicos en estas flotaciones. Los valores de estas
variables se muestran en la Tabla 2 y el diagrama del proceso en la Figura 8.
Tabla 2. Valores de nivel de flotación y flujo de aire para las diferentes flotaciones.
Nº de test Volumen [L] Flujo de aire [L/min] Rechazo [g]
1 19 7,4 610
2 19 7,4 1174
3 19 7,4 1705
4 20 7,4 671
5 20 7,4 1150
6 20 7,4 1720
7 19 13 554
8 19 13 1008
9 19 13 1512
10 20 13 668
11 20 13 1180
12 20 13 1737
22
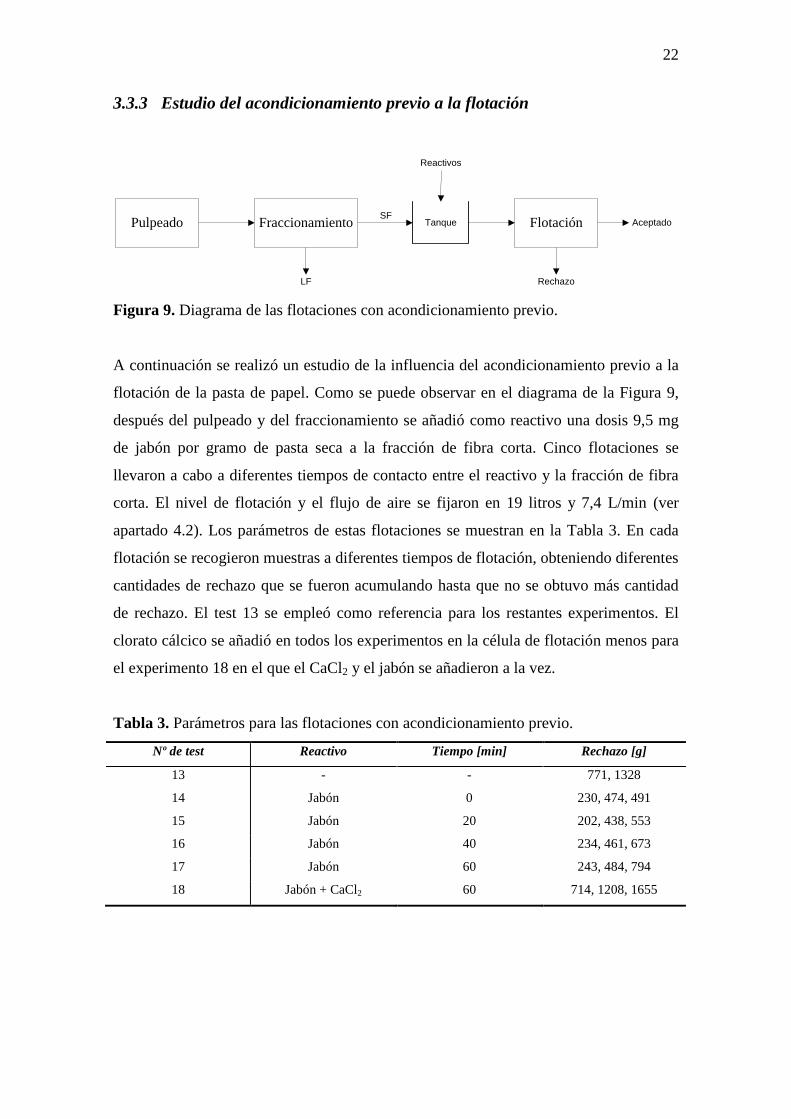
3.3.3 Estudio del acondicionamiento previo a la flotación
Pulpeado Fraccionamiento
LF
SFFlotación
Rechazo
AceptadoTanque
Reactivos
Figura 9. Diagrama de las flotaciones con acondicionamiento previo.
A continuación se realizó un estudio de la influencia del acondicionamiento previo a la
flotación de la pasta de papel. Como se puede observar en el diagrama de la Figura 9,
después del pulpeado y del fraccionamiento se añadió como reactivo una dosis 9,5 mg
de jabón por gramo de pasta seca a la fracción de fibra corta. Cinco flotaciones se
llevaron a cabo a diferentes tiempos de contacto entre el reactivo y la fracción de fibra
corta. El nivel de flotación y el flujo de aire se fijaron en 19 litros y 7,4 L/min (ver
apartado 4.2). Los parámetros de estas flotaciones se muestran en la Tabla 3. En cada
flotación se recogieron muestras a diferentes tiempos de flotación, obteniendo diferentes
cantidades de rechazo que se fueron acumulando hasta que no se obtuvo más cantidad
de rechazo. El test 13 se empleó como referencia para los restantes experimentos. El
clorato cálcico se añadió en todos los experimentos en la célula de flotación menos para
el experimento 18 en el que el CaCl2 y el jabón se añadieron a la vez.
Tabla 3. Parámetros para las flotaciones con acondicionamiento previo.
Nº de test Reactivo Tiempo [min] Rechazo [g]
13 - - 771, 1328
14 Jabón 0 230, 474, 491
15 Jabón 20 202, 438, 553
16 Jabón 40 234, 461, 673
17 Jabón 60 243, 484, 794
18 Jabón + CaCl2 60 714, 1208, 1655

23
3.3.4 Estudio del efecto del pH en la flotación
Cuatro experimentos de flotación diferentes se llevaron a cabo controlando el pH: en las
dos primeras flotaciones se empleó pasta de papel sin fraccionar, y en las dos últimas se
empleó la fracción de fibra corta. Durante el pulpeado se añadió como reactivo una
dosis de 6 mg de jabón por gramo de pasta seca, como se presenta en la Figura 10.
En cada uno de los 2 primeros experimentos, 1.520 g de pasta de papel se diluyeron en
la célula de flotación hasta un nivel de flotación de 19 litros (consistencia del 15%). En
la primera flotación se midió el pH de la alimentación (en torno a 7,5), mientras que el
pH de la segunda flotación se ajustó a 8,5 en la celda de flotación empleando una
solución 0,2M de NaOH.
Pulpeado Flotación
Rechazo
Aceptado
Reactivos
Pasta de papel
Figura 10. Diagrama de las flotaciones de pasta sin fraccionar con control de pH.
Las otras dos flotaciones se llevaron a cabo con la fracción de fibra corta (SF) obtenida
tras el fraccionamiento, como se detalla en la Figura 11. En la primera flotación se
midió el pH de la alimentación (en torno al 7,9), mientras que el pH de la segunda
flotación se ajusto a 8,5 empleando una solución 0,2M de NaOH.
Pulpeado Fraccionamiento
LF
SF
Flotación
Rechazo
Aceptado
Reactivos
Figura 11. Diagrama de las flotaciones de fibra corta con control de pH.

24
Las variables de todas estas flotaciones se muestran en la Tabla 4. En cada flotación se
recogieron muestras a tres diferentes tiempos de flotación, consiguiendo diferentes
cantidades de rechazo que se fueron acumulando hasta que no se obtuvo más cantidad
de rechazo.
Tabla 4. Variables para las flotaciones con control de pH.
Nº de test Voumen [L] Flujo de aire [L/min] Nota Rechazos [g]
19 19 7.4 Sin fraccionar 506, 1091, 2651
20 19 7.4 Sin fraccionar – pH 8.5 566, 1141, 2746
21 19 7.4 Fibra corta 613, 1257, 1756
22 19 7.4 Fibra corta – pH 8.5 573, 1219, 1621
3.3.5 Estudio de la adición de diferentes reactivos químicos de flotación
Pulpeado Fraccionamiento
LF
SFFlotación
Rechazo
Aceptado
Reactivos
Figura 12. Diagrama de las flotaciones con reactivos químicos.
Como se puede ver en la Figura 12, después del pulpeado y el fraccionamiento las
flotaciones se llevaron a cabo con la fracción de fibra corta (SF). Se emplearon tres
reactivos químicos diferentes en seis experimentos de flotación: jabón, surfactante #1 y
surfactante #2. Todos los reactivos químicos se añadieron en la célula de flotación antes
de comenzar la misma. Para el jabón, se añadieron dosis de 6 y 9 mg de jabón por
gramo de pasta seca respectivamente. Para los surfactantes, las dosis añadidas fueron de
0,6 y 0,9 gramos por gramo de pasta seca. En cada flotación se recogieron muestras
tanto de aceptado y como de rechazo a diferentes tiempos de flotación, con diferentes
cantidades de rechazo para cada toma que se fueron acumulando hasta que no se obtuvo
más cantidad de rechazo. Los parámetros de estas flotaciones se muestran en la Tabla 5.

25
Tabla 5. Parámetros para las flotaciones químicas.
Nº de test Reactivo químico Dosis [mg/g] Rechazo [g]
23 Jabón 6 238, 382
24 Jabón 9 148, 265
25 Surfactante #1 0,6 293, 485, 858
26 Surfactante #1 0,9 337, 591, 832
27 Surfactante #2 0,6 346, 590, 1020
28 Surfactante #2 0,9 388, 616, 1151

26
4 RESULTADOS Y DISCUSIÓN
Los resultados están distribuidos en los mismos grupos de experimentos de flotación
explicados en el apartado 3.3. Se ha de tener en cuenta que el papel recuperado
empleado en estos experimentos es antiguo, por tanto los valores de las muestras serán
más bajos en comparación con experimentos de papel fresco. Según Vahlroos y cols.
(2008), se pueden obtener valores de brillo ISO alrededor de 60% con papel fresco, en
vez de los valores alrededor del 50% que se obtienen con revistas y periódicos
recuperados.
4.1 Experimentos de referencia
Flotaciones de referencia
Los valores de brillo, contenido en cenizas y tinta residual obtenidos por medición
óptica de hojas de ensayo de cada muestra, se han representado frente al ratio de masa
de rechazo (RRm) en las figuras de las páginas 41 y 42 del Anexo 1. Los resultados
están presentados en la siguiente tabla:
Tabla 6. Resultados de las flotaciones de referencia.
Muestra Brillo ISO [%] Cenizas
[%]
Tinta residual
[ppm]
Eliminación
cenizas [%] RRm [%]
FEED 45,1 24,7 1439 0,0 0,0
A37 47,0 18,6 1216 20,2 9,0
A38 48,3 15,5 989 41,0 17,6
A39 49,5 13,2 846 50,2 21,7
A40 50,6 11,2 738 53,8 23,8
A41 51,8 9,8 628 68,8 27,9
Según la Tabla 6 y como era de esperar las muestras con altos ratios de masa de rechazo
(RRm) son las que tienen menor contenido en tinta residual y cenizas. Se observa que el
brillo y la RRm son proporcionales (aumento de 6,7% unidades de brillo ISO), pese a la
pérdida de fibra que se produce por los altos valores de RRm. Debido a que en la
flotación se eliminan tanto tinta como cargas del papel, la ganancia de brillo debida a la
eliminación de la tinta puede estar contrarrestada por la pérdida de cargas del papel
(como colorantes), si el brillo de las cargas es mayor que el brillo de las fibras, como

27
ocurre para las mezclas de papel recuperado ONP/OMG. Comparado con los datos
obtenidos por Körkkö y cols. (2008), el valor de brillo obtenido en el Test 41, y que va a
ser considerado como blanco de comparación del resto de experimentos, es bastante
elevado.
Fraccionamiento
Tras fraccionar la alimentación en fibra corta y fibra larga, se analizaron las propiedades
ópticas de las hojas de mano de menor tamaño (filtro de membrana) de cada muestra.
Los valores obtenidos tanto de la alimentación y como de las fracciones de fibra corta y
fibra larga se muestran en la Tabla 7. Tras el fraccionamiento, se observó quelos valores
de brillo fueron similares para todas las muestras pese a que la fracción de fibra corta
tuviera el mayor contenido en cenizas. Este contenido en cenizas de la fracción de fibra
corta fue mayor que el obtenido por Mäkinen y cols. (2010), como también fue mayor el
valor de la muestra de alimentación. También se obtuvieron valores similares de
retención para la alimentación y la fracción de fibra larga. El valor de brillo ISO de las
muestras hiperlavadas (HW) fue mayor para la fracción de fibra larga que para la
alimentación.
Tabla 7. Brillo, contendio en cenizas y retención de la alimentación, fracción de fibra
corta y fracción de fibra larga del fraccionamiento.
Alimentación Fibra corta Fibra larga
Brillo ISO [%] 44.3 44.0 42.7
Cenizas [%] 24.0 32.9 21.9
Retención [%] 61.0 38.6 59.1
Brillo ISO - HW [%] 44.0 - 47.0
Se confirma con estos resultados que la fracción de fibra corta acumula una mayor
cantidad de cenizas. Observando los datos de brillo se comprueba que el mayor valor lo
obtuvo la muestra de fibra larga hiperlavada, lo que sugiere que había gran cantidad de
tinta libre en la suspensión (no adherida a las fibras). Comparando el brillo de estas
muestras con el obtenido por las flotaciones de referencia, se observa una diferencia de
7,8% unidades entre la muestra A41 y la fracción de fibra corta (SF), según las Tablas 6
y 7. Por lo tanto, gracias a la flotación se pierde una mayor cantidad de cenizas y de
tinta, incrementando así el brillo.
28
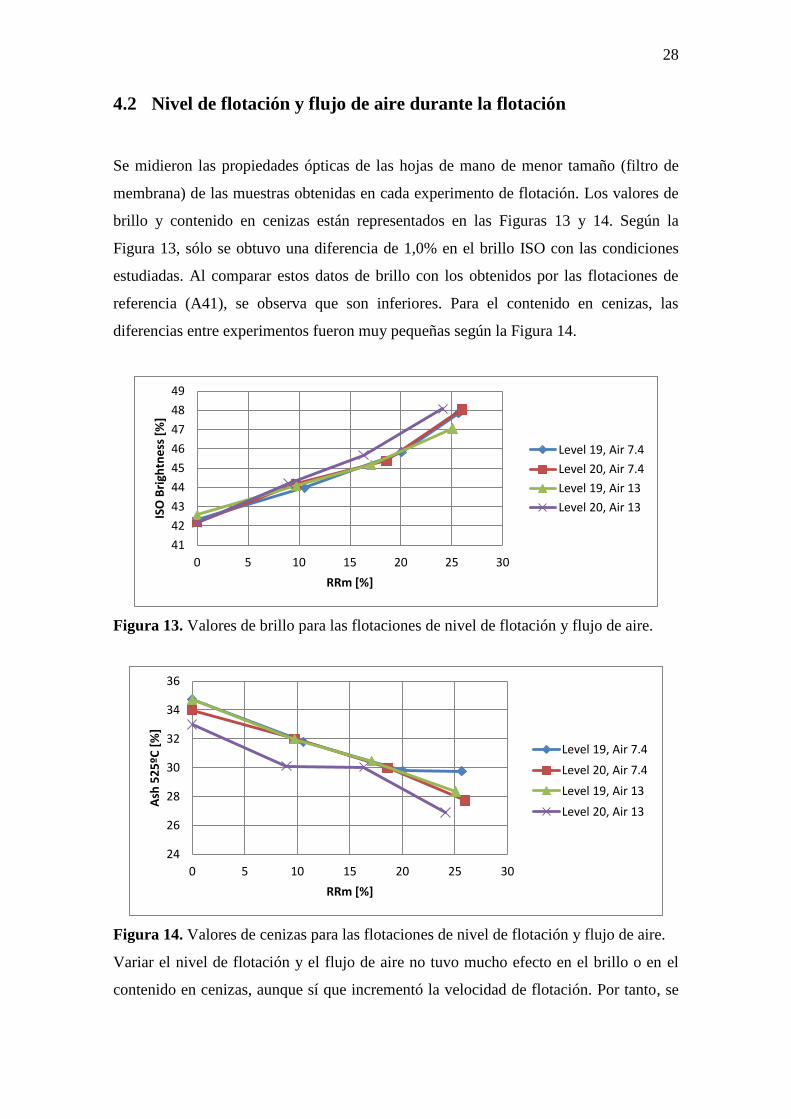
4.2 Nivel de flotación y flujo de aire durante la flotación
Se midieron las propiedades ópticas de las hojas de mano de menor tamaño (filtro de
membrana) de las muestras obtenidas en cada experimento de flotación. Los valores de
brillo y contenido en cenizas están representados en las Figuras 13 y 14. Según la
Figura 13, sólo se obtuvo una diferencia de 1,0% en el brillo ISO con las condiciones
estudiadas. Al comparar estos datos de brillo con los obtenidos por las flotaciones de
referencia (A41), se observa que son inferiores. Para el contenido en cenizas, las
diferencias entre experimentos fueron muy pequeñas según la Figura 14.
Figura 13. Valores de brillo para las flotaciones de nivel de flotación y flujo de aire.
Figura 14. Valores de cenizas para las flotaciones de nivel de flotación y flujo de aire.
Variar el nivel de flotación y el flujo de aire no tuvo mucho efecto en el brillo o en el
contenido en cenizas, aunque sí que incrementó la velocidad de flotación. Por tanto, se
41
42
43
44
45
46
47
48
49
0 5 10 15 20 25 30
ISO
Bri
ghtn
ess
[%
]
RRm [%]
Level 19, Air 7.4
Level 20, Air 7.4
Level 19, Air 13
Level 20, Air 13
24
26
28
30
32
34
36
0 5 10 15 20 25 30
Ash
52
5ºC
[%
]
RRm [%]
Level 19, Air 7.4
Level 20, Air 7.4
Level 19, Air 13
Level 20, Air 13

29
fijó el nivel de flotación a 19 litros y el flujo de aire a 7,4 litros por minutos para el resto
de flotaciones, para gastar la menor cantidad posible de agua y aire.
4.3 Acondicionamiento previo a la flotación
Una vez analizadas las formetas de menor tamaño (filtro de membrana), se
representaron los valores de brillo y contenido en cenizas de las muestras de
alimentación y de fracción de fibra corta post-flotada para cada flotación, y así
determinar la influencia del tiempo de contacto de los reactivos químicos previo a la
flotación. Se representan estas variables frente a RRm en las Figuras 15 y 16. Los
valores del Test 21, en el que el jabón se añadió en el desintegrador, se muestran
también en las gráficas para comparar resultados.
Figura 15. Valores de brillo para las flotaciones con reactivo a diferentes tiempos.
Los valores más altos de brillo se obtuvieron con las muestras en las que más tiempo
actuaron los reactivos químicos, aunque también con unos altos ratios de masa de
rechazo (RRm) con la consiguiente pérdida de material fibroso de la muestra. El uso de
reactivos químicos mejoró el brillo, obteniéndose unos valores de brillo ISO levemente
más altos (2% unidades) que los de las flotaciones de nivel de flotación y flujo de aire.
40
42
44
46
48
50
52
0 10 20 30 40
ISO
Bri
ghn
ess
[%
]
RRm [%]
No chemicals
Soap, Delay 0 mins
Soap, Delay 20 mins
Soap, Delay 40 mins
Soap, Delay 60 mins
Soap + CaCl2, Delay 60 mins Soap (Pulper)

30
Figura 16. Contenido en cenizas para las flotaciones con reactivo a diferentes tiempos.
Según la Figura 16, la muestra con menor contenido en cenizas fue la del test 15 (Soap,
Delay 20 mins), con menor pérdida de material fibroso en comparación con muestras
con mayor tiempo.
Basándonos en la cantidad de rechazo de cada flotación, se calcularon los valores de
eliminación de cenizas y finos (fibra corta) y están representados en las Figuras 17 y 18.
En la Figura 17, se obtuvieron valores similares de eliminación de cenizas para los
últimas cuatro flotaciones, con diferencias en RRm. En la Figura 18, las flotaciones con
mayor tiempo de actuación de los reactivos son las de mayor pérdida de finos.
Figura 17. Eliminación de cenizas en las flotaciones con reactivo a diferentes tiempos.
20
24
28
32
36
40
0 10 20 30 40
Ash
52
5ºC
[%
]
RRm [%]
No chemicals
Soap, Delay 0 mins
Soap, Delay 20 mins
Soap, Delay 40 mins
Soap, Delay 60 mins
Soap + CaCl2, Delay 60 mins Soap (Pulper)
0
10
20
30
40
50
60
0 10 20 30 40
Ash
re
mo
val [
%]
RRm [%]
No chemicals
Soap, Delay 0 mins
Soap, Delay 20 mins
Soap, Delay 40 mins
Soap, Delay 60 mins
Soap + CaCl2, Delay 60 mins Soap (Pulper)

31
Figura 18. Eliminación de finos en las flotaciones con reactivo a diferentes tiempos.
Por tanto, la variable más afectada por los reactivos químicos fue la RRm ya que cuanto
más tiempo actuaron los reactivos, mayor cantidad de fibra, finos y cenizas se perdió
con el rechazo. Añadir el CaCl2 junto con el jabón tuvo un efecto negativo en la
flotación, ya que incrementó la pérdida fibra.
4.4 Efecto del pH en la flotación
Comparación entre flotaciones de pasta sin fraccionar (Entire pulp)
Los valores de brillo, contenido en cenizas, tinta residual y eliminación de cenizas se
obtuvieron por medición óptica de hojas de mano grandes de cada flotación (muestras
de alimentación y fracción de fibra corta). Se compararon estos datos con los obtenidos
por las flotaciones de referencia y se representaron en las Figuras 19, 20, 21 y 22.
0
10
20
30
40
50
0 5 10 15 20 25 30 35 40
Fin
es
rem
ova
l [%
]
RRm [%]
No chemicals
Soap, Delay 0 mins
Soap, Delay 20 mins
Soap, Delay 40 mins
Soap, Delay 60 mins
Soap + CaCl2, Delay 60 mins Soap (Pulper)

32
Figura 19. Brillo ISO para las flotaciones de pasta sin fraccionar con control de pH.
Figura 20. Contenido en cenizas de las flotaciones de pasta sin fraccionar con control
de pH.
Figura 21. Tinta residual para las flotaciones de pasta sin fraccionar con control de pH.
A41
44
45
46
47
48
49
50
51
52
53
0 10 20 30 40
ISO
Bri
ghtn
ess
[%
]
RRm [%]
Reference flotations
Entire pulp
Entire pulp, pH 8.5
A41
0
5
10
15
20
25
30
35
0 10 20 30 40
Ash
52
5ºC
[%
]
RRm [%]
Reference flotations
Entire pulp
Entire pulp, pH 8.5
A41 400
600
800
1000
1200
1400
1600
1800
0 10 20 30 40
Re
sid
ual
ink
[pp
m]
RRm [%]
Referenc flotations
Enitre pulp
Enitre pulp, pH 8.5

33
Figura 22. Eliminación de cenizas para las flotaciones de pulpa sin fraccionar con
control de pH.
En la Figuras 19, 20, 21 y 22 se observa una pequeña diferencia entre las muestras de la
flotación con control de pH respecto a las no controladas. Los valores finales de brillo,
contenido en cenizas y en tinta residual fueron similares excepto para el test 20 (Entire
pulp, pH 8,5) que obtuvo un valor de RRm máximo inferior. Comparando las flotaciones
con control de pH con las flotaciones de referencia (Test 41), se observa que estas
últimas obtuvieron valores de brillo levemente mayor (un 1% mayor), menor contenido
en cenizas y similar contenido en tinta residual pero con menor ratio de masa de
rechazo. Sin embargo, al añadir los reactivos químicos a la desintegradora se consiguió
aumentar la flotabilidad de las partículas de tinta. Como se puede ver en la Figura 21,
los valores de tinta residual tuvieron un drástico descenso desde 1630 hasta 625 en la
muestra de la flotación con el pH controlado.
Flotaciones de la fracción de fibra corta
Se realizaron dos flotaciones de fracción de fibra corta, ajustando el pH de una ellas a
8,5. Los valores de brillo obtenidos gracias a mediciones ópticas de las hojas de mano
pequeñas (filtros de membrana) de cada flotación (muestras de alimentación y fracción
de fibras corta post-flotada), se representaron frente a RRm en la Figura 23. Otras
variables como el contenido en cenizas, la eliminación de cenizas y la eliminación de
finos también fueron estudiadas, pero se obtuvieron unas diferencias mínimas entre
ambas flotaciones. Las gráficas de estas variables se pueden ver en las páginas 49 y 50
del Anexo 1.
R41
0
10
20
30
40
50
60
70
80
0 10 20 30 40
Ash
re
mo
val [
%]
RRm [%]
Reference flotations
Entire pulp
Entire pulp, pH 8.5

34
Figura 23. Valores de brillo para las flotaciones de fracción de fibra corta con control
de pH.
Se observa que ajustar el pH no tuvo casi efecto en las flotaciones de la fibra corta. El
RRm máximo de ambas flotaciones fue aproximadamente el mismo (32%), y la única
diferencia fue en el valor de brillo de la muestra sin el pH controlado que resultó un 1%
mayor que la muestra controlada, como se puede ver en las Figura 23. Comparando el
valor máximo de brillo de estas flotaciones con los resultados obtenidos por las
flotaciones de nivel de flotación y flujo de aire, se observa un aumento de 2% unidades
de brillo ISO. Por lo tanto, al añadir los reactivos en la desintegradora se consigue una
mejor separación entre la tinta y las fibras de papel.
Sorprendentemente, ajustar el pH a 8,5 no tuvo ningún efecto sobre las propiedades
estudiadas. Según el método INGEDE 11, al final del pulpeado el valor de pH debe de
ser de 9,5 y se ha de emplear sosa para alcanzarlo (si fuera necesario), por lo que la
bibliografía se sugiere que cuanto mayor es el pH se obtienen mejores resultados. Sin
embargo, queda demostrado que las flotaciones se pueden llevar a cabo con condiciones
neutras de pH.
42
43
44
45
46
47
48
49
50
51
0 10 20 30 40
ISO
Bri
ghtn
ess
[%
]
RRm [%]
Fines fraction
Fines fraction, pH 8.5
35
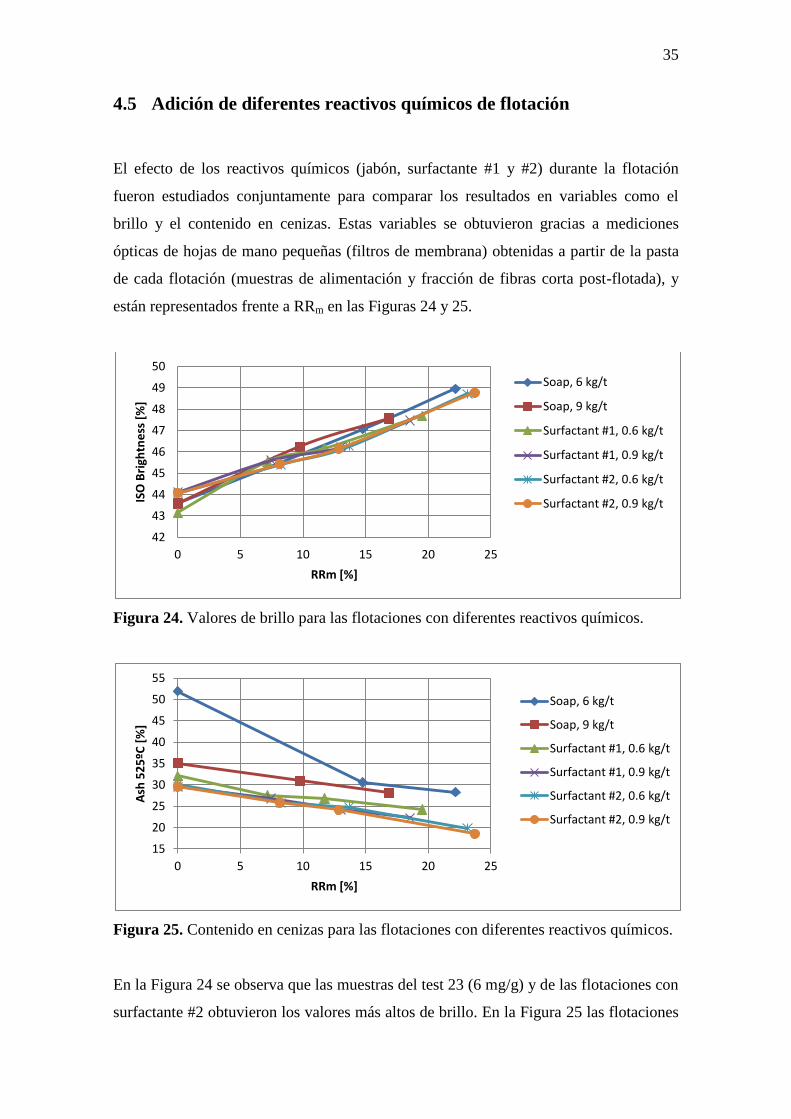
4.5 Adición de diferentes reactivos químicos de flotación
El efecto de los reactivos químicos (jabón, surfactante #1 y #2) durante la flotación
fueron estudiados conjuntamente para comparar los resultados en variables como el
brillo y el contenido en cenizas. Estas variables se obtuvieron gracias a mediciones
ópticas de hojas de mano pequeñas (filtros de membrana) obtenidas a partir de la pasta
de cada flotación (muestras de alimentación y fracción de fibras corta post-flotada), y
están representados frente a RRm en las Figuras 24 y 25.
Figura 24. Valores de brillo para las flotaciones con diferentes reactivos químicos.
Figura 25. Contenido en cenizas para las flotaciones con diferentes reactivos químicos.
En la Figura 24 se observa que las muestras del test 23 (6 mg/g) y de las flotaciones con
surfactante #2 obtuvieron los valores más altos de brillo. En la Figura 25 las flotaciones
42
43
44
45
46
47
48
49
50
0 5 10 15 20 25
ISO
Bri
ghtn
ess
[%
]
RRm [%]
Soap, 6 kg/t
Soap, 9 kg/t
Surfactant #1, 0.6 kg/t
Surfactant #1, 0.9 kg/t
Surfactant #2, 0.6 kg/t
Surfactant #2, 0.9 kg/t
15
20
25
30
35
40
45
50
55
0 5 10 15 20 25
Ash
52
5ºC
[%
]
RRm [%]
Soap, 6 kg/t
Soap, 9 kg/t
Surfactant #1, 0.6 kg/t
Surfactant #1, 0.9 kg/t
Surfactant #2, 0.6 kg/t
Surfactant #2, 0.9 kg/t
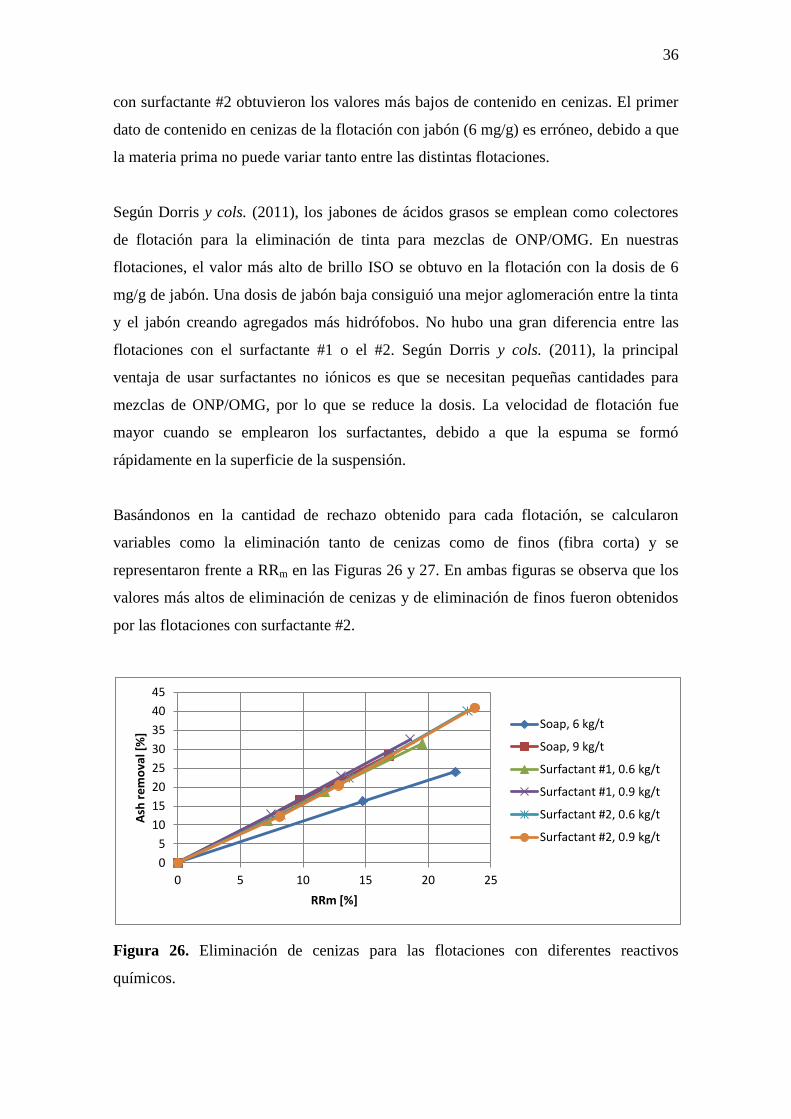
36
con surfactante #2 obtuvieron los valores más bajos de contenido en cenizas. El primer
dato de contenido en cenizas de la flotación con jabón (6 mg/g) es erróneo, debido a que
la materia prima no puede variar tanto entre las distintas flotaciones.
Según Dorris y cols. (2011), los jabones de ácidos grasos se emplean como colectores
de flotación para la eliminación de tinta para mezclas de ONP/OMG. En nuestras
flotaciones, el valor más alto de brillo ISO se obtuvo en la flotación con la dosis de 6
mg/g de jabón. Una dosis de jabón baja consiguió una mejor aglomeración entre la tinta
y el jabón creando agregados más hidrófobos. No hubo una gran diferencia entre las
flotaciones con el surfactante #1 o el #2. Según Dorris y cols. (2011), la principal
ventaja de usar surfactantes no iónicos es que se necesitan pequeñas cantidades para
mezclas de ONP/OMG, por lo que se reduce la dosis. La velocidad de flotación fue
mayor cuando se emplearon los surfactantes, debido a que la espuma se formó
rápidamente en la superficie de la suspensión.
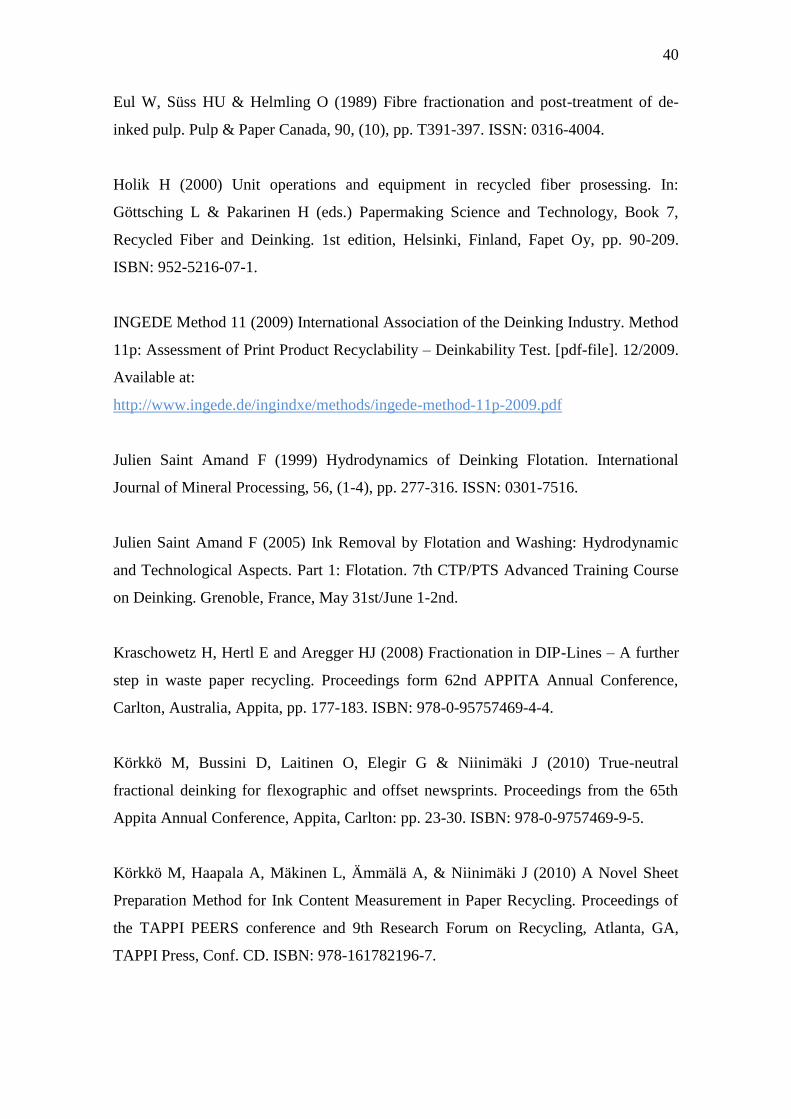
Basándonos en la cantidad de rechazo obtenido para cada flotación, se calcularon
variables como la eliminación tanto de cenizas como de finos (fibra corta) y se
representaron frente a RRm en las Figuras 26 y 27. En ambas figuras se observa que los
valores más altos de eliminación de cenizas y de eliminación de finos fueron obtenidos
por las flotaciones con surfactante #2.
Figura 26. Eliminación de cenizas para las flotaciones con diferentes reactivos
químicos.
0
5
10
15
20
25
30
35
40
45
0 5 10 15 20 25
Ash
re
mo
val [
%]
RRm [%]
Soap, 6 kg/t
Soap, 9 kg/t
Surfactant #1, 0.6 kg/t
Surfactant #1, 0.9 kg/t
Surfactant #2, 0.6 kg/t
Surfactant #2, 0.9 kg/t

37
Figura 27. Eliminación de finos para las flotaciones con diferentes reactivos químicos.
Comparando todas las flotaciones químicas, el experimento con una dosis de jabón de 6
mg/g consiguió los mejores resultados según la Figura 24 (mismos valores de brillo
pero con menor RRm). No hubo gran diferencia al usar una dosis mayor o menor de
surfactante, por lo que el uso de una dosis menor (0,6 mg/g) consigue ahorrar gastos.
0
5
10
15
20
25
30
35
40
0 5 10 15 20 25
Fin
es
rem
ova
l [%
]
RRm [%]
Soap, 6 kg/t
Soap, 9 kg/t
Surfactant #1, 0.6 kg/t
Surfactant #1, 0.9 kg/t
Surfactant #2, 0.6 kg/t
Surfactant #2, 0.9 kg/t
38
5 CONLCUSIONES
Antes de comenzar las conclusiones, es necesario recordar que el uso de materia prima
antigua (ONP/OMG) empeora el destintado de la pasta de papel y por consiguiente, los
valores de propiedades como el brillo son peores que los obtenidos con materia prima
fresca. Sin embargo, en nuestros experimentos, a través de la flotación de pasta de papel
sin fraccionar (Entire pulp), el valor de brillo fue aumentando moderadamente cuanto
mayor cantidad de rechazo se eliminaba de la suspensión. Por lo tanto, los experimentos
de flotación funcionaron bien pese al uso de materia prima antigua.
Las conclusiones tras la realización de este proyecto son las siguientes:
El fraccionamiento empleado en este proyecto resultó ser adecuado para los posteriores
experimentos. Los valores de brillo de la fracción de fibra larga fueron levemente
inferiores debido a la presencia de tinta libre en la suspensión. La mayor presencia de
cenizas en la fracción de fibra corta confirma que el fraccionamiento fue correcto.
Los resultados de las flotaciones de fibra corta muestran que cambiar parámetros como
el flujo de aire o el nivel de flotación en el equipo no tuvo mucho efecto en las
propiedades de la suspensión tras la flotación. Por otro lado, incrementar el tiempo de
acción de los reactivos en la suspensión antes de la flotación sí que tuvo efecto en las
propiedades de la fracción de fibra corta. A mayor tiempo, mayor valor tanto de brillo
como de ratio de masa de rechazo, con la consiguiente pérdida de fibras.
Las propiedades de la pasta de papel no fueron modificadas por el uso de reactivos
químicos para controlar el pH, por lo que aparentemente, estas flotaciones se pueden
llevar a cabo en unas condiciones de pH neutras.
Basándose en estos resultados, se recomienda el uso de una dosis de jabón de 6 mg/g en
el equipo de flotación. Gracias a esta dosis se consiguió una mejor aglomeración entre
la tinta y el jabón creando aglomerados más hidrófobos. Se obtuvieron los datos más
altos de brillo con menor ratio de masa de rechazo, en comparación con otros reactivos
colectores como los surfactantes.

39
6 BIBLIOGRAFÍA
Ackermann C (2000) Bleaching of deinked pulp. In: Göttsching L & Pakarinen H (eds.)
Papermaking Science and Technology, Book 7, Recycled Fibre and Deinking. Helsinki.
1st edition, Finland, Fapet Oy, pp. 306-356. ISBN 952-5216-07-1.
Beneventi D, Carré B & Gandini A (2005) Physico-chemical aspects of deinking. 7th
CTP/PTS Advanced Training Course on Deinking. Grenoble, France, May 31st/June 1-
2nd.
Carré B & Galland G (2007) Overview of deinking technology. 8th CTP/PTS Deinking
Training Course. Grenoble, France, May 29-30-31st.
Chabot B, Daneault C, Sain MM & Dorris GM (1997) The adverse role of fibres during
the flotation of flexographic inks. Pulp & Paper Canada, 98, (12), pp. T451-T456,
ISSN: 0316-4004.
Dorris G, Ben Y & Ricard M (2011) Overview of Flotation Deinking. Progress in Paper
Recycling, 20, (1), 41. ISSN: 1061-1452.
Dorris GM & Nguyen N (1995) Flotation of Model Inks. Part II: Flexo Ink Dispersions
Without Fibres. Journal of Pulp and Paper Science, 21, (2), pp. J55-J62. ISSN: 0826-
6220.
Doshi MR (1997) Overview – Deinking & Bleaching. IN: Doshi MR & Dyer JM (eds.)
Paper recycling challenge. Volume II. Deinking & bleaching. Appleton, WI, Doshi and
Associates Inc, pp. 3-5. ISBN: 0-9657447-1-X.
Eul W, Meier J, Arnold G, Berger M & Suess HU (1990) Fractionation prior to flotation
– A new approach for deinking technology. Proceeding of the TAPPI Pulping
conference. Atlanta, GA, TAPPI Press, pp. 757-765. ISBN: 0-89852-742-2.
40
Eul W, Süss HU & Helmling O (1989) Fibre fractionation and post-treatment of de-
inked pulp. Pulp & Paper Canada, 90, (10), pp. T391-397. ISSN: 0316-4004.
Holik H (2000) Unit operations and equipment in recycled fiber prosessing. In:
Göttsching L & Pakarinen H (eds.) Papermaking Science and Technology, Book 7,
Recycled Fiber and Deinking. 1st edition, Helsinki, Finland, Fapet Oy, pp. 90-209.
ISBN: 952-5216-07-1.
INGEDE Method 11 (2009) International Association of the Deinking Industry. Method
11p: Assessment of Print Product Recyclability – Deinkability Test. [pdf-file]. 12/2009.
Available at:
http://www.ingede.de/ingindxe/methods/ingede-method-11p-2009.pdf
Julien Saint Amand F (1999) Hydrodynamics of Deinking Flotation. International
Journal of Mineral Processing, 56, (1-4), pp. 277-316. ISSN: 0301-7516.
Julien Saint Amand F (2005) Ink Removal by Flotation and Washing: Hydrodynamic
and Technological Aspects. Part 1: Flotation. 7th CTP/PTS Advanced Training Course
on Deinking. Grenoble, France, May 31st/June 1-2nd.
Kraschowetz H, Hertl E and Aregger HJ (2008) Fractionation in DIP-Lines – A further
step in waste paper recycling. Proceedings form 62nd APPITA Annual Conference,
Carlton, Australia, Appita, pp. 177-183. ISBN: 978-0-95757469-4-4.
Körkkö M, Bussini D, Laitinen O, Elegir G & Niinimäki J (2010) True-neutral
fractional deinking for flexographic and offset newsprints. Proceedings from the 65th
Appita Annual Conference, Appita, Carlton: pp. 23-30. ISBN: 978-0-9757469-9-5.
Körkkö M, Haapala A, Mäkinen L, Ämmälä A, & Niinimäki J (2010) A Novel Sheet
Preparation Method for Ink Content Measurement in Paper Recycling. Proceedings of
the TAPPI PEERS conference and 9th Research Forum on Recycling, Atlanta, GA,
TAPPI Press, Conf. CD. ISBN: 978-161782196-7.

41
Körkkö M, Laitinen O, Vahlroos S, Ämmälä A & Niinimäki J (2008) Components
Removal in Flotation Deinking. Progress in Paper Recycling, 17, (4), pp. 15-22. ISSN:
1061-1452.
Lapierre L, Pitre D & Bouchar J (2003) Fines from deinked pulp: Effect of
contaminants on their bleachability and on the pulp final brightness. Pulp and paper
Canada, 104, (8), pp. T208-T211. ISSN: 0316-4004.
Lassus A (2000) Deinking chemistry. In: Göttsching L & Pakarinen H (eds.)
Papermaking Science and Technology, Book 7, Recycled Fiber and Deinking. 1st
edition, Helsinki, Finland, Fapet Oy, pp. 240-265. ISBN: 952-5216-07-1.
Mäkinen L, Ämmäla A, Vahlroos-Pirneskoski S, Körkkö M, Sarja T and Niinimäki J
(2010) Fractionation prior to deinking – a study of optical properties of fractions. Ipw
no. 4-5, pp. 14-20. ISSN: 1615-1720.
Matzke WH, Selder HH (1996) New Development in Deinking and Bleaching of
Secondary Fibers. Journal of Korea Tappi, 28, (1), pp. 73-79. ISSN: 0253-3200.
McKinney R (1999) Flotation Deinking Overview. In: Doshi MR & Dyer JM (eds.)
Paper Recycling Challenge. Volume III. Process Technology. Appleton, WI, Doshi and
Associates Inc, pp. 99-114. ISBN: 0-9657447-3-6.
Meltzer FP (1999) Fractionation. In: Doshi MR & Dyer JM (eds.) Paper Recycling
Challenge. Volume IV. Process Control & Mensuration. Appleton, WI, Doshi and
Associates Inc, pp. 153-162. ISBN: 0-9657447-4-4.
Vahlroos-Pirneskoski S, Körkkö M, Rosencrance S and Niinimäki J (2008) Post-
bleaching Response of Pulps Deinked using an Alkaline Fatty Acid Soap or Reduce
Alkaline Surfactant Blend Chemistry. Progress in Paper Recycling, 17, (3). ISSN: 1061-
1452.

Anexo 1 1
ANEXO 1
Department of process and environmental engineering
Fibre and particle engineering laboratory
Master’s thesis
Study of DIP fines fraction flotation
Oulu 15.9.2011
Author: _____________________
Gabriel Cisneros Barriga
Supervisor: ______________________
Ari Ämmälä
Dr. Tech
Advisor: ______________________ Advisor: ______________________
Mika Körkkö Liisa Mäkinen
M.Sc. M.Sc.

Anexo 1 2
UNIVERSITY OF OULU Abstract of thesis Faculty of technology
Department Laboratory
Department of Process and Environmental Engineering
Fibre and Particle Engineering Laboratory
Author Supervisor
Cisneros Barriga, Gabriel Ämmälä, A. Adjunct Professor
Name of the thesis
Study of DIP fines fraction flotation
Subject Level of studies Date Number of pages
Process Engineering Master’s thesis September 2011 63 + 3 (1 app.) Abstract
An increasing use of recovered papers to produce, through deinking, white grades has developed
deinking process lines in order to achieve the required final stock properties. For improving the
deinking process, other deinking lines are being considered too. In this Master’s Thesis, DIP fines
fraction flotation was studied in detail, as part of a fractional deinking concept that has been
considered as an alternative deinking process.
The objective of this study was to obtain more information about the less studied fines fraction
flotation and to optimize its properties. The work was divided into five different flotation scenarios.
Raw material used was a mixture of recovered paper with an ONP/OMG ratio of 50% ONP and 50%
OMG. Flotation experiments worked very well despite of the old raw material. Fractionation was
performed with a pressure screen with a long fibre share of 35% and short fibre 65%. Through
fractionation free ink and ash drifted into the short fibre fraction.
Fines fraction flotation results suggest that changing either flotation cell level or air flow do not have
so much effect on pulp properties after flotation. On the other hand, increasing the delay of chemicals
prior to flotation has an effect on fines fraction properties: longer delay increases brightness but also
mass reject rate which lowers the yield. Moreover, pH adjustment prior to flotation do not have an
effect on pulp properties, so apparently fines fraction flotation experiments can be carried out in
neutral pH conditions.
Based on the results presented here, the use of a soap dosage of 6 kg/t in the flotation is
recommended in fines fraction flotation experiments. Highest value of brightness was reached with
lower yield loss with 6 kg/t soap dosage compared to other chemicals tested.
Library location
University of Oulu, Science and technology Library Tellus

Anexo 1 3
ACKNOWLEDGEMENTS
This master’s thesis was done at the Fibre and Particle Engineering Laboratory at the
University of Oulu.
I wish to thank all the people from the Fibre and Particle Engineering Laboratory of the
University of Oulu for their kindness and for making the coldest winter of my life a
little bit warmer. Special thanks to my advisors Liisa Mäkinen and Mika Körkkö for
their calm and positive attitude and for their valuable help and assistance during the
whole thesis. Sincere thanks to my advisor Dr. Ari Ämmälä for his guidance.
Finally, I would like to thank my family, specially my parents, for their patience and for
giving me the chance to study abroad, and my brother, for being my support and
strength through the good and bad times. I would like to thank also all the friends I have
made during my Erasmus in Oulu. This past year was full of unforgettable memories.
Special thanks to my friends from school, from university and from my village
Malanquilla for their love, friendship and for all the laughs we have shared.
Oulu, September, 2011
Gabriel Cisneros Barriga

Anexo 1 4
ABBREVIATIONS
A Accept
cf Consistency of the feed pulp (%)
cr Consistency of the reject pulp (%)
Ca2+
Calcium
DAF Dissolved air flotation
DIP Deinked pulp
ERIC Effective residual ink concentration
F Feed
FAS Formamidine sulphinic acid
g Grammage
H2O2 Hydrogen peroxide
HC High consistency
HW Hyper washed
INGEDE International association of the deinking industry
k Light absorption coefficient
LC Low consistency
LF Long fibre fraction
LWC Light weight coated paper grade
M Molarity (mol/litre)
MC Medium consistency
NaOH Sodium hydroxide
R Reject
RCF Recycled fibre
RRm Mass reject rate
s Light scattering coefficient
SC Super calendared paper grade
SF Short fibre fraction
Anexo 1 5
TABLE OF CONTENTS
ACKNOWLEDGEMENTS ........................................... ¡Error! Marcador no definido.
ABBREVIATIONS ........................................................ ¡Error! Marcador no definido.
TABLE OF CONTENTS ............................................... ¡Error! Marcador no definido.
1 INTRODUCTION .................................................................................................... 7
2 CONVENTIONAL DEINKING LINE .................................................................... 9
2.1 Pulping ............................................................................................................. 10
2.2 Screening ......................................................................................................... 11
2.3 Cleaning ........................................................................................................... 12
2.4 Flotation ........................................................................................................... 13
2.5 Dispersion ........................................................................................................ 14
2.6 Bleaching ......................................................................................................... 14
2.7 Dewatering ....................................................................................................... 15
3 FRACTIONAL DEINKING LINE ........................................................................ 16
3.1 Differences between screening and fractionation ............................................ 17
3.2 Properties of the fibre fractions ....................................................................... 18
3.3 Place of fractionation ....................................................................................... 19
4 FUNDAMENTALS OF FLOTATION .................................................................. 22
4.1 Flotation phases ............................................................................................... 23
4.1.1 Collision between an air bubble and a free ink particle ........................... 24
4.1.2 Formation of an air bubble-ink particle complex ..................................... 25
4.1.3 Migration of the complex to the surface ................................................... 26
4.1.4 Froth removal ........................................................................................... 26
4.2 Flotation yield .................................................................................................. 26
4.2.1 Fibres and fines losses .............................................................................. 27
4.2.2 Fines fraction flotation ............................................................................. 29
5 EXPERIMENTAL ................................................................................................. 31
5.1 Materials .......................................................................................................... 31
5.1.1 Raw material ............................................................................................. 31
5.1.2 Chemicals ................................................................................................. 31
5.2 Methods ........................................................................................................... 32
5.2.1 Process description ................................................................................... 32
5.2.2 Analyses ................................................................................................... 34
5.3 General construct of experimental part ............................................................ 37
5.3.1 Reference flotation ................................................................................... 37
5.3.2 Fractionation ............................................................................................. 37

Anexo 1 6
5.3.3 Flotation level and air flow during flotation ............................................. 38
5.3.4 Conditioning prior to flotation .................................................................. 38
5.3.5 Effect of pH in flotation............................................................................ 39
5.3.6 Comparison of flotation chemicals ........................................................... 40
6 RESULTS ............................................................................................................... 41
6.1 Reference flotation ........................................................................................... 41
6.2 Fractionation .................................................................................................... 43
6.3 Flotation level and air flow during flotation .................................................... 43
6.4 Conditioning prior to flotation ......................................................................... 44
6.5 Effect of pH in flotation ................................................................................... 46
6.6 Comparison of flotation chemicals .................................................................. 50
7 DISCUSSION ......................................................................................................... 53
7.1 Reference flotation ........................................................................................... 53
7.2 Fractionation .................................................................................................... 53
7.3 Flotation level and air flow during flotation .................................................... 54
7.4 Conditioning prior to flotation ......................................................................... 54
7.5 Effect of pH in flotation ................................................................................... 55
7.6 Comparison of flotation chemicals .................................................................. 56
8 CONCLUSIONS AND RECOMMENDATIONS ................................................. 57
9 SUMMARY ........................................................................................................... 58
9.1 Reference flotation ........................................................................................... 58
9.2 Fractionation .................................................................................................... 58
9.3 Flotation level and air flow during flotation .................................................... 58
9.4 Conditioning prior to flotation ......................................................................... 59
9.5 Effect of pH in flotation ................................................................................... 59
9.6 Comparison of flotation chemicals .................................................................. 59
10 REFERENCES ....................................................................................................... 60
APPENDICES
APPENDIX 1. Block diagram of the flotation experiments
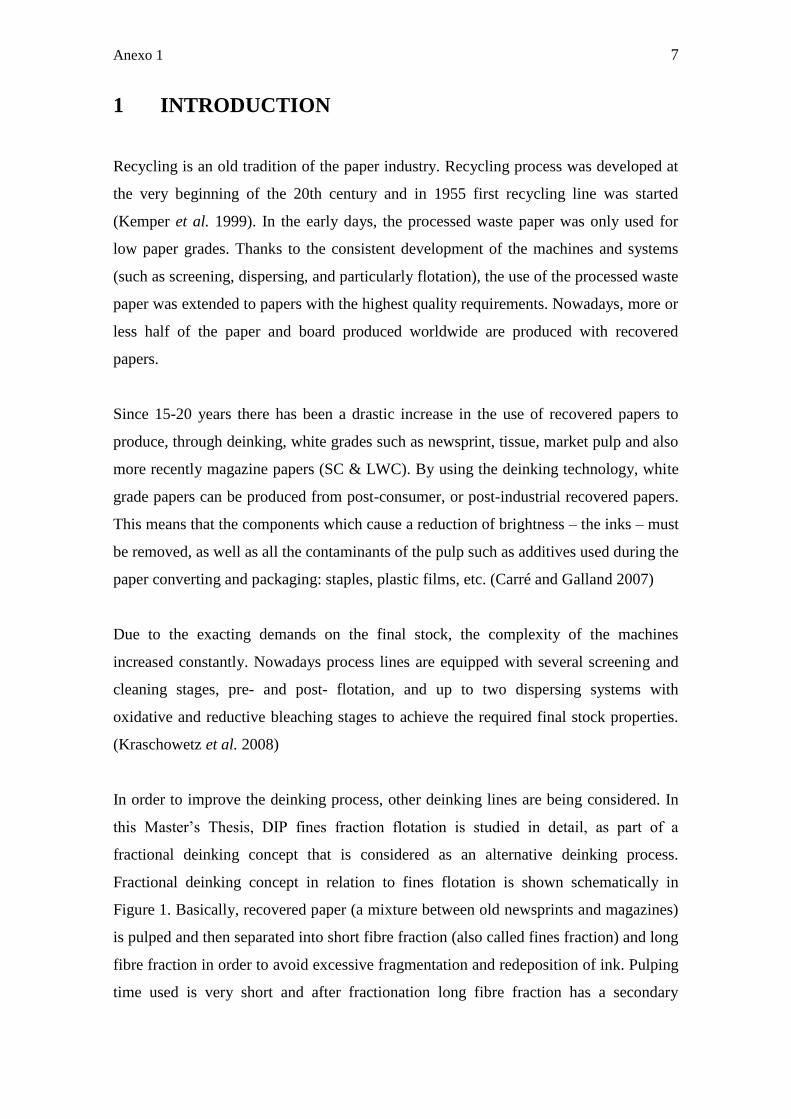
Anexo 1 7
1 INTRODUCTION
Recycling is an old tradition of the paper industry. Recycling process was developed at
the very beginning of the 20th century and in 1955 first recycling line was started
(Kemper et al. 1999). In the early days, the processed waste paper was only used for
low paper grades. Thanks to the consistent development of the machines and systems
(such as screening, dispersing, and particularly flotation), the use of the processed waste
paper was extended to papers with the highest quality requirements. Nowadays, more or
less half of the paper and board produced worldwide are produced with recovered
papers.
Since 15-20 years there has been a drastic increase in the use of recovered papers to
produce, through deinking, white grades such as newsprint, tissue, market pulp and also
more recently magazine papers (SC & LWC). By using the deinking technology, white
grade papers can be produced from post-consumer, or post-industrial recovered papers.
This means that the components which cause a reduction of brightness – the inks – must
be removed, as well as all the contaminants of the pulp such as additives used during the
paper converting and packaging: staples, plastic films, etc. (Carré and Galland 2007)
Due to the exacting demands on the final stock, the complexity of the machines
increased constantly. Nowadays process lines are equipped with several screening and
cleaning stages, pre- and post- flotation, and up to two dispersing systems with
oxidative and reductive bleaching stages to achieve the required final stock properties.
(Kraschowetz et al. 2008)
In order to improve the deinking process, other deinking lines are being considered. In
this Master’s Thesis, DIP fines fraction flotation is studied in detail, as part of a
fractional deinking concept that is considered as an alternative deinking process.
Fractional deinking concept in relation to fines flotation is shown schematically in
Figure 1. Basically, recovered paper (a mixture between old newsprints and magazines)
is pulped and then separated into short fibre fraction (also called fines fraction) and long
fibre fraction in order to avoid excessive fragmentation and redeposition of ink. Pulping
time used is very short and after fractionation long fibre fraction has a secondary
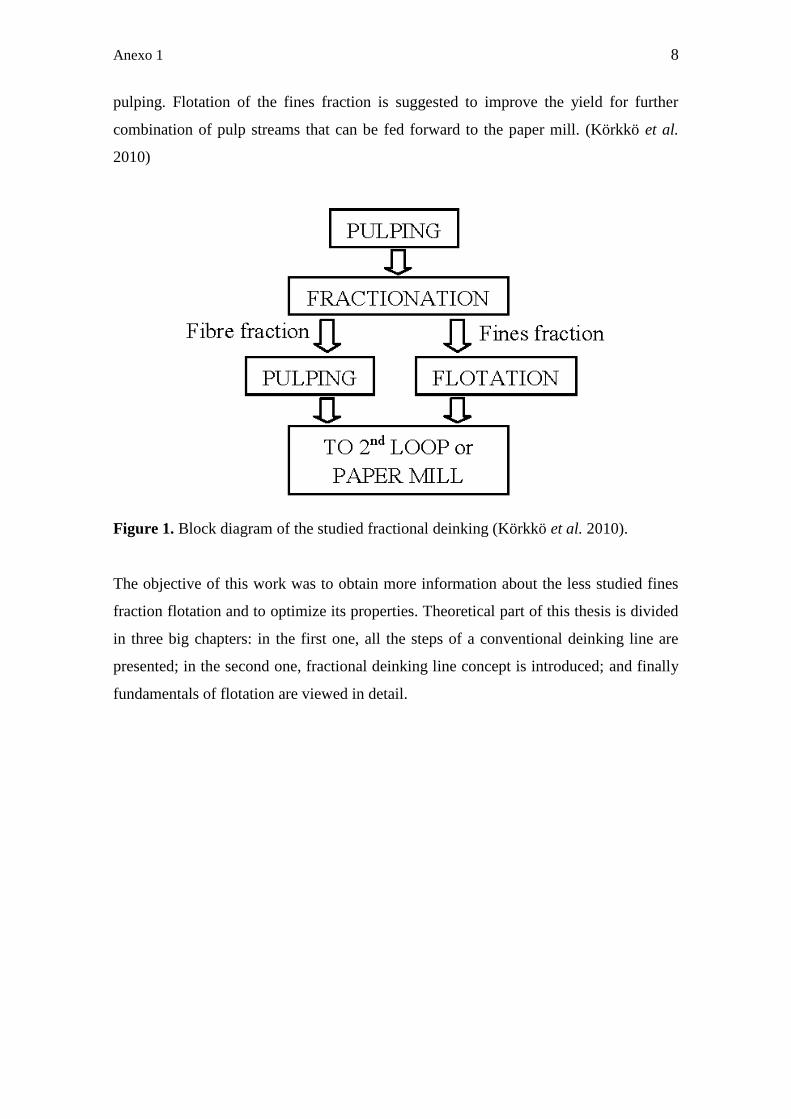
Anexo 1 8
pulping. Flotation of the fines fraction is suggested to improve the yield for further
combination of pulp streams that can be fed forward to the paper mill. (Körkkö et al.
2010)
Figure 1. Block diagram of the studied fractional deinking (Körkkö et al. 2010).
The objective of this work was to obtain more information about the less studied fines
fraction flotation and to optimize its properties. Theoretical part of this thesis is divided
in three big chapters: in the first one, all the steps of a conventional deinking line are
presented; in the second one, fractional deinking line concept is introduced; and finally
fundamentals of flotation are viewed in detail.
Anexo 1 9
2 CONVENTIONAL DEINKING LINE
The purpose of deinking is to remove printing ink and other substances that might affect
the papermaking process or final properties of paper. For that reason, recycled fibres
used in a deinking process require more complex process systems than virgin fibres
because the recovered paper usually is a mixture of various paper grades and usually, it
also contains a certain proportion of contaminants. The final stock properties depend on
the removal of contaminants from the pulp. Unsatisfactory separation of contaminants
results a low brightness and quality for the end product. (Lassus 2000 pp. 241, Holik
2000 pp. 91)
Some of the ink, like newsprint ink, is relatively weakly bonded to the fibres, and can be
detached rather easily. On the other hand, toner or UV-cured ink may be strongly
bonded to the fibres and cannot be detached easily in a pulper. Mechanical dispersion
units or kneaders are needed to handle these inks. The production of newsprint and
improved paper grades are nowadays usually carried out by using the process concept
presented in Figure 2.
Figure 2. Concept for newsprint and improved paper grades (Schwarz 2000 pp. 213).
The unit operations of a deinking line are the following ones: pulping, screening,
cleaning, flotation, dispersion, bleaching and dewatering. In pulping, mechanical,
chemical and thermal forces are used to detach impurities from the fibres, such as ink.

Anexo 1 10
This is usually carried out in pulpers where strong agitating provides shear force. Steam
or hot water and deinking chemicals are added to help dislodge ink from the fibres.
Screening, cleaning and flotation are separation stages. The detached ink is removed
from the stock by screening, cleaning, flotation and washing stages. (Eul et al. 1990,
Doshi 1997 pp. 3)
2.1 Pulping
The purpose of pulping is to slush the raw material into individual fibres as much as
possible to form a suspension that can at least be pumped. During pulping, large, solid
contaminants such as strings, plastic, stickies and printing ink, are removed from the
pulp suspension. The disintegrating forces applied in the pulper must be greater than the
strength of the raw material or the adhesion force of contaminants to the fibres. But
pulping forces should not be excessive or contaminants will break excessively which
leads to a less efficient removal. For that reason, it is desirable to remove solid
contaminants at an early stage. To save energy, the first step is often limited to coarse
slushing and heavy particle separation. (Holik 2000 pp. 95-97)
Chemicals are most often used in the pulping stage in order to improve ink release from
the fibres even if there is a recent trend to move to neutral pulping conditions. For
instance, NaOH swells fibres and increase slushing rate during pulping. Bleaching
chemicals, such as hydrogen peroxide are also often used in this stage. The most
important and oldest peroxide application in context of deinking is at the pulping stage.
In industrial deinking operations, this peroxide application invariably occurs in an
alkaline environment. To prevent yellowing of the mechanical fibres of the recycled
pulp, peroxide has to be used in alkaline conditions. (Carré & Galland 2007,
Ackermann 2000 pp. 322)
During pulping, a good detachment of the particles from the fibres is needed for further
efficient treatment of the pulp suspension. Mechanical forces remove the ink through
friction between fibres, and chemicals make some particles hydrophobic. Pulping
variables such as pulper type or pulper chemistry influence the ink detachment most,
because ink is mainly separated from the fibres during pulping. The aim is to free the

Anexo 1 11
ink from the fibre and to prevent reattachment and fragmentation of the ink particles.
The lower the ink fragmentation during pulping is, the higher will be the brightness
after flotation. Chemicals during pulping and pulp pre-treatment using kneaders or
dispersers improve ink detachment. (McKinney 1999 pp. 107, Beneventi et al. 2005,
Holik 2000 pp. 151-153)
The presence of metal ions catalyses the undesired peroxide decomposition. The
consequence is an increased addition of stabilizing chemicals such as water glass and
possibly chelating agents. For an efficient use of hydrogen peroxide in pulper, the
standard conditions are 15% to 18% consistency, 40 °C and 20 minutes pulping time.
(Ackermann 2000 pp. 322, Eul et al. 1990)
Pulpers operate at high consistencies HC (up to 19%), at medium consistencies MC (up
to 12%), and at low consistencies LC (up to 6%) depending on raw material. LC pulpers
and HC drum pulpers usually operate continuously. HC pulpers (Helico) operate in
batch mode. (Holik 2000 pp. 99)
2.2 Screening
The purpose of screening is to remove debris and solid contaminants from the recycled
fibre pulp. Screening uses appropriate screen configurations according to particle size,
shape, and deformability of the contaminants. Nondeformable contaminants whose
dimensions exceed the screen opening size are retained while fibres go through the
openings (slots or holes) of the screen. At the beginning, the screening devices were
open vibrating screens, today the screens are closed and pressurised to increase capacity
(Holik 2000 pp. 109-111, Carré & Galland 2007). The principle of screening is shown
in Figure 3.

Anexo 1 12
Figure 3. Principle of screening (Carré & Galland 2007 pp. 3).
Complete screening of recycled fibre pulp in a single stage is normally not possible.
Avoiding fibre loss during screening is impossible as well. For these reasons,
rescreening the first stage screen rejects in a second, third, or even fourth stage can
reduce such losses significantly and improve the screening of recycle fibre pulp. The
last stage (tailing screen) determines the overall fibre losses of the screening system.
(Holik 2000 pp. 109)
Different types of screening machines have use at different points in the system
depending on raw material, debris particles, flake content, and stock consistency.
Coarse screening is used for pulp slurries with a high trash and flake content. Fine
screening occurs in the LC range and partially in the MC range following coarse
screening. For instance, large particles are removed by coarse screening while small
particles (such as stickies) are removed by fine screening. Screen surfaces can be flat
(disk screens) or cylindrical (cylindrical screens). Hole perforations are about 0.8 - 1.5
mm diameter for cylindrical screens and 2.0 - 3.0 mm diameter for flat screens. Slotted
screens are generally in the cylindrical form with slot widths from 0.1 - 0.4 mm. (Holik
2000 pp. 119-120, 124)
2.3 Cleaning
Centrifugal cleaning is a separation process that complements other separation methods
such as screening, and its purpose is to remove particles from the suspension that affect
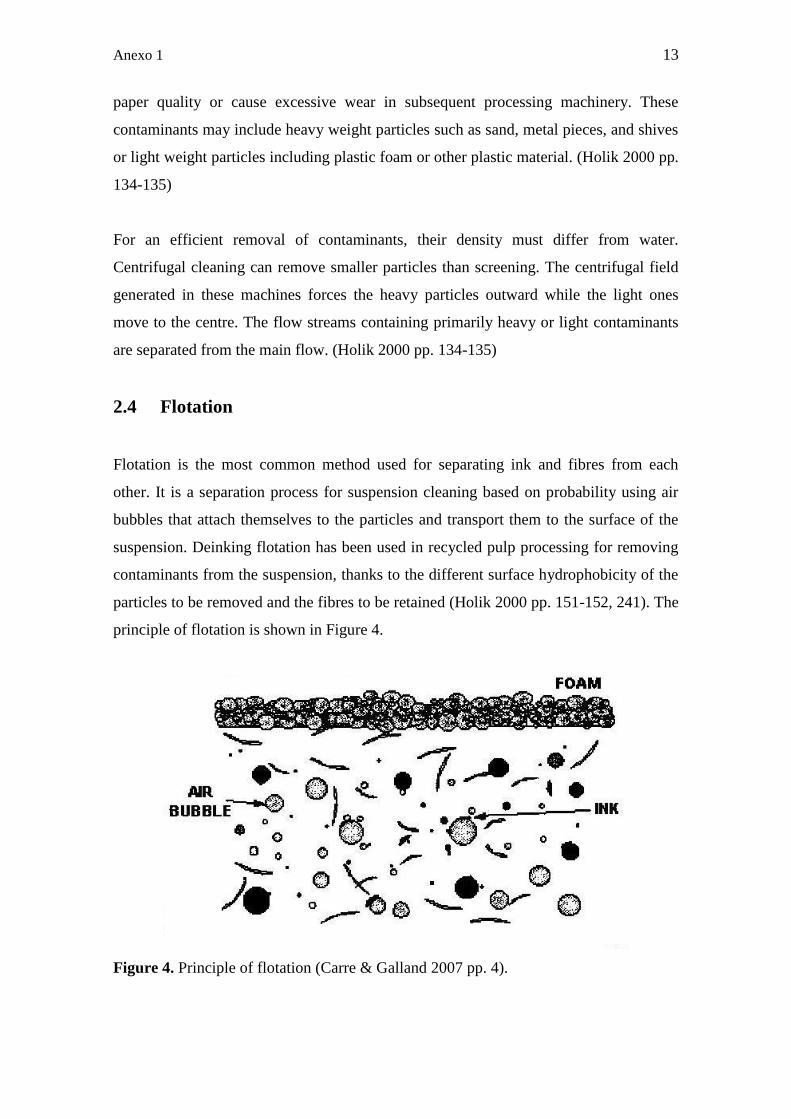
Anexo 1 13
paper quality or cause excessive wear in subsequent processing machinery. These
contaminants may include heavy weight particles such as sand, metal pieces, and shives
or light weight particles including plastic foam or other plastic material. (Holik 2000 pp.
134-135)
For an efficient removal of contaminants, their density must differ from water.
Centrifugal cleaning can remove smaller particles than screening. The centrifugal field
generated in these machines forces the heavy particles outward while the light ones
move to the centre. The flow streams containing primarily heavy or light contaminants
are separated from the main flow. (Holik 2000 pp. 134-135)
2.4 Flotation
Flotation is the most common method used for separating ink and fibres from each
other. It is a separation process for suspension cleaning based on probability using air
bubbles that attach themselves to the particles and transport them to the surface of the
suspension. Deinking flotation has been used in recycled pulp processing for removing
contaminants from the suspension, thanks to the different surface hydrophobicity of the
particles to be removed and the fibres to be retained (Holik 2000 pp. 151-152, 241). The
principle of flotation is shown in Figure 4.
Figure 4. Principle of flotation (Carre & Galland 2007 pp. 4).

Anexo 1 14
Once a good detachment of the particles from the fibres is achieved through pulping, air
is introduced into the suspension and the water-repelling particles attach to the air
bubbles and rise to the surface forming a foam layer at the top of the suspension, while
the hydrophilic fibres remain in the water phase. These hydrophobic particles include
printing ink, stickies, fillers, coating, pigments and binders. The foam can be removed
mechanically, by overflow or by a vacuum extraction. (Holik 2000 pp. 151-153, 244)
In flotation systems air is introduced into a diluted fibre suspension of 0.8 - 1.5%
consistency. The relative air load is mostly about 300% or more, expressed as total air
volume flow to total suspension volume flow. pH should be about 7 - 9 when using fatty
acid surfactants and temperatures of 40 – 70 ºC. The main application of selective
flotation in the paper industry is deinking. This improves pulp brightness by removing
ink particles and enhances cleanliness by removing dirt specks (Holik 2000 pp. 151,
157, 244). Flotation is discussed more deeply in Chapter 4.
2.5 Dispersion
The purpose of dispersion is to break down contaminants to a size where they usually
no longer interfere or detach them from the fibres if necessary to remove them in a
subsequent process. Dispersion makes dirt specks and stickies smaller and floatable,
mixes in bleaching agents and detaches ink still adhering to the fibres. Two kinds of
dispergers are used in the dispersion stage: disk and kneading dispergers. (Holik 2000
pp. 185-186)
Recycled pulp is dispersed at consistency of 25 - 30% and temperatures of 60 - 95 °C.
These process conditions and the high shear environment are ideal for admixing of
peroxide. Dispersion can be done also without NaOH and hydrogen peroxide.
(Ackerman 2000 pp. 232)
2.6 Bleaching
Bleaching contributes decisively to the optical characteristics of DIP such as brightness
and luminance. The bleached deinked pulp is usually used in the production of printing

Anexo 1 15
papers such as super calendared (SC) and office papers. Especially with hygienic papers
the microbial activity can be stopped with hydrogen peroxide.
Bleaching chemicals are divided into two groups: lignin preserving such as hydrogen
peroxide (H2O2), sodium dithionite (Na2S2O4) and formamidine sulphinic acid (FAS),
and lignin degrading such as chlorine (Cl2), chlorine dioxide (ClO2), sodium
hypochlorite (NaOCl), ozone (O3) and oxygen (O2). Lignin preserving chemicals are
normally used for wood containing papers, and lignin degrading chemical (if used) for
wood free papers. (Ackermann 2000 pp. 307)
The choice of bleaching chemicals and processes depends on the demanding quality of
the final product. Besides fibre composition, this also includes different types and
proportions of contaminants and detrimental substances still present in the deinked
stock. (Ackermann 2000 pp. 307)
The bleaching of deinked pulp at the end of stock processing is post-bleaching. The
deinked pulp is thickened and heated with steam to a temperature of approximately 60
°C. After adding bleaching chemicals, the pulp is stored in a bleaching tower at a
consistency of about 15% for 1 - 3 hours. (Ackermann 2000 pp. 324)
2.7 Dewatering
Dewatering is a filtration process with mechanical pressing and its purpose is to remove
process water from the pulp slurry and increase the stock consistency simultaneously.
Dewatering makes subsequent processes at the production level more cost-effective and
saves space in further storage. HC dispersion is an example of these subsequent
processes that can be improved thanks to dewatering. Stock dewatering characteristics
are normally expressed in the paper industry as Schopper-Riegles value (SR) or
Canadian Standard Freeness (CSF). Dewatering without further mechanical pressing is
often called thickening. The most common dewatering machines used in recovered
paper processing are belt filters, drum filters, disk filters and screw presses. During
filtration, a filter cake or filter mat is accumulating on the filter base such as a wire or
screen. (Holik 2000 pp. 168, 169, 171, 172)
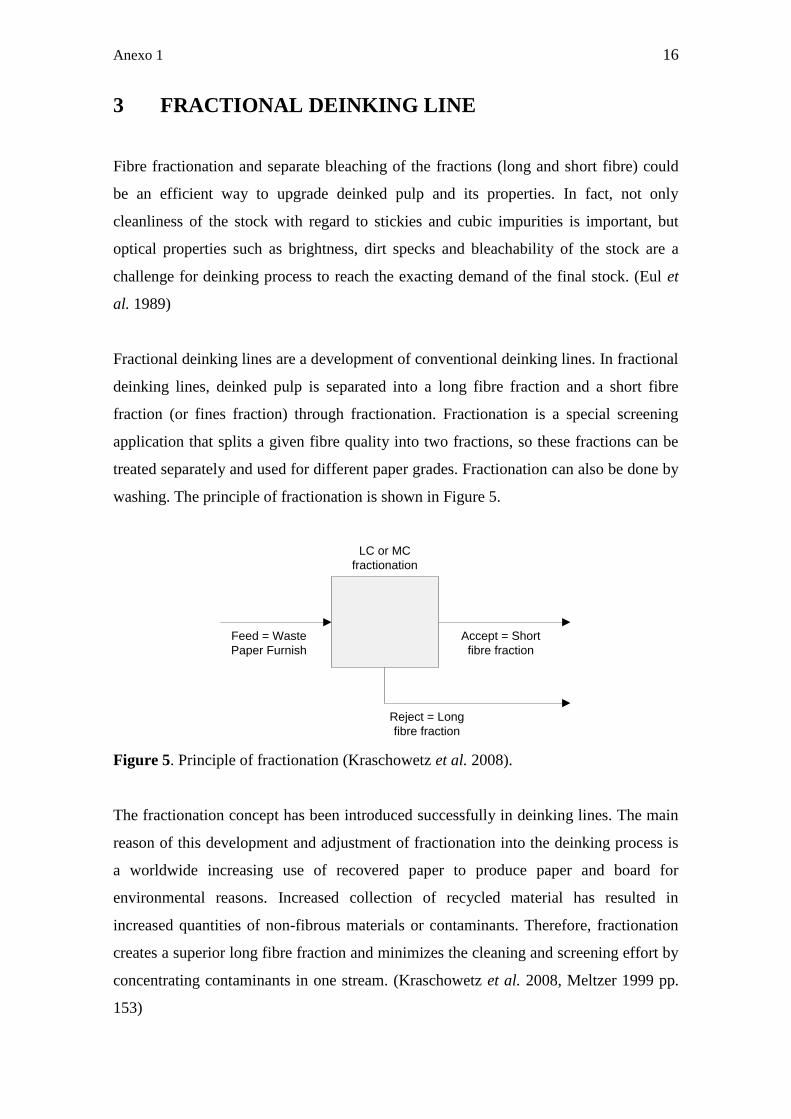
Anexo 1 16
3 FRACTIONAL DEINKING LINE
Fibre fractionation and separate bleaching of the fractions (long and short fibre) could
be an efficient way to upgrade deinked pulp and its properties. In fact, not only
cleanliness of the stock with regard to stickies and cubic impurities is important, but
optical properties such as brightness, dirt specks and bleachability of the stock are a
challenge for deinking process to reach the exacting demand of the final stock. (Eul et
al. 1989)
Fractional deinking lines are a development of conventional deinking lines. In fractional
deinking lines, deinked pulp is separated into a long fibre fraction and a short fibre
fraction (or fines fraction) through fractionation. Fractionation is a special screening
application that splits a given fibre quality into two fractions, so these fractions can be
treated separately and used for different paper grades. Fractionation can also be done by
washing. The principle of fractionation is shown in Figure 5.
Accept = Short
fibre fraction
Reject = Long
fibre fraction
LC or MC
fractionation
Feed = Waste
Paper Furnish
Figure 5. Principle of fractionation (Kraschowetz et al. 2008).
The fractionation concept has been introduced successfully in deinking lines. The main
reason of this development and adjustment of fractionation into the deinking process is
a worldwide increasing use of recovered paper to produce paper and board for
environmental reasons. Increased collection of recycled material has resulted in
increased quantities of non-fibrous materials or contaminants. Therefore, fractionation
creates a superior long fibre fraction and minimizes the cleaning and screening effort by
concentrating contaminants in one stream. (Kraschowetz et al. 2008, Meltzer 1999 pp.
153)

Anexo 1 17
The efficiency of every fractionation experiment is focused on the flow characteristics
of the screen surface. Based on fractionation efficiency, three different groups of factors
or parameters can be identified.
- First group are the properties of the individual fibre such as length, thickness,
coarseness, stiffness, and surface characteristics. The flow characteristics are
influenced by these fibre properties and by the concentration of fibres in the
suspension.
- The next group is the machine factors. Screen basket is a determining parameter
because it is the physical barrier for all the particles. Fractionation efficiency
depends on screen basket properties such as the type of aperture, hole or slot, the
aperture’s size and the surface profile. Other parameters regarding the housing
and the rotor have gained importance in fractionation efficiency. Rotor design,
the clearance between rotor and screen, the number of pulsation elements, and
the rotor speed determine frequency, size, and shape of the pressure and suction
pulses. Housing can be pressurized or at atmospheric pressure.
- Finally, the third group includes operating parameters. Consistency, reject rate,
system design and rotor speed influence aperture velocity and flow
characteristics. (Meltzer 1999 pp. 156)
3.1 Differences between screening and fractionation
The basic purpose of screening is the removal of disturbing components with a
minimum loss of usable fibres. On the contrary, fractionation focuses on the separation
of the stock flow into two or more fractions. Though fractionation and screening are
based on the same principles, their focus is quite different.
The performance of a screening system is determined by accept quality with several
contaminants removed as reject. However, a fractionation system is typically evaluated
by properties of the long fibre fraction. The main differences between screening and
fractionation are explained in Figure 6.
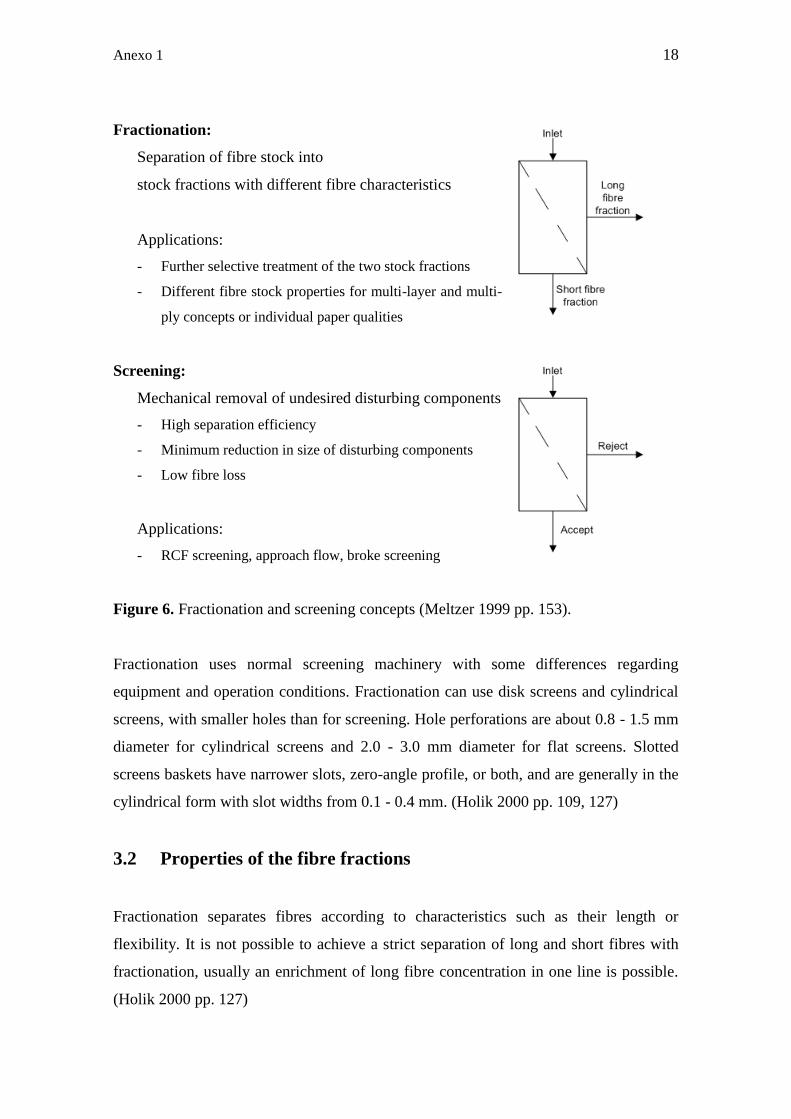
Anexo 1 18
Fractionation:
Separation of fibre stock into
stock fractions with different fibre characteristics
Applications:
- Further selective treatment of the two stock fractions
- Different fibre stock properties for multi-layer and multi-
ply concepts or individual paper qualities
Screening:
Mechanical removal of undesired disturbing components
- High separation efficiency
- Minimum reduction in size of disturbing components
- Low fibre loss
Applications:
- RCF screening, approach flow, broke screening
Figure 6. Fractionation and screening concepts (Meltzer 1999 pp. 153).
Fractionation uses normal screening machinery with some differences regarding
equipment and operation conditions. Fractionation can use disk screens and cylindrical
screens, with smaller holes than for screening. Hole perforations are about 0.8 - 1.5 mm
diameter for cylindrical screens and 2.0 - 3.0 mm diameter for flat screens. Slotted
screens baskets have narrower slots, zero-angle profile, or both, and are generally in the
cylindrical form with slot widths from 0.1 - 0.4 mm. (Holik 2000 pp. 109, 127)
3.2 Properties of the fibre fractions
Fractionation separates fibres according to characteristics such as their length or
flexibility. It is not possible to achieve a strict separation of long and short fibres with
fractionation, usually an enrichment of long fibre concentration in one line is possible.
(Holik 2000 pp. 127)

Anexo 1 19
The two fractions have different characteristics:
The short-fibre fraction (SF):
- enrichment of fines, ash and short fibres
- ink particles already detached from the fibres
- bleach-inhibiting substances (ash and fines).
The long-fibre fraction (LF):
- enrichment of long fibres
- ink particles still sticking onto the fibres
- stickies.
Separate bleaching stages for long and short fractions could result in better brightness
values than applying these chemicals to entire pulp fraction. In entire pulp fractions,
fines leads to an over/consumption of bleaching agents. Due to fractionation, optimum
bleaching conditions can be reached. The long fibre (LF) fraction can be bleached very
efficiently with hydrogen peroxide (H2O2), and the short fibre (SF) fraction can be
bleached with reductive bleaching agents, if necessary. (Eul et al. 1989, Eul et al. 1990,
Lapierre et al. 2003, Kraschowetz et al. 2008)
Fibre fractionation improves brightness of both fractions. The LF fraction bleached with
peroxide reached an ISO brightness of 75%, while the fines fractions bleached with
hydrosulphite reached an ISO brightness of only 56%. (Floccia et al. 1996, Lapierre et
al. 2003)
3.2 Place of fractionation
Fractionation can be implemented in DIP lines for newsprint as well as for higher paper
grades, such as SC or LWC. The goal of fractionation is to reduce the number of
deinking loops of a conventional deinking system. The DIP system for newsprint
presented in Figure 7, consists of two-loops with oxidative bleaching and an optional
reductive bleaching.

Anexo 1 20
PulpingCoarse
screeningFlotation 1
LC-
cleaning
LC-
screening
Thickening Dewatering Dispersing Flotation 2 Thickening
Figure 7. Conventional DIP system for newsprint (Kraschowetz et al. 2008).
Two new system configurations can be developed depending on the position of the
fractionator in the DIP system for newsprint previously shown: fractionation at low
consistency when the fractionation is positioned after the pre-flotation, and fractionation
at medium consistency when the fractionation is placed right after the pre-thickening.
Figure 8 shows DIP system with fractionation at low consistency. Two separate disc
filters (one for the long, one for the short fibre) are required. Several cost saving are
achieved with fractionation at low consistency. Separating the long fibre fraction
requires smaller equipment for high consistency thickening and dispersing. Savings in
electric energy, steam consumption and bleaching chemicals are also achieved.
PulpingCoarse
screeningFlotation 1
LC-
cleaning
LC-
screeningDewatering Dispersing Flotation 2 Thickening
ThickeningLC-
fractionation
LF
SF
Thickening
Figure 8. Fractionation at low consistency (Kraschowetz et al. 2008).
Figure 9 shows DIP system with fractionation at medium consistency. There are not as
much savings advantages as in fractionation at LC, because one additional screen
(fractionators is required) and long fibre fraction consistency values are quite low. In the
other hand, thickening of long fibre fraction is much easier than entire pulp or short
fibre fraction thickening. (Kraschowetz et al. 2008)
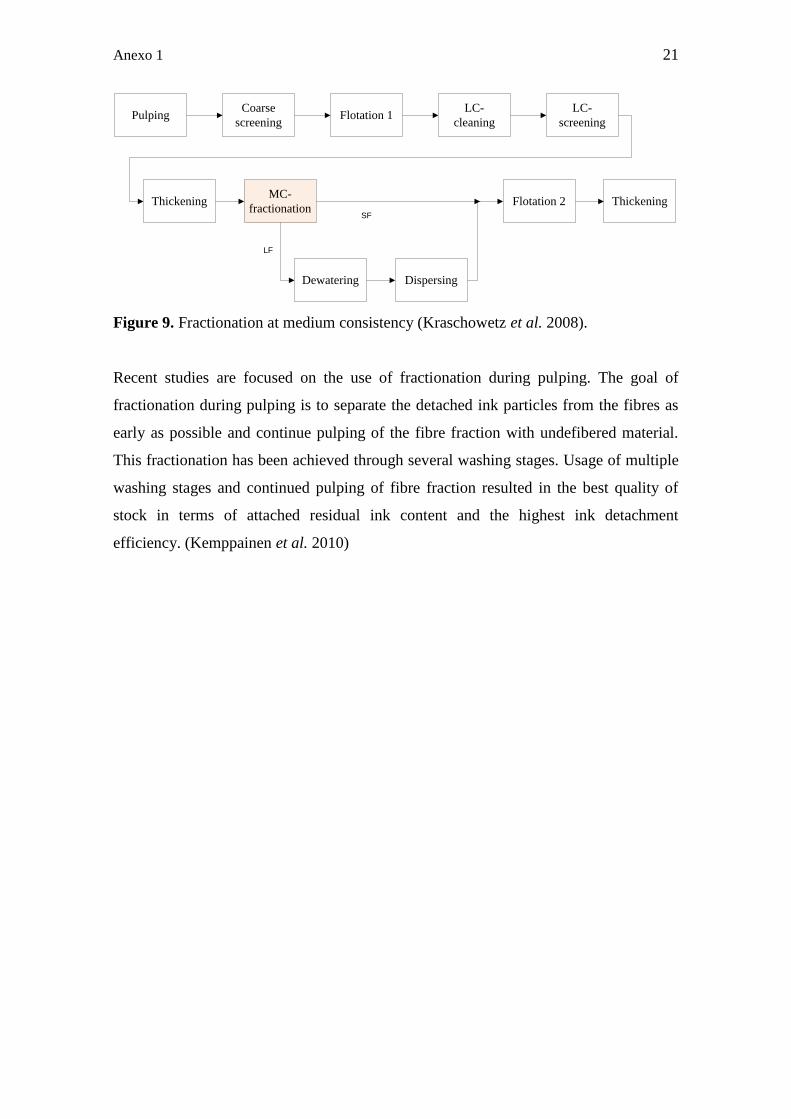
Anexo 1 21
PulpingCoarse
screeningFlotation 1
LC-
cleaning
LC-
screening
Dewatering Dispersing
Flotation 2 ThickeningThickeningMC-
fractionation
LF
SF
Figure 9. Fractionation at medium consistency (Kraschowetz et al. 2008).
Recent studies are focused on the use of fractionation during pulping. The goal of
fractionation during pulping is to separate the detached ink particles from the fibres as
early as possible and continue pulping of the fibre fraction with undefibered material.
This fractionation has been achieved through several washing stages. Usage of multiple
washing stages and continued pulping of fibre fraction resulted in the best quality of
stock in terms of attached residual ink content and the highest ink detachment
efficiency. (Kemppainen et al. 2010)

Anexo 1 22
4 FUNDAMENTALS OF FLOTATION
Froth flotation is a separation process applied to separate ink from recovered paper
stock. This separation is based on probability using air bubbles that attach themselves to
the particles and contaminants of the pulp slurry and its migration to the surface of the
suspension where they form a froth that can be removed by suction or overflowing. The
efficiency of flotation is strictly related to the ink particle/air bubble hydrodynamic and
physicochemical interactions. In recovered paper application, dispersed ink particles
from fibres are made hydrophobic and are agglomerated to improve the selectivity of
the attachment to the air bubbles. (Somasundaran 1998 pp. 83, Holik 2000 pp. 151,
Beneventi et al. 2005, Dorris et al. 2011)
Selectivity of the air bubbles is the main difference between froth flotation and
dissolved air flotation (DAF). The objective of dissolved air flotation is to remove all
suspended solids, rather than separate different types of solids, especially ink and
contaminants, which is the aim of froth flotation. In froth flotation, chemicals are added
to make ink particles more hydrophobic and improve the attachment between ink and
air bubbles (McKinney 1998 pp. 99-100). In this thesis, froth flotation is used.
During flotation deinking, ink and other contaminants are removed, but also flotation
removes some valuable material such as ash, fillers, fibres and fibre fines. For a better
understanding of the components removal during flotation deinking, the different
mechanisms of particle separation from the pulp should be presented. Four main
transport mechanisms describe the particle separation from the pulp suspension thanks
to air bubbles (Beneventi et al. 2005). These four transport mechanisms are shown in
Figure 10.
i) True flotation. Hydrophobic particles adhere themselves to the surface of air
bubbles and are transferred to the froth.
ii) Mechanical entrainment. Hydrophobic and hydrophilic particles are both
transported into the froth by air bubbles.
iii) Water drainage. Gravitational drainage of water from air bubbles in the froth
into the pulp slurry
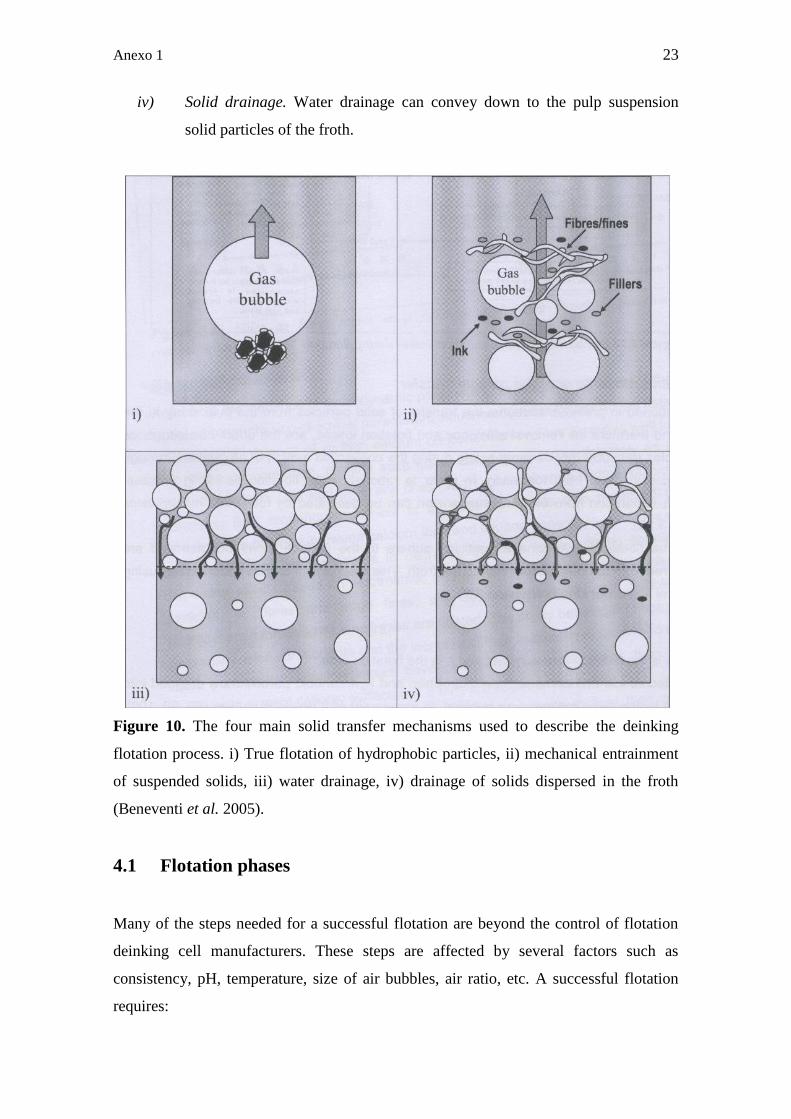
Anexo 1 23
iv) Solid drainage. Water drainage can convey down to the pulp suspension
solid particles of the froth.
Figure 10. The four main solid transfer mechanisms used to describe the deinking
flotation process. i) True flotation of hydrophobic particles, ii) mechanical entrainment
of suspended solids, iii) water drainage, iv) drainage of solids dispersed in the froth
(Beneventi et al. 2005).
4.1 Flotation phases
Many of the steps needed for a successful flotation are beyond the control of flotation
deinking cell manufacturers. These steps are affected by several factors such as
consistency, pH, temperature, size of air bubbles, air ratio, etc. A successful flotation
requires:

Anexo 1 24
- Ink detachment from fibre (shown in Chapter 2.1),
- a collision between an air bubble and a free ink particle,
- the formation of an air bubble-ink particle complex,
- migration of the complex to the surface,
- froth removal of air bubble-ink particle complex from the flotation cell.
4.1.1 Collision between an air bubble and a free ink particle
Air bubble and ink particle has to be close enough to collide and form an air bubble/ink
particle complex. A particle must be within the radius of the streaming tube, which is
defined by the diameter of the air bubble and fluid streamlines. Particle and bubble size
are factors that affect the probability of collision. The higher the particle size is and the
smaller the bubble size is, the higher the probability of collision is. The effect of bubble
size on flotation efficiency is shown in Figure 11. Flotation cell design influence the air
bubble size and the degree of mixing and turbulence. (McKinney 1999 pp. 107-108,
Julien Saint Amand et al. 2005)
Figure 11. Effect of bubble size and particle size on flotation efficiency (Julien Saint
Amand et al. 1999).
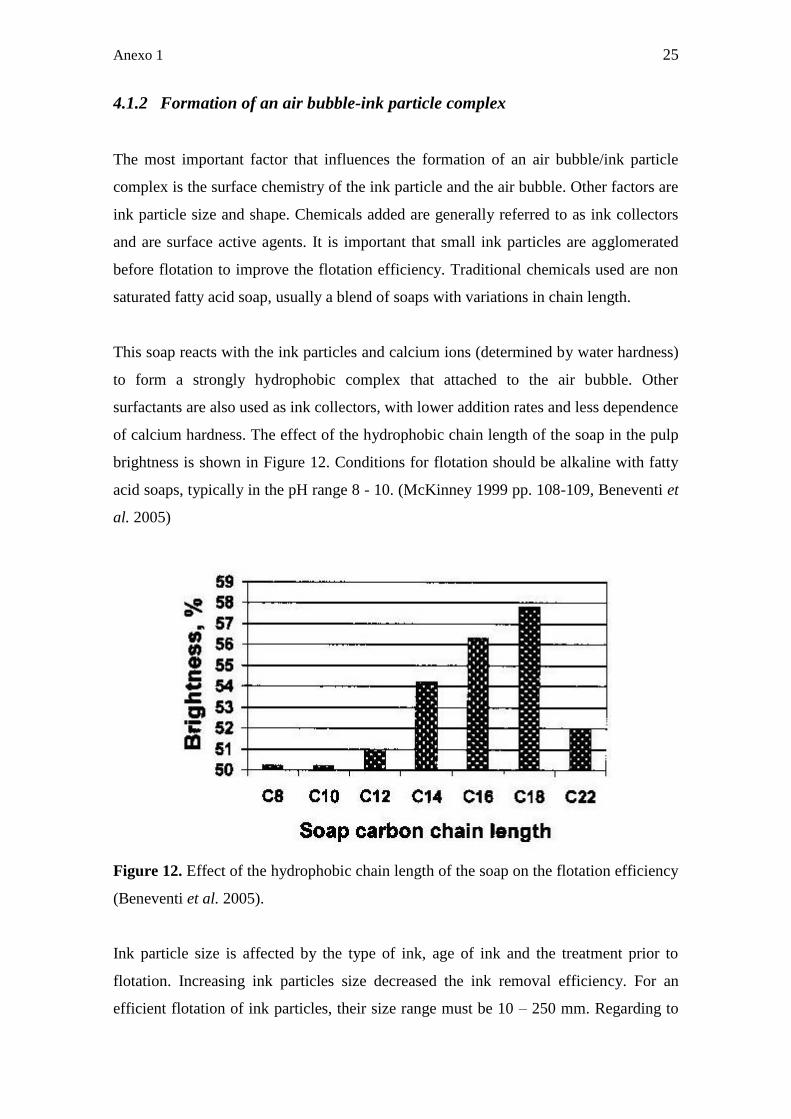
Anexo 1 25
4.1.2 Formation of an air bubble-ink particle complex
The most important factor that influences the formation of an air bubble/ink particle
complex is the surface chemistry of the ink particle and the air bubble. Other factors are
ink particle size and shape. Chemicals added are generally referred to as ink collectors
and are surface active agents. It is important that small ink particles are agglomerated
before flotation to improve the flotation efficiency. Traditional chemicals used are non
saturated fatty acid soap, usually a blend of soaps with variations in chain length.
This soap reacts with the ink particles and calcium ions (determined by water hardness)
to form a strongly hydrophobic complex that attached to the air bubble. Other
surfactants are also used as ink collectors, with lower addition rates and less dependence
of calcium hardness. The effect of the hydrophobic chain length of the soap in the pulp
brightness is shown in Figure 12. Conditions for flotation should be alkaline with fatty
acid soaps, typically in the pH range 8 - 10. (McKinney 1999 pp. 108-109, Beneventi et
al. 2005)
Figure 12. Effect of the hydrophobic chain length of the soap on the flotation efficiency
(Beneventi et al. 2005).
Ink particle size is affected by the type of ink, age of ink and the treatment prior to
flotation. Increasing ink particles size decreased the ink removal efficiency. For an
efficient flotation of ink particles, their size range must be 10 – 250 mm. Regarding to
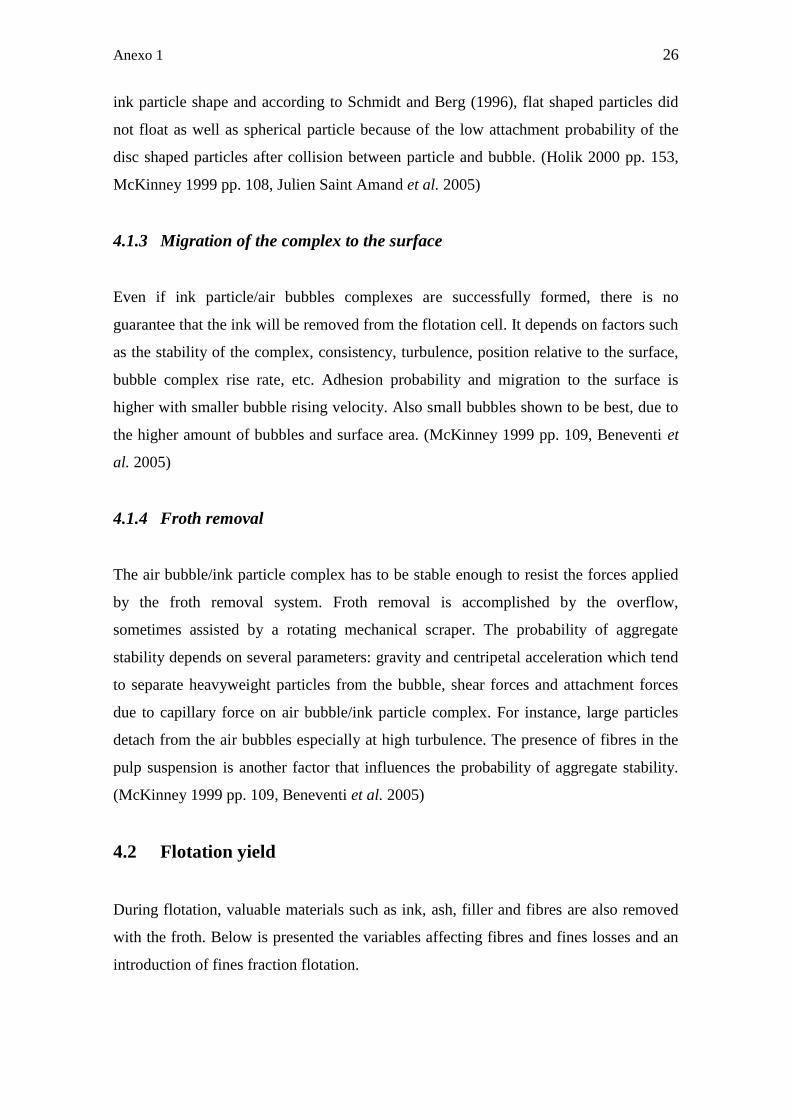
Anexo 1 26
ink particle shape and according to Schmidt and Berg (1996), flat shaped particles did
not float as well as spherical particle because of the low attachment probability of the
disc shaped particles after collision between particle and bubble. (Holik 2000 pp. 153,
McKinney 1999 pp. 108, Julien Saint Amand et al. 2005)
4.1.3 Migration of the complex to the surface
Even if ink particle/air bubbles complexes are successfully formed, there is no
guarantee that the ink will be removed from the flotation cell. It depends on factors such
as the stability of the complex, consistency, turbulence, position relative to the surface,
bubble complex rise rate, etc. Adhesion probability and migration to the surface is
higher with smaller bubble rising velocity. Also small bubbles shown to be best, due to
the higher amount of bubbles and surface area. (McKinney 1999 pp. 109, Beneventi et
al. 2005)
4.1.4 Froth removal
The air bubble/ink particle complex has to be stable enough to resist the forces applied
by the froth removal system. Froth removal is accomplished by the overflow,
sometimes assisted by a rotating mechanical scraper. The probability of aggregate
stability depends on several parameters: gravity and centripetal acceleration which tend
to separate heavyweight particles from the bubble, shear forces and attachment forces
due to capillary force on air bubble/ink particle complex. For instance, large particles
detach from the air bubbles especially at high turbulence. The presence of fibres in the
pulp suspension is another factor that influences the probability of aggregate stability.
(McKinney 1999 pp. 109, Beneventi et al. 2005)
4.2 Flotation yield
During flotation, valuable materials such as ink, ash, filler and fibres are also removed
with the froth. Below is presented the variables affecting fibres and fines losses and an
introduction of fines fraction flotation.

Anexo 1 27
4.2.1 Fibres and fines losses
Fibres and fines losses are influenced by several factors such as chemicals and air
bubble size. Chemicals improve the selectivity of the flotation process making particles
more hydrophobic attracting air bubbles. Without this selectivity, the flotation process
would remove particulate matter in a non-selective manner (as in DAF) leading to the
loss of valuable fines and fillers by entrainment rather than true flotation. This
entrainment phenomenon in flotation deinking is particularly harmful. (Dorris et al.
2011)
A high calcium concentration has a negative influence on fibre losses. At high Ca2+
concentration, calcium soap flakes can deposit on ink particles, fillers, fibres and fines,
increasing their tendency to attach to air bubbles. Nevertheless, sodium silicate has a
positive influence on fibre losses. Fibre losses decreased if sodium silicate is used
during flotation, due to its dispersing effects based on electrostatic and steric repulsion.
(Beneventi et al. 2005)
Air bubble size is a major factor affecting on pulp losses. If 0.01 mm to 0.1 mm sized
air bubbles were created in flotation deinking cells, all the solids, including fibre, would
float, and there would be no separation of ink from fibre. In froth flotation, air bubble
sizes range from about 0.1 mm up to 5.0 mm, and differences in properties between the
suspended solids (such as surface chemistry) assist the separation of solids (McKinney
1999 pp. 100).
According to Körkkö (2008), ash selectivity in removal was practically unaffected by
bubble size and fibre fines loss was higher with larger bubbles. The effect of bubble size
on pulp loss and fines and fillers loss are represented in Figures 13 and 14. According to
this figures, the amount of flotation rejects increases as bubbles size is decreased.
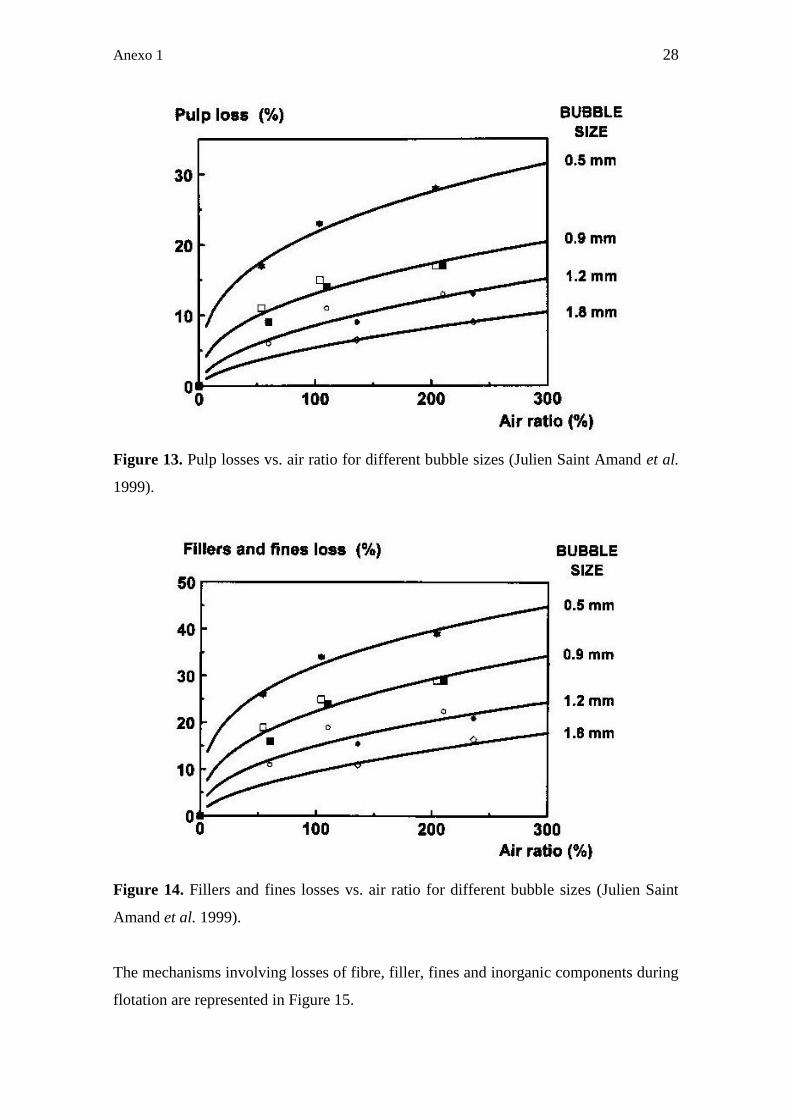
Anexo 1 28
Figure 13. Pulp losses vs. air ratio for different bubble sizes (Julien Saint Amand et al.
1999).
Figure 14. Fillers and fines losses vs. air ratio for different bubble sizes (Julien Saint
Amand et al. 1999).
The mechanisms involving losses of fibre, filler, fines and inorganic components during
flotation are represented in Figure 15.
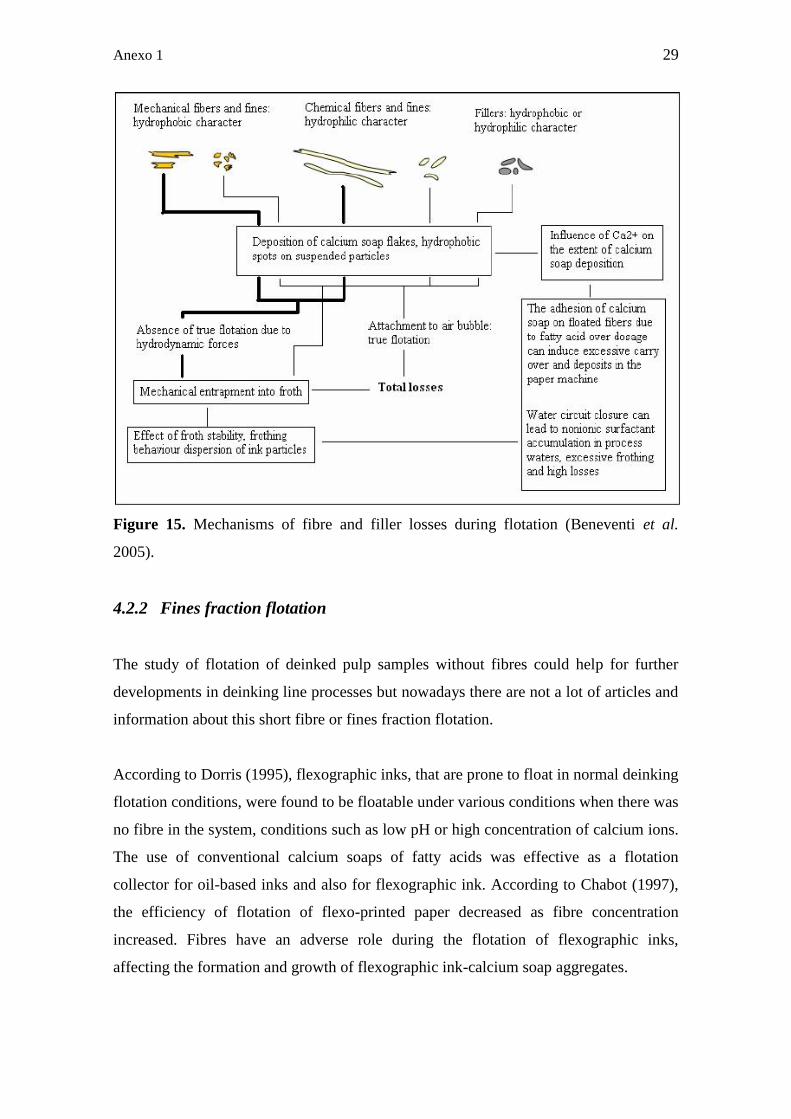
Anexo 1 29
Figure 15. Mechanisms of fibre and filler losses during flotation (Beneventi et al.
2005).
4.2.2 Fines fraction flotation
The study of flotation of deinked pulp samples without fibres could help for further
developments in deinking line processes but nowadays there are not a lot of articles and
information about this short fibre or fines fraction flotation.
According to Dorris (1995), flexographic inks, that are prone to float in normal deinking
flotation conditions, were found to be floatable under various conditions when there was
no fibre in the system, conditions such as low pH or high concentration of calcium ions.
The use of conventional calcium soaps of fatty acids was effective as a flotation
collector for oil-based inks and also for flexographic ink. According to Chabot (1997),
the efficiency of flotation of flexo-printed paper decreased as fibre concentration
increased. Fibres have an adverse role during the flotation of flexographic inks,
affecting the formation and growth of flexographic ink-calcium soap aggregates.

Anexo 1 30
Matzke (1996) proposed a new development in deinking and bleaching through
flotation of washing filtrate. It was shown that flexographic inks can be floated from a
wash filtrate because of its low viscosity and the absence of fibres. By this mean the
yield could be increased while retaining a high brightness level.

Anexo 1 31
5 EXPERIMENTAL
The experimental part of this work was divided in five different scenarios of flotation
experiments. The first scenario was the reference flotation experiments with the whole
pulp sample. The second scenario was performed to determinate the optimum variables
for air flow and flotation level at the fines flotation. And the other three different cases
were performed using several chemicals during the fines fraction flotation. Before a
deeply description of the flotation experiments, an introduction about the materials and
methods used is needed.
5.1 Materials
5.1.1 Raw material
The recovered paper used in the experiments was a mixture of old Finnish newsprint
(ONP) and old magazines (OMG). The feeding ratio for every pulping was 50% ONP
and 50% OMG. The OMG feed consisted half of super calendared paper (SC) and half
of light weight coated paper (LWC). The recovered paper used is considered as a very
old raw material because it is older than three months. All papers used were sorted by
hand in order to get batches of uniform quality for pulping.
5.1.2 Chemicals
Three different commercial chemicals were used during the process: surfactant #1,
surfactant #2 and soap. Surfactant #1 was a non-ionic surfactant, surfactant #2 was a
slightly different non-ionic surfactant and the soap was a mixture of sodium soaps of
fatty acids (i.e. anionic surfactant). Every experiment in which soap has been used, 7.2 g
of CaCl2 was also added to adjust the hardness. The dosing place of these chemicals and
its dosage were different in several flotation experiments.

Anexo 1 32
5.2 Methods
5.2.1 Process description
Pulping
The pulp was produced using a Hobart (H600) pulper with a hook impeller as presented
in Figure 16. Batch size in Hobart pulping was 2500 g. All the newsprints and
magazines were torn into about two centimetre wide strips and mixed with warm tap
water (45 °C) before pulping to adjust the consistency to 15%. Pulping time was 14
minutes while in every pulping experiment the first two minutes were performed at
speed #1, the next two minutes at speed #2 and the last ten minutes at speed #3.
Figure 16. Hobart (H600) pulper.

Anexo 1 33
Fractionation
Fractionation was performed using a PULA pilot that consisted of a mass tank of 300
litres, a pump and a screen basket with a slot width of 0.15 mm. The pulp was diluted in
the feed tank with warm tap water (45 °C) into a consistency of about 0.8%.
Experiments were performed with an accept flow of 0.05 litres per second and a screen
rotor frequency of 50 hertz. At the end, the accept flow (short fibre fraction) of every
fractionation experiment was mixed thoroughly for the short fibre flotation.
Flotation
Flotation was performed using the Voith Delta 25 flotation cell equipped with level box
to maintain constant fluid level by injecting tap water into the cell during flotation as
presented in Figure 17. Fines fraction samples from every fractionation experiment were
used as input in the flotation cell. An electric heater was used to keep the fines fraction
samples at 45 °C.
Figure 17. Voith Delta 25 flotation cell.

Anexo 1 34
5.2.2 Analyses
Consistency and ash
The consistency of pulp samples was determined according to SFS EN ISO 4119
standard. The ash content was done on ignition at 525 ºC according to ISO 1762
standard. Consistency and ash content values were used to calculate mass reject rate and
ash removal with the following equations.
m
where
creject is consistency of the reject [%],
mreject is the mass of reject [g],
cfeed is consistency of the feed sample [%] and
mfeed is the mass of feed sample [g].
sh emoval
where
creject is consistency of the reject [%],
mreject is the mass of reject [g],
cfeed is consistency of the feed sample [%],
mfeed is the mass of feed sample [g].
Ashreject is the ash content of the reject [%] and
Ashfeed is the ash content of the feed [%].
Pads
Pulp pads were prepared to determine the optical properties of the pulp. Cellulose
nitrate membrane filter (from Sartorius, 50 mm of diameter), with a porosity of 0.45 µm
to avoid the loss of ink, were used to prepare the pads. Opaque pads were prepared to
reach a basis grammage of 225 g/m2 (INGEDE Method 11p, 2009).
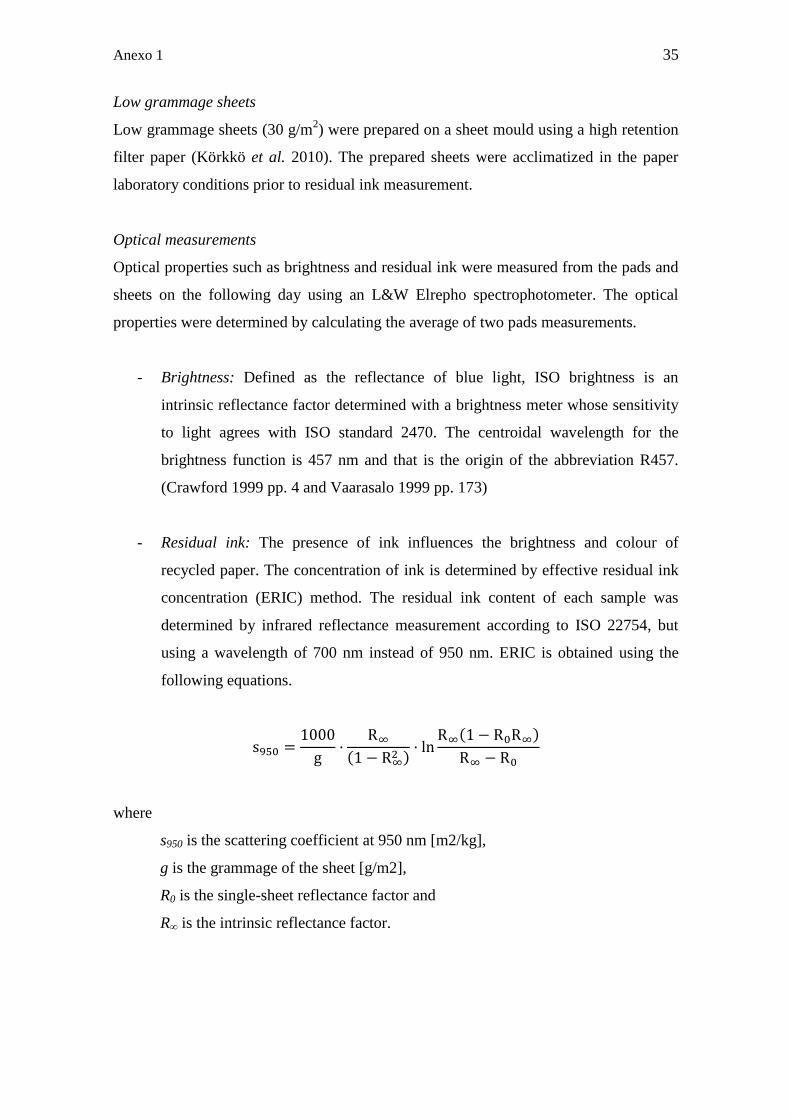
Anexo 1 35
Low grammage sheets
Low grammage sheets (30 g/m2) were prepared on a sheet mould using a high retention
filter paper (Körkkö et al. 2010). The prepared sheets were acclimatized in the paper
laboratory conditions prior to residual ink measurement.
Optical measurements
Optical properties such as brightness and residual ink were measured from the pads and
sheets on the following day using an L&W Elrepho spectrophotometer. The optical
properties were determined by calculating the average of two pads measurements.
- Brightness: Defined as the reflectance of blue light, ISO brightness is an
intrinsic reflectance factor determined with a brightness meter whose sensitivity
to light agrees with ISO standard 2470. The centroidal wavelength for the
brightness function is 457 nm and that is the origin of the abbreviation R457.
(Crawford 1999 pp. 4 and Vaarasalo 1999 pp. 173)
- Residual ink: The presence of ink influences the brightness and colour of
recycled paper. The concentration of ink is determined by effective residual ink
concentration (ERIC) method. The residual ink content of each sample was
determined by infrared reflectance measurement according to ISO 22754, but
using a wavelength of 700 nm instead of 950 nm. ERIC is obtained using the
following equations.
where
s950 is the scattering coefficient at 950 nm [m2/kg],
g is the grammage of the sheet [g/m2],
R0 is the single-sheet reflectance factor and
R∞ is the intrinsic reflectance factor.

Anexo 1 36
where
k950 is the light absorption coefficient at 950 nm [m2/kg].
E I
where
ERIC is the ERIC number [ppm],
ksheet is the light absorption coefficient of paper containing ink [m2/kg] and
kink is the light absorption coefficient of the ink itself i.e. 10000 m2/kg.
Hyper washing (HW)
Hyper washing was made by washing pulp with water flow of 8 L/min for 20 minutes
with Sommerville-type screening device using a 150-mesh wire screen. Retention in
hyperwashing was calculated using the following equation.
etention
where
cHW is consistency of the hyperwashed pulp [%],
mHW is the mass of pulp suspension [g] and
mpulp is the mass of dry pulp before hyperwashing [g].
Once retention was obtained, fines removal was calculated using the following
equation.
Fines emoval etention
etention
where
Retentionreject is the retention of the reject sample [%] and
Retentionfeed is the retention of the feed sample [%].

Anexo 1 37
5.3 General construct of experimental part
In this chapter, flotation experiments are explained in detail. Schematic diagrams of
these flotation experiments are presented in Appendix 1.
5.3.1 Reference flotation
After pulping, the pulp slurry was diluted with warm tap water (about 45 ºC) to a
consistency of 1.2%. Five reference flotation experiments were done using entire pulp
samples. A soap dosage of 6 kg/t was added in the flotation cell, with 7.2g of CaCl2 to
adjust hardness. In these five experiments, the flotation level was 19 litres and the air
flow was 7.4 L/min, but in every flotation the mass reject rate was different. The
variables of these flotation experiments are presented in Table 1.
Table 1. Reference flotation variables.
Test Run Flotation level (L) Air flow (L/min) Chemicals (kg/t)
37 19 7.4 6
38 19 7.4 6
39 19 7.4 6
40 19 7.4 6
41 19 7.4 6
5.3.2 Fractionation
The target of the fractionation was to have 35% long fibres and 65% short fibres. After
pulping without chemicals, the pulp slurry was diluted with warm tap water (about 45
ºC) to a consistency of 1.2%. Samples from a fractionation experiment were taken to
compare the data obtained by the different flows of the PULA fractionation device:
feed, accept (short fibre) and reject (long fibre).
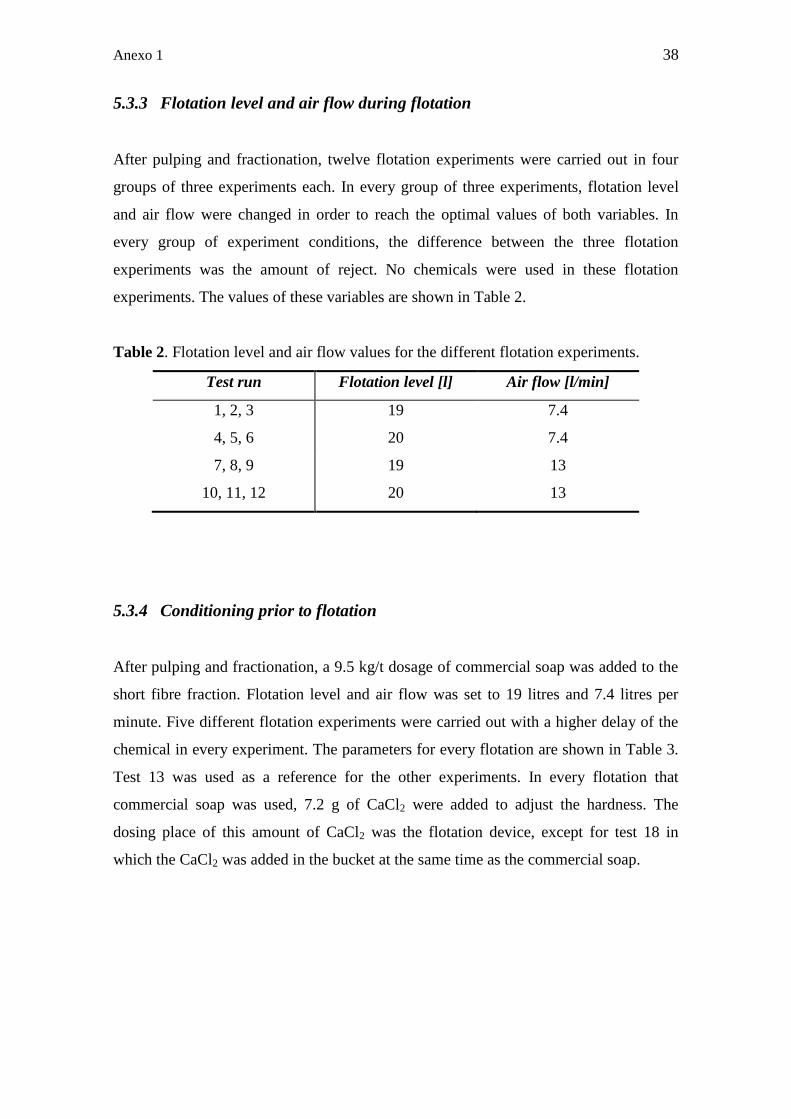
Anexo 1 38
5.3.3 Flotation level and air flow during flotation
After pulping and fractionation, twelve flotation experiments were carried out in four
groups of three experiments each. In every group of three experiments, flotation level
and air flow were changed in order to reach the optimal values of both variables. In
every group of experiment conditions, the difference between the three flotation
experiments was the amount of reject. No chemicals were used in these flotation
experiments. The values of these variables are shown in Table 2.
Table 2. Flotation level and air flow values for the different flotation experiments.
Test run Flotation level [l] Air flow [l/min]
1, 2, 3 19 7.4
4, 5, 6 20 7.4
7, 8, 9 19 13
10, 11, 12 20 13
5.3.4 Conditioning prior to flotation
After pulping and fractionation, a 9.5 kg/t dosage of commercial soap was added to the
short fibre fraction. Flotation level and air flow was set to 19 litres and 7.4 litres per
minute. Five different flotation experiments were carried out with a higher delay of the
chemical in every experiment. The parameters for every flotation are shown in Table 3.
Test 13 was used as a reference for the other experiments. In every flotation that
commercial soap was used, 7.2 g of CaCl2 were added to adjust the hardness. The
dosing place of this amount of CaCl2 was the flotation device, except for test 18 in
which the CaCl2 was added in the bucket at the same time as the commercial soap.

Anexo 1 39
Table 3. Parameters for delay chemical flotation.
Test Run Chemical Delay [min]
13 - -
14 Soap 0
15 Soap 20
16 Soap 40
17 Soap 60
18 Soap + CaCl2 60
5.3.5 Effect of pH in flotation
Four different flotation experiments were carried out controlling the pH. During
pulping, a chemical dosage of 6 kg/t of commercial soap were added into the pulper. In
each of the first two flotation experiments, 1520 g of entire pulp (15% consistency)
were diluted in the flotation device until the flotation level was 19 litres. The pH of the
second flotation experiment was adjusted to 8.5, using 0.2M NaOH to reach it. The
other two flotation experiments were done with the short fibre fractionation obtained
after fractionation. The pH of the second flotation experiment was set at 8.5 using 0.2M
NaOH. In every flotation experiment, three different samples of accept and reject were
taken and 7.2 g of CaCl2 were added into the flotation device at the beginning of every
flotation experiment. The variables of pH flotation experiments are presented in Table
4.
Table 4. Variables of pH flotation experiments.
Test Run Flotation level (L) Air level (L/min) Note
19 19 7.4 Entire pulp
20 19 7.4 Entire pulp – pH 8.5
21 19 7.4 Fines fraction
22 19 7.4 Fines fraction – pH 8.5

Anexo 1 40
5.3.6 Comparison of flotation chemicals
Three different chemicals were used in six flotation experiments. Commercial soap,
surfactant #1 and surfactant #2 were used in three different groups of two flotation
experiments each, in which the dosage was changed. After pulping and fractionation,
the short fibre fraction was used for the flotation experiments. All the chemicals were
added in the flotation cell before starting flotation experiments. For the commercial
soap, dosages of 6 and 9 kg/t were used (adding 7.2g of CaCl2 every time soap was
used). For the surfactants, dosages of 0.6 and 0.9 kg/t were added respectively. The
parameters for the chemicals flotation experiments are shown in Table 5.
Table 5. Parameters for chemicals flotation experiments.
Test run Chemical Dosage [kg/t]
23 Commercial soap 6
24 Commercial soap 9
25 Surfactant #1 0.6
26 Surfactant #1 0.9
27 Surfactant #2 0.6
28 Surfactant #2 0.9
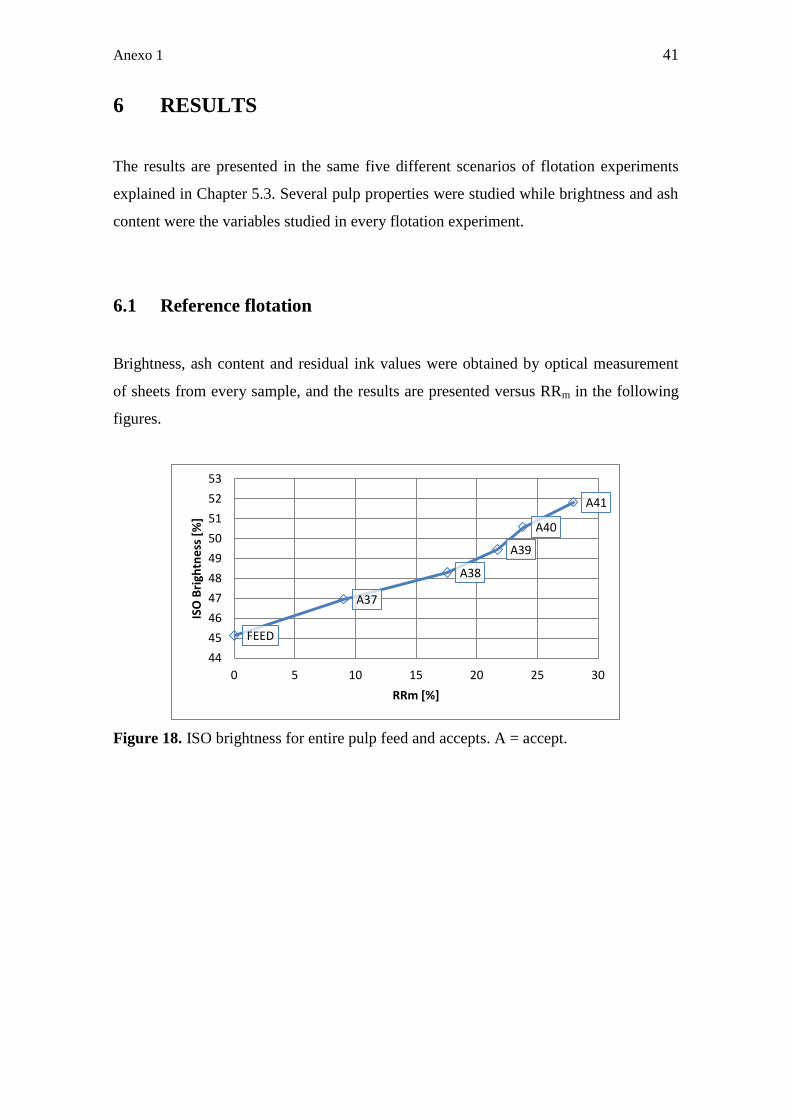
Anexo 1 41
6 RESULTS
The results are presented in the same five different scenarios of flotation experiments
explained in Chapter 5.3. Several pulp properties were studied while brightness and ash
content were the variables studied in every flotation experiment.
6.1 Reference flotation
Brightness, ash content and residual ink values were obtained by optical measurement
of sheets from every sample, and the results are presented versus RRm in the following
figures.
Figure 18. ISO brightness for entire pulp feed and accepts. A = accept.
FEED
A37
A38
A39
A40
A41
44
45
46
47
48
49
50
51
52
53
0 5 10 15 20 25 30
ISO
Bri
ghtn
ess
[%
]
RRm [%]
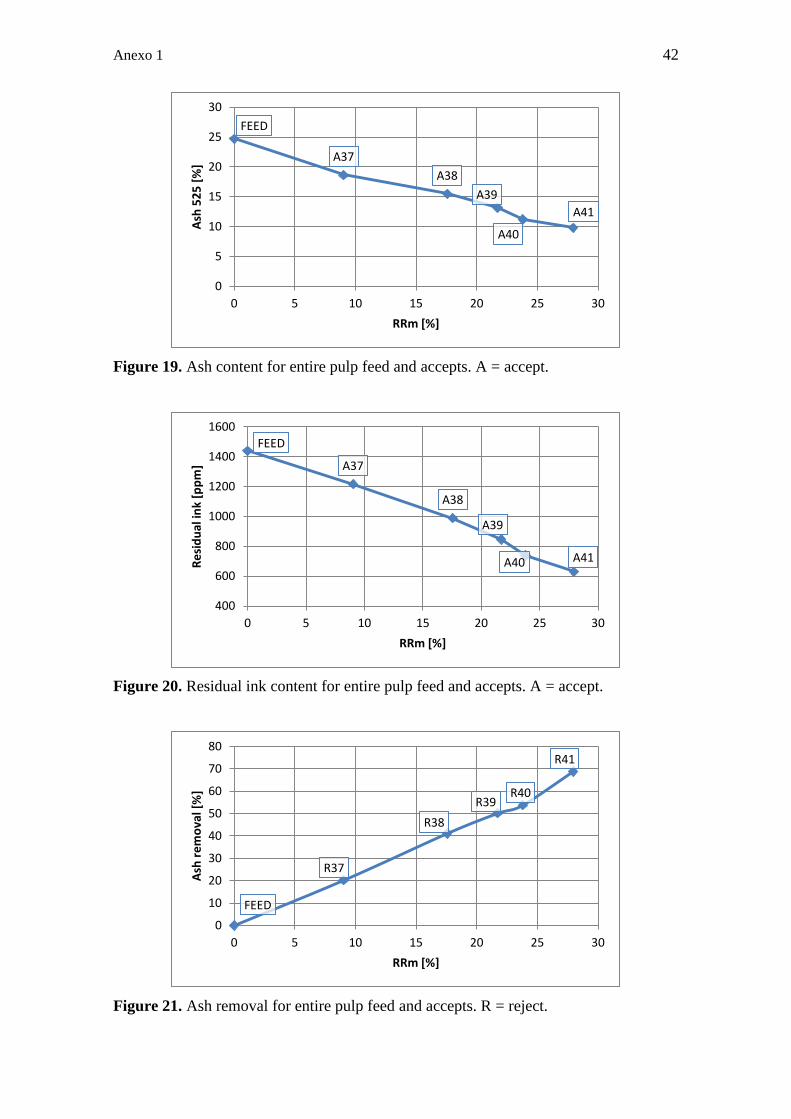
Anexo 1 42
Figure 19. Ash content for entire pulp feed and accepts. A = accept.
Figure 20. Residual ink content for entire pulp feed and accepts. A = accept.
Figure 21. Ash removal for entire pulp feed and accepts. R = reject.
FEED
A37
A38
A39
A40
A41
0
5
10
15
20
25
30
0 5 10 15 20 25 30
Ash
52
5 [
%]
RRm [%]
FEED
A37
A38
A39
A40 A41
400
600
800
1000
1200
1400
1600
0 5 10 15 20 25 30
Re
sid
ual
ink
[pp
m]
RRm [%]
FEED
R37
R38
R39 R40
R41
0
10
20
30
40
50
60
70
80
0 5 10 15 20 25 30
Ash
re
mo
val [
%]
RRm [%]

Anexo 1 43
According to Figures 19 and 20, accept samples with a higher mass reject are the ones
with less content in residual ink and ash. The higher the mass reject is the higher the
brightness, despite losing some fibre because of higher mass reject rates.
6.2 Fractionation
The values from membrane pads of feed, accept (short fibre) and reject (long fibre) are
presented in Table 6. After fractionation, brightness values were similar but the short
fibre fraction had the highest ash content value. Feed and long fibre fraction samples
had similar retention values. ISO brightness of hyperwashed pulps were 44.0% and
47.0% for feed and long fibre fraction, respectively.
Table 6. Brightness, ash content and retention of feed (entire pulp), accept (short fibre
fraction) and reject (long fibre fraction) from fractionation.
Feed Short fibre Long fibre
ISO Brightness [%] 44.3 44.0 42.7
Ash 525 [%] 24.0 32.9 21.9
Retention [%] 61.0 38.6 59.1
HW Brightness [%] 44.0 NA 47.0
6.3 Flotation level and air flow during flotation
Four groups of three flotation experiments in each were carried out in order to obtain
the optimum values for flotation level and air flow during flotation. Optical properties
were measured from pads of every flotation feed, accept and reject sample. Brightness
and ash content values are presented in Figures 22 and 23.

Anexo 1 44
Figure 22. Brightness values for flotation level and air flow flotation experiments.
Figure 23. Ash content values for flotation level and air flow flotation experiments.
According to Figure 22, only 1.0% unit difference in ISO brightness was achieved with
the studied range of air flow and flotation level. In Figure 23, there is a small difference
in ash content between the experiments.
6.4 Conditioning prior to flotation
Three different amounts of reject sample were taken in every flotation experiment in
order to observe the effect of chemical delay on brightness and ash content in feed and
accept samples. In Figures 24 and 25 these variables are represented vs. RRm.
41
42
43
44
45
46
47
48
49
0 5 10 15 20 25 30
ISO
Bri
ghtn
ess
[%
]
RRm [%]
Level 19, Air 7.4
Level 20, Air 7.4
Level 19, Air 13
Level 20, Air 13
24
26
28
30
32
34
36
0 5 10 15 20 25 30
Ash
52
5ºC
[%
]
RRm [%]
Level 19, Air 7.4
Level 20, Air 7.4
Level 19, Air 13
Level 20, Air 13
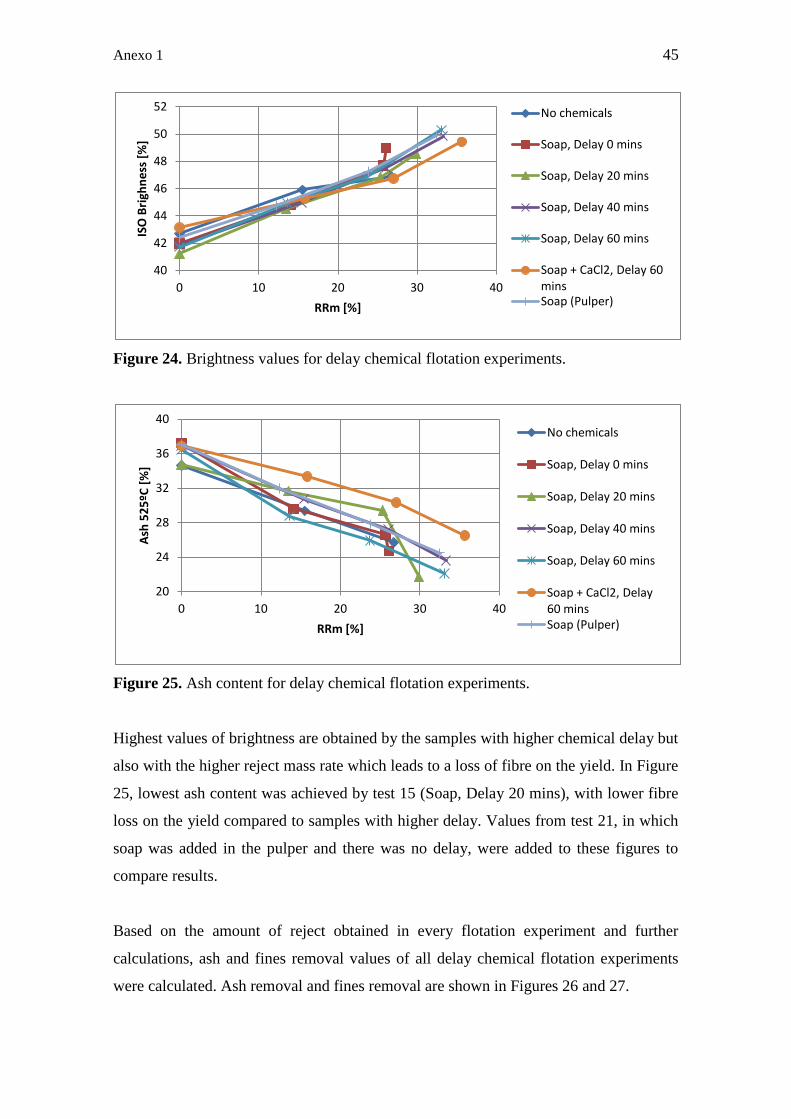
Anexo 1 45
Figure 24. Brightness values for delay chemical flotation experiments.
Figure 25. Ash content for delay chemical flotation experiments.
Highest values of brightness are obtained by the samples with higher chemical delay but
also with the higher reject mass rate which leads to a loss of fibre on the yield. In Figure
25, lowest ash content was achieved by test 15 (Soap, Delay 20 mins), with lower fibre
loss on the yield compared to samples with higher delay. Values from test 21, in which
soap was added in the pulper and there was no delay, were added to these figures to
compare results.
Based on the amount of reject obtained in every flotation experiment and further
calculations, ash and fines removal values of all delay chemical flotation experiments
were calculated. Ash removal and fines removal are shown in Figures 26 and 27.
40
42
44
46
48
50
52
0 10 20 30 40
ISO
Bri
ghn
ess
[%
]
RRm [%]
No chemicals
Soap, Delay 0 mins
Soap, Delay 20 mins
Soap, Delay 40 mins
Soap, Delay 60 mins
Soap + CaCl2, Delay 60 mins Soap (Pulper)
20
24
28
32
36
40
0 10 20 30 40
Ash
52
5ºC
[%
]
RRm [%]
No chemicals
Soap, Delay 0 mins
Soap, Delay 20 mins
Soap, Delay 40 mins
Soap, Delay 60 mins
Soap + CaCl2, Delay 60 mins Soap (Pulper)
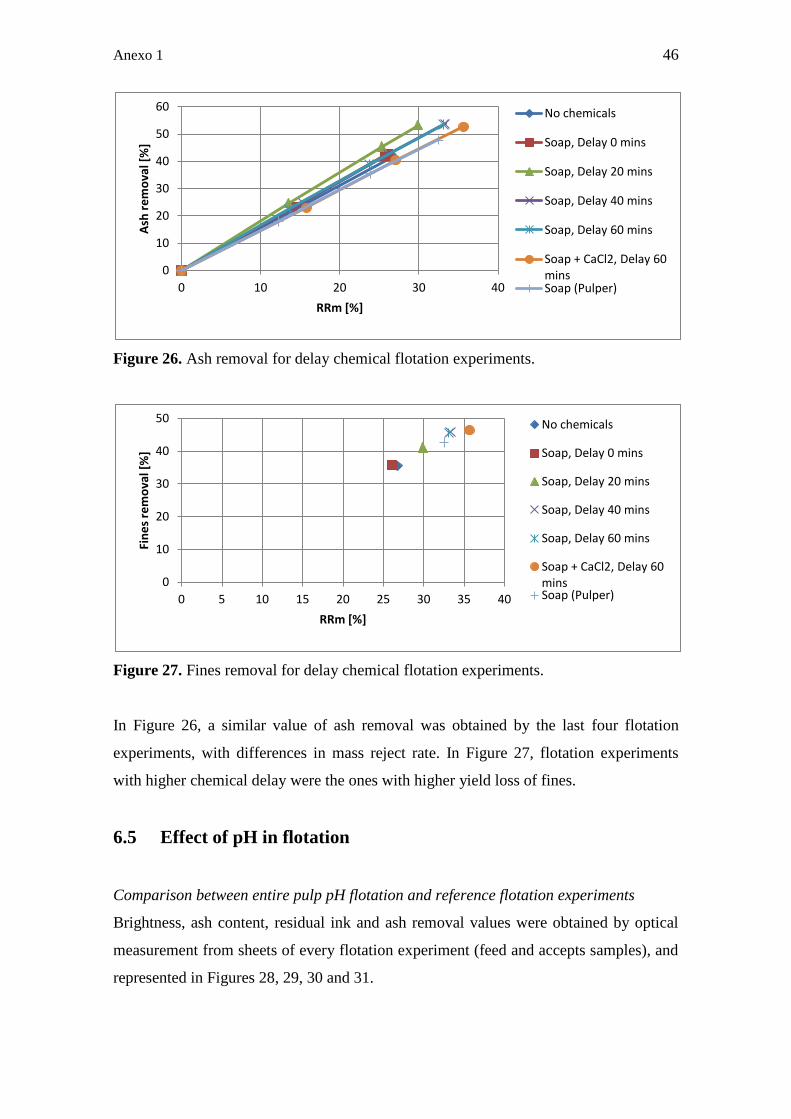
Anexo 1 46
Figure 26. Ash removal for delay chemical flotation experiments.
Figure 27. Fines removal for delay chemical flotation experiments.
In Figure 26, a similar value of ash removal was obtained by the last four flotation
experiments, with differences in mass reject rate. In Figure 27, flotation experiments
with higher chemical delay were the ones with higher yield loss of fines.
6.5 Effect of pH in flotation
Comparison between entire pulp pH flotation and reference flotation experiments
Brightness, ash content, residual ink and ash removal values were obtained by optical
measurement from sheets of every flotation experiment (feed and accepts samples), and
represented in Figures 28, 29, 30 and 31.
0
10
20
30
40
50
60
0 10 20 30 40
Ash
re
mo
val [
%]
RRm [%]
No chemicals
Soap, Delay 0 mins
Soap, Delay 20 mins
Soap, Delay 40 mins
Soap, Delay 60 mins
Soap + CaCl2, Delay 60 mins Soap (Pulper)
0
10
20
30
40
50
0 5 10 15 20 25 30 35 40
Fin
es
rem
ova
l [%
]
RRm [%]
No chemicals
Soap, Delay 0 mins
Soap, Delay 20 mins
Soap, Delay 40 mins
Soap, Delay 60 mins
Soap + CaCl2, Delay 60 mins Soap (Pulper)

Anexo 1 47
Figure 28. Brightness values for entire pulp pH flotation experiments. A = accept.
Figure 29. Ash content for entire pulp pH flotation experiments. A = accept.
Figure 30. Residual ink values of entire pulp pH flotation experiments. A = accept.
A41
44
45
46
47
48
49
50
51
52
53
0 10 20 30 40
ISO
Bri
ghtn
ess
[%
]
RRm [%]
Reference flotations
Entire pulp
Entire pulp, pH 8.5
A41
0
5
10
15
20
25
30
35
0 10 20 30 40
Ash
52
5ºC
[%
]
RRm [%]
Reference flotations
Entire pulp
Entire pulp, pH 8.5
A41 400
600
800
1000
1200
1400
1600
1800
0 10 20 30 40
Re
sid
ual
ink
[pp
m]
RRm [%]
Referenc flotations
Enitre pulp
Enitre pulp, pH 8.5

Anexo 1 48
Figure 31. Ash removal for entire pulp pH flotation experiments. R = reject.
In Figures 28, 29, 30 and 31 there was a small difference between the pH controlled
sample and the non-controlled one. Final values for brightness, ash content and residual
ink content were similar but flotation test 20 (Entire pulp, pH 8.5) had a lower mass
reject rate. Comparing pH flotation experiments with reference flotations, higher
brightness, lower ash content and similar residual ink values were obtained by the
reference flotation experiments but with lower mass reject rate.
Fines fraction flotation experiments
Two fines fraction flotation experiments were carried out, one of them adjusting the pH
of the flotation feed sample to 8.5. Brightness and ash content values were obtained by
optical measurement from pads of every flotation experiment (feed and accepts
samples), and were represented versus RRm in Figures 32 and 33.
Figure 32. Brightness values for fines fraction pH flotation experiments.
R41
0
10
20
30
40
50
60
70
80
0 10 20 30 40
Ash
re
mo
val [
%]
RRm [%]
Reference flotations
Entire pulp
Entire pulp, pH 8.5
42 43 44 45 46 47 48 49 50 51
0 10 20 30 40
ISO
Bri
ghtn
ess
[%
]
RRm [%]
Fines fraction
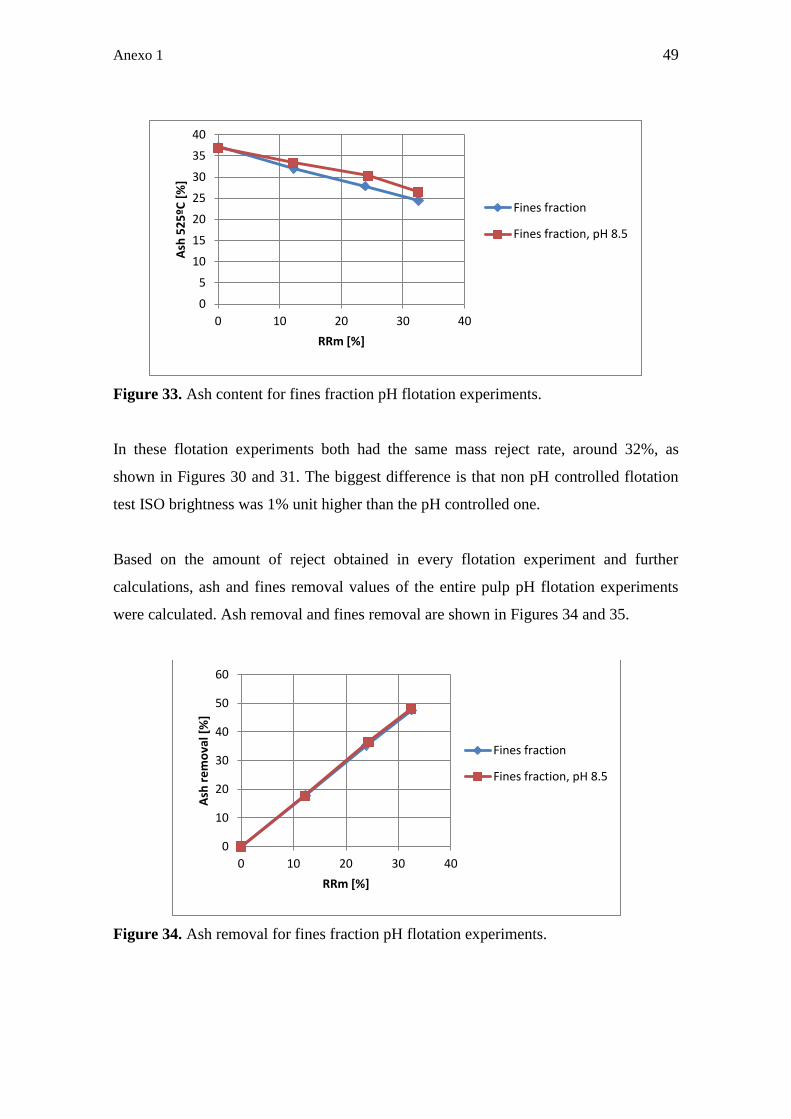
Anexo 1 49
Figure 33. Ash content for fines fraction pH flotation experiments.
In these flotation experiments both had the same mass reject rate, around 32%, as
shown in Figures 30 and 31. The biggest difference is that non pH controlled flotation
test ISO brightness was 1% unit higher than the pH controlled one.
Based on the amount of reject obtained in every flotation experiment and further
calculations, ash and fines removal values of the entire pulp pH flotation experiments
were calculated. Ash removal and fines removal are shown in Figures 34 and 35.
Figure 34. Ash removal for fines fraction pH flotation experiments.
0
5
10
15
20
25
30
35
40
0 10 20 30 40
Ash
52
5ºC
[%
]
RRm [%]
Fines fraction
Fines fraction, pH 8.5
0
10
20
30
40
50
60
0 10 20 30 40
Ash
re
mo
val [
%]
RRm [%]
Fines fraction
Fines fraction, pH 8.5

Anexo 1 50
Figure 35. Fines removal for fines fraction pH flotation experiments.
In Figure 34 ash removal is the same for both flotation experiments. In Figure 35 there
was no difference between the fines fraction pH flotation tests. Adjusting the pH to 8.5
had no effect on fines removal and mass reject rate values.
6.6 Comparison of flotation chemicals
The effect of all chemicals (soap, surfactant #1 and surfactant #2) during flotation was
studied together to compare results from the three chemicals used. Brightness and ash
content values were obtained by optical measurement from pads of every flotation
experiment (feed and accepts samples). These values are shown in Figures 36 and 37.
Figure 36. Brightness values for chemicals flotation experiments.
0
10
20
30
40
50
0 5 10 15 20 25 30 35
Fin
es
rem
ova
l [%
]
RRm [%]
Fines fraction
Fines fraction, pH 8.5
42
43
44
45
46
47
48
49
50
0 5 10 15 20 25
ISO
Bri
ghtn
ess
[%
]
RRm [%]
Soap, 6 kg/t
Soap, 9 kg/t
Surfactant #1, 0.6 kg/t
Surfactant #1, 0.9 kg/t
Surfactant #2, 0.6 kg/t
Surfactant #2, 0.9 kg/t

Anexo 1 51
Figure 37. Ash content values for chemicals flotation experiments.
In Figure 36 higher values of brightness and mass reject rate were obtained by flotation
test 23 (6 kg/t of commercial soap) and by surfactant #2 flotation tests. In Figure 37
lower values of ash content were obtained by surfactant #2 flotation tests. The first ash
content value of Soap, 6 kg/t is wrong in all probability, because the raw material
cannot change that much between experiments.
Based on the amount of reject obtained in every flotation experiment and further
calculations, ash and fines removal values of the different chemicals flotation
experiments were also calculated. Ash removal and fines removal values are represented
versus mass reject rate in Figures 38 and 39.
Figure 38. Ash removal values for chemicals flotation experiments.
15
20
25
30
35
40
45
50
55
0 5 10 15 20 25
Ash
52
5ºC
[%
]
RRm [%]
Soap, 6 kg/t
Soap, 9 kg/t
Surfactant #1, 0.6 kg/t
Surfactant #1, 0.9 kg/t
Surfactant #2, 0.6 kg/t
Surfactant #2, 0.9 kg/t
0
5
10
15
20
25
30
35
40
45
0 5 10 15 20 25
Ash
re
mo
val [
%]
RRm [%]
Soap, 6 kg/t
Soap, 9 kg/t
Surfactant #1, 0.6 kg/t
Surfactant #1, 0.9 kg/t
Surfactant #2, 0.6 kg/t
Surfactant #2, 0.9 kg/t
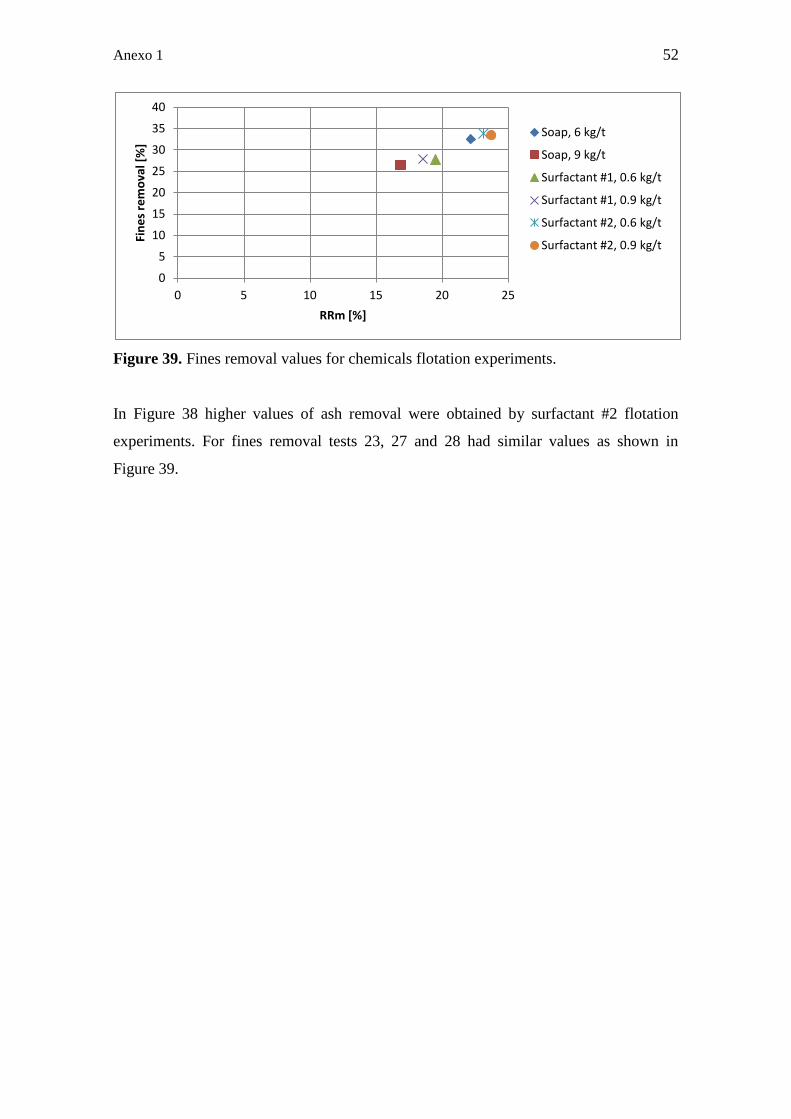
Anexo 1 52
Figure 39. Fines removal values for chemicals flotation experiments.
In Figure 38 higher values of ash removal were obtained by surfactant #2 flotation
experiments. For fines removal tests 23, 27 and 28 had similar values as shown in
Figure 39.
0
5
10
15
20
25
30
35
40
0 5 10 15 20 25
Fin
es
rem
ova
l [%
]
RRm [%]
Soap, 6 kg/t
Soap, 9 kg/t
Surfactant #1, 0.6 kg/t
Surfactant #1, 0.9 kg/t
Surfactant #2, 0.6 kg/t
Surfactant #2, 0.9 kg/t
Anexo 1 53
7 DISCUSSION
7.1 Reference flotation
Before starting the discussion part, it should be reminded that the raw material used in
these flotation experiments was quite old. The storage period of the recovered paper can
influence their deinkability (poor ink detachment, high speck content, high ink
fragmentation and poor ink removal). Because of the use of old newspapers and old
magazines, brightness values of all the samples were lower than experiments done with
fresh raw material. According to Vahlroos (2008), ISO brightness values around 60%
can be reached with fresh raw material, instead of values around 50% that were
obtained with old newspapers and magazines.
Since flotation removes inks and fillers, the brightness gain induced by the removal of
the inks might be overshadowed by the removal of fillers if the brightness of the fillers
is higher than the brightness fibres, such as with ONP/OMG mixtures. During entire
pulp flotation experiments, brightness values increased while the more amount of reject
were removed from the sample. According to Figure 18, the increase in ISO brightness
between feed sample and the final accept was 6.7% unit. Ash content and residual ink
values decreased while the amount of reject mass increased in every flotation test. Ash
removal values obtained in reference flotation were quite high (around 70%) compared
to ash removal shown in Körkkö (2008).
7.2 Fractionation
During fractionation, the feed sample was separated into two fractions, short and long
fibre fraction. According to Table 6, brightness values were similar for feed and fines
fraction, but long fibre fraction had a little lower value. However, brightness of
hyperwashed long fibre fraction was the highest which suggest that there was a lot of
free ink in the sample. Short fibre fraction had the highest ash content value after
fractionation. Ash content in the long fibre fraction was higher compared to ash content
values obtained by Mäkinen (2010), but also ash content of the feed sample was higher.
Anexo 1 54
Comparing ISO brightness values from entire pulp flotation experiments and
fractionation samples, a higher increase was observed through flotation. A difference of
7.1% units was shown between accept 41 and short fibre fraction sample according to
Table 6. Thanks to flotation, samples lose a higher amount of ash and ink particles,
increasing the final brightness values. Fractionation was not perfect but enough amount
of fines fraction was achieved for the flotation experiments.
7.3 Flotation level and air flow during flotation
Flotation cell level and air flow did not have so much effect, although the increase in
flotation cell level and air flow might increase the speed of flotation. All the ISO
brightness values are in a margin of 1% unit according to Figure 22. A maximum value
of 48% ISO brightness was obtained by flotation without chemicals, lower than the ISO
brightness value of 52% obtained by the reference flotation experiments. Flotation level
of 19 litres and air flow of 7.4 litres per minute were set for the rest of flotation
experiments.
7.4 Conditioning prior to flotation
The delay of chemical during flotation affected the mass reject rate the most. The higher
the delay was the higher amount of fibre, fillers and ash were lost with the reject
sample. Compared with entire pulp reference flotation experiments, ISO brightness
values were slightly lower (2% units less). The use of chemicals improved the
brightness values: delay chemical flotation results were better than results of flotation
level and air flow flotation experiments. So longer delay increases brightness, but also
RRm which lowers the yield. According to Figure 24, higher values of brightness were
obtained by tests 16 and 17 (Soap, Delay 40 mins and 60 mins), with values similar to
the ones from entire pulp flotation (around 50 %).
Anexo 1 55
Adding CaCl2 at the beginning of the delay time increased the mass reject rate by
making fillers, ash and fines more hydrophobic as shown in Figures 24, 25, 26 and 27.
Comparing these values with the ones obtained by test 21, in which the soap dosage was
added into the pulper, there was no effect on where the chemical was added. Adding
CaCl2 at the beginning of the delay had a negative effect on flotation, because the yield
loss was higher.
7.5 Effect of pH in flotation
Entire pulp flotation experiments
According to Figure 28, ISO brightness values around 51% were obtained by pH
flotation experiments, fairly similar values compared to reference flotations (only 1%
unit difference). Adding chemicals in the pulper made ink particles more floatable.
Residual ink values had a drastic decrease from 1630 to 625 ppm in the pH controlled
flotation experiment, according to Figure 30.
Fines fraction flotation experiments
Adjust of the pH to 8.5 did not have so much effect in fines fraction flotation. Ash
content, ash removal and fines removal of both experiments had very similar values as
shown in Figures 33, 34 and 35. According to Figure 32 the highest value of brightness
is obtained by flotation test 21, 1% unit higher than the pH controlled test 22. When
adding chemicals to pulping, a better separation between ink and fibres was achieved:
an increase of 2% units in ISO brightness can be seen compared to flotation level and
air flow flotation experiments carried out without chemicals.
Surprisingly, adjusting the pH to 8.5 did not have an effect in the properties measured.
There is a widespread belief that the higher the pH is, the better results are achieved.
According to INGEDE method 11, at the end of pulping pH value has to be 9.5 and
adjust using sodium hydroxide has to be done if the pH after pulping is too low.
However, this flotation experiments can be carried out in neutral pH conditions.

Anexo 1 56
7.6 Comparison of flotation chemicals
Commercial soaps of fatty acids are used as flotation collectors for ink removal in
ONP/OMG blend for newsprint production (Dorris et al. 2011). The highest value of
brightness was obtained with lower soap dosage (6 kg/t). Lower dosage of commercial
soap led to a better agglomeration of ink and soap and made the ink-soap aggregates
more hydrophobic.
There was not a big difference between flotation experiments using either surfactant #1
or surfactant #2. The main advantage of using non-ionic surfactants in ONP/OMG
blends is that small quantities are needed, reducing the chemical dosage (Dorris et al.
2011). The speed of flotation was higher when surfactants were used because the froth
was quickly formed and removed from the top of the sample.
Comparing all the chemicals flotation experiments, highest brightness value was
obtained by the lower soap dosage (6 kg/t) flotation test according to Figure 36 (same
brightness with lower RRm). There were no big differences between higher or lower
dosage of surfactants, so the best dosage was 0.6 kg/t which lead to cost savings.
According to Dorris (2011), if too much surfactant is added, the adhesion of ink particle
to air bubble will be too weak to permit flotation. It was supposed that the surfactants
would have worked better than soap during flotation, however soap worked very well.
For that reason lower soap dosage is recommended because higher value of ISO
brightness was obtained compared to surfactants flotation tests.
After comparing all the different fines fraction flotation experiments carried out, the use
of lower soap dosage (6 kg/t) in the flotation cell is recommended to improve pulp
properties. Comparing this flotation with flotation level and air flow flotation (Figure
22) and with fines fraction pH flotation (Figure 32), a ISO brightness value of 48.9% is
obtained with the lowest mass reject rate of all, losing less amount of fibres and fillers
with the reject, and with no need of adjusting the pH.
Anexo 1 57
8 CONCLUSIONS AND RECOMMENDATIONS
The use of old raw materials worsens the deinkability of the pulp and therefore pulp
properties such as brightness values are lower than values obtained using fresh raw
material. Through entire pulp flotation, however, the brightness value increased
moderately while the more amount of reject was removed from the sample. Thus,
flotation experiments worked very well despite of the old raw material.
Fractionation performed here was found to be adequate for these experiments.
Brightness value of long fibre fraction was a little low because of the presence of free
ink in the sample. However, short fibre fraction had the highest content of ash after
fractionation, which indicates that the pulp was fractionated.
Fines fraction flotation results suggest that changing flotation cell level and air flow do
not have so much effect on pulp properties after flotation. On the other hand, increasing
the delay of chemicals prior to flotation has an effect on fines fraction properties.
Longer delay increases brightness but also mass reject rate which lowers the yield.
The use of chemicals to adjust pH prior to flotation do not have an effect in pulp
properties, so apparently this flotation experiments can be carried out in neutral pH
conditions.
Based on these results, the use of a soap dosage of 6 kg/t in the flotation cell is
recommended. Lower dosage of soap leads to a better agglomeration of ink and soap
and made the ink-soap aggregates more hydrophobic. Highest value of brightness is
reached with lower mass reject rate, compared to other flotation collectors such as
surfactants.

Anexo 1 58
9 SUMMARY
The target of this work was to obtain more information about the less studied fines
fraction flotation and to optimize its variables. The work was divided in five different
flotation scenarios in which a mixture of recovered paper was used as feed. The feeding
ratio was 50% ONP and 50% OMG (OMG consisted in half SC and half LWC).
9.1 Reference flotation
Five entire pulp flotation experiments were carried out in the flotation device. The
consistency of the feed was 1.2%, after diluting the pulp slurry from pulping with warm
tap water. The flotation level and the air flow were set to 19 litres and 7.4 litres per
minute, respectively. Residual ink and ash content decreased through flotation while
ISO brightness increased from 45.1% to 51.8%.
9.2 Fractionation
Fractionation was performed with pressure screening in order to obtain 35% of long
fibres and 65% of short fibres. Because high accept consistency was wanted due to the
short fibre flotation right after fractionation, the feed consistency of the fractionation
was around 0.8%. Three samples from a fractionation were taken: feed, short fibre
fraction and long fibre fraction. Through fractionation, high free ink content was
achieved in the long fibre fraction and high ash content in the short fibre fraction.
9.3 Flotation level and air flow during flotation
Flotation level and air flow values were changed in different fines fraction flotation
experiments to obtain the optimum values. These changes did not have so much effect
on pulp properties and therefore flotation level and air flow were set to 19 litres and 7.4
litres per minute for the rest of flotation experiments. Results showed that ISO
brightness of the fines fraction increased to values around 48% through flotation.

Anexo 1 59
9.4 Conditioning prior to flotation
Soap was added in this fines fraction flotation experiments to determine the effect of
different delay time of chemicals in the pulp properties. The use of chemicals improved
the brightness values: delay chemical flotation results were better than results of
flotation level and air flow flotation experiments. Longer delay increases brightness, but
also RRm which lowers the yield.
9.5 Effect of pH in flotation
pH of different flotation experiments were adjust to 8.5 to compare the difference
between the controlled and the non controlled pH test. Controlling the pH was not an
important factor for pulp properties. The results suggest that these flotation experiments
can be carried out in neutral pH conditions.
9.6 Comparison of flotation chemicals
Three different chemicals were used during fines fraction flotation experiments in order
to look for the best one and optimise its dosage based on pulp properties. Results
suggest that lower soap dosage (6 kg/t) improve pulp properties, because highest ISO
brightness value (48.9%) was obtained with the lowest mass reject rate of all, losing less
amount of fibres and fillers with the reject, and with no need of adjusting the pH.
Anexo 1 60
10 REFERENCES
Ackermann C (2000) Bleaching of deinked pulp. In: Göttsching L & Pakarinen H (eds.)
Papermaking Science and Technology, Book 7, Recycled Fibre and Deinking. Helsinki.
1st edition, Finland, Fapet Oy, pp. 306-356. ISBN 952-5216-07-1.
Beneventi D, Carré B & Gandini A (2005) Physico-chemical aspects of deinking. 7th
CTP/PTS Advanced Training Course on Deinking. Grenoble, France, May 31st/June 1-
2nd.
Carré B & Galland G (2007) Overview of deinking technology. 8th CTP/PTS Deinking
Training Course. Grenoble, France, May 29-30-31st.
Chabot B, Daneault C, Sain MM & Dorris GM (1997) The adverse role of fibres during
the flotation of flexographic inks. Pulp & Paper Canada, 98, (12), pp. T451-T456,
ISSN: 0316-4004.
Crawford TB (1999) Optical Properties. In: Doshi MR & Dyer JM (eds.) Paper
Recycling Challenge. Volume IV. Process Control & Mensuration. Appleton, WI,
Doshi and Associates Inc, pp. 1-10. ISBN: 0-9657447-4-4.
Dorris G, Ben Y & Ricard M (2011) Overview of Flotation Deinking. Progress in Paper
Recycling, 20, (1), 41. ISSN: 1061-1452.
Dorris GM & Nguyen N (1995) Flotation of Model Inks. Part II: Flexo Ink Dispersions
Without Fibres. Journal of Pulp and Paper Science, 21, (2), pp. J55-J62. ISSN: 0826-
6220.
Doshi MR (1997) Overview – Deinking & Bleaching. IN: Doshi MR & Dyer JM (eds.)
Paper recycling challenge. Volume II. Deinking & bleaching. Appleton, WI, Doshi and
Associates Inc, pp. 3-5. ISBN: 0-9657447-1-X.

Anexo 1 61
Eul W, Meier J, Arnold G, Berger M & Suess HU (1990) Fractionation prior to flotation
– A new approach for deinking technology. Proceeding of the TAPPI Pulping
conference. Atlanta, GA, TAPPI Press, pp. 757-765. ISBN: 0-89852-742-2.
Eul W, Süss HU & Helmling O (1989) Fibre fractionation and post-treatment of de-
inked pulp. Pulp & Paper Canada, 90, (10), pp. T391-397. ISSN: 0316-4004.
Floccia L & Boillot C (1996) Fibre separation and bleaching. Paper technology, 37, (3),
pp. 45-48. ISSN: 0958-6024.
Holik H (2000) Unit operations and equipment in recycled fiber prosessing. In:
Göttsching L & Pakarinen H (eds.) Papermaking Science and Technology, Book 7,
Recycled Fiber and Deinking. 1st edition, Helsinki, Finland, Fapet Oy, pp. 90-209.
ISBN: 952-5216-07-1.
INGEDE Method 11 (2009) International Association of the Deinking Industry. Method
11p: Assessment of Print Product Recyclability – Deinkability Test. [pdf-file]. 12/2009.
Available at:
http://www.ingede.de/ingindxe/methods/ingede-method-11p-2009.pdf
Julien Saint Amand F (1999) Hydrodynamics of Deinking Flotation. International
Journal of Mineral Processing, 56, (1-4), pp. 277-316. ISSN: 0301-7516.
Julien Saint Amand F (2005) Ink Removal by Flotation and Washing: Hydrodynamic
and Technological Aspects. Part 1: Flotation. 7th CTP/PTS Advanced Training Course
on Deinking. Grenoble, France, May 31st/June 1-2nd.
Kemper M (1999) State-of-the-art and new technologies in flotation deinking.
International Journal of Mineral Processing, 56, (1-4), pp. 317-333. ISSN: 0301-7516.
Kemppainen K, Körkkö M, Haapala A, Illikainen M & Niinimäki J (2010) Benefits of
fractionation during pulping in deinking. Proceedings of the TAPPI PEERS conference
and 9th Research Forum on Recycling, Atlanta, GA, TAPPI Press, Conf. CD. ISBN:
978-161782196-7.

Anexo 1 62
Kraschowetz H, Hertl E and Aregger HJ (2008) Fractionation in DIP-Lines – A further
step in waste paper recycling. Proceedings form 62nd APPITA Annual Conference,
Carlton, Australia, Appita, pp. 177-183. ISBN: 978-0-95757469-4-4.
Körkkö M, Bussini D, Laitinen O, Elegir G & Niinimäki J (2010) True-neutral
fractional deinking for flexographic and offset newsprints. Proceedings from the 65th
Appita Annual Conference, Appita, Carlton: pp. 23-30. ISBN: 978-0-9757469-9-5.
Körkkö M, Haapala A, Mäkinen L, Ämmälä A, & Niinimäki J (2010) A Novel Sheet
Preparation Method for Ink Content Measurement in Paper Recycling. Proceedings of
the TAPPI PEERS conference and 9th Research Forum on Recycling, Atlanta, GA,
TAPPI Press, Conf. CD. ISBN: 978-161782196-7.
Körkkö M, Laitinen O, Vahlroos S, Ämmälä A & Niinimäki J (2008) Components
Removal in Flotation Deinking. Progress in Paper Recycling, 17, (4), pp. 15-22. ISSN:
1061-1452.
Lapierre L, Pitre D & Bouchard J (2001) Bleaching of deinked recycle pulp: benefits of
fibre fractionation. Pulp and paper Canada, 102, (2), pp. T43-T46. ISSN: 0316-4004.
Lapierre L, Pitre D & Bouchar J (2003) Fines from deinked pulp: Effect of
contaminants on their bleachability and on the pulp final brightness. Pulp and paper
Canada, 104, (8), pp. T208-T211. ISSN: 0316-4004.
Lassus A (2000) Deinking chemistry. In: Göttsching L & Pakarinen H (eds.)
Papermaking Science and Technology, Book 7, Recycled Fiber and Deinking. 1st
edition, Helsinki, Finland, Fapet Oy, pp. 240-265. ISBN: 952-5216-07-1.
Mäkinen L, Ämmäla A, Vahlroos-Pirneskoski S, Körkkö M, Sarja T and Niinimäki J
(2010) Fractionation prior to deinking – a study of optical properties of fractions. Ipw
no. 4-5, pp. 14-20. ISSN: 1615-1720.

Anexo 1 63
Matzke WH, Selder HH (1996) New Development in Deinking and Bleaching of
Secondary Fibers. Journal of Korea Tappi, 28, (1), pp. 73-79. ISSN: 0253-3200.
McKinney R (1998) Flotation Deinking Overview. In: Doshi MR & Dyer JM (eds.)
Paper Recycling Challenge. Volume III. Process Technology. Appleton, WI, Doshi and
Associates Inc, pp. 99-114. ISBN: 0-9657447-3-6.
Meltzer FP (1999) Fractionation. In: Doshi MR & Dyer JM (eds.) Paper Recycling
Challenge. Volume IV. Process Control & Mensuration. Appleton, WI, Doshi and
Associates Inc, pp. 153-162. ISBN: 0-9657447-4-4.
Milanova E & Dorris GM (1993) Flotation of Model Inks. Part I: Experimental
Methods. Journal of Pulp and Paper Science, 19, (5), pp. J194-J202. ISSN: 0826-6220.
Schmidt DC & Berg JC (1996) The effect of particle shape on the flotation of toner
particles. Progress in Paper Recycling, 5, (2), pp. 67-77. ISSN: 1061-1452.
Schwarz M (2000) Design of recycled fibre processes for different paper and board
grades. In: Göttsching L & Pakarinen H (eds.) Papermaking Science and Technology,
Book 7, Recycled Fiber and Deinking. 1st edition, Helsinki, Finland, Fapet Oy, pp. 211-
239. ISBN: 952-5216-07-1.
Somasundaran P & Zhang L (1998) Fundamentals of Flotation Deinking. In: Doshi MR
& Dyer JM (eds.) Paper Recycling Challenge. Volume III. Process Technology.
Appleton, WI, Doshi and Associates Inc, pp. 83-98. ISBN: 0-9657447-3-6.
Vaarasalo J (1999) Optical properties of paper. In: Levlin JE & Söderhjeln L (eds.)
Papermaking Science and Technology, Book 17, Pulp and Paper Testing. 1st edition,
Helsinki, Finland, Fapet Oy, pp 162-181. ISBN: 952-5216-17-9.
Vahlroos-Pirneskoski S, Körkkö M, Rosencrance S and Niinimäki J (2008) Post-
bleaching Response of Pulps Deinked using an Alkaline Fatty Acid Soap or Reduce
Alkaline Surfactant Blend Chemistry. Progress in Paper Recycling, 17, (3). ISSN: 1061-
1452.

Anexo 1 64
Block diagram of the flotation experiments APPENDIX 1 (1/3)
Reference flotation
- Flotation tests 37-41
Pulping Flotation
Reject
AcceptEntire pulp
- Fractionation samples
Pulping Fractionation
LF
SFF
Flotation level and air flow during flotation
- Flotation tests 1-12
Pulping Fractionation
LF
SFFFlotation
Reject
Accept

Anexo 1 65
Block diagram of the flotation experiments APPENDIX 1 (2/3)
Delay chemical flotation
- Flotation tests 13-18
Pulping Fractionation
LF
SF FFlotation
Reject
AcceptBucket
Chemicals
pH flotation
- Flotation tests 19-20
Pulping Flotation
Reject
Accept
Chemicals
Entire pulp
- Flotation tests 21-22
Pulping Fractionation
LF
SFFlotation
Reject
Accept
Chemicals

Anexo 1 66
Block diagram of the flotation experiments APPENDIX 1 (3/3)
Chemicals flotation
- Flotation tests 23-28
Pulping Fractionation
LF
SFFlotation
Reject
Accept
Chemicals