el potencial de curación con cetuximab y el tratamiento en ...€¢ panendoscopia oral...
TRANSCRIPT
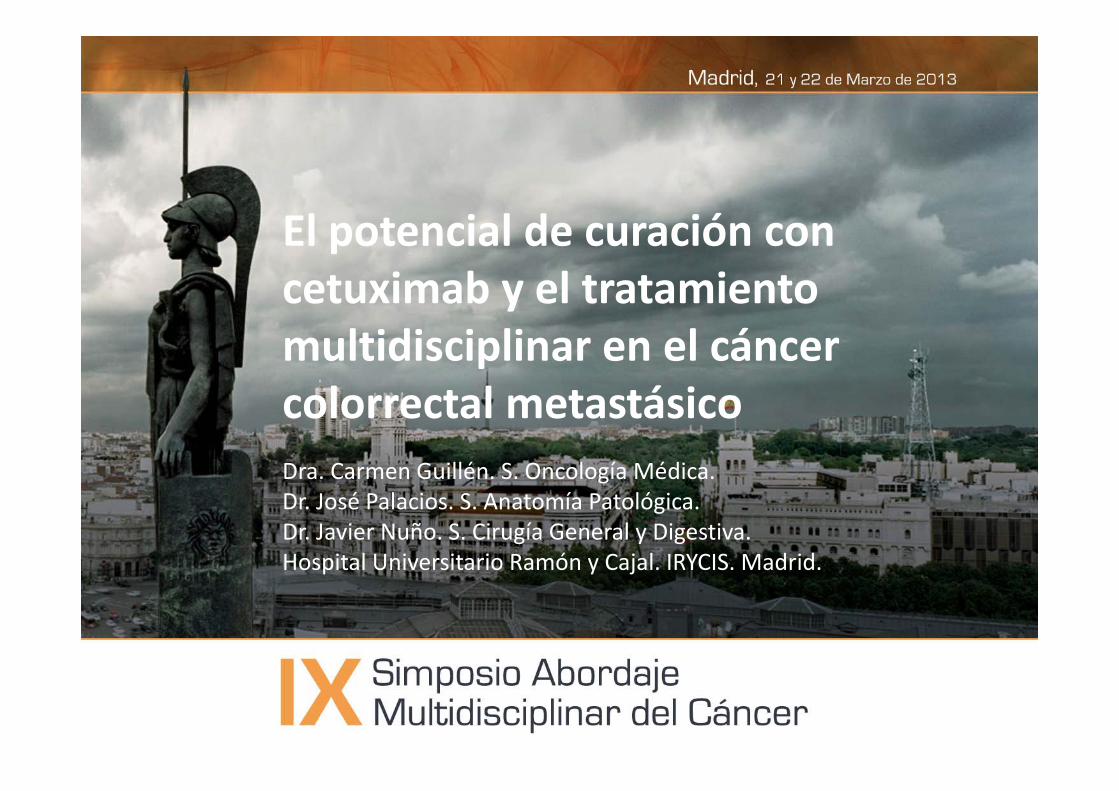
El potencial de curación con cetuximab y el tratamiento multidisciplinar en el cáncer colorrectal metastásicoDra. Carmen Guillén. S. Oncología Médica.Dr. José Palacios. S. Anatomía Patológica.Dr. Javier Nuño. S. Cirugía General y Digestiva.Hospital Universitario Ramón y Cajal. IRYCIS. Madrid.
CASO CLÍNICO
Mujer de 62 años.ANTECEDENTES PERSONALES:• Reacción alérgica a una inyección de vitamina B.• No HTA. No DM. No dislipemia.• No hábitos tóxicos.• Amigdalectomizada.• Tratamiento habitual: omeprazol 20 mg/día y paracetamol 650 mg/día, en las
últimas semanas.ANTECEDENTES FAMILIARES:• Madre con cáncer de colon y cáncer de ovario.• Tío materno con cáncer gástrico.• Tío materno con cáncer de páncreas.
HISTORIA ONCOLÓGICA (I)
• NOVIEMBRE 2010:• Dolor abdominal irradiado hacia la región lumbosacra, de moderada
intensidad, intermitente, de frecuencia creciente.• Sensación de plenitud y náuseas postpandriales.• Cambios en el ritmo intestinal con algunos episodios diarreicos, sin productos
patológicos.• Astenia progresiva (Grado 2).• No hiporexia ni pérdida de peso cuantificada.
• ENERO 2011:• Consultó a su médico de Atención Primaria.
• CEA elevado.• Derivada a consultas externas de Aparato Digestivo de zona.
HISTORIA ONCOLÓGICA (II)• MARZO 2011:
• Ecografía abdominal (29/03/2011):• Hígado aumentado de tamaño, de contornos irregulares, con alteracionesen su ecoestructura, con patrón no homogéneo por múltiples lesionesnodulares sólidas, sugestivas de metástasis, algunas dominantes en lóbulohepático izquierdo (LHI) de 39 mm, y lóbulo derecho (LHD) de 77 x 82mm. Vena porta y suprahepáticas normales.
• Lesión quística cortical en el riñón derecho de 14 mm.• Resto de la exploración normal.
• Se remitió al Servicio de Urgencias para estudio.• Valorada por el S. Oncología Médica (30/03/2011):
• Exploración Física: ECOG 1. Hepatomegalia 2‐3 traveses. Ruidoshidroaéreos normales. Sin otros hallazgos destacables.
• Análisis sanguíneos (31/03/2011): glucosa 133, calcio 10,6, GPT 50, GOT37, bilirrubina total 0,47. Hemograma y hemostasia: normales. CEA: 415ng/ml.
• Se decidió continuar el estudio de manera ambulatoria.
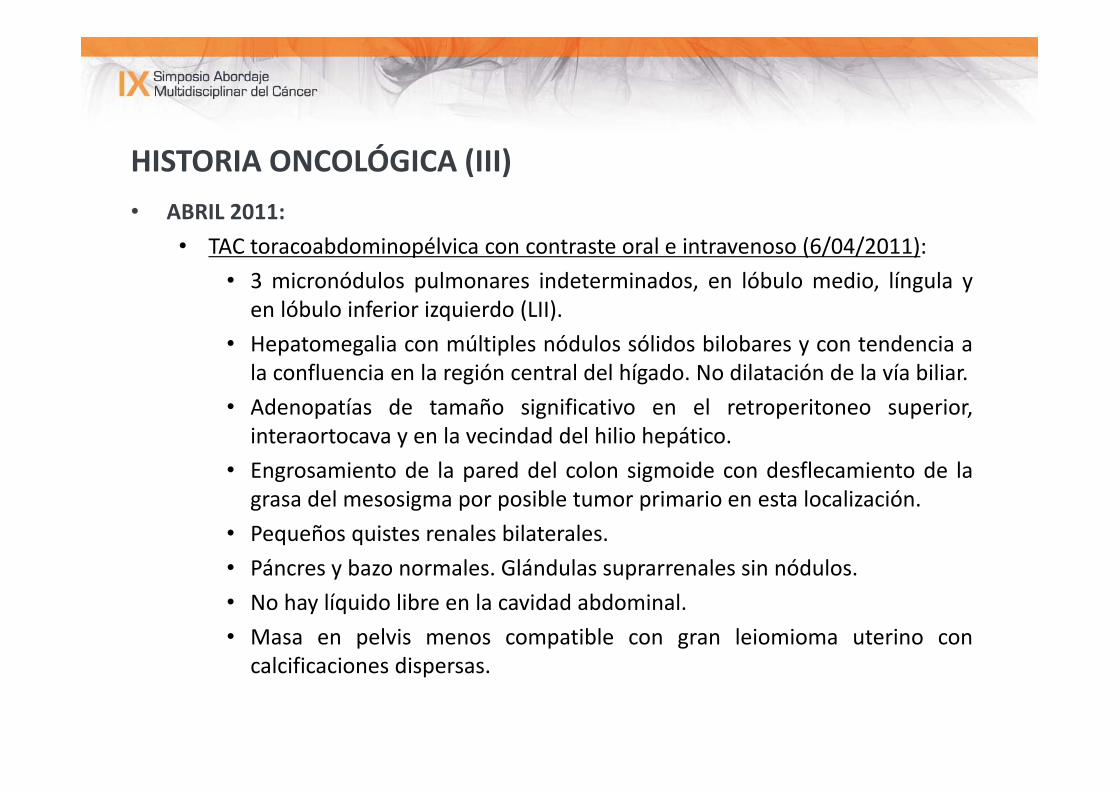
HISTORIA ONCOLÓGICA (III)• ABRIL 2011:
• TAC toracoabdominopélvica con contraste oral e intravenoso (6/04/2011):• 3 micronódulos pulmonares indeterminados, en lóbulo medio, língula yen lóbulo inferior izquierdo (LII).
• Hepatomegalia con múltiples nódulos sólidos bilobares y con tendencia ala confluencia en la región central del hígado. No dilatación de la vía biliar.
• Adenopatías de tamaño significativo en el retroperitoneo superior,interaortocava y en la vecindad del hilio hepático.
• Engrosamiento de la pared del colon sigmoide con desflecamiento de lagrasa del mesosigma por posible tumor primario en esta localización.
• Pequeños quistes renales bilaterales.• Páncres y bazo normales. Glándulas suprarrenales sin nódulos.• No hay líquido libre en la cavidad abdominal.• Masa en pelvis menos compatible con gran leiomioma uterino concalcificaciones dispersas.
HISTORIA ONCOLÓGICA (V)
• ABRIL 2011:• PAAF hepática con bloque celular (6/04/2011):
HISTORIA ONCOLÓGICA (IV)
• ABRIL 2011:• Panendoscopia oral (11/04/2011):
Exploración sin hallazgos
• Colonoscopia (11/04/2011):A 15‐20 cm del margen anal se evidencia una lesión proliferativa mamelonaday no ulcerada, que estenosa parcialmente la luz.
PREGUNTA 1:
• ¿Qué tratamiento propondría a esta paciente?
1. Quimioterapia paliativa.
2. Cirugía del tumor primario + Quimioterapia paliativa.
3. Quimioterapia de conversión + Valoración quirúrgicaposterior del primario y metástasis.
4. Cirugía del tumor primario y de las metástasis ±Quimioterapia “adyuvante” posterior.
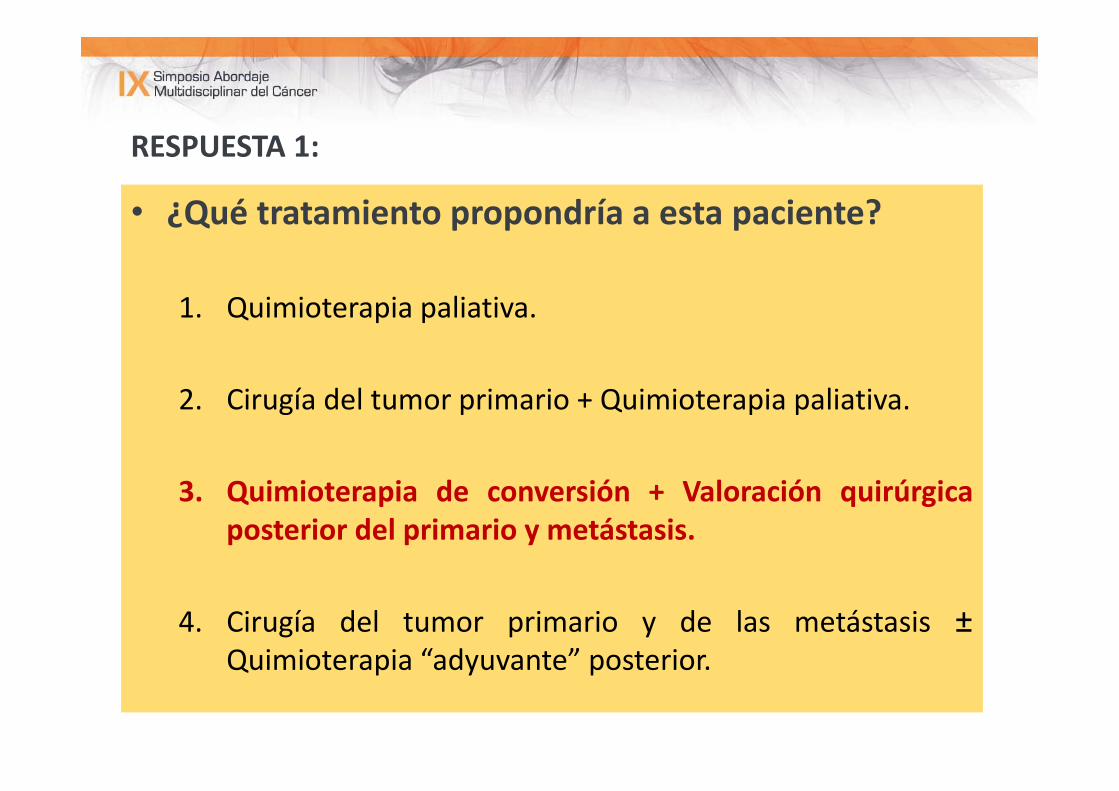
RESPUESTA 1:
• ¿Qué tratamiento propondría a esta paciente?
1. Quimioterapia paliativa.
2. Cirugía del tumor primario + Quimioterapia paliativa.
3. Quimioterapia de conversión + Valoración quirúrgicaposterior del primario y metástasis.
4. Cirugía del tumor primario y de las metástasis ±Quimioterapia “adyuvante” posterior.
HISTORIA ONCOLÓGICA (VI)
• ABRIL 2011:
• Decisión del Comité de Tumores Digestivos:
• Tratamiento con quimioterapia de conversión.
• Reevaluación para valorar cirugía del tumor primario y de las metástasisde manera secuencial.
PREGUNTA 2:
• ¿Qué tratamiento propondría a esta paciente?
1. Quimioterapia sola con un doblete.
2. Quimioterapia sola con un triplete.
3. Quimioterapia + anti‐EGFR.
4. Quimioterapia + Bevacizumab.
RESPUESTA 2:
• ¿Qué tratamiento propondría a esta paciente?
1. Quimioterapia sola con un doblete.
2. Quimioterapia sola con un triplete.
3. Quimioterapia + anti‐EGFR.
4. Quimioterapia + Bevacizumab.
HISTORIA ONCOLÓGICA (VII)
• ABRIL 2011:• Colocación de port‐a‐cath.
• CEA: 514 ng/ml (27/04/2011).
• Tratamiento con Quimioterapia de conversión:
• FOLFOX + ANTI‐EGFR
• Comenzó el tratamiento el día 28 de abril de 2011.
CÁNCER COLORRECTAL (CRC): magnitud del problema
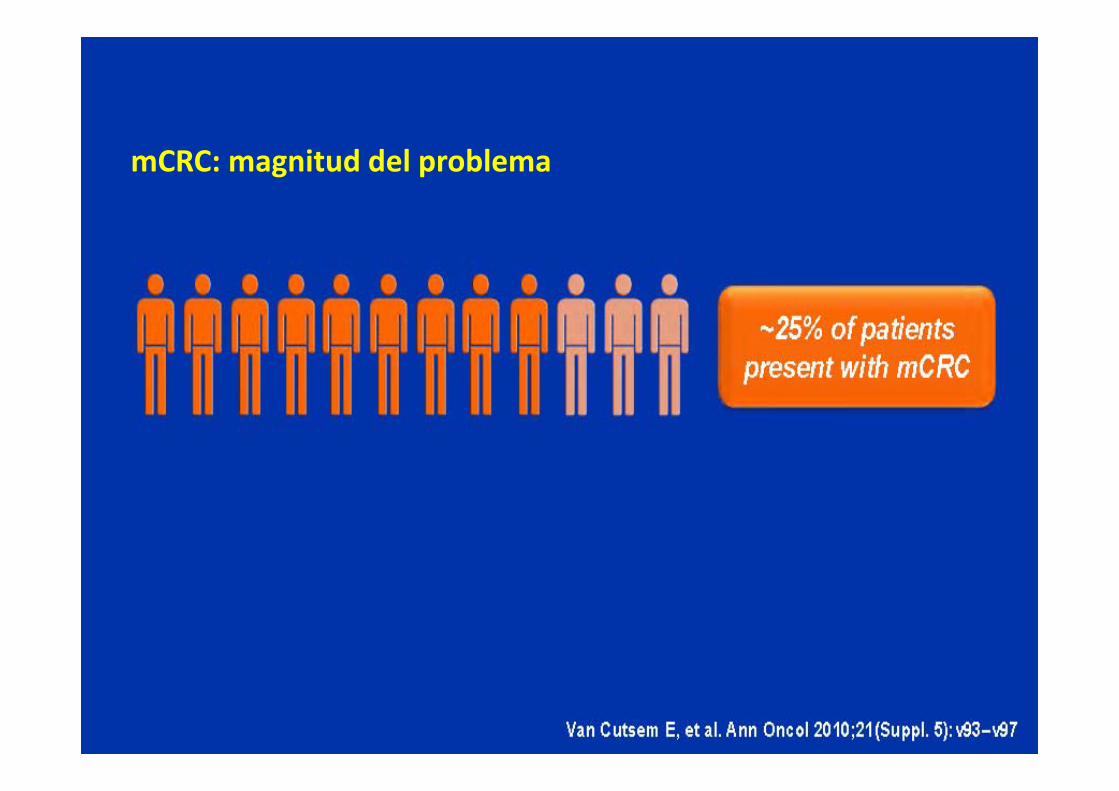
mCRC: magnitud del problema
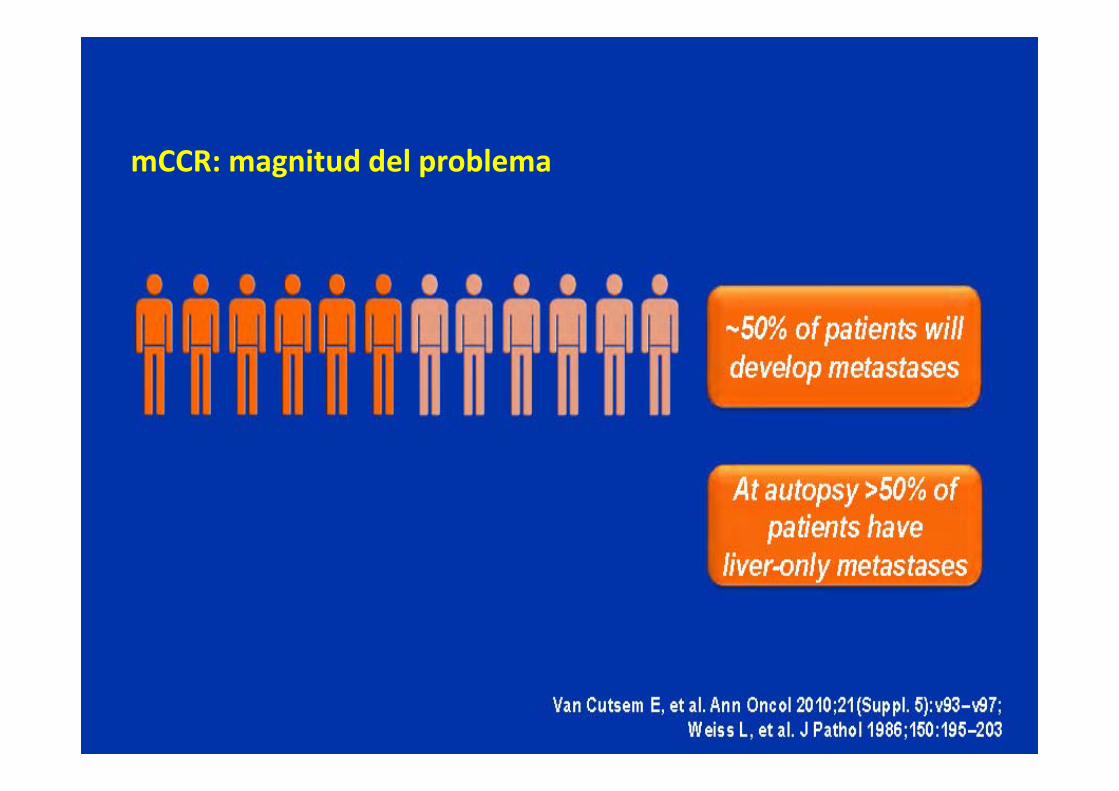
mCCR: magnitud del problema
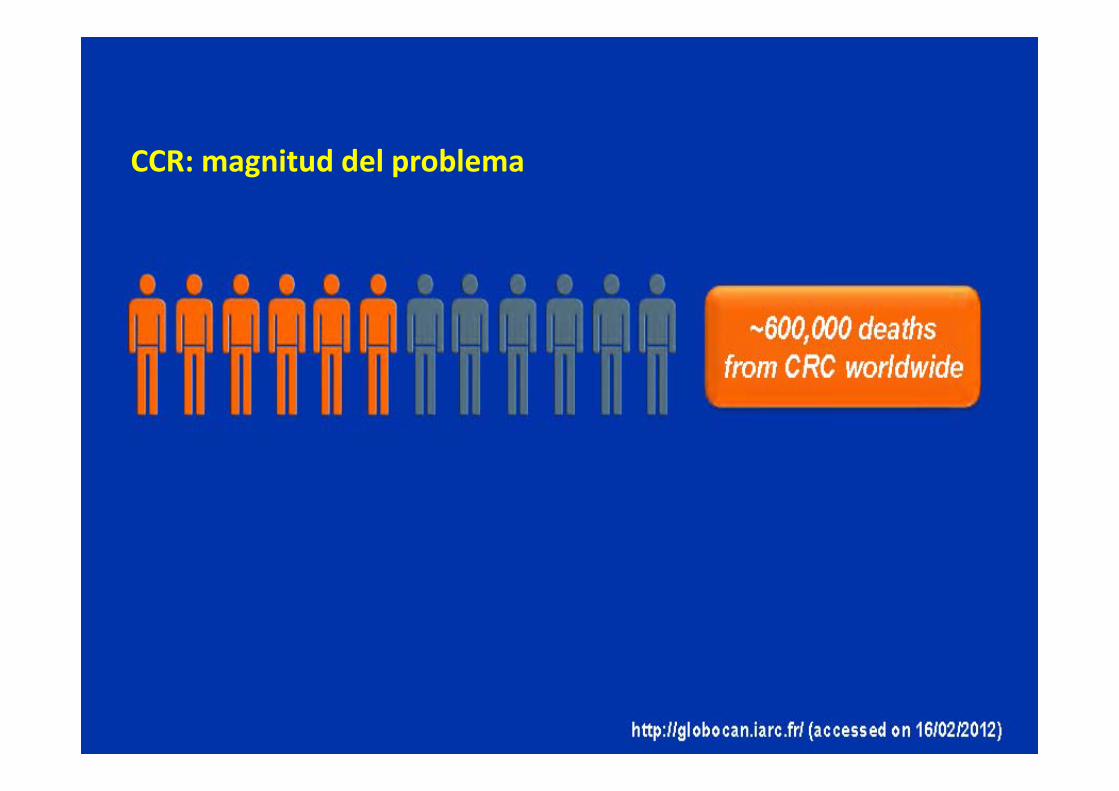
CCR: magnitud del problema
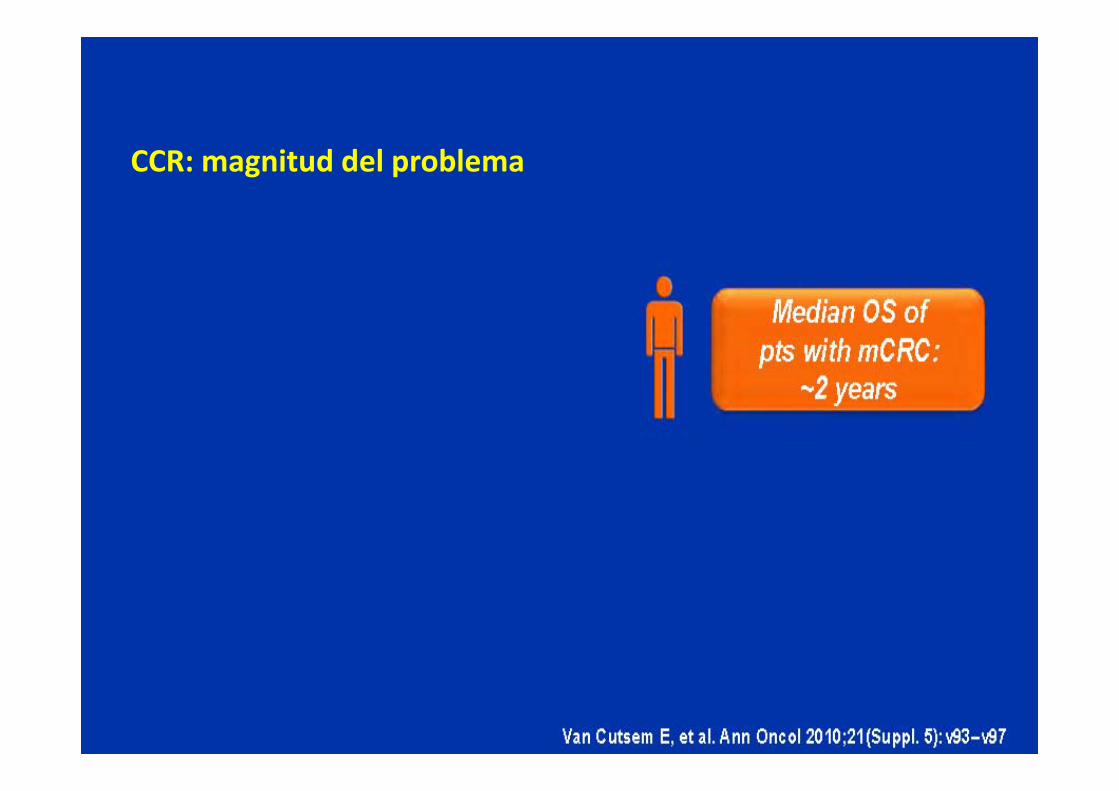
CCR: magnitud del problema
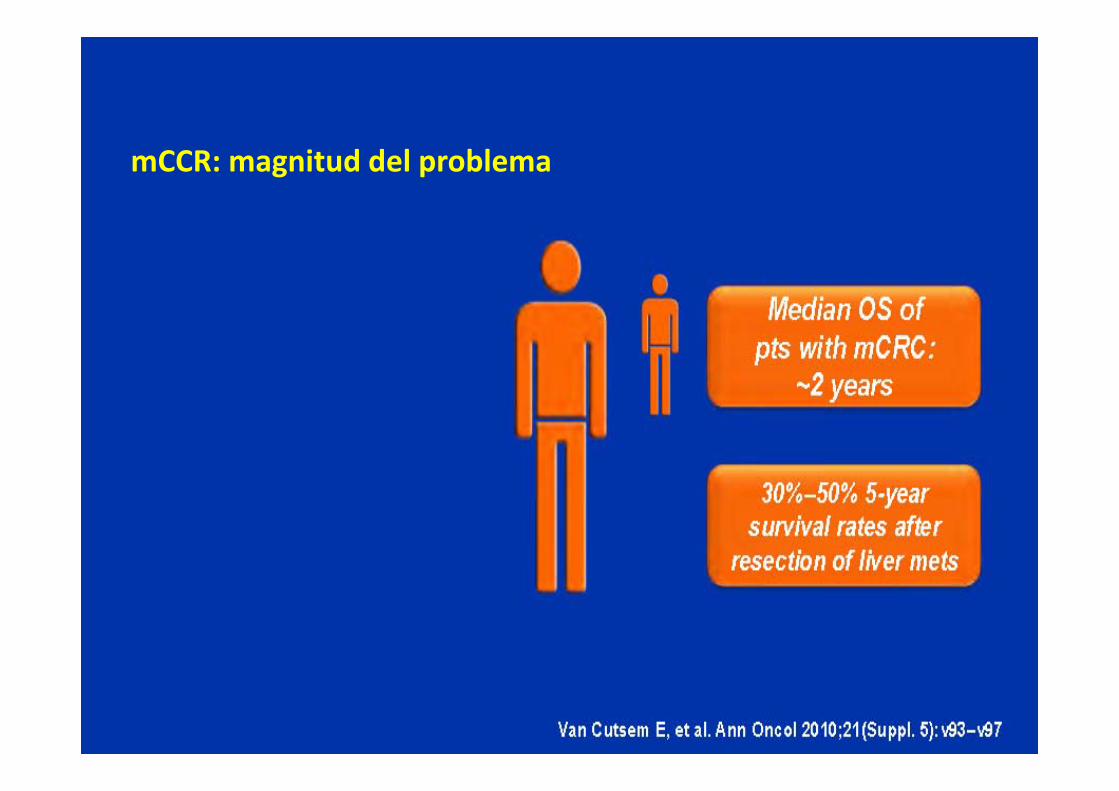
mCCR: magnitud del problema
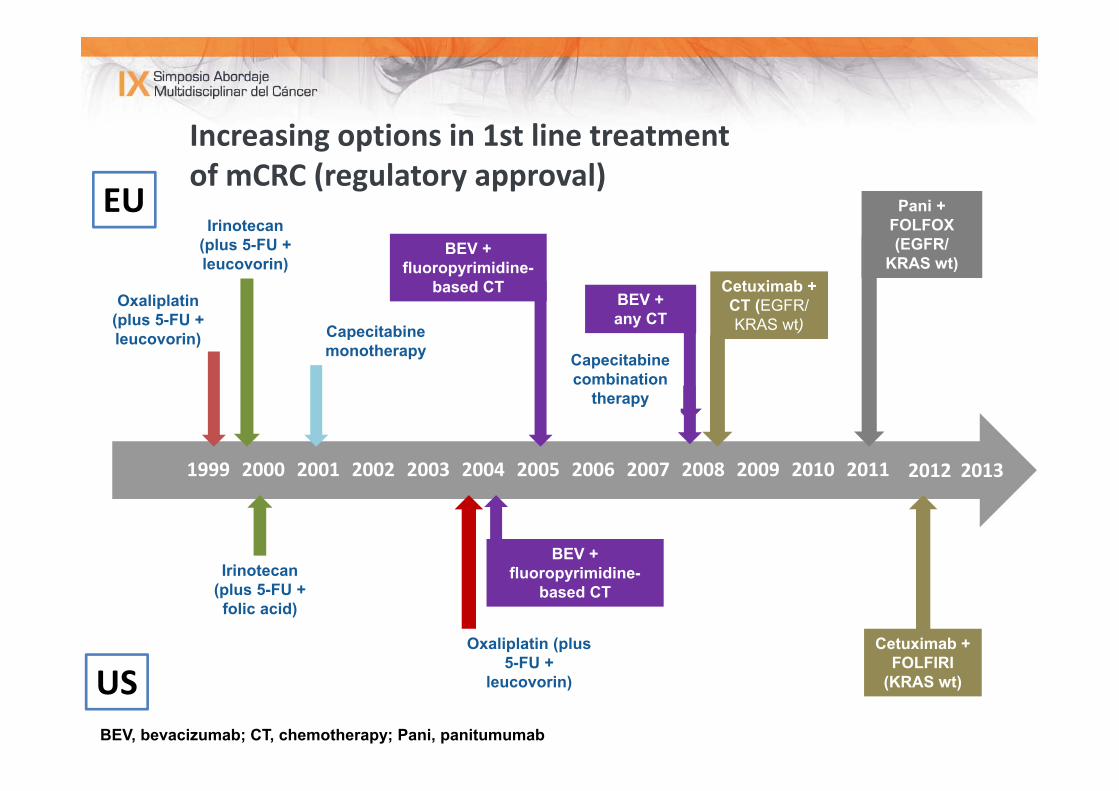
20122011201020092008200720062005200420032002200120001999
Capecitabine monotherapy
Increasing options in 1st line treatment of mCRC (regulatory approval)
US
Irinotecan (plus 5-FU + folic acid)
Irinotecan (plus 5-FU + leucovorin)
Oxaliplatin (plus 5-FU + leucovorin)
Capecitabine combination
therapy
BEV + fluoropyrimidine-
based CT
BEV + fluoropyrimidine-
based CTBEV + any CT
Cetuximab + CT (EGFR/KRAS wt)
Pani + FOLFOX(EGFR/
KRAS wt)
Cetuximab + FOLFIRI
(KRAS wt)
EU
Oxaliplatin (plus 5-FU +
leucovorin)
BEV, bevacizumab; CT, chemotherapy; Pani, panitumumab
2013
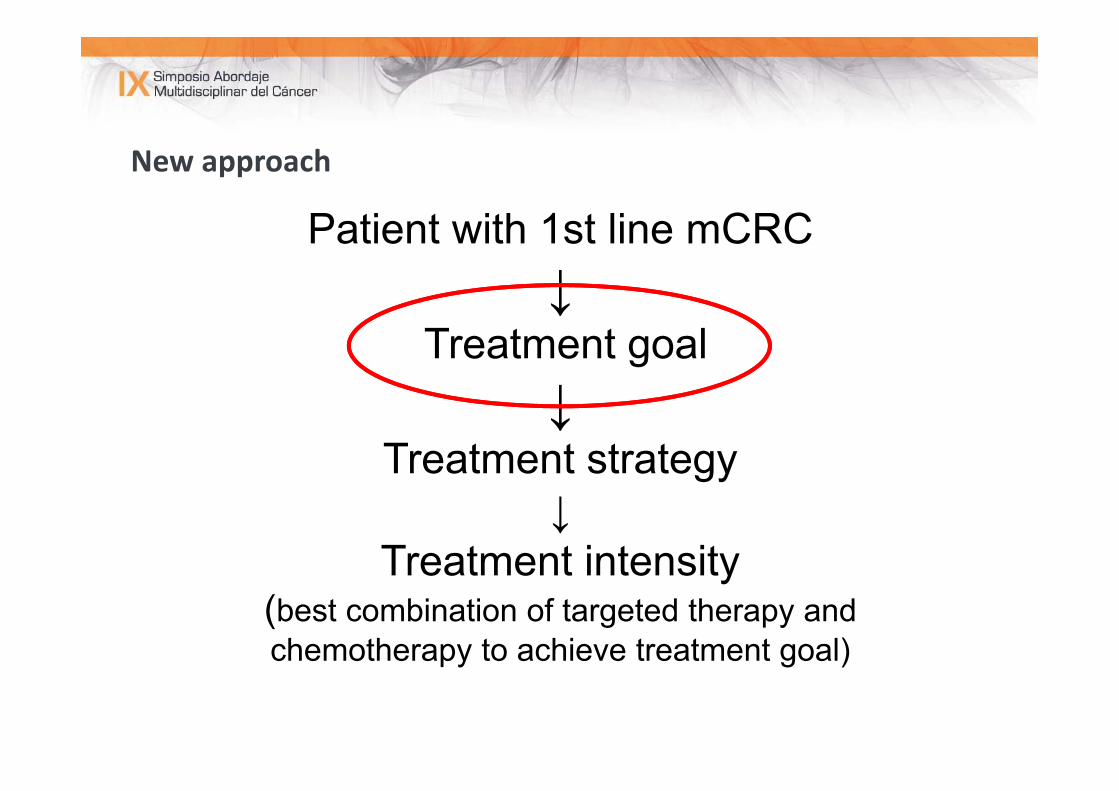
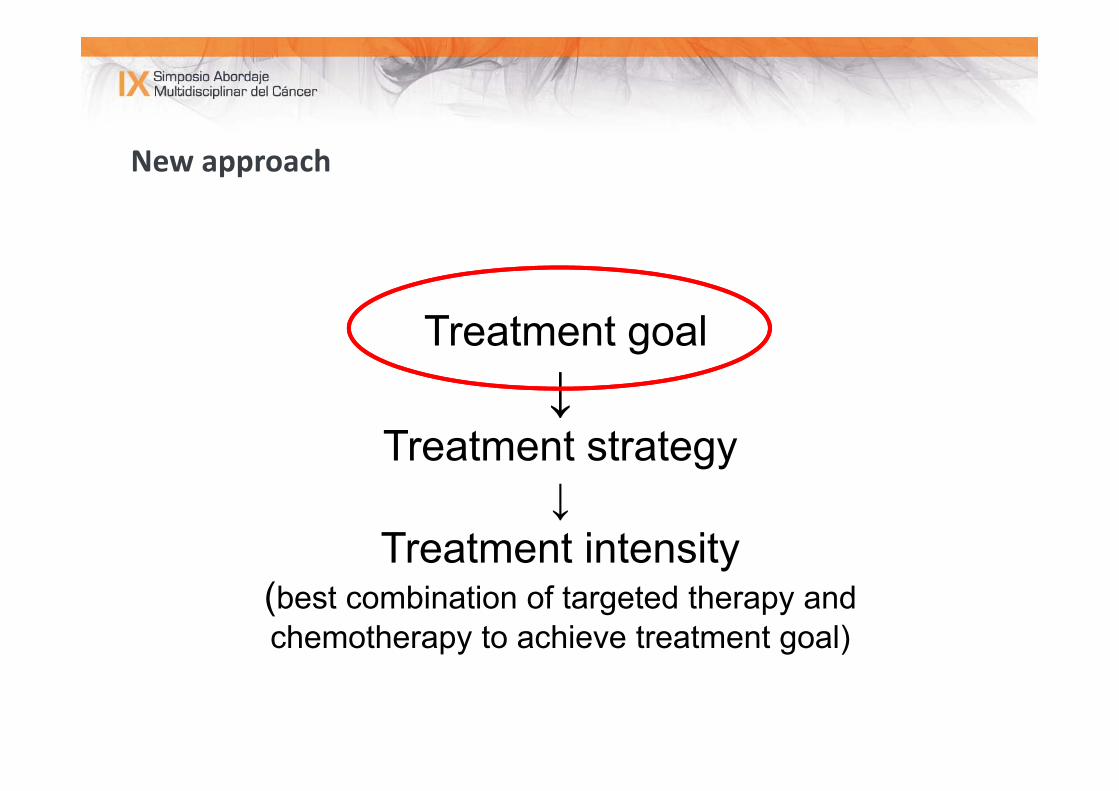
New approach
Patient with 1st line mCRC ↓
Treatment goal ↓
Treatment strategy↓
Treatment intensity(best combination of targeted therapy and chemotherapy to achieve treatment goal)
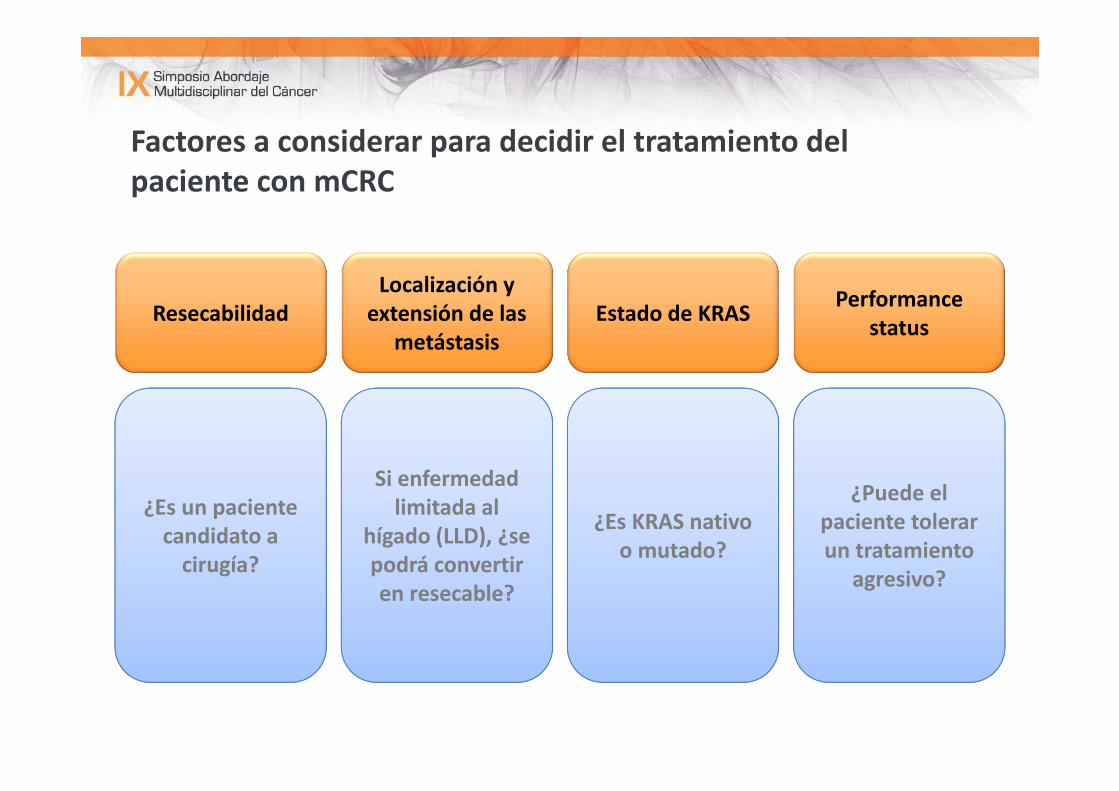
Factores a considerar para decidir el tratamiento del paciente con mCRC
ResecabilidadLocalización y extensión de las
metástasis
Performance statusEstado de KRAS
¿Es un paciente candidato a cirugía?
Si enfermedad limitada al
hígado (LLD), ¿se podrá convertir en resecable?
¿Es KRAS nativo o mutado?
¿Puede el paciente tolerar un tratamiento
agresivo?
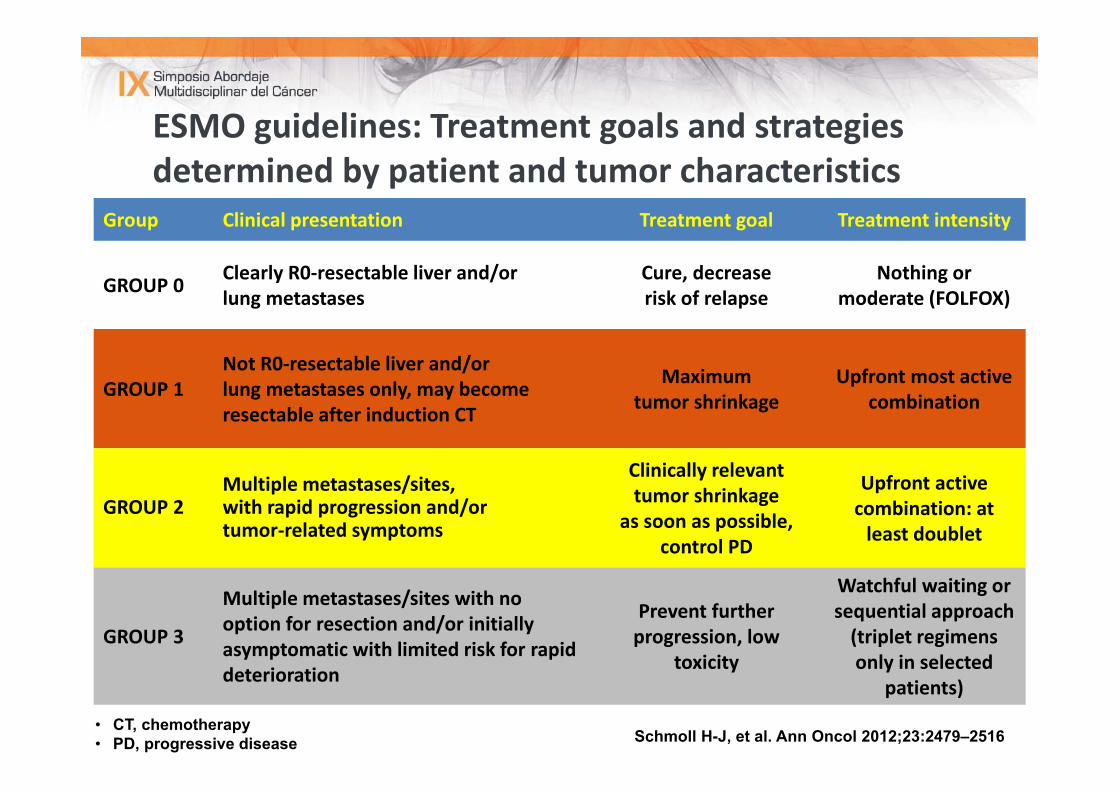
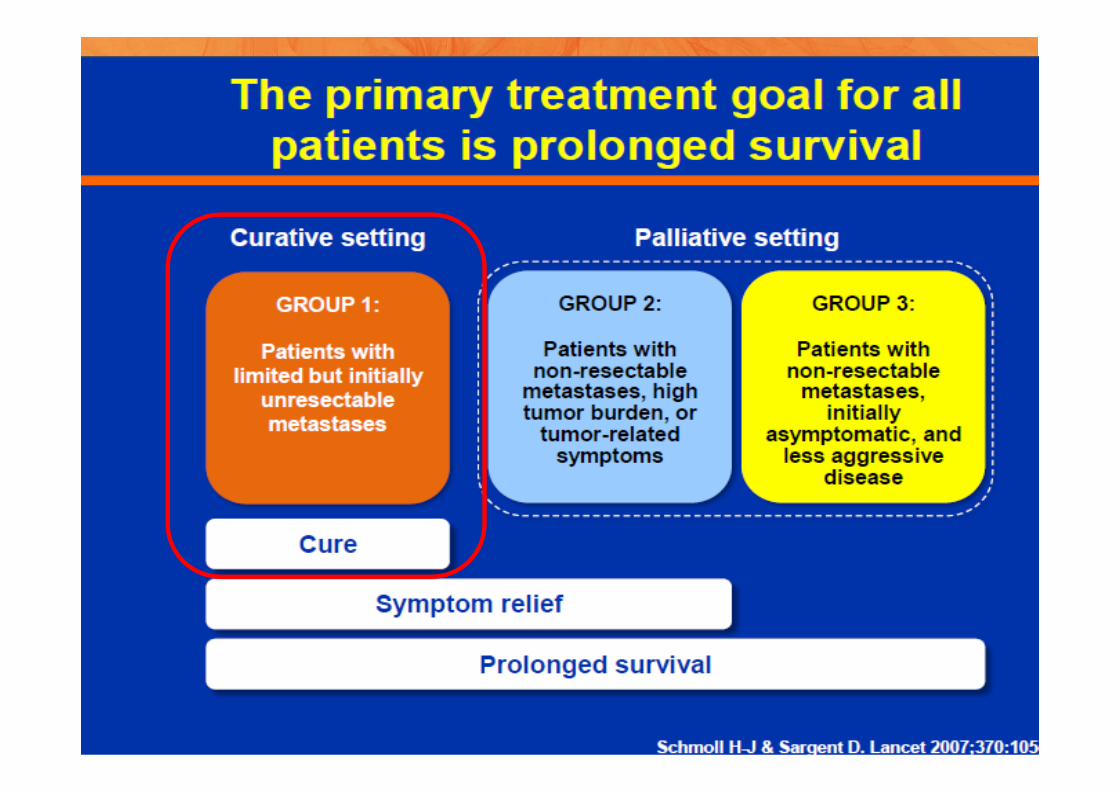
Group Clinical presentation Treatment goal Treatment intensity
GROUP 0 Clearly R0‐resectable liver and/orlung metastases
Cure, decrease risk of relapse
Nothing or moderate (FOLFOX)
GROUP 1Not R0‐resectable liver and/orlung metastases only, may become resectable after induction CT
Maximum tumor shrinkage
Upfront most active combination
GROUP 2Multiple metastases/sites, with rapid progression and/or tumor‐related symptoms
Clinically relevant tumor shrinkage
as soon as possible, control PD
Upfront active combination: at least doublet
GROUP 3
Multiple metastases/sites with no option for resection and/or initially asymptomatic with limited risk for rapid deterioration
Prevent further progression, low
toxicity
Watchful waiting or sequential approach (triplet regimens only in selected
patients)
ESMO guidelines: Treatment goals and strategies determined by patient and tumor characteristics
Schmoll H-J, et al. Ann Oncol 2012;23:2479–2516• CT, chemotherapy• PD, progressive disease
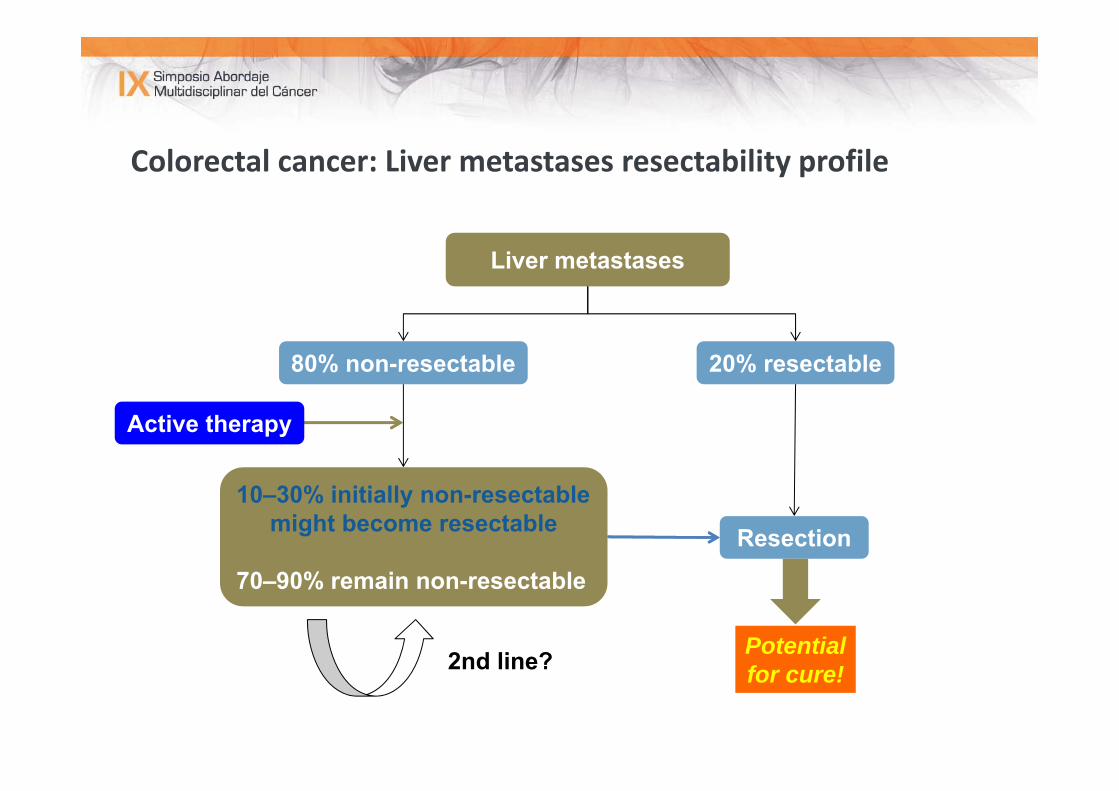
Colorectal cancer: Liver metastases resectability profile
Liver metastases
80% non-resectable 20% resectable
10–30% initially non-resectablemight become resectable
70–90% remain non-resectable
Resection
Potentialfor cure!2nd line?
Active therapy
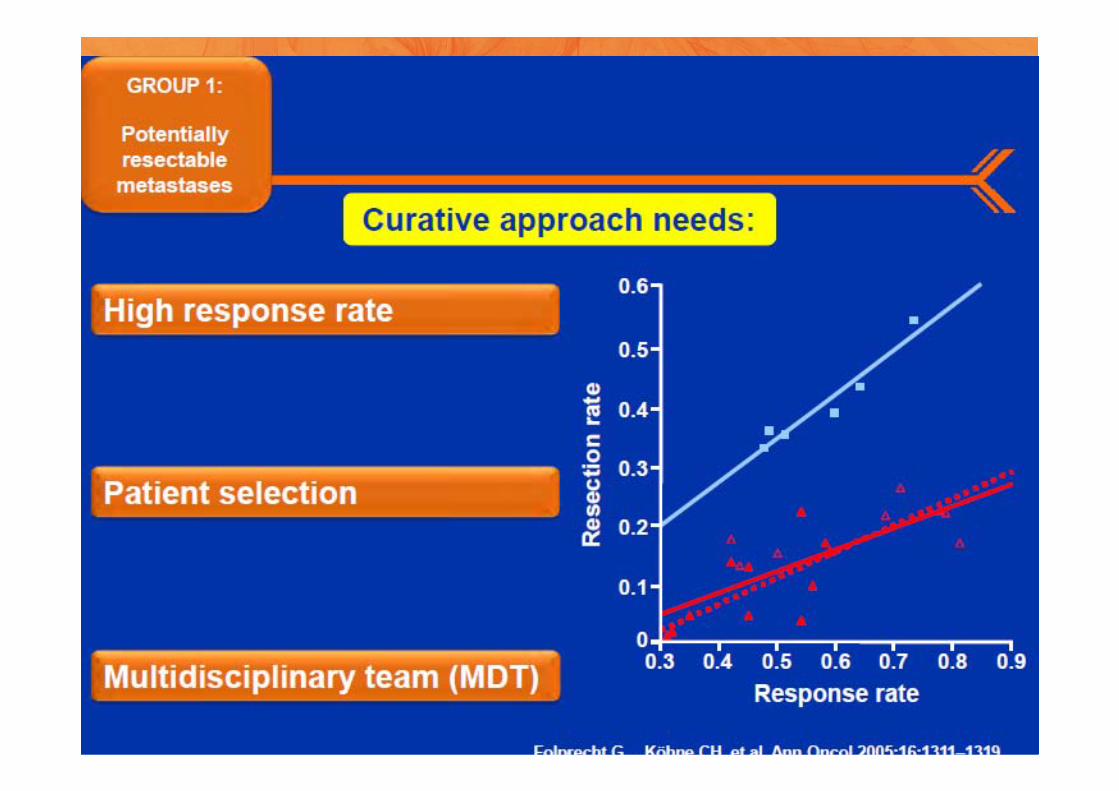
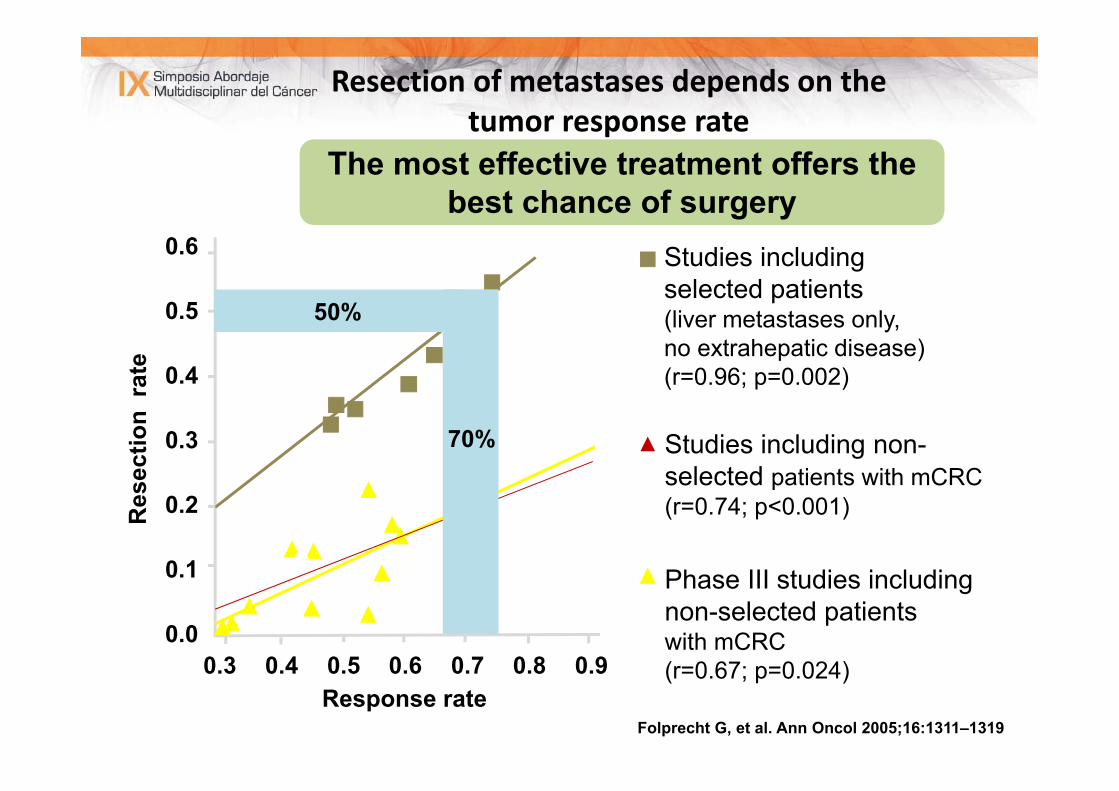
Folprecht G, et al. Ann Oncol 2005;16:1311–1319
Studies including non-selected patients with mCRC(r=0.74; p<0.001)
Studies including selected patients(liver metastases only, no extrahepatic disease)(r=0.96; p=0.002)
Phase III studies including non-selected patients with mCRC (r=0.67; p=0.024)
Resection of metastases depends on the tumor response rate
Res
ectio
n ra
te
Response rate
0.6
0.5
0.4
0.3
0.2
0.1
0.00.3 0.4 0.5 0.6 0.7 0.8 0.9
50%
70%
The most effective treatment offers thebest chance of surgery
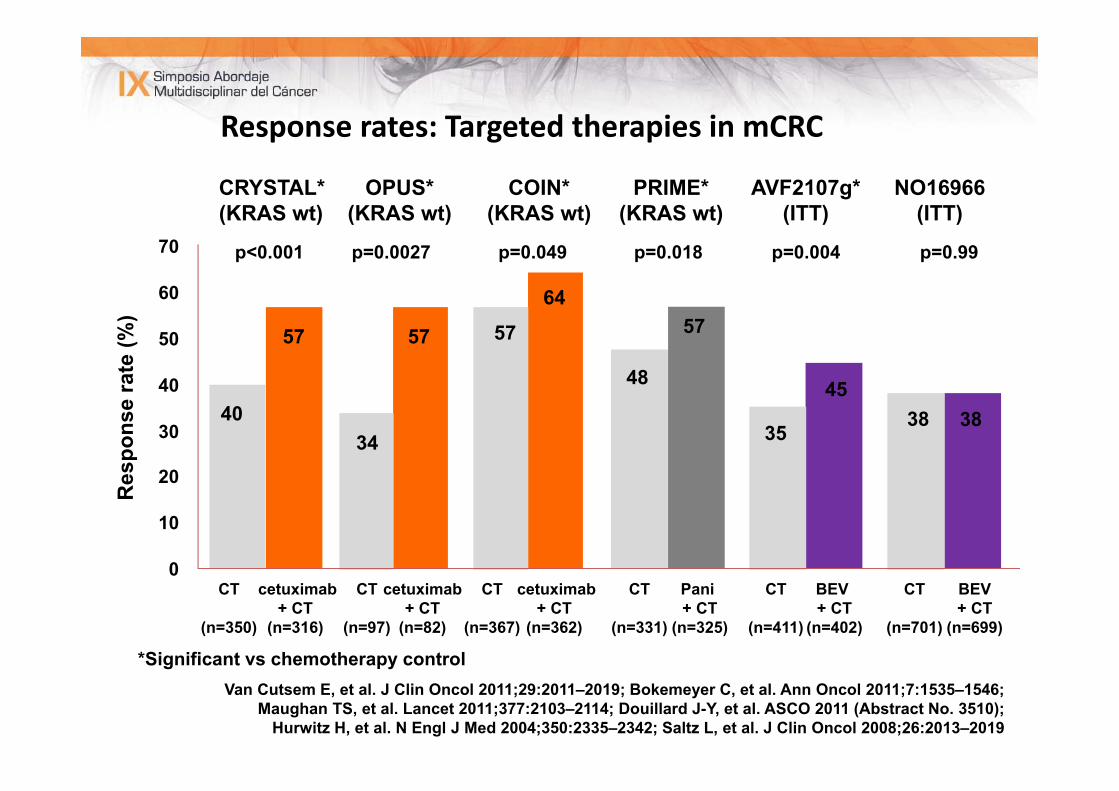
Response rates: Targeted therapies in mCRCR
espo
nse
rate
(%)
0
10
20
30
40
50
60
70
*Significant vs chemotherapy control
p=0.004
45
BEV + CT
(n=402)
AVF2107g*(ITT)
35
CT
(n=411)
p=0.99
38
BEV + CT
(n=699)
NO16966(ITT)
38
CT
(n=701)
p=0.018
57
Pani + CT
(n=325)
PRIME*(KRAS wt)
48
CT
(n=331)
COIN*(KRAS wt)
cetuximab+ CT
(n=362)
64
p=0.049
57
CT
(n=367)
CRYSTAL*(KRAS wt)
cetuximab + CT
(n=316)
57
p<0.001
40
CT
(n=350)
cetuximab + CT
(n=82)
57
p=0.0027
OPUS*(KRAS wt)
34
CT
(n=97)
Van Cutsem E, et al. J Clin Oncol 2011;29:2011–2019; Bokemeyer C, et al. Ann Oncol 2011;7:1535–1546; Maughan TS, et al. Lancet 2011;377:2103–2114; Douillard J-Y, et al. ASCO 2011 (Abstract No. 3510);
Hurwitz H, et al. N Engl J Med 2004;350:2335–2342; Saltz L, et al. J Clin Oncol 2008;26:2013–2019
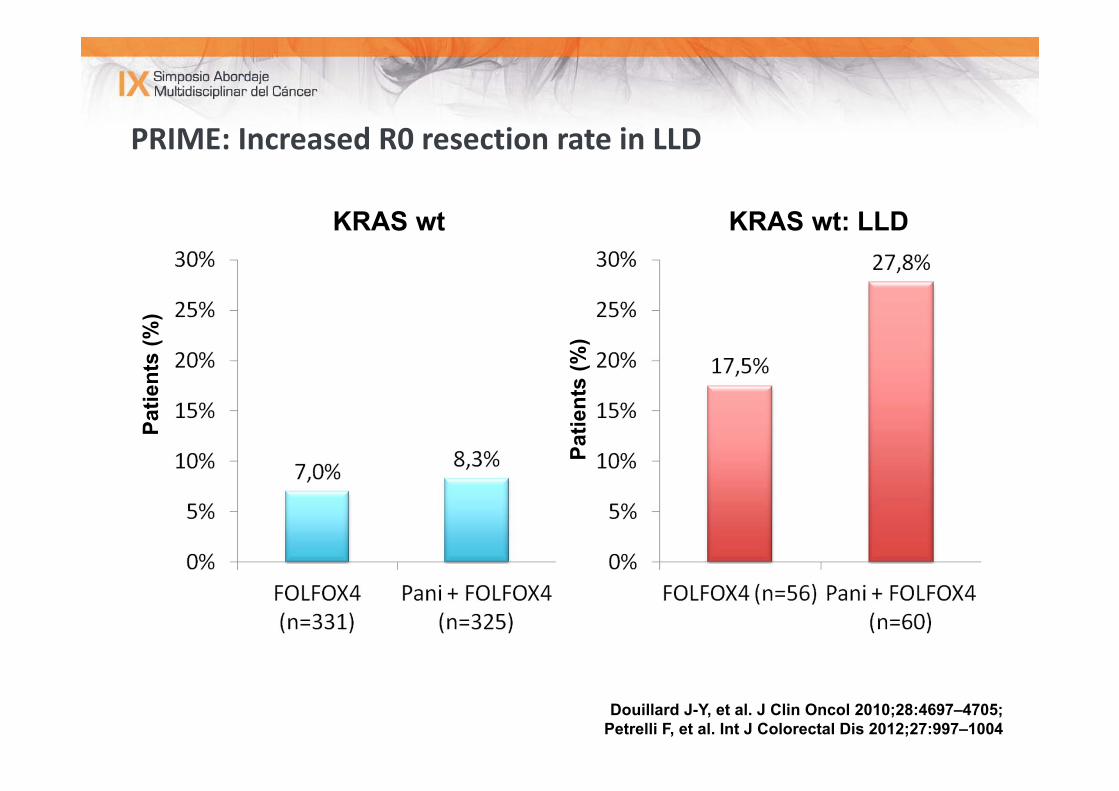
PRIME: Increased R0 resection rate in LLDPa
tient
s (%
)
KRAS wt KRAS wt: LLD
Patie
nts
(%)
Douillard J-Y, et al. J Clin Oncol 2010;28:4697–4705; Petrelli F, et al. Int J Colorectal Dis 2012;27:997–1004
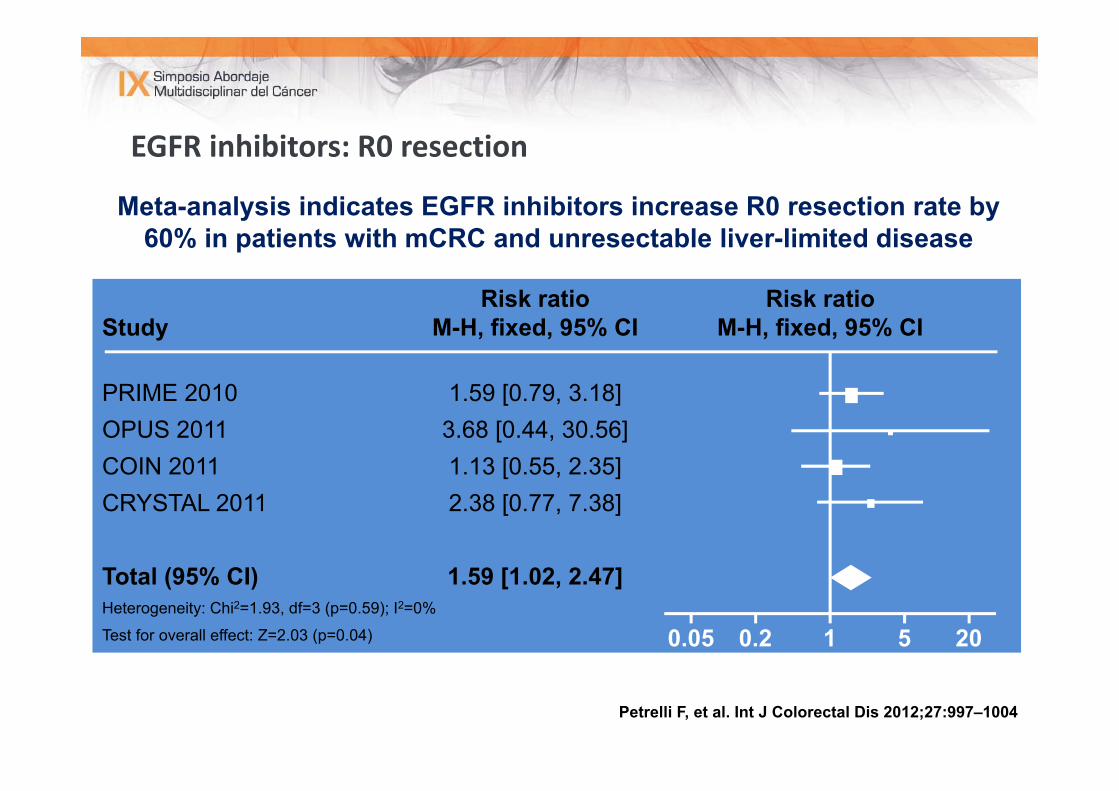
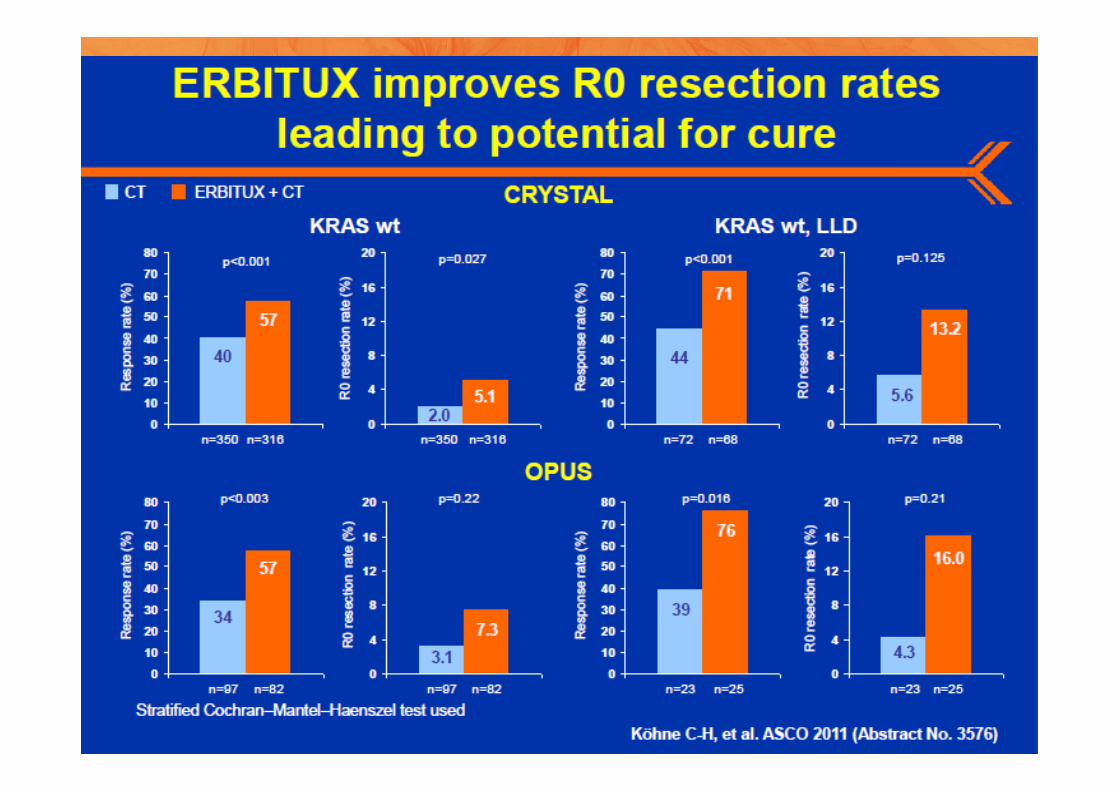
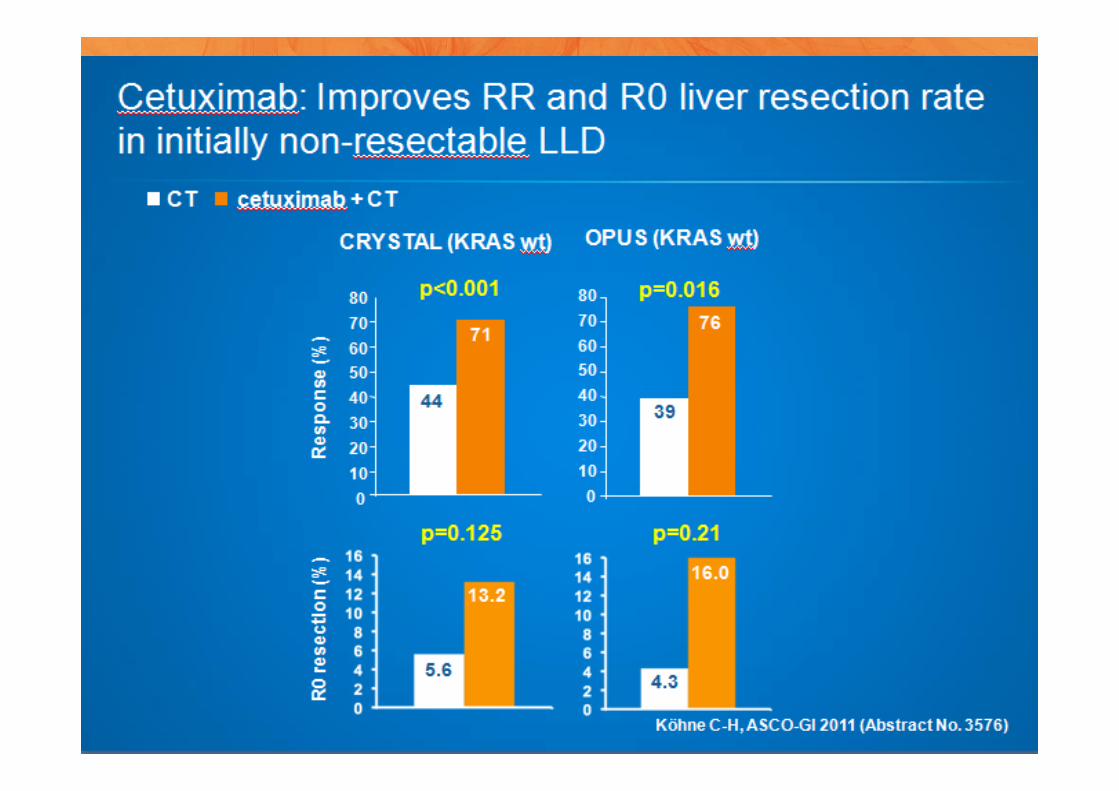
EGFR inhibitors: R0 resection
Meta-analysis indicates EGFR inhibitors increase R0 resection rate by 60% in patients with mCRC and unresectable liver-limited disease
Petrelli F, et al. Int J Colorectal Dis 2012;27:997–1004
Risk ratio Risk ratioStudy M-H, fixed, 95% CI M-H, fixed, 95% CI
PRIME 2010 1.59 [0.79, 3.18]OPUS 2011 3.68 [0.44, 30.56]COIN 2011 1.13 [0.55, 2.35]CRYSTAL 2011 2.38 [0.77, 7.38]
Total (95% CI) 1.59 [1.02, 2.47]Heterogeneity: Chi2=1.93, df=3 (p=0.59); I2=0%
Test for overall effect: Z=2.03 (p=0.04) 0.05 0.2 1 5 20Favours control
Favours EGFR combination
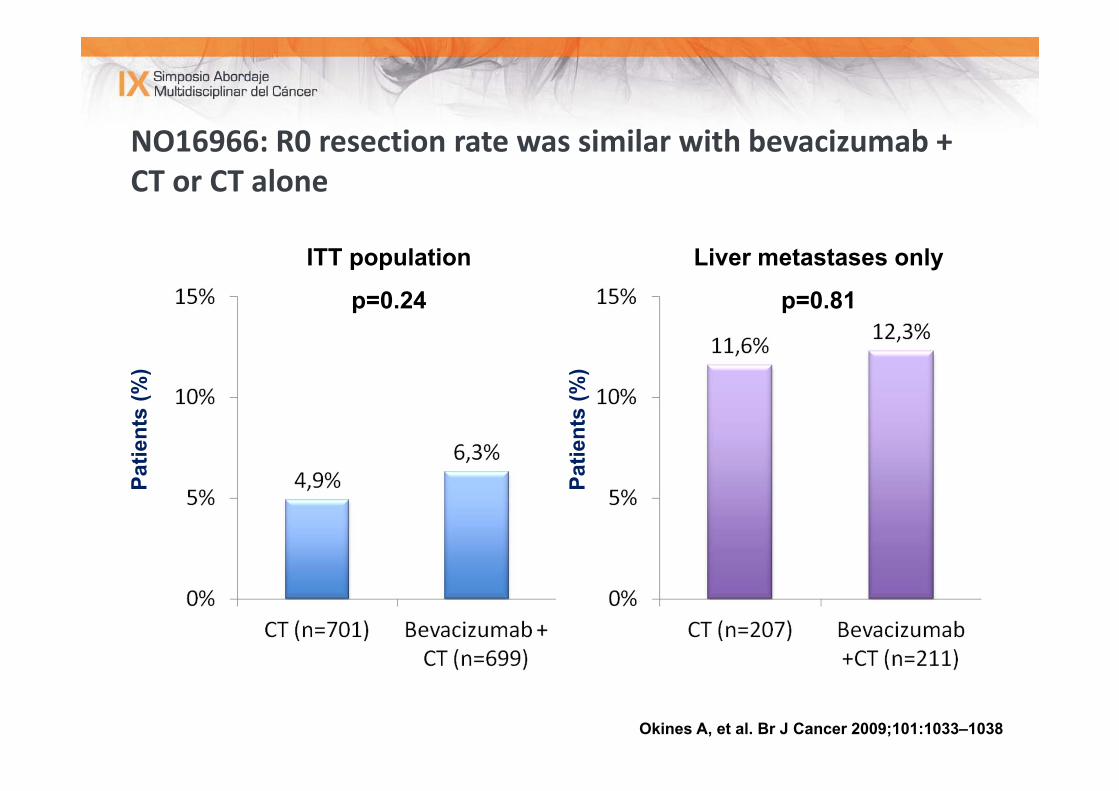
NO16966: R0 resection rate was similar with bevacizumab + CT or CT alone
Patie
nts
(%)
ITT population
p=0.24
Liver metastases only
p=0.81
Patie
nts
(%)
Okines A, et al. Br J Cancer 2009;101:1033–1038
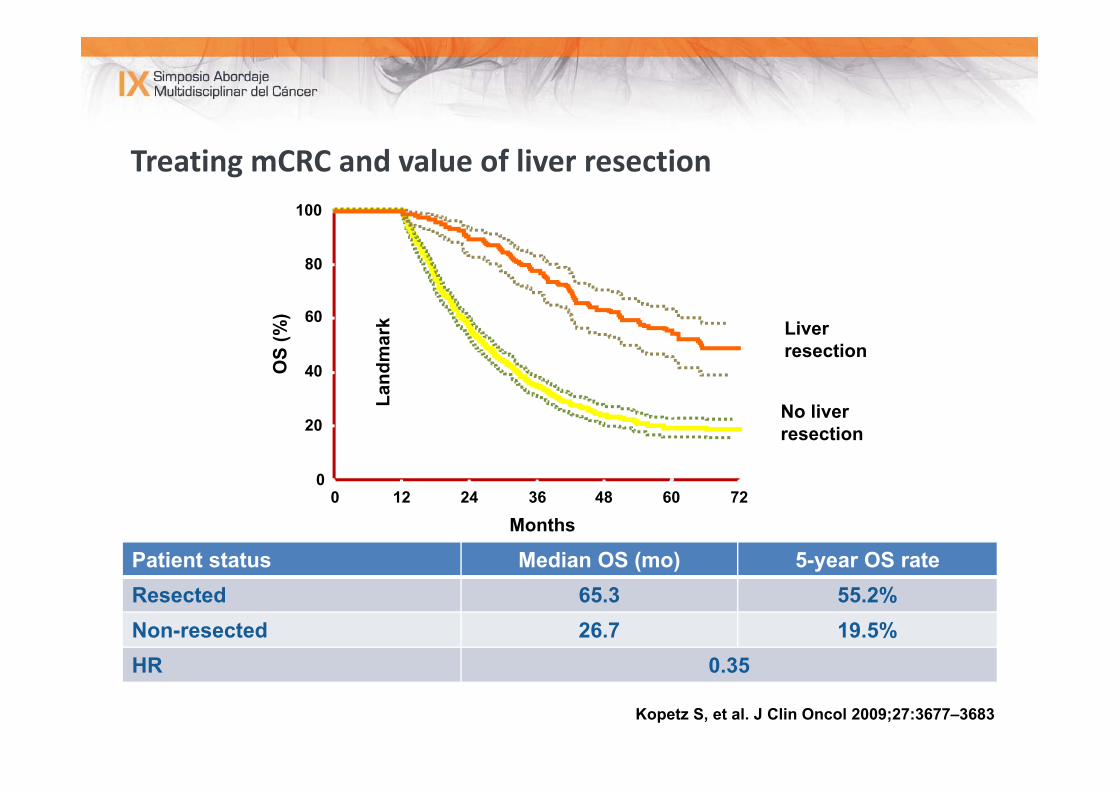
Treating mCRC and value of liver resection
012 24 36 48 60 72
20
40
60
80
100
0
No liver resection
Liver resection
Months
OS
(%)
Land
mar
k
Kopetz S, et al. J Clin Oncol 2009;27:3677–3683
Patient status Median OS (mo) 5-year OS rate Resected 65.3 55.2%Non-resected 26.7 19.5%HR 0.35
12 24 36 48 600
HR=2.34 (1.37–4.01)p=0.002
0 12 24 36 48 60
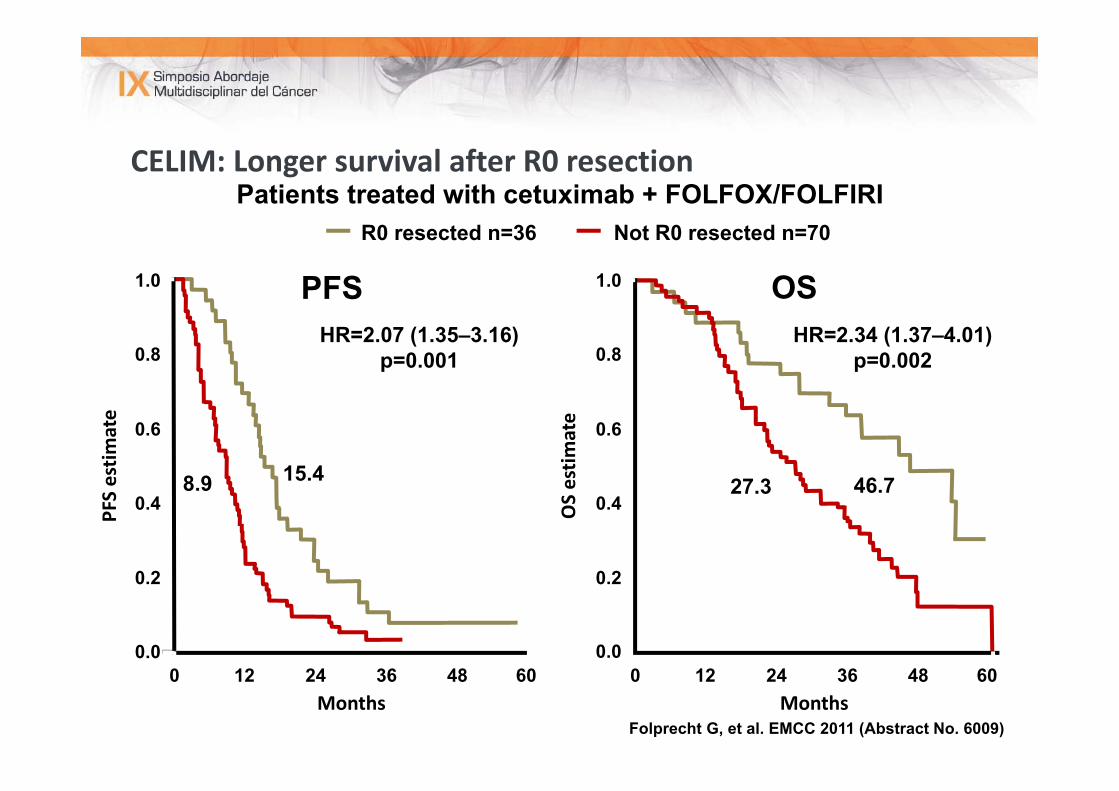
CELIM: Longer survival after R0 resection
OSPFS
PFS estim
ate
0.2
0.4
0.6
0.8
1.0
Months
0.0
HR=2.07 (1.35–3.16)p=0.001
Months
0.2
0.4
0.6
0.8
1.0
0.0
OS estim
ate
Folprecht G, et al. EMCC 2011 (Abstract No. 6009)
8.9 15.4 27.3 46.7
Patients treated with cetuximab + FOLFOX/FOLFIRINot R0 resected n=70R0 resected n=36
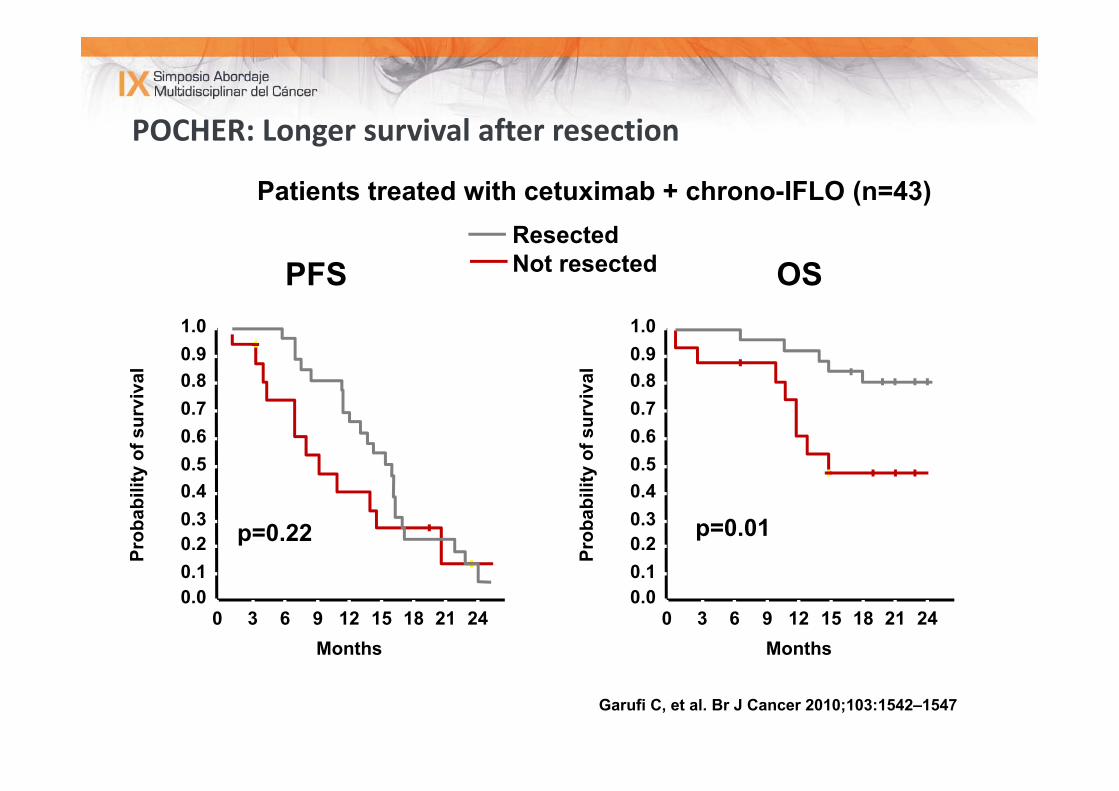
POCHER: Longer survival after resection
OSPFS1.0
Prob
abili
ty o
f sur
viva
l 0.90.80.70.60.50.40.30.20.10.0
0 63 9 12 15 18 21 24Months
p=0.22
ResectedNot resected
1.0
Prob
abili
ty o
f sur
viva
l 0.90.80.70.60.50.40.30.20.10.0
0 63 9 12 15 18 21 24Months
p=0.01
Garufi C, et al. Br J Cancer 2010;103:1542–1547
Patients treated with cetuximab + chrono-IFLO (n=43)
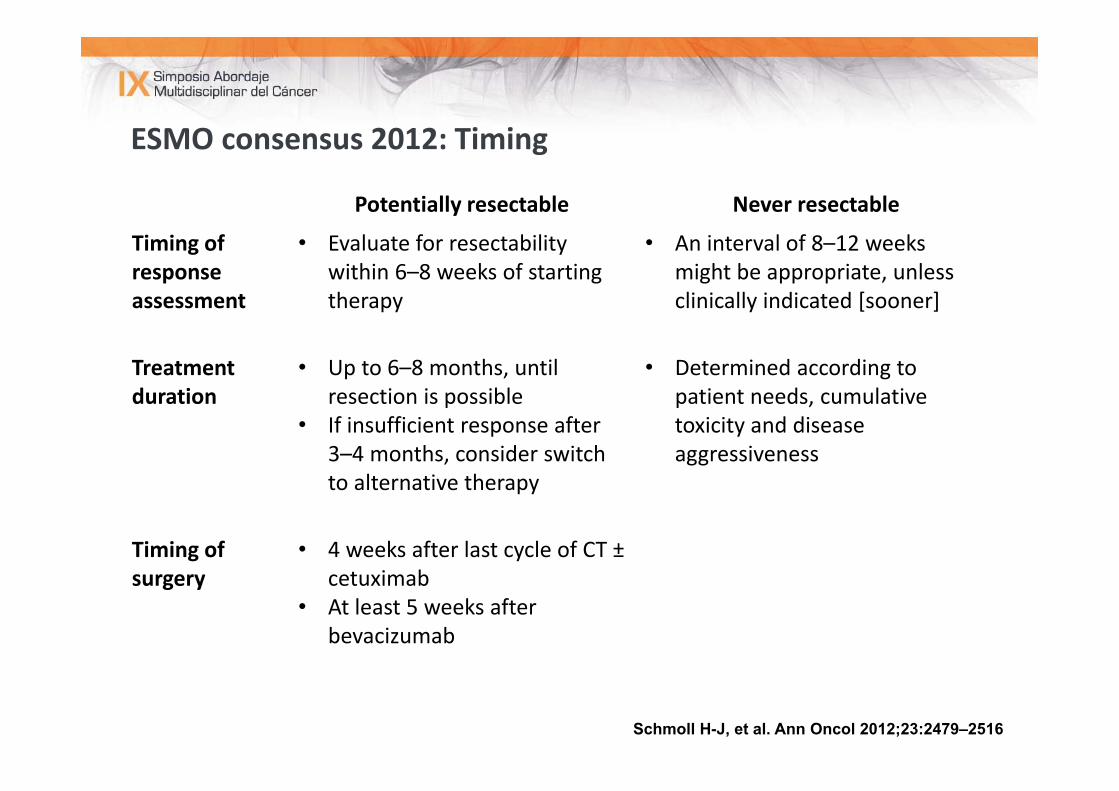
ESMO consensus 2012: Timing
Schmoll H-J, et al. Ann Oncol 2012;23:2479–2516
Potentially resectable Never resectable
Timing of response assessment
• Evaluate for resectabilitywithin 6–8 weeks of starting therapy
• An interval of 8–12 weeks might be appropriate, unless clinically indicated [sooner]
Treatment duration
• Up to 6–8 months, until resection is possible
• If insufficient response after 3–4 months, consider switch to alternative therapy
• Determined according to patient needs, cumulative toxicity and disease aggressiveness
Timing of surgery
• 4 weeks after last cycle of CT ±cetuximab
• At least 5 weeks after bevacizumab
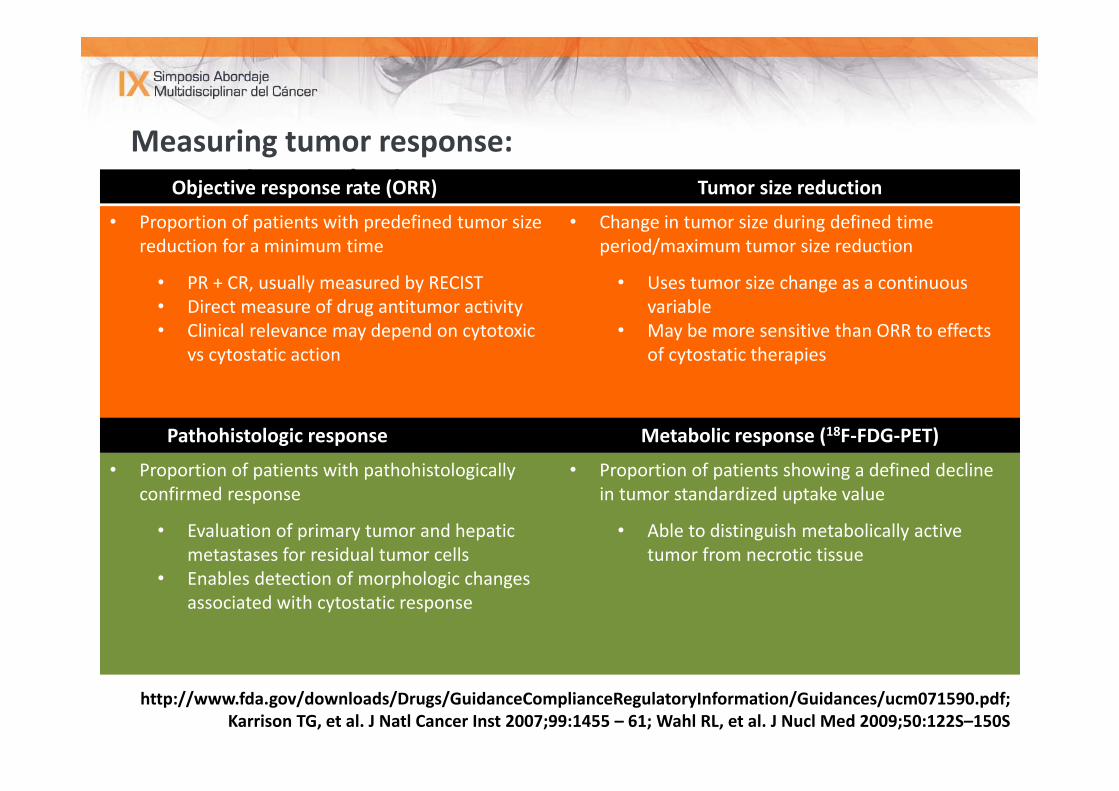
Measuring tumor response:Appropriate endpointsObjective response rate (ORR) Tumor size reduction
• Proportion of patients with predefined tumor size reduction for a minimum time
• PR + CR, usually measured by RECIST• Direct measure of drug antitumor activity• Clinical relevance may depend on cytotoxic
vs cytostatic action
• Change in tumor size during defined time period/maximum tumor size reduction
• Uses tumor size change as a continuous variable
• May be more sensitive than ORR to effects of cytostatic therapies
Pathohistologic response Metabolic response (18F‐FDG‐PET)
• Proportion of patients with pathohistologicallyconfirmed response
• Evaluation of primary tumor and hepatic metastases for residual tumor cells
• Enables detection of morphologic changes associated with cytostatic response
• Proportion of patients showing a defined decline in tumor standardized uptake value
• Able to distinguish metabolically active tumor from necrotic tissue
http://www.fda.gov/downloads/Drugs/GuidanceComplianceRegulatoryInformation/Guidances/ucm071590.pdf; Karrison TG, et al. J Natl Cancer Inst 2007;99:1455 – 61; Wahl RL, et al. J Nucl Med 2009;50:122S–150S
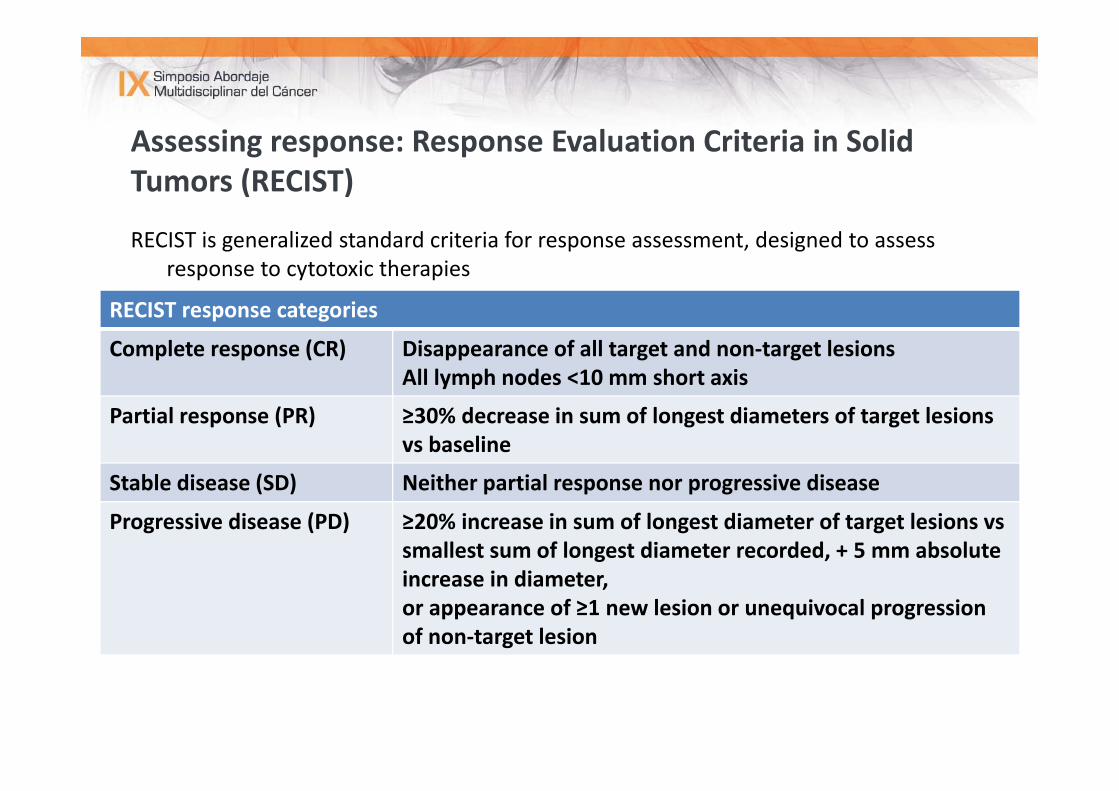
Assessing response: Response Evaluation Criteria in Solid Tumors (RECIST)
RECIST is generalized standard criteria for response assessment, designed to assess response to cytotoxic therapies
RECIST response categories
Complete response (CR) Disappearance of all target and non‐target lesions All lymph nodes <10 mm short axis
Partial response (PR) ≥30% decrease in sum of longest diameters of target lesions vs baseline
Stable disease (SD) Neither partial response nor progressive disease
Progressive disease (PD) ≥20% increase in sum of longest diameter of target lesions vssmallest sum of longest diameter recorded, + 5 mm absolute increase in diameter, or appearance of ≥1 new lesion or unequivocal progression of non‐target lesion
Nishino M, et al. AJR Am J Roentgenol 2012;198:737–745; http://www.recist.com
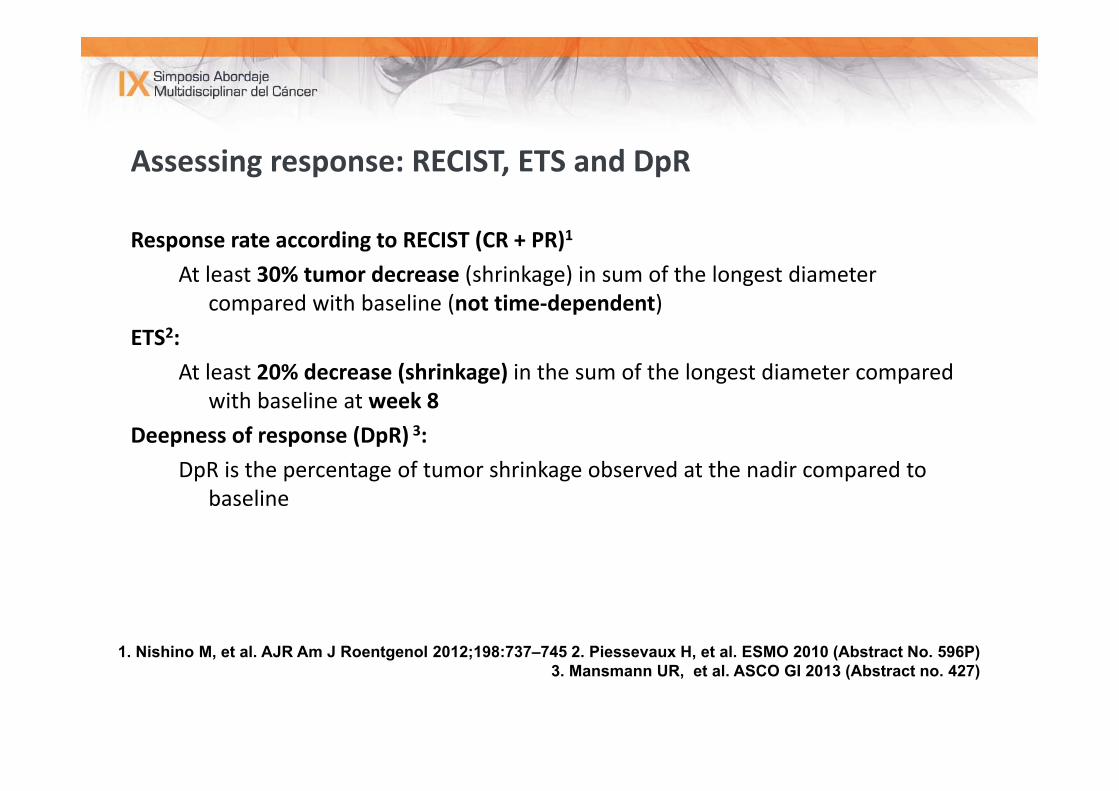
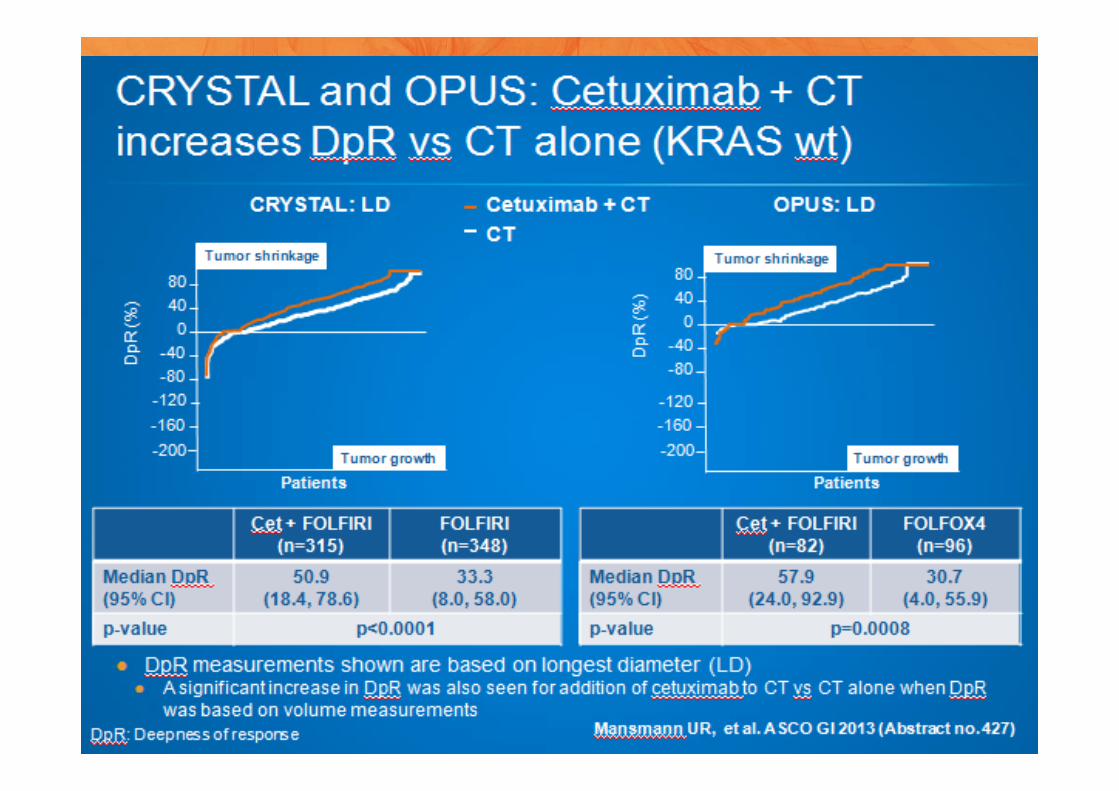
Assessing response: RECIST, ETS and DpR
Response rate according to RECIST (CR + PR)1
At least 30% tumor decrease (shrinkage) in sum of the longest diameter compared with baseline (not time‐dependent)
ETS2: At least 20% decrease (shrinkage) in the sum of the longest diameter compared
with baseline at week 8Deepness of response (DpR) 3:
DpR is the percentage of tumor shrinkage observed at the nadir compared to baseline
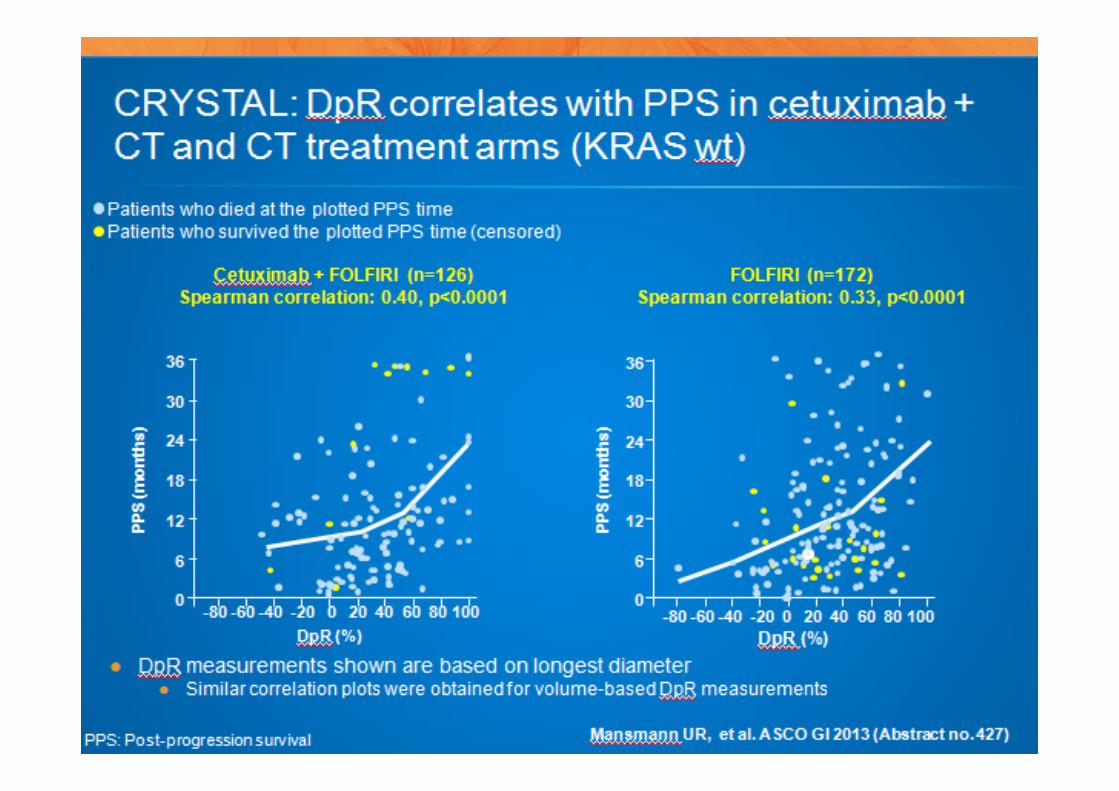
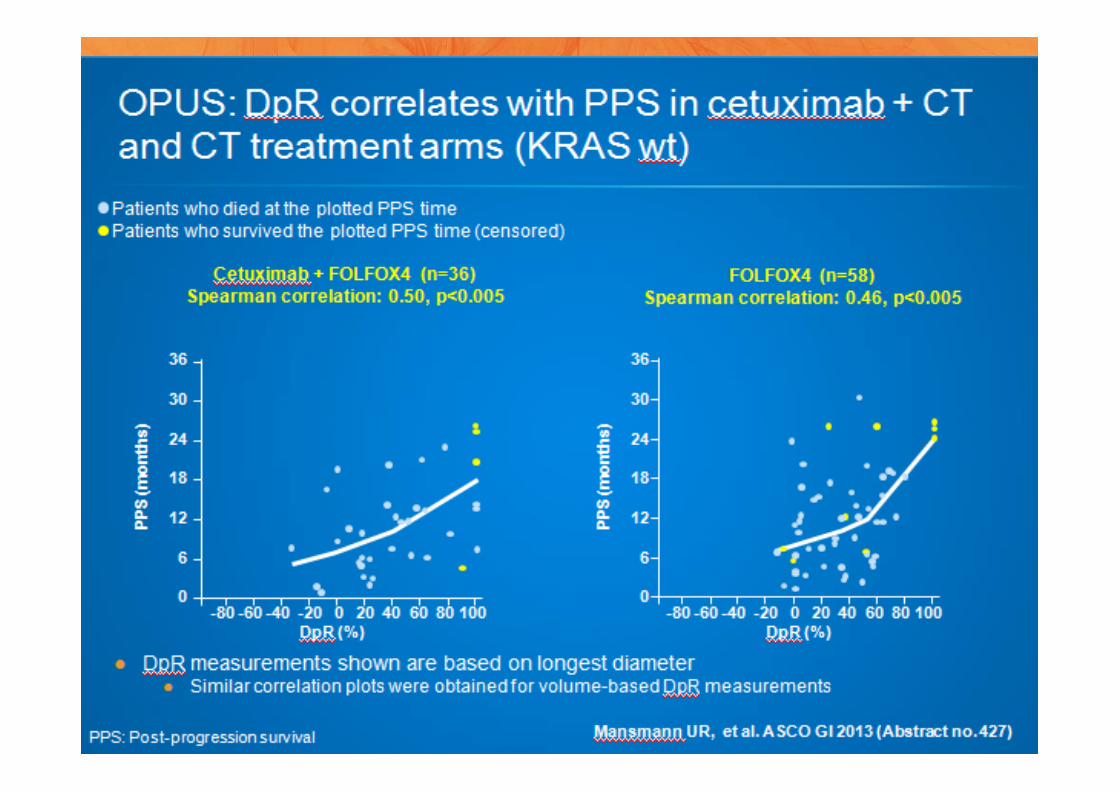
1. Nishino M, et al. AJR Am J Roentgenol 2012;198:737–745 2. Piessevaux H, et al. ESMO 2010 (Abstract No. 596P)3. Mansmann UR, et al. ASCO GI 2013 (Abstract no. 427)
- x%
100%
Tx duration
Sum of target lesions
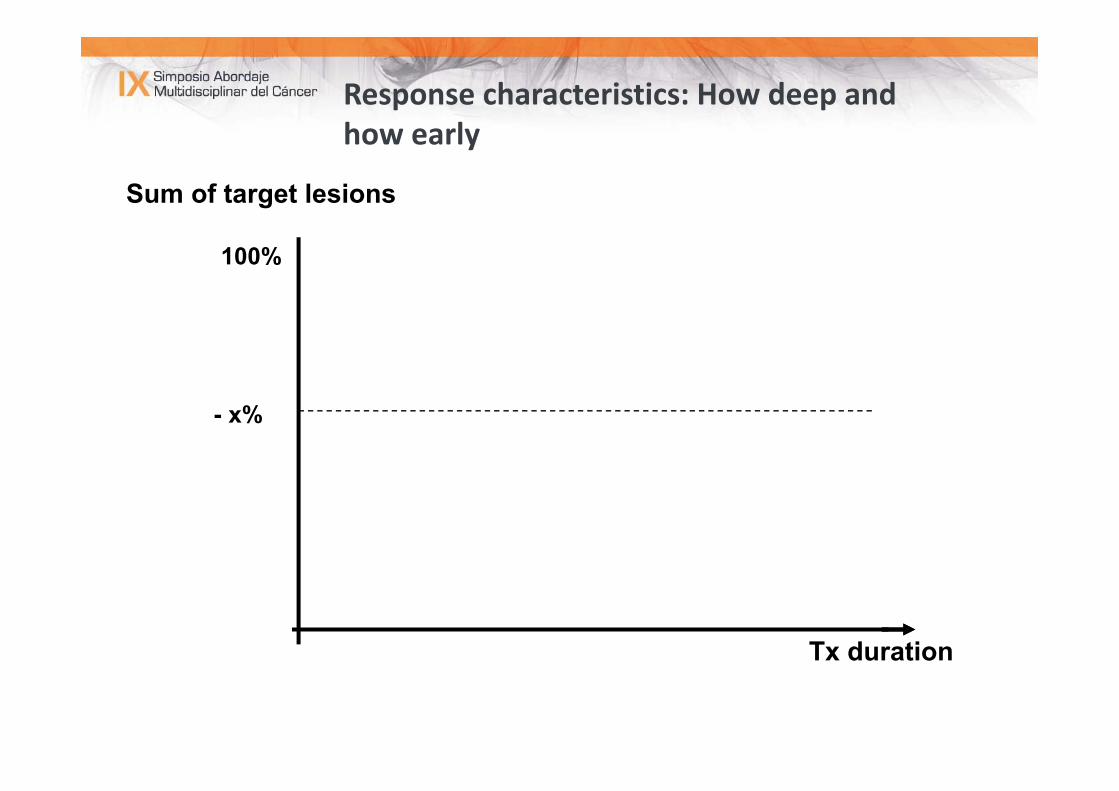
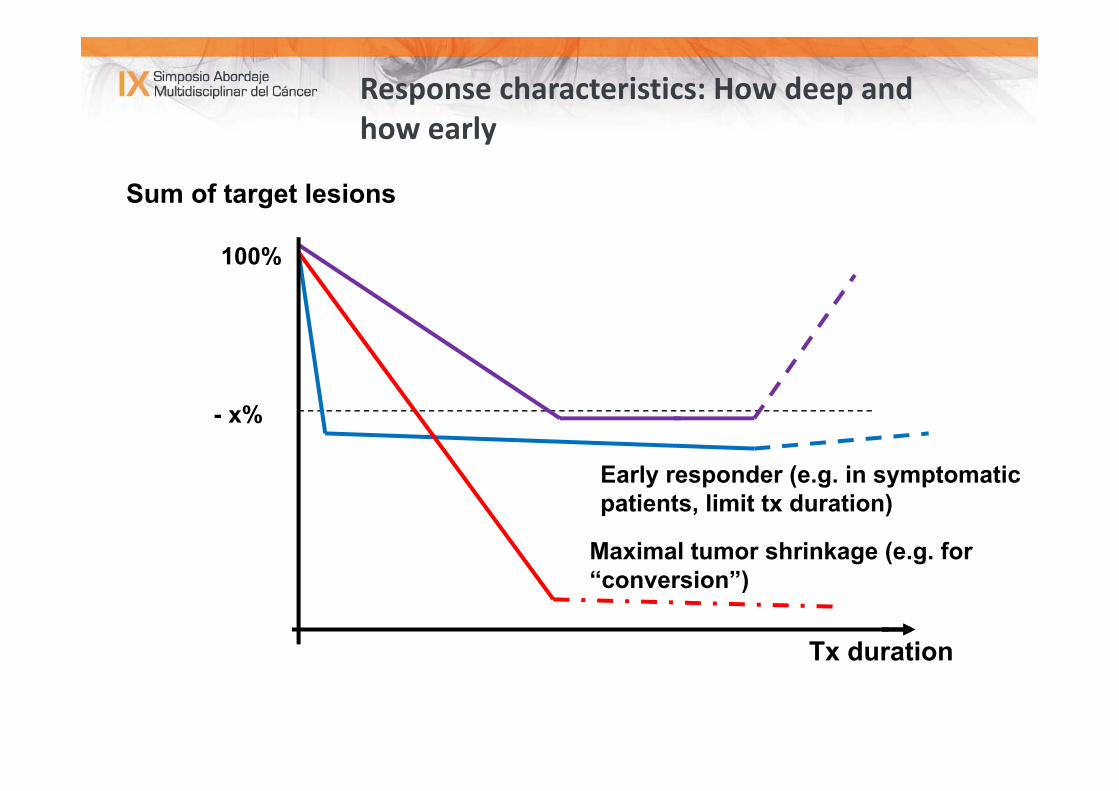
Response characteristics: How deep and how early
- x%
100%
Tx duration
Sum of target lesions
Early responder (e.g. in symptomatic patients, limit tx duration)
Maximal tumor shrinkage (e.g. for “conversion”)
Response characteristics: How deep and how early
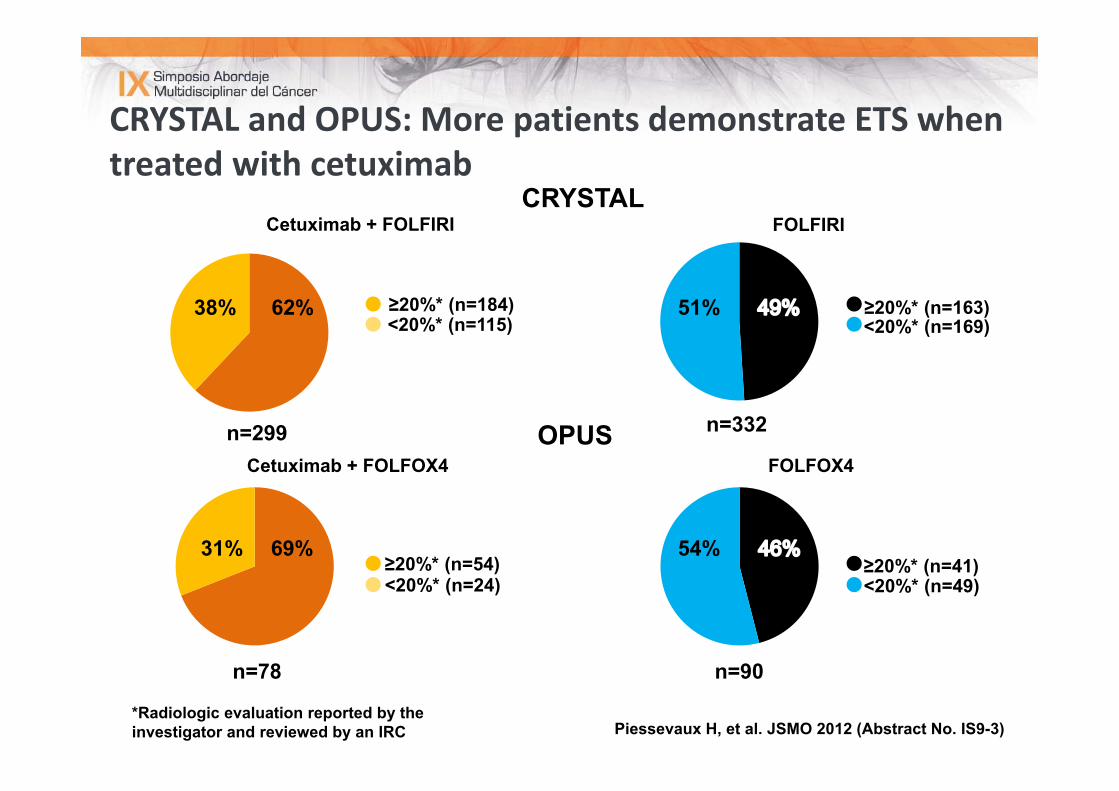
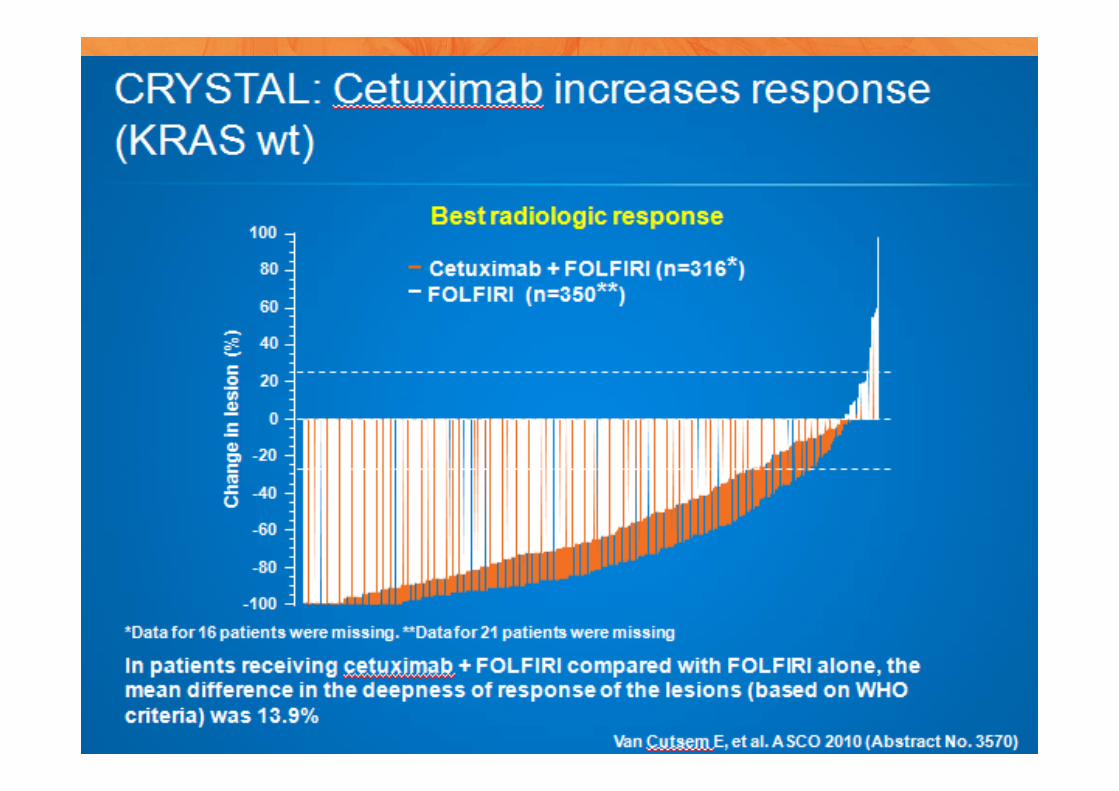
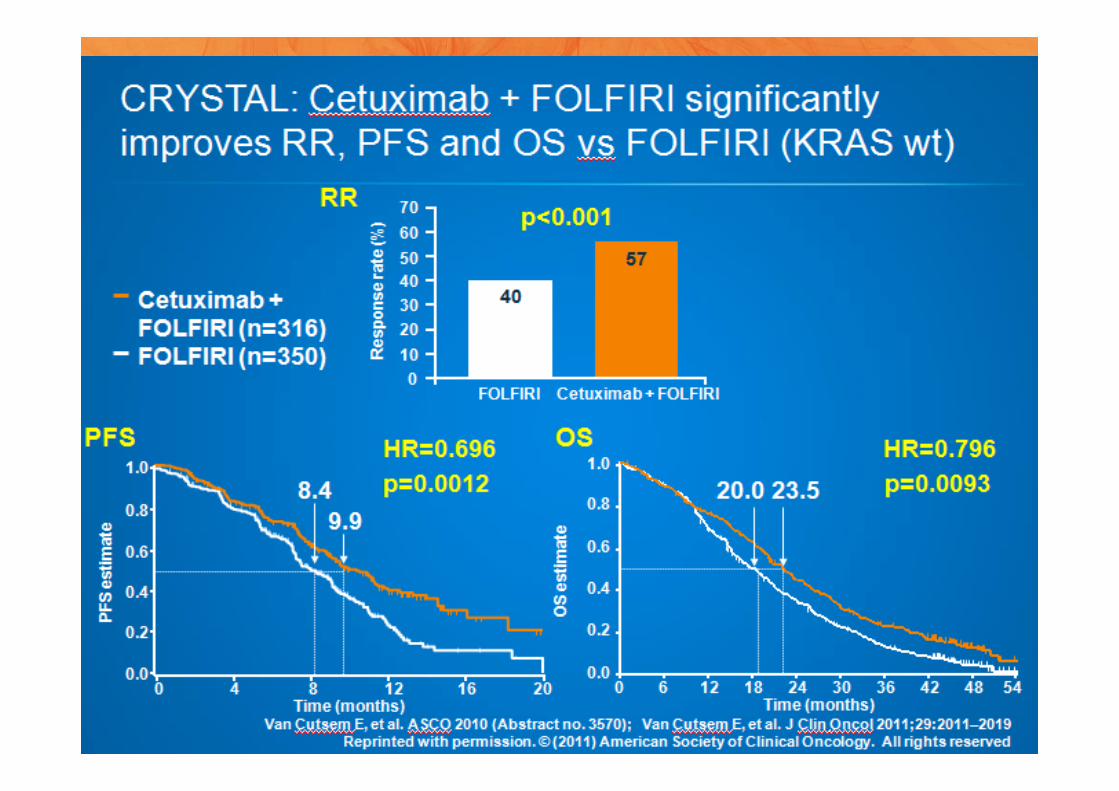
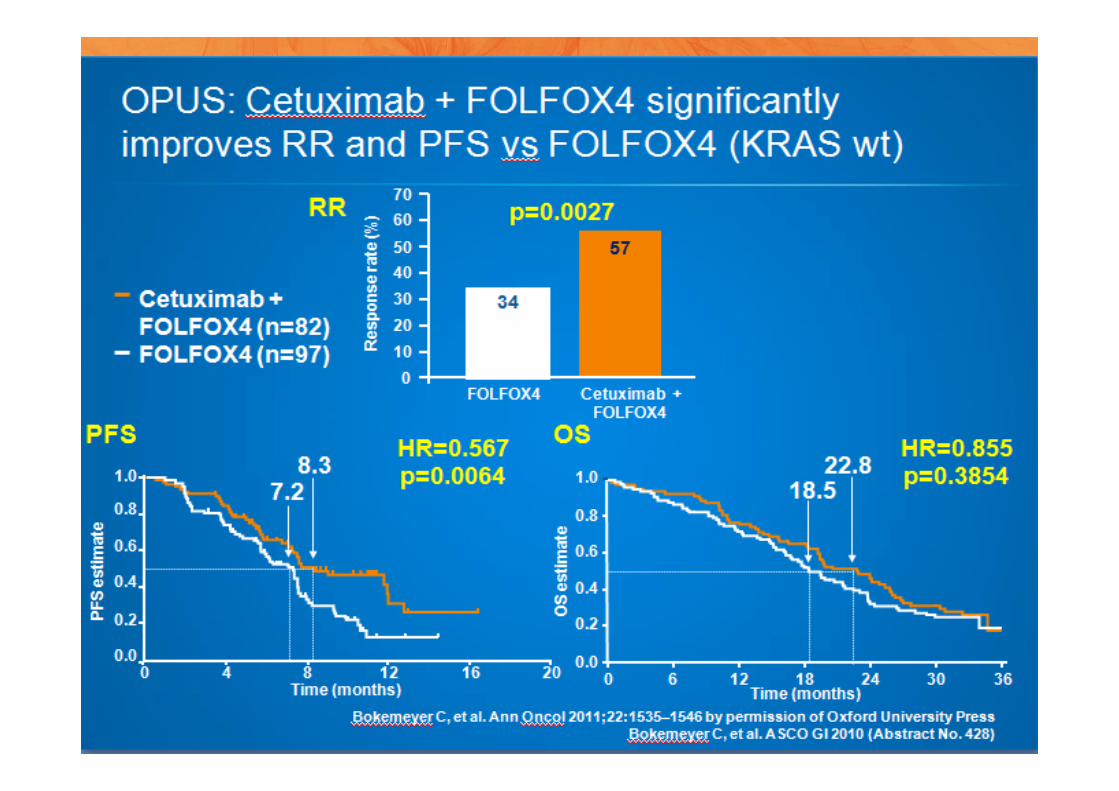
CRYSTAL and OPUS: More patients demonstrate ETS when treated with cetuximab
38% 62% 51%
54%31% 69%≥20%* (n=54)<20%* (n=24)
<20%* (n=115)≥20%* (n=184) ≥20%* (n=163)
<20%* (n=169)
≥20%* (n=41)<20%* (n=49)
FOLFIRI
Cetuximab + FOLFOX4 FOLFOX4
Cetuximab + FOLFIRI CRYSTAL
OPUS
Piessevaux H, et al. JSMO 2012 (Abstract No. IS9-3)*Radiologic evaluation reported by the investigator and reviewed by an IRC
n=332
n=90
n=299
n=78
mPFS 11.9 mo
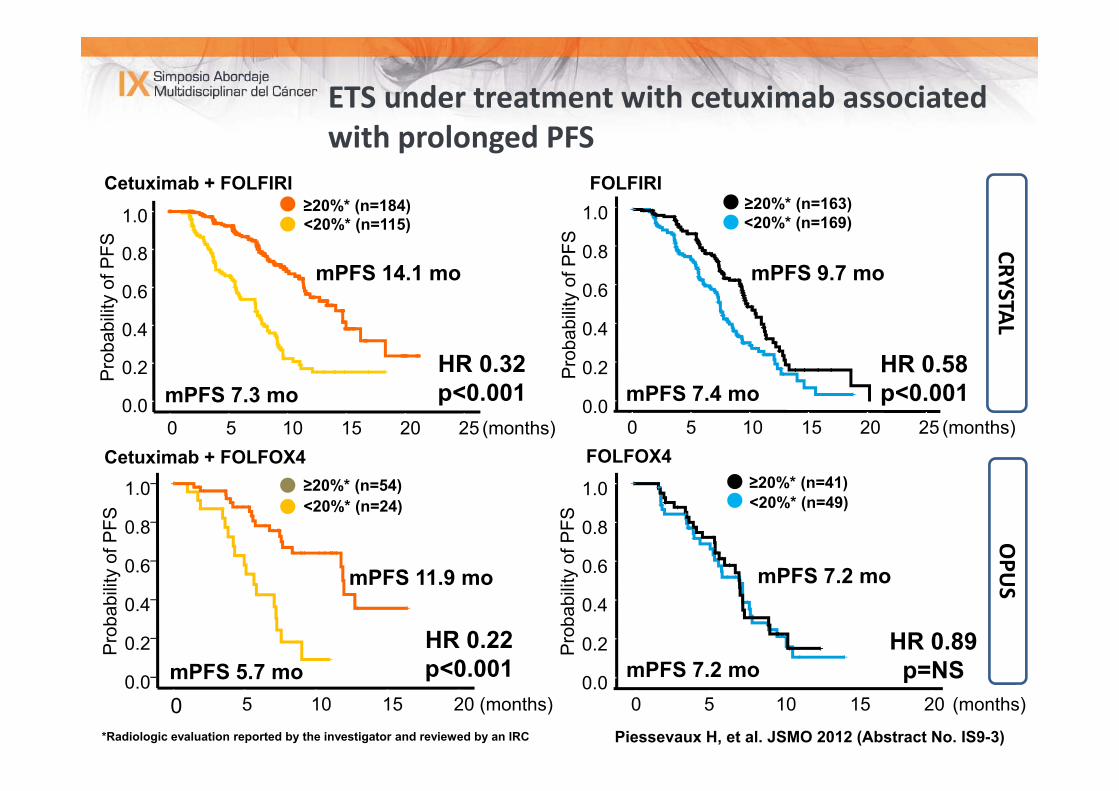
ETS under treatment with cetuximab associated with prolonged PFS
*Radiologic evaluation reported by the investigator and reviewed by an IRC
Cetuximab + FOLFIRI
(months)20151050
1.0
0.8
0.6
0.4
0.2
0.0
Pro
babi
lity
of P
FS
Cetuximab + FOLFOX4
Pro
babi
lity
of P
FS
(months)20151050
1.0
0.8
0.6
0.4
0.2
0.0
FOLFOX4 ≥20%* (n=54)<20%* (n=24)
≥20%* (n=41)<20%* (n=49)
mPFS 5.7 mo
mPFS 7.2 mo
mPFS 7.2 mo
FOLFIRI≥20%* (n=163)<20%* (n=169)
mPFS 9.7 mo
mPFS 7.4 mo
1.0
0.8
0.6
0.4
0.2
0.0
mPFS 14.1 mo
(months)2520151050
1.0
0.8
0.6
0.4
0.2
0.0
<20%* (n=115)≥20%* (n=184)
mPFS 7.3 mo
Pro
babi
lity
of P
FS
Pro
babi
lity
of P
FS
HR 0.32 p<0.001
HR 0.58 p<0.001
HR 0.22 p<0.001
HR 0.89p=NS
CRYSTALOPU
S
Piessevaux H, et al. JSMO 2012 (Abstract No. IS9-3)
(months)2520151050
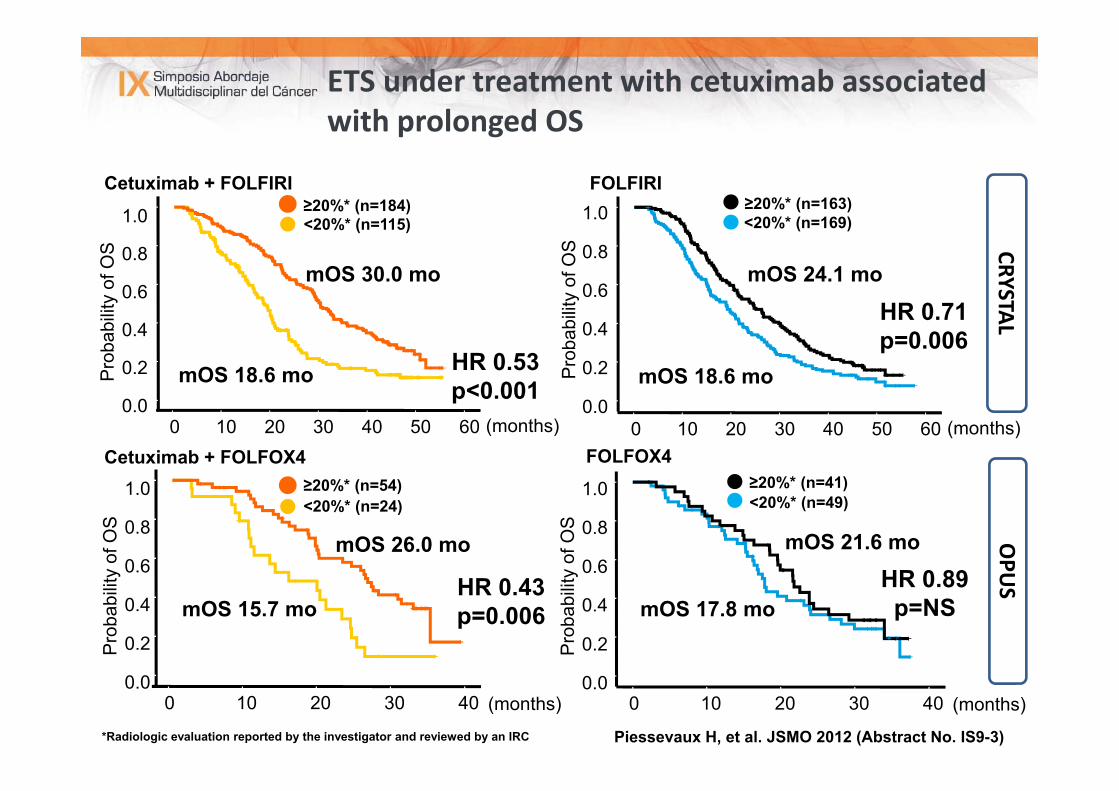
ETS under treatment with cetuximab associated with prolonged OS
mOS 30.0 mo
mOS 18.6 mo
mOS 24.1 mo
mOS 18.6 mo
mOS 26.0 mo
mOS 15.7 mo
mOS 21.6 mo
mOS 17.8 mo
HR 0.53 p<0.001
HR 0.71 p=0.006
HR 0.89p=NS
HR 0.43p=0.006
Pro
babi
lity
of O
S
Pro
babi
lity
of O
S
Pro
babi
lity
of O
S
Pro
babi
lity
of O
S
1.0
0.8
0.6
0.4
0.2
0.0
1.0
0.8
0.6
0.4
0.2
0.0
1.0
0.8
0.6
0.4
0.2
0.0(months)
1.0
0.8
0.6
0.4
0.2
0.0
*Radiologic evaluation reported by the investigator and reviewed by an IRC
Cetuximab + FOLFIRI
Cetuximab + FOLFOX4 FOLFOX4
FOLFIRI
CRYSTALOPU
S
≥20%* (n=54)<20%* (n=24)
≥20%* (n=41)<20%* (n=49)
≥20%* (n=163)<20%* (n=169)<20%* (n=115)
≥20%* (n=184)
Piessevaux H, et al. JSMO 2012 (Abstract No. IS9-3)
(months)6050403020100(months)6050403020100
403020100(months)403020100
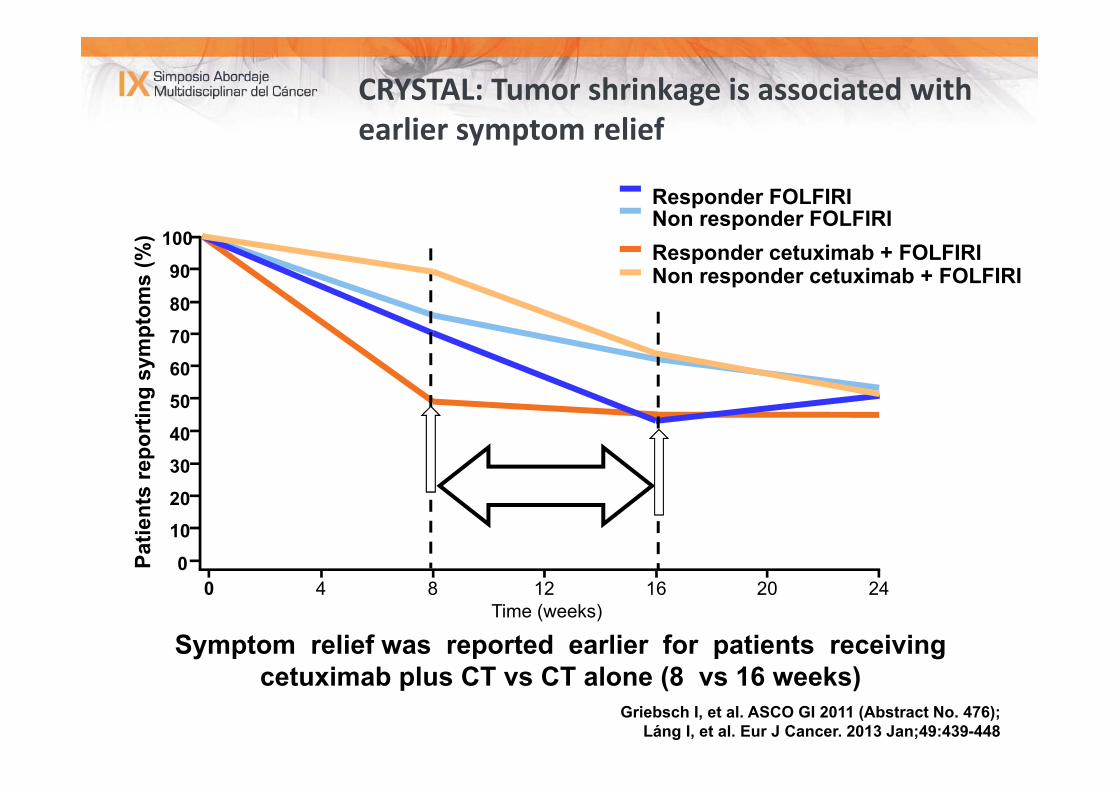
CRYSTAL: Tumor shrinkage is associated with earlier symptom relief
Responder FOLFIRINon responder FOLFIRIResponder cetuximab + FOLFIRINon responder cetuximab + FOLFIRI
Time (weeks)
Patie
nts
repo
rtin
g sy
mpt
oms
(%)
0 4 8 16 2012 24
100
90
80
70
60
50
4030
20
10
0
Griebsch I, et al. ASCO GI 2011 (Abstract No. 476);Láng I, et al. Eur J Cancer. 2013 Jan;49:439-448
Symptom relief was reported earlier for patients receiving cetuximab plus CT vs CT alone (8 vs 16 weeks)
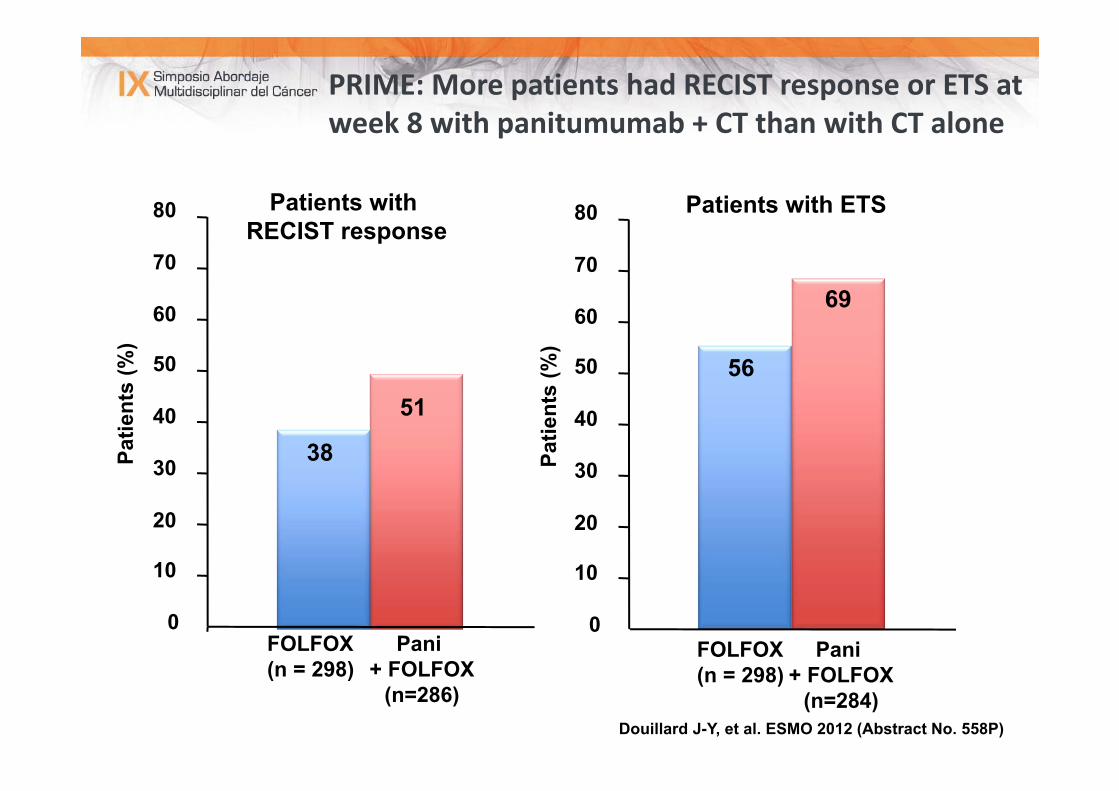
PRIME: More patients had RECIST response or ETS at week 8 with panitumumab + CT than with CT alone
Douillard J-Y, et al. ESMO 2012 (Abstract No. 558P)
39
51
0
10
20
30
40
50
60
70
80
38 39
69
0
10
20
30
40
50
60
70
80
56
Patients with RECIST response
Patients with ETS
Patie
nts
(%)
Patie
nts
(%)
FOLFOX(n = 298)
Pani + FOLFOX
(n=286)
FOLFOX(n = 298)
Pani + FOLFOX
(n=284)
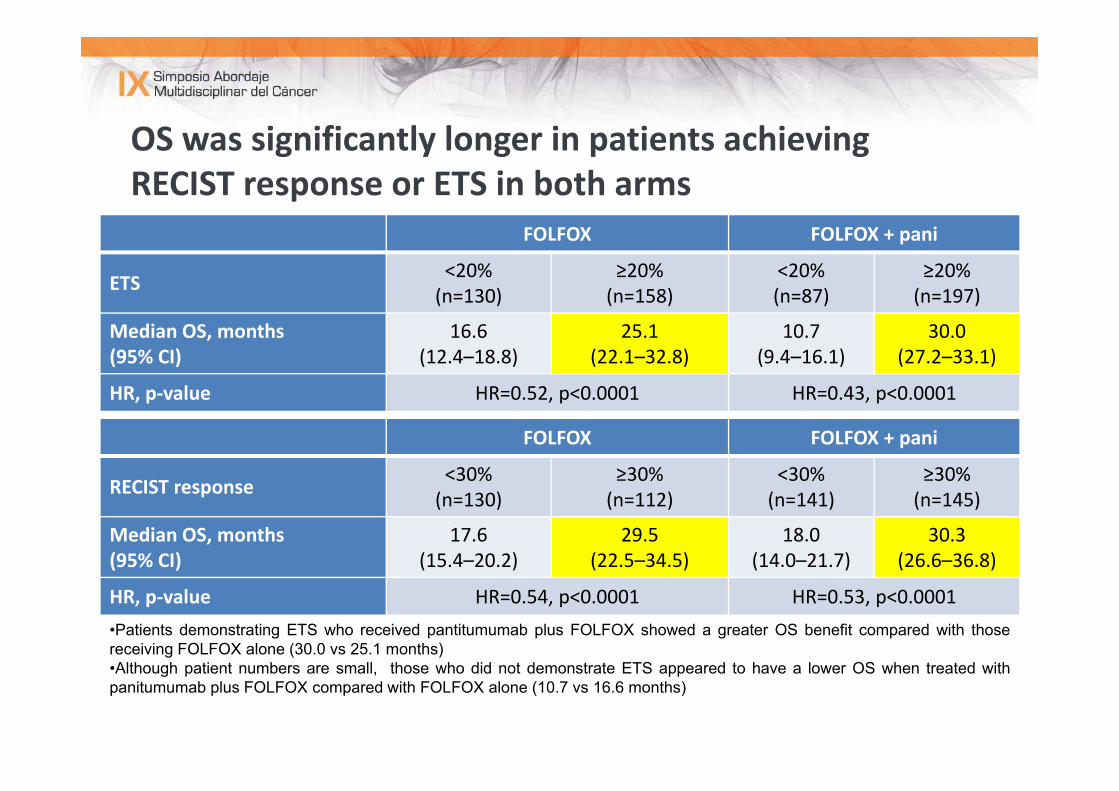
OS was significantly longer in patients achieving RECIST response or ETS in both arms
FOLFOX FOLFOX + pani
ETS <20%(n=130)
≥20%(n=158)
<20%(n=87)
≥20%(n=197)
Median OS, months (95% CI)
16.6(12.4–18.8)
25.1(22.1–32.8)
10.7(9.4–16.1)
30.0(27.2–33.1)
HR, p‐value HR=0.52, p<0.0001 HR=0.43, p<0.0001
Douillard J-Y, et al. ESMO 2012 (Abstract No. 558P)
FOLFOX FOLFOX + pani
RECIST response <30% (n=130)
≥30% (n=112)
<30%(n=141)
≥30%(n=145)
Median OS, months (95% CI)
17.6(15.4–20.2)
29.5(22.5–34.5)
18.0(14.0–21.7)
30.3(26.6–36.8)
HR, p‐value HR=0.54, p<0.0001 HR=0.53, p<0.0001•Patients demonstrating ETS who received pantitumumab plus FOLFOX showed a greater OS benefit compared with thosereceiving FOLFOX alone (30.0 vs 25.1 months)•Although patient numbers are small, those who did not demonstrate ETS appeared to have a lower OS when treated withpanitumumab plus FOLFOX compared with FOLFOX alone (10.7 vs 16.6 months)
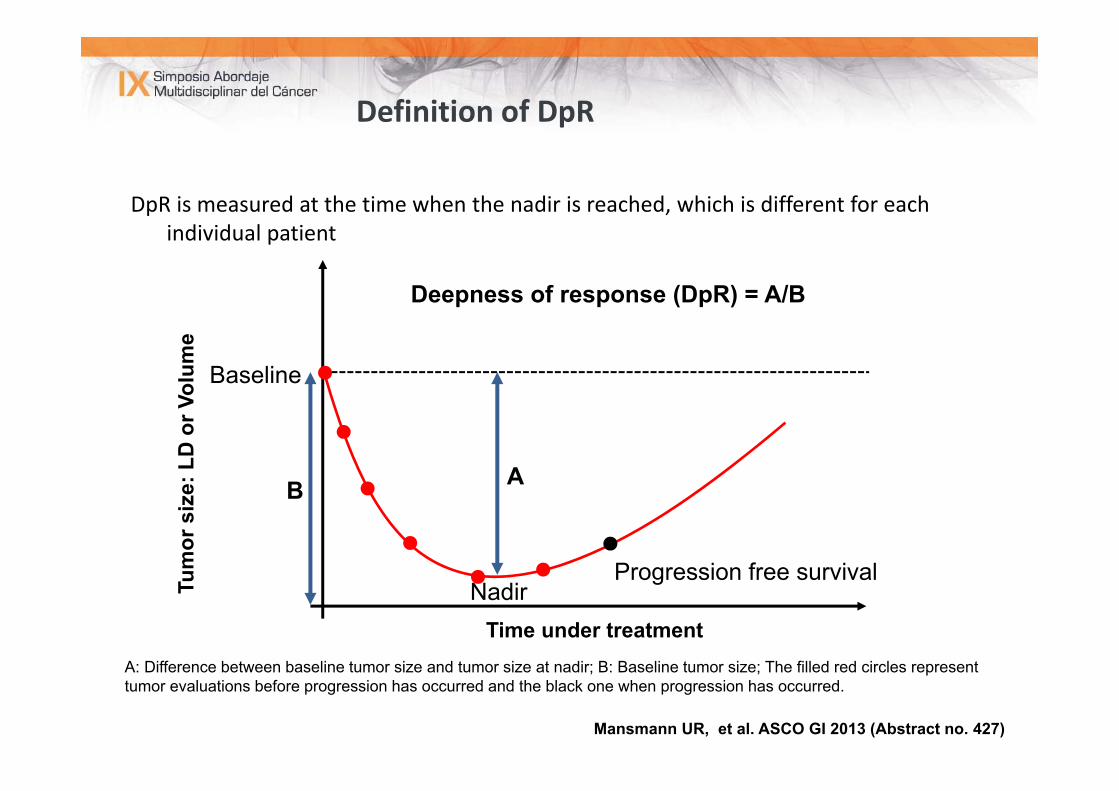
Definition of DpR
DpR is measured at the time when the nadir is reached, which is different for each individual patient
Mansmann UR, et al. ASCO GI 2013 (Abstract no. 427)
A: Difference between baseline tumor size and tumor size at nadir; B: Baseline tumor size; The filled red circles represent tumor evaluations before progression has occurred and the black one when progression has occurred.
Baseline
B A
NadirProgression free survival
Deepness of response (DpR) = A/B
Time under treatment
Tum
or s
ize:
LD
or V
olum
e
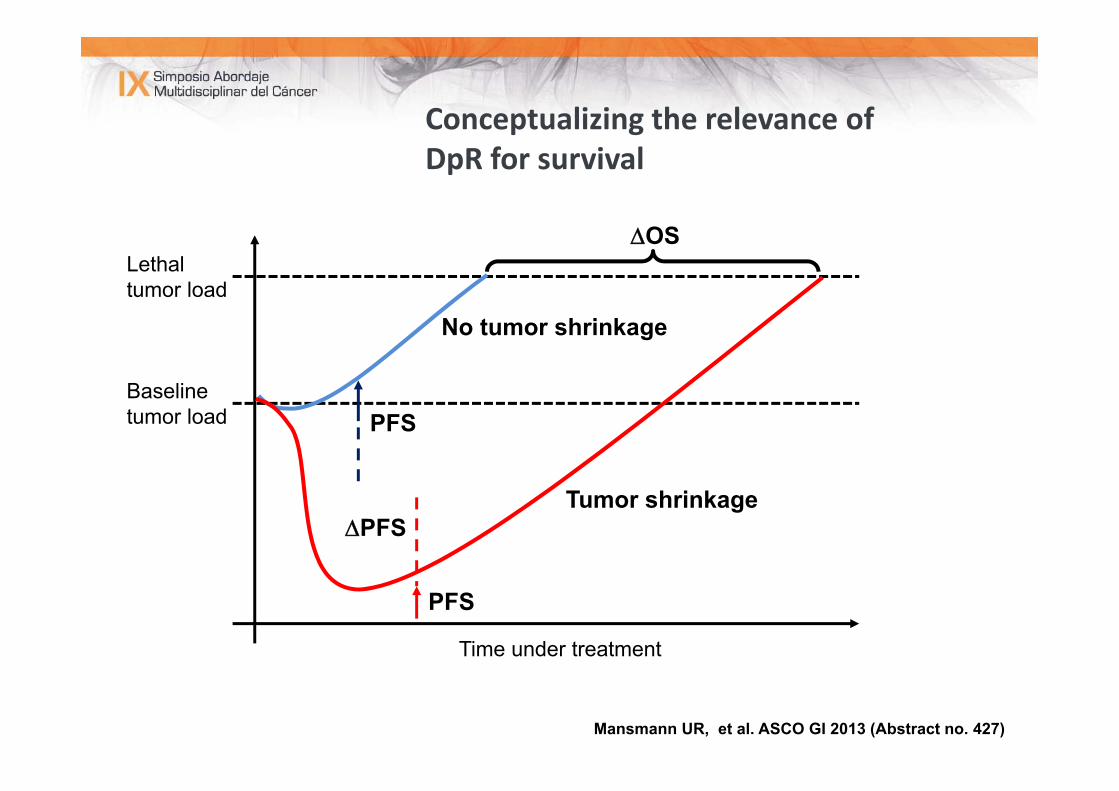
Conceptualizing the relevance of DpR for survival
Lethaltumor load
Baselinetumor load
Time under treatment
Tumor shrinkage
No tumor shrinkage
PFS
PFS
PFS
OS
Mansmann UR, et al. ASCO GI 2013 (Abstract no. 427)
HISTORIA ONCOLÓGICA (VIII)
• OCTUBRE 2011:• TAC toracoabdominopélvica con contraste oral e intravenoso (25/10/2011):
• Lengüeta de líquido pericárdico.• Reservorio en la pared torácica anterior derecha, con punta de catéterentre la vena cava superior y la aurícula derecha.
• Lesiones nodulares pulmonares milimétricas (la mayor de 4 mm en LID),inespecíficas.
• En hígado, múltiples lesiones compatibles con metástasis.• Útero miomatoso con calcificaciones.• Engrosamiento de la pared del sigma con cierto grado de estenosis enrelación con tumoración primaria.
• No adenopatías retroperitoneales ni mesentércias ni regionales en la zonade la neoplasia, aunque existen algunas calcificadas interaortocava.
New approach
Treatment goal ↓
Treatment strategy↓
Treatment intensity(best combination of targeted therapy and chemotherapy to achieve treatment goal)
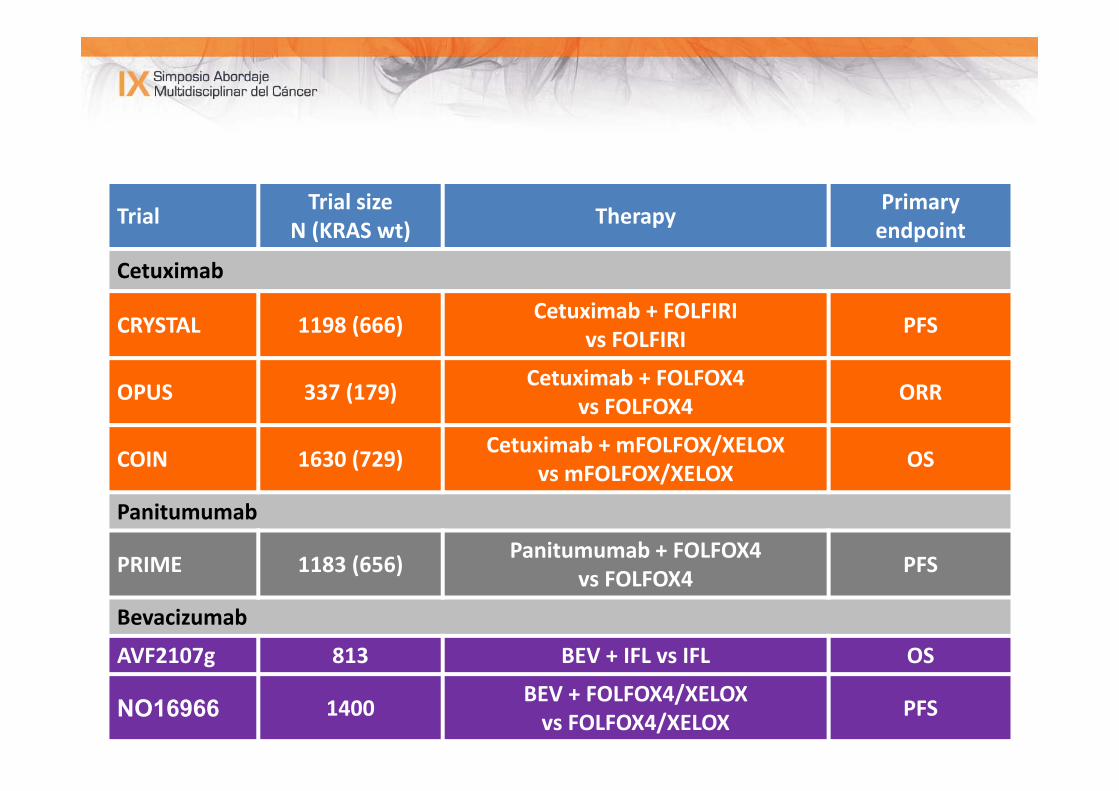
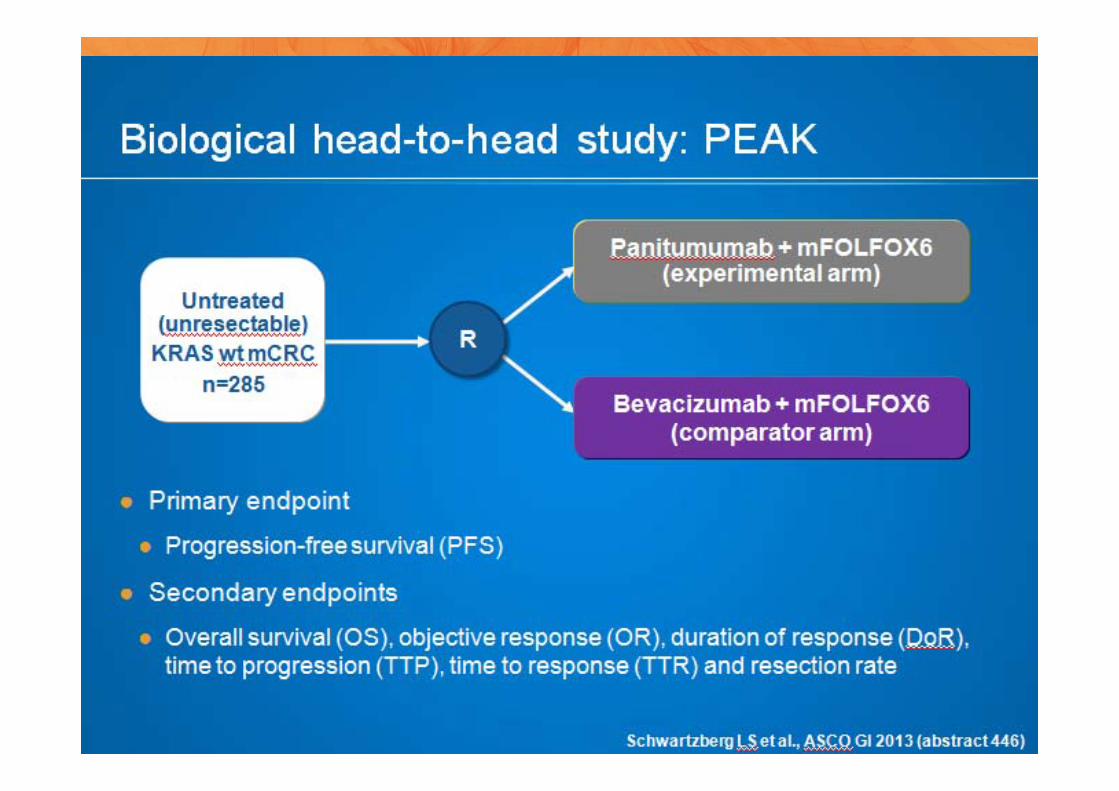
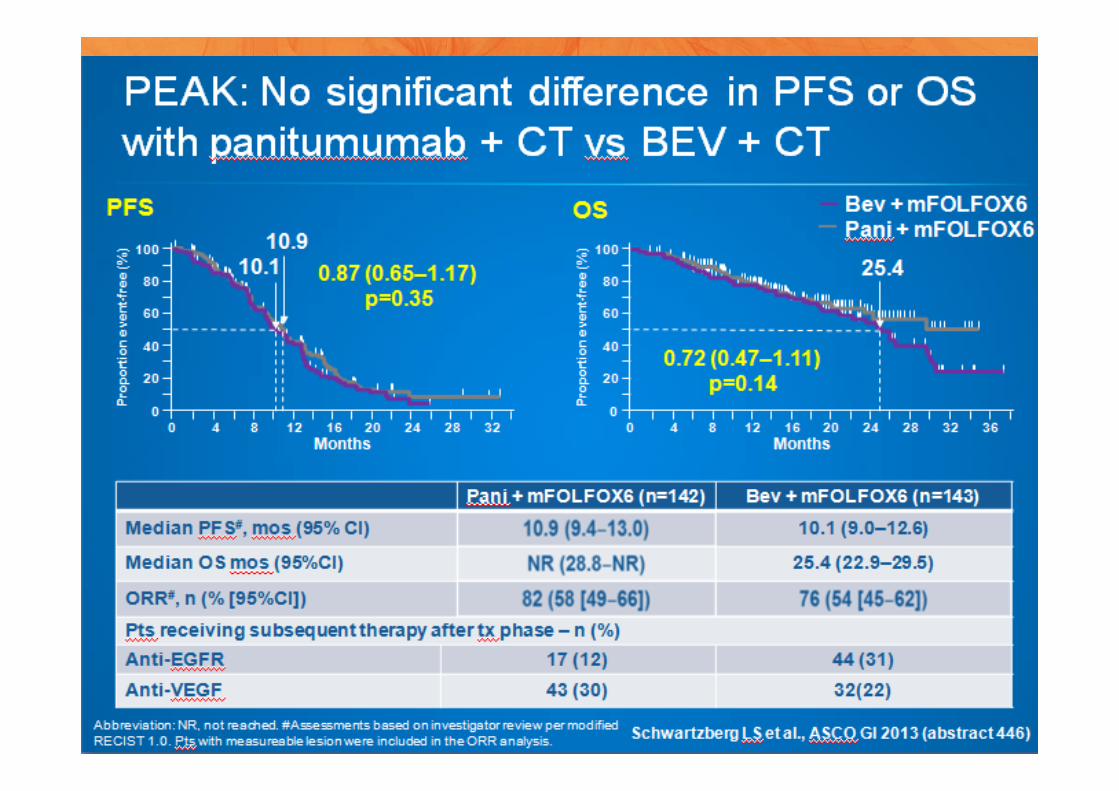
Trial Trial size N (KRAS wt) Therapy Primary
endpoint
Cetuximab
CRYSTAL 1198 (666) Cetuximab + FOLFIRI vs FOLFIRI PFS
OPUS 337 (179) Cetuximab + FOLFOX4vs FOLFOX4 ORR
COIN 1630 (729) Cetuximab + mFOLFOX/XELOXvs mFOLFOX/XELOX OS
Panitumumab
PRIME 1183 (656) Panitumumab + FOLFOX4vs FOLFOX4 PFS
Bevacizumab
AVF2107g 813 BEV + IFL vs IFL OS
NO16966 1400 BEV + FOLFOX4/XELOXvs FOLFOX4/XELOX PFS
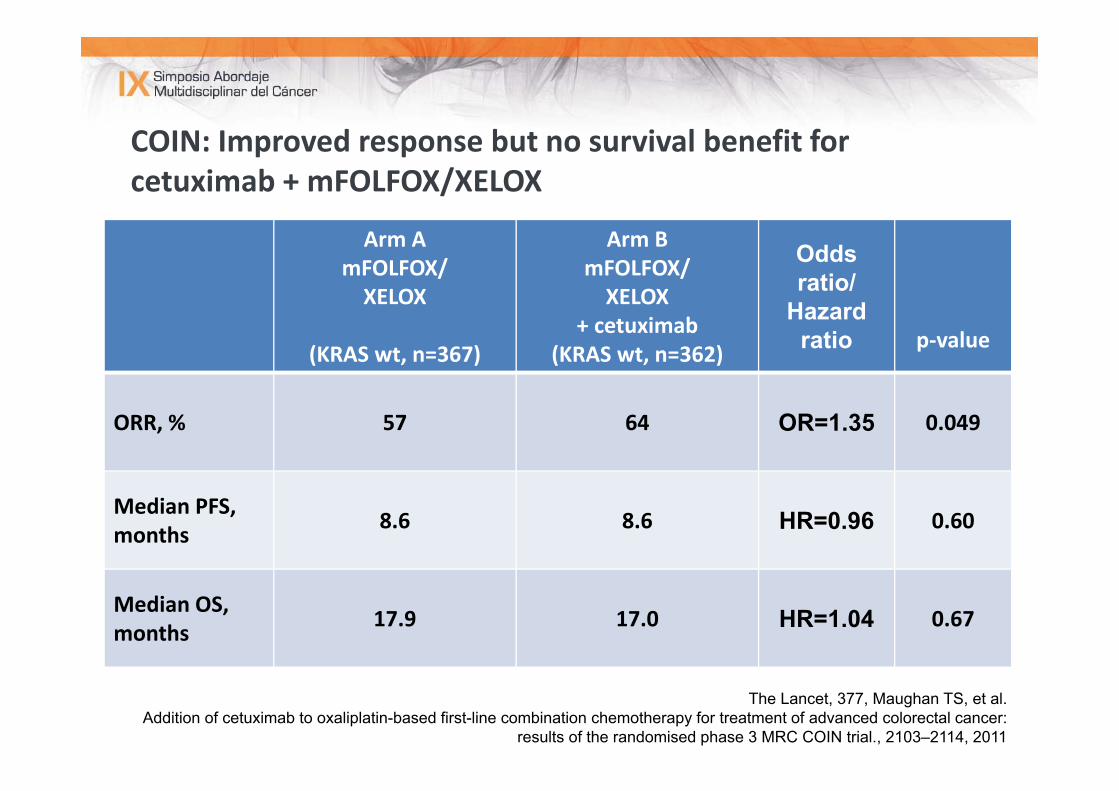
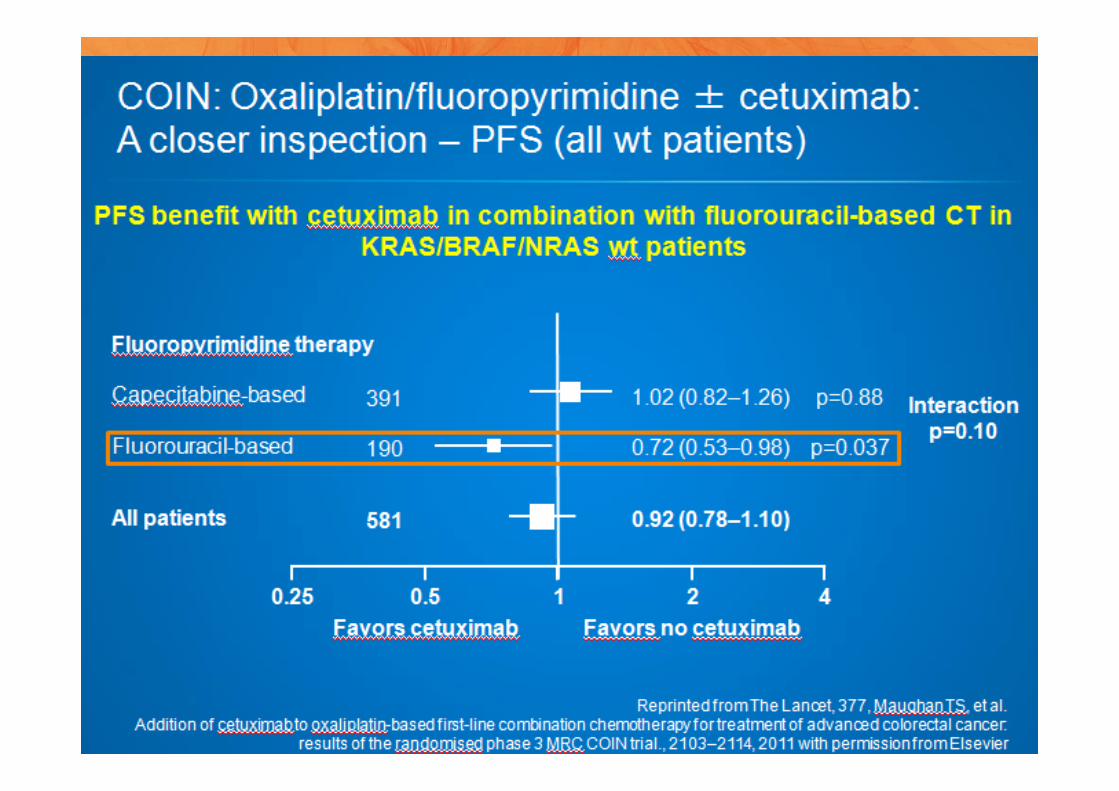
COIN: Improved response but no survival benefit for cetuximab + mFOLFOX/XELOX
Arm AmFOLFOX/XELOX
(KRAS wt, n=367)
Arm BmFOLFOX/XELOX
+ cetuximab(KRAS wt, n=362)
Odds ratio/
Hazard ratio p‐value
ORR, % 57 64 OR=1.35 0.049
Median PFS, months 8.6 8.6 HR=0.96 0.60
Median OS, months 17.9 17.0 HR=1.04 0.67
The Lancet, 377, Maughan TS, et al. Addition of cetuximab to oxaliplatin-based first-line combination chemotherapy for treatment of advanced colorectal cancer:
results of the randomised phase 3 MRC COIN trial., 2103–2114, 2011
MUCHAS GRACIAS