efecto de la frecuencia de ordeño sobre la producción ... · ganadería caprina al sostenimiento...
TRANSCRIPT

Alexandr Torres KrupijOctubre 2013
Efecto de la frecuencia de ordeñosobre la producción,
fraccionamiento lechero y parámetros de calidad
de la leche en las cabras canarias
Efect
o de l
a fre
cuen
cia d
e ord
eño s
obre
la pr
oduc
ción
, frac
cion
amie
nto l
eche
ro y
pará
met
ros d
e cal
idad
de la
lech
e en l
as ca
bras
cana
rias


Anexo II
UNIVERSIDAD DE LAS PALMAS DE GRAN CANARIA
Departamento: Instituto Universitario de Sanidad Animal y Seguridad Alimentaria
Programa de Doctorado: Sanidad Animal
Título de la Tesis
“EFECTO DE LA FRECUENCIA DE ORDEÑO SOBRE LA
PRODUCCIÓN, FRACCIONAMIENTO LECHERO Y PARÁMETROS
DE CALIDAD DE LA LECHE EN LAS CABRAS CANARIAS”
Tesis Doctoral presentada por D. Alexandr Torres Krupij
Dirigida por los Dres. D. Anastasio Argüello Henríquez y D. Juan Capote Álvarez
Las Palmas de Gran Canaria, a 15 de julio de 2013
Anastasio Argüello Henríquez
El Doctorando, El Director,
Alexandr Torres Krupij
El Director,
Juan Capote Álvarez

ANASTASIO ARGÜELLO HENRÍQUEZ, PROFESOR TITULAR DE
UNIVERSIDAD EN EL DEPARTAMENTO DE PATOLOGÍA ANIMAL,
PRODUCCIÓN ANIMAL, BROMATOLOGÍA Y TECNOLOGÍA DE LOS
ALIMENTOS DE LA FACULTAD DE VETERINARIA DE LA
UNIVERSIDAD DE LAS PALMAS DE GRAN CANARIA
INFORMA:
Que Alexandr Torres Krupij, Ingeniero Químico, ha realizado bajo mi
dirección y asesoramiento el presente trabajo titulado “EFECTO DE LA
FRECUENCIA DE ORDEÑO SOBRE LA PRODUCCIÓN,
FRACCIONAMIENTO LECHERO Y PARÁMETROS DE CALIDAD
DE LA LECHE EN LAS CABRAS CANARIAS” considerando que reúne
las condiciones y calidad científica para optar al grado de Doctor en
Veterinaria.
Las Palmas de Gran Canaria, julio 2013
Fdo. Anastasio Argüello Henríquez


JUAN CAPOTE ÁLVAREZ, DIRECTOR DE LA UNIDAD DE
PRODUCCIÓN ANIMAL, PASTOS Y FORRAJES DEL INSTITUTO
CANARIO DE INVESTIGACIONES AGRARIAS
INFORMA:
Que Alexandr Torres Krupij, Ingeniero Químico, ha realizado bajo mi
dirección y asesoramiento el presente trabajo titulado “EFECTO DE LA
FRECUENCIA DE ORDEÑO SOBRE LA PRODUCCIÓN,
FRACCIONAMIENTO LECHERO Y PARÁMETROS DE CALIDAD
DE LA LECHE EN LAS CABRAS CANARIAS” considerando que reúne
las condiciones y calidad científica para optar al grado de Doctor en
Veterinaria.
Las Palmas de Gran Canaria, julio 2013
Fdo. Juan Capote Álvarez


Alexandr Torres KrupijLas Palmas de Gran Canaria, Octubre 2013
FACULTAD DE VETERINARIA
TESIS DOCTORAL
EFECTO DE LA FRECUENCIA DE ORDEÑOSOBRE LA PRODUCCIÓN,
FRACCIONAMIENTO LECHEROY PARÁMETROS DE CALIDAD DE LA LECHE
EN LAS CABRAS CANARIAS


AGRADECIMIENTOSNi en estas líneas ni en un libro entero puedo plasmar mi gratitud a las personas e ins-tituciones que han hecho posible la realización de esta tesis. Soy de los que prefieren mostrar cotidianamente mi agradecimiento de muchas formas, sin necesidad de esperar al final para enumerar una a una las personas que han sido importantes en este trabajo. Sin embargo, me gustaría mencionar:
• AlINIAporlaoportunidaddefinanciarmidoctorado,sinlocual,hubiesesido prácticamente imposible continuar con la formación.
• Muchas gracias al equipo de trabajo del Departamento de ProducciónAnimaldelaULPGCyalaUnidaddeProducciónAnimal,PastosyForrajesdel ICIA. A los “jefes” de dichos grupos, por mostrarme las directrices a seguir y contribuir a lograr los objetivos pautados. A mis compañeros de laboratorio (estudiantes y personal técnico) por brindarme su amistad yayudadesinteresada.Porcompartirtantosmomentosagradables.Mesiento orgulloso de haber pertenecido a estos grupos.
• EspecialmentegraciasalpersonaldelaEscueladeCapacitaciónAgrariade Arucas, por hacer que mi estancia fuese tan entrañable, fueron como una familia para mí y nunca los olvidaré.
• Porúltimo,menciónespecialaesaspersonas,queaunquenopertenez-can a este mundo de cabras, experimentos-resultados y papers, me ani-maron en su momento a empezar un doctorado, a continuar cuando las fuerzas disminuían, y a darme el empujón final con alegría y esperanza. Graciasdecorazón.

Textos:Instituto Canario de Investigaciones Agrarias. Finca“Isamar”,Ctra.deElBoqueróns/n,ValleGuerra.LaLaguna.Tenerife.38270.Facultad de Veterinaria de la Universidad de Las Palmas de Gran Canaria. CampusUniversitariodeArucas.Arucas.35416.
Diseño y cuidado editorialMónicaPedrós
Fotografía de portadaFermín Correa

INDICEINTRODUCCIÓN 21
ARTÍCULO 1 69
ARTÍCULO 2 75
MANUSCRITO 3 83
MANUSCRITO 4 103
MANUSCRITO 5 123
CONCLUSIONES 145


INTRODUCCIÓN


INTRODUCCIÓN
21
1. El sector caprino
1.1. El caprino a nivel mundial
1.1.1.Generalidades
Lacabrafuedelosprimerosanimalesdomesticadosporelhombre,haceunos10500años,
contribuyendoaldesarrollode laagriculturaduranteelperiodoneolítico (Fernándezycol., 2006).
Desde entonces entró a formar parte de la alimentación del ser humano, proporcionándole leche
ycarne,ademásdepiel,peloyestiércol (VigneyHelmer, 2006). La importantecontribuciónde la
ganadería caprina al sostenimiento alimentario de la humanidad ha hecho que en la actualidad se
encuentre en regiones geográficas que difieren notablemente en clima, topografía y fertilidad, debido
asugranrusticidadyadaptabilidad(Devendra,1987).
Las cabras pueden adaptarse a una amplia gama de sistemas de intensificación que van de
un extremo al otro: por un lado, las razas lecheras mejoradas explotadas en condiciones intensivas
en las zonas templadas de Europa o América del Norte, en ciertas zonas favorables de clima tropical
húmedo,oensuperficiesirrigadasdeclimatropicalsecoy,porotrolado,laspoblacioneslocalesque
se mantienen en regiones muy áridas en las que los demás rumiantes difícilmente pueden resistir,
talescomolaszonasdesérticasdeÁfricaodelMedioOriente(BoyazogluyMorand-Fehr,1987).
1.1.2.Poblacióncaprinayproducciónlechera
La población caprina a nivel mundial ha incrementado su censo de forma importante durante
losúltimos40años,muchomásqueloscensosdebovinoyovino(Tabla1),locualsugiereelcreciente
interésporpartedelapoblaciónenlosproductoslácteosderivadosdelacabra(Dubeuf,2005).
Tabla 1. Población mundial de bovino, ovino y caprino en los últimos 40 años (millones de cabezas). (FAOSTAT, 2011).
Año Bovino Ovino Caprino2010 1427,5 1078,3 909,82000 1313,2 1059,7 751,41990 1298,4 1207,9 591,11980 1217,0 1098,7 464,31970 1081,6 1063,3 377,7

Efecto de la frecuencia de ordeño sobre la producción, fraccionamiento lechero y parámetros de calidad de la leche en las cabras canarias
22
Sinembargo, ladistribucióndelcaprinoesbastantedesigualanivelmundial.SegúnlaOr-
ganizacióndelasNacionesUnidasparalaAlimentaciónylaAgricultura(FAO),enelaño2011Asia
concentrabael61,6%delcensototal,mientrasqueÁfricacontabaconel31,6%.Encontraste,Europa
yAméricasólotienenel1,9%y4,3%,respectivamente.Así,paísescomoChina,India,Pakistán,Ban-
gladesh,yNigeria(Figura1)estánalacabezaencuantoapoblacióndecabras,representandoun
valioso sustento para numerosas familias de escasos recursos.
Figura1.Principalespaísesenpoblacióncaprinaenelaño2011.(FAOSTAT,2011).
DeacuerdoconlaFAO,laproduccióndelechedecabraenelmundoduranteelaño2011fue
deaproximadamente15millonesdetoneladas,loquerepresentóel2,2%deltotaldelalecheprodu-
cidaanivelmundial.Europa,consóloel5%deltotaldelganadocaprinolechero,produjocasiel20%
del volumen de leche total de esta especie. Cabe señalar, que en algunos países de África y Asia, las
estadísticas no registran el verdadero valor de la producción, debido a la dificultad para hacer los
censos, por la dispersión de los rebaños, y porque prácticamente toda la leche se destina al consumo
de la unidad familiar.
1.1.3.Biodiversidadcaprina
Entrelos900millonesdecabrasanivelmundial,untotalde570razashansidodefinidas.Los
paísesenvíasdedesarrolloconcentranel60%deltotaldelasrazas(Galal,2005).EnEuropaseen-
cuentran los genotipos con mayor producción lechera como la Saanen, Alpina, Nubia o Toggenburg
(Figura2).Sinembargoestecontinenteposeelamenordiversidadgenética,debidoalosprocesosde
mejora productiva, en los que han desaparecido las razas menos competitivas.

INTRODUCCIÓN
23
Figura2.Principalesrazascaprinaslecheras.A:Saanen;B:Alpina;C:Nubia;D:Toggenburg.(BreedStandards,www.dairygoatjournal.com).
1.2. El caprino en España
1.2.1.Generalidades
Durante muchos años, la cabra en España ha jugado un destacado papel en el abastecimiento
de leche para el consumo de la población. La leche obtenida era destinada al consumo familiar, mayo-
ritariamentedeformadirecta,aunqueunafracciónvariablesegúncasos,eratransformadaenqueso,
elaboradoen lapropiaexplotaciónpormétodosartesanales (Esteban-Muñoz,2008). Laganadería
caprina ha estado ligada tradicionalmente a zonas rurales poco productivas desde el punto de vista
agrícola, dado que las cabras tienen una gran capacidad para el aprovechamiento de los pastos de
escasa calidad. Esta característica ha hecho que el ganado caprino jugase un papel importante en el
mantenimientodezonasmarginalesydelapoblaciónasociadaaellas.Aúnhoyendía,enEspaña,el
86%delapoblacióncaprinaseencuentraenlasllamadasáreasmenosfavorecidas(Rancourtycol.,
2006),aunquelossistemasdeexplotaciónhancambiadosustancialmente.
1.2.2.Poblacióncaprinayproducciónlechera
EnEspaña,segúnlaFAO,lapoblacióndecaprinosdeaptitudlecheraseestimóalrededorde
los1,2millonesdecabezasenelaño2011.Laevolucióndelcensocaprinoenlosúltimos20años(Fi-
gura3)hasufridooscilacionessignificativas,comoconsecuencia,entreotrosaspectos,delavaria-
bilidadenlospreciosdelaleche.Sinembargo,laproducciónlecherasobrepasólas540000toneladas
enel2011,conunincrementoanualmediodel4%durantelasúltimasdosdécadas,principalmente
debido a la mejora genética y alimenticia, lo cual ha permitido optimizar el rendimiento lechero.
Efecto de la frecuencia de ordeño sobre la producción, fraccionamiento lechero y parámetros de calidad de la leche en las cabras canarias
24
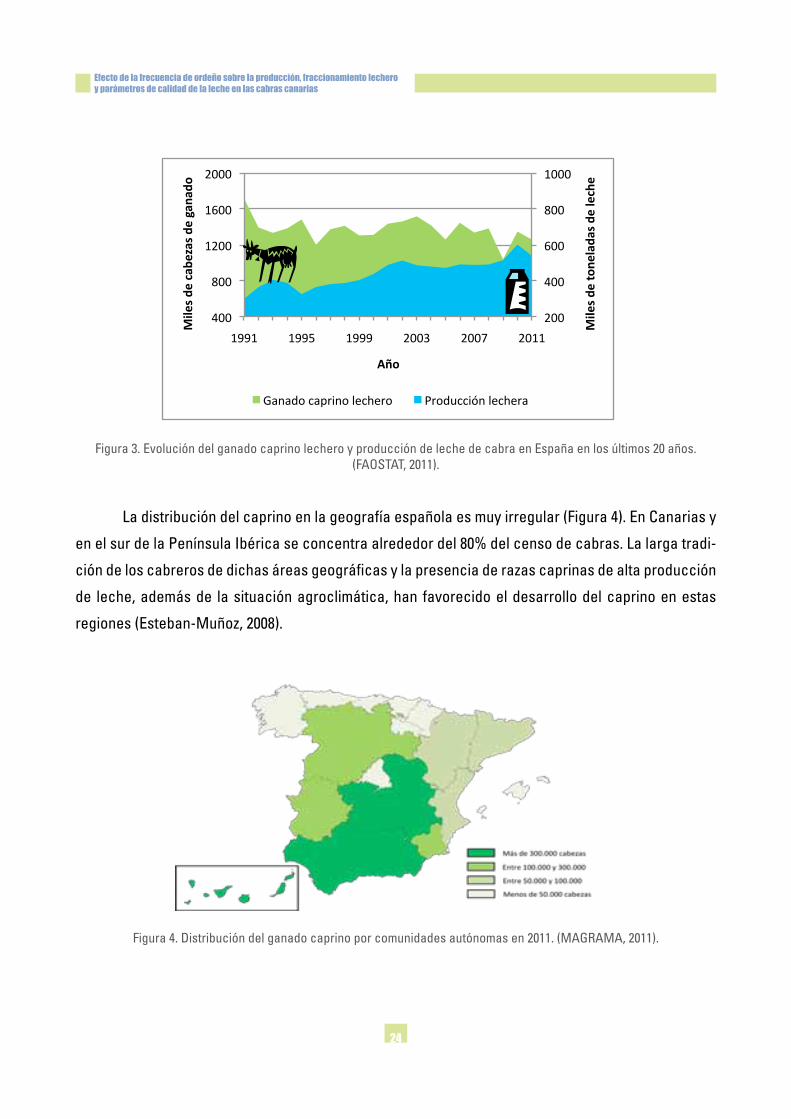
Figura3.EvolucióndelganadocaprinolecheroyproduccióndelechedecabraenEspañaenlosúltimos20años.(FAOSTAT,2011).
Ladistribucióndelcaprinoenlageografíaespañolaesmuyirregular(Figura4).EnCanariasy
enelsurdelaPenínsulaIbéricaseconcentraalrededordel80%delcensodecabras.Lalargatradi-
ción de los cabreros de dichas áreas geográficas y la presencia de razas caprinas de alta producción
de leche, además de la situación agroclimática, han favorecido el desarrollo del caprino en estas
regiones(Esteban-Muñoz,2008).
Figura4.Distribucióndelganadocaprinoporcomunidadesautónomasen2011.(MAGRAMA,2011).
Introducción
Página 9
Figura 3. Evolución del ganado caprino lechero y producción de leche de cabra en España en los últimos
20 años. (FAOSTAT, 2011).
La distribución del caprino en la geografía española es muy irregular (Figura 4).
En Canarias y en el sur de la Península Ibérica se concentra alrededor del 80% del censo
de cabras. La larga tradición de los cabreros de dichas áreas geográficas y la presencia
de razas caprinas de alta producción de leche, además de la situación agroclimática, han
favorecido el desarrollo del caprino en estas regiones (Esteban-Muñoz, 2008).
Figura 4. Distribución del ganado caprino por comunidades autónomas en 2011. (MAGRAMA, 2011).
200
400
600
800
1000
400
800
1200
1600
2000
1991 1995 1999 2003 2007 2011
Miles de
tone
lada
s de
leche
Miles de
cab
ezas de gana
do
Año
Ganado caprino lechero Producción lechera
INTRODUCCIÓN
25
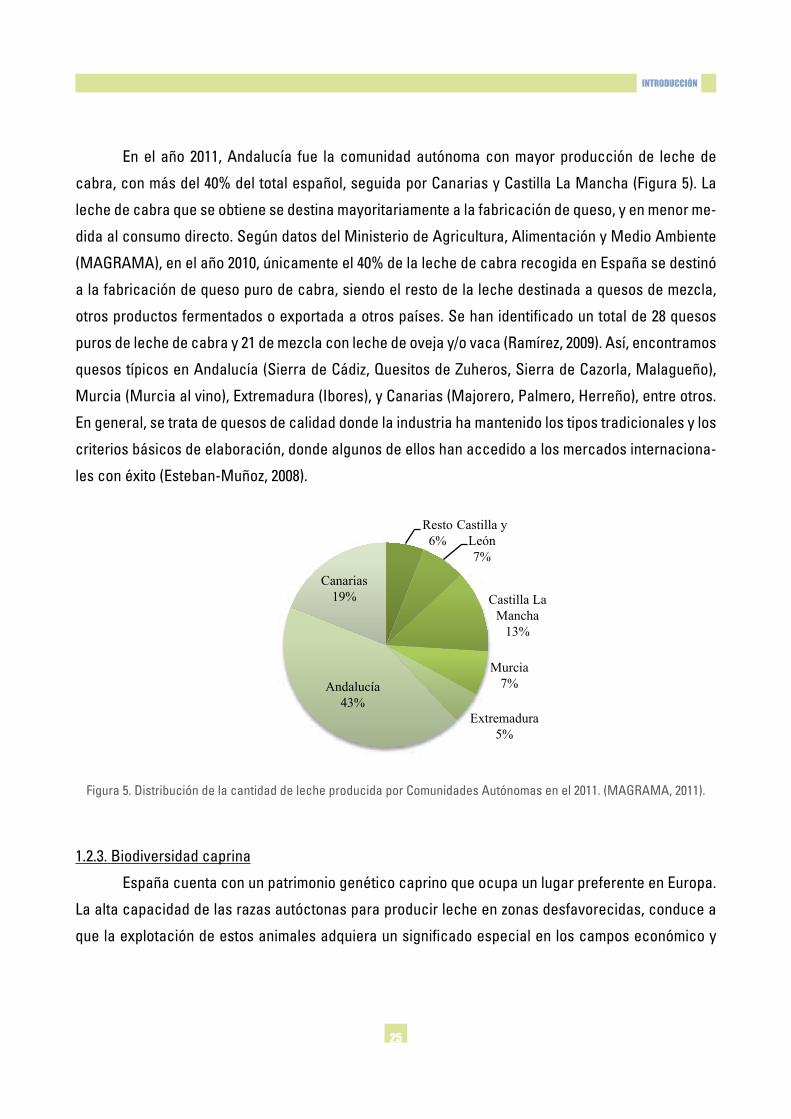
En el año 2011, Andalucía fue la comunidad autónoma con mayor producción de leche de
cabra,conmásdel40%deltotalespañol,seguidaporCanariasyCastillaLaMancha(Figura5).La
leche de cabra que se obtiene se destina mayoritariamente a la fabricación de queso, y en menor me-
didaalconsumodirecto.SegúndatosdelMinisteriodeAgricultura,AlimentaciónyMedioAmbiente
(MAGRAMA),enelaño2010,únicamenteel40%delalechedecabrarecogidaenEspañasedestinó
a la fabricación de queso puro de cabra, siendo el resto de la leche destinada a quesos de mezcla,
otrosproductosfermentadosoexportadaaotrospaíses.Sehanidentificadountotalde28quesos
purosdelechedecabray21demezclaconlechedeovejay/ovaca(Ramírez,2009).Así,encontramos
quesostípicosenAndalucía(SierradeCádiz,QuesitosdeZuheros,SierradeCazorla,Malagueño),
Murcia(Murciaalvino),Extremadura(Ibores),yCanarias(Majorero,Palmero,Herreño),entreotros.
En general, se trata de quesos de calidad donde la industria ha mantenido los tipos tradicionales y los
criterios básicos de elaboración, donde algunos de ellos han accedido a los mercados internaciona-
lesconéxito(Esteban-Muñoz,2008).
Figura5.DistribucióndelacantidaddelecheproducidaporComunidadesAutónomasenel2011.(MAGRAMA,2011).
1.2.3.Biodiversidadcaprina
España cuenta con un patrimonio genético caprino que ocupa un lugar preferente en Europa.
La alta capacidad de las razas autóctonas para producir leche en zonas desfavorecidas, conduce a
que la explotación de estos animales adquiera un significado especial en los campos económico y
Introducción
Página 10
En el año 2011, Andalucía fue la comunidad autónoma con mayor producción de
leche de cabra, con más del 40% del total español, seguida por Canarias y Castilla La
Mancha (Figura 5). La leche de cabra que se obtiene se destina mayoritariamente a la
fabricación de queso, y en menor medida al consumo directo. Según datos del
Ministerio de Agricultura, Alimentación y Medio Ambiente (MAGRAMA), en el año
2010, únicamente el 40% de la leche de cabra recogida en España se destinó a la
fabricación de queso puro de cabra, siendo el resto de la leche destinada a quesos de
mezcla, otros productos fermentados o exportada a otros países. Se han identificado un
total de 28 quesos puros de leche de cabra y 21 de mezcla con leche de oveja y/o vaca
(Ramírez, 2009). Así, encontramos quesos típicos en Andalucía (Sierra de Cádiz,
Quesitos de Zuheros, Sierra de Cazorla, Malagueño), Murcia (Murcia al vino),
Extremadura (Ibores), y Canarias (Majorero, Palmero, Herreño), entre otros. En general,
se trata de quesos de calidad donde la industria ha mantenido los tipos tradicionales y
los criterios básicos de elaboración, donde algunos de ellos han accedido a los mercados
internacionales con éxito (Esteban-Muñoz, 2008).
Figura 5. Distribución de la cantidad de leche producida por Comunidades Autónomas en el 2011.
(MAGRAMA, 2011).
Resto 6%
Castilla y León 7%
Castilla La Mancha
13%
Murcia 7%
Extremadura 5%
Andalucía 43%
Canarias 19%

Efecto de la frecuencia de ordeño sobre la producción, fraccionamiento lechero y parámetros de calidad de la leche en las cabras canarias
26
social(Castelycol.,2010).ElRealDecreto2129/2008,de26dediciembre,estableceelprogramana-
cional de conservación, mejora y fomento de las razas ganaderas. En el mismo se definen a las razas
autóctonas caprinas como de fomento o de protección especial.
LasrazasMurciano-GranadinayMalagueña(Figura6)quejuntoconlasrazasMajorera,Pal-
mera y Tinerfeña, se encuentran en expansión por su censo y organización, son las consideradas
comodefomento,mientrasqueelgrupodeprotecciónespecialcompuestoporotras16razas,entre
lasquedestacanlaPayoyaylaFlorida,disponenensuconjuntodeunapoblaciónreducida,debido
a una menor producción lechera, al fuerte aumento de los costes de producción, además de los pro-
blemasrelacionadosconlaescasezdecabreros(Esteban-Muñoz,2008).
Figura6.CabrasMurciano-Granadina(izquierda)yMalagueña(derecha).(MURCIGRANyCABRAMA).
1.3. El caprino en las Islas Canarias
1.3.1.Generalidades
En Canarias, la explotación caprina ha constituido tradicionalmente un importante recurso eco-
nómicoque,enépocasprehispánicas,llegóaserelmásimportantedelosaborígenes(Figura7)(Fresno
ycol.,1992).Elganadoqueellosmanejaban,deorigendesconocidohastaelmomento,lesservíacomo
fuente de alimentación (carne, leche) y les proporcionaba pieles, huesos e incluso productos con utili-
dadmedicinal(manteca).Esdesuponerqueestosanimales,constituíanunarazarústicamásomenos
uniforme, si bien existían por aquella época, dos tipos de ganado caprino, uno doméstico o “jairo”, y otro
salvajeo“guanil”,cuyosúltimosejemplaresdesaparecieronenladécadadeloscincuentadesuúltimo
reducto:LaCalderadeTaburienteenlaisladeLaPalma(Capoteycol.,1993).
INTRODUCCIÓN
27
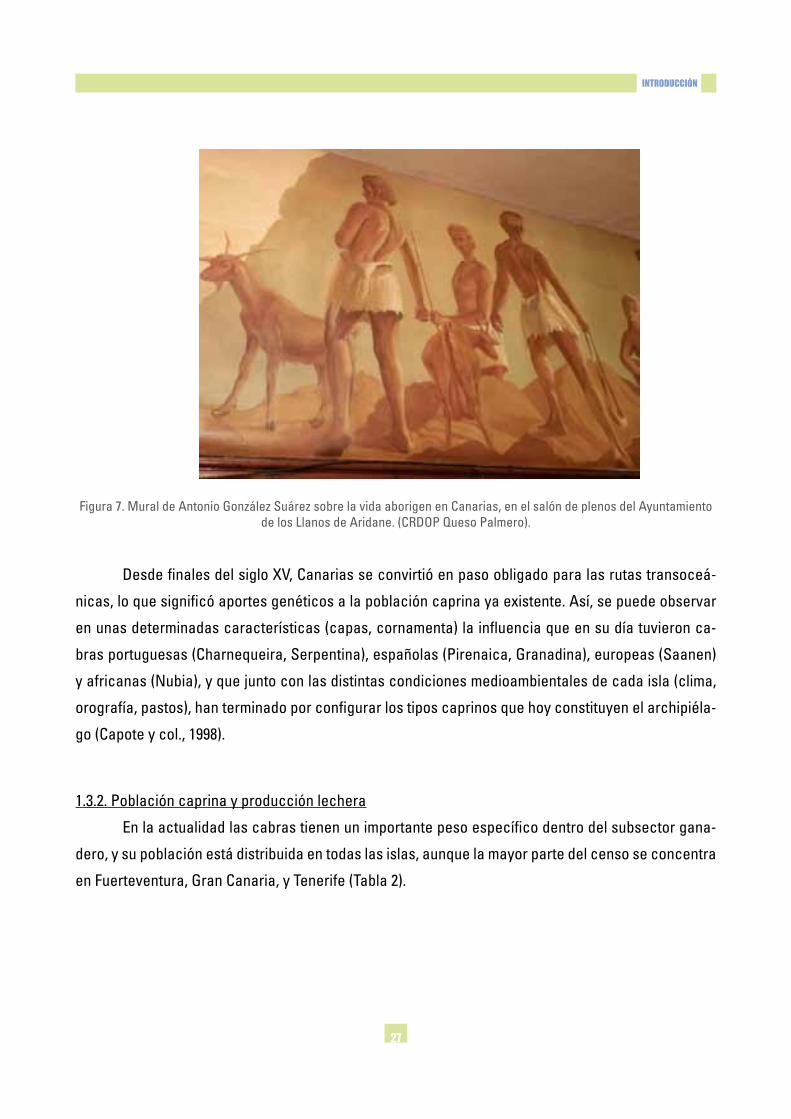
Figura7.MuraldeAntonioGonzálezSuárezsobrelavidaaborigenenCanarias,enelsalóndeplenosdelAyuntamientodelosLlanosdeAridane.(CRDOPQuesoPalmero).
Desde finales del siglo XV, Canarias se convirtió en paso obligado para las rutas transoceá-
nicas, lo que significó aportes genéticos a la población caprina ya existente. Así, se puede observar
en unas determinadas características (capas, cornamenta) la influencia que en su día tuvieron ca-
brasportuguesas(Charnequeira,Serpentina),españolas(Pirenaica,Granadina),europeas(Saanen)
y africanas (Nubia), y que junto con las distintas condiciones medioambientales de cada isla (clima,
orografía, pastos), han terminado por configurar los tipos caprinos que hoy constituyen el archipiéla-
go(Capoteycol.,1998).
1.3.2.Poblacióncaprinayproducciónlechera
En la actualidad las cabras tienen un importante peso específico dentro del subsector gana-
dero, y su población está distribuida en todas las islas, aunque la mayor parte del censo se concentra
enFuerteventura,GranCanaria,yTenerife(Tabla2).

Efecto de la frecuencia de ordeño sobre la producción, fraccionamiento lechero y parámetros de calidad de la leche en las cabras canarias
28
Tabla 2. Distribución de la cabaña caprina por islas en el año 2010. (Instituto Canario de Estadística, 2010).
Isla Nº Cabezas %Fuerteventura 116226 34,8GranCanaria 82742 24,8Tenerife 61434 18,4LaPalma 27651 8,3Lanzarote 24208 7,2LaGomera 11175 3,3El Hierro 10481 3,1
Enlasúltimasdécadas,elcaprinodelasislassehaexportadoaregionesmediterráneasy
tropicales donde se ha adaptado con bastante facilidad. Así, en países como Venezuela, la cabra
“Canaria”(Figura8),quenoesmásqueunaamalgamadelastresrazasdelasislas,conpredomi-
nanciadelarazaMajorera,estámuybienvaloradaporlosganaderosquedestacansurusticidady
altaproductividad.Porello,cercadel95%delasexplotacionesintensivasubicadasenesepaísem-
pleandicharaza(TorresyCapote,2011).Adicionalmente,larecienteintroduccióndecabrasderaza
MajoreraenSenegalylosrespectivosinformestécnicosconfirmanlaexcelenteadaptacióndeesas
cabrasalmedioambientesubsahariano(Capoteycol.,2012).
Figura8.Cabras,concrucedeCanaria,enunaexplotaciónganaderaenelestadoLaraenVenezuela.(TorresyCapote,2011).

INTRODUCCIÓN
29
SegúnelInstitutoCanariodeEstadística,en2010seprodujeronmásde85000toneladasde
lechedecabra,cuyafinalidadprincipalfuelaproduccióndequeso(Figura9),lamayorpartedelcual
se elabora con leche cruda usando métodos tradicionales y es consumido tras breves periodos de
maduración(7días)(Fresnoycol.,2008).Ademásdelariquezagenéticacaprinayforrajera,Canarias
tiene una excepcional situación sanitaria debido al estar oficialmente libre de brucelosis caprina y
ovina(Sánchez-Macíasycol.,2011),locualpermiteaaproximadamente500productoresartesanos
laventadequesosde lechecrudaconmenosde60díasdemaduración(FresnoyÁlvarez,2007).
Destacalaelaboracióndedosquesospurosdelechedecabra,MajoreroyPalmero,yunquesode
mezcladeovejaconlechedevacay/ocabra,el“QuesoFlordeGuíayQuesodeGuía”queposeen
DenominacióndeOrigenProtegida(DOP),aunqueenesteúltimocaso,lalechedecabrapuedeser
utilizadaenun10%comomáximo.
Figura9.Quesoscanarios.(ICCA).
1.3.3.Biodiversidadcaprina
Hastal985todoslostrabajospublicadosincluíanalosindividuosdelapoblacióncaprinaca-
naria dentro de una raza en la que se admitían las más variadas morfologías. Durante ese mismo
añosepublicóenelBoletínOficialdelEstado(BOE)laOrdenporlaqueseaprobabanlasnormas
reguladorasdelLibroGenealógicoydeComprobacióndeRendimientoparalaAgrupaciónCaprina

Efecto de la frecuencia de ordeño sobre la producción, fraccionamiento lechero y parámetros de calidad de la leche en las cabras canarias
30
Canaria,dondeseeliminóeltérmino“raza”.Capote(1985)postulólahipótesisdelaexistenciadetres
razasdiferenciadas,basadaenlaopinióndelosganaderos,ydenominadassegúnsuisladeorigen:
Majorera(Fuerteventura),Palmera(LaPalma),yTinerfeña(Tenerife),sibienestaúltimapodríaestar
divididaenotrasdosquesesituaríanenlafranjaNorte(húmeda)ySur(árida)delaisla.Posterior-
mente,losestudiosmorfológicos(Capoteycol.,1998)ygenéticos(Martínezycol.,2006)confirmaron
dichahipótesis.Elreconocimientodelastresrazas(Figura10)estárecogidoenelCatálogoOficialde
RazasdeGanadodeEspaña(BOE,OrdenAPA2420/2003,de28deagosto).
Figura10.Razascaprinascanarias.A:Majorera;B:Palmera;C:Tinerfeña.(GobiernodeCanarias).
A continuación se describen las tres razas caprinas canarias reconocidas oficialmente:
∑ Raza Majorera.
DebesunombrealaIsladeFuerteventura(Maxorataenlaépocaprehispánica)lugardonde
seformóydondeseencuentraelmayornúcleodeanimalesdelaraza,aunquesucríaseextiendepor
todaslasislasdelarchipiélago.Engeneral,lacabraMajoreraseadaptabienalosdiferentessiste-
mas de explotación, desde el pastoreo en zonas áridas, a la estabulación permanente, con elevados
rendimientos en la producción de leche.
Existe coincidencia en admitir que cuando llegaron los castellanos a las islas, a finales del
siglo XV, existía una población caprina adaptada al medio que había permanecido aislada genética-
mentedelrestodelmundo.Posteriormente, la llegadadenuevasetnias, incidieronsobreel fondo
genético de la población caprina prehispánica, dejando rasgos en la población actual de las islas y
querecuerdanatroncoscomoelPirenaicooelNubianoafricano(Amillsycol.,2004).

INTRODUCCIÓN
31
Elprototipo racial respondea lassiguientescaracterísticas (Figura11):Cabezade tamaño
grande, con perfil fronto-nasal recto o subconvexo, con orejas grandes e inclinadas hacia abajo. Los
cuernos pueden ser tipo prisca o de tipo aegagrus, en arco hacia atrás. La línea dorso-lumbar es rec-
ta. El pelo se presenta generalmente uniforme, corto y raso, y capa policromada. Ubre de color negro
o pizarra, tipo globosa o abolsada, de amplia inserción, con pezones bien diferenciados y, a veces de
implantaciónlateral(Esteban-Muñoz,2008).
Figura11.CabraMajorera.(FEAGAS).
LaproducciónmediadelascabrasderazaMajoreraesde551,3kgdelecheen210díasde
lactación.Porotraparte,unelevadoporcentajedecabrasmantienenduranteeseperiodounapro-
ducciónmediasuperiora2kgdelechepordía.Conunacomposiciónmediadelalechede:Grasa=
3,94%;Proteína=3,90%;Lactosa=4,55%;ExtractoSeco=13,19%(Fresno,1993).
Hay que tener en cuenta que una buena parte de la leche de estas cabras es destinada a la
elaboración de queso artesanal o industrial, el cual se consume después de unos días de oreo, o bien
se deja madurar largo tiempo, en ambiente templado y seco. El queso que se va a conservar más
tiempo puede untarse con aceite, pimentón y/o gofio, lo que le confiere características peculiares.
Su masa al corte aparece compacta, de textura cremosa y sabor acídulo y algo picante. Es de color
blanco,tomandounligerotonomarfileñoenquesoscurados(FresnoyÁlvarez,2007).
Efecto de la frecuencia de ordeño sobre la producción, fraccionamiento lechero y parámetros de calidad de la leche en las cabras canarias
32
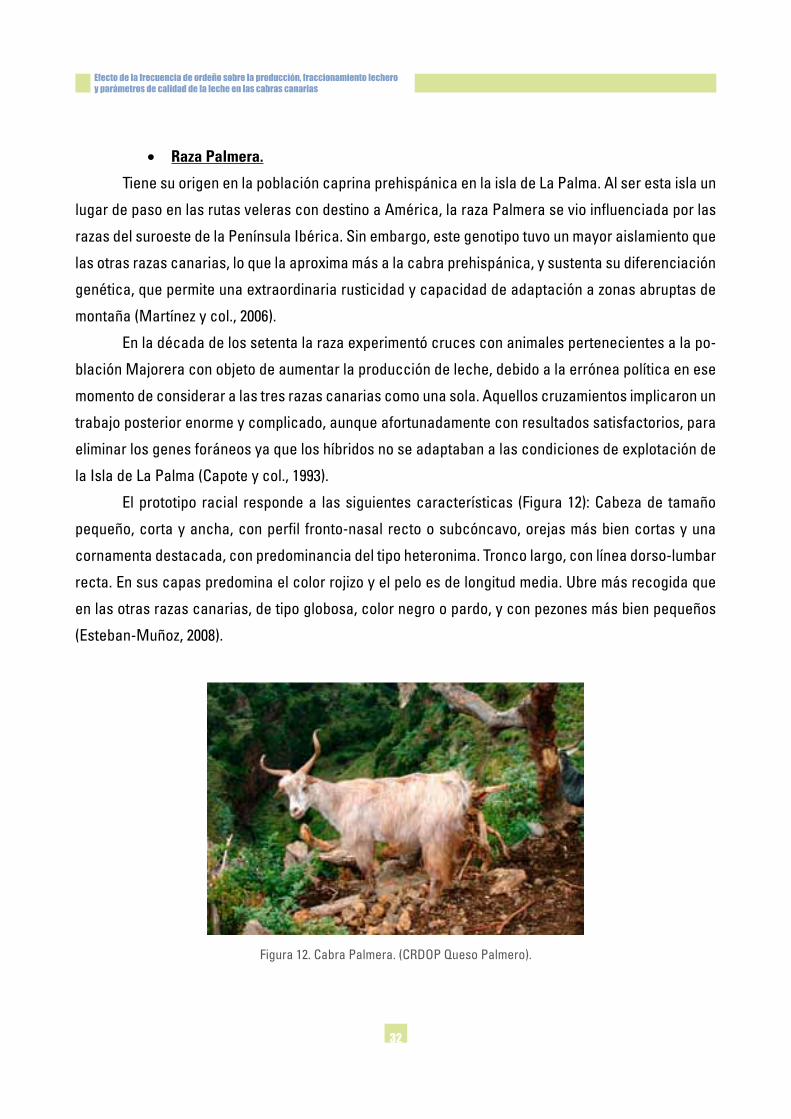
∑ Raza Palmera.
TienesuorigenenlapoblacióncaprinaprehispánicaenlaisladeLaPalma.Alserestaislaun
lugardepasoenlasrutasvelerascondestinoaAmérica,larazaPalmerasevioinfluenciadaporlas
razasdelsuroestedelaPenínsulaIbérica.Sinembargo,estegenotipotuvounmayoraislamientoque
las otras razas canarias, lo que la aproxima más a la cabra prehispánica, y sustenta su diferenciación
genética, que permite una extraordinaria rusticidad y capacidad de adaptación a zonas abruptas de
montaña(Martínezycol.,2006).
En la década de los setenta la raza experimentó cruces con animales pertenecientes a la po-
blaciónMajoreraconobjetodeaumentarlaproduccióndeleche,debidoalaerróneapolíticaenese
momento de considerar a las tres razas canarias como una sola. Aquellos cruzamientos implicaron un
trabajo posterior enorme y complicado, aunque afortunadamente con resultados satisfactorios, para
eliminar los genes foráneos ya que los híbridos no se adaptaban a las condiciones de explotación de
laIsladeLaPalma(Capoteycol.,1993).
Elprototipo racial respondea lassiguientescaracterísticas (Figura12):Cabezade tamaño
pequeño, corta y ancha, con perfil fronto-nasal recto o subcóncavo, orejas más bien cortas y una
cornamenta destacada, con predominancia del tipo heteronima. Tronco largo, con línea dorso-lumbar
recta. En sus capas predomina el color rojizo y el pelo es de longitud media. Ubre más recogida que
en las otras razas canarias, de tipo globosa, color negro o pardo, y con pezones más bien pequeños
(Esteban-Muñoz,2008).
Figura12.CabraPalmera.(CRDOPQuesoPalmero).

INTRODUCCIÓN
33
Laproducciónmediatipificadaa210díasdelactación,esde362,6kgdeleche,conunapro-
duccióndegranpersistencia,loquepermiteampliarelperiododelactacióna240-270días.Lacalidad
mediadelalecheesde:Grasa=4,06%;Proteína=4,21%;Lactosa=4,66%;ExtractoSeco=13,75%
(Fresno,1993).
LaproduccióndelechedelacabraPalmeravadestinadaalafabricacióndequesodetipo
artesanal. Se trata de un queso graso o extragraso, elaborado con leche cruda y entera, y se co-
mercializatantotierno(de8a20días),comosemicurado(21a60días)ycurado(apartirde60días).
El sabor es franco y láctico, muy mantecoso y con un ligero y agradable aroma ahumado (Fresno y
Álvarez,2007).
∑ Raza Tinerfeña.
SibienenelCatálogoOficialesconsideradacomounaúnicapoblación,estudiosmorfoló-
gicos y genéticos señalan suficientes evidencias para considerar dos grupos independientes en el
norteysurdelaisladeTenerife(Capoteycol.,1998;Martínezycol.,2006).Así,existiríaelecotipo
Norte, con gran influencia del tronco pirenaico, y el ecotipo Sur, reducido en pureza por sus cruces
concabraMajorera.Aligualquelasotrasdosrazas,lacabraTinerfeñapresentaunagranrusticidad
y elevada aptitud para la producción de leche.
Elprototiporacialtienelassiguientescaracterísticas(Figura13):Cabezadetamañopropor-
cionado con el cuerpo, el ecotipo Norte dispone de un perfil fronto-nasal recto o subconvexo, mien-
trasqueenelSurcasisiempreesrecto.Ambastienencornamentatipoprisca.Orejasdegrantama-
ño, inclinadas hacia abajo en las cabras del Norte, y de menor tamaño en cabras de la zona Sur. Los
caprinos del Norte se caracterizan por presentar pelo largo y colores oscuros, principalmente negro
y con alguna frecuencia castaño. Los caprinos del Sur tienen el pelo corto y disponen de una capa
multicolor.Laubredeestascabras,engeneralpresentanuntiposimilaraldelacabraMajorera,con
pezones pequeños y situados con alguna frecuencia en posición lateral. En la cabra Tinerfeña Norte,
la forma de la ubre, frecuentemente globosa, es más adecuada para el ordeño mecánico en lo refe-
rentealtamañoyposicióndelospezones,quesuhomólogadelSur(Esteban-Muñoz,2008).
LosvaloresasignadosalaproduccióndelechedecabraTinerfeñaen210díasdelactación,
esde421,0kgdeleche,conunacomposiciónde:Grasa=3,91%;Proteína=3,79%;Lactosa=4,46%;
ExtractoSeco=13,13%(Fresno,1993).EnlaisladeTenerife,seelaboraelQuesodeTenerife,obtenido

Efecto de la frecuencia de ordeño sobre la producción, fraccionamiento lechero y parámetros de calidad de la leche en las cabras canarias
34
con leche cruda de cabra. Se trata de un queso de graso a extragraso y que se consume preferente-
mente fresco o ligeramente curado, de color blanco intenso y brillante, y sabor muy fresco y acidula-
do,ligeramentesaladoygrasolechosoalpaladar(FresnoyÁlvarez,2007).
Figura13.Cabra Tinerfeña Norte. (ACRICATI).
2. La leche de cabraEn términos generales, la leche de cabra es un líquido blanco opaco, de un sabor ligeramente
azucarado, cuyo olor es poco marcado cuando es recogida con limpieza de animales que tengan un
buen estado de salud. La consistencia es uniforme sin grumos ni copos. De la calidad de la leche
empleada en queserías va a depender gran parte el éxito de las transformaciones y la calidad del
producto final. Nutricionalmente, la leche de cabra es una fuente de proteínas de alto valor biológi-
co y ácidos grasos esenciales, además de minerales y vitamina A. Es de gran importancia para los
infantes por su alto valor nutricional, hipoalergenicidad, así como por su alta digestibilidad debido al
pequeño tamaño de los glóbulos de grasa. Algunos autores han resaltado las propiedades saludables
delalechedecabra(Silanikoveycol.,2010)ysusproductosderivados(RibeiroyRibeiro,2010),justi-
ficando su alta calidad y los beneficios de su consumo. Además, la población del mundo desarrollado
no se preocupa especialmente sobre el costo de los productos en el mercado si al consumir deriva-

INTRODUCCIÓN
35
doslácteosdecabraspuedeobtenerbeneficiosparalasalud(Mowlen,2005).Actualmenteexisten
revisionesquehanprofundizadoenlascaracterísticasfísico-químicas(Parkycol.,2007),reológicas
(Park,2007)ehigiénico-sanitarias(Raynal-Ljutovacycol.,2007)delalechedecabra.
2.1. Composición químicaLa leche está compuesta principalmente, además del agua, por materia grasa, proteínas,
lactosa, sales minerales, vitaminas, y enzimas. La composición varía apreciablemente de acuerdo a
algunos factores como la raza, la alimentación, el período de lactación, la frecuencia de ordeño, el
estado sanitario de la cabra, entre otros.
2.1.1.Grasa
El contenido de grasa es el componente más variable cuantitativa y cualitativamente en la
leche. Los glóbulos de grasa de la leche de cabra son en general más pequeños y más finos que en
lalechedevaca(3,5vs.4,6µm,respectivamente)(Park,2006).Acausadesureducidotamañoyla
uniformidad de su distribución, los glóbulos de la leche de cabra ingerida quedan más dispersos y,
como resultado, las enzimas digestivas humanas, al actuar sobre ellos, los desintegran de forma más
rápida y completa.
No se han encontrado diferencias apreciables en el mecanismo de secreción de los glóbulos
de grasa en cabra, oveja y vaca, teniendo estos glóbulos una estructura y composición similar entre
lastresespecies(Scolozziycol.,2003).Respectoalosácidosgrasosqueformanpartedelaleche
decabra,cincodeellosrepresentanmásdel75%:cáprico(C10:0),mirístico(C14:0),palmítico(C16:0),
esteárico(C18:0)yoleico(C18:1)(Chilliardycol.,2006).
2.1.2.Proteína
En cuanto a las proteínas de la leche, éstas se dividen habitualmente como caseínas y pro-
teínas séricas, aunque se pueden encontrar otras proteínas minoritarias, como inmunoglobulinas,
lactoferrina, transferrina, ferritina, peptona proteasa, prolactina, etc. El contenido total de proteínas
es uno de los principales criterios de calidad usados como sistema de pago de la leche de cabra en
muchospaíses(Pirisiycol.,2007).

Efecto de la frecuencia de ordeño sobre la producción, fraccionamiento lechero y parámetros de calidad de la leche en las cabras canarias
36
Engeneral,laß-caseínaeslaprincipalcaseínaenlalechedecabra(Tziboula-Clarke,2003).
Laproporcióndelas4caseínasmayoritariasenlalechedecabraestádeterminadaporpolimorfis-
mos genéticos, pero en general el orden es ß-caseína > αS2-caseína > αS1-caseína>k-caseína.De
media, la αS1-caseínarepresentael10%deltotaldelascaseínas,variandode0a25%(Boulangery
col.,1984),dependiendodelgenotipodelanimal.Lasrazascaprinascanarias(Majorera,Tinerfeñay,
especialmente,Palmera)representanuncasoparticulardondeel60%delosalelosdelaαS1-caseína
caprinasondeltipoAyB(Jordanaycol.,1996),porloqueestacaseínaesrelativamenteabundante
en la leche y quesos elaborados a partir de estos animales.
2.1.3.Lactosa
La lactosa es el carbohidrato por excelencia en la leche, el cual está formado por una mo-
lécula de glucosa y otra de galactosa, que también pueden estar presentes de forma individual en
pequeñascantidadeslibres(Park,2006).Lalactosaesdegranimportanciaparamantenerelequili-
brio osmótico entre la corriente sanguínea y las células alveolares de la glándula mamaria durante la
síntesisdelaleche,ysusecreciónenellumenalveolaryelsistemadeconductosdelaubre(Parky
col.,2007).Encabrasesueleencontrarsobre0,2-0,5%menosqueenlalechedevacayoveja.Otros
carbohidratos presentes en la leche de cabra son los oligosacáridos, glicopéptidos, glicoproteínas y
nucleótidos(Parkycol.,2007),perosusfuncioneshansidomuypocoestudiadas.
2.1.4.Vitaminasyminerales
El contenido de macrominerales en la leche de cabra es mucho mayor que el de la leche hu-
mana, con cuatro y seis veces más calcio y fósforo, respectivamente. Comparativamente, la leche de
cabra contiene más calcio, fósforo, potasio, magnesio y cloro, y menos sodio y azufre que la leche de
vaca(Parkycol.,2007).Debidoaquelascabrasconviertentodoelβ-carotenoenvitaminaA,laleche
de cabra presenta mayor cantidad de este compuesto y es mucho más blanca que la leche de vaca.
Tambiéncontienemástiamina,riboflavina,niacina,vitaminaCyvitaminaDquelalechedevaca(Park
ycol.,2007).
INTRODUCCIÓN
37
2.2. Células somáticasLas células somáticas están presentes en la leche de todos los mamíferos, no tienen capaci-
dadparamultiplicarseyprovienendelpropioanimal.Segúnsuorigen,seclasificanendosgrandes
grupos: células de origen sanguíneo y células epiteliales. Normalmente estas células se encuentran
en la glándula mamaria sana, aunque puede considerarse un indicador de inflamación y/o infección
debido a que en estas situaciones se produce un incremento en el trasvase de leucocitos a la leche
(DasySingh,2000).
En muchos países se han establecido unos criterios de calidad para la leche de acuerdo a
los requerimientos higiénicos, tecnológicos y sensoriales. Estos criterios forman parte de un sistema
de pago que asegura la calidad de los productos finales. En los Estados Unidos, el límite legal en el
recuento de células somáticas (RCS) establecido en leche de cabra por la FDA (Food and Drug Admi-
nistration)esde1millóndecélulas/ml.SinembargoenlaUniónEuropeanohaylímiteparalaleche
de cabras y ovejas, como está dispuesto en los diferentes reglamentos, que establecen los criterios
generalesyespecíficosdehigienequedebencumplirlosproductosalimenticios(Paapeycol.,2007).
Algunosautores(Paapeycol.,2007;Raynal-Ljutovacycol.,2007)haninformadoquelosca-
breros de Estados Unidos tienen dificultades para mantener el RCS en la leche de tanque por debajo
del límite establecido. Como consecuencia, muchas granjas eliminan la leche que excede el límite, lo
cual provoca importantes pérdidas económicas para el sector.
El alto RCS puede ser causado por infección pero también por razones fisiológicas. En las
ubressanasdecabras,elRCSseincrementaprogresivamenteconlaedad(Salamaycol.,2003),du-
rantelalactación(Gomesycol.,2006),ademásdefluctuacionesdeundíaparaotro(Zengycol.,1997),
enlaqueintervienenfactorescomoelcelo(Mehdidycol.,2013)yelestrés(McDougallycol.,2002).
Portanto,laaplicacióndeuncriterioparalaevaluacióndelacalidaddelalecheyparaladetección
de mastitis está sin resolver.
En España ya hay algunas industrias queseras que están pagando la leche de cabra a los ga-
naderossegúnsucomposiciónquímicabásica(grasayproteína)asícomoenfuncióndelacalidad
higiénico-sanitaria (microbiología, RCS), pudiendo aplicarse primas o penalizaciones, tal como se
recoge en la homologación de contrato-tipo de suministro de leche de cabra con destino a su trans-
formaciónenproductoslácteos(OrdenARM/2387/2010,de1deSeptiembre).

Efecto de la frecuencia de ordeño sobre la producción, fraccionamiento lechero y parámetros de calidad de la leche en las cabras canarias
38
3. Factores que afectan al rendimiento y composición de la leche
La cantidad de leche producida por una cabra y su composición tienen variaciones como
consecuenciadeungrannúmerodefactores.Estospuedenactuaraisladamenteoencombinación.
Clásicamente, los mencionados factores se han dividido en dos grupos, uno de carácter intrínseco,
atribuido al animal, y otro de carácter extrínseco, debido a las condiciones y circunstancias externas
queactúansobreél.
3.1. Factores intrínsecos
3.1.1.Razaeindividuo
La producción lechera caprina está condicionada por factores genéticos que influyen tanto
sobrelacantidad(Figura14)comoenlacalidaddelalecheproducida.Sinembargo,lasdiferentes
condiciones de cría, alimentación, factores geográficos y climáticos a las que están expuestas las
diferentes razas, hacen difícil evaluar la importancia de este factor, de tal manera que la mayoría de
diferencias dentro de cabras de la misma raza pueden ser explicadas por el efecto rebaño (Capote y
col.,2000).
Figura14.Curvasdelactacióndealgunasrazasdealtaproducción.(AnimalImprovementProgramsLaboratory,2004).
Introducción
Página 27
3.1. Factores intrínsecos
3.1.1. Raza e individuo
La producción lechera caprina está condicionada por factores genéticos que
influyen tanto sobre la cantidad (Figura 14) como en la calidad de la leche producida.
Sin embargo, las diferentes condiciones de cría, alimentación, factores geográficos y
climáticos a las que están expuestas las diferentes razas, hacen difícil evaluar la
importancia de este factor, de tal manera que la mayoría de diferencias dentro de cabras
de la misma raza pueden ser explicadas por el efecto rebaño (Capote y col., 2000).
Figura 14. Curvas de lactación de algunas razas de alta producción. (Animal Improvement Programs
Laboratory, 2004).
Las cabras de alta producción lechera más difundidas en el mundo tienen su
origen o se han seleccionado esencialmente en tres países: Suiza (Saanen y
Toggenburg), Francia (Alpina) e Inglaterra (Anglonubia). Sobre estos animales se han
realizado una gran cantidad de estudios que abarcan la mayoría de los aspectos
relacionados con los individuos y su explotación, destacando aquellos dedicados a la
0,0
1,0
2,0
3,0
4,0
0 50 100 150 200 250 300 350
Prod
ucción
de leche (Kg)
Días de lactación
Alpina
Nubia
Saanen
Toggenburg

INTRODUCCIÓN
39
Las cabras de alta producción lechera más difundidas en el mundo tienen su origen o se
han seleccionado esencialmente en tres países: Suiza (Saanen y Toggenburg), Francia (Alpina) e
Inglaterra (Anglonubia). Sobre estos animales se han realizado una gran cantidad de estudios que
abarcan la mayoría de los aspectos relacionados con los individuos y su explotación, destacando
aquellosdedicadosa laproducción lechera(Britoycol.,2011;Garcia-Penicheycol.,2012).En los
países, cuyas razas nativas son muy poco productivas, suele ser frecuente el cruzamiento con razas
mejoradas(Kumeycol.,2012;Sanogoycol.,2012).Ladiscutiblefinalidaddeestoscruzamientosesla
de conservar las cualidades de rusticidad y adaptación al medio de las razas nativas pero mejorando
la producción lechera y alargando el tiempo de lactación.
La composición química de la leche también presenta grandes variaciones según la raza,
ligadasalniveldeproduccióndeleche.Enestesentido,Garcia-Penicheycol.(2012)examinaronla
composicióndelalecheenvariasrazasdealtaproduccióndurante3periodos(de1976a1984,de
1985a1994,yde1995a2005),yobservaronincrementosenelporcentajedeproteína,elcualfueva-
riablesegúnlasrazas(7,4%enToggenburg;7,1%enAlpina;6,5%enLaMancha;5,6%enAnglonubia;
3,4%enSaanen).Sinembargo,sóloencontraronincrementosenelporcentajedegrasaenunaraza
(2,1%enAnglonubia).
El estudio detallado de las variantes genéticas de la caseína as1(Ambrosoliycol.,1988;Jor-
danaycol.,1996)permitiórealizarunanuevaclasificacióndelasrazascaprinasenfuncióndesus
frecuencias alélicas. Cabe destacar que la concentración de as1secorrelacionapositivamentecon
las propiedades de coagulación de la leche, y que nuevos trabajos genéticos están enfocados en la
mejoradeestavariable(Magaycol.,2009).
Así como existe variabilidad entre razas en cuanto a producción y calidad de la leche, también
existen variaciones entre animales de la misma raza, pudiendo incluso superar estas variaciones a
las interraciales.
3.1.2.Estadoyduracióndelalactación
La producción de leche no es constante a lo largo de toda la lactación. De manera general la
producción aumenta hasta alcanzar el máximo pico de producción, luego desciende a medida que
avanza la lactación. El aumento de la producción de leche hasta el pico de lactación parece ser debi-
do a una mayor capacidad de síntesis de las células epiteliales mamarias, en lugar de un incremento
Efecto de la frecuencia de ordeño sobre la producción, fraccionamiento lechero y parámetros de calidad de la leche en las cabras canarias
40
enelnúmerodecélulassecretoras(Capucoycol.,2001;Salama,2005).Posteriormente,eldescenso
progresivo de la producción de leche, tras alcanzar el máximo, es asociado con una reducción en el
contenidodeADNtotaldelparénquimamamario,implicandounadisminuciónenelnúmerodecélu-
lassecretoras(KnightyPeaker,1984;Capucoycol.,2001).
Lamayoríadelascabrassitúansumáximaproducciónentrela3ªy8ªsemanadelactación
(Salama,2005).Así,sehanobtenidovaloresdepicodelactaciónde2,42kgalos45días(Leónycol.,
2012)encabrasMurciano-Granadina,de2,48kgalos45díasencabrasTinerfeñas(Capoteycol.,
2000),ode2,54kgalos54díasencrucedeToggenburgconrazaslocalesdeMéxico(Montaldoycol.,
1997).DeacuerdoalDepartamentodeAgriculturadeEstadosUnidos,losmáximosvaloresdeproduc-
ciónalcanzadosparacabrasmultíparassonde4,63kgalos50díasenSaanen,4,49kgalos40días
enAlpina,yde3,67kgalos45díasenOberhasli(AnimalImprovementProgramsLaboratory,2004).
En lo que respecta a la composición, el contenido de grasa sigue una evolución opuesta
a la evolución de la producción de leche, es decir, una rápida disminución en el transcurso de las
primeras semanas de lactación, a la que sigue un mínimo que se alcanza aproximadamente entre el
finaldel2ºyel6ºmesdelactación,yposteriormente,unaumentolentoyprogresivo(Peris,1994).Sin
embargo, algunos autores no consiguieron observar diferencias de este componente entre las fases
delactacióntemprana,mediaotardía(Capoteycol.,2008).Encuantoalaproteína,lamayoríadelos
autores encontraron que permanece casi constante con pequeñas fluctuaciones alrededor de un
valormedio(Peris,1994;Hejtmankovaycol.,2012).Finalmente,laevolucióndelalactosapresenta
un comportamiento inverso al de la grasa, es decir aumentando en la primera parte de la lactación y
disminuyendoenlaúltima(Parkycol.,2007).
3.1.3.Edadynúmerodelactación
Parececlaroquelaproduccióndelecheesmenorencabrasprimíparasqueencabrasmultí-
paras(Goetschycol.,2011).Dehecho,lasúnicasdiferenciassignificativassehanobservadoentrela
primerayelrestodelaslactaciones(ZengyEscobar,1995).Ellopuededeberseaqueentrelaprimera
y segunda lactación los animales manifiestan una importante diferencia en el desarrollo corporal,
más acentuada en cabras que se cubren precozmente de forma sistemática, como ocurre en las Islas
Canarias(Capoteycol.,2000),Portanto,lascabrasenprimeralactacióntienenmenorvolumende
ubre(Salamaycol.,2004)yportantounamenorcantidaddelechesecretadaporunidaddevolumen

INTRODUCCIÓN
41
encomparaciónconlascabrasmultíparas(KnightyWilde,1993).Deestaforma,Zahraddeenycol.
(2009)encontraronunincrementoprogresivoenelrendimientolecheroentrela1ªy3ªlactaciónen
variasrazasdecabrasdedoblepropósito(RedSokoto,SahelyWestAfricanDwarf).Mientrasque
Carnicellaycol.(2008)yMiocycol.(2008)encontraronunaumentoenlaproduccióndelechecasi
constantedesdela1ªhastala4ªlactaciónencabrasMaltesa,SaanenyAlpina.
En cuanto a los componentes de la leche considerados de forma porcentual, algunos trabajos
recientes señalaron que las concentraciones de grasa y proteína fueron similares entre los cinco pri-
merospartos,perofuemenorenla6ªlactación(Zengycol.,2008),mientrasqueotrosestudioshabían
observado previamente un incremento de la cantidad de grasa al mismo tiempo que el contenido de
proteínadisminuíaalaumentarelnúmerodelactaciones(Morand-Fehrycol.,1986).
3.1.4.Prolificidad
La producción de leche de cabra puede verse influenciada por el tamaño de la camada (Figura
15).Delgado-Pertiñezycol.(2009)observaronunamayorcantidaddelecheproducidaencabrasde
razaPayoyacondoscabritosrespectoalasdeuno,durantelasprimeras5semanasdespuésdelpar-
to,conindependenciadelossistemasdelactanciaydeordeño.Sinembargoapartirdelasemana6
hastala30,lasproduccionesfueronsimilares.Portanto,elhechodequelascabrasconmásdedos
crías liberen cantidades superiores de lactógeno placentario durante la gestación, parece tener un
mayor impacto sobre la posterior producción de leche, que las diferencias producidas por la estimu-
lacióndeloscabritosallactar(Goetschycol.,2011).
Figura15.CabraMajoreraconuna(izquierda)odos(derecha)crías.(U.D.ProducciónAnimalULPGC).

Efecto de la frecuencia de ordeño sobre la producción, fraccionamiento lechero y parámetros de calidad de la leche en las cabras canarias
42
En lo referente a la composición de la leche, algunos estudios observaron que la prolificidad
influíasobreelporcentajedeproteína,sibiennohabíaningúnefectosobre lagrasa(Perisycol.,
1997).Sinembargo,enotrosexperimentosencontraronquelascabrasqueteníandoscabritos,inde-
pendientemente de su origen genético, presentaban una mayor concentración de grasa, proteína y
lactosa(Zygoyiannis,1994).
3.1.5.Estadosanitario
Existen numerosos estudios que han demostrado que los procesos infecciosos en cabras pro-
vocan una disminución en la producción de leche, con un incremento en el RCS que afecta a la vida
mediadelalechedestinadaalconsumidor(ZengyEscobar,1995;Huijpsycol.,2008).Hayquetener
en cuenta que durante la lactación ocurren cambios en el rendimiento lechero relacionados con
procesos no infecciosos, los cuales pueden resultar en un efecto de concentración de las células
somáticas(Paapeycol.,2007;Goetschycol.,2011).Portanto,elaumentobruscodelRCSalfinaldela
lactación donde se produce un descenso en el rendimiento lechero, puede ser resultado de una ma-
yor transferencia de células de origen sanguíneo a la leche, debido a una mayor actividad de factores
relacionadosconlainvolucióndelaglándulamamaria(Manlongatycol.,1998).
3.2. Factores extrínsecos
3.2.1.Alimentación
La alimentación del ganado caprino no sólo influye en la cantidad de leche sino también en la
calidaddelamismayporendeenladelqueso(Pulinaycol.,2008).Debidoalaimportanciadeeste
factor(Figura16),sonnumerososlostrabajosyrevisionesbibliográficasrealizadasatalefecto(Min
ycol.,2005;Álvarezycol.,2007).Además,buenapartedeellosestándedicadosalabúsquedadeali-
mentosalternativos,engeneralsubproductosdelaindustriaalimentaria(Azzazycol.,2012;Romero-
Huelvaycol.,2012).
INTRODUCCIÓN
43
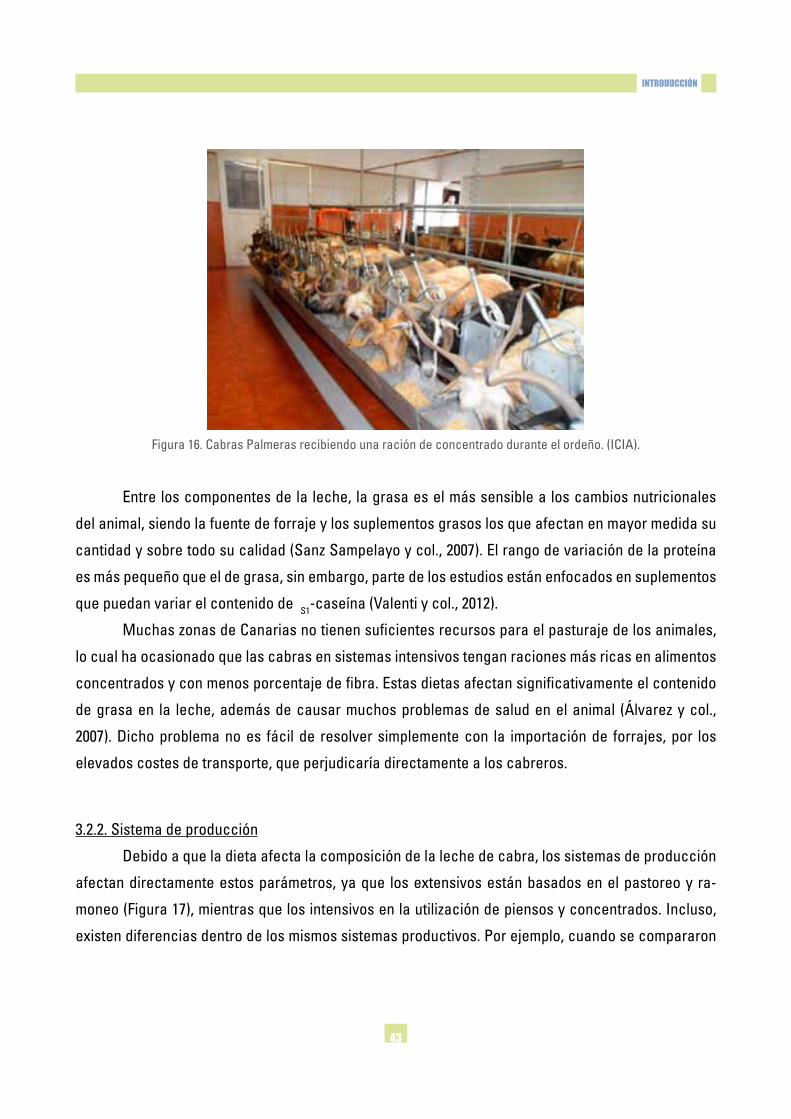
Figura16.CabrasPalmerasrecibiendounaracióndeconcentradoduranteelordeño.(ICIA).
Entre los componentes de la leche, la grasa es el más sensible a los cambios nutricionales
del animal, siendo la fuente de forraje y los suplementos grasos los que afectan en mayor medida su
cantidadysobretodosucalidad(SanzSampelayoycol.,2007).Elrangodevariacióndelaproteína
es más pequeño que el de grasa, sin embargo, parte de los estudios están enfocados en suplementos
que puedan variar el contenido de αS1-caseína(Valentiycol.,2012).
MuchaszonasdeCanariasnotienensuficientesrecursosparaelpasturajedelosanimales,
lo cual ha ocasionado que las cabras en sistemas intensivos tengan raciones más ricas en alimentos
concentrados y con menos porcentaje de fibra. Estas dietas afectan significativamente el contenido
de grasa en la leche, además de causar muchos problemas de salud en el animal (Álvarez y col.,
2007).Dichoproblemanoes fácilde resolversimplementecon la importaciónde forrajes,por los
elevados costes de transporte, que perjudicaría directamente a los cabreros.
3.2.2.Sistemadeproducción
Debido a que la dieta afecta la composición de la leche de cabra, los sistemas de producción
afectan directamente estos parámetros, ya que los extensivos están basados en el pastoreo y ra-
moneo(Figura17),mientrasquelosintensivosenlautilizacióndepiensosyconcentrados.Incluso,
existendiferenciasdentrodelosmismossistemasproductivos.Porejemplo,cuandosecompararon

Efecto de la frecuencia de ordeño sobre la producción, fraccionamiento lechero y parámetros de calidad de la leche en las cabras canarias
44
tres sistemas de producción caprina basados en pastos naturales de llanura, colinas y montaña, la
producción de leche resultó ligeramente inferior en los pastos de montaña, pero su contenido de gra-
sa y proteína, así como los porcentajes de ácidos grasos poliinsaturados fueron mayores respecto a
losotrosdossistemasdemanejo(Morand-Fehrycol.,2007).
Figura17.CabrasdepastoreoenlaisladeLaPalma.(ICIA).
El tipo de especies forrajeras y de concentrados suministrados en la alimentación, también
afectalacalidaddelosquesos.Soryalycol.(2004)observaronunapuntuaciónmayorenelsaborde
los quesos elaborados con leche de cabras que pastaban sin concentrado suplementario en compa-
ración con aquellas que estaban confinadas y cuya dieta estaba basada en concentrados comercia-
les y heno de alfalfa.
En Canarias generalmente las cabras son explotadas en sistemas semi-extensivos, ya que el
pastoreo forma parte importante de la ganadería tradicional. Algunos autores han señalado que al
realizarse de forma controlada contribuye a la biodiversidad y al desarrollo sostenible de la región
(Mataycol.,2010).
3.2.3.Factoresclimáticos
Se ha señalado que las altas temperaturas, la incidencia de radiación solar y una humedad
elevada, son factores condicionantes sobre los animales que afectan su nivel de producción (Sila-

INTRODUCCIÓN
45
nikove,2000a).Sinembargo,estosfactoresnoafectandeigualmaneraalasdistintasrazas,yaque
por ejemplo, las cabras de zonas templadas de Europa se ven más perjudicadas por las altas tem-
peraturasquelascabrasautóctonasdezonascálidasdeAsia,ÁfricayAméricadelSur(Gaughany
col.,2009).
Porotrolado,aunquelaaltaproducciónlecheraestárelacionadaconlosrecursoshídricos
disponiblesen lazona(Silanikove,2000b),cabedestacarque lascabrasestánmejoradaptadas
quelasvacasyovejasaloslargosperíodosdesequíayalaszonasáridas(Figura18), llegando
inclusoaproducir2litrosdelechealdíaconrestriccióndeaguasisealimentanadecuadamente
(Maltzycol.,1982).
Figura18.CabrasderazaMajoreraenlaisladeFuerteventura.(ICIA).
3.2.4.Condicionesdeordeño
Aunqueelordeñomecánicoestábastantegeneralizadoen lospaíses industrializados,aún
existen muchas regiones donde el ordeño manual es frecuente. Existen pocos trabajos que comparen
la producción y composición de la leche entre ambos métodos de ordeño. Aunque la estimulación
manual mejora el vaciado de la ubre respecto al ordeño a máquina, no debería haber diferencias en
cuantoalaproducciónsiempreycuandoambosmétodosserealicenadecuadamente(Bruckmaier
yBlum,1998).EnloreferentealRCS,algunosautoresnohanconseguidodiferenciassignificativas
entre el ordeño manual y el mecánico, aunque si un mayor recuento de bacterias en la leche del orde-
Efecto de la frecuencia de ordeño sobre la producción, fraccionamiento lechero y parámetros de calidad de la leche en las cabras canarias
46
ñomanual(ZengyEscobar,1996).Sinembargo,otrosafirmanqueexisteunaimportantevariabilidad
en el RCS, en lo referente al método de ordeño utilizado, con mayores recuentos durante el ordeño
manual(Haenlein,2002).
Porotrolado,losparámetrosyajustesenlamáquinadeordeñoinfluyenconsiderablemente
sobre la extracción de leche, tanto en términos de cantidad como de calidad. Así por ejemplo, se ha
reportado que las condiciones óptimas de ordeño en cabras griegas se dan con una frecuencia de
pulsaciónde70-90pulsos/min,unapresióndesucciónentre36-44kPayunarelacióndepulsaciónde
65:35(Sinapisycol.,2000).EnrazasAlpinaySaanen,unaaltafrecuenciaenlaordeñadora(90y120
pulsos/minyunarelacióndepulsaciónde60:40)reduceeltiempodeordeño,mientrasquelabajafre-
cuencia(60pulsos/minyunarelacióndepulsaciónde50:50)alargaeltiempodeordeñoydisminuye
elflujodeleche(Billonycol.,2005).Además,sielniveldevacíoesmuyalto,seproduceunestrangu-
lamiento de los pezones en las pezoneras disminuyendo el caudal de leche extraída y puede incidir
en la aparición de mastitis, pero si el vacío es muy bajo, es muy frecuente la caída de las pezoneras
ya que no succionan adecuadamente a los pezones de las cabras y por tanto retrasa el tiempo de
ordeño(MarnetyMcKusick,2001).
Cuando empezaron a implantarse las maquinarias de ordeño en las Islas Canarias, los ga-
naderos se quejaban de que esta práctica producía mastitis a las cabras. Sin embargo, las razones
principales eran que no se manejaban unas adecuadas condiciones higiénicas, además de que las
marcas proveedoras no se habían adaptado a las necesidades de esta especie, tanto en parámetros
como en materiales. Hoy en día los ganaderos conocen la importancia de la máquina de ordeño, re-
presentadoungraveproblemasiéstasufrealgúndesperfectoodaño(Capoteycol.,2010).
En lo referente a la frecuencia de ordeño, en países como Francia, Suiza y Alemania que cuen-
tan con una explotación caprina tecnificada, es habitual realizar dos ordeños al día, cuya eficacia
está respaldada por numerosos estudios que otorgan un elevado incremento de las producciones le-
cheras. Así, en razas como Alpina y Saanen, las diferencias a favor del doble ordeño oscilaban entre
un26y45%(MocquotyAuran,1974;WildeyKnight,1990),aunqueentrabajosmásrecientesdichas
diferenciasestánalrededordel16%(Komaraycol.,2009).
La totalidad de las ganaderías caprinas del Archipiélago Canario realizan un solo ordeño dia-
rio. Este hábito se vio favorecido por la costumbre de elaborar el queso justo después de haber or-
deñado, debido a la imposibilidad de conservar la leche, lo cual implicaba una tarea exigente y difícil
de realizar dos veces al día, y más si consideramos las grandes distancias que recorrían los cabreros

INTRODUCCIÓN
47
enlabúsquedadezonasdepastoreo.Sinembargo,lasmejorastecnológicasproducidasenelsector
caprinoenlosúltimosañosconlaproliferacióndemaquinariadeordeño,tanquesderefrigeracióne
industrias con circuito de recogida de la leche, suponía que la variación en la frecuencia de ordeño
permitiría aumentar los rendimientos de los rebaños, pero los primeros estudios realizados en cabras
Tinerfeñasconsiguieronincrementosentresóloel6y8%(Capoteycol.,2000).
4. Estructura anatómica y conformación de la glándula mamaria
4.1. Anatomía de la glándula mamaria caprinaLa ubre caprina, conformada por dos glándulas independientes, está situada en la región
inguinal cubriendo la cara interna de los muslos y con una proyección desde atrás hacia adelante.
Cada glándula mamaria está compuesta por una cisterna y una papila o pezón, y se separa de la
otra por un surco intermamario. En las cabras, al igual que en el resto de las hembras con aptitud
lechera, el desarrollo mamario constituye la base donde podrá proliferar el tejido secretor (Knight
yPeaker,1982).
Cada complejo mamario se compone de diversos elementos funcionales responsables del
procesobiosintético,almacenamientoytransportedelaleche(Figura19):
Figura19.Vistalateralglándulamamariacaprina.A:parénquimamamario;b:porcióncisternaldelsenolactífero;c:por-ciónpapilardelsenolactífero;d:papilamamaria;e:nóduloslinfáticosmamarios;f:conductoyorificiopapilar;g:con-
ductoslactíferoscolectores.(Sandoval,2003).

Efecto de la frecuencia de ordeño sobre la producción, fraccionamiento lechero y parámetros de calidad de la leche en las cabras canarias
48
4.1.1.Parénquimaglandular
En el parénquima glandular o tejido noble se encuentran las unidades secretoras, o alvéolos,
que presentan como característica primordial la presencia de un epitelio secretor que delimita inter-
namente el lumen donde se deposita la leche secretada por la células. Exteriormente cada alvéolo
presenta una compleja red de capilares arteriales y venosos que están en íntimo y estrecho contacto
conelepiteliobasal (ConstantinescuyConstantinescu,2010).Losalvéolosagrupadosenracimos,
lobulillos y lóbulos, son vaciados por pequeños canalículos que confluyen para formar conductos de
mayor tamaño, llamados canales galactóforos, los que a su vez convergen en estructuras de mayor
diámetrointerno,conlímitesmásdifusosdenominadoscisternasdelamama(FerrandoyBoza,1990).
Finalmente este sistema de conducción se comunica con una cisterna del pezón, ubicada en
esteúltimoycuyovolumenvaríasegúneltamañodelpezón.Elinteriordelapapilamamariapresenta
una mucosa muy plegada para evitar el flujo espontáneo de leche al exterior así como la penetración
de agentes patógenos, y una concentración de fibras musculares que contienen numerosas termina-
cionesnerviosasyvasossanguíneos(Suárez-Trujilloycol.,2013).
Otroelementoanatómicofuncionaldeimportancia loconstituyenlascélulasmioepiteliales
que envuelven externamente a los alveolos y que por ser fibras musculares lisas responden activa-
mente a las descargas de oxitocina, permitiendo un correcto vaciamiento de la leche acumulada en
lasestructurasnocisternales(BruckmaieryBlum,1998).
4.1.2.Sistemasuspensorio
El aparato suspensorio de la ubre lo conforma una red de fibras de naturaleza elástica y fi-
brosa, procedentes de la pared ventral del abdomen, que penetran en el parénquima mamario a di-
ferentes niveles, evitando que los cuerpos glandulares graviten directamente sobre la piel que los
envuelve(Suárez-Trujilloycol.,2013).Laproporcióndetejidoglandularydetejidodesosténpresenta
una buena caracterización de una glándula mamaria en cuanto a su mayor o menor capacidad pro-
ductiva. Así una glándula con una gran cantidad de tejido de sostén presentará un aspecto exterior
con escasa variación antes o después del ordeño, mientras que una glándula rica en tejido noble
presentaráunaspectomuyretraídodespuésdelordeño(FerrandoyBoza,1990).

INTRODUCCIÓN
49
4.1.3.Sistemacirculatorioylinfático
Parapodersintetizarlaleche,debecircularporlaubreunaenormecantidaddesangre,ya
que se requiere una elevada proporción de nutrientes para que las células secretoras la produzcan.
Así mismo, las células alveolares requieren tiempo para la captura de estos nutrientes, por lo que un
pasodesangreaaltavelocidadnoresolveríaelproblema.Paraquelasecreciónlácteasellevea
cabo eficientemente, el aporte sanguíneo se ralentiza a nivel alveolar como consecuencia del enor-
me desarrollo del sistema venoso de la ubre, encontrándose alrededor de las mamas, ricas redes
capilares conectadas con amplios plexos venosos por los que la sangre circula muy lentamente (Fe-
rrandoyBoza,1990).
También cabe destacar la existencia de una gran representación linfática, destacando los
ganglioslinfáticosmamariosqueactúancomolinfocentros,yquedesempeñanunimportantepapel
como barrera defensiva frente a las infecciones que puedan afectar a la ubre (Constantinescu y
Constantinescu,2010).
4.2. Morfología de la ubre de las razas canariasLa morfología de la ubre es un importante parámetro en la ganadería caprina por su contribu-
ción en la producción de leche y la aptitud de ésta para el ordeño mecanizado. Los parámetros más
utilizados en la definición de la morfología de la ubre son: profundidad y volumen de la ubre, morfolo-
gía del pezón (longitud, anchura, ángulo de implantación y situación antero-posterior), y altura de las
cisternasmamarias(Figura20).
Una morfología de ubre adecuada es muy importante para una buena adaptación del animal
a la máquina de ordeño, ya que puede evitar algunos efectos indeseables, como por ejemplo la in-
hibición del reflejo de eyección láctea, o la caída de pezoneras que conllevaría un mayor tiempo de
ordeño(Barillet,2007).Peris(1994)alestudiar laaptitudalordeñomecánicodecabrasMurciano-
Granadina,describióqueexisteunagranheterogeneidadenloscriteriosmetodológicosylasmedi-
das morfológicas evaluadas, así como en el estado de lactación utilizado por cada autor para evaluar
la aptitud al ordeño.

Efecto de la frecuencia de ordeño sobre la producción, fraccionamiento lechero y parámetros de calidad de la leche en las cabras canarias
50
Figura20.Medidasmorfológicadelaubre.DEP:distanciaentrepezones;ACS:alturacisterna-suelo;APS:alturapezón-suelo;AIUS:alturainserción-suelo;PU:profundidadubre.(U.D.ProducciónAnimalULPGC).
La morfología de la ubre ha sido descrita en las principales razas lecheras: Saanen y Alpina
(Manfrediycol.,2001),Toggenburg(Wang,1989),Murciano-Granadina(Perisycol.,1999).Enlostra-
bajos se describen distintas formas de ubres: redondeadas o globosas, ovales, piriformes, pendulares
o planas. También diferentes tipos de pezón: cónicos, cilíndricos, en forma de botella o bulbosos,
pequeños, o voluminosos. En el caso de la razas canarias, la ubre se caracteriza porque la altura del
pezónesmayorquelaalturadelfondodecisternaenungrannúmerodeanimales(Figura21),una
circunstancia negativa en el momento del ordeño, ya que es necesaria la intervención manual para
levantar la ubre y extraer la porción de leche que hay debajo del pezón, lo cual incrementa el tiempo
deordeño(Capoteycol.,2008).

INTRODUCCIÓN
51
Figura21.Típicaubredelascabrascanarias.(U.D.ProducciónAnimalULPGC).
Algunos autores han señalado que la selección genética para mejorar la producción lechera
llevadaacaboenlasúltimasdécadas,haproducidoefectosindeseablesenlamorfologíamamaria,
como la tendencia de que las ubres tengan ubicados los pezones más horizontalmente para incre-
mentar la capacidad cisternal pero que trae como consecuencia una menor ordeñabilidad de los
animales(MarnetyMcKusick,2001;Barillet,2007).
5. Fisiología de ordeñoEl inicio masivo de la secreción láctea corresponde al momento del parto en que se produce
un cambio hormonal importante, con el descenso en el nivel de la progesterona y un incremento de
estrógenos,prolactina,yglucocorticoides(Davisycol.,1979).Lalactogénesiscomprendelasíntesis
intracelular de la leche y su posterior transferencia desde el citoplasma hacia el lumen alveolar. El
componente de base del tejido secretor es el alvéolo, envuelto por una capa de células mioepiteliales
que ayudan en la contracción de los alvéolos por efecto de la oxitocina, produciendo la expulsión de
la leche hacia los conductos galactóforos. Este proceso neurohormonal es provocado por estímulos
comoelamamantamientodelacríaoelprocesodeordeño(ParkyHaenlein,2010).
Las terminaciones nerviosas del pezón están conectadas con el sistema nervioso central y
el hipotálamo a través de las raíces dorsales de los nervios lumbares de la médula espinal. Cuando
un estímulo alcanza el sistema nervioso central provoca que el lóbulo posterior de la hipófisis libere
Efecto de la frecuencia de ordeño sobre la producción, fraccionamiento lechero y parámetros de calidad de la leche en las cabras canarias
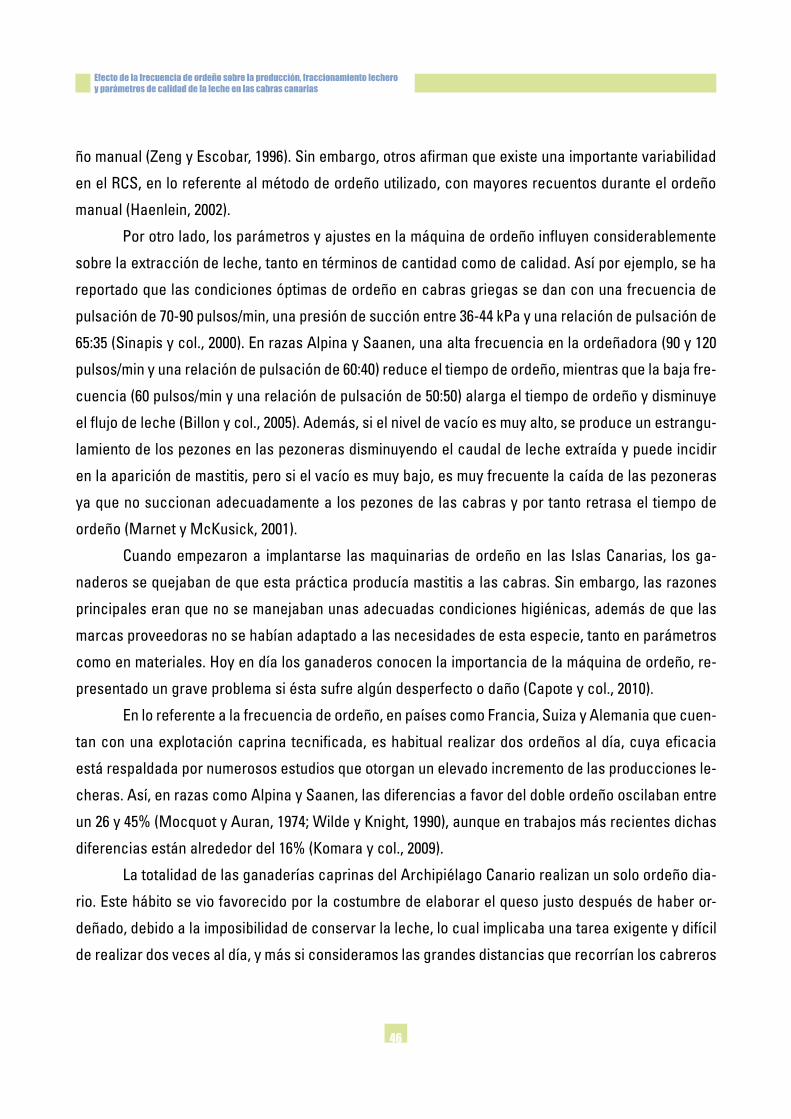
52
oxitocina. La oxitocina viaja a través del flujo de sangre hasta la glándula mamaria, donde causa la
contraccióndelascélulasmioepiteliales(Figura22)(BruckmaieryBlum,1998).
Figura22.Esquemadeeyeccióndelecheencabras.(Caja,2003).
5.1. Efectos de la oxitocina sobre la eyección de lecheLa oxitocina es un neuropéptido responsable de la eyección de la leche, con el consecuente
vaciado de la ubre. Dependiendo del grado de estimulación de la glándula mamaria, se producen
diferentes respuestas en la liberación de oxitocina. De esta forma, el amamantamiento de la cría es
un estímulo más potente que el ordeño, mientras que el ordeño manual induce una liberación más
pronunciadadeoxitocinaqueelordeñoamáquina(BruckmaieryBlum,1998).Además, laestimu-
lación previa al ordeño es importante en algunas especies como el ganado bovino porque aumenta
los niveles de oxitocina y promueve la inducción temprana de eyección de la leche para evitar una
interrupción del flujo de leche durante el ordeño, sin embargo en cabras no es tan importante esta
estimulación previa por el gran volumen de leche almacenado en la cisterna, y que está disponible en
elmomentodelordeño(BruckmaieryWellnitz,2008).
El proceso de eyección de leche en cabras, en respuesta a la oxitocina, es similar al de vacas
yovejas,perolaextraccióndelalecheesdiferentedebidoalamorfologíadelaubre(Bruckmaiery
Blum,1998).Encabras,laliberacióndeoxitocinaesaltamentevariableenelmismoanimalyentre
diferentes individuos de la misma raza, siendo fácilmente inducida por estimulación táctil previa o por
lamáquinadeordeño(BruckmaieryBlum,1998;MarnetyMcKusick,2001).

INTRODUCCIÓN
53
5.2. Efectos de la administración de oxitocina exógena sobre la producción de lecheAunque existen numerosos informes de que la administración exógena de oxitocina en el mo-
mento del ordeño puede aumentar la producción de leche, hay contradicciones en la literatura con
respecto a sus efectos sobre el rendimiento lechero y calidad de la leche. Éstos se deben principal-
menteadiferenciasenlametodologíaydiseñoexperimental,quevandesdeelnúmerodeanimales
utilizados, estado de lactación, inyección seguida de remoción de leche o no, inyección administrada
conlasubresllenasovacías,ydosisdeoxitocinaadministrada(Lollivierycol.,2002).
Laadministracióndedosisintravenosasentre0,1y1UIdeoxitocinapuedeinducirlabajadade
la leche en cabras, ya que sólo es necesario rebasar un umbral mínimo de concentración de oxitocina
parainiciarelproceso(Schamsycol.,1984).Sinembargo,enlamayoríadelostrabajosexperimentales,
losinvestigadoreshanutilizadodosisconcantidadessuprafisiológicas(Lollivierycol.,2002).
En vacas, se ha reportado que la administración exógena de oxitocina es una terapia eficaz
contralamastitis(Macuhovaycol.,2004).Sinembargonosehanencontradocambiosaparentesen
el sistema inmune por los tratamientos con oxitocina, aunque las inyecciones en cantidades supra-
fisiológicas pueden ayudar en la eliminación de microorganismos patógenos debido a un completo
vaciadodelaubre(Werner-Misofycol.,2007).Adicionalmente,algunosestudiosconfirmanunare-
ducción en la eyección espontanea de leche después de retirar los tratamientos crónicos de oxito-
cina, lo cual puede deberse a una disminución de la oxitocina liberada desde la hipófisis, o por una
reducción en la contractibilidad de las células mioepiteliales a niveles fisiológicos de oxitocina en
sangre(Bruckmaier,2003).
6. Fraccionamiento lechero
En el instante del ordeño, se considera que la leche se encuentra almacenada en la ubre en
dos niveles bien diferenciados (fracciones de ubre), o como se obtiene durante una rutina de ordeño
completa (fracciones de ordeño).

Efecto de la frecuencia de ordeño sobre la producción, fraccionamiento lechero y parámetros de calidad de la leche en las cabras canarias
54
6.1. Fracciones de ubre
6.1.1.Lechecisternal
Cierta cantidad de leche está contenida en la cisterna o seno glandular. La especial es-
tructuración anatómica de la glándula mamaria del caprino, que incluye la presencia de grandes
cisternas(Figura23),permitequebuenapartedelcontenidodelechealmacenadaenelinteriorde
laglándulapuedaserevacuadaenformapasiva,esdecir,sinunprocesodecontracción(Bruck-
maieryBlum,1998).
Figura23.Laubrecaprinacanariadestacaporsusgrandescisternas.(U.D.ProducciónAnimalULPGC).
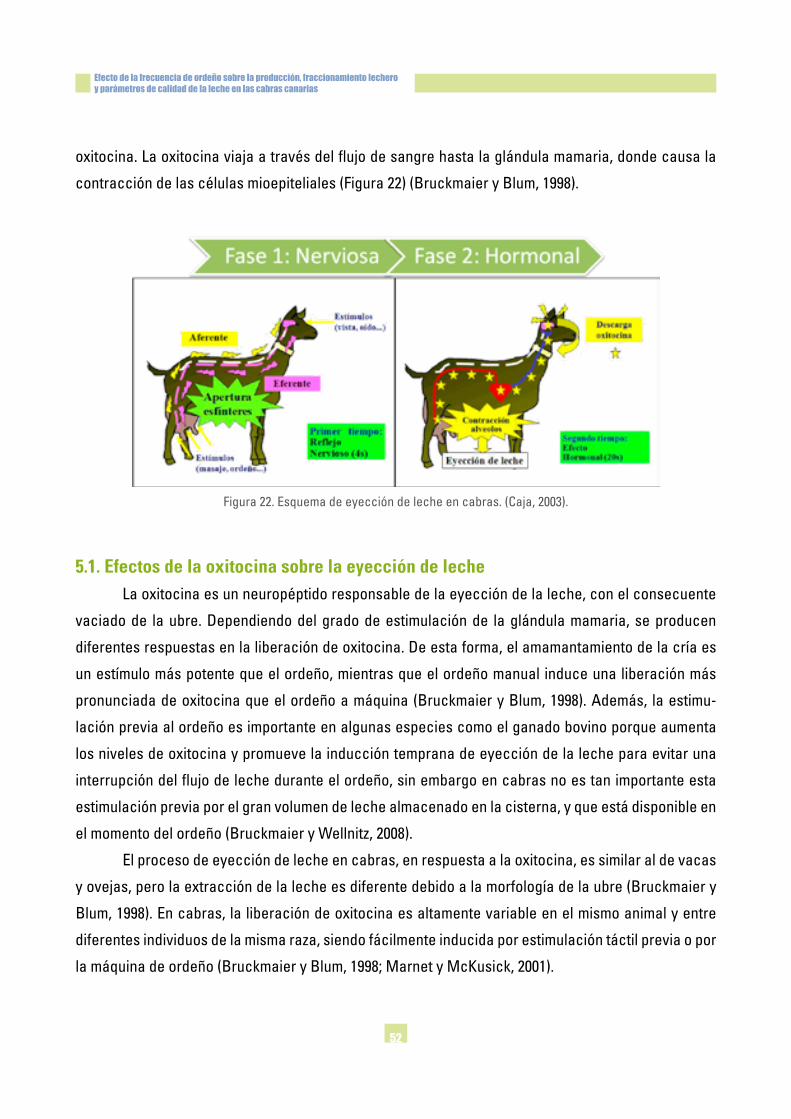
6.1.2.Lechealveolar
Una parte de la leche se acumula en los alvéolos y en la red de canales y conductos (Figu-
ra24),yestáfijadaporfuerzascapilares.Parasuobtenciónseprecisadelaparticipaciónactiva
delanimal,atravésdelapuestaenmarchadelmecanismodeeyeccióndeleche(Bruckmaiery
Wellnitz,2008).
INTRODUCCIÓN
55
Figura24.Representacióndelaexpulsióndelalechecontenidaenlosalveolos.(Schmidt,1971).
El reparto entre la leche cisternal y alveolar se determinaba mediante el uso de una cánula que
seintroducíaporelesfínterdelpezónypermitíaeldrenajedelalechecisternal(PeakeryBlatchford,
1988).Noobstante,estatécnicapuedesobreestimarelvolumendelechecisternal,yaquealgunas
razas son muy sensibles a la liberación espontánea de oxitocina endógena, como consecuencia de
reflejoscondicionadosalordeñoocomoresultadodelamanipulacióndelpezón.Porello,lasnuevas
técnicas incluyen el uso de un antagonista de los receptores de oxitocina para bloquear la eyección
espontáneadeleche(Wellnitzycol.,1999).
6.2. Fracciones de ordeño
6.2.1.Lechedemáquina
El fraccionamiento obtenido durante el ordeño mecánico permite diferenciar una porción de
leche recogida desde la colocación de las pezoneras hasta el cese de flujo de leche sin intervención
algunaporpartedelordeñador(Figura25).
6.2.2.Lechedeapuradoamáquina
La morfología de ubre de muchas razas caprinas hace necesario realizar un masaje de las
regiones cisternales y alzar el ligamento suspensorio por parte del ordeñador, antes de la retirada de
laspezoneras,parafavorecerlaremocióndelalechecontenidadebajodelospezones(Figura25).

Efecto de la frecuencia de ordeño sobre la producción, fraccionamiento lechero y parámetros de calidad de la leche en las cabras canarias
56
6.2.3.Lecheresidual
La leche total contenida en la glándula mamaria difícilmente se puede extraer en su totalidad
por medios mecánicos o manuales, puesto que una parte sólo puede ser extraída por mecanismos
hormonales. Así pues, mediante una inyección de oxitocina se extrae la fracción retenida en el tejido
mamario, y aunque no se considera propiamente como una fracción de ordeño, permite expresar el
grado de vaciado de la ubre conseguido por medio del ordeño mecánico.
Figura25.Fraccióndelechedemáquina(izquierda)ydeapuradoamáquina(derecha).(ICIA).
Porconsiguiente,lascabrasconmejoradaptaciónalamáquinadeordeñoseránaquellasque
presenten una mayor cantidad de leche de máquina, y menor volumen de leche de apurado y residual,
lo que implica una reducción en el tiempo dedicado al ordeño. Sin embargo, en las explotaciones
ganaderas,hayunatendenciacentradaenreducirelnúmerodeoperacionesduranteelordeño,omi-
tiendoelapuradoamáquina(McKusickycol.,2003).
Porotrolado,sehaseñaladolaimportanciadelamorfologíadeubresobrelasfraccionesde
ordeño, destacando la red canalicular, la altura de las cisternas mamarias y el ángulo de inclinación
delospezones(LeDu,1985),habiéndoseresaltadotambiénquelasubresglobosassonmásfáciles
deordeñarquelasubresdescendidas(Capoteycol.,2006).Además,lafrecuenciadeordeñoafecta
especialmente la fracción de apurado a máquina, donde el doble ordeño incrementa significativa-

INTRODUCCIÓN
57
mente los porcentajes en las cabras Tinerfeñas, debido al hecho de tener que realizar esta labor dos
vecesparauncorrectovaciadodelaubre(Capoteycol.,2009).
Deformageneral,losvaloresderepartodelecheduranteelordeñoencaprinosesitúanen-
tre61a90%paralechedemáquina,10a23%paralechedeapuradoamáquinayun10a17%para
lalecheresidual(Capoteycol.,2000).Porotraparte,lafraccióndelechedemáquinaeslaquemás
disminuye a lo largo de la lactación, siguiendo una evolución paralela a la leche total ordeñada, e
inversa al de la leche de apurado a máquina, en donde la leche residual permanece más o menos es-
table,peroexistiendounaaltavariabilidadentreindividuos(PeakeryBlatchford,1988;Capoteycol.,
2008).Díazycol(2013)estudiaronlosnivelesdecortisolsobreelfraccionamientolecheroencabras
Murciano-Granadinaynoencontraroncorrelaciónentreéstosconelvolumendelechedeapuradoa
máquina y el tiempo total de ordeño, por lo que las variaciones de esta hormona pueden estar asocia-
das a factores fisiológicos en el animal y no necesariamente al estrés. En general, estas fracciones
tienden a mantener un volumen constante a medida que los animales se adaptan a la máquina de
ordeño(Rovai,2001).


BIBLIOGRAFÍA
59
Bibliografía
ÁlvarezS,FresnoM,MéndezP,CastroN,FernándezJ,&SanzSampelayoM.2007.Alternativesforimproving physical, chemical, and sensory characteristics of goat cheeses: the use of arid-landforagesinthediet.JournalofDairyScience,90:2181–2188.
AmbrosoliR,DiStasioL,&MazzoccoP.1988.ContentofalphaS1-caseinandcoagulationpropertiesingoatmilk.JournalofDairyScience,71:24–28.
AmillsA,CapoteJ,TomàsA,KellyL,Obexer-RuffG,AngiolilloA,&SánchezA.2004.Strongphylo-geographic relationships among three goat breeds from the Canary Islands. Journal of Dairy Research,71:257–262.
AnimalImprovementProgramsLaboratory.2004.Estimatedgoatlactationcurves.http://aipl.arsusda.gov/reference/goat/laccurv.htm.
AzzazH,KholifA,MuradH,HanfyM,&AbdelGawadM.2012.Utilizationofcellulolyticenzymestoim-prove the nutritive value of banana wastes and performance of lactating goats. Asian Journal ofAnimalandVeterinaryAdvances,7:664–673.
BarilletF.2007.Genetic improvement fordairyproduction insheepandgoats.SmallRuminantRe-search,70:60–75.
BillonP,MarnetP,&MaugrasJ.2005.Influenceofpulsationparametersonmilkingandudderhealthofdairygoats.En:ProceedingsoftheInternationalConferenceinPhysiologicalandTechnicalAspectsofMachineMilking,137–146.Nitra,Eslovaquia.
BoulangerA,GrosclaudeF,&MahéM.1984.Polymorphismedescaséinesβs1etβs2delachèvre(Ca-prahircus).GeneticsSelectionEvolution,16:157–176.
BoyazogluJ,&Morand-FehrP.1987.Systemsofgoatproductionandtheenviroment.En:ProceedingsoftheIVInternationalConferenceonGoats,8–13.Brasilia,Brasil.
BritoL,SilvaF,MeloA,CaetanoG,TorresR,RodriguesM,&MenezesG.2011.Geneticandenviron-mentalfactorsthatinfluenceproductionandqualityofmilkofAlpineandSaanengoats.Gene-ticsandMolecularResearch,10:3794–3802.
BruckmaierR.2003.Chronicoxytocintreatmentcausesreducedmilkejectionindairycows.JournalofDairyResearch,70:123–126.
BruckmaierR,&BlumJ.1998.Oxytocinreleaseandmilkremovalinruminants.JournalofDairyScien-ce,81:939–949.
BruckmaierR,&WellnitzO.2008.Inductionofmilkejectionandmilkremovalindifferentproductionsystems.JournalofAnimalScience,86:15–20.

BIBLIOGRAFÍA
60
Caja,G.2003.Produccióndelecheyordeñodecaprino.UniversidadAutónomadeBarcelona.http://goo.gl/CE1W8.
CapoteJ.1985.LaAgrupaciónCaprinaCanaria.En:LibrodeActasdelISimposioInternacionaldelaExplotaciónCaprinaenZonasÁridas,17–29.Fuerteventura,España.
CapoteJ,DelgadoJV,CamachoE,DarmaninN,&FresnoM.l993.LaganaderíatradicionalenlaisladeLaPalma:RazasAutóctonas.ActasdelIEncuentroGeografíaeHistoriadelArte,CabildoInsulardeLaPalma.TomoIII,160–172.
CapoteJ,DelgadoJV,FresnoM,CamachoM,&MolinaA.1998.MorphologicalvariabilityintheCa-narygoatpopulation.SmallRuminantResearch,27:167–172.
CapoteJ,LópezJL,&CajaG.2000.Elordeñoenlascabrascanarias.EdicionesLaPalma,Madrid,España,257pp.
CapoteJ,ArgüelloA,CastroN,LópezJ,&CajaG.2006.Correlationsbetweenuddermorphology,milkyield,andmilkingabilitywithdifferentmilkingfrequenciesindairygoats.JournalofDairyScience,89:2076–2079.
CapoteJ,CastroN,CajaG,FernándezG,BriggsH,&ArgüelloA.2008.Effectsofthefrequencyofmil-kingandlactationstageonmilkfractionsandmilkcompositioninTinerfeñadairygoats.SmallRuminantResearch,75:252–255.
CapoteJ,CastroN,CajaG,FernandezG,Morales-delaNuezA,&ArgüelloA.2009.TheeffectsofthemilkingfrequencyandmilkproductionlevelsonmilkpartitioninginTinerfeñadairygoats.Mil-chwissenschaft,64:239–241.
CapoteJ,TorresA,CastroN,Morales-delaNuezA,Moreno-IndiasI,Hernández-CastellanoL,&Ar-güelloA.2010.Algunosaspectosdiferencialesenelordeñodelascabrascanarias.RevistaAgropalca,11:22.
CapoteJ,ÁlvarezS,FresnoM,MéndezP,&ReigM.2012.AdaptacióndelascabrascanariaseneláridoSubsahariano.RevistaAgropalca,17:34.
CapucoA,WoodD,BaldwinR,McleodK,&PaapeM.2001.Mammarycellnumber,proliferation,andapoptosisduringabovinelactation:relationtomilkproductionandeffectofbST.JournalofDairyScience,84:2177–2187.
CarnicellaD,DarioM,AyresM,LaudadioV,&DarioC.2008.Theeffectofdiet,parity,yearandnumberofkidsonmilkyieldandmilkcomposition.SmallRuminantResearch,77:71–74.
CastelJ,RuizF,MenaY,&Sánchez-RodríguezM.2010.PresentsituationandfutureperspectivesforgoatproductionsystemsinSpain.SmallRuminantResearch,89:207–210.
ChilliardYR,FerlayA,BernardL,GaboritP,Raynal-LjutovacK,LauretA,&LerouxC.2006.Optimisinggoat’smilkandcheesefattyacidcomposition.En:ImprovingtheFatContentofFoods.Williams
BIBLIOGRAFÍA
61
C,&ButtrissJ.(Eds.)WoodheadPublishingLTD,Cambridge,UK,281–312.
ConstantinescuG,&ConstantinescuI.2010.Functionalanatomyofthegoat.En:GoatScienceandproduction.SolaimanS.(Ed.)BlackwellPublishing,Iowa,USA,89–137.
DasM,&SinghM.2000.Variationinbloodleucocytes,somaticcellcount,yieldandcompositionofmilkofcrossbredgoats.SmallRuminantResearch,35:169–174.
DavisA,FleetI,GoodeJ,HamonM,WalkerF,&PeakerM.1979.Changesinmammaryfunctionattheonsetoflactationinthegoat:correlationwithhormonalchanges.TheJournalofPhysiology,288:33–44.
Delgado-PertiñezM,Guzmán-GuerreroJ,CaravacaF,CastelJ,RuizF,González-RedondoP,AlcaldeMJ.2009.Effectofartificialvs.naturalrearingonmilkyield,kidgrowthandcost inPayoyaautochthonousdairygoats.SmallRuminantResearch,84:108–115.
DevendraC.1987.Herbivoresinthearidandwettropics.En:TheNutritionofHerbivores.HackerJ,&TernouthJ.(Eds.)AcademicPress,Sidney,Australia,23–46.
DíazJ,AlejandroM,RomeroG,MoyaF,&PerisC.2013.VariationinmilkcortisolduringlactationinMurciano-Granadinagoats.JournalofDairyScience,96:897–905.
DubeufJ.2005.Structural,marketandorganizationalconditionsfordevelopinggoatproductionsys-tems.SmallRuminantResearch,60:67–74.
Esteban-MuñozC.2008.RazasGanaderasEspañolasCaprinas.EdicionesFEAGAS,Madrid,España,410pp.
FAOSTAT.2011.FoodandAgricultureOrganizationoftheUnitedNations.http://faostat.fao.org.
FernándezH,HughesS,VigneJ,HelmerD,HodginsG,MiquelC,HänniC,LuikartG,&TaberletP.2006.Divergent mDNA lineages of goats in an early Neolithic site, far from the initial domestication areas.ProceedingsoftheNationalAcademyofSciencesoftheUnitedStatesofAmerica,103:15375–15379.
FerrandoG,&BozaJ.1990.Lactacióndelacabraylosfactoresquelaregulan.AnalesAcademiadeCienciasVeterinariasdeAndalucíaOriental,2:49–77.
FresnoM.1993.EstudiodelaproducciónlácteaenlaAgrupaciónCaprinaCanaria.TesisDoctoral.UniversidaddeCórdoba,España,168pp.
FresnoM,CapoteJ,CamachoE,DarmaninN,&DelgadoJV.1992.TheCanaryIslandsbreeds:past,presentandfuture.ArchivosdeZootecnia,41:513–518.
FresnoM,&ÁlvarezS.2007.Análisissensorialdelosquesosdecabradepastaprensada.ManualdecataparaelquesoMajoreroDOPyPalmeroDOP.InstitutoCanariodeInvestigacionesAgra-rias,LaLaguna,España,225pp.

BIBLIOGRAFÍA
62
FresnoM,RodríguezA,EscuderoA,GonzálezR,CaleroP,MenéndezS,HernándezA,López-Gayol,M,Álvarez,S.2008.¿Esposibleelaborarquesosdelechecrudasinriesgossanitarios?EjemplodelosquesosMajorerosyPalmeros.En:LibrodeActasdelIXSimposioIberoamericanosobrelaconservaciónyutilizaciónderecursoszoogenéticos,393–395.MardePlata,Argentina.
LeDuJ.1985.Functionalparametersaffectingtheefficiencyofmilkingmachineadaptedtosheepandgoat.En:Proceedingsofthe36thAnnualMeetingoftheEuropeanAssociationforAnimalProduction,430–431.Kallithea,Grecia.
GalalS.2005.Biodiversityingoats.SmallRuminantResearch,60:75–81.
Garcia-PenicheT,MontaldoH,Valencia-PosadasM,WiggansG,HubbardS,Torres-VázquezJ,She-pardL.2012.Breeddifferencesovertimeandheritabilityestimatesforproductionandrepro-ductiontraitsofdairygoatsintheUnitedStates.JournalofDairyScience,95:2707–2717.
GaughanJ,LaceteraN,ValtortaS,KhalifaH,HahnL,&MaderT.2009.Responseofdomesticanimalsto climate challenges. En: Biometeorology for Adaptation to Climate Variability and Change. EbiK,BurtonI,&McGregorG.(Eds.)Springer-VerlagPublisher,Berlín,Alemania,131-170.
GoetschA,ZengS,&GibsonT.2011.Factorsaffectinggoatmilkproductionandquality.SmallRumi-nantResearch,101:55–63.
GomesV,Della-LiberaA,PaivaM,MadureiraK,&Pereira-AraujoW.2006.Effectofthestageoflac-tation on somatic cell counts in healthy goats (Caprae hircus) breed in Brazil. Small Ruminant Research,64:30–34.
HaenleinG.2002.Relationshipofsomaticcellcountsingoatmilktomastitisandproductivity.SmallRuminantResearch,45:163–178.
HejtmankovaA,PivecV,TrnkovaE,&DragounovaH.2012.Effectofthelactationstageonconcentra-tionofwheyproteinsincaprineacidwhey.SmallRuminantResearch,105:206–209.
HuijpsK,LamT,&HogeveenH.2008.Costsofmastitis: factsandperception.JournalofDairyRe-search,75:113–120.
InstitutoCanariodeEstadística.2010.http://www.gobiernodecanarias.org/istac/.
JordanaJ,AmillsM,DiazE,AnguloC,SerradillaJ,&SanchezA.1996.Genefrequenciesofcaprineβs1-caseinpolymorphisminSpanishgoatbreeds.SmallRuminantResearch,20:215–221.
KnightC,&PeakerM.1982.Developmentofmammarygland.JournalofReproductionandFertility,65:521–536.
KnightC,&PeakerM.1984.Mammarydevelopmentandregressionduringlactationingoatsinrela-tiontomilksecretion.QuarterlyJournalofExperimentalPhysiology,69:331–338.
KnightC,&WildeC.1993.Mammarycellchangesduringpregnancyandlactation.LivestockProduc-tionScience,35:3–19.

BIBLIOGRAFÍA
63
Komara M, Boutinaud M, Ben Chedly H, Guinard-Flament J, & Marnet P. 2009. Once-daily milkingeffectsinhigh-yieldingalpinedairygoats.JournalofDairyScience,92:5447–5455.
KumeK,PapaL,&HajnoL.2012.Effectsonmilkproduction inF-1crossbredofAlpinegoatbreed(male)andAlbaniangoatbreed(female).ItalianJournalofAnimalScience,11:258–261.
LeDuJ.1985.Functionalparametersaffectingtheefficiencyofmilkingmachineadaptedtosheepandgoat.En:Proceedingsofthe36thAnnualMeetingoftheEuropeanAssociationforAnimalProduction,Kallithea,Grecia,pp.430–431.EAAP.
LeónJ,MacciottaN,GamaL,BarbaC,&DelgadoH.2012.CharacterizationofthelactationcurveinMurciano-Granadinadairygoats.SmallRuminantResearch,107:76–84.
LollivierV,Guinard-FlamentJ,Ollivier-BousquetsM,&MarnetP.2002.Oxytocinandmilkremoval:twoimportantsourcesofvariationinmilkproductionandmilkqualityduringandbetweenmilkings.ReproductionNutritionDevelopment,42,173–186.
MacuhovaJ,TancinV,&BruckmaierR.2004.Effectsofoxytocinadministrationonoxytocinreleaseandmilkejection.JournalofDairyScience,87:1236–1244.
MagaE,DaftariP,KueltzD,&PenedoM.2009.Prevalenceofalpha(s1)-caseingenotypesinAmericandairygoats.JournalofAnimalScience,87:3464–3469.
MAGRAMA.2011.MinisteriodeAgriculturaAlimentaciónyMedioAmbiente.http://www.magrama.gob.es.
MaltzE,SilanikoveN,&ShkolnikA.1982.EnergycostandwaterrequirementofblackBedouingoatsatdifferentlevelsofproduction.TheJournalofAgriculturalScience,98:499–504.
ManfrediE,PiacereA,LahayeP,&DucrocqV.2001.GeneticparametersoftypeappraisalinSaanenandAlpinegoats.LivestockProductionScience,70:183–189.
ManlongatN,YangT,HinckleyL,BendelR,&KriderH.1998.Physiologic-chemoattractant-inducedmi-grationofpolymorphonuclearleukocytesinmilk.ClinicalandVaccineImmunology,5:375–381.
MarnetP,&McKusickB.2001.Regulationofmilkejectionandmilkabilityinsmallruminants.LivestockProductionScience,70:125–133.
MartínezA,AcostaJ,Vega-PláJ,&DelgadoJV.2006.Analysisofthegeneticstructureofthecanarygoatpopulationsusingmicrosatellites.LivestockScience,102:140–145.
MataJ,BermejoL,deNascimentoL,&CamachoA.2010.Theproblemofgrazingplanninginanon-equilibrated environment, from the analytical procedure toward the system approach. Small RuminantResearch,89:91–101.
McDougallS,AnnissFM,&CullumA.2002.Effectoftransportstressonsomaticcellcountsindairygoats.ProceedingsoftheNewZealandofAnimalProduction,62:16–18.

BIBLIOGRAFÍA
64
McKusickBC,ThomasDL,&BergerYM.2003.Effectofomissionofmachinestrippingonmilkproduc-tionandparlorthroughputinEastFriesiandairyewes.JournalofDairyScience,86:680–687.
MehdidA,DíazJR,MartíA,VidalG,&PerisC.2013.Effectofestrussynchronizationondailysomaticcell count variation in goats according to lactation number and udder health status. Journal of DairyScience,96:4368–4374.
MinB,HartS,SahluT,&SatterL.2005.Theeffectofdietsonmilkproductionandcomposition,andonlactationcurvesinpastureddairygoats.JournalofDairyScience,88:2604–2615.
MocquotJC,&AuranT.1974.Effetsdedifférentesfréquencesdetraitesurlaproductionlaitièredescaprins.AnnalesdeGénétiqueetdeSélectionAnimale,6:463–476.
MiocB,PrpicZ,VnucecI,BaracZ,SusicV,SamarzijaD,&PavicV.2008.Factorsaffectinggoatmilkyieldandcomposition.Mljekarstvo,58:305–313.
MontaldoH,AlmanzaA,&JuárezA.1997.Geneticgroup,ageandseasoneffectsonlactationcurveshapeingoats.SmallRuminantResearch,24:195–202.
Morand-FehrP,BlanchartG,LeMensP,RemeufF,SauvantD,LenoirJ,LamberetG,LeJauoen,JC,&BasP.1986.Donnéerecentessurlacompositiondulaitdechévre.JournéesdelaRechercheOvineetCaprine,11:253–298.
Morand-FehrP,FedeleV,DecandiaM,&LeFrileuxY.2007.Influenceoffarmingandfeedingsystemsoncompositionandqualityofgoatandsheepmilk.SmallRuminantResearch,68:20–34.
MowlenA.2005.MarketinggoatdairyproduceintheUK.SmallRuminantResearch,60:207–213.
PaapeM,WiggansG,BannermanD,ThomasD,SandersA,ContrerasA,MoroniP,&Miller,R.2007.Monitoringgoatandsheepmilksomaticcellcounts.SmallRuminantResearch,68:114–125.
ParkY.2006.Goatmilk—chemistryandnutrition.En:HandbookofMilkofNon-bovineMammals.ParkY,&HaenleinG.(Eds.)BlackwellPublishing,Oxford,UK,34–58.
ParkY.2007.Rheologicalcharacterisiticsofgoatandsheepmilk.SmallRuminantResearch,68:73–87.
ParkY,JuárezM,RamosM,&HaenleinG.2007.Physico-chemicalcharacteristicsofgoatandsheepmilk.SmallRuminantResearch,68:88–113.
ParkY,&HaenleinG.2010.Milkproduction.En:GoatScienceandProduction.SolaimanS.(Ed.)Blac-kwellPublishing,Iowa,USA,275-292.
PeakerM,&BlatchfordD.1988.Distributionofmilkinthegoatmammaryglandanditsrelationtotherateandcontrolofmilksecretion.JournalofDairyResearch,55:41–48.
PerisS.1994.CaracterísticasdelacurvadelactaciónyaptitudalordeñomecánicodelacabraderazaMurciano-Granadina.TesisDoctoral.UniversidadAutónomadeBarcelona,Espa-ña,149pp.

BIBLIOGRAFÍA
65
PerisS,CajaC,SuchX,CasalsR,FerretA,&TorreC.1997.Influenceofkidrearingsystemsonmilkcom-positionandyieldofMurciano-Granadinadairygoats.JournalofDairyScience,80:3249–3255.
PerisS,CajaG,&SuchX.1999.RelationshipsbetweenudderandmilkingtraitsinMurciano-Granadi-nadairygoats.SmallRuminantResearch,33:171–179.
PirisiA,LauretA,&DubeufJ.2007.Basicandincentivepaymentsforgoatandsheepmilkinrelationtoquality.SmallRuminantResearch,68:167–178.
PulinaG,NuddaA,&BattaconeG.2008.Nutritionandqualityofgoat’smilk.En:DairyGoatsFeedingandNutrition.PulinaG,&CannasA.(Eds.)CABInternational,Bolonia,Italia,1–30.
RamírezM.2009.Guíadelosquesosespañoles.PublicacionesTécnicasAlimentarias,Madrid,Espa-ña,253pp.
RancourtM,FoisN,LavínM,TchakérianE,&VallerandF.2006.Mediterraneansheepandgoatspro-duction:Anuncertainfuture.SmallRuminantResearch,62:167–179.
Raynal-LjutovacK,PirisiA,deCrémouxR,&GonzaloC.2007.Somaticcellsofgoatandsheepmilk:Analytical,sanitary,productiveandtechnologicalaspects.SmallRuminantResearch,68:126–144.
RibeiroA,&RibeiroS.2010.Specialtyproductsmadefromgoatmilk.SmallRuminantResearch,89:225–233.
Romero-HuelvaM,Ramos-MoralesE,&Molina-AlcaideE.2012.Nutrientutilization,ruminalfermen-tation,microbialabundances,andmilkyieldandcompositionindairygoatsfeddietsincludingtomatoandcucumberwastefruits.JournalofDairyScience,10:6015–6026.
RovaiM.2001.CaracteresmorfológicosyfisiológicosqueafectanlaaptitudalordeñomecánicoenovejasderazaManchegayLacaune.TesisDoctoral.UniversidadAutónomadeBarcelona,España,281pp.
SalamaA.2005.Modifyingthelactationcurveindairygoats:Effectsofmilkingfrequency,dryperiod,andkiddinginterval.TesisDoctoral.UniversidadAutónomadeBarcelona,España,142pp.
SalamaA,SuchX,CajaG,RovaiM,CasalsR,AlbanellE,MarínMP,&MartíA.2003.Effectsofonceversus twice daily milking throughout lactation on milk yield and milk composition in dairygoats.JournalofDairyScience,86:1673–1680.
SalamaA,CajaG,SuchX,PerisS,SorensenA,&KnightC.2004.Changesincisternaluddercom-partmentinducedbymilkingintervalindairygoatsmilkedonceortwicedaily.JournalofDairyScience,87:1181–1187.
Sánchez-MacíasD,Morales-delaNuezA,Moreno-IndiasI,Hernández-CastellanoL,Mendoza-GrimónV,CastroN,&ArgüelloA.2011.Lipolysisandproteolysisprofilesoffreshartisanalgoatcheesemadewithrawmilkwith3differentfatcontents.JournalofDairyScience,94:5786–5793.
BIBLIOGRAFÍA
66
SandovalJ.2003.TratadodeAnatomíaVeterinaria,TomoIV.ImprentaSorbes,León,España.281pp.
Sanogo S, Shaker M, Nantoumé H, & Salem AF. 2012. Milk yield and composition of crossbredSahelian×Anglo-Nubiangoatsinthesemi-intensivesysteminMaliduringthepreweaningpe-riod.TropicalAnimalHealthandProduction,45:305–310.
SanzSampelayoM,ChilliardY,SchmidelyP,&BozaJ.2007.Influenceoftypeofdietonthefatcons-tituentsofgoatandsheepmilk.SmallRuminantResearch,68:42–63.
SchamsD,MayerH,ProkoppA,&WorstorffH.1984.Oxytocinsecretionduringmilkingindairycowswithregardtothevariationandimportanceofathresholdlevelformilkremoval.JournalofEndocrinology,102:337–343.
SchmidtGH.1971.Biologyoflactation.WH.FreemanandCompany,SanFrancisco,USA,317pp.
ScolozziC,MartiniM,&AbramoF.2003.Amethodforidentificationandcharacterizationofewe’smilkfatglobules.Milchwissenschaft,58:490–493.
SilanikoveN.2000a.Effectsofheatstressonthewelfareofextensivelymanageddomesticruminants.LivestockProductionScience,67:1–18.
SilanikoveN.2000b.Thephysiologicalbasisofadaptationingoatstoharshenviroments.SmallRumi-nantResarch,35:181–193.
SilanikoveN,LeitnerG,MerinU,&ProsserC.2010.Recentadvancesinexploitinggoat’smilk:Quality,safetyandproductionaspects.SmallRuminantResearch,89:110–124.
SinapisE,HatziminaoglouaI,MarnetP,AbasZ,&BolouA.2000.Influenceofvacuumlevel,pulsationrateandpulsatorratioonmachinemilkingefficiencyinlocalGreekgoats.LivestockProduc-tionScience,64:175–181.
SoryalK,ZengS,MinB,&HartS.2004.Effectoffeedingtreatmentsandlactationstagesoncom-positionandorganolepticqualityofgoatmilkDomiaticheese.SmallRuminantResearch,52:109–116.
Suárez-TrujilloA,CapoteJ,ArgüelloA,CastroN,Morales-delaNuezA,TorresA,MoralesJ,&RiveroM.2013.Effectsofbreedandmilkingfrequencyonudderhistologicalstructuresindairygoats.JournalofAppliedAnimalResearch,41:166–172.
TorresA,&CapoteJ.2011.Venezuelaylascabrascanarias.RevistaAgropalca,15:25.
Tziboula-ClarkeA.2003.Goatmilk.En:EncyclopediaofDairySciences.RoginskiH,&FuquayJ.(Eds.)AcademicPress,Cornwall,UK,1270–1279.
ValentiB,PaganoR,&AvondoM.2012.Effectofdietatdifferentenergylevelsonmilkcaseincom-position of Girgentana goats differing in CSN1S1 genotype. Small Ruminant Research, 105:135–139.

BIBLIOGRAFÍA
67
VigneJ,&HelmerD.2006.Wasmilka“secondaryproduct”intheOldWorldNeolithisationprocess?Itsroleinthedomesticationofcattle,sheepandgoats.Anthropozoologica,42:9–40.
WangP.1989.UddercharacteristicsinToggenburgdairygoats.SmallRuminantResearch,2:181–190.
Wellnitz O, Bruckmaier R, Albrecht C, & Blum J. (1999). Atosiban, an oxytocin receptor blockingagent:Pharmacokineticsandinhibitionofmilkejectionindairycows.JournalofDairyRe-search,66:1–8.
Werner-MisofC,PfafflM,MeyerH,&BruckmaierR.2007.Theeffectofchronicoxytocin-treatmentonthebovinemammaryglandimmunesystem.VeterinarniMedicina,11:475–486.
WildeC,&KnightC.1990.Milkyieldandmammaryfunctioningoatsduringandafteronce-dailymil-king.JournalofDairyResearch,57:441–447.
ZahraddeenD,ButswastI.,&MbapS.2009.Anoteonfactorsinfluencingmilkyieldoflocalgoatsun-dersemi-intensivesysteminSudansavannahecologicalzoneofNigeria.LivestockResearchforRuralDevelopment,21:34–37.
ZengS,&EscobarE.1995.Effectofparityandmilkproductiononsomaticcellcount,standardplatecountandcompositionofgoatmilk.SmallRuminantResearch,17:269–274.
ZengS,&EscobarE.1996.Effectofbreedandmilkingmethodonsomaticcellcount,standardplatecountandcompositionofgoatmilk.SmallRuminantResearch,19:169–175.
ZengS,EscobarE,&PophamT.1997.Dailyvariationsinsomaticcellcount,composition,andproduc-tionofAlpinegoatmilk.SmallRuminantResearch,26:253–260.
ZengS,ZhangL,WiggansG,ClayJ,LacroixR,&WangJG.2008.CurrentstatusofcompositionandsomaticcellcountinmilkofgoatsenrolledinDairyHerdImprovementProgramintheUnitedStates.En:NewResearchonLivestockScienceandDairyFarming.DiAlbertoP,&CostaC.(Eds.)NovaSciencePublisher,NewYork,USA,129–144.
ZygoyiannisD.1994.AnoteontheeffectofnumberandgenotypeofkidsonmilkyieldandcompositionofindigenousGreekgoats(CapraPrisca).AnimalProduction,58:423–426.


ARTÍCULO 1


ARTÍCULO 1
71
1071
J. Dairy Sci. 96 :1071–1074http://dx.doi.org/ 10.3168/jds.2012-5435 © American Dairy Science Association®, 2013 .
ABSTRACT
Thirty-six dairy goats of 3 breeds (Majorera, Tiner-feña, and Palmera) in mid lactation (124 ± 8 d in milk) were subjected unilaterally to once (×1) or twice daily milking (×2) for 5 wk to evaluate udder morphology, milk partitioning, and somatic cell count. Majorera and Palmera goats presented the highest and lowest udder depth values, respectively, whereas the differences be-tween initial and final cistern-floor and teat-floor dis-tances were not affected by milking frequency or breed factors. Cisternal and alveolar milk percentages were similar between ×1 and ×2 in the studied breeds. Milk-ing frequency did not affect milk composition in the cisternal fraction, suggesting a greater transfer of milk from the alveoli to the cistern during early udder filling. However, milking frequency caused diverse changes in the milk composition in the alveolar fraction, especially in fat, lactose, and total solids contents. No udder halves presented clinical mastitis during the experimental pe-riod, suggesting that ×1 does not impair udder health and indicating that the studied breeds are adapted to this milking frequency. Key words: milking frequency , milk partitioning , milk quality , dairy goat
Short Communication
Intramammary filling rate and cisternal capacity to store milk determine the choice of an adequate milking routine. Overfilling of the udder increases intramam-mary pressure and distention of the alveoli, which can compromise subsequent milk synthesis as has been reported by Peaker (1980). Animals with large cisterns are milked faster with simplified routines and are better at tolerating extended milking intervals (Knight and Dewhurst, 1994; Ayadi et al., 2003; Salama et al., 2003).
Techniques for determining cisternal and alveolar milk fractions have been improved and include the
use of an oxytocin receptor antagonist to block spon-taneous milk ejection (Wellnitz et al., 1999), allowing a reliable separation between both fractions. This is important because the udder morphology of some dairy goat breeds (e.g., Tinerfeña breed) is characterized by higher teat-floor distance (TF) than cistern-floor distance (CF), a negative circumstance that makes more difficult the emptying of cisternal milk by gravity (López et al., 1999).
The aim of the present study was to determine the effects of milking frequency on udder morphology, milk partitioning, composition of each fraction, and SCC of 3 dairy goat breeds (Majorera, Tinerfeña, and Palmera).
The present study was performed on the experimental farm of the Instituto Canario de Investigaciones Agrar-ias in Tenerife (Spain) on 36 dairy goats belonging to 3 different breeds: Majorera (n = 12), Tinerfeña (n = 12), and Palmera (n = 12). The experimental animal procedures were approved by the Ethical Committee of the Universidad de Las Palmas de Gran Canaria (Aru-cas, Spain). Goats with symmetrical udder halves were in third parity with 124 ± 8 DIM at the beginning of the experiment. The milking frequency before the start of the experimental period was once per day. During a 5-wk period, each goat was milked once daily in the left mammary gland (×1; at 0700 h), whereas the right mammary gland was milked twice daily (×2; at 0700 and 1700 h). The animals were fed with commercial concentrate, maize, lucerne, wheat straw, and a vita-min-mineral corrector in accordance with the guidelines issued for lactating goats by Institut National de la Recherche Agronomique (INRA, Paris, France; Jarrige, 1990). Goats were milked in a double 12-stall parallel milking parlor (Alfa Laval Iberia SA, Madrid, Spain) equipped with recording jars (4 L ± 5%) and a low-line milk pipeline. Milking was performed at a vacuum pres-sure of 42 kPa, a pulsation rate of 90 pulses/min, and a pulsation ratio of 60/40, in accordance with Capote et al. (2006). The milking routine included wiping dirt off teat ends and stripping 2 to 3 squirts of milk from each teat; machine milking and stripping milking, done by the operator to remove the milk remaining in the udder before cluster removal; and teat dipping in an
Short communication: Effects of milking frequency on udder morphology, milk partitioning, and milk quality in 3 dairy goat breeds A. Torres ,* N. Castro ,† L. E. Hernández-Castellano ,† A. Argüello ,†1 and J. Capote * * Instituto Canario de Investigaciones Agrarias, La Laguna, Tenerife 38200, Spain † Department of Animal Science, Universidad de Las Palmas de Gran Canaria, 35413 Arucas, Spain
Received February 15, 2012. Accepted October 26, 2012. 1 Corresponding author: [email protected]

Efecto de la frecuencia de ordeño sobre la producción, fraccionamiento lechero y parámetros de calidad de la leche en las cabras canarias
72
1072 TORRES ET AL.
Journal of Dairy Science Vol. 96 No. 2, 2013
iodine solution (P3-cide plus; Henkel Hygiene, Barce-lona, Spain).
Milk recording and sampling were done at wk 1, 3, and 5. Before the experiment, the goats were exposed to 3 wk of adaptation. In the first and second weeks, the goats began to enter the milking parlor in the af-ternoon, but the goats were not milked. During the third week of adaptation, the goats were milked once and twice daily in the left and right mammary gland, respectively, but the milk was not collected. Udder measurements of each goat were taken just before the first and the last milking of the experimental period. The following udder measurements were performed: CF and TF, recorded as the differences between initial and final measurements (ΔCF and ΔTF), and ud-der depth (UD), recorded as the difference in distance between the udder floor and the cistern floor.
Before the a.m. milking (24- and 14-h milking inter-vals for ×1 and ×2, respectively) on the sampling days, each goat was injected intravenously with 0.8 mg of an oxytocin receptor blocking agent (Tractocile; Ferring SAU, Madrid, Spain) inside a pen immediately before entering the parlor to record cisternal milk volume. After cisternal milk removal, the goats were injected intravenously with 2 IU of oxytocin (Oxiton; Laborato-rios Ovejero, León, Spain) to reestablish milk ejection to allow the measurement of alveolar milk. Cisternal and alveolar milk volumes were recorded by using the recording jars in the milking parlor and milk samples were collected separately for each udder half and frac-tion.
Milk samples (cisternal and alveolar fractions) were analyzed immediately after collection to determine milk composition and SCC. Protein, fat, lactose, TS, and SNF percentages were determined using a MilkoScan 133 analyzer (Foss Electric A/S, Hillerød, Denmark), and SCC using a Fossomatic 90 cell counter (Foss Electric A/S). Somatic cell count was calculated by a weighted average of the cisternal and alveolar SCC.
The statistical analysis used to evaluate the effects of breed and milking frequency on morphological param-eters of udder, milk partitioning and SCC was PROC MIXED of SAS (version 9.0; SAS Institute Inc., Cary, NC). The model included fixed effects of milking fre-quency (×1 or ×2) and breed (Majorera, Tinerfeña, or Palmera) and their interactions. The repeated state-ment was used to take into account repeated measures for each individual animal. Differences among the breeds and milking frequencies were evaluated using a multiple comparison test following the Tukey-Kramer method. Statistical differences were considered signifi-cant at P < 0.05. Data are presented as least squares means.
The ΔCF and ΔTF (Table 1) did not differ due to milking frequency or breed (P > 0.05). Knight and Dewhurst (1994) found that large cisternal size may explain the small negative effects of longer milking intervals on udder morphology because it is better pre-pared to accommodate greater milk accumulation, and may explain the absence of differences in the cistern descent of goat udders.
Majorera and Palmera goats presented the highest and lowest UD values, respectively (Table 1). The in-crease in UD values during the experimental period can be explained because ΔTF were lower than ΔCF, which implies that increasing the cistern depth increases the UD. The cistern depth is a consequence of teat place-ment of the studied goats whose teats are not located in the ventral portion of the udder (Capote et al., 2006).
Cisternal and alveolar milk percentages were similar between ×1 (24 h after milking) and ×2 (14 h after milking) in Majorera, Tinerfeña, and Palmera breeds (Table 1). Salama et al. (2004) did not find differences in cisternal milk fraction in Murciano-Granadina goats between ×1 and ×2 when milking intervals were 16 and 24 h (values ranged from 66 to 76%). The differences observed in the cisternal and alveolar fractions between breeds may be explained by the cisternal size, because greater cisterns are able to store more milk. Bruckmaier et al. (1997) explained that a large absolute cisternal volume implies that a large fraction of the milk is stored within the cisternal cavities and it varies according to breed.
Percentages of cisternal milk components (Table 1) were not affected by milking frequency (P > 0.05). This absence of differences between ×1 and ×2 goats might be due to the fact that approximately 80% of total milk was stored in the cisternal compartment and most of the transfer of milk from the alveoli and small milk ducts had already taken place. However, McKusick et al. (2002) observed marked differences in milk fat percentage in the cisternal fraction between different milking intervals in dairy ewes, in which the cistern was only capable of storing approximately 50% of the total milk volume, being more susceptible to changes in the transfer of milk components.
Alveolar milk of ×1 goats contained higher percent-ages of fat and TS than alveolar milk of ×2 goats, but these differences were significant only in the Majorera breed. McKusick et al. (2002) explained that a transfer of milk fat from the alveoli to the cistern occurs dur-ing early udder filling; however, this transfer no longer takes place during later intervals, resulting in an ac-cumulation of milk fat in the alveolar compartment. Alveolar milk was richer in fat content than cisternal milk in all breeds and milking intervals, which agrees

ARTÍCULO 1
73
Journal of Dairy Science Vol. 96 No. 2, 2013
SHORT COMMUNICATION: UNILATERAL MILKING FREQUENCY IN GOATS 1073
with observations in dairy cows by Waldmann et al. (1999) and dairy ewes by McKusick et al. (2002).
Milk protein percentage was unaffected by milk par-titioning (Table 1). This agrees with observations in dairy ewes by McKusick et al. (2002) and dairy cows by Ayadi et al. (2004), indicating that casein micelles passed more freely than fat globules from the alveolar to the cisternal compartment between milkings, result-ing in minimal differences in protein concentration of milk fractions.
Lactose content in cisternal milk was not affected by milking frequency (Table 1). Lactose content in alveolar milk in Majorera and Tinerfeña breeds was not different between ×1 and ×2 goats, whereas in the Palmera breed, lactose content was lower for ×1 goats (P < 0.05). The decrease in milk lactose percentage seems to be due to lactose passing from milk into blood through an impaired tight junction (Stelwagen et al., 1994) associated with extended milking intervals.
The results for the SCC showed that Tinerfeña goats presented higher values than Majorera and Palmera goats for ×1. Nevertheless, no differences in SCC level were found for ×2 between the studied breeds (Table 1). Harmon (1994) indicated that variability in SCC within a breed is greater than variability in SCC be-
tween breeds; therefore, it is possible that the results found could be due to an effect of individual variability.
Milking frequency did not affect the milk SCC. No coincident data exist about the effect of milking fre-quency on SCC levels. Salama et al. (2003) did not find significant differences in SCC between ×1 and ×2 goats in 32 Murciano-Granadina goats during an entire lactation, whereas Komara et al. (2009) conducted 2 experiments with Alpine goats and found differences only in experiment 1, which could be due to the dif-ferent number of goats used in each experiment (48 for experiment 1 and 8 for experiment 2) and to individual variability, as indicated by the authors.
No udder halves presented clinical mastitis during the experimental period, suggesting that ×1 does not impair udder health and indicating that the breeds are fully adapted to this milking frequency. Lacy-Hulbert et al. (2005) did not report differences in the number of clinical or subclinical infections between ×1 and ×2 in dairy cows. Nudda et al. (2002) suggested that high SCC levels induced by a change in milking frequency may be temporary and not necessarily due to mam-mary gland infections.
In conclusion, the fact that about 80% of total milk was stored in cisternal compartments for 14- and 24-h
Table 1. Morphological parameters of udder, milk partitioning, milk composition, and SCC of 3 dairy goat breeds milked once (×1) or twice (×2) daily1,2
Parameter3
Goat breed
SEM
P-value4Majorera Tinerfeña Palmera
×1 ×2 ×1 ×2 ×1 ×2 B F B × F
Initial UD (cm) 29.10a 28.10ab 26.65abc 25.55bc 24.80c 25.00c 0.422 0.001 0.41 0.74Final UD (cm) 29.95a 28.80ab 28.60ab 27.10ab 26.30b 25.60b 0.507 0.021 0.26 0.94ΔCF (cm) 0.85 0.70 1.95 1.55 1.50 0.60 0.293 0.40 0.42 0.87ΔTF (cm) 0.25 0.05 1.35 1.10 0.35 0.15 0.227 0.11 0.64 0.999Cisternal milk (%) 81.63a 80.21ab 81.62ab 82.04a 77.78b 78.23b 0.524 0.007 0.86 0.68 Fat (%) 3.70 3.66 3.63 3.47 3.78 3.83 0.049 0.11 0.60 0.66 Protein (%) 3.57bc 3.55bc 3.59abc 3.44c 3.80a 3.68ab 0.040 0.049 0.21 0.76 Lactose (%) 4.92 4.90 4.78 4.78 4.79 4.87 0.023 0.083 0.70 0.64 TS (%) 12.85a 12.80ab 12.73ab 12.39b 13.10a 13.08a 0.073 0.012 0.32 0.58 SNF (%) 9.19a 9.14a 9.07ab 8.92b 9.29a 9.25a 0.038 0.011 0.26 0.79Alveolar milk (%) 18.37b 19.79ab 18.38ab 17.96b 22.22a 21.77a 0.524 0.007 0.86 0.68 Fat (%) 6.03b 4.84d 5.86bc 4.94cd 7.07a 6.45ab 0.166 0.001 0.001 0.66 Protein (%) 3.52 3.54 3.59 3.50 3.69 3.58 0.039 0.51 0.47 0.79 Lactose (%) 4.78ab 4.87a 4.74ab 4.76ab 4.58c 4.70b 0.022 0.001 0.046 0.52 TS (%) 15.03b 13.94c 14.73bc 13.89c 16.05a 15.38ab 0.163 0.001 0.002 0.82 SNF (%) 9.00 9.12 9.00 8.96 8.98 8.99 0.036 0.61 0.71 0.68SCC (log/mL) 6.00b 5.90b 6.33a 6.26ab 6.08b 5.92b 0.051 0.010 0.25 0.93a–dMeans with different superscripts within the same row are different (P < 0.05).1Data are least squares means and standard error of means.2Morphological parameters were recorded before the first and the last milking of the experimental period. Milk parameters were measured at 24- and 14-h milking intervals for ×1 and ×2 goats, respectively.3UD = udder depth; ΔCF = difference between initial and final cistern-floor (CF) distance; ΔTF = difference between initial and final teat-floor (TF) distance.4B = breed; F = milking frequency.

Efecto de la frecuencia de ordeño sobre la producción, fraccionamiento lechero y parámetros de calidad de la leche en las cabras canarias
74
1074 TORRES ET AL.
Journal of Dairy Science Vol. 96 No. 2, 2013
milking intervals suggested a greater transfer of milk from the alveoli to the cistern during early udder fill-ing and, therefore, did not produce significant changes in the milk composition. However, milking intervals caused diverse changes in the milk composition in the alveolar fraction, especially in fat, lactose, and TS contents; therefore, it merits further investigation of the mechanisms responsible for milk ejection between milkings.
ACKNOWLEDGMENTS
This work was supported by Fondo Europeo de De-sarrollo Regional-Instituto Nacional de Investigación y Tecnología Agraria y Alimentaria (FEDER-INIA) RTA2009-00125.
REFERENCES
Ayadi, M., G. Caja, X. Such, and C. H. Knight. 2003. Use of ultra-sonography to estimate cistern size and milk storage at different milking intervals in the udder of dairy cows. J. Dairy Res. 70:1–7.
Ayadi, M., G. Caja, X. Such, M. Rovai, and E. Albanell. 2004. Effect of different milking intervals on the composition of cisternal and alveolar milk in dairy cows. J. Dairy Res. 71:304–310.
Bruckmaier, R. M., G. Paul, H. Mayer, and D. Schams. 1997. Machine milking of Ostfriesian and Lacaune dairy sheep: Udder anatomy, milk ejection and milking characteristics. J. Dairy Res. 64:163–172.
Capote, J., A. Argüello, N. Castro, J. L. López, and G. Caja. 2006. Correlations between udder morphology, milk yield and milking ability with different milking frequencies in dairy goats. J. Dairy Sci. 89:2076–2079.
Harmon, R. J. 1994. Physiology of mastitis and factors affecting so-matic cell counts. J. Dairy Sci. 77:2103–2112.
Jarrige, J. 1990. Alimentación de bovinos, ovinos y caprinos. 1st ed. Mundi-Prensa, Madrid, Spain.
Knight, C. H., and R. J. Dewhurst. 1994. Once daily milking of dairy cows: Relationship between yield loss and cisternal milk storage. J. Dairy Res. 61:441–449.
Komara, M., M. Boutinaud, H. Ben Chedly, J. Guinard-Flament, and P. G. Marnet. 2009. Once-daily milking effects in high-yielding alpine dairy goats. J. Dairy Sci. 92:5447–5455.
Lacy-Hulbert, S. J., D. E. Dalley, and D. A. Clark. 2005. The effects on once a day milking on mastitis and somatic cell count. Proc. N.Z. Soc. Anim. Prod. 65:137–142.
López, J. L., J. Capote, G. Caja, S. Peris, N. Darmanin, A. Argüello, and X. Such. 1999. Changes in udder morphology as a consequence of different milking frequencies during first and second lactation in Canarian dairy goats. Pages 100–103 in Milking and Milk Produc-tion of Dairy Sheep and Goats. F. Barillet, and N. P. Zervas, ed. Wageningen Pers, Wageningen, the Netherlands.
McKusick, B. C., D. L. Thomas, Y. M. Berger, and P. G. Marnet. 2002. Effect of milking interval on alveolar versus cisternal milk accumulation and milk production and composition in dairy ewes. J. Dairy Sci. 85:2197–2206.
Nudda, A., R. Bencini, S. Mijatovic, and G. Pulina. 2002. The yield and composition of milk in Sarda, Awassi, and Merino sheep milked unilaterally at different frequencies. J. Dairy Sci. 85:2879–2884.
Peaker, M. 1980. The effect of raised intramammary pressure on mam-mary function in the goat in relation to the cessation of lactation. J. Physiol. 301:415–428.
Salama, A. A. K., G. Caja, X. Such, S. Peris, A. Sorensen, and C. H. Knight. 2004. Changes in cisternal udder compartment induced by milking interval in dairy goats milked once or twice daily. J. Dairy Sci. 87:1181–1187.
Salama, A. A. K., X. Such, G. Caja, M. Rovai, R. Casals, E. Albanell, M. P. Marín, and A. Martí. 2003. Effects of once versus twice daily milking throughout lactation on milk yield and milk composition in dairy goats. J. Dairy Sci. 86:1673–1680.
Stelwagen, K., S. R. Davis, V. C. Farr, C. G. Prosser, and R. A. Sher-lock. 1994. Mammary epithelial cell tight junction integrity and mammary blood flow during an extended milking interval in goats. J. Dairy Sci. 77:426–432.
Waldmann, A., E. Ropstad, K. Landsverk, K. Sørensen, L. Sølverød, and E. Dahl. 1999. Level and distribution of progesterone in bo-vine milk in relation to storage in the mammary gland. Anim. Reprod. Sci. 56:79–91.
Wellnitz, O., R. M. Bruckmaier, C. Albrecht, and J. W. Blum. 1999. Atosiban, an oxytocin receptor blocking agent: Pharmacokinet-ics and inhibition of milk ejection in dairy cows. J. Dairy Res. 66:1–8.

ARTÍCULO 2


ARTÍCULO 2
77
Please cite this article in press as: Torres, A., et al., Comparison between two milk distribu-tion structures in dairy goats milked at different milking frequencies. Small Ruminant Res. (2013),http://dx.doi.org/10.1016/j.smallrumres.2013.04.013
ARTICLE IN PRESSG ModelRUMIN-4519; No. of Pages 6
Small Ruminant Research xxx (2013) xxx–xxx
Contents lists available at SciVerse ScienceDirect
Small Ruminant Research
journa l homepage: www.e lsev ier .com/ locate /smal l rumres
Comparison between two milk distribution structures indairy goats milked at different milking frequencies
A. Torresa, N. Castrob, A. Argüellob, J. Capotea,∗
a Instituto Canario de Investigaciones Agrarias (ICIA), La Laguna 38200, Tenerife, Spainb Department of Animal Science, Universidad de Las Palmas de Gran Canaria, Arucas 35413, Spain
a r t i c l e i n f o
Article history:Received 6 March 2013Received in revised form 26 April 2013Accepted 30 April 2013Available online xxx
Keywords:Milk yieldMilk partitioningMilking frequencyDairy goat
a b s t r a c t
Twenty-four dairy goats of 3 breeds (Majorera, Tinerfena, and Palmera) in mid lactation(110 ± 7 d in milk) were milked unilaterally at 2 frequencies (once: X1 or twice daily: X2)for 6 wk to evaluate milk yield and milk composition and to compare two milk distribu-tion structures. On the sampling days, milk volumes of each udder halves were recordedand analyzed. Milk partitioning was divided into: cisternal (CM) and alveolar milk (AM);and into: machine milk (MM), machine stripping milk (MSM), and residual milk (RM). InMajorera and Tinerfena breeds did not find significant differences in milk yield and milkcomposition due to milking frequency. In contrast, Palmera goats had an increase of 14%in milk yield when they were milked X2 compared with X1, but the protein content wassignificantly higher in the milk of X1 (3.92%) than X2 (3.72%). Furthermore, the absenceof differences in protein daily yield between X1 and X2, suggested that cheese yield couldnot be maintained. Milking frequency did not affect CM and AM percentages in the studiedbreeds. Regarding breed factor, Majorera and Palmera had the highest and lowest CM per-centages, respectively, both in X1 and X2. On the other hand, MM and MSM percentages didnot differ due to milking frequency in Tinerfena and Palmera breeds. However, Majoreragoats had significant differences in MM (77.29 vs. 71.66%) and MSM (12.67 vs. 17.41%) forX1 and X2, respectively. A breed effect was observed on MM and MSM fractions: Major-era goats had higher MM percentages, while Tinerfena and Palmera goats had higher MSMpercentages. RM fraction was not affected by milking frequency or breed factors. Finally, nosignificant correlation coefficients were detected when comparing CM and AM with MM,MSM and RM fractions, which indicates that both milk partitioning structures did not seemto be comparable between them, at least in goat udders that have a more horizontal teatinsertion.
© 2013 Elsevier B.V. All rights reserved.
1. Introduction
The mammary glands in ruminants are composed offunctionally separate glands (four in cows and two ingoats and sheep). Each gland has its own secretory tis-sue and cisternal cavities, and each gland is drained by
∗ Corresponding author at: ICIA, Apto. de correos 60, La Laguna 38200,Tenerife, Spain. Tel.: +34 922542800; fax: +34 922542898.
E-mail addresses: [email protected], [email protected] (J. Capote).
a separate teat (Bruckmaier and Blum, 1998). Accordingto Wilde and Knight (1990), the unilateral alteration ofmilking frequency indicates that milk yield changes areimposed by local intramammary mechanisms and affectsonly the treated gland. In addition, Wall and McFadden(2008) explained that experimental design that appliedsingle gland milking eliminated variation among animalsdue to environment, nutrition and genetic factors andexposed each gland to the same systemic factors.
Milk is stored in two interconnected anatomical uddercompartments that determine the milkability (Salama
0921-4488/$ – see front matter © 2013 Elsevier B.V. All rights reserved.http://dx.doi.org/10.1016/j.smallrumres.2013.04.013

Efecto de la frecuencia de ordeño sobre la producción, fraccionamiento lechero y parámetros de calidad de la leche en las cabras canarias
78
Please cite this article in press as: Torres, A., et al., Comparison between two milk distribu-tion structures in dairy goats milked at different milking frequencies. Small Ruminant Res. (2013),http://dx.doi.org/10.1016/j.smallrumres.2013.04.013
ARTICLE IN PRESSG Model
RUMIN-4519; No. of Pages 6
2 A. Torres et al. / Small Ruminant Research xxx (2013) xxx–xxx
et al., 2004). Cisternal milk (CM) is located in the cisternalcompartment consisting of the gland cistern, the teat cis-terns and the large ducts; while alveolar milk (AM) is storedwithin the alveoli and small interlobular ducts (Marnet andMcKusick, 2001). Milk partitioning between both compart-ments varies according to specie, breed, age, lactation stage,parity and milking interval (Salama et al., 2004; Castilloet al., 2008). Partitioning between CM and AM was for-merly determined by drainage of cisternal milk, by using ateat cannula (Peaker and Blatchford, 1988), but new tech-niques include the use of an oxytocin receptor antagonistto block spontaneous milk ejection (Wellnitz et al., 1999).
Differing from dairy cows, small ruminants have pro-portionally larger cisterns which play an important rolein the storage of milk between milkings and can greatlyaffect the removal of milk at the time of milking (Marnetand McKusick, 2001). Furthermore, udder morphology ofmany goat and sheep breeds is characterized by having amore horizontal teat insertion (Rovai et al., 2008; Torreset al., 2013), a circumstance that implies manual inter-vention for complete milk removal. Milk collected duringmilking can be divided into: machine milk (MM) obtainedbetween attaching the line and the final cessation of themilk flow without the operator having to manipulate theudder; and machine stripping milk (MSM) which requiresmanual intervention to remove milk not obtained by themachine. Moreover, a milk fraction known as residual milk(RM) remains in the mammary tissue and it can only be col-lected after administration of pharmacological amounts ofoxytocin (Bruckmaier and Blum, 1998).
The goals of this study were to evaluate the effects ofunilateral milking frequency on milk yield, milk composi-tion and milk component yield; and to compare two milkdistribution structures in 3 dairy goat breeds milked at 2frequencies, and whether there are relevant correlationsamong them to establish a relationship between CM andAM with MM, MSM and RM.
2. Materials and methods
The experimental animal procedures were approved by the EthicalCommittee of the Universidad de Las Palmas de Gran Canaria (Arucas,Spain). A total of 24 dairy goats in mid lactation (110 ± 7 DIM) of Majorera(n = 8; 2.7 ± 0.4 L/d; parity = 3.4 ± 1.1), Tinerfena (n = 8; 2.3 ± 0.5 L/d; par-ity = 3.1 ± 1.3), and Palmera (n = 8; 1.8 ± 0.4 L/d; parity = 3.1 ± 1.2) breedsfrom the experimental farm of the Instituto Canario de InvestigacionesAgrarias (ICIA, Tenerife, Spain) were used. The animals were fed with com-mercial concentrate, maize, lucerne, wheat straw and a vitamin–mineralcorrector in accordance with the guidelines issued for lactating goatsby Institut National de la Recherche Agronomique (INRA, Paris, France;Jarrige, 1990). The milking frequency before the start of the experimentalperiod was once per day. Goats were milked in a double 12-stall paral-lel milking parlor equipped with recording jars (4 L ±5%) and a low-linemilk pipeline. Milking was performed at a vacuum pressure of 42 kPa, apulsation rate of 90 pulses/min, and a pulsation ratio of 60/40. The milk-ing routine included wiping dirt off teat ends and stripping 2–3 squirtsof milk from each teat, machine milking, machine stripping before clus-ter removal, and teat dipping in an iodine solution (P3-cide plus; HenkelHygiene, Barcelona, Spain).
During a 6-wk period, goats were milked once daily in the left mam-mary gland (X1; at 07:00 h), whereas the right mammary gland wasmilked twice daily (X2; at 07:00 and 17:00 h). Before the start of the exper-imental period, the goats were exposed to 3 wk of adaptation to X2. Milkvolumes were measured by using the recording jars in the milking parlorfor each udder half. On the sampling days (wk 2, 4, and 6), milk yield wasrecorded as MM plus MSM once daily for X1, and MM and MSM twice
daily for X2, according to Capote et al. (2008). Fat (4.0%)-corrected milk(FCM) was calculated according to Salama et al. (2003). Milk samples wereanalyzed immediately after collection to determine milk composition. Fat,protein, lactose and total solids were determined using a MilkoScan 133analyzer (Foss Electric, Hillerod, Denmark). Milk composition of X2 wascalculated by a weighted average from the a.m. and the p.m. milk compo-sition. Milk component yields were calculated by multiplying milk yieldby corresponding milk component percentages.
Milk partitioning was calculated at the a.m. milking (24- and 14-hmilking intervals for X1 and X2, respectively). During wk 1, 3, and 5, onthe sampling days, each goat was injected intravenously with 0.8 mg ofan oxytocin receptor blocking agent (Tractocile; Ferring, Madrid, Spain)inside a holding pen immediately before entering the milking parlor torecord CM volume. After CM removal, the goats were injected intra-venously with 2 IU of oxytocin (Oxiton; Laboratorios Ovejero, León, Spain)to reestablish milk ejection, and AM was measured. During wk 2, 4, and 6,on the sampling days, milk partitioning was divided into MM, MSM per-formed by the same milker, and RM obtained after injecting goats with2 IU of oxytocin.
A MIXED model procedure (SAS 9.0; SAS Institute Inc., Cary, NC) wasused. The statistical model included the fixed effects of milking frequency(X1 or X2) and breed (Majorera, Tinerfena, or Palmera), the random effectof the half-udder nested within animal, the respective interactions, andthe residual error:
Yijk = � + Bi + Mj + Gk + (BM)ij + εijk
where Yijk is the observation of the dependent variable, � is the overallmean, Bi is the effect of the breed i (i = 3), Mj is the effect of the milking fre-quency j (j = 2), Gk is the random effect, (BM)ij is the effect of the interactionbetween breed and milking frequency, εijk is the residual error.
Differences among the breeds and milking frequencies were evaluatedusing a multiple comparison test following the Tukey–Kramer method.Pearson’s correlation coefficients between milk fractions were also calcu-lated. Statistical differences were considered significant at P < 0.05. Dataare presented as least squares means.
3. Results
Milk yield and FCM (Table 1) did not differ due to milk-ing frequency in Majorera and Tinerfena breeds (P > 0.05).Nevertheless, Palmera breed had a significant increase inmilk yield by 14% when they were milked X2 comparedwith X1. Furthermore, FCM of X2 was higher than in X1udder halves by 18% in Palmera goats (P < 0.05). Regardingbreed effect, Majorera goats had higher milk yield valuesthan Palmera goats both in X1 and X2 (P < 0.05).
No differences were found in fat percentages in the stud-ied breeds (Table 1) when the milking frequency effect wasconsidered (P > 0.05). Besides, Palmera breed had highermilk fat content than Majorera and Tinerfena both in X1 andX2, but the differences were significant only in X2. Milkingfrequency did not have effect on the protein percentages inMajorera and Tinerfena goats (Table 1). However, Palmeragoats had higher milk protein content in X1 than in X2udder halves (P < 0.05). Regarding breed effect, Majoreraand Tinerfena had lower protein fraction than Palmera bothin X1 and X2 (P < 0.05).
No significant differences were detected in lactose con-tent among breeds and milking frequencies (Table 1),ranging from 4.78 to 4.86% in the studied conditions. Like-wise, total solids percentages were not affected due tomilking frequency (Table 1) (P > 0.05). Moreover, differ-ences in total solids percentages were found when thebreed effect was considered (P < 0.05). Thus, Palmera goatshad higher values than Majorera and Tinerfena both in X1and X2.

ARTÍCULO 2
79
Please cite this article in press as: Torres, A., et al., Comparison between two milk distribu-tion structures in dairy goats milked at different milking frequencies. Small Ruminant Res. (2013),http://dx.doi.org/10.1016/j.smallrumres.2013.04.013
ARTICLE IN PRESSG Model
RUMIN-4519; No. of Pages 6
A. Torres et al. / Small Ruminant Research xxx (2013) xxx–xxx 3
Table 1Milk yield, milk composition and milk component yield of each udder half of three dairy goat breeds milked once (X1) or twice (X2) daily.a
Parameter Goat breed SEM
Majorera Tinerfena Palmera
X1 X2 X1 X2 X1 X2
Milk yield (L/d) 1.39ab 1.51a 1.27ab 1.31ab 1.04c 1.19b 0.049FCMb (L/d) 1.34a 1.50a 1.21ab 1.28a 1.05b 1.24a 0.045Fat (%) 3.79b 3.94b 3.76b 3.88b 4.06ab 4.29a 0.060Protein (%) 3.67bc 3.59c 3.63bc 3.51c 3.92a 3.72b 0.041Lactose (%) 4.83 4.86 4.85 4.83 4.78 4.81 0.028
Total solids (%) 12.99b 13.06b 12.92b 12.91b 13.58a 13.53a 0.083
Fat (g/d) 52.47a 59.42a 46.90ab 50.00ab 41.77b 50.98a 1.785Protein (g/d) 50.95a 54.40a 44.78ab 44.73ab 40.79b 44.45ab 1.504Lactose (g/d) 67.20ab 73.65a 61.70ab 64.22ab 49.96c 57.48b 2.513
Total solids (g/d) 180.42a 197.58a 162.07ab 168.04a 141.01b 161.42a 5.936
a–cMeans with different superscripts within the same row are different (P < 0.05).a Data are least squares means and standard error of means.b FCM = total milk yield (L/d) × (0.400 + 0.150 × total fat content (%)).
Majorera and Tinerfena goats were not different in milkcomponent yields between X1 and X2 (Table 1). In contrast,Palmera goats had significant increases by 22%, 15%, and14% in X2 daily yields of fat, lactose and total solids, respec-tively, compared with X1. However, protein yield did notsignificantly increase as did the other milk components.
CM and AM percentages (Table 2) did not differ due tomilking frequency in the studied breeds (P > 0.05). Majoreraand Palmera had the highest and lowest CM percentages,respectively, both in X1 and X2 (P < 0.05). In the same way,MM and MSM percentages (Table 2) were not affectedby milking frequency in Tinerfena and Palmera breeds(P > 0.05). However, Majorera goats had higher and lowervalues in MM and MSM fractions, respectively, in X1 withregard to X2. RM percentages were not affected by the milk-ing frequency and breed factors (P > 0.05), ranging from10.66 to 14.49% in the studied conditions.
Correlation coefficients among milk fractions arereported in Table 3. High negative correlations betweenMM and MSM fractions (P < 0.05) were observed forX1 (Majorera, r = −0.76; Tinerfena, r = −0.94; Palmera,r = −0.90) and X2 (Majorera, r = −0.72; Tinerfena, r = −0.70;Palmera, r = −0.90). Moreover, MM and RM were only sig-nificantly correlated for X1 (Majorera, r = −0.82; Tinerfena,
r = −0.93; Palmera, r = −0.86). In addition, no significantcorrelation coefficients were found between MSM and RMfor X1 and X2. Finally, CM and AM were not correlated withMM, MSM and RM fractions in the studied breeds milkedat X1 and X2 (P > 0.05).
4. Discussion
The increase in milk yield in Palmera goats was higherthan the values reported in Tinerfena goats (6%) by Capoteet al. (1999) and Damascus goats (7%) by Papachristoforouet al. (1982) and similar to loss caused by X1 in Alpinegoats (16%) by Komara et al. (2009). The increase in FCMin Palmera goats was comparable with the FCM valuereported in Murciano-Granadina goats (18%) by Salamaet al. (2003). However, the goats of those studies weremilked with the same frequency in both glands. The unilat-eral milking frequency effect indicates that the increase inmilk yield is a response strictly at the level of the mam-mary gland via local factors, and not due to the greateravailability of nutrient supply caused by the suppressionof milking in the opposite gland (Nudda et al., 2002; Walland McFadden, 2008).
Table 2Milk fractions of three dairy goat breeds milked once (X1) or twice (X2) daily.a,b
Fractionc Goat breed SEM
Majorera Tinerfena Palmera
X1 X2 X1 X2 X1 X2
CM (%) 82.28a 81.75a 80.12ab 80.30ab 77.22bc 76.70c 0.528AM (%) 18.41c 18.77c 20.15bc 19.99bc 23.02ab 23.43a 0.498MM (%) 77.29a 71.66b 67.21bc 61.21c 65.86bc 59.07c 1.366MSM (%) 12.67c 17.41b 19.71b 24.94ab 22.34ab 27.57a 1.100RM (%) 10.66 11.61 12.96 14.49 12.48 13.24 0.449
a–cMeans with different superscripts within the same row are different (P < 0.05).a Data are least square means and standard error of means.b Milk fractions were measured at 24- and 14-h milking intervals for X1 and X2 goats, respectively.c CM, cisternal milk; AM, alveolar milk; MM, machine milk; MSM, machine stripping milk; RM, residual milk.

Efecto de la frecuencia de ordeño sobre la producción, fraccionamiento lechero y parámetros de calidad de la leche en las cabras canarias
80
Please cite this article in press as: Torres, A., et al., Comparison between two milk distribu-tion structures in dairy goats milked at different milking frequencies. Small Ruminant Res. (2013),http://dx.doi.org/10.1016/j.smallrumres.2013.04.013
ARTICLE IN PRESSG Model
RUMIN-4519; No. of Pages 6
4 A. Torres et al. / Small Ruminant Research xxx (2013) xxx–xxx
Table 3Pearson’s correlation coefficients matrix among milk fractions of three dairy goat breeds milked once (above diagonal) or twice (below diagonal) daily.
Breed Fractiona
CM AM MM MSM RM
CMMajorera −0.885* −0.285 0.379 0.181Tinerfena −0.989* 0.084 −0.050 −0.159Palmera −0.987* −0.051 0.162 0.007
AMMajorera −0.892* −0.007 −0.245 0.173Tinerfena −0.935* −0.189 0.143 0.232Palmera −0.990* 0.008 −0.136 0.023
MMMajorera 0.411 −0.550 −0.761* −0.823*
Tinerfena 0.067 −0.082 −0.941* −0.933*
Palmera 0.617 −0.586 −0.897* −0.863*
MSMMajorera −0.164 0.314 −0.721* 0.139Tinerfena 0.158 −0.210 −0.702* 0.694Palmera −0.615 0.636 −0.895* 0.666
RMMajorera 0.128 0.053 −0.050 −0.258Tinerfena −0.476 0.433 −0.253 −0.107Palmera 0.024 −0.107 −0.406 0.006
* P < 0.05.a CM, cisternal milk; AM, alveolar milk; MM, machine milk; MSM, machine stripping milk; RM, residual milk.
The differences observed in milk yield in Majorera, Tin-erfena and Palmera goats between X1 and X2 may beexplained as a consequence of cisternal capacity of eachbreed (Bruckmaier and Blum, 1998). A large voluminouscistern takes more time in filling up, delaying the effectsof the intramammary feedback inhibitor, intramammarypressure, or tight junction integrity on milk transferencefrom the alveoli to the cisterns, during the filling of theudder (Capote et al., 2008). Recently, serotonin has beenproposed as a feedback inhibitor of lactation, being a com-ponent involved in milk regulation (Hernandez et al., 2008).However, milk yields did not differ between treatment andcontrol halves, which suggest that serotonin is not a localfactor.
In addition, Silanikove et al. (2000) showed in goatsand cows that the plasmin-induced �-casein f(1–28) pep-tide can serve as a local regulator on milk secretion byfunctioning as a potassium channel blocker, which wassubsequently confirmed in dairy cows by Silanikove et al.(2009). It is predicted that for milking intervals of less than20 h in goats and 18 h in cows, the concentration of casein-derived peptides, including the active component �-caseinf(1–28), would be higher in the cistern than in the alveoli;therefore, the alveoli will not be exposed to the full impactof the negative feedback signal of this peptide. Extendingmilk stasis beyond these times exceeds the storage capac-ity of the cistern, resulting in the equilibration of �-caseinf(1–28) concentration between the cistern and the alveoli(Silanikove et al., 2010).
Thus, animals with smaller udder size, and hence ofcisternal compartment, such as Palmera goats (Suárez-Trujillo et al., 2013; Torres et al., 2013), are more affectedby mechanisms of feedback inhibition. Silanikove et al.(2010) explained that high milk producing goats, as Saa-nen, selected to high alveolar to cistern compartment ratio,are the most sensitive to changes in milking frequency. Incontrast, medium milk producing goats, as some Spanishbreeds, may attain their genetic potential for milk yield in
X1 regimen due to selection for high cistern capacity. Thephysiological explanation relates to the suggestion that �-casein f(1–28) is effective only in the alveoli where it isin contact with the epithelial cells. Exposing the alveoli tohigh concentration of �-casein f(1–28) will induce disrup-tion of the tight junction (Silanikove et al., 2010).
Milk fat content was not affected by milking frequencywhich is in accordance with Komara et al. (2009), who alsodid not observe differences in fat globule size between X1and X2 for Alpine goats. However, Salama et al. (2003)showed that milk of X1 goats had a 10% more fat con-tent than milk of X2 goats. Milk fat is considered to bethe most variable component in ruminant milk, due todiffering regulatory mechanisms for secretion of milk fatglobules relative to the components in the aqueous phaseof milk and to the transfer between alveolar and cister-nal compartments (Salama et al., 2003). X1 managementin high-yielding goats is a potent stressor that is able todisturb alveolar milk ejection because alveolar milk wasshown to contain up to 75% of milk fat when milk ejectionwas inhibited (Labussière, 1988). However, the absence ofsignificant differences in the studied breeds might be dueto the fact that approximately 80% of total milk was storedin the cisternal compartment and most of the transfer ofmilk fat from the alveoli to the cistern had already takenplace.
Milk protein concentration was significantly higher inX1 than in X2 udder halves in Palmera goats, which agreeswith observations in dairy goats by Komara et al. (2009)and dairy ewes by Nudda et al. (2002). Salama et al. (2003)explained that the concentration effect of the protein in X1with respect to X2 was due to the milk volume, this waslower with X1 but the casein synthesized remained andbecame more concentrated in the milk.
In goats, Capote et al. (1999) found that milking fre-quency did not affect lactose percentage and reiterate theassertion that lactose is the milk component least influ-enced by breed and milking factors, indicating a similar

ARTÍCULO 2
81
Please cite this article in press as: Torres, A., et al., Comparison between two milk distribu-tion structures in dairy goats milked at different milking frequencies. Small Ruminant Res. (2013),http://dx.doi.org/10.1016/j.smallrumres.2013.04.013
ARTICLE IN PRESSG Model
RUMIN-4519; No. of Pages 6
A. Torres et al. / Small Ruminant Research xxx (2013) xxx–xxx 5
performance of the synthetic activity of the mammarygland.
In the studied breeds there were no significantdifferences found in total solids content between X1and X2. There is disagreement about the milking fre-quency effects on total solids percentages. Capote et al.(1999) had observed a lower total solids fraction inX1 (12.48%) than X2 (12.84%), while for Salama et al.(2003) the total solids were higher in X1 (13.60%) thanX2 (12.90%) in goats during an entire lactation. Finally,the fact that Palmera goats had higher percentages oftotal solids than Majorera and Tinerfena both in X1and X2, may be explained because the Palmera hadhigher percentages of fat and protein than the other twobreeds.
The increases in fat, lactose, and total solids yields wereconsistent with the significant increase in the milk produc-tion of Palmera goats. However, the absence of differencesin protein yield between X1 and X2 can be explained bya lower concentration of protein in X2, suggesting thatcheese yield could not be maintained. Marnet and Komara(2008) explained that the regulation of milk componentssynthesis is dependent on the duration of the milkinginterval, which can influence cheese-making capacity andcheese quality.
Despite the differences in milk yield in Palmera goatsbetween X1 and X2, there were not differences in the dis-tribution of milk in the udder. Salama et al. (2004) did notfind differences in milk accumulation rates in the cisternalcompartment at 16 and 24 h in Murciano-Granadina goatsmilked X1 or X2, whereas Torres et al. (2013) suggested thatthe high percentages of milk stored in cisternal compart-ments for 14- and 24-h milking intervals may be explainedby a greater transfer of milk from the alveoli to the cisternsduring early udder filling. The differences in milk partition-ing among breeds were due to the cisternal size of eachbreed that influences the capacity to store milk in this com-partment. For example, Rovai et al. (2008) found CM–AMratio of 59–41 and 77–23 for Manchega and Lacauneewes, respectively, where Lacaune breed presented agreater cisternal area than Manchega breed (24.0 vs.12.4 cm2).
MM and MSM percentages were higher and lower,respectively, in X1 udder halves in the studied breeds, butthe differences were significant only in Majorera goats.Previously, Capote et al. (2009) found no differences inMM percentages between X1 (67.8%) and X2 (64.5%) inTinerfena goats of high milk production, while MSM per-centages were higher in X2 (27.8%) than X1 (20.7%), andRM percentages were higher in X1 (11.5%) than X2 (7.7%),suggesting that an increase in milking frequency in a nor-mal routine implies greater stimulation and thus a highermilk drop to the cisterns. Moreover, Majorera goats hada higher and lower MM and MSM percentages, respec-tively, than Tinerfena and Palmera goats. Caja et al. (1999)explained that quantities of milk in each partition obtainedby mechanical milking depend on the udder morphologyand the development of cisternal and canalicular systems;which suggests a high variability between breeds and evenbetween animals of same breed. RM percentages were notaffected by the breed, and they were similar than those
reported in Murciano-Granadina (9–11%; Peris et al., 1996)and Tinerfena (7–12%; Capote et al., 2009) goats.
In addition, Marnet and McKusick (2001) reported sig-nificant increases in MSM percentage without proportionalmodification of AM or CM volume in Lacaune ewes betweenthe years 1982 and 1992. The increase in MSM fraction wasa consequence of the tendency to have more horizontallyplaced teats in the udder which increases cisternal stor-age capacity to improve milk production (Bruckmaier et al.,1997; Marnet and McKusick, 2001).
High negative correlations observed between MM andMSM fractions both in X1 and X2 in the studied breeds dif-fers with these observed by Peris et al. (1996) and Caja et al.(1999) who did not find significant correlations betweenboth fractions. However, it is clear that the correlationbetween both them could help in the selection of goats toimprove the milkability. Furthermore, Peris et al. (1996)noted that the negative correlation between MM and RMin goats could reduce the milking time because they accu-mulate more milk into the cisterns.
Although, CM and AM (Salama et al., 2004) or MM, MSMand RM percentages (Capote et al., 2008) have a strongdependence on udder morphology, the absence of signif-icant correlation coefficients between CM and AM withMM, MSM, and RM fractions impeded the establishment ofa relationship between both milk partitioning structures,at least in goat udders that have a more horizontal teatinsertion.
5. Conclusion
The results demonstrated that X2 practice did notimprove the milk production of the Majorera and Tin-erfena breeds, so it is a consequence of the adaptationof these breeds to X1, which is an interesting issue ingoat production systems, because it requires fewer variablecosts. Nevertheless, the high increase in milk yield in thePalmera goats due to X2 could seem a profitable manage-ment at certain times during the lactation. However, thispractice did not produce an increased in milk protein yieldin accordance with milk yield. Therefore, other studies arerequired to evaluate how the milking frequency affects thecheese yield, which is a very important part of the CanaryIslands livestock economy. Additionally, the knowledge ofthe structures of milk partitioning can serve as a basis forfuture selection programs to improve the milkability of thestudied breeds. Furthermore, if a wider selection of breedscould be studied, ranging from low milk yielding to highmilk yielding breeds, the relationship among milk fractionswould be more noticeable.
Conflict of interest
None.
Acknowledgment
This work was supported by Fondo Europeo deDesarrollo Regional-Instituto Nacional de Investigación yTecnología Agraria y Alimentaria (FEDER-INIA) RTA2009-00125.

Efecto de la frecuencia de ordeño sobre la producción, fraccionamiento lechero y parámetros de calidad de la leche en las cabras canarias
82
Please cite this article in press as: Torres, A., et al., Comparison between two milk distribu-tion structures in dairy goats milked at different milking frequencies. Small Ruminant Res. (2013),http://dx.doi.org/10.1016/j.smallrumres.2013.04.013
ARTICLE IN PRESSG Model
RUMIN-4519; No. of Pages 6
6 A. Torres et al. / Small Ruminant Research xxx (2013) xxx–xxx
References
Bruckmaier, R.M., Paul, G., Mayer, H., Schams, D., 1997. Machine milkingof Ostfriesian and Lacaune dairy sheep: udder anatomy, milk ejectionand milking characteristics. J. Dairy Res. 64, 163–172.
Bruckmaier, R.M., Blum, J.W., 1998. Oxytocin release and milk removal inruminants. J. Dairy Sci. 81, 939–949.
Caja, G., Capote, J., López, J.L., Peris, S., Such, X., Argüello, A., 1999. Milk par-titioning and milk flow rate of Canarian dairy goats under once dailyor twice daily milking frequencies. In: Barillet, F., Zervas, N.P. (Eds.),Milking and Milk Production of Dairy Sheep and Goats. WageningenPers, Wageningen, pp. 274–280.
Capote, J., López, J.L., Caja, G., Peris, S., Argüello, A., Darmanin, N., 1999.The effects of milking once or twice daily throughout lactation on milkproduction of Canarian dairy goats. In: Barillet, F., Zervas, N.P. (Eds.),Milking and Milk Production of Dairy Sheep and Goats. WageningenPers, Wageningen, pp. 267–273.
Capote, J., Castro, N., Caja, G., Fernández, G., Briggs, H., Argüello, A., 2008.Effects of the frequency of milking and lactation stage on milk fractionsand milk composition in Tinerfena dairy goats. Small Rumin. Res. 75,252–255.
Capote, J., Castro, N., Caja, G., Fernández, G., Morales-delaNuez, A.,Argüello, A., 2009. The effects of the milking frequency and milkproduction levels on milk partitioning in Tinerfena dairy goats. Milch-wissenschaft 64, 239–241.
Castillo, V., Such, X., Caja, G., Salama, A.A.K., Albanell, E., Casals, R., 2008.Changes in alveolar and cisternal compartments induced by milkinginterval in the udder of dairy ewes. J. Dairy Sci. 91, 3403–3411.
Hernandez, L.L., Stiening, C.M., Wheelock, J.B., Baumgard, L.H., Parkhurst,A.M., Collier, R.J., 2008. Evaluation of serotonin as a feedback inhibitorof lactation in the bovine. J. Dairy Sci. 91, 1834–1844.
Jarrige, J., 1990. Alimentación de bovinos, ovinos y caprinos (Nutri-tion in bovine, ovine and caprine), first ed. Mundi Prensa, Madrid,Spain.
Komara, M., Boutinaud, M., Ben Chedly, H., Guinard-Flament, J., Marnet,P.G., 2009. Once-daily milking effects in high-yielding alpine dairygoats. J. Dairy Sci. 92, 5447–5455.
Labussière, J., 1988. Review of the physiological and anatomical factorsinfluencing the milking ability of ewes and the organization of milking.Livest. Prod. Sci. 18, 253–274.
Marnet, P.G., Komara, M., 2008. Management systems with extendedmilking intervals in ruminants: regulation of production and qualityof milk. J. Anim. Sci. 86, 47–56.
Marnet, P.G., McKusick, B.C., 2001. Regulation of milk ejec-tion and milkability in small ruminants. Livest. Prod. Sci. 70,125–133.
Nudda, A., Bencini, R., Mijatovic, S., Pulina, G., 2002. The yield and compo-sition of milk in Sarda, Awassi, and Merino sheep milked unilaterallyat different frequencies. J. Dairy Sci. 85, 2879–2884.
Papachristoforou, C., Roushias, A., Mavrogenis, A.P., 1982. The effect ofmilking frequency on the milk production of Chios ewes and Damas-cus goats. Ann. Zootech. 31, 37–46.
Peaker, M., Blatchford, D.R., 1988. Distribution of milk in the goat mam-mary gland and its relation to the rate and control of milk secretion.J. Dairy Res. 55, 41–48.
Peris, S., Such, X., Caja, G., 1996. Milkability of Murciano-Granadina dairygoats. Milk partitioning and flow rate during machine milking accord-ing to parity, prolificacy and mode of suckling. J. Dairy Res. 63, 1–9.
Rovai, M., Caja, G., Such, X., 2008. Evaluation of udder cisterns and effectson milk yield of dairy ewes. J. Dairy Sci. 91, 4622–4629.
Salama, A.A.K., Such, X., Caja, G., Rovai, M., Casals, R., Albanell, E., Marín,M.P., Martí, A., 2003. Effects of once versus twice daily milkingthroughout lactation on milk yield and milk composition in dairygoats. J. Dairy Sci. 86, 1673–1680.
Salama, A.A.K., Caja, G., Such, X., Peris, S., Sorensen, A., Knight, C.H., 2004.Changes in cisternal udder compartment induced by milking intervalin dairy goats milked once or twice daily. J. Dairy Sci. 87, 1181–1187.
Silanikove, N., Shamay, A., Shinder, D., Moran, A., 2000. Stress down reg-ulates milk yield in cows by plasmin induced �-casein product thatblocks K+ channels on the apical membranes. Life Sci. 67, 2201–2212.
Silanikove, N., Shapiro, F., Shinder, D., 2009. Acute heat stress brings downmilk secretion in dairy cows by up-regulating the activity of the milk-borne negative feedback regulatory system. BMC Physiol. 9, 13.
Silanikove, N., Leitner, G., Merin, U., Prosser, C., 2010. Recent advances inexploiting goat’s milk: quality, safety and production aspects. SmallRumin. Res. 89, 110–124.
Suárez-Trujillo, A., Capote, J., Argüello, A., Castro, N., Morales-delaNuez, A.,Torres, A., Morales, J., Rivero, M., 2013. Effects of breed and milkingfrequency on udder histological structures in dairy goats. J. Appl. Anim.Res. 41, 166–172.
Torres, A., Castro, N., Hernández-Castellano, L.E., Argüello, A., Capote, J.,2013. Effects of milking frequency on udder morphology, milk par-titioning, and milk quality in 3 dairy goat breeds. J. Dairy Sci. 96,1071–1074.
Wall, E.H., McFadden, T.B., 2008. Use it or lose it: enhancing milk pro-duction efficiency by frequent milking of dairy cows. J. Anim. Sci. 86,27–36.
Wellnitz, O., Bruckmaier, R.M., Albrecht, C., Blum, J.W., 1999. Atosiban, anoxytocin receptor blocking agent: pharmacokinetics and inhibition ofmilk ejection in dairy cows. J. Dairy Res. 66, 1–8.
Wilde, C.J., Knight, C.H., 1990. Milk yield and mammary function in goatsduring and after once-daily milking. J. Dairy Res. 57, 441–447.

MANUSCRITO 3


MANUSCRITO 3
85
1
Short-term effects of milking frequency on milk yield, milk composition, SCC and 1
milk protein profile in dairy goats 2
Alexandr Torres1, Lorenzo-Enrique Hernández-Castellano2, Antonio 3
Morales-delaNuez2, Davinia Sánchez-Macías3, Isabel Moreno-Indias2, 4
Noemi Castro2, Juan Capote1 and Anastasio Argüello2* 5
1 Instituto Canario de Investigaciones Agrarias, La Laguna, Tenerife 38200, Spain. 6
2 Department of Animal Science, Universidad de Las Palmas de Gran Canaria, Arucas 7
35413, Spain. 8
3 Agroindustrial Engineering Department, Universidad Nacional de Chimborazo. 9
Riobamba 060150, Ecuador. 10
* Corresponding author: Anastasio Argüello, Fac. Veterinaria s/n, 35413 Arucas, Spain. 11
Tel.: +34 928451094; fax: +34 928451142. E-mail address: [email protected] 12
13
14
15
16
17
18
19
20
21
22
23
24

Efecto de la frecuencia de ordeño sobre la producción, fraccionamiento lechero y parámetros de calidad de la leche en las cabras canarias
86
2
The goats in Canary Islands are milked once daily by tradition, but in other areas, is 25
carried out two times, with an increase of milk yield. Therefore it is important know if 26
the increase of milking frequency can improve the production without impairing the 27
milk quality. The objective of this study was to investigate the short term effects of 3 28
milking frequencies on milk yield, milk composition, SCC, and milk protein profile in 29
dairy goats traditionally milked once a day. Twelve Majorera goats in early lactation (48 30
± 4 d in milk) were used to determine the milk yield, milk composition, somatic cell 31
count, and milk protein profile at 3 different milking frequencies. During a 5-wk period, 32
goats were milked once a day (X1) at wk 1 and 5, twice a day (X2) at wk 2 and 4, and 33
three times a day (X3) at wk 3. Milk recording and sampling were done on the last day 34
of each experimental week. Milk yield increased by 26% from X1 to X2. No differences 35
were obtained when switched from X2 to X3, and from X3 to X2. The goats recovered 36
the production level when they returned to X1. Different patterns of changes in the milk 37
constituents due to milking frequency were observed. Fat percentages increased when 38
switched from X1 to X2, there was a significant decrease from X2 to X3, and continued 39
to decline as milking frequency was decreased. Protein and lactose percentages were 40
similar among X1, X2, and X3. SCC values were similar when goats were milked X1, 41
X2, and X3, but then increased slightly when milking frequency returned to X2 and X1. 42
Finally, different patterns were observed for caseins (αS1-CN, αS2-CN, β-CN, κ-CN). 43
Thus, milking frequency did not affect the proportion of αS1-CN in milk, while αS2-CN 44
and β-CN increased from X1 to X2, stayed stable from X2 to X3, and then decreased as 45
milking frequency decreased. In contrast, κ-CN decreased from X1 to X2, and 46
recovered to initial values when milking frequency was returned to X1. 47
48
Keywords: milking frequency, milk yield, milk quality, dairy goat. 49

MANUSCRITO 3
87
3
Goat research needs progress rapidly to reach the level of knowledge of other 50
species like cattle or sheep, especially in milk production (Argüello, 2011). Many 51
studies seek to implement management systems in dairy farms with extended milking 52
intervals, or to minimize additional cost associated with extra milking if it is 53
outweighed by the value of additional milk obtained as observed in dairy cows (Wall & 54
McFadden, 2008). Milking is done twice daily (X2) in countries with high-yielding 55
dairy goats (Capote et al. 2009). However, dairy farmers want to reduce their labor 56
requirements associated with milking, to devote time to other farm practices or to social 57
activities (Komara et al. 2009). In this way, the practice of once daily milking (X1) is 58
viewed with interest by dairy farmers. In contrast, thrice daily milking (X3) is a 59
relatively novel management practice and it is not generally used in small ruminants, 60
but in dairy cows it has emerged as an effective management tool for dairy farmers to 61
increase milk production (Wall & McFadden, 2008). 62
Silanikove et al. (2010) explained that high milk producing goats, as Saanen, 63
selected to high alveolar to cistern compartment ratio, are the most sensitive to changes 64
in milking frequency. In contrast, medium milk producing goats, as Majorera, may 65
attain their genetic potential for milk yield in X1 regimen due to selection for high 66
cistern capacity (Torres et al. 2013). Previous studies revealed losses in milk yield of 67
X1 of 8 to 45% compared to X2 (Mocquot & Auran, 1974; Capote et al. 2009) and 68
increases of 8 to 28% when the goats were milked X3 instead of X2 (Henderson et al. 69
1985; Boutinaud et al. 2003). The wide variation in milk yield due to milking frequency 70
in the literature reports is a consequence of differences in breed, lactation stage, level of 71
production, duration of X1, X2 or X3, and individual characteristics (Marnet & 72
Komara, 2008). Additionally, the regulation of milk components synthesis and somatic 73

Efecto de la frecuencia de ordeño sobre la producción, fraccionamiento lechero y parámetros de calidad de la leche en las cabras canarias
88
4
cells are dependent on the milking intervals, which can influence on the milk quality 74
(Marnet & Komara, 2008). 75
The hypothesis of this research paper is that 3 milking frequencies might have 76
minor effect on milk yield and chemical composition in a goat breed that is generally 77
milked X1. In addition, no information regarding the influence of milking interval on 78
milk protein profile in dairy goats is available. Therefore, the objective of this study was 79
to investigate the short term effects of 3 milking frequencies on milk yield, milk 80
composition, SCC, and milk protein profile in dairy goats traditionally milked X1. 81
82
Materials and Methods 83
The experimental animal procedures were approved by the Ethical Committee of 84
the Universidad de Las Palmas de Gran Canaria. A total of 12 Majorera goats were in 85
second parity with 48 ± 4 DIM at the beginning of the experiment. The goats which 86
were used in the experiment were from the experimental farm of the Faculty of 87
Veterinary of this University. Kids were separated from their dams within 8 h of birth. 88
The milking frequency before the start of the experimental period was once per day. 89
During a 5-wk period, goats were milked: once daily at wk 1 and 5 (X1, at 09:00), twice 90
daily at wk 2 and 4 (X2, at 09:00 and 17:00), and thrice daily at wk 3 (X3, at 09:00, 91
13:00, and 19:00). The animals had access to wheat straw ad libitum and a vitamin-92
mineral corrector. The supplement per goat was 800 g/d of alfalfa and 1200 g/d of a mix 93
of maize, lucerne, and dehydrated beetroot, which it meets the nutritional requirements 94
in accordance with the guidelines issued for lactating goats by Institut National de la 95
Recherche Agronomique (INRA, Paris, France; Jarrige, 1990). The amount of 96
supplement did not differ according to milking frequency. Goats were milked in a 97
double 12-stall parallel milking parlor (Alfa Laval Iberia SA, Madrid, Spain) equipped 98

MANUSCRITO 3
89
5
with recording jars (4 L ± 5%) and a low-line milk pipeline. Milking was performed at a 99
vacuum pressure of 42 kPa, a pulsation rate of 90 pulses/min, and a pulsation ratio of 100
60/40, in accordance with Capote et al. (2009). The milking routine included machine 101
milking and stripping milking, done by the operator to remove the remaining milk from 102
the udder before cluster removal; and teat dipping in an iodine solution (P3-cide plus; 103
Henkel Hygiene, Barcelona, Spain). 104
Milk recording and sampling were done on the last day of each experimental 105
week. Milk yield (L/d) was calculated by adding milk volume at every milking by using 106
the recording jars in the milking parlor. Milk samples (50 ml) were analyzed 107
immediately after collection at the a.m. milking to determine milk composition, SCC, 108
and milk protein profile. Fat, protein, lactose, and total solids percentages were 109
determined using a DMA2001 Milk Analyzer (Miris Inc., Uppsala, Sweden), and SCC 110
using a DeLaval somatic cell counter (DeLaval International AB, Tumba, Sweeden). 111
Milk proteins were separated by SDS-PAGE (12.5%) using a Bio-Rad slab 112
electrophoresis unit (Bio-Rad Laboratories, Hercules, CA, USA), based on the method 113
of Laemmli (1970). Protein concentration of the milk was determined with the Quick 114
Start™ Bradford Protein Assay (Bio-Rad Laboratories, Hercules, CA, USA), using 115
BSA as standard reference. Gels were loaded with a fixed protein level (40 µg) per line, 116
and were run at 200 V for 6 h. After electrophoresis, gels were stained for 90 min using 117
10% acetic acid, 40% methanol, and 0.05% (w/v) Coomassie Blue R-250 solution, and 118
then were destained for 15 h using 10% acetic acid and 40% methanol solution. The gel 119
images (Figure 1) were scanned (Gel Doc EQ, Bio-Rad Laboratories), and the relative 120
quantities of each band were determined by using the Quantity One software program 121
(Bio-Rad Laboratories). Each sample was analyzed on duplicate gels. Individual protein 122

Efecto de la frecuencia de ordeño sobre la producción, fraccionamiento lechero y parámetros de calidad de la leche en las cabras canarias
90
6
species were identified by comparing their relative mobilities with those of standard 123
proteins (Precision Plus ProteinTM Unstained Standards, Bio-Rad Laboratories). 124
The statistical analyses were performed by using SPSS 15.0 software (SPSS 125
Inc., Chicago, IL). Repeated measures analysis of variance (ANOVA), with adjustments 126
for non-sphericity (Greenhouse-Geisser correction), was applied to evaluate time-127
dependent milking frequency effects on milk yield and milk quality; followed by LSD 128
post-hoc tests. Statistical differences were considered significant at P < 0.05. Data are 129
presented as least squares means. 130
131
Results and Discussion 132
Milk yield increased by 26 ± 10% (P < 0.05) with increasing milking frequency 133
from X1 to X2 (Table 1). This increase in Majorera goats, which are traditionally 134
milked X1, was similar to loss caused by X1 (compared with X2) in Saanen goats 135
(26%) in late lactation reported by Boutinaud et al. (2003) during a short treatment 136
period (23 d). Subsequently, no significant differences in milk yield were obtained 137
between X2 and X3. This result does not agree with those of Boutinaud et al. (2003) 138
who found significant increases (8%) in milk yield for goats milked X3 compared with 139
X2. Finally, when the milking frequency was returned to X1, there was a recovery in 140
milk yield to initial values (P > 0.05). Previously, Capote et al. (2009) showed that 141
Tinerfeña goat breed, also generally milked X1, did not present significant increases 142
from X1 to X2 (9%) in high production level (> 2.4 L/d); but medium (between 1.9 and 143
2.4 L/d) and low (< 1.9 L/d) production level presented significant increases (25 and 144
20%, respectively) for 24 wks of lactation, suggesting that lower difference between X1 145
and X2 in high production goats is a consequence of a wider cisternal capacity which 146
allows a continuous drop of alveolar milk to the cistern, reducing the feedback inhibitor 147
MANUSCRITO 3
91
7
process and the intramammary pressure. Otherwise, the absence of increase from X2 to 148
X3 indicated that secretory activity of mammary cells was not modified at these 149
frequencies in goats usually milked X1. 150
Fat percentage had a significant increase when switched from X1 to X2, there 151
was a significant decrease from X2 to X3, and continued to decline as milking 152
frequency was decreased (Table 1). The higher fat content of X2 milk compared to X1 153
may be due to the length of the preceding milking interval, in X2 was 16 h and in X1 154
was 24 h. However, McKusick et al. (2002) in dairy ewes and Torres et al. (2013) in 155
dairy goats explained that transfer of milk fat from the alveoli to the cistern occurs 156
during early udder filling, and this transfer no longer takes place during later intervals. 157
In addition, some researchers have observed no effect of milking frequency on fat 158
percentage (Komara et al. 2009), whereas other studies have found a negative 159
correlation between milk yield and fat percentages due to milking frequency (Salama et 160
al. 2003). Capote et al. (1999) found that goats milked X2 showed a significant increase 161
in fat percentage compared to those animals milked X1, due to a higher proportion of 162
alveolar milk removed by X2 which is richer in fat. However, a decline in milk fat 163
fraction was observed when milking frequency was changed to X3 and then returned to 164
X2. Some research works on dairy ruminants studied the association of plasma cortisol 165
levels with different factors that cause stress as related to milking (Hopster et al. 2002; 166
Negrao et al. 2004). Previously, Raskin et al. (1973) found that cortisol may produce a 167
decrease in milk lipid formation from glucose and acetate. Therefore, more experiments 168
will be necessary to study the relationship between frequent milking and cortisol levels 169
in goats usually milked X1. 170
Milking frequency did not affect the protein percentages during the experimental 171
period (P > 0.05; Table 1). In accordance, Torres et al. (2013) reported no differences in 172

Efecto de la frecuencia de ordeño sobre la producción, fraccionamiento lechero y parámetros de calidad de la leche en las cabras canarias
92
8
milk protein percentages due to milking frequency in cisternal and alveolar fractions of 173
3 dairy breeds traditionally milked X1. However, Boutinaud et al. (2003) showed a 174
higher protein content in Saanen goats milked X1 compared with X2 and X3, which 175
suggested a specific leakage of serum protein into milk after modification of the 176
permeability of the mammary epithelium at longer milking intervals. Nevertheless, the 177
ability to support the extended intervals between milking of some dairy goat breeds 178
could be related to the capacity of the tight junctions to remain tight for a long period, 179
without modification of secretion of milk components regulated by it (Marnet & 180
Komara, 2008). 181
Similarly to protein percentages, lactose concentration was unaffected by the 182
studied milking intervals (P > 0.05; Table 1). This is in agreement with the results by 183
Henderson et al. (1985) between X2 and X3 in Saanen goats and with Torres et al. 184
(2013) between X1 and X2 in Majorera goats. In this way, Capote et al. (1999) 185
reiterated the assertion that lactose is the lactic component least influenced by breeding 186
and milking factors, indicating a similar performance of the synthetic activity of the 187
mammary gland. 188
Total solids stayed stable from X1 to X2 (P > 0.05; Table 1), and decreased from 189
X2 to X3 (P < 0.05). No corresponding results for X3 are available in dairy goats for 190
comparison, but Capote et al. (1999) and Salama et al. (2003) reported significant 191
differences in total solids percentages (12.48 vs.12.84% and 13.60 vs.12.90% for X1 192
and X2, respectively) in dairy goats during an entire lactation. The milk total solids are 193
a mixture of fat, protein, lactose and mineral matter. Thus, any variation on these 194
constituents can affect its concentration. In this case, milk fat was the most variable 195
component among milking frequencies, which involved changes in total solids 196
percentages. 197
MANUSCRITO 3
93
9
SCC values were unaffected by milking frequency when goats were milked X1, 198
X2, and X3; but then increased slightly when milking frequency returned to X2 and X1 199
(Table 1). There is disagreement about the milking frequency effects on SCC levels. 200
Some researchers have observed no effect of frequent milking on SCC in cows (Klei et 201
al. 1997), and ewes (de Bie et al. 2000), both in early lactation. Boutinaud et al. (2003) 202
showed that SCC tended to increase in X1, whereas it remained stable in X3 compared 203
with X2 in dairy goats. Likewise, Lakic et al. (2011) explained that prolonged milking 204
intervals as well as short milking intervals have influence on the milk SCC in cows. 205
Kamote et al. (1994) suggested that the increase in SCC in extended milking intervals in 206
dairy cows could be explained by a concentration effect. Paape et al. (2001) described 207
those stressful events as changes in the milking routine, to which goats are very 208
sensitive, may cause an increase in SCC even in the absence of an intramammary 209
infection. Therefore, the high values of SCC obtained during the final period seem to be 210
related with a physiological stress to the mammary gland caused by the experiment. 211
Changes in milk protein profile were found due to milking frequency (Table 2). 212
Thus, different patterns were observed for caseins (αS1-CN, αS2-CN, β-CN, κ-CN). 213
Milking frequency did not affect the proportion of αS1-CN in milk, while αS2-CN and β-214
CN increased from X1 to X2 (P < 0.05), stayed stable from X2 to X3, and then 215
decreased as milking frequency decreased. In contrast, κ-CN decreased from X1 to X2 216
(P < 0.05), and recovered to initial values when milking frequency was progressively to 217
X3 toward X1 (P > 0.05). Goats showed a significantly lower β-Lactoglobulin (β-Lg) 218
content in the final week of experimentation, whereas α-Lactalbumin (α-La) presented a 219
lower percentage when animals were milked X3. Lastly, there was not an effect of 220
milking frequency on lactoferrin (LF) and serum albumin (SA) concentration when 221
increasing from X1 to X3 (P > 0.05), and then had an enhanced trend when the milking 222

Efecto de la frecuencia de ordeño sobre la producción, fraccionamiento lechero y parámetros de calidad de la leche en las cabras canarias
94
10
frequency returned to X1. Immunoglobulin G heavy- (IgH) and light-chain (IgL) had a 223
decrease in concentrations from X1 to X2, but these differences were significant only 224
for IgL, then were maintained from X2 to X3, and tended to increase at the end of the 225
experiment. 226
The results for caseins are consistent with observations in dairy cows by 227
Sorensen et al. (2001), who found higher proportions of α-CN and β-CN and lower κ-228
CN when switched from X2 to X3 in either the long or the short term. However, these 229
authors indicated that β-Lg and α-La were not affected by milking frequency in the 230
short term. Regarding to SA, it has the same amino acid sequence as the blood serum 231
molecule, and it is commonly believed that SA enters the milk by leaking through the 232
epithelial tight junction from the systemic fluids, as was suggested by Boutinaud et al. 233
(2003). However, Shamay et al. (2005) showed that SA is produced and secreted by 234
epithelial cells into milk, indicating that it is part of the mammary gland innate immune 235
system. In addition, Hernández-Castellano et al. (2011) found that high milking 236
frequency affected the immunological milk parameters in Majorera goats, chiefly a 237
decreased on IgG concentration (immunosupression) presumably due to an increased in 238
the cortisol excretion by adrenal glands, caused by animal stress. 239
The changes in milk protein profile in cows have been associated with differing 240
proteolytic enzyme activities, such as plasmin, because the increase of milking 241
frequency reduces the time that milk is stored in the udder, and the time to degrade the 242
milk proteins is shorter (Sorensen et al. 2001). Previously, Bastian (1996) indicated that 243
plasmin causes degradation of β-CN to γ-CN, which influence the milk quality for 244
cheese production, and Grieve & Kitchen (1985) explained that κ-CN is more resistant 245
to proteolysis for bovine plasmin than α-CN and β-CN, which can explain that κ-CN 246
varied at the opposite to β-CN and αS2-CN when milking frequency was increased from 247

MANUSCRITO 3
95
11
X1 to X2. However, Svennersten-Sjaunja et al. (2007) reported a lower plasmin activity 248
when milking frequency was increased in dairy cows, but proteolytic degradation of 249
milk proteins was maintained. Therefore, more experiments will be necessary to 250
evaluate the plasmin activity at different milking frequencies and its effects on 251
degradation of milk proteins in dairy goats. 252
In conclusion, short-term changes of the normal milking frequency in goats 253
traditionally milked X1 during early lactation can affect milk production as reflected the 254
high increase in milk yield when milking frequency was increased from X1 to X2. 255
However, the changes in milk quality, especially in the fat content and milk protein 256
profile, requires new studies on how the milking frequency affect the yield and quality 257
of the cheeses, because the goat milk in Canary Islands is used mainly for cheese 258
production. In addition, the modification in milk yield did not take place when goats 259
were switched from X2 to X3, but the decreased in fat content requires further studies to 260
evaluate the factors that cause this decline. 261
262
This research was supported by grant AGL 2006-08444/GAN from the Spanish 263
Government. The authors want to thank A. Alavoine, G. Pons, V. Bissières, and S. 264
Cyrille from École Vetérinaire de Toulouse (France) for their technical assistance 265
during the experiment. 266
267
References 268
Argüello A 2011 Trends in goat research, a review. Journal of Applied Animal 269
Research 39 429–434 270
Bastian ED 1996 Plasmin in milk and dairy products: An update. International Dairy 271
Journal 6 435–457 272

Efecto de la frecuencia de ordeño sobre la producción, fraccionamiento lechero y parámetros de calidad de la leche en las cabras canarias
96
12
de Bie L, Berger YM & Thomas DL 2000 The effect of three times a day milking at the 273
beginning of lactation on the milk production of East Friesian crossbred ewes. 274
Proceedings of the 6th Great Lakes Dairy Sheep Symposium 1–9 275
Boutinaud M, Rousseau C, Keisler DH & Jammes H 2003 Growth hormone and 276
milking frequency act differently on goat mammary gland in late lactation. 277
Journal of Dairy Science 86 509–520 278
Capote J, López JL, Caja G, Peris S, Argüello A & Darmanin N 1999 The effects of 279
milking once or twice daily throughout lactation on milk production of Canaria 280
dairy goats. In Milking and milk production of dairy sheep and goats, pp 267–281
273 (Ed. F Barillet & NP Zervas) Wageningen: Wageningen Pers 282
Capote J, Castro N, Caja G, Fernández G, Morales-delaNuez A & Argüello A 2009 The 283
effects of the milking frequency and milk production levels on milk partitioning 284
in Tinerfeña dairy goats. Milchwissenschaft 64 239–241 285
Grieve PA & Kitchen BJ 1985 Proteolysis in milk: the significance of the proteinases 286
originating from leucocytes and a comparison of the action of leucocyte, 287
bacterial and natural milk proteinases on casein. Journal of Dairy Research 101–288
112 289
Henderson AJ, Blatchford DR & Peaker M 1985 The effects of long-term thrice-daily 290
milking on milk secretion in the goat: evidence for mammary growth. Quarterly 291
Journal of Experimental Physiology 70 557–565 292
Hernández-Castellano LE, Torres A, Alavoine A, Ruiz-Díaz MD, Argüello A, Capote C 293
& Castro N 2011 Effect of milking frequency on milk immunoglobulin 294
concentration (IgG, IgM and IgA) and chitotriosidase activity in Majorera goats. 295
Small Ruminant Research 98 70–72 296

MANUSCRITO 3
97
13
Hopster H, Bruckmaier RM, Van der Werf JTN, Korte SM, Macuhova J, Korte-Bouws 297
G & van Reenen CG 2002 Strees responses during milking; comparing 298
conventional and automatic milking in primiparous dairy cows. Journal of Dairy 299
Science 85 3206–3216 300
Jarrige J 1990 Alimentación de bovinos, ovinos y caprinos [Nutrition in cattle, sheep 301
and goats]. Madrid: Mundi-Prensa 302
Kamote HI, Holmes CW, Mackenzie DDS, Holdaway RJ & Wickham BW 1994 Effects 303
of once-daily milking in later lactation on cows with either low or high initial 304
somatic cell counts. Proceedings of the New Zealand Society of Animal 305
Production 54 285–287 306
Klei LR, Lynch JM, Barbano D, Oltenacu P, Lednor AJ & Bandler DK 1997 Influence 307
of milking three times a day on milk quality. Journal of Dairy Science 80 427–308
436 309
Komara M, Boutinaud M, Ben Chedly H, Guinard-Flament J & Marnet PG 2009 Once-310
daily milking effects in high-yielding alpine dairy goats. Journal of Dairy 311
Science 92 5447–5455 312
Laemmli UK 1970 Cleavage of structural proteins during the assembly of the head of 313
bacteriophage T4. Nature 227 680–685 314
Lakic B, Svennersten-Sjaunja K, Norell L, Dernfalk J & Östensson K 2011 The effect 315
of a single prolonged milking interval on inflammatory parameters, milk 316
composition and yield in dairy cows. Veterinary Immunology and 317
Immunopathology 140 110–118 318
Marnet PG & Komara M 2008 Management systems with extended milking intervals in 319
ruminants: Regulation of production and quality of milk. Journal of Animal 320
Science 86 47–56 321

Efecto de la frecuencia de ordeño sobre la producción, fraccionamiento lechero y parámetros de calidad de la leche en las cabras canarias
98
14
McKusick BC, Thomas DL, Berger YM & Marnet PG 2002 Effect of milking interval 322
on alveolar versus cisternal milk accumulation and milk production and 323
composition in dairy ewes. Journal of Dairy Science 85 2197–2206 324
Mocquot JC & Auran T 1974 Effets de différentes fréquences de traite sur la production 325
laitière des caprins [Effects of milking frequency on milk production of goats]. 326
Annales de Génétique et de Sélection Animale 6 463–476 327
Negrao JA, Porcionato MA, Passille A & Rushen J 2004 Cortisol in saliva and plasma 328
of cattle after ACTH administration and milking. Journal of Dairy Science 87 329
1713–1718 330
Paape MJ, Poutrel B, Contreras A, Marco JC & Capuco AV 2001 Milk somatic cells 331
and lactation in small ruminants. Journal of Dairy Science 84 E237–E244 332
Raskin RL, Raskin M & Baldwin RL 1973 Effects of chronic insulin and cortisol 333
administration on lactational performance and mammary metabolism in rats. 334
Journal of Dairy Science 56 1033–1041 335
Salama AAK, Such X, Caja G, Rovai M, Casals R, Albanell E, Marín MP & Martí A 336
2003 Effects of once versus twice daily milking throughout lactation on milk 337
yield and milk composition in dairy goats. Journal of Dairy Science 86 1673–338
1680 339
Silanikove N, Leitner G, Merin U & Prosser C 2010. Recent advances in exploiting 340
goat's milk: Quality, safety and production aspects. Small Ruminant Research 89 341
110–124 342
Shamay A, Homans R, Fuerman Y, Levin I, Barash H, Silanikove N & Mabjeesh J 343
2005 Expression of albumin in nonhepatic tissues and its synthesys by the 344
bovine mammary gland. Journal or Dairy Science 88 569–576 345

MANUSCRITO 3
99
15
Sorensen A, Muir DD & Knight CH 2001 Thrice-daily milking throughout lactation 346
maintains epithelial integrity and thereby improves milk protein quality. Journal 347
of Dairy Research 68 15–25 348
Svennersten-Sjaunja K, Wiking L, Edvardsson A, Bavius A-K, Larsen LB & Nielsen 349
JH 2007 Effect of frequent milking on milk fat and protein. Journal of Animal 350
and Feed Sciences 16 151–155 351
Torres A, Castro N, Hernández-Castellano LE, Argüello A & Capote J 2013 Effects of 352
milking frequency on udder morphology, milk partitioning, and milk quality in 3 353
dairy goat breeds. Journal of Dairy Science 96 1071–1074 354
Wall EH & McFadden TB 2008 Use it or lose it: Enhancing milk production efficiency 355
by frequent milking of dairy cows. Journal of Animal Science 86 27–36 356
357
358
359
360
361
362
363
364
365
366
367
368
369

Efecto de la frecuencia de ordeño sobre la producción, fraccionamiento lechero y parámetros de calidad de la leche en las cabras canarias
100
16
Table 1. Milk yield, milk composition, and SCC from dairy goats milked at different 370
milking frequencies†‡ 371
Milking Frequency§
X1 X2 X3 X2 X1 SEM P value
Milk yield (L/d) 1.69b 2.13a 2.09a 2.01a 1.89b 0.127 0.001
Fat (%) 3.86b 4.38a 3.61b 3.34c 3.13c 0.084 0.001
Protein (%) 3.39 3.06 3.07 3.03 3.12 0.054 0.073
Lactose (%) 5.17 5.09 5.26 5.21 5.22 0.035 0.514
Total Solids (%) 13.24a 13.34a 12.74b 12.26c 12.30c 0.109 0.001
SCC (log/ml) 5.99ab 5.82b 5.88ab 6.21a 6.06a 0.077 0.050
a–cMeans with different superscripts within the same row are different (P < 0.05) 372
† Data are least squares means and standard error of means 373
‡ Milk composition and SCC were determined with milk samples from a.m. milking for 374
X2 and X3 375
§ X1 = once daily; X2 = twice daily; X3 = thrice daily 376
377
378
379
380
381
382
383
384
385
386

MANUSCRITO 3
101
17
Table 2. Protein profile from dairy goats milked at different milking frequencies†‡ 387
Milking Frequency§
Protein (%)¶ X1 X2 X3 X2 X1 SEM P value
αS1-CN 11.15 10.41 11.67 10.03 10.36 0.399 0.302
αS2-CN 16.22bc 20.86a 20.63a 18.05b 15.70c 0.975 0.001
β-CN 21.63b 25.95a 25.29a 24.39ab 22.85b 0.692 0.021
κ-CN 12.01a 9.24b 9.64b 8.29b 9.84ab 0.513 0.038
β-Lg 14.67a 15.44a 14.68a 15.39a 12.96b 0.449 0.045
α-La 10.43a 10.30ab 8.73b 9.95ab 11.52a 0.509 0.050
LF 3.02b 1.57b 2.10b 3.66ab 4.97a 0.558 0.007
SA 3.91ab 2.40b 3.22b 4.89a 5.30a 0.501 0.001
IgH 3.74ab 2.38b 2.61ab 3.28ab 4.20a 0.390 0.042
IgL 3.17a 1.45b 1.43b 2.09ab 2.31ab 0.421 0.010
a–cMeans with different superscripts within the same row are different (P < 0.05) 388
†Data are least squares means and standard error of means 389
‡Protein profile was determined with milk samples from a.m. milking for X2 and X3 390
§ X1 = once daily; X2 = twice daily; X3 = thrice daily 391
¶ CN = casein; β-Lg = β-lactoglobulin; α-La = α-lactalbumin; LF = lactoferrin; SA = 392
serum albumin; IgH = immunoglobulin G heavy-chain; IgL = immunoglobulin G light-393
chain 394
395
396
397
398
399
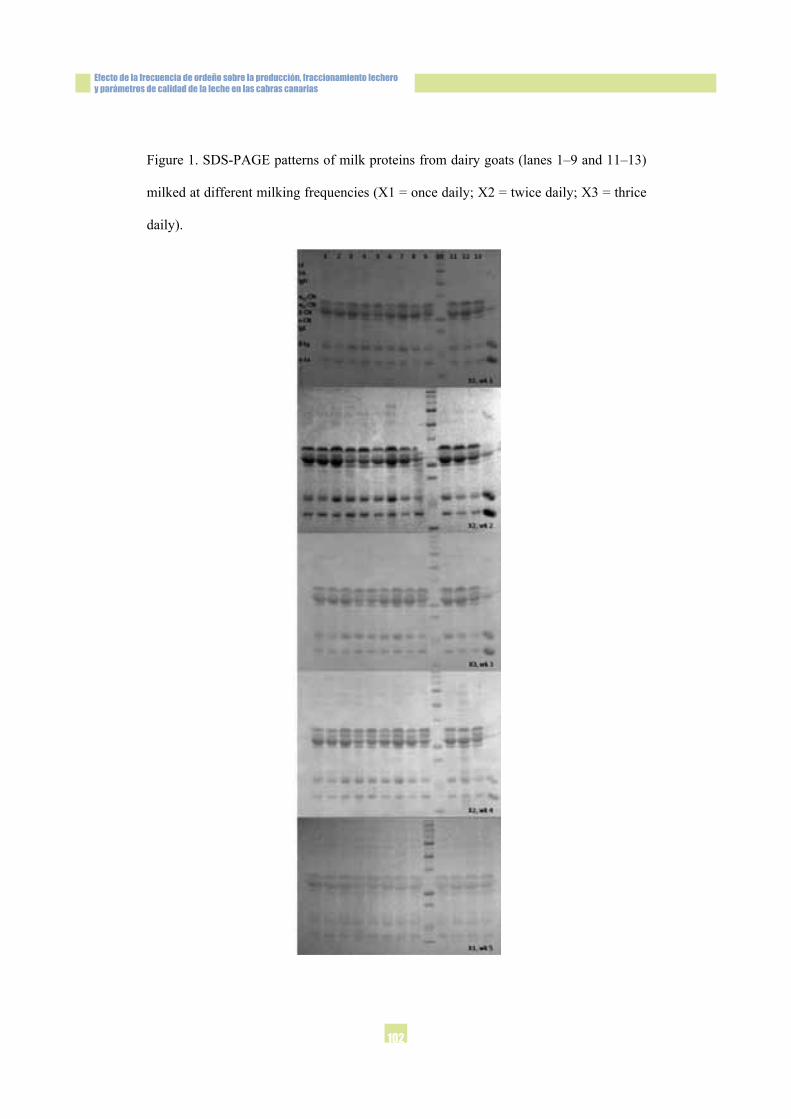
Efecto de la frecuencia de ordeño sobre la producción, fraccionamiento lechero y parámetros de calidad de la leche en las cabras canarias
102
18
Figure 1. SDS-PAGE patterns of milk proteins from dairy goats (lanes 1–9 and 11–13) 400
milked at different milking frequencies (X1 = once daily; X2 = twice daily; X3 = thrice 401
daily). 402
403

MANUSCRITO 4

MANUSCRITO 4
105
1
Effects of oxytocin treatments on milk production in dairy goats 1
A. Torres,* J. Capote,* A. Argüello,† D. Sánchez-Macías,‡ A. Morales-delaNuez,† 2
and N. Castro,†1 3
*Instituto Canario de Investigaciones Agrarias, La Laguna, Tenerife 38200, Spain. 4
†Department of Animal Science, Universidad de Las Palmas de Gran Canaria, Arucas 5
35413, Spain. 6
‡Universidad Nacional de Chimborazo, Riobamba 060150, Ecuador. 7
1Corresponding author: Noemi Castro, Fac. Veterinaria s/n, Arucas 35413, Spain. 8
Tel.: +34 928451093; fax: +34 928451142. E-mail address: [email protected] 9
10
ABSTRACT 11
Two experiments were conducted to determine the effects of oxytocin treatments on 12
milk ejection. In experiment 1, 39 dairy goats in mid lactation (95 ± 10 days in milk) 13
were divided into 3 groups (n = 13) with similar milk yields. During an 8-wk period, 14
goats from group 1 (OT1) were introduced to the milking parlor once a week, 10 h after 15
morning milking, and all pre-milking routines were carried out, including stripping 2 to 16
3 squirts of milk from each teat, but the animals were not milked. During this period, 17
goats from group 2 (OT2) were injected intravenously with 2 IU of oxytocin in the 18
crowd pen once a week, 10 h after morning milking, but the animals were not milked. 19
Goats from group 3 (control) remained in the pen without any treatment. In experiment 20
2, 10 dairy goats in mid lactation (104 ± 5 days in milk) were divided into 5 groups (n = 21
2) with similar milk yields. During a 6-wk period, goats were milked once daily, except 22
for one day a week, when they were milked 3 additional times (at 1200, 1600, and 2000 23
h). On this day, after each milking, goats were administered intravenously with a dose 24
corresponding to oxytocin (0.5, 1, 2, and 4 IU), or saline solution (control). Machine 25

Efecto de la frecuencia de ordeño sobre la producción, fraccionamiento lechero y parámetros de calidad de la leche en las cabras canarias
106
2
milk and residual milk were recorded for each group. Additionally, milk yield, chemical 26
composition, and SCC of each group were determined for the 3 following days after 27
applying the treatments. In experiment 1, milk yield and milk composition were not 28
affected by OT1 and OT2, indicating that the oxytocin release by the stimulatory effect 29
of milking procedures or the administration of synthetically manufactured oxytocin, 30
have no galactopoietic effect on goats not milked immediately. In experiment 2, milk 31
partitioning and milk composition did not differ due to oxytocin treatments at 1200, 32
1600 and 2000 h, indicating that the contraction of the myoepithelial cells that surround 33
the mammary alveoli is similar between low and high doses of oxytocin. In addition, the 34
evolution of milk yield and SCC after the experimental day was not affected by the 35
treatments with oxytocin. 36
37
Keywords: oxytocin, dairy goat, milk yield, milk partitioning. 38
39
INTRODUCTION 40
In ruminants, milk ejection is a neuroendocrine reflex arc and it occurs in 41
response to suckling, manual stimulation of the mammary gland, or machine milking 42
(Macuhova et al., 2004). These stimulations cause on the udder the release of oxytocin 43
from the neural lobe of the pituitary into blood circulation, which induces contraction of 44
myoepithelial cells that surround the alveoli where milk is stored, and transfer it into the 45
cisternal space (Lollivier et al., 2002; Bruckmaier, 2003). However, not all alveolar 46
milk can be ejected if milk is not removed from the udder (Bruckmaier and Blum, 47
1998). 48
Depending on the stimulation of the mammary gland, it causes different 49
oxytocin responses. Suckling is a more potent stimulus than milking, while hand 50
MANUSCRITO 4
107
3
milking induces a more pronounced release of oxytocin than machine milking (Akers 51
and Lefcourt, 1982; Gorewit et al., 1992). Furthermore, prestimulation before milking is 52
important because it increases oxytocin levels and promotes early induction of milk 53
ejection to avoid an interruption of milk flow during early milking (Bruckmaier, 2001). 54
However, milk ejection during machine milking is not complete, even with an adequate 55
prestimulation. Usually a residual milk fraction remains in the udder which can be 56
obtained by injection of oxytocin, and it varies widely between breeds and even 57
between animals of the same breed (Peaker and Blatchford, 1988; Such et al., 1999). 58
Milk ejection in goats, in response to oxytocin, is similar to cows and sheep, but 59
milk removal is different due to udder morphology and milk partitioning (Bruckmaier 60
and Blum, 1998). In goats, oxytocin release is highly variable within and between 61
animals, being readily induced by tactile prestimulation or by the milking machine 62
(Bruckmaier and Blum, 1998; Marnet and McKusick, 2001). 63
In experiments of unilateral milking frequency of dairy goats, the effect of 64
oxytocin on milk yield and milk composition of the unmilked gland is still unknown. 65
For this reason, the first objective of the present study was to determine the effects of 66
endogenous and exogenous oxytocin on milk parameters in goats not milked 67
immediately. In addition, the second objective was to study the response to different 68
doses of exogenous oxytocin on milk ejection in dairy goats. 69
70
MATERIALS AND METHODS 71
Animal and Management Conditions 72
Two experiments were conducted on a total of 49 dairy goats in mid lactation. 73
The experiment 1 was performed on the experimental farm of the Instituto Canario de 74
Investigaciones Agrarias (Tenerife, Spain) on 39 dairy goats, while the experiment 2 75

Efecto de la frecuencia de ordeño sobre la producción, fraccionamiento lechero y parámetros de calidad de la leche en las cabras canarias
108
4
was carried out on the experimental farm of the Faculty of Veterinary of the 76
Universidad de Las Palmas de Gran Canaria (Arucas, Spain) on 10 dairy goats. The 77
experimental animal procedures were approved by the Ethical Committee of the 78
Universidad de Las Palmas de Gran Canaria. The animals were fed with maize, lucerne, 79
dehydrated beetroot, wheat straw, and a vitamin-mineral corrector in accordance with 80
the guidelines issued for lactating goats by Institut National de la Recherche 81
Agronomique (INRA, Paris, France; Jarrige, 1990). In both experiments, goats were 82
milked in a double 12-stall parallel milking parlor equipped with recording jars (4 L ± 83
5%) and a low-line milk pipeline. Milking was performed at a vacuum pressure of 42 84
kPa, a pulsation rate of 90 pulses/min, and a pulsation ratio of 60/40, in accordance with 85
Capote et al. (2006). The milking routine included wiping dirt off teat ends and 86
stripping 2 to 3 squirts of milk from each teat; machine milking and stripping milking, 87
done by the operator to remove the milk remaining in the udder before cluster removal; 88
and teat dipping in an iodine solution (P3-cide plus; Henkel Hygiene, Barcelona, Spain). 89
90
Experimental Procedures 91
Experiment 1. 39 Canarian dairy goats in second parity, with 95 ± 10 DIM, 92
were divided into 3 groups (n = 13) with similar milk yields. All goats were milked 93
once daily (at 0700 h) according to the normal milking routine. During an 8-wk period, 94
goats from group 1 (OT1) were introduced to the milking parlor once a week, 10 h after 95
morning milking, and all pre- and post-milking routines were carried out, including 96
stripping 2 to 3 squirts of milk from each teat and dipping of teats in an iodine solution 97
(P3-cide plus; Henkel Hygiene, Barcelona, Spain), but the animals were not milked. 98
Before the experimental period, OT1 goats were exposed to 3 wk of adaptation, where 99
the animals began to enter the milking parlor in the afternoon. During the experimental 100

MANUSCRITO 4
109
5
period, goats from group 2 (OT2) were injected intravenously with 2 IU of oxytocin 101
(Oxiton; Laboratorios Ovejero, León, Spain) in the crowd pen once a week, 10 h after 102
morning milking, but the animals were not milked at this time. Goats from group 3 103
(control) remained in the pen without any treatment. Milk recording and sampling were 104
done the next day at the morning milking. 105
Experiment 2. 10 Canarian dairy goats in second parity, with 104 ± 5 DIM, 106
were divided into 5 groups (n = 2) with similar milk yields. During a 6-wk period, goats 107
were milked once daily (at 0800 h), except one day a week, when they were milked 3 108
additional times (at 1200, 1600, and 2000 h). On this day, milk was collected after each 109
milking (machine milk), and after the complete cessation of milk flow, the groups were 110
injected intravenously with a dose corresponding to oxytocin (0.5, 1, 2, and 4 IU), or 111
saline solution (control) to remove the remainder of milk in the udder (residual milk). 112
Total milk was defined as machine milk plus residual milk. Additionally, milk yield, 113
milk composition (fat, protein and lactose), and SCC of each group were determined for 114
the 3 following days after applying the treatments. 115
In experiment 1, milk volumes were recorded by using the recording jars in the 116
milking parlor, while milk of each fraction of the experiment 2 was measured by a 117
graduated cylinder. Milk samples (experiment 1 and 2) were analyzed immediately after 118
collection to determine chemical composition. Fat, protein and lactose percentages were 119
determined by using a DMA2001 Milk Analyzer (Miris Inc., Uppsala, Sweden), and 120
SCC using a DeLaval somatic cell counter (DeLaval International AB, Tumba, 121
Sweeden). 122
123
Statistical Analysis 124
The statistical analyses were performed by using SPSS 15.0 software (SPSS 125
Inc., Chicago, IL). Repeated measures analysis of variance (ANOVA), with adjustments 126

Efecto de la frecuencia de ordeño sobre la producción, fraccionamiento lechero y parámetros de calidad de la leche en las cabras canarias
110
6
for non-sphericity (Greenhouse-Geisser correction), was applied to evaluate time-127
dependent effects of OT1 and OT2 on milk yield and milk composition (experiment 1), 128
and doses of oxytocin on milk partitioning and milk composition (experiment 2), 129
followed by LSD post-hoc tests. Differences among experimental groups (experiment 1 130
and 2) were evaluated using a multiple comparison test following the Tukey method. 131
Statistical differences were considered significant at P < 0.05. Data are presented as 132
estimated marginal means. 133
134
RESULTS AND DISCUSSION 135
Experiment 1. 136
In the 3 studied groups, it was observed, as expected, a decrease in milk yield at 137
the end of the experimental period (P < 0.05; Table 1). Capote et al. (2008) observed a 138
significant decrease in milk yield throughout lactation in dairy goats (2.51 vs. 2.08 L/d 139
in 12 and 20 weeks of lactation, respectively). The decline in milk production with 140
advancing lactation has been attributed to a gradual decrease in number of secretory 141
cells (Knight and Peaker, 1984). No differences were detected in milk yield (P > 0.05) 142
in any week of experimentation due to treatments. Therefore, the results indicate that 143
the oxytocin release by the stimulatory effect of milking procedures or the 144
administration of synthetically manufactured oxytocin, have no galactopoietic effect in 145
goats not milked immediately. Some studies have indicated that oxytocin release is not 146
an important factor for milk yield gain in small ruminants with large cisterns (Negrao et 147
al., 2001; Marnet and McKusick, 2001). However, it has been indicated that oxytocin 148
doses induce an increase in milk yield proportional to the capacity of cisternal storage 149
but only when accompanied by milk removal (Lollivier and Marnet, 2005a). 150

MANUSCRITO 4
111
7
Oxytocin treatments did not affect the milk composition (Table 1). Lollivier and 151
Marnet (2005b) observed changes in protein content due to oxytocin injection in dairy 152
goats not milked immediately (28.9 vs. 27.6 g/kg in control and oxytocin group, 153
respectively), but fat (33.2 vs. 34.3 g/kg) and lactose contents (44.9 vs. 45.3 g/kg) were 154
unaffected. In cows, Caja et al. (2004) demonstrated a back-flux of milk to the ductal 155
and alveolar compartments when they are not milked promptly after milk letdown, 156
which influences the transference of milk components, as the upward movement of the 157
fat globules in the opposite direction to the downward draining and newly secreted milk 158
(Ayadi et al., 2004). However, Salama et al. (2004) indicated the absence of recoil and 159
milk return from cistern to alveoli in goats, due to the greater cisternal milk percentages 160
and the small contact surface between the alveolar and cisternal compartments. 161
162
Experiment 2. 163
Total milk volumes and percentages of machine milk and residual milk at 1200, 164
1600 and 2000 h are presented in Table 2. No differences were observed in total milk 165
volumes due to treatments at different milking times (P > 0.05). Since the control goats 166
were not subjected to a complete emptying of the udder, the milk accumulated in the 167
alveoli and small ducts was transferred to the cistern and was obtained in the next 168
milking; while the other goats began to store milk in the alveolar tissue which was 169
ejected after having received doses of oxytocin. Thus, there was no effect of treatments 170
on total milk volume within the udder. On the other hand, percentages of residual milk 171
obtained after saline solution injection were lower (P < 0.05) in control group (< 20%) 172
than oxytocin groups (ranged from 38.31 to 59.79%) at 1200, 1600 and 2000 h, which 173
corroborate that oxytocin has an effect on the milk transfer from alveolar tissue to 174
cistern. Moreover, the absence of differences in the milk partitioning among the 4 175

Efecto de la frecuencia de ordeño sobre la producción, fraccionamiento lechero y parámetros de calidad de la leche en las cabras canarias
112
8
oxytocin groups at these intervals (P > 0.05), could indicate that the contraction of the 176
myoepithelial cells that surround the mammary alveoli is similar between low and high 177
doses of oxytocin. Previously, Lollivier et al. (2002) have indicated that a complete 178
milk removal is obtained following intravenous injection with 0.1 to 1 IU of oxytocin in 179
dairy goats. 180
Fat, protein and lactose percentages in machine and residual milk are shown in 181
Table 3. Fat percentages in machine milk significantly decreased between 1200 and 182
1600 h for the studied groups, and although another decline was observed between 1600 183
and 2000 h, the differences were not significant. A similar pattern was detected in fat 184
fractions of residual milk for the oxytocin groups between 1200 and 1600h. This decline 185
in milk fat content of both fractions could be due to cortisol released in response to the 186
stress caused by the experiment. Some research work on dairy ruminants studied the 187
association of plasma cortisol levels with different factors that cause stress in animals 188
(e.g., milking) (Hopster et al., 2002; Negrao et al., 2004). Previously, Raskin et al. 189
(1973) found that cortisol may produce a decrease in milk lipid formation from glucose 190
and acetate. In addition, no differences were observed in fat percent in milk fractions 191
among oxytocin groups at any studied milking time (P > 0.05). Gorewit and Sagi (1984) 192
observed that fat percentage in total residual milk was not affected by administration of 193
different doses of oxytocin (0.5, 1, 1.5, 2, and 3 IU) in dairy cows, but they used 194
different experimental techniques for determination of residual milk. 195
Protein and lactose percentages in machine milk and residual milk were not 196
affected due to oxytocin doses at 1200, 1600 and 2000 h (P > 0.05). In cows, some 197
authors claim that there is no modification of milk protein and lactose contents 198
regardless if oxytocin is administered over medium or long periods of time, indicating 199
that the effect of oxytocin is not manifested through an effect on cell activity (Nostrand 200

MANUSCRITO 4
113
9
et al., 1991; Ballou et al., 1993). However, Gorewit and Sagi (1984) observed that milk 201
protein percentage was lower for those cows receiving higher doses of oxytocin, 202
attributed to a dilution effect as a result of increased total milk yield. 203
Milk yield, chemical composition and SCC before (day 0) and after (day 1–3) 204
injecting different treatments are presented in Table 4. In all groups, an expected 205
decrease in milk yield at day 1 after applying the treatments was observed (P < 0.05). 206
This was because 12 hours had elapsed since the last milking. Therefore, the goats 207
stored less milk inside the udder. However, there was no effect due to treatments on 208
milk production in the following days (P > 0.05), recovering similar values to day 0. 209
Bruckmaier (2003) and Macuhova et al. (2004) found a reduction of milk ejection when 210
chronic oxytocin treatment (50 IU) was withdrawn in dairy cows. It seems that the 211
reduction of spontaneously removed milk was caused by reduced contractibility of 212
myoepithelial cells in the mammary gland at the normal physiological oxytocin 213
concentrations (Macuhova et al., 2004). 214
Fat percentages declined significantly at days 1 and 2 in all studied groups, but 215
at day 3 it reached similar values to day 0 (Table 4). In contrast, protein contents 216
increased at days 1 and 2, and subsequently decreased. Lactose percentages did not 217
show significant changes in the following days after experiment. This behavior could be 218
due to different regulatory mechanisms for secretion of milk components. No statistical 219
differences were found in SCC levels for the experimental days in the oxytocin groups 220
(Table 4). Allen (1990) observed that milk SCC increased in a dose dependent manner 221
at 12, 24, 36, 48, 60, and 72 h after the injected dose (1, 10, 100, or 1000 IU), and some 222
cows had a mastitis-like response with clots in the milk. Finally, variability of SCC 223
among the groups was high, and may be due to multiple individual factors (e.g., oestrus) 224
and not necessarily a response caused by treatments. 225

Efecto de la frecuencia de ordeño sobre la producción, fraccionamiento lechero y parámetros de calidad de la leche en las cabras canarias
114
10
226
CONCLUSIONS 227
The oxytocin release by the stimulatory effect of milking procedures or the 228
administration of synthetically manufactured oxytocin had no galactopoietic effect and 229
did not produce apparent changes in the milk composition on goats not milked 230
immediately, and that are traditionally milked once a day. Likewise, it did not produce 231
apparent changes in the milk composition. In addition, the absence of differences in the 232
milk partitioning and milk composition among the administration of 4 doses of oxytocin 233
indicated that the contraction of the myoepithelial cells that surround the mammary 234
alveoli is similar between low and high doses of oxytocin in dairy goats milked once a 235
day by tradition. 236
237
ACKNOWLEDGMENTS 238
This work was supported by Fondo Europeo de Desarrollo Regional-Instituto 239
Nacional de Investigación y Tecnología Agraria y Alimentaria (FEDER-INIA) 240
RTA2009-00125. 241
242
REFERENCES 243
Akers, R. M., and A. M. Lefcourt. 1982. Milking- and suckling- induced secretion of 244
oxytocin and prolactin in parturient dairy cows. Horm. Behav. 15:87–93. 245
Allen, J. C. 1990. Milk synthesis and secretion rates in cows with milk composition 246
changed by oxytocin. J. Dairy Res. 73:975–984. 247
Ayadi, M., G. Caja, X. Such, M. Rovai, and E. Albanell. 2004. Effect of different 248
milking intervals on the composition of cisternal and alveolar milk in dairy 249
cows. J. Dairy Res. 71:304–310. 250

MANUSCRITO 4
115
11
Ballou, L. U., J. L. Bleck, G. T. Bleck, and R. D. Bremel. 1993. The effects of daily 251
oxytocin injections before and after milking on milk production, milk plasmin, 252
and milk composition. J. Dairy Sci. 76:1544–1549. 253
Bruckmaier, R. M., and J. W. Blum. 1998. Oxytocin release and milk removal in 254
ruminants. J. Dairy Sci. 81:939–949. 255
Bruckmaier, R. M. 2001. Milk ejection during machine milking in dairy cows. Livest. 256
Prod. Sci. 81:121–124. 257
Bruckmaier, R. M. 2003. Chronic oxytocin treatment causes reduced milk ejection in 258
dairy cows. J. Dairy Res. 70:123–126. 259
Caja, G., M. Ayadi, and C. H. Knight. 2004. Changes in cisternal compartment based on 260
stage of lactation and time since milk ejection in the udder of dairy cows. J. 261
Dairy Sci. 87:2409–2415. 262
Capote, J., A. Argüello, N. Castro, J. L. López, and G. Caja. 2006. Correlations between 263
udder morphology, milk yield and milking ability with different milking 264
frequencies in dairy goats. J. Dairy Sci. 89:2076–2079. 265
Capote, J., Castro, N., Caja, G., Fernández, G., Briggs, H., Argüello, A., 2008. Effects 266
of the frequency of milking and lactation stage on milk fractions and milk 267
composition in Tinerfeña dairy goats. Small Rumin. Res. 75, 252–255. 268
Gorewit, R. C., and R. Sagi. 1984. Effects of exogenous oxytocin on production and 269
milking variables of cows. J. Dairy Sci. 67:2050–2054. 270
Gorewit, R. C., K. Svennersten, W. R. Butler, and K. Uvnas-Moberg. 1992. Endocrine 271
responses in cows milked by hand and machine. J. Dairy Sci. 75:443–448. 272
Hopster, H., R. M. Bruckmaier, J. T. N. Van der Werf, S. M. Korte, J. Macuhova, G. 273
Korte-Bouws, and C. G. van Reenen. 2002. Stress responses during milking; 274

Efecto de la frecuencia de ordeño sobre la producción, fraccionamiento lechero y parámetros de calidad de la leche en las cabras canarias
116
12
comparing conventional and automatic milking in primiparous dairy cows. J. 275
Dairy Sci. 85:3206–3216. 276
Jarrige, J. 1990. Alimentación de bovinos, ovinos y caprinos. 1st ed. Mundi-Prensa, 277
Madrid, Spain. 278
Knight, C. H., and M. Peaker. 1984. Mammary development and regression during 279
lactation in goats in relation to milk secretion. Q. J. Exp. Physiol. 69:331–338. 280
Lollivier, V., J. Guinard-Flament, M. Ollivier-Bousquet, and P. G. Marnet. 2002. 281
Oxytocin and milk removal: two important sources of variation in milk 282
production and milk quality during and between milkings. Reprod. Nutr. Dev. 283
42:173–186. 284
Lollivier, V., and P. G. Marnet. 2005a. Galactopoietic effect of milking in lactating 285
Holstein cows: Role of physiological doses of oxytocin. Livest. Prod. Sci. 286
95:131–142. 287
Lollivier, V., and P. G. Marnet. 2005b. Comparative study of the galactopoietics effect 288
of oxytocin during and between milkings in cows and goats. ICAR Technical 289
Series. 10:41–47. 290
Macuhova, J., V. Tancin, and R. M. Bruckmaier. 2004. Effects of oxytocin 291
administration on oxytocin release and milk ejection. J. Dairy Sci. 87:1236–292
1244. 293
Marnet, P. G., and B. C. McKusick. 2001. Regulation of milk ejection and milkability 294
in small ruminants. Livest. Prod. Sci. 70:125–133. 295
Negrao, J. A., P. G. Marnet, and J. Labussière. 2001. Effect of milking frequency on 296
oxytocin release and milk production in dairy ewes. Small Rumin. Res. 39:181–297
187. 298

MANUSCRITO 4
117
13
Negrao, J. A., M. A. Porcionato, A. Passille, and J. Rushen. 2004. Cortisol in saliva and 299
plasma of cattle after ACTH administration and milking. J. Dairy Sci. 87:1713–300
1718. 301
Nostrand S. D., D. M. Galton, H. N. Erb, and D. E. Bauman. 1991. Effects of daily 302
exogenous oxytocin on lactation milk yield and composition, J. Dairy Sci. 303
74:2119–2127. 304
Peaker, M., and D. R. Blatchford. 1988. Distribution of milk in the in the goat 305
mammary gland and its relation to the rate and control of milk secretion. J. Dairy 306
Res. 55: 41–48. 307
Raskin, R. L., M. Raskin, and R. L. Baldwin. 1973. Effects of chronic insulin and 308
cortisol administration on lactational performance and mammary metabolism in 309
rats. J. Dairy Sci. 56:1033–1041. 310
Salama, A. A. K., G. Caja, X. Such, S. Peris, A. Sorensen, and C. H. Knight. 2004. 311
Changes in cisternal udder compartment induced by milking interval in dairy 312
goats milked once or twice daily. J. Dairy Sci. 87:1181–1187. 313
Such, X., G. Caja, and L. Pérez. 1999. Comparison of milking ability between 314
Manchega and Lacaune dairy ewes. Pages 45–50 in Milking and milk 315
production of dairy sheep and goats. EAAP Publication No. 95. F. Barillet and 316
N. P. Zervas, Wageningen Pers., Wageningen, The Netherlands. 317
318
319
320
321
322
323

Efecto de la frecuencia de ordeño sobre la producción, fraccionamiento lechero y parámetros de calidad de la leche en las cabras canarias
118
14
Table 1. Milk yield and milk composition of goats subjected to different oxytocin treatments.1 324
Experimental weeks
Parameter Treatment2 1 2 3 4 5 6 7 8 SEM
Control 2.13a 2.15a 2.05a 2.04a 2.05a 2.05a 1.98ab 1.84b 0.060
OT1 2.15a 2.10a 2.14a 2.08a 2.09a 2.05ab 2.03ab 1.92b 0.072 Milk yield (L/d)
OT2 2.04a 1.98a 1.95ab 2.06a 2.06a 1.95ab 1.85b 1.83b 0.055
Control 4.62 4.63 4.56 4.67 4.72 4.78 4.72 4.86 0.040
OT1 4.34 4.55 4.48 4.34 4.37 4.40 4.40 4.55 0.048 Fat (%)
OT2 4.42 4.44 4.52 4.60 4.48 4.68 4.75 4.76 0.037
Control 3.82 3.80 3.81 3.83 3.86 3.87 3.88 3.89 0.016
OT1 3.81 3.79 3.75 3.79 3.77 3.79 3.80 3.81 0.014 Protein (%)
OT2 3.88 3.83 3.84 3.88 3.86 3.89 3.92 3.93 0.013
Control 5.02 5.04 5.06 4.97 5.02 4.93 4.92 4.88 0.021
OT1 5.11 5.13 5.09 5.07 5.12 5.06 4.99 4.94 0.015 Lactose (%)
OT2 5.05 5.05 5.09 5.01 5.09 5.01 5.01 4.92 0.023
a–bMeans with different superscripts within the same row are different (P < 0.05). 325
1Data are estimated marginal means and standard error of means. 326
2Treatment: OT1 = endogenous oxytocin; OT2 = exogenous oxytocin. 327
328
329
330
331
332
333
334
335
336
337
338
339

MANUSCRITO 4
119
15
Table 2. Total milk volume and milk partitioning of goats injected with different doses of 340
oxytocin at 4-h milking intervals.1 341
Milking time (h)
Parameter Treatment 1200 1600 2000 SEM
Control 277.42 244.58 248.92 21.517
0.5 IU 264.17 278.17 329.83 13.037
1 IU 278.58 225.42 265.00 9.762
2 IU 285.00 263.83 290.42 14.550
Total milk
(ml)
4 IU 290.67 277.67 297.33 14.616
Control 82.48x 81.92x 87.94x 2.443
0.5 IU 53.95y 57.25y 59.13y 3.846
1 IU 49.64y 51.61y 53.87y 3.287
2 IU 52.06y 49.55y 48.97y 3.002
Machine
milk (%)
4 IU 40.21b,y 57.94a,y 61.69a,y 3.316
Control 17.52y 18.08y 12.06y 2.443
0.5 IU 46.05x 42.75x 40.87x 3.846
1 IU 50.36x 48.39x 46.13x 3.287
2 IU 47.94x 50.45x 51.03x 3.002
Residual
milk (%)
4 IU 59.79a,x 42.06b,x 38.31b,x 3.316
a–bMeans with different superscripts within the same row are different (P < 0.05). 342
x–yMeans with different superscripts within the same column for each item are different (P < 343
0.05). 344
1Data are estimated marginal means and standard error of means. 345
346
347
348
349
350
351
352

Efecto de la frecuencia de ordeño sobre la producción, fraccionamiento lechero y parámetros de calidad de la leche en las cabras canarias
120
16
Table 3. Milk composition of machine milk and residual milk of goats injected with different 353
doses of oxytocin at 4-h milking intervals.1 354
Milking time (h)
Parameter Treatment 1200 1600 2000 SEM
Control 5.12a 4.22b 3.86b 0.125
0.5 IU 5.02a 4.00b 3.64b 0.139
1 IU 5.21a 4.33b 3.78b 0.223
2 IU 6.05a 4.62b 4.13b 0.170
Fat machine
milk (%)
4 IU 5.58a 4.02b 3.71b 0.170
Control 5.19a 4.67ab 4.26b 0.129
0.5 IU 4.83a 3.95b 4.00b 0.131
1 IU 5.78a 4.07b 4.38b 0.195
2 IU 5.83a 4.16b 4.46b 0.156
Fat residual
milk (%)
4 IU 5.55a 4.01b 4.18b 0.162
Control 2.87 2.98 2.81 0.075
0.5 IU 2.43 2.73 2.74 0.079
1 IU 2.64 2.97 2.77 0.078
2 IU 2.73 2.91 3.07 0.075
Protein
machine
milk (%)
4 IU 2.75 3.24 3.23 0.100
Control 3.16 3.41 3.40 0.112
0.5 IU 2.89 3.17 2.96 0.089
1 IU 2.86 3.39 3.17 0.086
2 IU 3.04 3.45 3.19 0.097
Protein
residual
milk (%)
4 IU 3.45 3.71 3.56 0.063
Control 4.48 4.55 4.59 0.029
0.5 IU 4.45 4.68 4.62 0.057
1 IU 4.52 4.68 4.73 0.042
2 IU 4.44 4.54 4.44 0.041
Lactose
machine
milk (%)
4 IU 4.50 4.41 4.45 0.045
Control 4.87 4.94 4.95 0.026
0.5 IU 4.79 4.89 4.91 0.036
1 IU 4.88 4.93 4.94 0.036
2 IU 4.83 4.89 4.94 0.032
Lactose
residual
milk (%)
4 IU 4.66 4.78 4.77 0.030
a–cMeans with different superscripts within the same row are different (P < 0.05). 355
1Data are estimated marginal means and standard error of means. 356
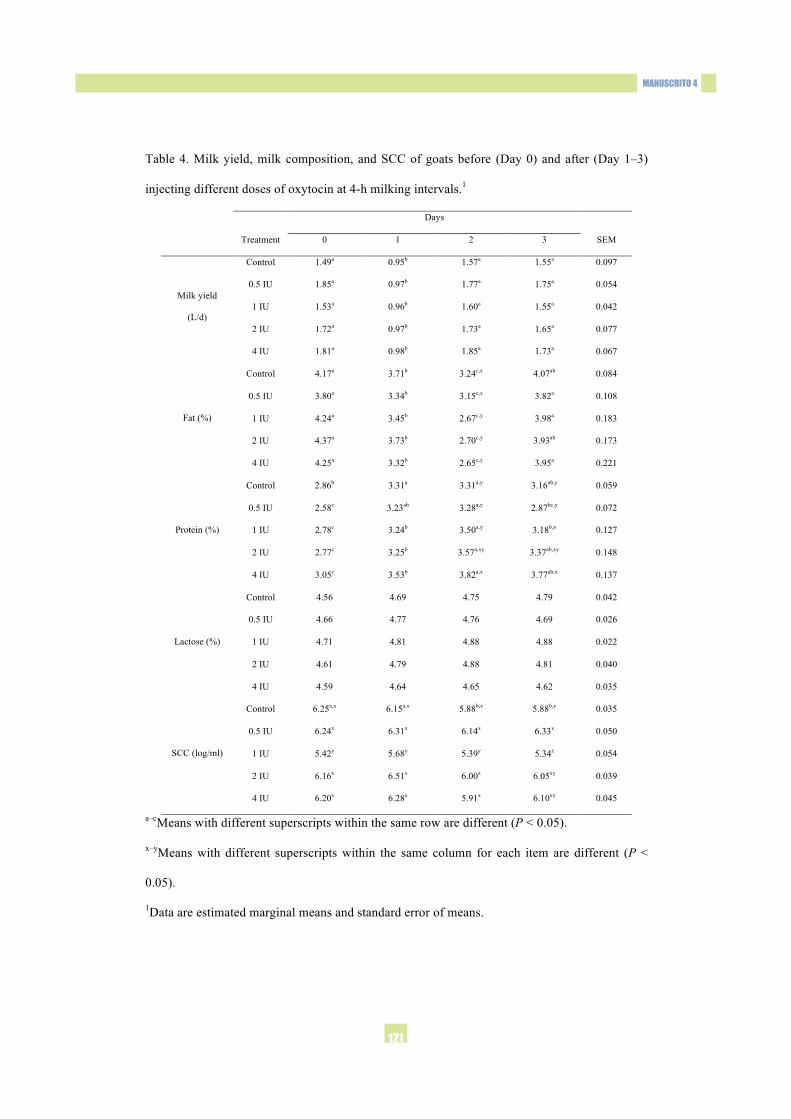
MANUSCRITO 4
121
17
Table 4. Milk yield, milk composition, and SCC of goats before (Day 0) and after (Day 1–3) 357
injecting different doses of oxytocin at 4-h milking intervals.1 358
Days
Treatment 0 1 2 3 SEM
Control 1.49a 0.95b 1.57a 1.55a 0.097
0.5 IU 1.85a 0.97b 1.77a 1.75a 0.054
1 IU 1.53a 0.96b 1.60a 1.55a 0.042
2 IU 1.72a 0.97b 1.73a 1.65a 0.077
Milk yield
(L/d)
4 IU 1.81a 0.98b 1.85a 1.73a 0.067
Control 4.17a 3.71b 3.24c,x 4.07ab 0.084
0.5 IU 3.80a 3.34b 3.15c,x 3.82a 0.108
1 IU 4.24a 3.45b 2.67c,y 3.98a 0.183
2 IU 4.37a 3.73b 2.70c,y 3.93ab 0.173
Fat (%)
4 IU 4.25a 3.32b 2.65c,y 3.95a 0.221
Control 2.86b 3.31a 3.31a,y 3.16ab,y 0.059
0.5 IU 2.58c 3.23ab 3.28a,y 2.87bc,y 0.072
1 IU 2.78c 3.24b 3.50a,y 3.18b,y 0.127
2 IU 2.77c 3.25b 3.57a,xy 3.37ab,xy 0.148
Protein (%)
4 IU 3.05c 3.53b 3.82a,x 3.77ab,x 0.137
Control 4.56 4.69 4.75 4.79 0.042
0.5 IU 4.66 4.77 4.76 4.69 0.026
1 IU 4.71 4.81 4.88 4.88 0.022
2 IU 4.61 4.79 4.88 4.81 0.040
Lactose (%)
4 IU 4.59 4.64 4.65 4.62 0.035
Control 6.25a,x 6.15a,x 5.88b,x 5.88b,y 0.035
0.5 IU 6.24x 6.31x 6.14x 6.33x 0.050
1 IU 5.42y 5.68y 5.39y 5.34z 0.054
2 IU 6.16x 6.51x 6.00x 6.05xy 0.039
SCC (log/ml)
4 IU 6.20x 6.28x 5.91x 6.10xy 0.045
a–cMeans with different superscripts within the same row are different (P < 0.05). 359
x–yMeans with different superscripts within the same column for each item are different (P < 360
0.05). 361
1Data are estimated marginal means and standard error of means. 362
363


MANUSCRITO 5


MANUSCRITO 5
125
Study of mammary tight junction permeability in dairy goats traditionally milked
once a day
A. Torresa, N. Castrob, A. Suárez-Trujillob, A. Argüellob, and J. Capotea*
aInstituto Canario de Investigaciones Agrarias (ICIA), La Laguna 38200, Tenerife,
Spain
bDepartment of Animal Science, Universidad de Las Palmas de Gran Canaria, Arucas
35413, Spain.
*Corresponding author: Juan Capote, ICIA, Apto. de correos 60, La Laguna 38200,
Tenerife, Spain.
Tel.: +34 922542800; fax: +34 922542898. E-mail address: [email protected]
ABSTRACT
Effects of milking interval on mammary tight junction permeability are well-
documented in ruminants. However, the most studies have been focused in animals that
usually are milked twice a day. For this reason, thirty-two dairy goats in mid lactation of
two breeds traditionally milked once a day (Majorera, Palmera) and two parity numbers
(primiparous, multiparous) were used to evaluate the short-term effects of different
milking intervals (10, 14, 24, 28, and 32 h) on tight junction permeability of mammary
epithelia. Milk samples were analyzed for determination of chemical composition, and
Na and K concentrations. Blood samples were immediately taken after each milking and
analyzed for determination of lactose, and Na and K concentrations. Milk volumes
increased when milking interval was increased. On average, it increased from 2.23 to
2.73 L in Majorera, and from 1.38 L to 1.63 L in Palmera goats, at 24- and 32-h of milk
accumulation, respectively, which demonstrated the adaptation of the studied breeds to
accommodate greater milk volumes into the udder at extended milkings. Furthermore, it

Efecto de la frecuencia de ordeño sobre la producción, fraccionamiento lechero y parámetros de calidad de la leche en las cabras canarias
126
did not produce apparent changes in the milk composition from 24- to 28-h, and from
24- to 32-h intervals. The concentrations of Na and K in milk and blood did not reflect
the degree of permeability of tight junctions at extended milkings, at least in goats
traditionally milked once a day. Finally, plasma lactose increased sharply at 24-h, being
more pronounced in primiparous (from 65.59 to 111.81 μM, at 14- and 24-h,
respectively) than multiparous goats (from 161.67 to 241.95 μM, at 14- and 24-h,
respectively), indicative of an increase in the permeability of tight junctions.
1. Introduction
Tight junctions form the continuous intercellular barrier between epithelial cells,
which is required to separate tissue spaces and regulate selective movement of small
molecules and ions across the epithelium (Anderson and Van Itallie, 2009). In the
mammary gland, the tight junctions are dynamic structures between the blood, or more
precisely the interstitial fluid (basolateral side), and milk in the alveolar lumen (apical
side), thus preventing serum components from entering into milk and vice versa
(Stelwagen et al., 1995). In addition, tight junctions are instrumental in maintaining the
polarized state of secretory cells, and keeping a difference in lipid and protein
composition between the basal and apical side of the plasma membrane (Stelwagen et
al., 1998).
In the mammary epithelium, tight junctions are formed during lactogenesis, prior
to onset of copious milk secretion, and are leaky during mammary involution (Nguyen
and Neville, 1998; Ben Chedly et al., 2010). During lactation the tight junctions are
become impermeable in most lactating animals, including ruminants. However,
systemic and local factors, such as changing hormone concentration, intramammary
pressure and mastitis, have been shown to regulate tight junction permeability

MANUSCRITO 5
127
(Stelwagen et al., 1999b). Tight junctions switch to a leaky state after approximately 18
h of milk accumulation in cows (Stelwagen et al., 1997), after 20 h in sheep (Castillo et
al., 2008), and after 21 h in goats (Stelwagen et al., 1994). Moreover, Stelwagen et al.
(1994) have previously shown that a decrease in the rate of milk secretion is correlated
with the leakiness of mammary tight junctions observed during extended milking.
However, Ben Chedly et al. (2013) found that the decrease in milk yield that occurs
during once daily milking in goats is due to regulation of synthetic activity rather than
to apoptosis of mammary epithelial cells or the state of the mammary gland tight
junctions.
The Na and K balance between the alveolar lumen and the interstitial fluid is
conditioned by tight junction integrity. Thus, Na and K can freely cross the apical
membrane, and the changes in the concentrations of these ions lead to corresponding
intracellular changes (Stelwagen et al., 1999a). Furthermore, lactose is a component
synthesized only in the mammary gland and is not secreted basolaterally in significant
quantities, so its presence in blood can only be explained by its movement from milk
into blood via leaky tight junctions (Stelwagen et al., 1994; Castillo et al., 2008).
Knowledge about how different milking intervals affect the permeability of tight
junctions in dairy goats traditionally milked once a day is required. For this reason, the
objective of this study was to evaluate some indicators of leakiness of tight junction at
different milking intervals in two dairy goat breeds traditionally milked once a day.
2. Material and methods
The experimental animal procedures were approved by the Ethical Committee of
the Universidad de Las Palmas de Gran Canaria (Arucas, Spain). The present study was
performed in the experimental farm of the Instituto Canario de Investigaciones Agrarias

Efecto de la frecuencia de ordeño sobre la producción, fraccionamiento lechero y parámetros de calidad de la leche en las cabras canarias
128
(Tenerife, Spain) on 32 dairy goats belonging to two breeds: Majorera (n = 8,
primiparous, 2.09 ± 0.53 L/d; n = 8; multiparous, 2.11 ± 0.57 L/d), and Palmera (n = 8,
primiparous, 1.35 ± 0.39 L/d; n = 8; multiparous, 1.41 ± 0.20 L/d), in mid lactation at
the beginning of the experiment. The animals were fed according to the guidelines of
the Institute National de la Recherche Agronomique (INRA, Paris, France) and
recommendations (Jarrige, 1990). The goats were divided in 2 flocks (n = 16) balanced
for parity (primiparous and multiparous) and breed (Majorera and Palmera) with similar
milk yields.
The experiment considered 4 milking intervals (Flock 1: 10, 14, 24, and 28 h;
Flock 2: 10, 14, 24, and 32 h), where milk and blood samples were taken for analysis.
Goats were milked in a double 12-stall parallel milking parlor (Alfa-Laval, Madrid,
Spain) equipped with recording jars (4 L ± 5%) and a low-line milk pipeline. Milking
was performed at a vacuum pressure of 42 kPa, a pulsation rate of 90 pulses/min, and a
pulsation ratio of 60/40 in accordance with Capote et al. (2006). The milking routine
included wiping dirt off teat ends and stripping 2-3 squirts of milk from each teat,
machine milking and stripping milking, done by the operator to remove the milk
remaining in the udder before cluster removal, and teat dipping in an iodine solution
(P3-cide plus, Henkel Hygiene, Barcelona, Spain).
Milk volumes were recorded by using the recording jars in the milking parlor.
Milk samples were analyzed for determination of chemical composition, and Na and K
concentrations. Blood samples were immediately taken after each milking and analyzed
for determination of lactose, and Na and K concentrations. Milk fat, protein and lactose
percentages were determined by using a DMA2001 Milk Analyzer (Miris Inc., Uppsala,
Sweden). Concentrations of Na and K in milk were determined using atomic absorption
spectrometry (AAnalyst 200 spectrometer, Perkin-Elmer, Norwalk, USA) in the
MANUSCRITO 5
129
Laboratory of Chemical Analysis of the Instituto Canario de Investigaciones Agrarias,
and the concentrations of these ions in blood were measured by means of ion selective
electrodes (Olympus AU2700 analyzer, Beckman Coulter, Tokyo, Japan) in the
Laboratory LGS Análisis. The enzymatic assay for determination of plasma lactose
(Boehringer Mannheim / R-Biopharm) was based on two reactions, one measuring
galactose and the other measuring lactose and galactose; the difference between the two
provided a measurement of lactose concentration. This analysis was conducted in the
Laboratory of Research Unit at University Hospital (Tenerife, Spain).
The statistical analyses were performed by using SPSS 15.0 software (SPSS
Inc., Chicago, USA). Repeated measures analysis of variance (ANOVA), with
adjustments for non-sphericity (Greenhouse-Geisser correction), was applied to evaluate
milking intervals effects on studied parameters; followed by LSD post-hoc tests.
Differences among experimental groups (Majorera-primiparous, Majorera-multiparous,
Palmera-primiparous, Palmera-multiparous) were evaluated using a multiple
comparison test following the Tukey method. Statistical differences were considered
significant at P < 0.05. Data are presented as least squares means.
3. Results
Milk volume (Table 1) was affected due to milking interval in both experimental
flocks (P < 0.05). However, Majorera and Palmera goats did not show differences from
10- to 14-h of milk accumulation, but a significant increase was observed from 14- to
24-h intervals in the studied groups. In the Flock 1, milk volume at 28-h was higher
than milk volume at 24-h in the studied breeds, but these differences were not
significant (P > 0.05). In contrast, the goats of Flock 2 showed a dramatic increase in
milk volume in Majorera primiparous (17%), Majorera multiparous (27%), Palmera

Efecto de la frecuencia de ordeño sobre la producción, fraccionamiento lechero y parámetros de calidad de la leche en las cabras canarias
130
primiparous (20%), and Palmera multiparous (10%) from 24- to 32-h of milk
accumulation. Regarding breed effect, no significant differences were found between
Majorera and Palmera goats at 10-h milking interval. Nevertheless, Majorera goats had
higher milk volumes than Palmera goats at subsequent milking intervals (P < 0.05).
Additionally, milk volumes were similar (P > 0.05) between primiparous and
multiparous goat at different milking intervals.
Milk fat percentages (Table 1) were comparable between consecutive milking
intervals (P > 0.05), except for goats of the Flock 1, where milk at 14-h contained lower
percentages of fat than milk at 24-h (P < 0.05). Nevertheless, there was a trend to obtain
milk richer in fat content when the milking intervals differ by more than 14 hours (P <
0.05). In addition, fat percentage was not affected by breed and parity factors, both in
goats of Flock 1 and 2 (P > 0.05).
No significant differences were detected in milk protein percentages from 10- to
14-h milking intervals in the studied groups (Table 1). Subsequently, Majorera breed
had an increase in protein content when interval switched from 14- to 24-h (P < 0.05),
and stayed stable from 24- to 28- and 32-h (P > 0.05). Likewise, Palmera goats did not
have differences in protein content from 24- to 28- and 32-h. Breed and parity had not
effects on milk protein percentage at the studied milking intervals.
No differences were found in milk lactose percentages in the studied goats
(Table 1) when the milking interval and breed factors were considered (P > 0.05).
Regarding parity effect, Palmera primiparous had higher values than Palmera
multiparous at 28- and 32-h (P < 0.05). However, these differences were not significant
between Majorera primiparous and multiparous.
Milking interval did not modify Na content in milk for Majorera goats (Table 2).
Only a slight increase in Na concentration was observed for Palmera primiparous and

MANUSCRITO 5
131
multiparous (Flock 2) from 10- with respect to 24- and 32-h. In general, primiparous
goats had lower levels of Na than multiparous goats, whereas Palmera had higher values
than Majorera of these ions in milk, when the parity and breed effects were considered,
respectively. Moreover, no changes were found in concentration of K in milk for the
goat groups due to milking interval, breed or parity factors (P > 0.05).
Goat breed and parity did not affect (P > 0.05) Na and K concentration in
plasma blood at all intervals (Table 2). Besides, as milking interval increased,
concentration of Na in blood plasma decreased for Majorera and Palmera in both
parities (P < 0.05). Otherwise, concentration of K in blood plasma was steady until 28-h
(Flock 1) and increased markedly at 32-h (Flock 2) for all goat groups.
Milking interval affected (P < 0.05) lactose concentration in plasma (Table 2). It
was observed that after 14-h interval, Majorera and Palmera goats in both parities
dramatically increased its levels of lactose in plasma blood. Likewise, parity factor had
an effect on plasma lactose, where primiparous goats exhibited lower values than
multiparous goats at the studied milking intervals. Finally, no differences were observed
between Majorera and Palmera breeds at the different intervals (P > 0.05).
4. Discussion
The increases in milk volume with increasing milking intervals, is a
consequence of a wider cisternal capacity of the studied breeds, which allowed a
continuous drop of milk from alveoli to the cistern, reducing the feedback inhibitor
process, the alveolar milk stasis and alveolar pressure (McKusick et al., 2002; Torres et
al., 2013a). Typically in goats, 24-h of milk stasis is necessary to activate regulatory
mechanisms leading to disruption of tight junctions and reduced milk secretion, longer
than the 18 h required to induce a similar phenomena in cows and sheep (Marnet and

Efecto de la frecuencia de ordeño sobre la producción, fraccionamiento lechero y parámetros de calidad de la leche en las cabras canarias
132
Komara, 2008). Goats have a higher proportion of milk in their cistern than ewes or
cows, which most likely contributes to their ability to better maintain milk yield under
extended milking (Silanikove et al., 2010).
Disruption of mammary tight junctions is associated with a decrease in milk
yield due to longer milking intervals (Stelwagen et al., 1994; Delamaire and Guinard-
Flament, 2006), which is related with cell death and a decrease in mammary activity
(Ben Chedly et al., 2010). It is predicted that for milking intervals of less than 20-h in
goats and 18-h in cows, the concentration of β-casein f(1–28), peptide that serves as a
local regulator on milk secretion, would be higher in the cistern than in the alveoli
(Silanikove et al., 2000). Therefore, the alveoli will not be exposed to the full impact of
the negative feedback signal of this peptide. Extending milk stasis beyond these times
exceeds the storage capacity of the cistern, resulting in the equilibration of β-casein f(1–
28) concentration between the cistern and the alveoli, and inducing disruption of the
tight junction (Silanikove et al., 2010).
The higher volume of milk found for Majorera goats compared with Palmera
goats is due to cisternal size of each breed. Previously, Torres et al. (2013a) reported
that Majorera have higher udder depth values (difference in distance between the udder
floor and the cistern floor) than Palmera, which is correlated with the udder volume
(Capote et al., 2006). Bruckmaier et al. (1997) explained that a large absolute cisternal
volume implies that a large fraction of the milk is stored within the cisternal cavities.
Castillo et al. (2008) showed a greater milk accumulation rate in Lacaune than in
Manchega ewes, where Lacaune breed have a greater cisternal area than Manchega
breed (Rovai et al., 2008).
Milk volume in multiparous goats was higher than primiparous goats, but the
statistical differences were no significant, which was unexpected. Goetsch et al. (2011)

MANUSCRITO 5
133
reported that milk production is lower for primiparous than for multiparous dairy goats.
Salama et al. (2004) found that the differences in storage capacity of the cisterns
between primiparous and multiparous goats were more evident after 24 h of milk
accumulation, in which multiparous goats had larger cisternal area and were able to
store more volume of milk in the cistern than primiparous goats. McKusick (2000)
found that ewes with high milk volume-intramammary pressure ratio had a significant
degree of compliance in their udders because they were able to accommodate an
increase in intramammary pressure of 30% when the milking interval was extended to
24 h. Therefore, intramammary compliance or elasticity plays a significant role to
accommodate the milk volumes secreted. The results obtained could be explained by the
fact that primiparous goats had an optimal intramammary compliance due to adaptation
of the breed to once daily milking. However, further studies are needed to verify this
hypothesis.
Milk fat percentages had a trend to be higher as milking interval increased.
However, McKusick et al. (2002) and Castillo et al. (2008) in ewes, and Ayadi et al.
(2004) in cows observed that milk fat content decreased with longer milking intervals.
These authors indicate that there was transfer of milk fat from the alveoli to the cistern
during early udder filling, but this transfer was no longer taking place during the later
intervals. It has been reported an upward movement of the fat globules, in the opposite
direction to the downward draining and newly secreted milk at extended milking in
dairy cows (Ayadi et al., 2004). Conversely, this cistern recoil phenomenon did not
occur in goats, where once milk is ejected, it is unable to return to the alveoli (Salama et
al., 2004). In addition, Komara et al. (2009) in Alpine goats and Torres et al. (2013b) in
Majorera and Palmera goats did not find differences in fat percentages between once
and twice daily milking. Moreover, according to Stelwagen et al. (1997), the diameter

Efecto de la frecuencia de ordeño sobre la producción, fraccionamiento lechero y parámetros de calidad de la leche en las cabras canarias
134
of milk fat globules is greater than the intercellular joints, and Komara et al. (2009)
found that fat globule size between once and twice daily milking were similar for dairy
goats. Therefore, changes in fat content according to milking interval are related to the
regulatory mechanisms for secretion of large and high-viscosity milk fat globules
relative to the components in the aqueous phase of milk (Davis et al., 1999).
Milk protein percentages did not have changes at extended milking in the
studied breeds, which agrees with observations in dairy cows by Ayadi et al. (2004) and
dairy ewes by Castillo et al. (2008), where protein content in milk was constant after 12
h. However, McKusick et al. (2002) found an increase in milk protein fraction from 20
h in dairy ewes. The tendency of protein content to increase for extended milking
intervals in some species or breeds may be explained by increased tight junction
leakiness allowing serum protein entering into the milk, since casein does not move
through leaky mammary tight junction (Ayadi et al., 2004; Castillo et al., 2008).
However, typical milk albumin concentration (the greatest potential contributor of
serum protein to milk) is too small to make an effect on protein concentration in milk,
being produced and secreted by mammary epithelial cells into milk (Silanikove et al.,
2013). Therefore, the changes in milk protein content according to milking interval, like
milk fat content, seems are more correlated to regulation of synthetic activity of
secretory cells or hydrolysis of protein rather to disruption of the mammary gland tight
junctions (Ben Chedly et al., 2013).
The absence of differences in milk lactose percentages found in the studied goats
according to milking interval factor is related with the udder size. Thus, Castillo et al.
(2008) reported a decrease in lactose content from the 20- to 24-h milking interval in
Manchega ewes (small udder cisterns), but not in Lacaune ewes (large udder cisterns).
Decreases of milk lactose percentage seem to be due to lactose passing from milk into

MANUSCRITO 5
135
blood through impaired tight junctions associated with extended milking intervals
(Stelwagen et al., 1994). However, Ben Chedly et al. (2013) proposed that the reduction
of milk lactose yield is essentially due to a reduction of its synthesis by the mammary
gland.
In general, Na and K contents in milk were not affected by the studied milking
intervals. Only a slight increase was observed in Na content for Palmera goats from 10-
to 24- and 32 intervals. When the permeability of tight junctions increases, the
concentration of Na in milk increases, and the concentration of K decreases (Stelwagen
et al., 1999a). Furthermore, a reduction of Na content and an increase of K content in
blood plasma would be expected during the disruption of tight junctions. In the present
experiment was detected the diminution of Na values in blood plasma in the studied
groups when the milking interval was increased, and the concentration of K only was
increased both Majorera and Palmera goats at 32-h interval. Castillo et al. (2008) did
not find differences in Na and K concentration in milk in Lacaune ewes at extended
milking intervals, but Manchega ewes had an increase of Na and a decreased of K in
milk after 20 h. These authors suggested that variations in ion concentration have a
relationship with the adaptation to extended milking intervals of these breeds being
lower in Manchega than Lacaune ewes. Furthermore, Stelwagen et al. (1994) found that
Na concentration in milk increased from 16.3 mM at 0 h to 21.3 mM at 36 h, and the K
concentration in milk decreased from 46.7 mM at 0 h to 34.3 mM at 36 h in Saanen
goats, as consequence of tight junction disruption. In the present study, Majorera and
Palmera breeds are fully adapted to once daily milking, which can explain that
concentrations of Na and K were not the best indicators of leakiness of tight junctions.
Despite the high variability of plasma lactose concentration obtained in the
experimental groups, this increased sharply at 24-h, indicative of an increase in tight

Efecto de la frecuencia de ordeño sobre la producción, fraccionamiento lechero y parámetros de calidad de la leche en las cabras canarias
136
junction permeability. Castillo et al. (2008) considered that lactose in plasma is the main
indicator of mammary tight junction permeability, because changes in Na and K
concentrations may reflect an alteration in the transport of these ions across transcellular
rather than paracellular pathways. In Saanen goats, Stelwagen et al. (1994) showed an
increase of plasma lactose concentration after 21 h of milk accumulation, whereas that
in dairy cows, Stelwagen et al. (1997) observed the increase of lactose in plasma after
18 h of milk stasis. In addition, some studies which switched from twice to once daily
milking in goats and cows (Stelwagen et al., 1997; Ben Chedly et al., 2013)
demonstrated that the increase in blood lactose concentration is transient, suggesting
that the gland gradually adapted to once daily milking. Finally, the increases of plasma
lactose seem to have not been conditioned by breed effect. Nevertheless, primiparous
goats had an increase more pronounced in plasma lactose values than multiparous goats
at extended milking intervals, although these animals presented the highest
concentrations, which may indicate that the older animals had a greater degradation in
the integrity of tight junction due to different lactations. On the other hand, Castillo et
al. (2008) found that Manchega ewes increased by 5-fold its plasma lactose values from
20- to 24-h, whereas Lacaune ewes increased by only 1.5-fold, indicating that the tight
junction leakiness effect was greater in Manchega that in Lacaune ewes. Therefore, the
udder development plays an important role on degree of tight junction leakiness.
5. Conclusions
The wide cisternal capacity of the Majorera and Palmera breeds allowed an
increase in milk yield above to 24 h of milk accumulation. Furthermore, milk
composition was not impaired when milking intervals were increased until 28 or 32 h.
In regard to indicators of leakiness of tight junction, the concentrations of Na and K in

MANUSCRITO 5
137
milk and blood did not reflect its degree of permeability, at least in goats traditionally
milked once a day. Moreover, the increase in the concentration of plasma lactose after
14 h did not allow to precise whether the disruption of tight junctions occurred before or
after to 24 h, or simply is normal flux of lactose from apical to basolateral side due to
status of tight junctions in goats usually milked once time a day. Therefore, a milking
interval between 14- and 24-h will be necessary to take into consideration to evaluate
the integrity of tight junctions. Nevertheless, the results did not show a clear
relationship between the milk yields and damages of tight junction permeability, which
is interesting to develop breeding programs adapted to extended milkings, in areas that
require it.
Conflict of interest
None.
Acknowledgments
This work was supported by Fondo Europeo de Desarrollo Regional-Instituto
Nacional de Investigación y Tecnología Agraria y Alimentaria (FEDER-INIA)
RTA2009-00125. The authors are also grateful to Dr. Eduardo Salido and Dr. Ana Rosa
Socorro for their assistance with the experimental procedures.
References
Anderson, J.M., Van Itallie, C.M., 2009. Physiology and function of the tight junction.
Cold Spring Harb. Perspect. Biol. 1:a002584.

Efecto de la frecuencia de ordeño sobre la producción, fraccionamiento lechero y parámetros de calidad de la leche en las cabras canarias
138
Ayadi, M., Caja, G., Such, X., Rovai, M., Albanell, E., 2004. Effect of different milking
intervals on the composition of cisternal and alveolar milk in dairy cows. J.
Dairy Res. 71, 304–310.
Ben Chedly, H., Boutinaud, M., Bernier-Dodier, P., Marnet. P.G., Lacasse, P., 2010.
Disruption of cell junctions induces apoptosis and reduces synthetic activity in
lactating goat mammary gland. J. Dairy Sci. 93, 2938–2951.
Ben Chedly, H., Lacasse, P., Marnet, P.G., Boutinaud, M., 2013. The decrease in milk
yield during once daily milking is due to regulation of synthetic activity rather
than apoptosis of mammary epithelial cells in goats. Animal 7, 124–133.
Bruckmaier, R.M., Paul, G., Mayer, H., Schams, D., 1997. Machine milking of
Ostfriesian and Lacaune dairy sheep: Udder anatomy, milk ejection and milking
characteristics. J. Dairy Res. 64, 163–172.
Castillo, V., Such, X., Caja, G., Casals, R., Albanell, E., Salama, A.A.K., 2008. Effect
of milking interval on milk secretion and mammary tight junction permeability
in dairy ewes. J. Dairy Sci. 91, 2610–2619.
Capote, J., Argüello, A., Castro, N., López, J.L., Caja, G., 2006. Correlations between
udder morphology, milk yield and milking ability with different milking
frequencies in dairy goats. J. Dairy Sci. 89, 2076–2079.
Goetsch, A.L., Zeng, S.S., Gibson, T.A., 2011. Factors affecting goat milk production
and quality. Small Rumin. Res. 101, 55–63.
Davis, S.R., Farr, V.C., Stelwagen, K., 1999. Regulation of yield loss and milk
composition during once-daily milking: A review. Livest. Prod. Sci. 59, 77–94.
Delamaire, E., Guinard-Flament, J., 2006. Longer milking intervals alter mammary
epithelial permeability and the udder’s ability to extract nutrients. J. Dairy Sci.
89, 2007–2016.

MANUSCRITO 5
139
Jarrige, J., 1990. Alimentación de bovinos, ovinos y caprinos (Nutrition in bovine,
ovine and caprine), first ed. Mundi Prensa, Madrid, Spain.
Komara, M., Boutinaud, M., Ben Chedly, H., Guinard-Flament, J., Marnet, P.G., 2009.
Once-daily milking effects in high-yielding alpine dairy goats. J. Dairy Sci. 92,
5447–5455.
Marnet, P.G., Komara, M., 2008. Management systems with extended milking intervals
in ruminants: Regulation of production and quality of milk. J. Anim. Sci. 86,
47–56.
McKusick, B.C., 2000. Physiologic factors that modify the efficiency of machine
milking in dairy ewes. Proceedings of the 6th Great Lakes Dairy Sheep
Symposium 86–100.
McKusick, B.C., Thomas, D.L., Berger, Y.M., Marnet, P.G., 2002. Effect of milking
interval on alveolar versus cisternal milk accumulation and milk production and
composition in dairy ewes. J. Dairy Sci. 85, 2197–2206.
Nguyen, D.A., Neville, M.C., 1998. Tight junction regulation in the mammary gland. J.
Mammary Gland Biol. 3, 233–246.
Salama, A.A.K., Caja, G., Such, X., Peris, S., Sorensen, A., Knight, C.H., 2004.
Changes in cisternal udder compartment induced by milking interval in dairy
goats milked once or twice daily. J. Dairy Sci. 87, 1181–1187.
Silanikove, N., Shamay, A., Shinder, D., Moran, A., 2000. Stress down regulates milk
yield in cows by plasmin induced β-casein product that blocks K+ channels on
the apical membranes. Life Sci. 67, 2201–2212.
Silanikove, N., Leitner, G., Merin, U., Prosser, C., 2010. Recent advances in exploiting
goat's milk: Quality, safety and production aspects. Small Rumin. Res. 89, 110–
124.

Efecto de la frecuencia de ordeño sobre la producción, fraccionamiento lechero y parámetros de calidad de la leche en las cabras canarias
140
Silanikove, N., Shapiro, F., Merin, U., Leitner, G., 2013. Tissue-type plasminogen
activator and plasminogen embedded in casein rule its degradation under
physiological situations: manipulation with casein hydrolysate. J. Dairy Res. 80,
227–232.
Stelwagen, K., Davis, S.R., Farr, V.C., Prosser, C.G., Sherlock, R.A., 1994. Mammary
epithelial cell tight junction integrity and mammary blood flow during an
extended milking interval in goats. J. Dairy Sci. 77, 426–432.
Stelwagen, K., Farr, V.C., Davis, S.R., Prosser, C.G., 1995. EGTA-induced disruption
of epithelial cell tight junctions in the lactating caprine mammary gland. Am. J.
Physiol. 269, R848–R855.
Stelwagen, K., Farr, V.C., McFadden, H.A., Prosser, C.G., Davis, S.R., 1997. Time
course of milk accumulation-induced opening of mammary tight junctions and
blood clearance of milk components. Am. J. Physiol. 273, R379–R386.
Stelwagen, K., van Espen, D.C., Verkerk, G.A., McFadden, H.A., Farr, V.C., 1998.
Elevated plasma cortisol reduces permeability of mammary tight junctions in the
lactating bovine mammary epithelium. J. Endocrinol. 159, 173–178.
Stelwagen, K., Farr, V.C., McFadden, H.A., 1999a. Alteration of the sodium to
potassium ratio in milk and the effect on milk secretion in goats. J. Dairy Sci. 82,
52–59.
Stelwagen, K., McFadden, H.A., Demmer, J., 1999b. Prolactin, alone or in combination
with glucocorticoids, enhances tight junction formation and expression of the
tight junction protein occludin in mammary cells. Mol. Cell. Endocrinol. 156,
55–61.
Rovai, M., Caja, G., Such, X., 2008. Evaluation of udder cisterns and effects on milk
yield of dairy ewes. J. Dairy Sci. 91, 4622–4629.

MANUSCRITO 5
141
Torres, A., Castro, N., Hernández-Castellano, L.E., Argüello, A., Capote, J., 2013a.
Effects of milking frequency on udder morphology, milk partitioning, and milk
quality in 3 dairy goat breeds. J. Dairy Sci. 96, 1071–1074.
Torres, A., Castro, N., Argüello, A., Capote, J., 2013b. Comparison between two milk
distribution structures in dairy goats milked at different milking frequencies.
Small Rumin. Res. DOI: 10.1016/j.smallrumres.2013.04.013.

Efecto de la frecuencia de ordeño sobre la producción, fraccionamiento lechero y parámetros de calidad de la leche en las cabras canarias
142
Table 1. Effects of milking interval on milk volume and milk composition in two dairy
goat breeds 1
Flock 1 Flock 2
Milking interval (h) Milking interval (h)
10 14 24 28 SEM
10 14 24 32 SEM
Milk volume (L)
Majorera primiparous 1.02a 1.40a,y 1.81b,y 2.05b,y 0.157 0.98a 1.31a,xy 2.23b,y 2.61c,y 0.208
Majorera multiparous 1.04a 1.31a,y 2.03b,y 2.18b,y 0.176 1.21a 1.50a,y 2.24b,y 2.84c,y 0.198
Palmera primiparous 0.61a 0.71a,x 1.11b,x 1.35b,x 0.155 0.64a 0.80a,x 1.20b,x 1.44c,x 0.128
Palmera multiparous 0.72a 1.03a,xy 1.45b,xy 1.76c,xy 0.116 0.72a 1.00a,xy 1.55b,x 1.71c,x 0.108
Milk composition
Fat (%)
Majorera primiparous 2.17a 2.55a 3.15b 3.66b 0.189 2.27a 2.25a 2.83ab 3.05b 0.113
Majorera multiparous 2.95a 3.24a 4.11b 4.38b 0.187 2.99a 2.89a 3.19ab 3.61b 0.118
Palmera primiparous 2.41a 2.45a 3.72b 3.56b 0.225 2.69a 2.88ab 3.64b 3.37b 0.134
Palmera multiparous 2.43ª 3.03a 3.92b 4.22b 0.207 2.39a 2.95ab 3.51bc 3.83c 0.173
Protein (%)
Majorera primiparous 2.39a 2.73a 3.19b 3.39b 0.156 2.19a 2.38a 3.03b 3.02b 0.118
Majorera multiparous 2.89a 2.89a 3.84b 4.30b 0.205 2.49a 2.75a 3.08b 3.40b 0.142
Palmera primiparous 2.37a 3.01ab 3.73b 3.54b 0.176 2.32a 2.82ab 3.19bc 3.73c 0.173
Palmera multiparous 2.97a 3.07a 3.98b 4.01b 0.180 2.41a 3.04ab 3.36bc 3.87c 0.165
Lactose (%)
Majorera primiparous 5.06 4.95 4.73 4.69xy 0.124 5.51 5.45 5.05 5.08xy 0.085
Majorera multiparous 4.67 4.43 4.55 4.38x 0.082 4.98 5.09 4.83 4.75x 0.109
Palmera primiparous 5.33 5.08 4.76 5.03y 0.070 5.35 5.17 5.06 5.22y 0.087
Palmera multiparous 4.53 4.81 4.39 4.20x 0.136 4.94 5.04 4.77 4.80x 0.098
a–cMeans with different superscripts within the same row are different (P < 0.05).
x–yMeans with different superscripts within the same column for each item are different (P < 0.05).
1Data are least square means and standard error of means.

MANUSCRITO 5
143
Table 2. Effects of milking interval on concentration of Na and K in milk and plasma
blood and concentration of plasma lactose in two dairy goat breeds 1
Flock 1 Flock 2
Milking interval (h) Milking interval (h)
10 14 24 28 SEM
10 14 24 32 SEM
Milk
Na (mM)
Majorera primiparous 12.38x 13.47x 14.80x 14.99x 0.437 12.65x 14.13x 13.99x 13.33x 0.605
Majorera multiparous 18.62y 17.43y 18.17xy 19.87y 0.519 20.03y 18.74y 21.99y 20.76y 0.996
Palmera primiparous 12.53x 14.36xy 15.99x 15.41x 0.538 13.78a,x 15.56ab,xy 16.51b,x 17.02b,xy 0.880
Palmera multiparous 19.76y 22.36y 22.17y 24.36z 0.763 17.70a,y 18.29ab,y 20.87b,xy 21.28b,y 0.620
K (mM)
Majorera primiparous 34.75 37.44 37.02 37.15 0.904 35.70 39.82 38.07 38.53 0.960
Majorera multiparous 36.01 38.80 42.80 39.96 1.149 38.13 41.99 40.98 40.24 0.728
Palmera primiparous 34.16 36.99 34.51 35.57 0.805 33.35 36.33 35.13 33.20 0.536
Palmera multiparous 33.36 35.76 37.44 34.02 1.131 34.65 36.32 37.93 36.44 0.839
Plasma blood
Na (mM)
Majorera primiparous 146.08b 145.55b 144.68a 144.23a 0.278 145.95b 145.30b 144.05a 143.90a 0.287
Majorera multiparous 148.53c 146.95bc 146.80ab 144.90a 0.517 146.88b 146.05ab 144.15a 144.45a 0.417
Palmera primiparous 146.45b 144.85ab 142.70a 142.75a 0.552 147.28b 145.93ab 143.85a 143.80a 0.455
Palmera multiparous 147.05b 145.20ab 144.18a 143.33a 0.464 147.00c 145.50bc 143.80a 144.40ab 0.365
K (mM)
Majorera primiparous 5.18 5.08 5.00 5.73 0.120 5.10a 4.78a 4.73a 5.88b 0.148
Majorera multiparous 5.23 5.03 4.90 5.45 0.102 5.28ab 4.93a 4.60a 5.90b 0.165
Palmera primiparous 5.33 5.05 4.95 5.53 0.134 5.03ab 4.90a 4.55a 5.45b 0.117
Palmera multiparous 4.93 5.10 4.88 5.63 0.136 4.68a 4.58a 4.43a 5.58b 0.134
Plasma lactose (μM)
Majorera primiparous 54.96a,x 66.51a,x 127.85b,x 181.05c,y 14.435 65.48a,x 84.39b,xy 140.98c,x 230.23d,y 17.707
Majorera multiparous 135.45a,y 177.23a,y 235.51b,y 328.22c,z 20.651 120.64a,y 180.95a,z 222.92b,y 308.96c,z 21.158
Palmera primiparous 44.26a,x 56.26a,x 88.73b,x 110.38c,x 10.100 43.28a,x 55.18a,x 89.71b,x 152.78c,x 12.528
Palmera multiparous 136.75a,y 160.35a,y 264.00b,y 342.21c,z 22.518 106.96a,y 128.15a,y 245.37b,y 314.44c,z 22.815
a–dMeans with different superscripts within the same row are different (P < 0.05).
x–zMeans with different superscripts within the same column for each item are different (P < 0.05).
1Data are least square means and standard error of means.


CONCLUSIONES


CONCLUSIONES
147
Artículo 1Elhechodequealrededordel80%delalechetotalqueseencuentraenlaubre,sealmacene
enloscompartimentoscisternales,tantoalas14-comoalas24-h,sugierequelamayorpartedela
transferencia de leche desde los alvéolos a la cisterna ocurre durante las primeras fases de llenado
delaglándula.Poresarazónnoseencontrarondiferencias,enrelaciónalacomposiciónquímicade
la leche cisternal, entre ambos intervalos de ordeño. Sin embargo, los diversos cambios que presen-
taron los contenidos de grasa, lactosa y sólidos totales en la leche alveolar, sugieren la necesidad de
posteriores estudios sobre los mecanismos responsables de la eyección de la leche entre ordeños.
Artículo 2Los resultados demostraron que la práctica del doble ordeño no mejora la producción de
lecherespectoaunordeñodiarioenlascabrasderazaMajorerayTinerfeña,locualesdeinterés
para los sistemas de producción caprina, en donde se busca reducir los costes relacionados con la
producción de leche. No obstante, el aumento significativo en la producción lechera que mostraron
lascabrasderazaPalmeraalordeñardosvecesaldía,sugierequepodríaserunaprácticarentable
en ciertos momentos de la lactación. Sin embargo, el contenido de proteína en leche no incrementó
en concordancia con la producción. Por esta razón, se necesitan otros estudios para evaluar los
efectos de la frecuencia sobre el rendimiento quesero, lo cual es un aspecto de suma importancia en
la economía ganadera de Canarias. Además, el conocimiento de las estructuras de fraccionamiento
de leche puede servir de base para futuros programas de selección, al objeto de mejorar la facilidad
de ordeño en las razas locales.
Manuscrito 3Los cambios a corto plazo de la frecuencia normal de ordeño en cabras tradicionalmente or-
deñadas una vez al día durante la lactancia temprana puede afectar la producción de leche en cabras
derazaMajorera,comolodemuestraelincrementosignificativocuandosecambiadeunoadosor-
deños diarios. Sin embargo, las variaciones en el contenido de grasa y perfil proteico requieren estu-
dios acerca de cómo éstas afectan la producción y calidad de los quesos, ya que la finalidad principal
delasexplotacionescaprinascanariaseslafabricacióndeeseproducto.Porotrolado,lafaltade
incremento en la producción durante el triple ordeño, con la disminución en los porcentajes de grasa
en la leche, hace necesario futuros estudios para evaluar las causas que provocan este descenso.
Efecto de la frecuencia de ordeño sobre la producción, fraccionamiento lechero y parámetros de calidad de la leche en las cabras canarias
148
Manuscrito 4La liberación de oxitocina por estimulación previa al ordeño y la administración de oxitocina
sintética no tuvo efecto galactopoyético ni cambios aparentes en la composición química de la leche
en cabras no ordeñadas inmediatamente que tradicionalmente se ordeñaban una vez al día. Además,
la ausencia de diferencias en el fraccionamiento lechero y composición de la leche entre la admi-
nistración de cuatro dosis de oxitocina indica que la contracción de las células mioepiteliales que
rodean los alvéolos es similar en respuesta a bajas y altas dosis de esta hormona.
Manuscrito 5LaampliacapacidadcisternaldelascabrasderazaMajorerayPalmerapermitióunaumento
delaproduccióndelechedespuésde24hdeacumulación.Además,lacomposiciónquímicadela
lechenosevioafectadacuandolosintervalosdeordeñoseincrementaronhasta28o32h.Enloque
se refiere a los indicadores de permeabilidad de las uniones celulares del epitelio mamario, las con-
centraciones de Na y K en leche y sangre no reflejaron un mayor grado de permeabilidad, al menos
encabrastradicionalmenteordeñadasunavezaldía.Porotraparte,elaumentoenlaconcentración
delactosaenelplasmasanguíneo,despuésde14hdeacumulacióndeleche,nopermitióprecisar
silaroturadelasunionescelularesseprodujoantesodespuésde24h,osedebíaalflujonormalde
lactosa desde el lado apical al basolateral por el estado de dichas uniones en cabras acostumbradas
a largo intervalos de ordeño. Adicionalmente, los resultados no mostraron una relación entre los ren-
dimientos de leche y daños en la permeabilidad de las uniones celulares, lo cual es interesante para
el desarrollo de programas de selección, en las zonas que requieran intervalos de ordeño más largos.

