INSTITUTO POTOSINO DE INVESTIGACIÓN
CIENTÍFICA Y TECNOLÓGICA, A.C.
POSGRADO EN CIENCIAS APLICADAS
Producción de hidrógeno en reactores de biomasa
fija, implicaciones de microorganismos
hidrogenotróficos
Para obtener el grado de
Doctor en Ciencias Aplicadas
En la opción de
Ciencias Ambientales
San Luis Potosí, S.L.P., Febrero de 2013
ii
Table of contents
Table of contents ii List of tables v List of figures vi
Abstract ix
Chapter 1
Biological hydrogen production, process conditions 1 Summary 1
1.1 Introduction 2 1.2 Substrates used for biohydrogen production 2
1.2.1 Dairy industry effluents 3 1.3 Fermentative hydrogen production 4 1.4 Process conditions for the continuous hydrogen production 5 1.4.1 Inoculum 5
1.4.2 pH 5 1.4.3 Hydraulic retention time and substrate concentration 6 1.4.4 Temperature 7
1.5 Fixed biomass reactors 7 1.6 Hydrogen consuming microorganisms 8
1.7 Scope and structure of the thesis 9 1.8 References 10
Chapter 2 Different start-up strategies to enhance biohydrogen production from cheese whey in
UASB reactors 12 Summary 12
2.1 Introduction 13 2.2 Materials and methods 15
2.2.1 Seed sludge 15 2.2.2 Medium composition 16 2.2.3 Reactor operation 16 2.2.4 Batch activity assays 18
2.2.5 Electron balance 18 2.2.6 Analytical methods 19
2.2.7 Bacterial community analyses by 16S rRNA genes using DGGE 19 2.2.7.1 DNA extraction 19 2.2.7.2 PCR amplification 20 2.2.7.3 DGGE analysis 21 2.3 Results and discussion 22
2.3.1 Reactors performance 22 2.3.2 Metabolic byproducts 25 2.3.3 Electron balance 26 2.3.4 Specific activities 28 2.3.5 Bacterial community analyses by PCR–DGGE 30

iii
2.4 Conclusions 32 2.5 References 33
Chapter 3 Decreasing methane production in hydrogenogenic UASB reactors 36 Summary 36
3.1 Introduction 37 3.2. Materials and Methods 39
3.2.1 Substrate and seed sludge 39 3.2.2 Experimental set-up 40 3.2.3 Batch activity assays 41 3.2.4 Analytical methods 42
3.3 Results and Discussion 43 3.3.1 Evaluation of the pH reduction effect 43 3.3.2 Evaluation of the organic shock load: effect of increasing influent substrate
concentration 45
3.3.3 Evaluation of the organic shock load: effect of decreasing HRT 47 3.3.4 Heat treatment 48 3.4 Conclusions 50
3.5 References 51
Chapter 4 Community dynamics during methane decreasing strategies in UASB hydrogenogenic
reactors 53 Summary 53
4.1 Introduction 54 4.2 Materials and methods 55 4.2.1 Substrate 55
4.2.2 Reactors and inoculum 56 4.2.3 Experimental set-up 56
4.2.4 Analytical methods 57 4.2.5 Microbial community analyses 57
4.2.6 Statistical analysis 60 4.3 Results and Discussion 60 4.3.1 pH reduction 60 4.3.2 OLR increments 62
4.3.4 Heat treatment 67 4.4 Conclusions 67 4.5 References 68
Chapter 5 Implications of the hydrogen consuming microorganisms in two upflow anaerobic
packed-bed reactors treating cheese whey 71 Summary 71
5.1 Introduction 72 5.2 Materials and Methods 74 5.2.1 Substrate and mineral medium 74
iv
5.2.2 Reactor design 74 5.2.3 Inoculum 74 5.2.4 Reactors operation 75
5.2.5 Hydrogen consuming activity batch assays 76 5.2.6 Analytical methods 76 5.2.7 DGGE 77 5.3. Results and Discussion 78 5.3.1 Reactor performance 78
5.3.2 Hydrogen consumption batch assays 80 5.3.3 DGGE fingerprints 83 5.4 Conclusions 85 5.5 References 86
Chapter 6 Perspectives, conclusions and final remarks 88
6.1 General discussion 89
6.2 Conclusions and final remarks 92 6.3 References 93

v
List of tables Table 2.1. Different start-up strategies and inoculum used in the reactors. 17
Table 2.2. Specific hydrogenogenic activity (SHA) and final metabolites concentration
obtained in the batch assays conducted with the inoculum and biomass
withdrawn from the UASB reactors at days 33 and 82. The specific
hydrogenotrophic methanogenic activity (SHMA) is also shown.
30
Table 2.3. Affiliation of the DGGE fragments showing the highest percentage of identity in
the output result from the analysis in the non-redundant nucleotide database from
NCBI using the BLAST program.
32
Table 3.1. Results of the specific hydrogenogenic (SHA) and hydrogenotrophic
methanogenic activities (SHMA) batch tests with the biomass withdrawn from
the reactors at different days.
45
Table 4.1. Affiliation of the Archaeal OTUs identified showing the highest percentage of
identity in the output result from the analysis in the non-redundant nucleotide
database from NCBI using the BLAST program.
66
Table 5.1. Specific hydrogen consuming activity for the biomass withdrawn from the
reactors.
82

vi
List of figures Figure 2.1. Photographs of the disaggregated (a) and granular (b) inoculum. 15
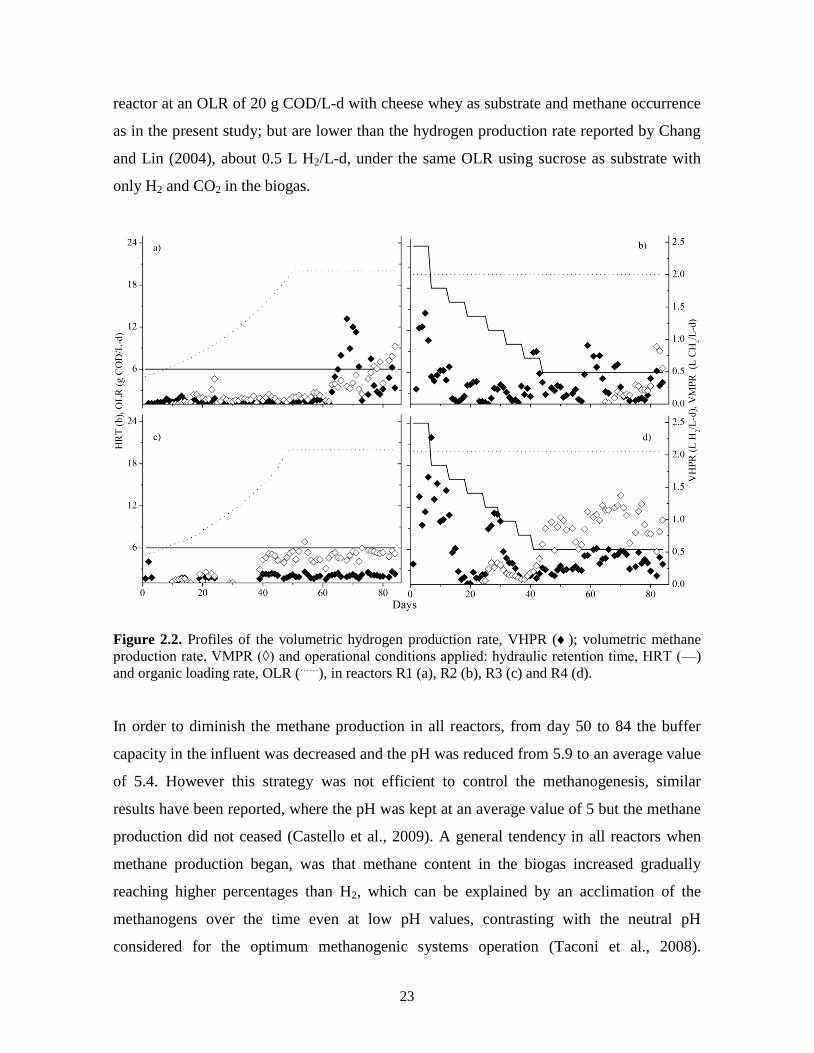
Figure 2.2. Profiles of the volumetric hydrogen production rate, VHPR ( ); volumetric
methane production rate, VMPR (◊) and operational conditions applied:
hydraulic retention time, HRT (—) and organic loading rate, OLR (……
), in
reactors R1 (a), R2 (b), R3 (c) and R4 (d).
23
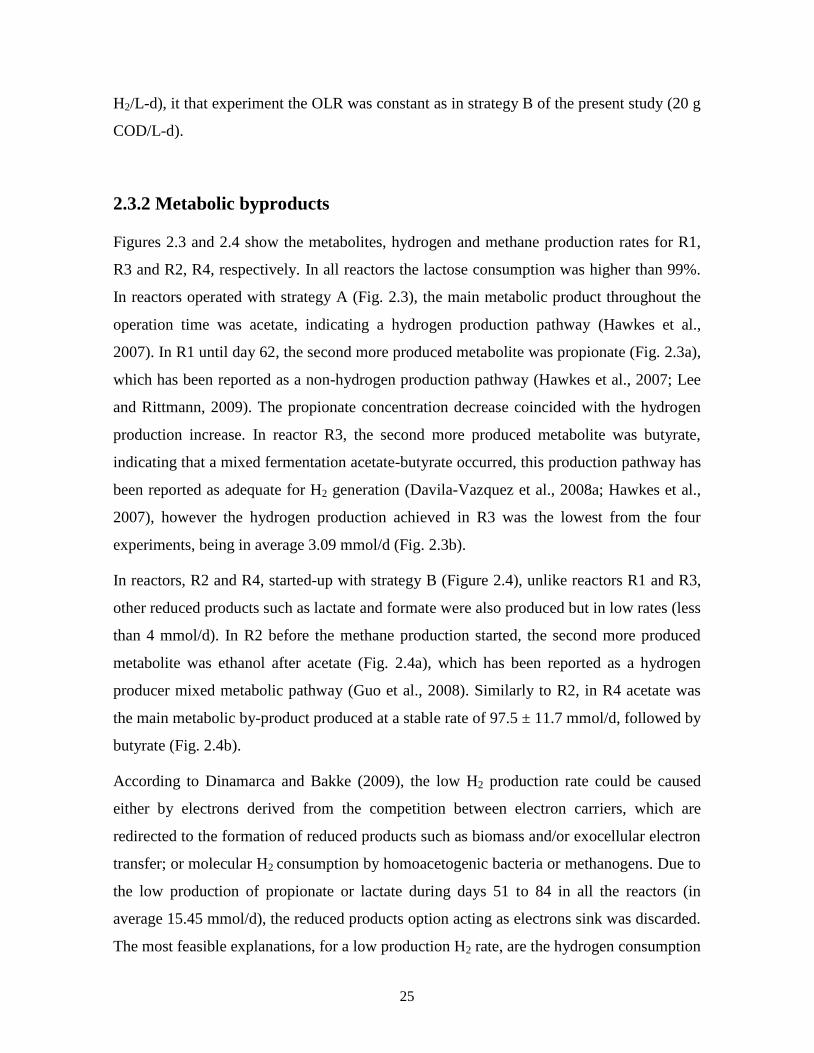
Figure 2.3. Profiles of the metabolites and gas production rates obtained from UASB
reactors operated with strategy A: R1(a) and R3 (b); Acetate (, Ethanol (▼),
Propionate (□), Butyrate (∆), H2 (and CH4 (◊).
26
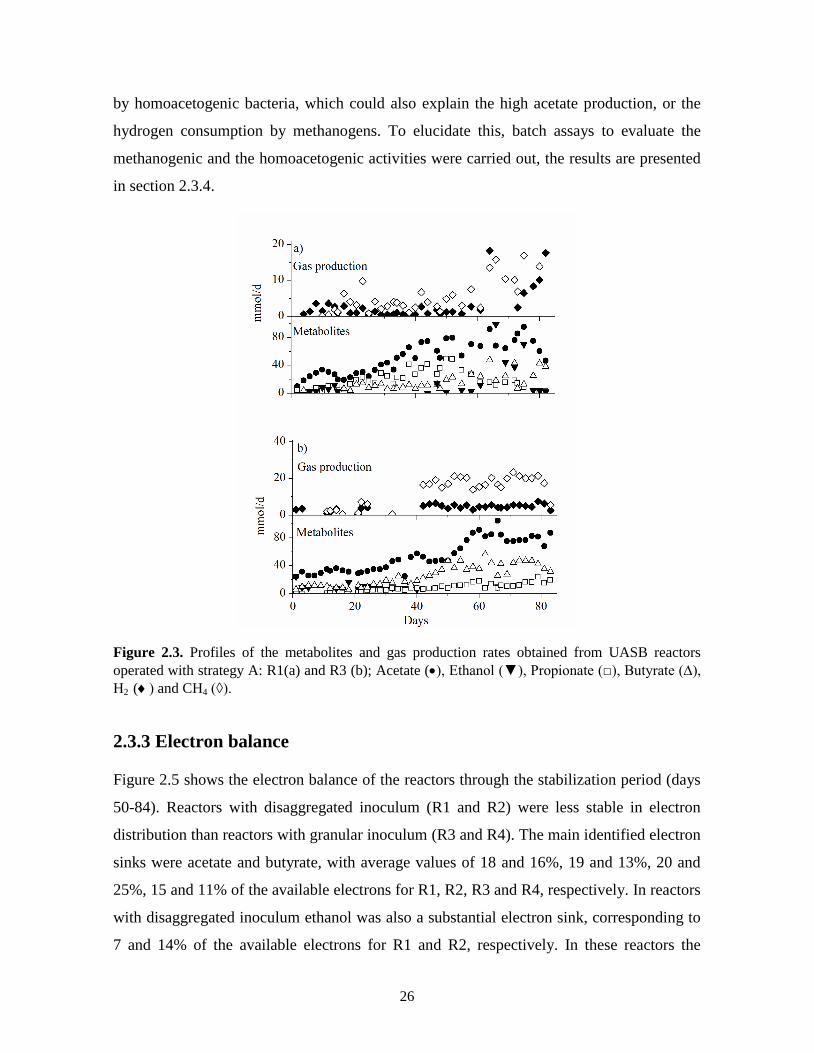
Figure 2.4. Profiles of the metabolites and gas production rates obtained from UASB
reactors operated with strategy B: R2(a) and R4 (b); Acetate (, Ethanol (▼),
Propionate (□), Butyrate (∆), Lactate (), Formate (◄),H2 (and CH4 (◊).
27
Figure 2.5. Electron balances in UASB reactors during the stabilization period in reactors
R1 (a), R2 (b), R3 (c) and R4 (d); N.D. not determined.
28
Figure 2.6. Bacterial DGGE community fingerprints and corresponding similarity
dendrograms and indexes from reactor inoculated with disaggregated sludge (a)
and granular sludge (b). I corresponds to inoculum samples; I-1, I-2 and I-3
corresponds to heat treated inoculum 1, 2 or 3 times; R1-R4 corresponds to the
reactors and the operation day of each sample 33 or 82. A, B and C are the
sequenced bands.
31
Figure 3.1. Operational conditions before the present experiments were carried out and the
parameters evaluated in each experiment (from day 0 onwards). a) Experiment
A, b) Experiment B and C, c) Experiment D and E. — Hydraulic retention time,
HRT; ○ Substrate concentration, S; ∙∙∙ pH; --- Organic loading rate, OLR.
40
Figure 3.2. Volumetric production rates (a) and metabolites produced (b) at each condition
of Experiment A (effect of pH reduction).
44
Figure 3.3. Volumetric production rates of Experiment B and C (a) and metabolites
concentration at each condition (b). Organic loading rate, OLR; Hydraulic
retention time, HRT.
46
Figure 3.4. Volumetric production rates of Experiment D and E (a) and metabolites
concentration at each condition (b). Organic loading rate, OLR; Hydraulic
retention time, HRT; Heat treatment, H.T.
48
Figure 3.5. Acetate produced and hydrogen consumed by homoacetogens expressed as
molar rates during Experiment E.
50
Figure 4.1 Volumetric production rates of Experiment A (a), Experiments B and C (b), and
Experiments D and E (c). H.T. (Heat treatment).
61

vii
Figure 4.2 Phylogenetic relationships of partial 16S rRNA gene sequences recovered from
three clone libraries. The tree was inferred using the neighborjoining algorithm,
with the Tamura Nei model. Escherichia coli was used as the outgroup taxon.
The scale bar represents 5% sequence divergence; values at the nodes are the
percentages of 1,000 bootstrap replicates supporting the branching order;
bootstrap values below 50% are not shown. A similarity threshold of over 97%
was used for the same OTU assignment.
63
Figure 4.3. Bacterial DGGE community fingerprints and corresponding similarity
dendrograms and indexes. a) Experiment B and C, b) Experiment D and E. The
numbers correspond to the different Bacterial OTUs associated with the DGGE
fingerprint.
64
Figure 5.1. Anaerobic-packed bed reactor design. 75
Figure 5.2. Reactor A performance. Profile of volumetric gas production, percentage of
lactose consumed and OLR (a), Metabolites concentration in COD equivalents
(b and c).
79
Figure 5.3. Reactor B performance. Volumetric gas production and OLR (a), Metabolites
concentration (b and c).
81
Figure 5.4. Bacterial DGGE community fingerprints and corresponding similarity
dendrograms and indexes from reactors A, B and the autofermented CWP in
sterile medium.
84
Figure 5.5. Shannon-Wiener diversity indices from the bacterial and archeal communities in
the Fermented CWP (W N, with nutrients; W/O N, without nutrients); Reactor
A and Reactor B.
85
Figure 5.6. Archeal DGGE community fingerprints and corresponding similarity
dendrograms and indexes from reactors A (a).
85

viii
Resumen
Producción de hidrógeno en reactores de biomasa fija, implicaciones de
microorganismos hidrogenotróficos
Palabras clave: hidrógeno, metano, UASB, lecho empacado, homoacetogenesis
El hidrógeno es considerado el combustible del futuro por su mayor contenido energético
comparándolo con cualquier otro combustible. Su producción por vía biológica permite valorizar
residuos o aguas residuales, como el suero de leche, pudiendo producirlo de manera renovable
además de ser carbono neutral. En la producción fermentativa de hidrógeno, las bacterias anaerobias
utilizan los compuestos orgánicos para producir energía metabólica y componentes estructurales,
produciendo H2 y una mezcla de ácidos grasos de cadena corta, así como algunos alcoholes. El uso
de suero de leche como sustrato para la producción de hidrógeno ha sido estudiado en reactores de
biomasa suspendida, obteniendo velocidades de producción muy promisorias. Con el objetivo de
aumentar dicha producción, favorecida por una mayor concentración de biomasa, en el presente
trabajo se exploró el uso de reactores de biomasa fija (UASB y lecho empacado). Una limitante de
los sistemas granulares como los reactores UASB es el largo tiempo de arranque necesario para
establecer una comunidad productora de hidrógeno. En este sentido se evaluaron diferentes
estrategias de arranque y estructuras del inóculo. Una disminución gradual del tiempo de residencia
hidráulica desde 24 a 6 horas, con una velocidad de carga orgánica (VCO) constante de 20 g
DQO/L-d fue la estrategia que produjo una biomasa hidrogenogénica mas activa. La producción
inesperada de metano a la par del hidrógeno llevó a la evaluación de diferentes estrategias para
controlar la metanogénesis. Un aumento en la VCO de 20 a 30 g DQO/L-d incrementó hasta 172%
la producción de hidrógeno, disminuyendo la producción de metano en 75%. La única estrategia
que inhibió completamente la metanogénesis fue aplicar un segundo tratamiento térmico a la
biomasa. Sin embargo, esta última estrategia también seleccionó a consumidores de hidrógeno,
como los homoacetogénicos. El análisis de las comunidades en los reactores UASB con técnicas
moleculares como PCR-DGGE y clonación mostraron una proliferación de organismos
relacionados con los productores de hidrógeno Clostridium tyrobutyricum, Citrobacter freundii y
Enterobacter aerogenes, así como los homoacetogénicos Blautia hydrogenotrophica, Oscillibacter
valericigenes y Clostridium ljungdahlii. Mientras que los responsables de la producción de metano
fueron hidrogenótrofos de los géneros Methanobrevibacter y Methanobacterium. Posteriormente se
evaluó la producción de hidrógeno en reactores de lecho empacado, inoculados con la fermentación
natural del suero de leche. Las velocidades de producción alcanzadas en los reactores de lecho
empacado fueron similares a las alcanzadas en los UASB durante su arranque, demostrando la
factibilidad de usar la fermentación natural del suero de leche como inóculo. La relevancia de los
homoacetogenos se evaluó en ensayos en lote, probando que durante el tiempo de operación del
reactor la actividad homoacetogénica fue desplazada por la producción de metano. En el presente
trabajo se elucidó la relevancia del consumo de hidrógeno por metanogénesis y homoacetogénesis
en reactores de biomasa fija, y se observó que la magnitud de dicho consumo fue similar para
ambas actividades. Además se establecieron los parámetros operacionales adecuados para controlar
la metanogénesis. Futuras investigaciones son necesarias para determinar los factores que controlan
la homoacetogenesis. Este trabajo contribuye dando una aproximación a la utilización del suero de
leche como fuente de energía renovable resolviendo un potencial problema ambiental.

ix
Abstract
Hydrogen production in biomass fixed reactors, implications of
hydrogenotrophic microorganisms
Keywords: hydrogen, methane, UASB, packed-bed, homoacetogenesis
Hydrogen is considered the fuel of the future due to the highest energy content compared
with any fuel. The biological hydrogen production allows valorizing waste or wastewaters,
like the cheese whey, being a renewable and carbon neutral fuel. In the fermentative
hydrogen production, anaerobic bacteria use organic substrates to generate metabolic
energy and structural components, producing H2 and a mix of short chain fatty acids and
alcohols. The cheese whey has been used largely to produce hydrogen in suspended
biomass reactors, achieving promising rates. The present work explored the use of biomass
fixed reactors (UASB and packed-bed) with the of aim increasing the production rate,
favored by the higher biomass concentration. A limitation in granular systems, like the
UASB is the long time required to develope a hydrogen producing community. In this
sense, different start-up strategies and inoculum structures were evaluated. A gradual
decrease of the hydraulic retention time from 24 to 6 hours, with a constant organic loading
rate (OLR) of 20 g COD/L-d, produced the more active biomass. The unexpected methane
production addressed the evaluation of operational strategies to control the methanogens.
An increment of the OLR from 20 to 30 g COD/L-d increased the hydrogen production rate
172%, whereas the methane production was reduced 75%. The only strategy that
completely inhibited the methane production was a second heat treatment to the biomass.
However, the latter strategy also selected homoacetogens, which are hydrogen consuming
organisms. The community analysis of the biomass withdrawn from UASB reactors with
molecular techniques, such as PCR-DGGE and cloning, showed a proliferation of
organisms related to hydrogen producers such as Clostridium tyrobutyricum, Citrobacter
freundii and Enterobacter aerogenes, as well as the homoacetogens Blautia
hydrogenotrophica, Oscillibacter valericigenes and Clostridium ljungdahlii. The archaeal
community analysis showed that methane was produced by hydrogenotrophs from genera
Methanobrevibacter and Methanobacterium. Afterwards, the hydrogen production in
packed-bed reactors inoculated with natural fermented cheese whey, was evaluated. The
hydrogen production rates achieved in these reactors were similar to those obtained in the
UASB reactors, during the start-up, showing the suitability of using natural fermented
cheese whey as inoculum. The relevance of homoacetogens was evaluated in batch assays,
proving that during the reactor operation time the homoacetogenic activity was replaced by
the methane production. The present work elucidated the relevance of the hydrogen
consumption in biomass fixed reactors by methanogens or homoacetogens, observing that
the magnitude of these activities are similar. Moreover, the adequate operational parameters
to control methanogenesis were established. Further research is needed to determine
elucidate the factors that control the homoacetogenesis. This work contributes to give an
approach to the use the cheese whey as a renewable energy source, solving a potential
environmental problem.

1
Chapter 1
Biological hydrogen production, process conditions
Summary
The fermentative hydrogen production is considered an alternative for conventional fuels as
it is carbon neutral, has the highest energy content (122 kJ/g) and can be produced through
an organic waste valorization. Among possible substrates cheese whey, a readily
biodegradable by-product, is a potential substrate for hydrogen production. Several factors
contribute to a stable hydrogen production in bioreactors, such as inoculum, pH, hydraulic
retention time, substrate concentration, temperature, etc. Fixed biomass reactors offer some
advantages over suspended biomass reactors, supporting higher organic loading rates and
producing higher volumetric rates of hydrogen. Nevertheless, fixed biomass reactors may
favor the presence of hydrogen consuming organisms that decrease the hydrogen yields
achieved. In the present chapter, the main operational conditions controlling the
fermentative hydrogen production are reviewed.

2
1.1 Introduction
Actual environmental challenges derived from the use of fossil fuels, such as greenhouse
gases emission, acid rain and the future depletion of those fuels, drive a search of clean and
renewable energy sources (Saxena et al., 2009). In this regard, the energy from biomass is
considered a clean option, since it is carbon neutral and there is a wide accessibility of
agricultural, wood and municipal wastes and wastewaters (Davila-Vazquez et al., 2008).
Therefore, technologies for methane and hydrogen production from biological processes, as
well as ethanol production by fermentation are important alternatives for the energy
production from biomass (Davila-Vazquez et al., 2008).
Among the possible fuels from biomass, hydrogen (H2) is considered the most promising
due to its technical, economic and environmental benefits. H2 has the highest energy
content compared with the other existing fuels (122 kJ/g), can be used directly in a
combustion internal engine or in a fuel cell to produce electricity. Moreover, unlike the
conventional produced H2 from fossil fuels, the biological produced H2 is a clean and
renewable fuel (Das and Veziroglu, 2008).
Biological hydrogen is produced through an anaerobic digestion process, also known as
dark fermentation. By-products of this process are organic acids, which can be valuable
metabolites for other energy producer process, such as methanogenesis. The use of organic
wastes or wastewater to produce hydrogen have a double purpose, the generation of clean
energy and waste valorization, saving the environmental costs related with the treatment or
waste disposition (Das and Veziroglu, 2008; Redwood et al., 2009).
1.2 Substrates used for biohydrogen production
Different factors are considered to select a suitable substrate for the fermentative hydrogen
production, such as the substrate cost, availability, carbohydrates content and
biodegradability. Different studies have used model substrates like glucose, sucrose and
starch due to their easy biodegradability and their presence in wastewaters (Das and
Veziroglu, 2008; Davila-Vazquez et al., 2008).

3
Other substrates used have been effluents from the food and beverage industry, and
agricultural wastes, showing the viability to use more complex organic compounds to
produce hydrogen (Buitrón and Carvajal, 2010; Castello et al., 2009; Wang et al., 2006).
The use of these wastes may require a pretreatment for the hydrolysis of complex
substrates, to remove undesirable components and for nutritional balance (Kapdan and
Kargi, 2006).
1.2.1 Dairy industry effluents
Among the dairy industry effluents, the most common by-product generated during the
cheese manufacturing is the cheese whey. The estimated world production of whey is
around 160 million tonnes per year (Guimaraes et al., 2010). Cheese whey has a high
organic content (60-80 g COD/L) largely due to lactose; moreover it contains proteins,
nutrients (N and P), some vitamins and inorganic salts. A valorization process of this
effluent is usually a common alternative, but the cost associated is not sustainable for small
and medium factories, for those factories the methane and hydrogen production may be a
suitable alternative. Otherwise, the environmental release of this effluent can cause an
excess of oxygen consumption, eutrophication and toxicity, among other detrimental effects
(Prazeres et al., 2012).
Biological processes have been used for the treatment of cheese whey, generating valuable
products, such as methane, ethanol, lactic acid, and hydrogen (Prazeres et al., 2012). The
conventional anaerobic digestion of cheese whey has some drawbacks, such as the high
content of carbohydrate that causes a rapid acidification inhibiting the methanogenic phase
(Vidal et al., 2000), therefore alkalinity supplementation has been proposed (Prazeres et al.,
2012). Another potential problem can be biomass flotation due to the fat content (Mockaitis
et al., 2006).
The fermentative hydrogen production using cheese whey has gained attention as an
alternative to overcome the drawbacks of anaerobic digestion. In this sense, successful
hydrogen producing systems have been developed (Azbar et al., 2009; Davila-Vazquez et
al., 2009).
4
1.3 Fermentative hydrogen production
During the fermentative hydrogen production, bacteria oxidize the organic wastes to obtain
structural components and metabolic energy for their growth. This oxidation produces
electrons that need to be ―disposed‖ in order to keep the electric neutrality in the cell.
Bacteria use protons (H+) as final electron acceptor, being these reduced to molecular
hydrogen (H2). At first, electrons are transferred to internal electron carriers (NADH2 and
ferredoxin), which have to be oxidized to allow continuous fermentation. Besides electrons
disposal through proton reduction to hydrogen, certain amount of electrons are used in new
biomass production and in other reduced compounds such as butyrate, ethanol, lactate,
propionate, and others (Das and Veziroglu, 2008; Lee and Rittmann, 2009).
Therefore, the main objective of the fermentative hydrogen production is to direct the
largest number of electrons to protons. If only acetate and hydrogen are produced from the
oxidation of one mol of hexose, 4 mol of H2 and 2 mol of acetate would be obtained. In
practice, the yield of a mesophilic acid fermentation is around 2 mol H2/mol hexose
(Hawkes et al., 2007; Lee and Rittmann, 2009). The latter yield is explained by the
bacterial need to keep the energy and to balance the flux of electrons during the
fermentation. The fermentative bacteria synthesize ATP trough glycolysis (2 mol ATP/mol
of glucose) and from acetate and butyrate production (1 mol ATP/mol of acid). Regarding
to energy conservation, the bacteria have to favor the acetate formation. However, its
production from Acetyl-CoA does not involve oxidation-reduction. Therefore, reduced
compounds or H2 have to be generated to dispose the electron produced during glycolysis
and pyruvate decarboxylation (Hawkes et al., 2007; Lee and Rittmann, 2009). Hence, the
final products of the fermentation are a mix of acetate/butyrate or acetate/ethanol,
depending on the operational conditions and the microorganisms present (Guo et al., 2008;
Yu and Mu, 2006).
5
1.4 Process conditions for the continuous hydrogen production
The capacity to produce hydrogen through oxidation of organic compounds has been
applied in reactors to produce this fuel in a continuous way. The main goals are to increase
both the yield of hydrogen obtained and the volumetric hydrogen production rate (VHPR)
in order to evaluate their potential application in fuel cells (Das and Veziroglu, 2008;
Davila-Vazquez et al., 2008). The efficiency of the applied reactors depends on different
operational factors such as the source of the inoculum and pretreatment, pH, hydraulic
retention time (HRT), organic loading rate (OLR), temperature, among others (Buitrón and
Carvajal, 2010; Chen et al., 2009; Das and Veziroglu, 2008; Davila-Vazquez et al., 2009).
1.4.1 Inoculum
Hydrogen producing bacteria can be facultative or strict anaerobes, in the last years several
studies have shown the major abundance of species from genus Clostridium in the inocula.
Other reported genera are Micrococci, Enterobacteria, Thermoanaerobacterium,
Thermobacteroides, Ruminococcus, Anaerotruncus, Megasphaera, Pectinatus (Castello et
al., 2009; Davila-Vazquez et al., 2008; Ueno et al., 2001).
Even though some works have used pure cultures as inoculum (Collet et al., 2004; Fritsch
et al., 2008; O-Thong et al., 2008), the use of mixed cultures is closer to a real application,
less expensive and easier to operate and maintain (Lee et al., 2009). Several sources of
mixed cultures inocula have been evaluated (soil, sediments, compost, anaerobic and
aerobic sludge, etc.). Using anaerobic sludge as inoculum requires a pretreatment in order
to eliminate methanogens. Common pretreatments are based on the sporulation capacity of
some hydrogen producing bacteria, undergoing the sludge to harsh conditions like heat,
acid or basic medium, and aeration, among others (Hu and Chen, 2007).
1.4.2 pH
A slightly acidic pH contributes to inhibit the methanogens growth, can increase the VHPR
and enhance the stability of the hydrogen producing reactors. Different reviews report the
6
optimum pH between 4.5 and 6.5 (Das and Veziroglu, 2008; Davila-Vazquez et al., 2008;
Hawkes et al., 2007). Besides the control of methanogenesis, the pH is determinant in the
reactor performance affecting the metabolic pathway. For instance, Guo et al.(2008) found
an acetate/ethanol fermentation at pH 4.2 – 4.4, whereas the VHPR decreased at pH 5,
changing the metabolic pathway to acetate, butyrate and propionate.
1.4.3 Hydraulic retention time and substrate concentration
Both the hydraulic retention time (HRT) and substrate concentration determine the organic
loading rate (OLR); the optimum HRT range is between 0.5 and 12 hours, whereas the
substrate concentration is around 20 g/L (Davila-Vazquez et al., 2008). By increasing the
OLR, raising the substrate concentration or diminishing the HRT, it is expected an
increment in the hydrogen production rate, due to the increase in the organic availability,
until certain limit is reached as is described below.
The increase in the substrate concentration is limited by undissociated by-products
inhibition (acetic, butyric and propionic acid); Van Ginkel and Logan (2005) reported 19
mM of undissociated acids as the threshold concentration for a significant H2 yield
reduction and a switch to solventogenesis, which is the solvents production, such as
acetone, butanol and ethanol. In the same sense, Castro-Villalobos et al. (2012) reported a
complete biomass growth inhibition at 30 mM of undissociated acids.
The HRT reduction to increase the OLR is limited by the maximum specific growth rate
(μmax), in order to avoid the biomass wash-out. This growth rate is specific for each culture,
an anaerobic sludge inoculum had a μmax of 0.172 h-1
, corresponding to a minimal HRT of
5.9 h (Chen et al., 2001). Due to the uncoupled solids retention time to the HRT in biomass
fixed systems, lower HRT can be applied. For instance, Gavala et al. (2006) compared an
UASB (up-flow anaerobic sludge blanket) reactor and a CSTR (completely stirred tank
reactor) for hydrogen production, finding that the optimal HRTs were 2 and 6 h,
respectively.
7
1.4.4 Temperature
Temperature is an operational parameter affecting the bacterial growth rate and the
metabolic activity. Fermentative hydrogen production can be developed at mesophilic,
thermophilic and hyperthermophilic conditions (Davila-Vazquez et al., 2008). Comparing
mesophilic and thermophilic conditions (35 and 55°C) in two CSTRs, Gavala et al. (2006)
found that the thermophilic reactor had higher hydrogen yield and specific hydrogen
production. These results are explained by the lower biomass generation due to higher
maintenance energy demands at 55 °C. Higher H2 productions at thermophilic conditions
are attributed to thermodynamic considerations; another advantage is pathogens and
methanogens removal, however high temperatures contribute to proteins denaturalization
and increases the energy cost (Davila-Vazquez et al., 2008).
1.5 Fixed biomass reactors
The reactor configuration influences H2 production, largely related to the biomass
concentration. The biomass suspended CSTR is the most reported process in H2
production. Some advantages of this configuration are the good mass transfer and diffusion
due to the flocs size and porosity. One of the highest hydrogen production rates in a CSTR,
1.39 L/L-h, was achieved by Davila-Vazquez et al. (2009), applying an OLR of 138.6 g
lactose/L-d with a volatile solids concentration of 5 g/L. Nevertheless, the CSTR has the
disadvantage of the potential biomass wash-out at low HRT, as was discussed in section
1.4.3 (Hawkes et al., 2007).
The fixed biomass reactors are used in a lesser extent for hydrogen production; these
reactors can retain high biomass concentrations due to granule sedimentation (7-9 g
volatile solids/L) or to the biomass attached in a support (20 g volatile solids/L) (Castello
et al., 2009; Guo et al., 2008; Zhang et al., 2007). Therefore, higher OLR can be applied, at
lower HRT than in CSTR without the problem of biomass wash-out (Hawkes et al., 2007).
For instance, Zhang et al. (2007) applied an OLR of 500 g/L-d, at a HRT of 0.5 h in an
anaerobic fluidized bed reactor, obtaining a hydrogen production rate of 2.36 L/L-h. Lee et
8
al. (2003) applied an OLR of 961 g/L-d at the same HRT obtaining a hydrogen production
rate of 7.4 L/L-h, in a packed-bed reactor.
Other advantages of fixed biomass reactors are the resistance to inhibitory compounds,
more stability compared to suspended growth systems and the possibility to obtain an
effluent with a low solids concentration (Gavala et al., 2006). A significant example of
reactor stability is the work of Yu and Mu (2006), whom operated an UASB reactor during
3 years proving different substrate concentrations and HRT with stable hydrogen
productions, reaching the higher yield (1.44 mol H2/mol glucose) at 7.1 g COD/L-d.
However, in fixed biomass reactors the solid retention time cannot be controlled; therefore,
slow-growing hydrogen consuming microorganisms such as methanogens cannot be easily
washed-out.
1.6 Hydrogen consuming microorganisms
Besides the metabolic pathways that generate reduced compounds instead of hydrogen,
another cause of low hydrogen yields is the presence of microorganisms capable to
consume H2. Typical hydrogen consumers in fermentative systems are methanogens and
homoacetogens (Calli et al., 2008; Castello et al., 2009). The methanogenic relevance in
hydrogenic systems is clear due to the stoichiometric relation of 4 mol of H2 consumed per
mol of CH4 produced in hydrogenotrophic methanogenesis. However, there are
contradictory results that question the relevance of hydrogen consumption by
homoacetogenesis. In this sense, whereas Kramer and Bagley (2008) established that
homoacetogenic activity was of minor concern, Calli et al. (2008) attributed the instability
of fermentative hydrogen producing systems to homoacetogenic activity.
A condition that favors the establishment of hydrogen consuming microorganisms is a
solids retention time longer than the duplication time of hydrogen consumers (Dinamarca
and Bakke, 2009); as occurs in biomass fixed reactors. In this regard, Koskinen et al.
(2007) suggested that the instability in a fluidized-bed reactor was due to the enrichment
and efficient adhesion of H2 consumers in the carrier. Moreover, methanogenic occurrence
is a concern in reactors inoculated with anaerobic sludge, even though it was pretreated or
9
not (Castello et al., 2009; Wang et al., 2007). Therefore, the presence of hydrogen
consuming microorganisms in fixed biomass reactors is a major concern for the appropriate
operation of hydrogenogenic reactors.
1.7 Scope and structure of the thesis
Fermentative hydrogen production using cheese whey has gained attention in the last years.
Most of the studies have been developed in CSTR (Azbar et al., 2009; Davila-Vazquez et
al., 2009; Venetsaneas et al., 2009; Yang et al., 2007), and in lesser extent in biomass fixed
reactors such as UASB (Castello et al., 2009); where only Davila-Vazquez et al. (2009)
achieved significant hydrogen production at 138 g lactose/L-d. Therefore, the aim of this
thesis was to evaluate the fermentative hydrogen production in fixed biomass reactors,
using cheese whey as substrate. Due to the high solids retention time in these reactors, it
was evaluated the relevance of hydrogen consumption by methanogens and
homoacetogens, assessing strategies to eliminate the methanogenic activity.
In Chapter 2, the start-up strategies to enhance the hydrogen production in two UASB
reactors were evaluated. Different operational parameters and inoculum structures (granules
and disaggregated granules) were assayed and the bacterial community was evaluated using
PCR-DGGE.
Once methane presence was detected in UASB reactors, different operational strategies
were tested to decrease the methane production as shown in Chapter 3. In Chapter 4 the
changes in the microbial communities developed during the application of decreasing
methane production strategies were determined using molecular biology techniques.
In Chapter 5 hydrogen production in two anaerobic packed bed reactors was evaluated
using as inoculum a natural fermented cheese whey powder solution; the implication of
hydrogen consuming microorganisms was also evaluated using batch assays and the
microbial communities were studied by PCR-DGGE. The global results obtained in this
thesis are discussed in Chapter 6, accompanied by final recommendations.
10
1.8 References
Azbar N, Çetinkaya Dokgöz FT, Keskin T, Korkmaz KS, Syed HM. 2009. Continuous fermentative
hydrogen production from cheese whey wastewater under thermophilic anaerobic conditions.
Int J Hydrogen Energy 34:7441–7447.
Buitrón G, Carvajal C. 2010. Biohydrogen production from Tequila vinasses in an anaerobic
sequencing batch reactor: effect of initial substrate concentration, temperature and hydraulic
retention time. Bioresour Technol 101:9071–9077.
Calli B, Zhao J, Nijssen E, Vanbroekhoven K. 2008. Significance of acetogenic H2 consumption in
dark fermentation and effectiveness of pH. Water Sci Technol 57:809.
Castello E, García y Santos C, Iglesias T, Paolino G, Wenzelb J, Borzacconia L, Etchebehereb C.
2009. Feasibility of biohydrogen production from cheese whey using a UASB reactor: Links
between microbial community and reactor performance. Int J Hydrogen Energy 34:5674–
5682.
Castro-Villalobos MC, Garcia-Morales JL, Fernandez FJ. 2012. By-products inhibition effects on
bio-hydrogen production. Int J Hydrogen Energy 37:7077–7083.
Chen CC, Lin CY, Chang JS. 2001. Kinetics of hydrogen production with continuous anaerobic
cultures utilizing sucrose as the limiting substrate. Appl Environ Microbiol 57:56–64.
Chen W-H, Sung S, Chen S-Y. 2009. Biological hydrogen production in an anaerobic sequencing
batch reactor: pH and cyclic duration effects. Int J Hydrogen Energy 34:227–234.
Collet C, Adler N, Schwitzguebel JP, Peringer P. 2004. Hydrogen production by Clostridium
thermolacticum during continuous fermentation of lactose. Int J Hydrogen Energy 29:1479–
85.
Das D, Veziroglu TN. 2008. Advances in biological hydrogen production processes. Int J Hydrogen
Energy 33:6046–6057.
Davila-Vazquez G, Cota-Navarro CB, Rosales-Colunga LM, De León-Rodríguez A, Razo-Flores E.
2009. Continuous biohydrogen production using cheese whey: Improving the hydrogen
production rate. Int J Hydrogen Energy 34:4296–4304.
Davila-Vazquez G, Arriaga S, Alatriste-Mondragón F, De León-Rodríguez A, Rosales-Colunga
LM, Razo-Flores E. 2008. Fermentative biohydrogen production: trends and perspectives.
Rev Environ Sci Biotechnol 7:27–45.
Dinamarca C, Bakke R. 2009. Apparent hydrogen consumption in acid reactors: observations and
implications. Water Sci Technol 59:1441–1447.
Fritsch M, Hartmeier W, Chang JS. 2008. Enhancing hydrogen production of Clostridium
butyricum using a column reactor with square-structured ceramic fittings. Int J Hydrogen
Energy 33:6549–6557.
Gavala HN, Skiadas LV, Ahring BK. 2006. Biological hydrogen production in suspended and
attached growth anaerobic reactor systems. Int J Hydrogen Energy 31:1164–1175.
Guimaraes PMR, Teixeira JA, Domingues L. 2010. Fermentation of lactose to bio-ethanol by yeasts
as part of integrated solutions for the valorisation of cheese whey. Biotechnol Adv 28:375–84.
Guo WQ, Ren NQ, Wang XJ, Xiang WS, Meng ZH, Ding J, Qu YY, Zhang LS. 2008. Biohydrogen
production from ethanol-type fermentation of molasses in an expanded granular sludge bed
(EGSB) reactor. Int J Hydrogen Energy 33:4981–4988.
Hawkes FR, Hussy I, Kyazze G, Dinsdale R, Hawkes DL. 2007. Continuous dark fermentative
hydrogen production by mesophilic microflora: Principles and progress. Int J Hydrogen
Energy 32:172–184.
Hu B, Chen SL. 2007. Pretreatment of methanogenic granules for immobilized hydrogen
fermentation. Int J Hydrogen Energy 32:3266–3273.
Kapdan IK, Kargi F. 2006. Bio-hydrogen production from waste materials. Enzyme Microb Tech
38:569–582.

11
Koskinen PEP, Kaksonen AH, Puhakka LA. 2007. The relationship between instability of H-2
production and compositions of bacterial communities within a dark fermentation fluidized-
bed bioreactor. Biotechnol Bioeng 97:742–758.
Kraemer JT, Bagley DM. 2008. Measurement of H2 consumption and its role in continuous
fermentative hydrogen production. Wat Sci Technol 57:681.
Lee HS, Rittmann BE. 2009. Evaluation of Metabolism Using Stoichiometry in Fermentative
Biohydrogen. Biotechnol Bioeng 102:749–758.
Lee H-S, Krajmalinik-Brown R, Zhang H, Rittmann BE. 2009. An electron-flow model can predict
complex redox reactions in mixed-culture fermentative BioH2: Microbial ecology evidence.
Biotechnol Bioeng 104:687–697.
Lee K-S, Lo Y-S, Lo Y-C, Lin P-J, Chang J-S. 2003. H2 production with anaerobic sludge using
activated-carbon supported packed-bed bioreactors. Biotechnol Lett 25:133–138.
Mockaitis G, Ratusznei SM, Rodrigues JAD, Zaiat M, Foresti E. 2006. Anaerobic whey treatment
by a stirred sequencing batch reactor (ASBR): effects of organic loading and supplemented
alkalinity. J Environ Management 79:198–206.
O-Thong S, Prasertsan P, Karakashev D, Angelidaki I. 2008. High-rate continuos hydrogen
production by Thermoanaerobacterium thermosaccharolyticum PSU-2 immobilized on heat-
pretreated methanogenic granules. Int J Hydrogen Energy 33:6498–6508.
Prazeres AR, Carvalho F, Rivas J. 2012. Cheese whey management: A review. J Environ
Management 110:48–68.
Redwood MD, Paterson-Beedle M, Macaskie LE. 2009. Integrating dark and light bio-hydrogen
production strategies: towards the hydrogen economy. Rev Environ Sci Biotechnol 8:149–
185.
Saxena RC, Adhikari DK, Goyal HB. 2009. Biomass-based energy fuel through biochemical routes:
A review. Renew Sust Energ Rev 13:167–178.
Ueno Y, Haruta S, Ishii M, Igarashi Y. 2001. Microbial community in anaerobic hydrogen-
producing microflora enriched from sludge compost. Appl Microbiol Biotechnol 57:555–562.
Van Ginkel S, Logan BE. 2005. Inhibition of Biohydrogen Production by Undissociated Acetic and
Butyric Acids. Environ Sci Technol 39:9351–9356.
Venetsaneas N, Antonopoulou G, Stamatelatou K, Kornaros M, Lyberatos G. 2009. Using cheese
whey for hydrogen and methane generation in a two-stage continuous process with
alternative pH controlling approaches. Bioresour Technol 100:3713–3717.
Vidal G, Carvalho A, Méndez R, Lema J. 2000. Influence of the content in fats and proteins on the
anaerobic biodegradability of dairy wastewaters. Bioresour Technol 74:231–239.
Wang CH, Lin PJ, Chang JS. 2006. Fermentative conversion of sucrose and pineapple waste into
hydrogen gas in phosphate-buffered culture seeded with municipal sewage sludge. Process
Biochem 41:1353–1358.
Wang Y, Mu Y, Yu HQ. 2007. Comparative performance of two upflow anaerobic biohydrogen-
producing reactors seeded with different sludges. Int J Hydrogen Energy 32:1086–1094.
Yang P, Zhang R, McGarvey JA, Benemann JR. 2007. Biohydrogen production from cheese
processing wastewater by anaerobic fermentation using mixed microbial communities. Int J
Hydrogen Energy 32:4761–71.
Yu HQ, Mu Y. 2006. Biological hydrogen production in a UASB reactor with granules. II: Reactor
performance in 3-year operation. Biotechnol Bioeng 94:988–995.
Zhang ZP, Tay JH, Show KY, Yan R, Liang DT, Lee DJ, Jiang WJ. 2007. Biohydrogen production
in a granular activated carbon anaerobic fluidized bed reactor. Int J Hydrogen Energy
32:185–191.
12
Chapter 2
Different start-up strategies to enhance biohydrogen production from
cheese whey in UASB reactors
Summary
The effect of different operational strategies and inoculum structure (granules and
disaggregated granules) during the start-up of four up-flow anaerobic sludge bed
hydrogenogenic reactors was investigated. The more stable hydrogen production rates
(VHPR) obtained were 0.38 and 0.36 L H2/L-d, in reactors operated with a constant organic
loading (OLR) rate with both inoculum structures, whereas in reactors operated with an
increasing OLR methane started to be produced earliest in time. Specific hydrogenogenic
activity results proved that the disaggregated inoculum produced a more active biomass
than the granular one, but not granule formation was evident. The methane
hydrogenotrophic activity was the main limitation of the systems evaluated. In the reactors
inoculated with disaggregated sludge the start-up strategy did not influence the bacterial
DGGE fingerprint, in contrast to the reactors started-up with granular sludge; members of
the Clostridium genus were always present. The results demonstrated that operational
conditions during the start-up period are crucial for the production of hydrogenogenic
biomass.
13
2.1 Introduction
Present concerns about limited fossil fuel reserves and climate change drive a search for
renewable fuels. Hydrogen (H2) is considered a sustainable alternative for fossil fuels, due
to its highest energy content compared to other fuels and that it can be combusted or used
directly in fuel cells to produce electricity and only water as by-product. Indeed, renewable
energy sources e.g. biomass or wastewater can be utilized for hydrogen generation through
a fermentative process using microorganisms, making this process promising for energy
production (Davila-Vazquez et al., 2008b; Hallenbeck, 2009); due to the biological origin,
the term biohydrogen is used. Dairy industry effluents are a potential substrate for
biohydrogen production, due to their high biodegradable carbohydrate content (Kapdan and
Kargi, 2006). Around the world, the cheese industry produces over 160 million tonnes of
cheese whey per year (Guimaraes et al., 2010), a by-product that contains around 70% of
lactose (on a dry basis), and has been used successfully for biohydrogen production
(Castello et al., 2009; Davila-Vazquez et al., 2009).
Recent research approaches are aimed to develop continuous biohydrogen producing
systems, using different reactor technologies, being the continuous stirred tank reactor
(CSTR) the most frequently reported (Guo et al., 2008; Hawkes et al., 2007). Although the
stirring condition can improve the mass transfer efficiency, the CSTR has the potential
problem of cell washout due to the suspended nature of the biomass within the reactor (Guo
et al., 2008).
The critical parameter related to the increase of biohydrogen productivity is the organic
loading rate (OLR). Several reports show that a high OLR may increase the hydrogen
production rate; for instance, Guo et al. (2008) found than an increase from 12 to 120 kg
COD/m3-d in the OLR produced a gain of about 7 times in the hydrogen production rate,
reaching a value of 0.71 L/L-h. Biological reactors can withstand high OLR as long as they
can retain high biomass concentrations like those using granular sludge (Chang and Lin,
2004). Such systems, like the up-flow anaerobic sludge blanket (UASB) reactors, have
been used for biohydrogen production (Mu and Yu, 2006; Zhao et al., 2008). However the
main constrain of using an UASB reactor for hydrogen production is to obtain granular
sludge with a high biohydrogen production rate. Although the formation and stabilization
14
of hydrogen producing granules takes a long period of time, usually several months (Chang
and Lin, 2004; Mu and Yu, 2006), some successful strategies have been reported such as
acid incubation of a previous enriched hydrogenogenic biomass in a CSTR (Zhang et al.,
2007) and the use of sterilized granules as biomass support at hyper-thermophilic
conditions (Kotsopoulos et al., 2006). The drawbacks of these procedures are the time
required to create hydrogenogenic granules in a CSTR and the energy requirements for
keeping the temperature at 70°C, respectively.
Alternatively, it is proposed the use of strategies based on controlling either the hydraulic
retention time (HRT) or the OLR during the reactor start-up to promote the selection of
hydrogenogenic microorganisms within the granule; for example, gradual OLR increases
can promote a slow growth of microorganisms creating a dense granule, and low HRT can
wash out microorganisms with low adhesion capabilities. These strategies were
successfully proven to overcome the long start-up period for the development of
methanogenic granules and biofilms (Cresson et al., 2008; Liu et al., 2002). Nonetheless,
according to our knowledge, similar strategies have not been applied for the development
of hydrogenogenic biomass.
The source of the inoculum is another important factor in the performance of the
fermentation system, determining the hydrogen yield, the microbial community structure
and the metabolic pathway (Akutsu et al., 2008; Baghchehsaraee et al., 2010). Moreover,
the structure of the inoculum can play a key role in the formation of hydrogenogenic
granules. In this regard, anaerobic granular sludge has been used like support for the
development of hydrogen producing granules (Kotsopoulos et al., 2006), but the use of
disaggregated granules as inoculum has not been studied to establish a hydrogenogenic
community.
Therefore, in this work different strategies (changing operational parameters) and different
inoculum structure (granules and disaggregated granules) were studied to evaluate their
effect on the reactor start-up period and the volumetric hydrogen production rate (VHPR)
in UASB reactors using cheese whey powder (CWP) solution as a synthetic dairy
wastewater. The performance of the reactors was evaluated and specific hydrogenogenic
activity (SHA) batch assays were conducted regularly in order to characterize the
15
development of the hydrogenogenic biomass, changes in the bacterial communities were
analyzed using polymerase chain reaction–denaturing gradient gel electrophoresis (PCR–
DGGE).
2.2 Materials and methods
2.2.1 Seed sludge
The inoculum was anaerobic granular sludge from a full-scale up-flow anaerobic sludge
bed (UASB) reactor treating wastewater from a confectionery factory in San Luis Potosí,
México. Two different heat treatments were applied to the inoculum to inactivate
methanogenic microflora as follows: i) the granular sludge was boiled for 45 minutes and
then disaggregated in an anaerobic chamber (95% nitrogen and 5% hydrogen) by pressing
it out repeatedly through a 21G x 1‖ syringe needle; ii) due to an expected resistance of
methanogens due to the protective environment in the granular structure (Hu and Chen,
2007), the granular sludge was boiled three times during 1 hour, with 22 hours between
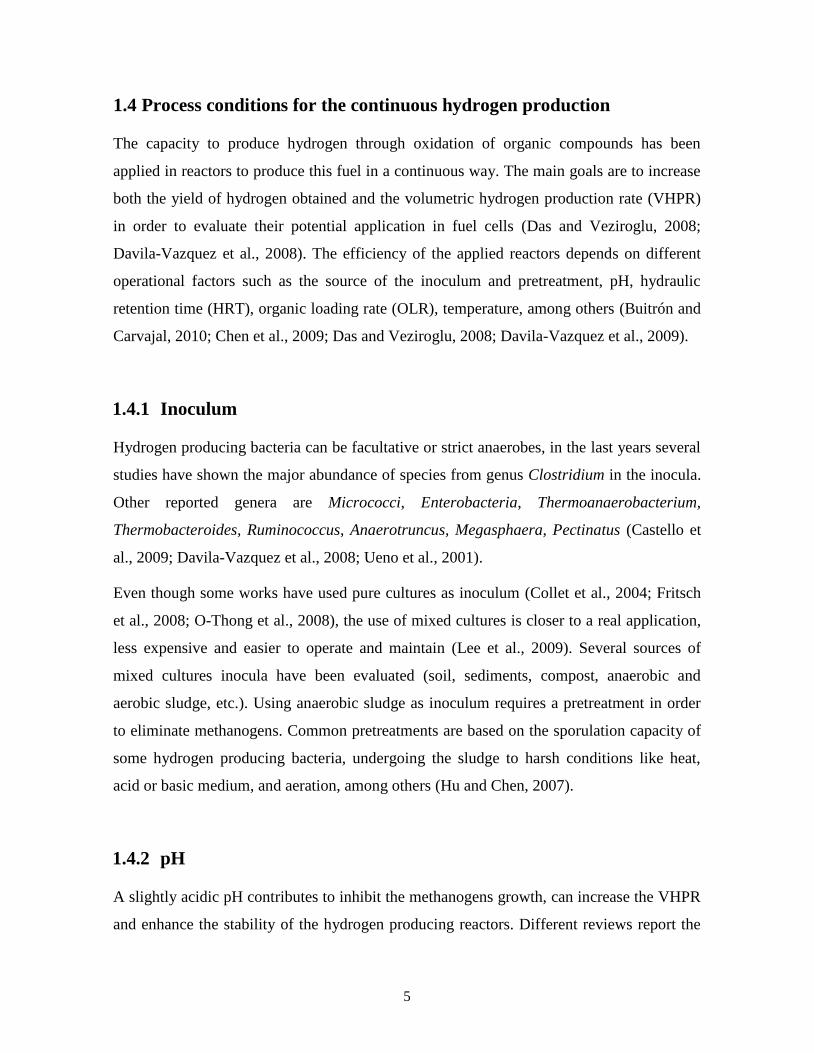
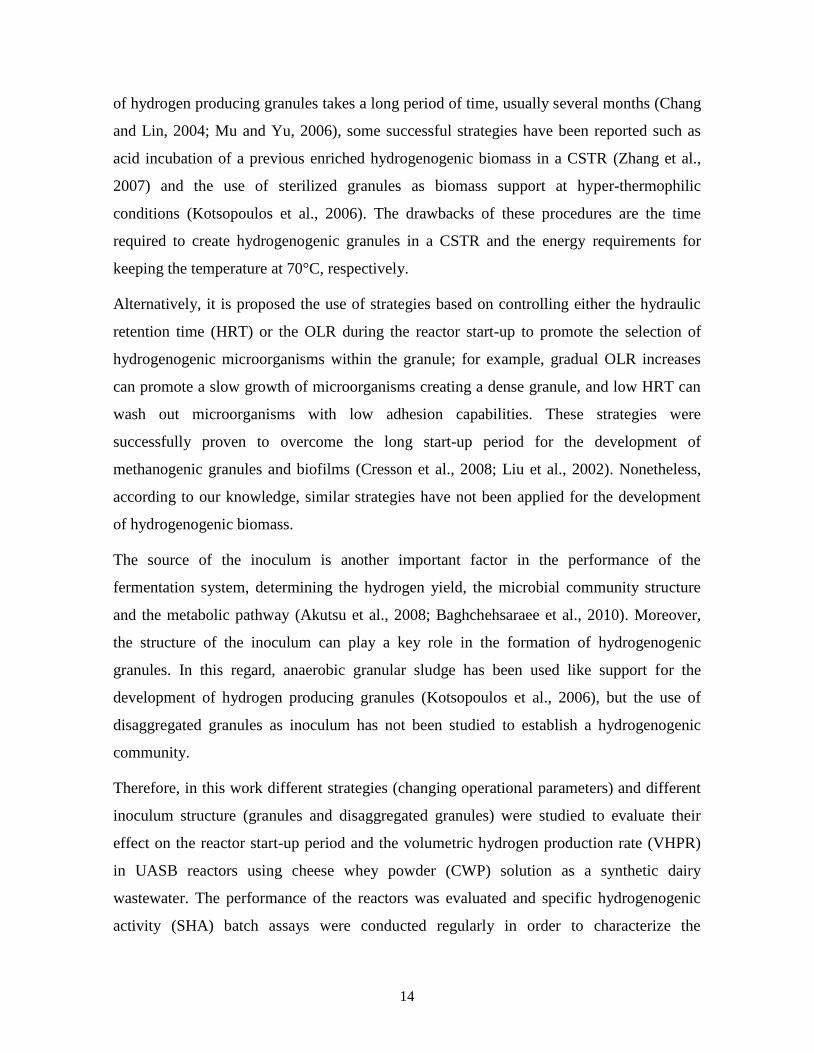
each treatment. Figure 2.1 shows the structure of each inoculum. The reactors were seeded
with 20 g volatile suspended solids (VSS)/L of either granules or disaggregated granules.
Figure 2.1. Photographs of the disaggregated (a) and granular (b) inoculum.
16
2.2.2 Medium composition
CWP was purchased from Grande Custom Ingredients Group (Wisconsin, USA). The
soluble lactose content of CWP was 75.5% with 11.5% protein (w/w). An initial stock
solution of 100 g CWP/L was centrifuged 10 minutes at 7000g to remove insoluble
material. After that, soluble chemical oxygen demand (COD) of the solution was
determined. The medium used to feed the reactors and for the specific hydrogenogenic
activity (SHA) tests, contained a known amount of CWP-COD and was supplemented with
(mg/L): NH4H2PO4, 4500; K2HPO4, 125; MgCl2·6H2O, 100; ZnCl2, 75; FeSO4·6H2O, 25;
MnSO4·7H2O, 15; Na2MoO4·2H2O, 12.5; CuSO4·5H2O, 5; CoCl2·6H2O, 3. Additional
Na2HPO4 was added to increase the buffer capacity of the medium in order to control the
pH at the desired value.
2.2.3 Reactor operation
Four different UASB reactors with the same configuration and working volume (1.3 L)
were used for the study. Two different start-up strategies (A and B) and two different
inocula structure (disaggregated granules and granules) were used. Reactors were named as
R1, R2, R3 and R4 and were operated as follows: R1 and R2 were inoculated with
disaggregated granules and start-up strategies A and B, were applied respectively; whereas
R3 and R4 were inoculated with granular sludge and start-up strategies A and B, were
applied respectively (Table 2.1). After inoculation the reactors were filled-up with medium
containing 8 g COD/L and left in batch mode for 12 h with effluent recirculation to obtain
an up-flow velocity of 1.5 m/h. Then the reactors were switched to continuous mode and
operated for 84 days maintaining the recirculation flow.
During the first 50 days of continuous operation the following start-up strategies A or B
were applied.
Start-up strategy A. The reactors were started with an initial OLR of 5 g COD/L-d which
was increased geometrically, achieving a final OLR of 20 g COD/L-d after 50 days; the
OLR was calculated each day with following formula
OLRi=αOLRi-1 (2.1)
17
where OLRi and OLR i-1 are the OLR on days i and on day i-1, respectively, and α is a
constant parameter calculated from the following equation:
,n
i
n
OLR
OLR (2.2)
where n is the duration of the OLR increase (in days), OLRi and OLRn are the OLR at the
first and last day of the start-up phase, respectively.
Table 2.1. Different start-up strategies and inoculum used in the reactors.
Start-up strategy Reactor Inoculum
A Gradual OLR increase,
constant HRT
1 Disaggregated
3 Granular
B Constant OLR, gradual
HRT decrease
2 Disaggregated
4 Granular
The HRT was kept constant at 6 h, above the HRT limit of 5.8 h, equivalent to the
maximum specific growth rate of 0.172/h reported for hydrogen-producing cultures (Chen
et al., 2001); this strategy was modified from the one proposed by Cresson et al.(2008).
Start-up strategy B. The reactors were operated at a constant OLR of 20 g COD/L-d,
whereas the HRT was gradually decreased, in a period of 50 days, from 24 h to 6 h (24, 18,
16, 14, 12, 10, 8, 6 h). The reactors were operated during 6 or 7 days at each HRT.
At the end of the start-up period, from day 51 to day 84, the reactors were operated at the
same conditions (OLR of 20 g COD/L-d and HRT of 6 h) to promote a steady state. The
reactors OLR and HRT during all the experiment are depicted in Figure 2.2. The reactors
were maintained at ambient temperature (22-25 °C) and at a pH value of 5.9, unless
otherwise indicated.
The performance of the reactors was followed by analyzing the effluent three times a week
for COD, volatile fatty acids (VFA), ethanol and residual lactose; VSS concentration was
assayed once a week. Gas production was measured using a liquid-displacement device
filled with water. All gas volumes are reported as measured (0.81 atm and 25°C).
18
2.2.4 Batch activity assays
Specific hydrogenogenic activity (SHA). SHA was determined in the seed sludge (granules
and disaggregated granules) and in the biomass withdrawn from the reactors sampling ports
on days 33 and 82. Measurements were performed in 120 mL glass serum bottles with 80
mL of working volume containing 4.5 g VSS/L of biomass and sealed with rubber septa
according to the optimized method described by Davila-Vazquez et al. (2008a), at a COD
concentration of 25 g/L and an initial pH value of 7.5. The gas composition of the
headspace was determined as described in the analytical methods. The SHA was calculated
dividing the maximum hydrogen production rate by the VSS concentration.
Specific hydrogenotrophic methanogenic activity (SHMA). SHMA was measured in seed
sludge of reactors R3 and R4 and in biomass withdrawn from the sampling ports of the
same reactors on days 33 and 82. Glass serum bottles (160 mL) with 80 mL of working
volume were used for the assay. The headspace was displaced with a mixture of H2/CO2
(80/20%). The pressure of the headspace was measured periodically during 5 days, to
calculate the methane production stoichiometrically (Equation 2.3). All batch activity
assays were carried out in duplicate at 35°C with horizontal agitation at 120 rpm.
4H2 + CO2 → CH4 + 2H2O (2.3)
2.2.5 Electron balance
The flow of electron equivalents (e- eq) during reactor operation was determined through an
electron balance according to equation (2.4), modified from the proposed by Lee and
Rittmann (2009):
e- (CODi) = e
- (metabolites) + e
- (gas) + e
- (residual lactose) + e
- (N.D.) (2.4)
where e- (CODi) = e
- eq corresponding to the COD of the feed solution (an equivalence of 8
g COD/ e- eq was considered); e
- (metabolites) = e
- eq of each metabolite produced; e
- (gas)
= e- eq of H2 and CH4 produced; e
- (residual lactose) = e
- eq of the residual lactose in the
effluent; e- (N.D.) = e
- eq of the not determined products, resulting from the difference of
the e- (CODi) and the other equation terms. The electron flow is reported as fraction, being
e-
(CODi) the total e-
eq available, and the electron sinks, e-
(metabolites, gas, residual
19
lactose and N.D.) are a fraction of this value; the electron equivalents directed to biomass
production were not considered.
2.2.6 Analytical methods
Hydrogen, CH4 and CO2 content in the gas were determined by gas chromatography (GC,
6890N Network GC System, Agilent Technologies, Waldbronn, Germany) equipped with a
thermal conductivity detector and a Hayesep D column (Alltech, Deerfield, Illinois, USA)
with the following dimensions: 10´ x 1/8’’x 0.085‖. Temperatures of the injection port,
oven and detector were 250, 60 and 250ºC, respectively. Nitrogen was used as carrier gas
with a flow-rate of 12 mL/min. Pressure of the headspace in the hydrogenotrophic
methanogenic assays was measured with a manometer (Model 407910, Extech Instruments
Corporation, Massachusetts, USA). Lactose, volatile fatty acids (VFA: acetate, propionate
butyrate, lactate and formate) and ethanol were analyzed as previously described (Davila-
Vazquez et al., 2008a). COD and VSS were analyzed according to Standard Methods
(APHA/AWWA/WFE, 2005).
2.2.7 Bacterial community analyses by 16S rRNA genes using DGGE
2.2.7.1 DNA extraction
Ten milliliters of sludge were withdrawn from each reactor at day 33 and 84 of continuous
operation and kept at -20°C, DNA was extracted from these samples and the samples from
the different inoculum (granules and disaggregated granules) based on a previously
published protocol (Wisotzkey et al., 1990). In brief, the samples were slowly thawed and
300 µL were centrifuged at 7000g for 10 min. The pellet was washed with PBS buffer (10
mM NaH2PO4 and Na2HPO4, plus NaCl 140 mM, pH 7.5) and ethanol solution (1:1), a
second wash with PBS was done and the pellet was incubated in 500 µL of extraction
buffer (10 mM Tris/HCl, pH 8) and 20 µL of lysozyme (20 mg/mL) during 30 minutes at
37°C and 250 rpm. Afterwards, the following reagents were added: NaCl 5M (600 µL), 2-
2% (w/v) polyvinylpirrolidone-cetyltrimetylammonium bromide (200 µL), PK buffer [100
mM Tris/HCl pH 7.6, 5 mM EDTA pH 8, 50 mM NaCl] (600 µL) and 20 µL of proteinase
20
K (20 mg/mL), the mixture was incubated during 2 hours at 55°C and 250 rpm. Then, 15
µL of RNase (0.5 mg/mL) were added and samples were incubated during 30 minutes at
37°C and 250 rpm. For nucleic acids purification, one volume of chloroform–isoamylic
alcohol (24:1) was added, mixed and centrifuged for 3 min at 7000g. This purification step
was repeated two times using the supernatant. To precipitate nucleic acids, one volume of
isopropanol at -20°C and 0.3 volumes of ammonium acetate (5M) were added to the
supernatant and incubated overnight at -20°C before centrifugation at 4°C for 40 min at
7000g. The pellet was first washed with 70% ethanol and centrifuged at 7000g for 40 min.
The DNA pellet was dried at room temperature and resuspended in 15-50 µL of sterile
deionized water. DNA integrity was observed in 1% agarose gels, stained with ethidium
bromide.
2.2.7.2 PCR amplification
Amplification of the 16S rRNA gene from the purified DNA was carried out by PCR using
Taq DNA polymerase (Dongsheng, China). The PCR primers used were the forward primer
341F-GC (5’-
CGCCCGCCGCGCGCGGCGGGCGGGGCGGGGGCACGGGGGGCCTACGGGAGGC
AGCAG-3´) and the reverse primer 907R (5’-CCGTCAATTCMTTTGAGTTT-3’) for
bacterial identification of complex microbial populations (Schäfer and Muyzer, 2001); the
forward primer contains a 40 nucleotide GC-clamp at the 5’ end to prevent the complete
dissociation of the two DNA strands during the DGGE. Reaction conditions were as
follows: initial DNA denaturation at 96 °C for 4 min, followed by 10 cycles of denaturation
at 94°C for 30 s and annealing for 1 min decreasing 1ºC in each cycle the temperature from
61°C-56ºC, followed by an extension at 72°C for 1 min. Once the temperature reached
56ºC, 20 more cycles were performed; final extension lasted 7 min at 72°C. PCR products
were visualized in 1.5% agarose gels, stained with ethidium bromide to assess the size,
purity and concentration of DNA.

21
2.2.7.3 DGGE analysis
DGGE was performed with Dcode Universal Mutation Detection System (Biorad,
Hercules, California, USA). The PCR products were separated in 8% polyacrylamide gels
(1mm thick) in 0.5 X TAE buffer (20mM Tris–acetate, 10 mM sodium acetate, 0.5mM
EDTA, pH 8.0) with a linear denaturing gradient (urea–formamide) from 30 to 60%.
Electrophoresis was carried out at 60°C at a constant voltage of 70 V during 20 h. The
procedure to stain the gel after the electrophoresis was as follows, first the gel was fixed
with 10% acetic acid solution during 30 min at 40-50 rpm, and the gel was washed three
times with deionized water for 5 min at the same agitation. Afterwards, the gel was
submerged in AgNO3 solution (1 g/L) during 30 min, without light incidence. The bands in
the gel were developed with anhydrous sodium carbonate (23.3 g/L) solution during 15
min, afterwards the gel was submerged in the fixation solution (10% acetic acid) during 5
min and finally the gel was rinsed with deionized water. The gel bands were observed at
visible light, and a photo with a digital camera was taken.
DGGE gels were analyzed with the Cross Checker v 2.91 software (Wageningen
University, The Netherlands) to create a binary matrix, the Unweighted Pair Group Method
Arithmetic (UPGMA) averages were calculated and corresponding dendograms showing
the relationships between the DGGE profiles were constructed with the Phylogeny
Inference Package v 3.69 (University of Washington, USA). The dominant bands were
excised from the gel, eluted in 20µL of sterile deionized water overnight at room
temperature. The eluted DNA was reamplified by PCR using 341F (without GC-clamp) and
907R primers. The PCR products from reamplification were sent to purification and
sequencing to ―Laboratorio Nacional de Biotecnología Agrícola, Médica y Ambiental‖
(LANBAMA, Mexico). Sequence data were analyzed with DNA Baser v.3.2.5 software
(Heracle BioSoft, Arges, Romania) and submitted to the non-redundant nucleotide database
at GenBank using the BLAST program (http://www.ncbi.nlm.nih.gov/blast/) and
Ribosomal Database Project (http://rdp.cme.msu.edu/index.jsp) for bacterial identification.
22
2.3 Results and discussion
2.3.1 Reactors performance
Four laboratory scale UASB reactors were operated in order to investigate the effect of
different start-up strategies and different inoculum structure on both the VHPR and the
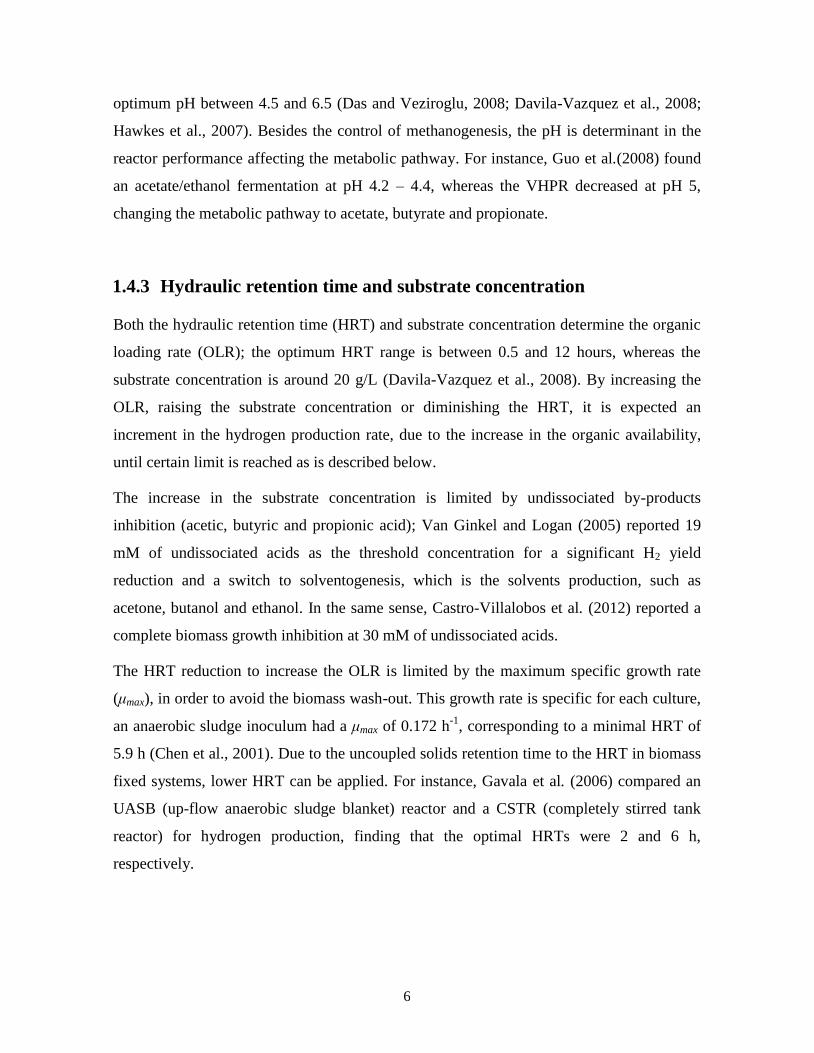
biomass activity. Figure 2.2 shows the time course of the reactors performance. The gas
production started at different times in each reactor, in the reactors with disaggregated
granular sludge, R1 and R2, the gas production started after 40 to 70 hours of continuous
operation (Figs. 2.2a and b), meanwhile in R3 and R4, inoculated with granular sludge, the
gas production started during the first 12 hours after inoculation (Figs. 2.2c and d). In the
reactors started-up with strategy A (R1 and R3) the gas composition in the first 9 days of
continuous operation was mainly H2, 98 and 76%, respectively, and the rest was CO2, the
VHPR was less than 0.3 L H2/L-d (Figs. 2.2a and c). Despite heat treatment was applied to
the seed sludge methane was produced in all reactors. From day 10 onwards, methane was
produced in R1 and R3 at a higher volumetric rate (0.5 L CH4/L-d) than hydrogen
production (Figs 2.2a and c). In the reactors started-up with strategy B (R2 and R4), the H2
content in the gas was 49 and 31%, respectively, and the rest was CO2; methane production
began on days 64 and 25 for R2 and R4, respectively (Figs. 2.2b and d). The highest VHPR
achieved in R2 and R4 was 1.41 and 3.25 (point not shown) L H2/L-d, respectively, which
can be explained by the higher initial OLR applied.
During the start-up period (days 1-50) a stable hydrogen production was not expected, due
to the variable operational conditions. In R1 the highest hydrogen producing period was
between days 68 and 72, reaching a VHPR of 1.12 ± 0.19 L H2/L-d, then the production
decreased to an average value of 0.33 ± 0.2 up to day 84 (Fig. 2.2a). In R2 during days 59
to 64 the VHPR was 0.74 ± 0.14 L H2/L-d, following a similar tendency like R1 decreasing
to 0.38 ± 0.1 from day 80 to 84 (Fig. 2.2b). In R3 the VHPR was in average 0.11 ± 0.03 L
H2/L-d during all the stabilization period from days 51 to 84 (Fig. 2.2c), meanwhile in R4
the hydrogen production rate was 0.36 ± 0.1 L H2/L-d in the same period, being a more
stable hydrogen production compared to R1 and R2 (Fig. 2.2d).
The hydrogen production rates obtained in R1, R2, and R4, at the end of reactors operation,
are higher than the VHPR obtained by Castello et al. (2009) (122 mL H2/L-d), in a UASB
23
reactor at an OLR of 20 g COD/L-d with cheese whey as substrate and methane occurrence
as in the present study; but are lower than the hydrogen production rate reported by Chang
and Lin (2004), about 0.5 L H2/L-d, under the same OLR using sucrose as substrate with
only H2 and CO2 in the biogas.
Figure 2.2. Profiles of the volumetric hydrogen production rate, VHPR (); volumetric methane
production rate, VMPR (◊) and operational conditions applied: hydraulic retention time, HRT (—)
and organic loading rate, OLR (……
), in reactors R1 (a), R2 (b), R3 (c) and R4 (d).
In order to diminish the methane production in all reactors, from day 50 to 84 the buffer
capacity in the influent was decreased and the pH was reduced from 5.9 to an average value
of 5.4. However this strategy was not efficient to control the methanogenesis, similar
results have been reported, where the pH was kept at an average value of 5 but the methane
production did not ceased (Castello et al., 2009). A general tendency in all reactors when
methane production began, was that methane content in the biogas increased gradually
reaching higher percentages than H2, which can be explained by an acclimation of the
methanogens over the time even at low pH values, contrasting with the neutral pH
considered for the optimum methanogenic systems operation (Taconi et al., 2008).

24
According to Wang et al. (2007) reducing the pH up to 4.5 effectively suppressed methane
production in UASB reactor inoculated with heat treated anaerobic sludge, possibly in the
present study a higher decrease on the pH (one unit or more) would be a sustainable
strategy to reduce the methanogenic activity.
The results confirmed that one or repeated heat treatments did not eliminate the
methanogens from the inoculum, due to the protection structure provided by the granules as
was established by Hu and Chen (2007), who found that a heat treatment was effective in a
sewage sludge but it did not eliminate completely the methanogenic activity in granular
sludge. In other study in which the seed sludge was heat treated, methane production was
also observed (Wang et al., 2007). Potential strategies to efficiently inhibit methanogens
are: heat treatment after disintegration of the granules; longer dry heat treatments at 105°C
(1.5 to 2 hours) (Khanal et al., 2006; Wang and Wan, 2008); heat treatment followed by an
acid treatment (2 hours of heat treatment followed by acid incubation at pH 2 or 3 during
24 hours) (Mohan et al., 2008; Zhang et al., 2008) and boiling the sludge during 5 h (Argun
and Kargi, 2009).
Another important factor to consider is the solids retention time (SRT), for instance in a
CSTR the HRT is equal to the SRT, which in principle allows the washout of cells not able
to growth at the dilution rate applied. In contrast, within UASB reactors the SRT is longer
than the HRT, this may explain why the methanogens were preserved even at the short
HRT (6 h) applied to the reactors with strategy A (R1 and R3), unlike the results from
previous experiments using the same seed sludge and similar heat treatment, but different
reactor system such as a CSTR (Davila-Vazquez et al., 2009).
In the case of reactors started-up with strategy B, R2 and R4, the high initial concentration
of VFA produced (up to 10 g COD/L) due to the higher initial substrate concentration
applied during the start-up period, inhibited the methanogenic community (Wong et al.,
2008) retarding the methane presence comparing with R1 and R3.
It can be considered that reactor R4 reached steady state after 60 days of operation (Fig.
2.2d). This time is shorter than the time reported by Mu and Yu (2006) (140 days) and
Zhao et al. (Zhao et al., 2008) (8 months), but is similar to the time reported by Chang and
Lin (2004) (50 days) to reach equivalent and stable hydrogen production rates (about 0.5 L
25
H2/L-d), it that experiment the OLR was constant as in strategy B of the present study (20 g
COD/L-d).
2.3.2 Metabolic byproducts
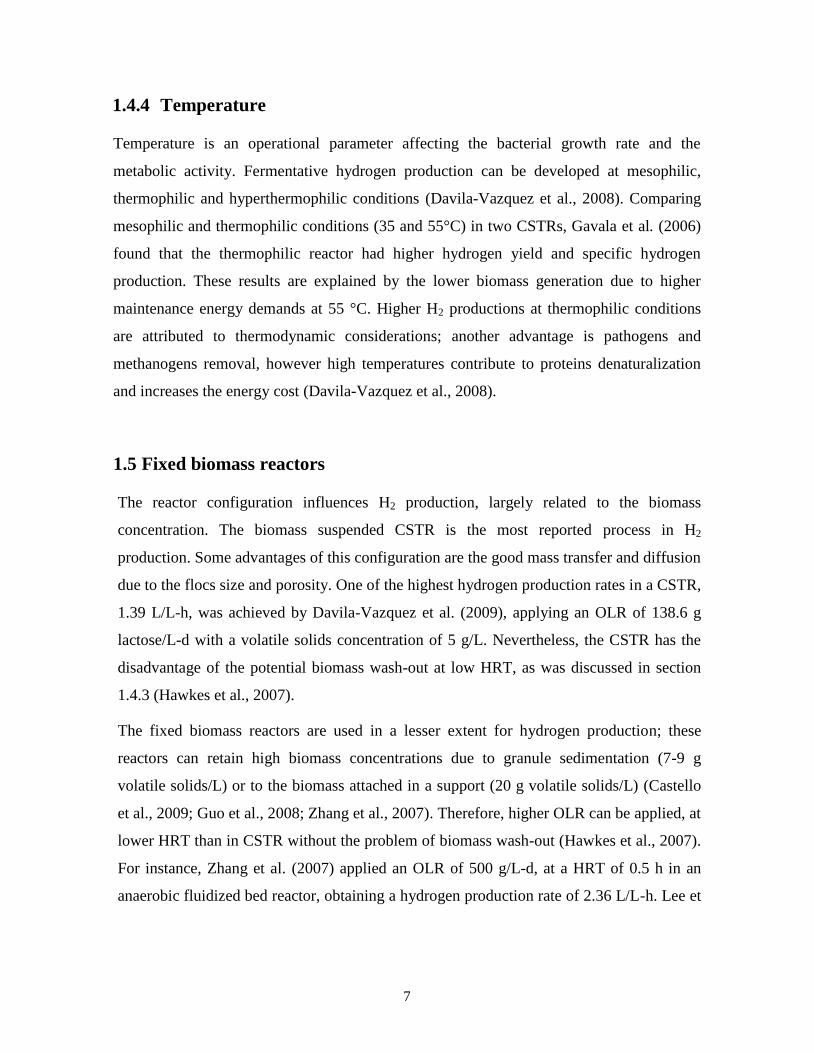
Figures 2.3 and 2.4 show the metabolites, hydrogen and methane production rates for R1,
R3 and R2, R4, respectively. In all reactors the lactose consumption was higher than 99%.
In reactors operated with strategy A (Fig. 2.3), the main metabolic product throughout the
operation time was acetate, indicating a hydrogen production pathway (Hawkes et al.,
2007). In R1 until day 62, the second more produced metabolite was propionate (Fig. 2.3a),
which has been reported as a non-hydrogen production pathway (Hawkes et al., 2007; Lee
and Rittmann, 2009). The propionate concentration decrease coincided with the hydrogen
production increase. In reactor R3, the second more produced metabolite was butyrate,
indicating that a mixed fermentation acetate-butyrate occurred, this production pathway has
been reported as adequate for H2 generation (Davila-Vazquez et al., 2008a; Hawkes et al.,
2007), however the hydrogen production achieved in R3 was the lowest from the four
experiments, being in average 3.09 mmol/d (Fig. 2.3b).
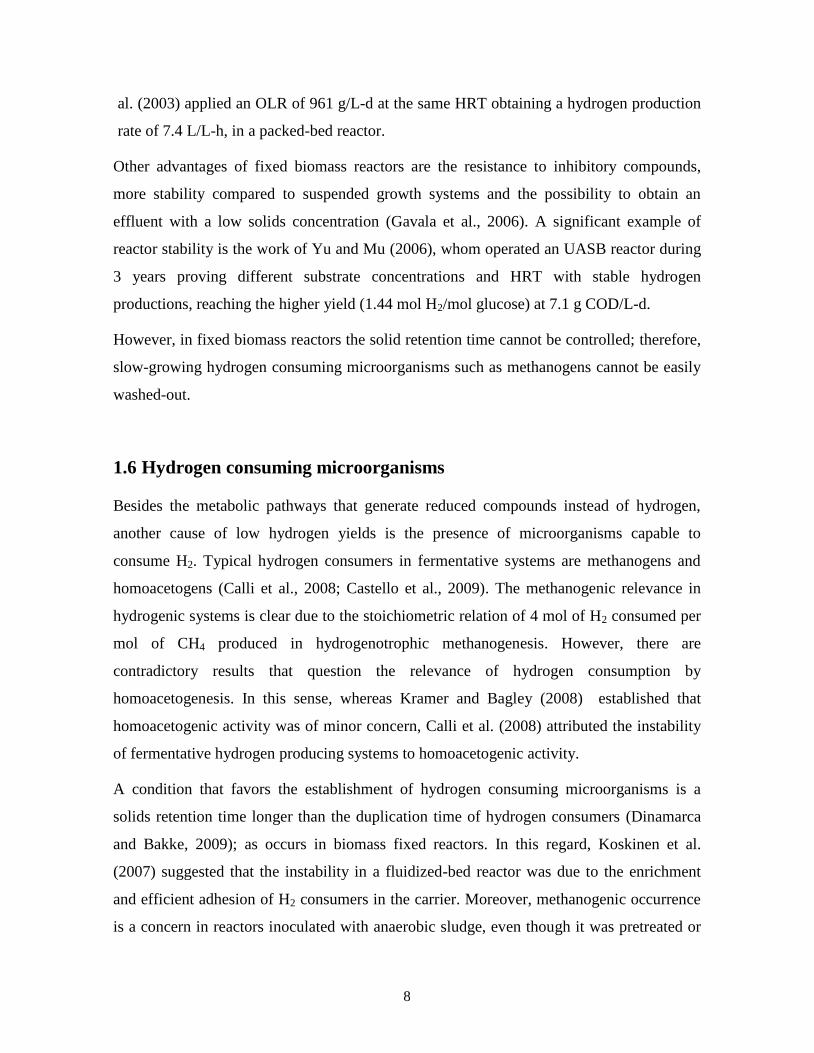
In reactors, R2 and R4, started-up with strategy B (Figure 2.4), unlike reactors R1 and R3,
other reduced products such as lactate and formate were also produced but in low rates (less
than 4 mmol/d). In R2 before the methane production started, the second more produced
metabolite was ethanol after acetate (Fig. 2.4a), which has been reported as a hydrogen
producer mixed metabolic pathway (Guo et al., 2008). Similarly to R2, in R4 acetate was
the main metabolic by-product produced at a stable rate of 97.5 ± 11.7 mmol/d, followed by
butyrate (Fig. 2.4b).
According to Dinamarca and Bakke (2009), the low H2 production rate could be caused
either by electrons derived from the competition between electron carriers, which are
redirected to the formation of reduced products such as biomass and/or exocellular electron
transfer; or molecular H2 consumption by homoacetogenic bacteria or methanogens. Due to
the low production of propionate or lactate during days 51 to 84 in all the reactors (in
average 15.45 mmol/d), the reduced products option acting as electrons sink was discarded.
The most feasible explanations, for a low production H2 rate, are the hydrogen consumption
26
by homoacetogenic bacteria, which could also explain the high acetate production, or the
hydrogen consumption by methanogens. To elucidate this, batch assays to evaluate the
methanogenic and the homoacetogenic activities were carried out, the results are presented
in section 2.3.4.
Figure 2.3. Profiles of the metabolites and gas production rates obtained from UASB reactors
operated with strategy A: R1(a) and R3 (b); Acetate (, Ethanol (▼), Propionate (□), Butyrate (∆),
H2 (and CH4 (◊).
2.3.3 Electron balance
Figure 2.5 shows the electron balance of the reactors through the stabilization period (days
50-84). Reactors with disaggregated inoculum (R1 and R2) were less stable in electron
distribution than reactors with granular inoculum (R3 and R4). The main identified electron
sinks were acetate and butyrate, with average values of 18 and 16%, 19 and 13%, 20 and
25%, 15 and 11% of the available electrons for R1, R2, R3 and R4, respectively. In reactors
with disaggregated inoculum ethanol was also a substantial electron sink, corresponding to
7 and 14% of the available electrons for R1 and R2, respectively. In these reactors the
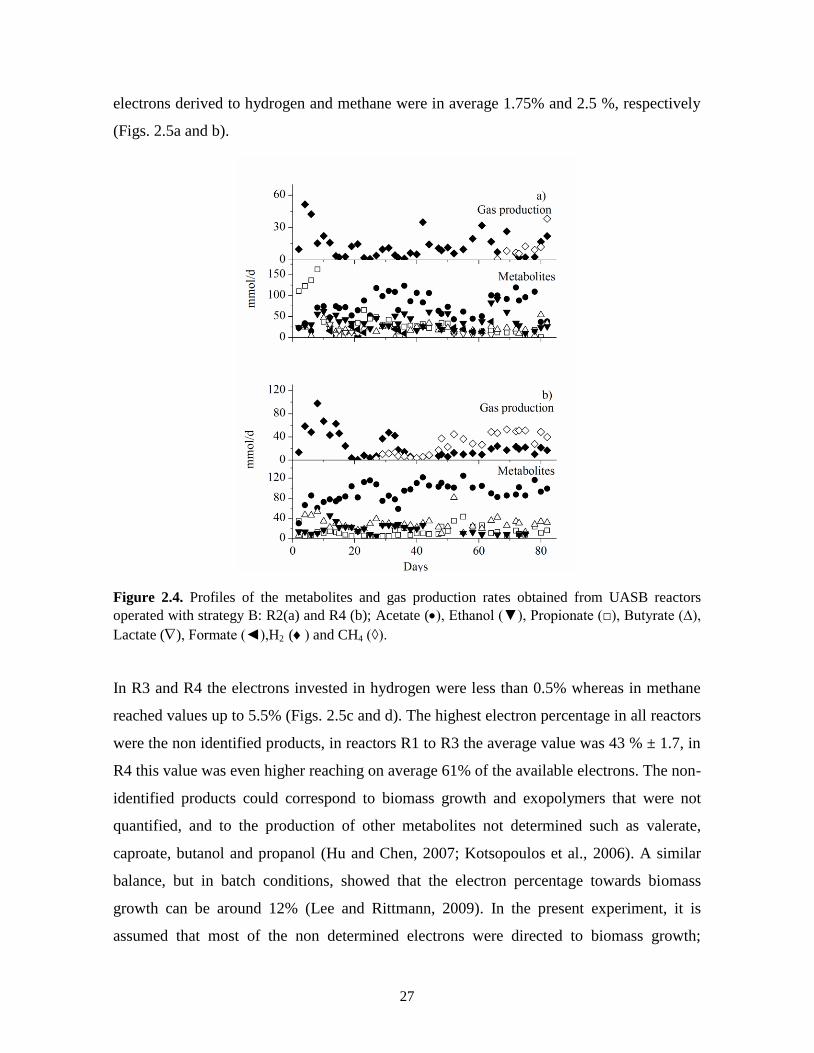
27
electrons derived to hydrogen and methane were in average 1.75% and 2.5 %, respectively
(Figs. 2.5a and b).
Figure 2.4. Profiles of the metabolites and gas production rates obtained from UASB reactors
operated with strategy B: R2(a) and R4 (b); Acetate (, Ethanol (▼), Propionate (□), Butyrate (∆),
Lactate (), Formate (◄),H2 (and CH4 (◊).
In R3 and R4 the electrons invested in hydrogen were less than 0.5% whereas in methane
reached values up to 5.5% (Figs. 2.5c and d). The highest electron percentage in all reactors
were the non identified products, in reactors R1 to R3 the average value was 43 % ± 1.7, in
R4 this value was even higher reaching on average 61% of the available electrons. The non-
identified products could correspond to biomass growth and exopolymers that were not
quantified, and to the production of other metabolites not determined such as valerate,
caproate, butanol and propanol (Hu and Chen, 2007; Kotsopoulos et al., 2006). A similar
balance, but in batch conditions, showed that the electron percentage towards biomass
growth can be around 12% (Lee and Rittmann, 2009). In the present experiment, it is
assumed that most of the non determined electrons were directed to biomass growth;
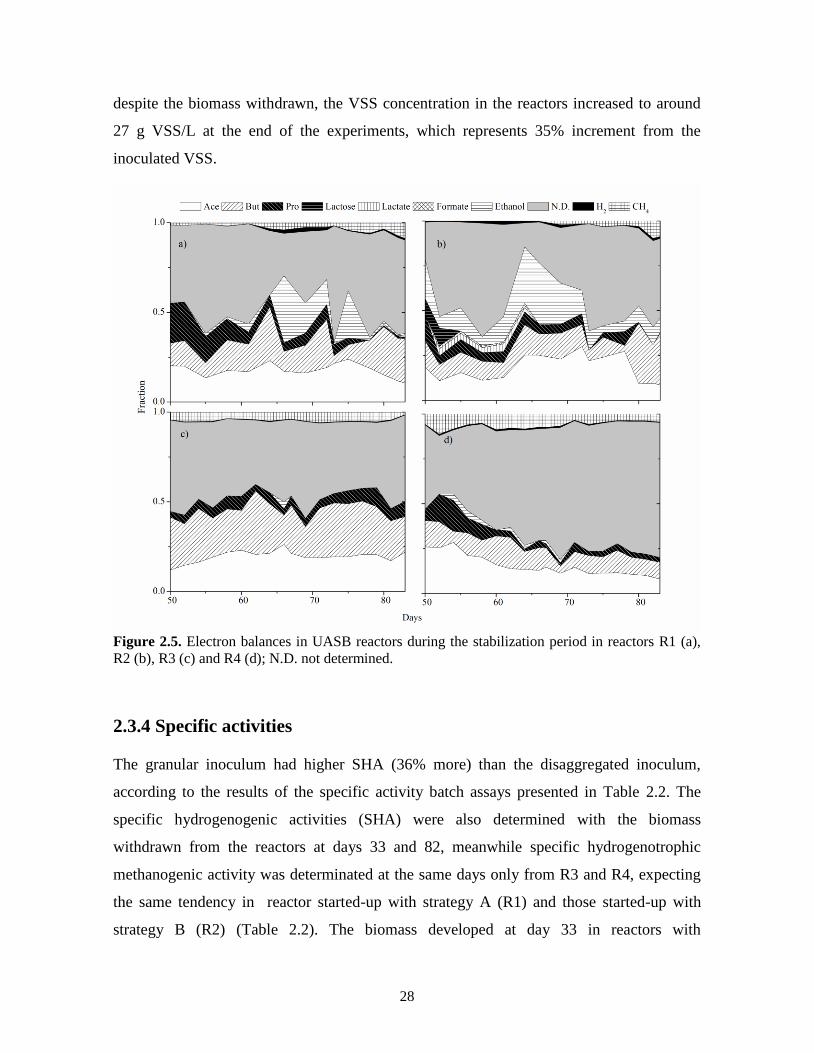
28
despite the biomass withdrawn, the VSS concentration in the reactors increased to around
27 g VSS/L at the end of the experiments, which represents 35% increment from the
inoculated VSS.
Figure 2.5. Electron balances in UASB reactors during the stabilization period in reactors R1 (a),
R2 (b), R3 (c) and R4 (d); N.D. not determined.
2.3.4 Specific activities
The granular inoculum had higher SHA (36% more) than the disaggregated inoculum,
according to the results of the specific activity batch assays presented in Table 2.2. The
specific hydrogenogenic activities (SHA) were also determined with the biomass
withdrawn from the reactors at days 33 and 82, meanwhile specific hydrogenotrophic
methanogenic activity was determinated at the same days only from R3 and R4, expecting
the same tendency in reactor started-up with strategy A (R1) and those started-up with
strategy B (R2) (Table 2.2). The biomass developed at day 33 in reactors with

29
disaggregated inoculum (R1 and R2) had lower SHA (57 to 65% decrement) compared to
the inoculum. However, those values increased at day 82, in particular in R2 the SHA
reached similar hydrogenogenic activity (1469.7 mL H2/g VS-d) to the inoculum. In
contrast, the SHA of R3 and R4 at day 82 diminished 90 and 60%, respectively compared
to the SHA of the granular inoculum, hydrogen yields were also lower than the obtained in
the granular inoculum, most probably as a consequence of the considerable
hydrogenotrophic methanogenic activity detected in R3 and R4.
The SHMA increased over time in R3 and R4 from 26 mL CH4/ g VS-d in the granular
inoculum, to 69.2 and 113 mL CH4/ g VS-d in R3 and R4, respectively. This increment in
the hydrogenotrophic methanogenic activity is clearly reflected in R4 performance (Fig.
2.2d), where even at a constant OLR the volumetric methane production rate (VMPR)
increased gradually. During the SHMA batch assays, acetate was not produced indicating
the absence of homoacetogenic activity; when bromoethanesulfonate, a specific
methanogenic inhibitor (Ryan et al., 2008), was added, neither methane nor acetate
production was detected. Besides the SHMA assay, an acetoclastic methanogenic activity
batch assay was carried out during 30 days of incubation (data not shown), and no methane
production was detected neither with the granular inoculum nor with the biomass
withdrawn from R3 and R4 at day 82. These results indicate that hydrogenotrophic
methanogenic activity was not inhibited and was the main reason for the low hydrogen
production in R3 and R4 and possibly in R1 and R2 also, due to the same inoculum source
and the heat treatment applied. Similarly Kim et al. (2004), using a stoichiometric analysis,
proposed that methane produced in a semi-continuous hydrogenogenic reactor was due to
the hydrogen consumption at pH of 4.5; in our study the hydrogenogenic activity was
evaluated through activity batch tests from the reactors biomass that were operated at pH
5.9 and 5.5 during days 33 and 82, respectively; the tolerance of hydrogen consuming
methanogens at acidic pH has been observed previously in natural environments (Horn et
al., 2003).
The lower SHA results and the different metabolites concentration from the reactor biomass
at day 33 compared to their respective inocula (Table 2.2), indicated that a biomass wash-
out occurred during the start-up period. In R1 and R2, at day 82 the main metabolic
products in both reactors were acetate, propionate and butyrate at similar concentrations,
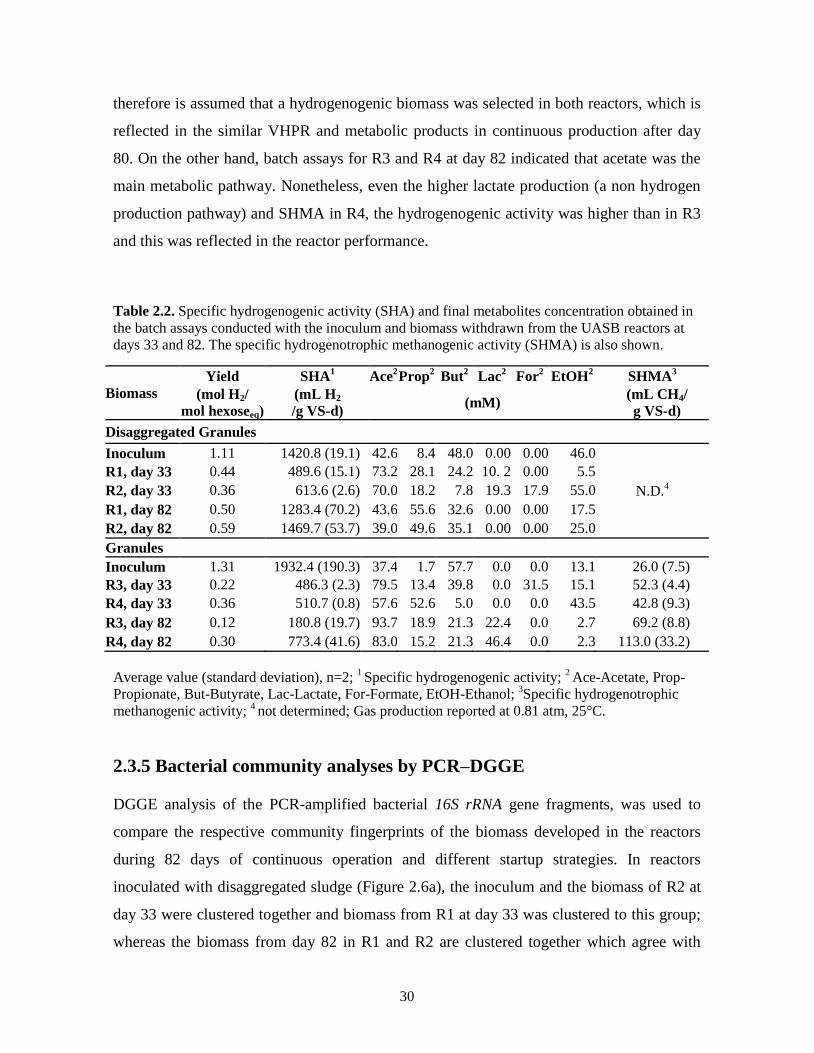
30
therefore is assumed that a hydrogenogenic biomass was selected in both reactors, which is
reflected in the similar VHPR and metabolic products in continuous production after day
80. On the other hand, batch assays for R3 and R4 at day 82 indicated that acetate was the
main metabolic pathway. Nonetheless, even the higher lactate production (a non hydrogen
production pathway) and SHMA in R4, the hydrogenogenic activity was higher than in R3
and this was reflected in the reactor performance.
Table 2.2. Specific hydrogenogenic activity (SHA) and final metabolites concentration obtained in
the batch assays conducted with the inoculum and biomass withdrawn from the UASB reactors at
days 33 and 82. The specific hydrogenotrophic methanogenic activity (SHMA) is also shown.
Biomass
Yield SHA1
Ace2 Prop
2 But
2 Lac
2 For
2 EtOH
2 SHMA
3
(mol H2/
mol hexoseeq)
(mL H2
/g VS-d) (mM)
(mL CH4/
g VS-d)
Disaggregated Granules
Inoculum 1.11 1420.8 (19.1) 42.6 8.4 48.0 0.00 0.00 46.0
N.D.4
R1, day 33 0.44 489.6 (15.1) 73.2 28.1 24.2 10. 2 0.00 5.5
R2, day 33 0.36 613.6 (2.6) 70.0 18.2 7.8 19.3 17.9 55.0
R1, day 82 0.50 1283.4 (70.2) 43.6 55.6 32.6 0.00 0.00 17.5
R2, day 82 0.59 1469.7 (53.7) 39.0 49.6 35.1 0.00 0.00 25.0
Granules
Inoculum 1.31 1932.4 (190.3) 37.4 1.7 57.7 0.0 0.0 13.1 26.0 (7.5)
R3, day 33 0.22 486.3 (2.3) 79.5 13.4 39.8 0.0 31.5 15.1 52.3 (4.4)
R4, day 33 0.36 510.7 (0.8) 57.6 52.6 5.0 0.0 0.0 43.5 42.8 (9.3)
R3, day 82 0.12 180.8 (19.7) 93.7 18.9 21.3 22.4 0.0 2.7 69.2 (8.8)
R4, day 82 0.30 773.4 (41.6) 83.0 15.2 21.3 46.4 0.0 2.3 113.0 (33.2)
Average value (standard deviation), n=2; 1 Specific hydrogenogenic activity;
2 Ace-Acetate, Prop-
Propionate, But-Butyrate, Lac-Lactate, For-Formate, EtOH-Ethanol; 3Specific hydrogenotrophic
methanogenic activity; 4 not determined; Gas production reported at 0.81 atm, 25°C.
2.3.5 Bacterial community analyses by PCR–DGGE
DGGE analysis of the PCR-amplified bacterial 16S rRNA gene fragments, was used to
compare the respective community fingerprints of the biomass developed in the reactors
during 82 days of continuous operation and different startup strategies. In reactors
inoculated with disaggregated sludge (Figure 2.6a), the inoculum and the biomass of R2 at
day 33 were clustered together and biomass from R1 at day 33 was clustered to this group;
whereas the biomass from day 82 in R1 and R2 are clustered together which agree with

31
their similar SHA. Even though the SHA results from R1 and R2 (day 82) show a similar
potential than the inoculum (Table 2.2), the bacterial DGGE fingerprint showed a different
community selection over the operation time. Therefore, the reactor operation time was
determinant for the bacterial community selection, more than start-up strategies A and B in
these reactors (R1 and R2).
Figure 2.6. Bacterial DGGE community fingerprints and corresponding similarity dendrograms and
indexes from reactor inoculated with disaggregated sludge (a) and granular sludge (b). I
corresponds to inoculum samples; I-1, I-2 and I-3 corresponds to heat treated inoculum 1, 2 or 3
times; R1-R4 corresponds to the reactors and the operation day of each sample 33 or 82. A, B and C
are the sequenced bands.
Figure 2.6b shows the DGGE fingerprint from the reactors inoculated with granular sludge,
in this case the communities developed at day 33 with start-up strategy A or B (R3 and R4)
were 96 % similar, and were clustered to the DGGE fingerprint of R3 at day 82. Whereas
the bacterial community from R4 at day 82 was clustered separately from all the samples,
unlike to reactors with disaggregated inoculum. According to this result, in reactors with
granular inoculum the start-up strategy and the reactor operation during 82 days were
determinant in the bacterial community selection, which agree with the difference in the
SHA assays at day 82 (Table 2.2, R3 and R4) and the reactor performance (Figure 2.2c and
d). Although the methanogenic community was not monitored in the present work, the
DGGE fingerprint cluster analysis can be associated to the SHA results.
The DNA retrieved from the bands A, B and C shown in Figure 2.6b were amplified and
sequenced (Table 2.3). The sequences of bands B and C were similar to sequences of the
genus Clostridium (93 and 97% identity), were found during all operation time of R3 and
R4 as was expected due to metabolites produced, since butyrate and acetate were the main

32
products (Davila-Vazquez et al., 2009). The sequence of band A was closely related to the
sequence of Lactobacillus casei BD-1 (98% identity), present in R3 and R4 at day 33, and
only present in R4 at day 82. Band A was not found in R3 at day 82 which pointed out a
probable wash-out of Lactobacillus from R3. Microorganisms of this genus have been
related previously to hydrogen producing reactors fed with dairy effluents (Castello et al.,
2009), producing lactate by fermentation of sugars (Kandler and Weiss, 1986) which was
only detected in reactors started-up with the strategy B (R2 and R4).
Table 2.3. Affiliation of the DGGE fragments showing the highest percentage of identity in the
output result from the analysis in the non-redundant nucleotide database from NCBI using the
BLAST program.
Band Closest relative Gen bank accession
number
Percentage of identity
against GenBank database
A Lactobacillus casei BD-I CP002618.1 98
B Clostridium sp. FJ805840.2 93
C Clostridium ramosum HM245949.1 97
2.4 Conclusions
The start-up strategy had no effect in the bacterial community in reactors inoculated with
disaggregated sludge according to the cluster analysis, unlike to those inoculated with
granular sludge.
Based on the similar performance of the UASB reactors R1, R2 and R4 in the last 14 days
of the experiments, it can be concluded that the start-up strategies applied selected a
hydrogen producing biomass. Nonetheless, judging by the SHA batch assays results, the
strategy B produced a more active biomass and it can be considered that keeping a constant
OLR and decreasing gradually the HRT is a suitable strategy for the development of a
hydrogen producing microbial community in reactors fed with cheese whey.
Considering the inoculum structure, the disaggregated inoculum produced a more active
hydrogenogenic biomass, but not granule formation was observed during the operational
period. In order to conserve the granular structure and due to the stable reactor
performance, the strategy used in R4 can be the most promising if the methanogenic
33
activity can be controlled. The pH decrease from 5.9 to 5.5 did not cause a reduction in the
methanogenic activity. Although hydrogen was not the main product in the gas, the
experiments showed a high hydrogenogenic potential because the methane detected in the
reactors was produced from hydrogen, at a ratio of 1 mol of methane per 4 mol of hydrogen
consumed. The challenge now, is to identify the operational parameters to block the
hydrogenotrophic methanogenic activity, or to use more aggressive inoculum treatments.
2.5 References
Akutsu Y, Li YY, Tandukar M, Kubota K, Harada H. 2008. Effects of seed sludge on fermentative
characteristics and microbial community structures in thermophilic hydrogen fermentation of
starch. Int J Hydrogen Energy 33:6541–6548.
APHA/AWWA/WFE. 2005. Standard methods for the examination of water and wastewater. 21th
edn, Washington DC, USA.
Argun H, Kargi F. 2009. Effects of sludge pre-treatment method on bio-hydrogen production by
dark fermentation of waste ground wheat. Int J Hydrog Energy 34:8543–8548.
Baghchehsaraee B, Nakhla G, Karamanev D, Margaritis A. 2010. Fermentative hydrogen
production by diverse microflora. Int J Hydrogen Energy 35:5021–5027.
Castello E, García y Santos C, Iglesias T, Paolino G, Wenzelb J, Borzacconia L, Etchebehereb C.
2009. Feasibility of biohydrogen production from cheese whey using a UASB reactor: Links
between microbial community and reactor performance. Int J Hydrogen Energy 34:5674–
5682.
Chang FY, Lin CY. 2004. Biohydrogen production using an up-flow anaerobic sludge blanket
reactor. Int J Hydrogen Energy 29:33–39.
Chen CC, Lin CY, Chang JS. 2001. Kinetics of hydrogen production with continuous anaerobic
cultures utilizing sucrose as the limiting substrate. Appl Environ Microbiol 57:56–64.
Cresson R, Escudié R, Steyer JP, Delgenès JP, Bernet N. 2008. Competition between planktonic
and fixed microorganisms during the start-up of methanogenic biofilm reactors. Water Res
42:792–800.
Davila-Vazquez G, Cota-Navarro CB, Rosales-Colunga LM, De León-Rodríguez A, Razo-Flores E.
2009. Continuous biohydrogen production using cheese whey: Improving the hydrogen
production rate. Int J Hydrogen Energy 34:4296–4304.
Davila-Vazquez G, Alatriste-Mondragón F, De León-Rodríguez A, Razo-Flores E. 2008a.
Fermentative hydrogen production in batch experiments using lactose, cheese whey and
glucose: Influence of initial substrate concentration and pH. Int J Hydrogen Energy 33:4989
– 4997.
Davila-Vazquez G, Arriaga S, Alatriste-Mondragón F, De León-Rodríguez A, Rosales-Colunga
LM, Razo-Flores E. 2008b. Fermentative biohydrogen production: trends and perspectives.
Rev Environ Sci Biotechnol 7:27–45.
Dinamarca C, Bakke R. 2009. Apparent hydrogen consumption in acid reactors: observations and
implications. Water Sci Technol 59:1441–1447.
Guimaraes PMR, Teixeira JA, Domingues L. 2010. Fermentation of lactose to bio-ethanol by yeasts
as part of integrated solutions for the valorisation of cheese whey. Biotechnol Adv 28:375–84.
34
Guo WQ, Ren NQ, Wang XJ, Xiang WS, Meng ZH, Ding J, Qu YY, Zhang LS. 2008. Biohydrogen
production from ethanol-type fermentation of molasses in an expanded granular sludge bed
(EGSB) reactor. Int J Hydrogen Energy 33:4981–4988.
Hallenbeck PC. 2009. Fermentative hydrogen production: Principles, progress, and prognosis. Int J
Hydrogen Energy 34:7379–7389.
Hawkes FR, Hussy I, Kyazze G, Dinsdale R, Hawkes DL. 2007. Continuous dark fermentative
hydrogen production by mesophilic microflora: Principles and progress. Int J Hydrogen
Energy 32:172–184.
Horn MA, Matthies C, Kusel K, Schramm A, Drake HL. 2003. Hydrogenotrophic methanogenesis
by moderately acid-tolerant methanogens of a methane-emitting acidic peat. Appl Environ
Microbiol 69:74–83.
Hu B, Chen SL. 2007. Pretreatment of methanogenic granules for immobilized hydrogen
fermentation. Int J Hydrogen Energy 32:3266–3273.
Kandler O, Weiss N. 1986. Genus Lactobacillus. In: Sneath PHA, Mair NS, Sharpe ME, Holt JG,
editors. Bergey’s manual of systematic bacteriology, vol. 2. Baltimore: Williams & Wilkins;
1209-34 p.
Kapdan IK, Kargi F. 2006. Bio-hydrogen production from waste materials. Enzyme Microb Tech
38:569–582.
Khanal SK, Chen W-H, Li L, Sung S. 2006. Biohydrogen Production in Continuous-Flow Reactor
Using Mixed Microbial Culture. Water Environ Res 78:110–117.
Kim IS, Hwang MH, Jang NJ, Hyun SHSH, Lee ST. 2004. Effect of low pH on the activity of
hydrogen utilizing methanogen in bio-hydrogen process. Int J Hydrogen Energy 29:1133–
1140.
Kotsopoulos TA, Zeng RJ, Angelidaki I. 2006. Biohydrogen production in granular up-flow
anaerobic sludge blanket (UASB) reactors with mixed cultures under hyper-thermophilic
temperature (70 degrees C). Biotechnol Bioeng 94:296–302.
Lee HS, Rittmann BE. 2009. Evaluation of Metabolism Using Stoichiometry in Fermentative
Biohydrogen. Biotechnol Bioeng 102:749–758.
Liu Y, Xu HL, Show KY, Tay JH. 2002. Anaerobic granulation technology for wastewater
treatment. World J Microbiol Biotechnol 18:99–113.
Mohan SV, Mohanakrishna G, Reddy SS, Raju BD, Rao KSR, Sarma PN. 2008. Self-
immobilization of acidogenic mixed consortia on mesoporous material (SBA-15) and
activated carbon to enhance fermentative hydrogen production. Int J Hydrogen Energy
33:6133–6142.
Mu Y, Yu HQ. 2006. Biological hydrogen production in a UASB reactor with granules. I:
Physicochemical characteristics of hydrogen-producing granules. Biotechnol Bioeng 94:980–
987.
Ryan P, Forbes C, Colleran E. 2008. Investigation of the diversity of homoacetogenic bacteria in
mesophilic and thermophilic anaerobic sludges using the formyltetrahydrofolate synthetase
gene. Water Sci Technol 57:675–680.
Schäfer H, Muyzer G. 2001. Denaturing gradient gel electrophoresis in marine microbial ecology.
In: Paul John, editor. Methods in microbiology, vol. 30. London: Academic Press 425-68 p.
Taconi KA, Zappi ME, French WT, Brown LR. 2008. Methanogenesis under acidic pH conditions
in a semi-continuous reactor system. Bioresour Technol 99:8075–8081.
Wang JL, Wan W. 2008. Comparison of different pretreatment methods for enriching hydrogen-
producing bacteria from digested sludge. Int J Hydrogen Energy 33:2934–2941.
Wang Y, Mu Y, Yu HQ. 2007. Comparative performance of two upflow anaerobic biohydrogen-
producing reactors seeded with different sludges. Int J Hydrogen Energy 32:1086–1094.
Wong BT, Show KY, Su A, Wong RJ, Lee DJ. 2008. Effect of volatile fatty acid composition on
upflow anaerobic sludge blanket (UASB) performance. Energy Fuels 22:108–112.
35
Zhang ZP, Show KY, Tay JH, Liang DT, Lee DJ. 2008. Biohydrogen production with anaerobic
fluidized bed reactors - A comparison of biofilm-based and granule-based systems. Int J
Hydrogen Energy 33:1559–1564.
Zhang ZP, Show KY, Tay JH, Liang DT, Lee DJ, Jiang WJ. 2007. Rapid formation of hydrogen-
producing granules in an anaerobic continuous stirred tank reactor induced by acid
incubation. Biotechnol Bioeng 96:1040–1050.
Zhao BH, Yue ZB, Zhao QB, Mu Y, Yu HQ, Harada H, Li YY. 2008. Optimization of hydrogen
production in a granule-based UASB reactor. Int J Hydrogen Energy 33:2454–2461.
36
Chapter 3
Decreasing methane production in hydrogenogenic UASB reactors
Summary
One of the problems in fermentative hydrogen producing reactors, inoculated with pre-
treated anaerobic granular sludge, is the eventual methane production by hydrogen
consuming methanogens. In this study, strategies such as reduction of pH and HRT, organic
shock loads and repeated biomass heat treatment were applied to hydrogenogenic UASB
reactors that showed methane production after certain time of continuous operation
(between 10 and 60 days). The reduction of pH to 4.5 not only decreased methane
production but also hydrogen production. Organic shock load (from 20 to 30 g COD/L d)
was the more effective strategy to decrease the methane production rate (75%) and to
increase the hydrogen production rate (172%), without stopping reactor operation.
Repeated heat treatment of the granular sludge was the only strategy that inhibited
completely methane production, leading to high volumetric hydrogen production rates (1.67
L H2/L-d). However this strategy required stopping reactor operation; in addition
homoacetogenesis, another hydrogen consuming pathway, was not completely inhibited.
This work demonstrated that it was possible to control the methane production in hydrogen
producing reactors using operational strategies.
37
3.1 Introduction
The environmental impacts derived from the use of fossil fuels, such as climate change and
the finite reserves of these fuels, drive a search for renewable and carbon neutral energy
sources. The production of hydrogen by dark fermentation from biomass is a sustainable
alternative because organic residues and wastewater can be used, turning a pollution
problem into an energy resource; moreover, H2 has the highest energy content compared
with any fuel and it can be used directly in fuel cells to produce electricity (Das and
Veziroglu, 2008; Davila-Vazquez et al., 2008b; Rittmann, 2008).
Wastes with high content of biodegradable carbohydrates are potential feedstocks for
fermentative hydrogen production, such as dairy industry effluents (Kapdan and Kargi,
2006). Annually, the cheese industry produces over 160 million tons of cheese whey
(Guimaraes et al., 2010), in its dried form this by-product contains around 70% of lactose
and has been used successfully for hydrogen production (Castello et al., 2009; Davila-
Vazquez et al., 2009).
Continuous hydrogen producing reactors are usually inoculated by a complex consortium
from an anaerobic reactor, the inoculum receives a treatment to select hydrogen producing
bacteria and eliminate hydrogen consuming microorganisms (Castello et al., 2009). In such
continuous reactors the biohydrogen yield and production rates achieved, depend on
different operational factors such as pH, hydraulic retention time (HRT), solids retention
time, and organic loading rate (OLR) among others (Buitrón and Carvajal, 2010; Chen et
al., 2009; Davila-Vazquez et al., 2009). Frequently, in high cell density reactors, such as the
upflow anaerobic sludge bed (UASB), the inoculum treatment is not enough to eliminate
undesired microorganisms and eventually methane is produced. Part of the available
electrons are directed to methane production lowering significantly the hydrogen
productivity (Carrillo-Reyes et al., 2012; Castello et al., 2009). Methane production in
UASB reactors may start several days or weeks after the reactor start-up (Carrillo-Reyes et
al., 2012; Castello et al., 2009; Spagni et al., 2010). Different causes contribute to methane
occurrence, such as operating the reactor at a pH near to neutrality (6-7) (Wang et al.,
2007), a long solids retention time (Castello et al., 2009) and deficient inoculum
38
pretreatments that do not eliminate completely the methanogenic community (Argun and
Kargi, 2009).
According to (Wang et al., 2007) the pH is a parameter that can determinate the methane
production in hydrogenogenic UASB reactors. At pH value of 5 and lower they did not find
any methane production, having the highest hydrogen production rate at pH 4 (127 ± 9 mL
H2/L-h). Whereas, Castello et al. (2009) operated a UASB reactor at an average pH value of
5 during 200 days, methane being the main component in the biogas (6-20 % methane and
less than 1 % hydrogen) even though they started-up the reactor at pH 3.3.
Previous works in methanogenic reactors have shown that organic shock loads create an
imbalance accumulating volatile fatty acids (VFA), increasing the hydrogen partial pressure
and diminishing or even eliminating the methane production (CordRuwisch et al., 1997).
This strategy has been proved in hydrogenogenic UASB reactors to reduce the methane
production, increasing the OLR from 7.6 to 12.7, 25.5 and finally to 38.2 g COD/L-d
(Spagni et al., 2010). Although the two lowest OLR values were kept only during 5 days,
methane started to be produced and it did not ceased completely at the highest OLR values
tested. Therefore, it is important to evaluate the organic shock load effect in
hydrogenogenic reactors with a more stable microbial community where methane has been
produced for longer periods of time.
The inoculum pretreatment selects hydrogen producing bacteria using its sporulation
capability when facing unfavorable growth conditions, eliminating microorganisms that do
not form endospores like methanogens (Duangmanee et al., 2007). Different inoculum
pretreatments have been evaluated, being heat treatment the most commonly used (Akutsu
et al., 2009; Hu and Chen, 2007). The efficiency of this pretreatment is influenced by the
biomass structure. Hu and Chen (Hu and Chen, 2007) demonstrated that heat treatment was
more effective to inhibit methanogenesis in a flocculent biomass than in a granular
biomass. Recently, Duangmanee et al. (Duangmanee et al., 2007) applied repeated heat
treatments to the recirculated biomass in a completely mixed reactor, favoring the stability
of hydrogen production.
The above results show different approaches and some contrasting results in order to avoid
methane production in hydrogenogenic reactors. Therefore, the aim of this work was to
39
evaluate systematically different strategies to inhibit the methanogenic activity in
hydrogenogenic UASB reactors that had been in operation for extended periods of time.
The strategies included operational conditions (pH, OLR and hydraulic retention time) and
repeated heat treatment to the biomass. The reactors performance was evaluated through
volumetric hydrogen and methane production rates, metabolites produced as well as
hydrogenogenic and methanogenic specific activities.
3.2. Materials and Methods
3.2.1 Substrate and seed sludge
Cheese whey powder (CWP) solution was used as a synthetic dairy wastewater. The CWP
was purchased from Grande Custom Ingredients Group (Wisconsin, USA). The soluble
lactose content of CWP was 75.5% with 11.5% protein (w/w). An initial stock solution of
100 g CWP/L was centrifuged 10 minutes at 13000 rpm to remove insoluble material. After
that, soluble chemical oxygen demand (COD) was determined. The medium contained a
known amount of CWP-COD and was supplemented with (mg/L): NH4H2PO4, 4500;
K2HPO4, 125; MgCl2·6H2O, 100; ZnCl2, 75; FeSO4·6H2O, 25; MnSO4·7H2O, 15;
Na2MoO4·2H2O, 12.5; CuSO4·5H2O, 5; CoCl2·8H2O, 3. Additional Na2HPO4 was added to
increase the buffer capacity of the medium and controlling the pH at the desired value.
The original seed sludge was collected from a full-scale methanogenic UASB reactor
treating wastewater from a confectionery factory in San Luis Potosí, México. The sludge
received a heat treatment (boiled during 1 hour) and was inoculated in different lab scale
hydrogenogenic UASB reactors (working volumes between 0.47 and 1.3 L) to reach
volatile suspended solids (VSS) concentration from 13 to 20 g VVS/L. The reactors were
fed with CWP as substrate and operated during extended periods of time where, eventually,
methane started to be produced concomitantly with hydrogen, for periods not less than 20
days before the present experiments were performed.
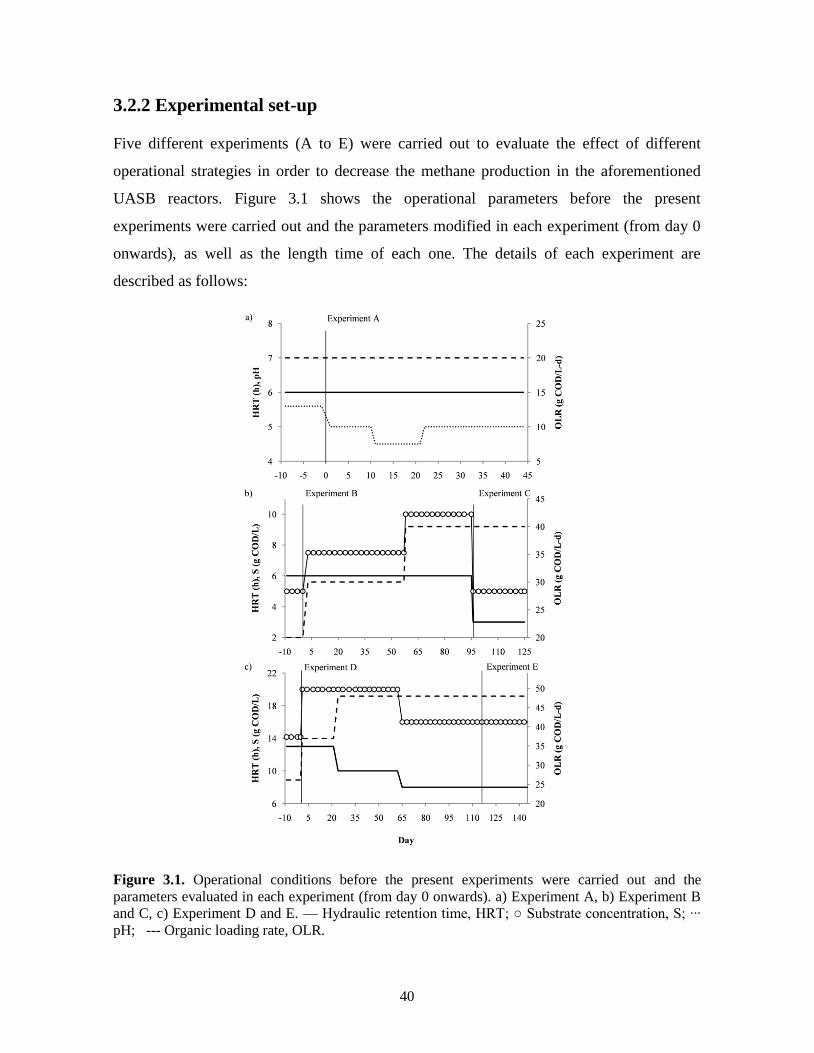
40
3.2.2 Experimental set-up
Five different experiments (A to E) were carried out to evaluate the effect of different
operational strategies in order to decrease the methane production in the aforementioned
UASB reactors. Figure 3.1 shows the operational parameters before the present
experiments were carried out and the parameters modified in each experiment (from day 0
onwards), as well as the length time of each one. The details of each experiment are
described as follows:
Figure 3.1. Operational conditions before the present experiments were carried out and the
parameters evaluated in each experiment (from day 0 onwards). a) Experiment A, b) Experiment B
and C, c) Experiment D and E. — Hydraulic retention time, HRT; ○ Substrate concentration, S; ∙∙∙
pH; --- Organic loading rate, OLR.
41
Experiment A: the effect of pH reduction was tested by decreasing the reactor pH from 5.63
to 5.0 and 4.5, and reestablishing the pH again to 5.0. OLR and HRT were kept at 20 g
COD/L-d and 6 h respectively (Figure 3.1a).
Experiment B: the effect of the organic shock load was tested by increasing the OLR from
20 to 30 and finally to 40 g COD/L-d. The OLR was increased by incrementing the COD
influent concentration while the HRT was kept constant at 6 h (Figure 3.1b).
Experiment C: the effect of the organic shock load was further tested by operating at the
previous OLR (40 g COD/L-d), but by means of decreasing both the HRT and the COD
influent concentration (Figure 3.1b).
Experiment D: the effect of the organic shock load was also tested in this experiment by
increasing the OLR from 26 to 37 by means of raising the COD concentration in the
influent at constant HRT (13 h). Afterwards the OLR was increased up to 48 g COD/L-d by
decreasing the HRT to 10. Then the HRT was further decreased to 8 h, while reducing the
COD concentration in the influent in order to maintain an OLR of 48 g COD/L-d (Figure
3.1c).
Experiment E: the granules of the experiment D were harvested, heat treated (boiled 1 hour)
and re-inoculated to evaluate the effect of a second heat treatment, keeping the same
operational parameters applied in the last stage of experiment D (Figure 3.1c).
The pH in the reactors during experiments B to E was 5.3 - 5.5.
3.2.3 Batch activity assays
The specific hydrogenogenic and methanogenic activities were carried out in batch tests
using sludge withdrawn from the UASB reactors during experiments A to E. Table 3.1
shows the specific operational conditions and days where the sludge was sampled. All
batch activity assays were carried out at 35 °C under agitation at 120 rpm.
Specific hydrogenogenic activity (SHA). SHA measurements were performed in duplicate
in 120 mL glass serum bottles sealed with rubber septa according to the method described
by Davila-Vazquez et al. (Davila-Vazquez et al., 2008a), at an initial pH value of 7.5. Each

42
serum bottle was inoculated with 4.5 g VSS/L and CWP was used as substrate at a
concentration of 25 g COD/L. The SHA was calculated dividing the maximum hydrogen
production rate by the VSS concentration.
Specific hydrogenotrophic methanogenic activity (SHMA). SHMA was measured in
duplicate using 160 mL glass serum bottles, with 80 mL of working volume and 80 mL of
headspace. Each serum bottle was inoculated with 4.5 g VSS/L and the headspace was
displaced with a mixture of H2/CO2 (80/20 %). The pressure of the headspace was
measured periodically during 5 days, calculating the stoichiometric methane production
according to reaction 3.1:
4H2 + CO2 → CH4 + 2H2O (3.1)
3.2.4 Analytical methods
Hydrogen, CH4 and CO2 were measured using a 1.0 mL Pressure-Lok® syringe (Valco
Instruments, Houston, Texas, USA) by comparing a 500 μL sample from the reactors and
serum bottles headspace with high purity standards (Alltech, Deerfield, Illinois, USA) in a
gas chromatograph (GC, 6890N Network GC System, Agilent Technologies, Waldbronn,
Germany) equipped with a thermal conductivity detector. The column used was a Hayesep
D (Alltech, Deerfield, Illinois, USA) with the following dimensions: 10´ x 1/8’’x 0.085‖.
Temperatures of the injection port, oven and the detector were 250, 60 and 250ºC,
respectively. Nitrogen was used as carrier gas with a flow-rate of 12 mL/min. Pressure of
the headspace from the hydrogenotrophic SHMA assays was measured with a manometer
(Model 407910, Extech Instruments Corporation, Massachusetts, USA). Lactose, VFA, and
ethanol were analyzed as previously described (Davila-Vazquez et al., 2008a). COD and
VSS were analyzed according to Standard Methods (APHA/AWWA/WFE, 2005). All gas
measurements are shown at standard conditions (273.15 K and 1 atm).

43
3.3 Results and Discussion
In this study, five different strategies to diminish the methane production in
hydrogenogenic UASB reactors were evaluated. Figures 3.2 to 3.4 show the volumetric
hydrogen and methane production rates and the metabolites concentration produced.
To evaluate the biomass activity, SHA and SHMA batch test were carried out at different
operational conditions using biomass withdrawn for the reactors and the results are
presented in Table 3.1. The acetoclastic methanogenic activity was also evaluated in the
biomass from the experiment C and, after more than 30 days of incubation, no methane
production was measured (results not shown); therefore it was assumed that only
hydrogenotrophic methanogenic activity was present in all experiments.
3.3.1 Evaluation of the pH reduction effect
The first condition evaluated in experiment A was the pH reduction from 5.63 to 5. The
total gas production (H2 + CH4 + CO2) at pH 5 was rather similar to the production at pH
5.63, slightly increasing from 1.58 ± 0.51 to 1.69 ± 0.41 L/L-d. Even though the volumetric
methane production rate (VMPR) varied from 0.26 ± 0.10 to 0.30 ± 0.06 L/L-d, the
volumetric hydrogen production rate (VHPR) decreased from 0.51 to 0.31 L/L-d (Figure
3.2a).
When the pH was further decreased to 4.5 the total gas production diminished abruptly,
with average values of 0.49 ± 0.29 L/L-d increasing the methane concentration. Due to the
variation in the total gas and methane production, the pH was adjusted again to 5 (Figure
3.2a). This last pH change resulted in similar VHPR and VMPR compared to the previous
condition at pH 5.
In this work the strategy of reducing the pH to 5.0 to avoid methane production was not
efficient, unlike the findings reported by Wang et al. (2007), where pH 5 was enough to
control the methane production. This was due probably to methanogens acclimatization to
such low pH (Taconi et al., 2008). Additionally, contrary to the work reported by Yu and
Mu (2006), reducing the pH to 4.5 did not favor hydrogen production and even caused a
sharp drop in the total gas production. Similar results were found by Taconi et al. (2008),

44
operating a methanogenic reactor where low production rates were reported at pH between
4.7 and 5.0.
Figure 3.2. Volumetric production rates (a) and metabolites produced (b) at each condition of
Experiment A (effect of pH reduction).
However a noticeable effect of the pH decrease was the change in the metabolic pathways
(Figure 3.2b). Before pH was diminished to 5, the acetate concentration was higher than 15
mM in the reactor and during all the conditions of experiment A its concentration was kept
between 7 and 15 mM. When pH was lowered from 5.6 to 5.0 the butyrate production
increased reaching similar concentrations than acetate during the experiment. Propionate
increased during the operation at pH 4.5, which corresponds to the low hydrogen
production, as has been reported before (Lee and Rittmann, 2009).
The acetate-butyrate pathway has been reported as a hydrogen producer one (Davila-
Vazquez et al., 2008a), although hydrogen production did not correspond to the metabolites
concentration, which is explained by the hydrogen consumption by methanogens, as was
previously proposed by Kim et al. (2004) for hydrogenogenic reactors using a
stoichiometric balance. In this sense, Horn et al. (2003) showed that in natural acidic
systems like peats, methane is only produced by hydrogenotrophic methanogens at pH 4.4,
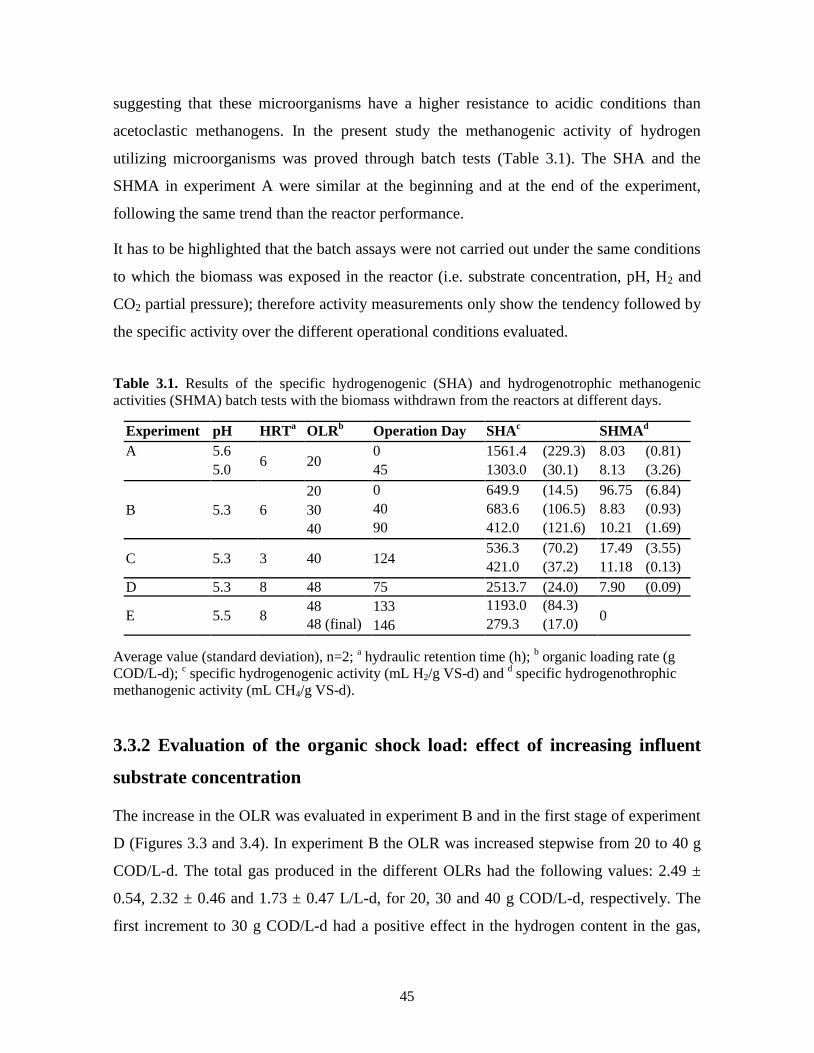
45
suggesting that these microorganisms have a higher resistance to acidic conditions than
acetoclastic methanogens. In the present study the methanogenic activity of hydrogen
utilizing microorganisms was proved through batch tests (Table 3.1). The SHA and the
SHMA in experiment A were similar at the beginning and at the end of the experiment,
following the same trend than the reactor performance.
It has to be highlighted that the batch assays were not carried out under the same conditions
to which the biomass was exposed in the reactor (i.e. substrate concentration, pH, H2 and
CO2 partial pressure); therefore activity measurements only show the tendency followed by
the specific activity over the different operational conditions evaluated.
Table 3.1. Results of the specific hydrogenogenic (SHA) and hydrogenotrophic methanogenic
activities (SHMA) batch tests with the biomass withdrawn from the reactors at different days.
Experiment pH HRTa OLR
b Operation Day SHA
c SHMA
d
A 5.6 6 20
0 1561.4 (229.3) 8.03 (0.81)
5.0 45 1303.0 (30.1) 8.13 (3.26)
B 5.3 6
20 0 649.9 (14.5) 96.75 (6.84)
30 40 683.6 (106.5) 8.83 (0.93)
40 90 412.0 (121.6) 10.21 (1.69)
C 5.3 3 40 124 536.3 (70.2) 17.49 (3.55)
421.0 (37.2) 11.18 (0.13)
D 5.3 8 48 75 2513.7 (24.0) 7.90 (0.09)
E 5.5 8 48 133 1193.0 (84.3)
0 48 (final) 146 279.3 (17.0)
Average value (standard deviation), n=2; a hydraulic retention time (h);
b organic loading rate (g
COD/L-d); c specific hydrogenogenic activity (mL H2/g VS-d) and
d specific hydrogenothrophic
methanogenic activity (mL CH4/g VS-d).
3.3.2 Evaluation of the organic shock load: effect of increasing influent
substrate concentration
The increase in the OLR was evaluated in experiment B and in the first stage of experiment
D (Figures 3.3 and 3.4). In experiment B the OLR was increased stepwise from 20 to 40 g
COD/L-d. The total gas produced in the different OLRs had the following values: 2.49 ±
0.54, 2.32 ± 0.46 and 1.73 ± 0.47 L/L-d, for 20, 30 and 40 g COD/L-d, respectively. The
first increment to 30 g COD/L-d had a positive effect in the hydrogen content in the gas,
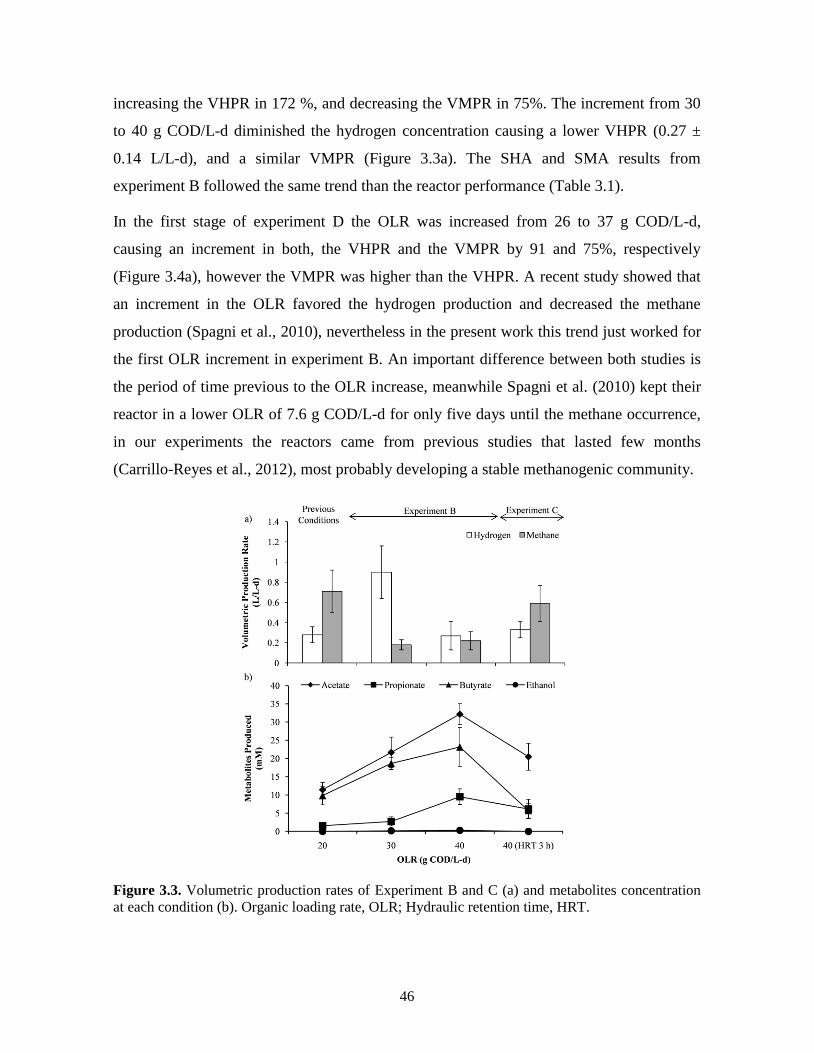
46
increasing the VHPR in 172 %, and decreasing the VMPR in 75%. The increment from 30
to 40 g COD/L-d diminished the hydrogen concentration causing a lower VHPR (0.27 ±
0.14 L/L-d), and a similar VMPR (Figure 3.3a). The SHA and SMA results from
experiment B followed the same trend than the reactor performance (Table 3.1).
In the first stage of experiment D the OLR was increased from 26 to 37 g COD/L-d,
causing an increment in both, the VHPR and the VMPR by 91 and 75%, respectively
(Figure 3.4a), however the VMPR was higher than the VHPR. A recent study showed that
an increment in the OLR favored the hydrogen production and decreased the methane
production (Spagni et al., 2010), nevertheless in the present work this trend just worked for
the first OLR increment in experiment B. An important difference between both studies is
the period of time previous to the OLR increase, meanwhile Spagni et al. (2010) kept their
reactor in a lower OLR of 7.6 g COD/L-d for only five days until the methane occurrence,
in our experiments the reactors came from previous studies that lasted few months
(Carrillo-Reyes et al., 2012), most probably developing a stable methanogenic community.
Figure 3.3. Volumetric production rates of Experiment B and C (a) and metabolites concentration
at each condition (b). Organic loading rate, OLR; Hydraulic retention time, HRT.

47
To reach higher OLR, the substrate COD concentration in the influent was increased, which
was reflected in the metabolites concentration produced (Figures 3.3b and 3.4b). As it is
evident from these results, it seems that the metabolic pathway was not shifted at the
conditions tested and, as a consequence, the observed reduction of VMPR (experiment B)
may have been due to an inhibitory effect on the methanogenic activity caused by the
volatile fatty acids accumulation, around 60 mM as was reached by Duangmanee et al.
(2007) at a pH of 5.5, even though this activity was not completely eliminated.
3.3.3 Evaluation of the organic shock load: effect of decreasing HRT
For the sake of comparison with the aforementioned results (section 3.2), the effect of a
higher OLR but with the same substrate concentration was evaluated in the second stage of
experiment D; the HRT was reduced from 13 to 10 h with the consequent increase in OLR
from 37 to 48 g COD/L-d (Figure 3.4a). Noteworthy, this change increased slightly the
total gas production from 3.45 ± 0.47 to 4.3 ± 0.92 L/L-d, nonetheless the change did not
produced significant changes neither in the VHPR and VMPR nor in metabolites
concentration. These results may indicate that only the organic shock load due to the
increase in the influent substrate concentration has a control effect in the methanogenic
activity.
During the experiment C and in the third stage of experiment D (Figures 3.3 and 3.4) a
HRT decrease was evaluated, from 6 to 3 and 10 to 8 h, respectively, keeping the same
OLR (40 g COD/ d) than in the previous stages. Results of experiment C shown that both
VHPR and VMPR increased (figure 3.3a) as a result of an increment in the hydrogen and
methane concentration in the biogas (15 to 16 % and 12 to 27 %, respectively), and as was
expected, the methane production was favored due to the lower metabolites concentration
(figure 3.3b). In experiment D there was no effect neither in the gas production (around 4
L/L-d), nor in both VHPR and VMPR.
In both cases there were changes in the metabolic pathway (Figures 3.3b and 3.4b), a
decrease in the butyrate concentration was observed with the consequent decrease of the
molar butyrate/acetate (B/A) ratio. In experiment C the B/A ratio decreased from 0.72 to
0.27, and in experiment D from 1.09 to 0.55. Zhao et al. (2008) reported that lower B/A

48
ratios in the range from 0.57 to 3.65 produce low hydrogen rates. In this study the
metabolic change, measured as the change in the B/A ratio, produced an increase in the
VHPR in the experiment C whereas in experiment D there was no effect. Besides the
metabolic pathway, the metabolite concentrations have also to be considered. The decrease
of the substrate concentration from 10 to 5 g COD/L (experiment C) had an expected
decrease on the methane inhibition, in contrast with the decrease from 20 to 16 g COD/L in
experiment D, where the methane production remained the same (Figure 3.4a). It is clear
that more research is needed in order to elucidate the VFA inhibitory concentration for the
methanogens in this kind of systems.
Figure 3.4. Volumetric production rates of Experiment D and E (a) and metabolites concentration
at each condition (b). Organic loading rate, OLR; Hydraulic retention time, HRT; Heat treatment,
H.T.
3.3.4 Heat treatment
During the experiment E (Figure 3.4) a heat treatment was applied to the biomass
withdrawn from the last stage of experiment D and it was reinoculated into the reactor,
operating again at the same HRT (8 h) and OLR (48 g COD/L d) of the last stage. This
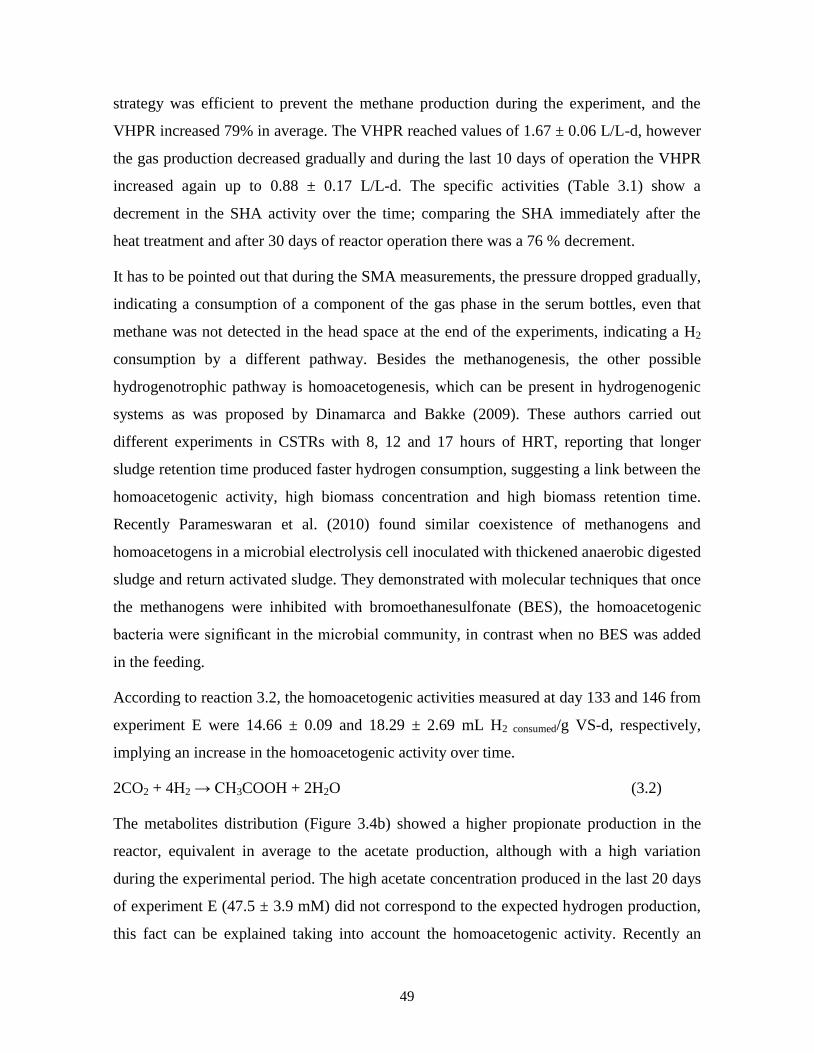
49
strategy was efficient to prevent the methane production during the experiment, and the
VHPR increased 79% in average. The VHPR reached values of 1.67 ± 0.06 L/L-d, however
the gas production decreased gradually and during the last 10 days of operation the VHPR
increased again up to 0.88 ± 0.17 L/L-d. The specific activities (Table 3.1) show a
decrement in the SHA activity over the time; comparing the SHA immediately after the
heat treatment and after 30 days of reactor operation there was a 76 % decrement.
It has to be pointed out that during the SMA measurements, the pressure dropped gradually,
indicating a consumption of a component of the gas phase in the serum bottles, even that
methane was not detected in the head space at the end of the experiments, indicating a H2
consumption by a different pathway. Besides the methanogenesis, the other possible
hydrogenotrophic pathway is homoacetogenesis, which can be present in hydrogenogenic
systems as was proposed by Dinamarca and Bakke (2009). These authors carried out
different experiments in CSTRs with 8, 12 and 17 hours of HRT, reporting that longer
sludge retention time produced faster hydrogen consumption, suggesting a link between the
homoacetogenic activity, high biomass concentration and high biomass retention time.
Recently Parameswaran et al. (2010) found similar coexistence of methanogens and
homoacetogens in a microbial electrolysis cell inoculated with thickened anaerobic digested
sludge and return activated sludge. They demonstrated with molecular techniques that once
the methanogens were inhibited with bromoethanesulfonate (BES), the homoacetogenic
bacteria were significant in the microbial community, in contrast when no BES was added
in the feeding.
According to reaction 3.2, the homoacetogenic activities measured at day 133 and 146 from
experiment E were 14.66 ± 0.09 and 18.29 ± 2.69 mL H2 consumed/g VS-d, respectively,
implying an increase in the homoacetogenic activity over time.
2CO2 + 4H2 → CH3COOH + 2H2O (3.2)
The metabolites distribution (Figure 3.4b) showed a higher propionate production in the
reactor, equivalent in average to the acetate production, although with a high variation
during the experimental period. The high acetate concentration produced in the last 20 days
of experiment E (47.5 ± 3.9 mM) did not correspond to the expected hydrogen production,
this fact can be explained taking into account the homoacetogenic activity. Recently an

50
equation to calculate the acetate produced by homoacetogenic pathway was proposed
(Arooj et al., 2008; Luo et al., 2011):
Achomoacet = (2[Ac]+2[But]-[Prop]-[H2])/6 (3.3)
Figure 3.5 shows the proportion of acetate produced and hydrogen consumed by
homoacetogenic pathway according to equation 3.3 and reaction 3.2, respectively. It has to
be noticed that the homoacetogenic activity increased in the second half of experiment E,
remaining stable and causing a considerable decrement in the hydrogen production
potential of the reactor, from around 250 mmol/d to a real hydrogen production of 40
mmol/d.
Figure 3.5. Theoretical acetate produced and hydrogen consumed by homoacetogens expressed as
molar rates during Experiment E.
3.4 Conclusions
The organic shock load was the more effective strategy to decrease the methane production,
mainly due to the higher influent organic substrate concentration. Nonetheless, it is
necessary to evaluate different ranges of organic substrate concentration to identify the
limits of this strategy, considering that high VFA concentration could also be inhibitory for
the hydrogen production due to the increase of undissociated acids. Once the methanogens
are completely inhibited, the homoacetogenic activity diminishes considerably the
51
hydrogen production potential. Studies like this one are relevant considering that potential
substrates for hydrogen production could take hydrogen-consuming microorganisms into
the fermentation system.
3.5 References
Akutsu Y, Lee DY, Li YY, Noike T. 2009. Hydrogen production potentials and fermentative
characteristics of various substrates with different heat-pretreated natural microflora. Int J
Hydrogen Energy 34:5365–5372.
APHA/AWWA/WFE. 2005. Standard methods for the examination of water and wastewater. 21th
edn, Washington DC, USA.
Argun H, Kargi F. 2009. Effects of sludge pre-treatment method on bio-hydrogen production by
dark fermentation of waste ground wheat. Int J Hydrogen Energy 34:8543–8548.
Arooj MF, Han SK, Kim SH, Kim DH, Shin HS. 2008. Continuous biohydrogen production in a
CSTR using starch as a substrate. Int J Hydrogen Energy 33:3289–3294.
Buitrón G, Carvajal C. 2010. Biohydrogen production from Tequila vinasses in an anaerobic
sequencing batch reactor: Effect of initial substrate concentration, temperature and hydraulic
retention time. Bioresource Technol 101:9071–77.
Carrillo-Reyes J, Celis LB, Alatriste-Mondragón F, Razo-Flores E. 2012. Different start-up
strategies to enhance biohydrogen production from cheese whey in UASB reactors. Int J
Hydrogen Energy 37:5591–5601.
Castello E, García y Santos C, Iglesias T, Paolino G, Wenzelb J, Borzacconia L, Etchebehereb C.
2009. Feasibility of biohydrogen production from cheese whey using a UASB reactor: Links
between microbial community and reactor performance. Int J Hydrogen Energy 34:5674–
5682.
Chen W-H, Sung S, Chen S-Y. 2009. Biological hydrogen production in an anaerobic sequencing
batch reactor: pH and cyclic duration effects. Int J Hydrogen Energy 34:227–234.
CordRuwisch R, Mercz TI, Hoh CY, Strong GE. 1997. Dissolved hydrogen concentration as an on-
line control parameter for the automated operation and optimization of anaerobic digesters.
Biotechnol Bioeng 56:626–634.
Das D, Veziroglu TN. 2008. Advances in biological hydrogen production processes. Int J Hydrogen
Energy 33:6046–6057.
Davila-Vazquez G, Cota-Navarro CB, Rosales-Colunga LM, De León-Rodríguez A, Razo-Flores E.
2009. Continuous biohydrogen production using cheese whey: Improving the hydrogen
production rate. Int J Hydrog Energy 34:4296–4304.
Davila-Vazquez G, Alatriste-Mondragón F, De León-Rodríguez A, Razo-Flores E. 2008a.
Fermentative hydrogen production in batch experiments using lactose, cheese whey and
glucose: Influence of initial substrate concentration and pH. Int J Hydrogen Energy 33:4989
– 4997.
Davila-Vazquez G, Arriaga S, Alatriste-Mondragón F, De León-Rodríguez A, Rosales-Colunga
LM, Razo-Flores E. 2008b. Fermentative biohydrogen production: trends and perspectives.
Rev Environ Sci Biotechnol 7:27–45.
Dinamarca C, Bakke R. 2009. Apparent hydrogen consumption in acid reactors: observations and
implications. Water Sci Technol 59:1441–1447.
Duangmanee T, Padmasiri SI, Simmons JJ, Raskin L, Sung S. 2007. Hydrogen production by
anaerobic microbial communities exposed to repeated heat treatments. Water Environ Res
79:975–983.
52
Guimaraes PMR, Teixeira JA, Domingues L. 2010. Fermentation of lactose to bio-ethanol by yeasts
as part of integrated solutions for the valorisation of cheese whey. Biotechnol Adv 28:375–84.
Horn MA, Matthies C, Kusel K, Schramm A, Drake HL. 2003. Hydrogenotrophic methanogenesis
by moderately acid-tolerant methanogens of a methane-emitting acidic peat. Appl Environ
Microbiol 69:74–83.
Hu B, Chen SL. 2007. Pretreatment of methanogenic granules for immobilized hydrogen
fermentation. Int J Hydrogen Energy 32:3266–3273.
Kapdan IK, Kargi F. 2006. Bio-hydrogen production from waste materials. Enzyme Microb Tech
38:569–582.
Kim IS, Hwang MH, Jang NJ, Hyun SHSH, Lee ST. 2004. Effect of low pH on the activity of
hydrogen utilizing methanogen in bio-hydrogen process. Int J Hydrogen Energy 29:1133–
1140.
Lee HS, Rittmann BE. 2009. Evaluation of Metabolism Using Stoichiometry in Fermentative
Biohydrogen. Biotechnol Bioeng 102:749–758.
Luo G, Karakashev D, Xie L, Zhou Q, Angelidaki I. 2011. Long‐ term effect of inoculum
pretreatment on fermentative hydrogen production by repeated batch cultivations:
Homoacetogenesis and methanogenesis as competitors to hydrogen production. Biotechnol
Bioeng 108:1816–1827.
Parameswaran P, Zhang HS, Torres CI, Rittmann BE, Krajmalnik-Brown R. 2010. Microbial
Community Structure in a Biofilm Anode Fed With a Fermentable Substrate: The
Significance of Hydrogen Scavengers. Biotechnol Bioeng 105:69–78.
Rittmann BE. 2008. Opportunities for Renewable Bioenergy Using Microorganisms. Biotechnol
Bioeng 100:203–211.
Spagni A, Casu S, Farina R. 2010. Effect of the organic loading rate on biogas composition in
continuous fermentative hydrogen production. J Environ Sci Health Part A-Toxic/Hazard
Subst Environ Eng 45:1475–1481.
Taconi KA, Zappi ME, French WT, Brown LR. 2008. Methanogenesis under acidic pH conditions
in a semi-continuous reactor system. Bioresour Technol 99:8075–8081.
Wang Y, Mu Y, Yu HQ. 2007. Comparative performance of two upflow anaerobic biohydrogen-
producing reactors seeded with different sludges. Int J Hydrogen Energy 32:1086–1094.
Yu HQ, Mu Y. 2006. Biological hydrogen production in a UASB reactor with granules. II: Reactor
performance in 3-year operation. Biotechnol Bioeng 94:988–995.
Zhao BH, Yue ZB, Zhao QB, Mu Y, Yu HQ, Harada H, Li YY. 2008. Optimization of hydrogen
production in a granule-based UASB reactor. Int J Hydrogen Energy 33:2454–2461.

53
Chapter 4
Community dynamics during methane decreasing strategies in UASB
hydrogenogenic reactors
Summary
Methane occurrence is a common concern in hydrogen producing reactors. In the present
study the microbial community structure was analyzed during the application of different
operational strategies to decrease methane production in UASB hydrogen producing
reactors. The pH reduction selected homoacetogenic organisms related to Blautia
hydrogenotrophica and Oscillibacter valericigenes, and the hydrogen producer
Enterobacter aerogenes. The organic loading rate increment from 20 to 30 g COD/L-d,
selected the hydrogen producers Clostridium tyrobutyricum, Citrobacter freundii and E.
aerogenes; further increments caused an inhibition in hydrogen production due to the high
undissociated acids concentration. Repeated heat treatment to the biomass completely
inhibited methane production, selecting hydrogen producers capable to sporulate, even
though homoacetogens were also selected. The archaeal community was represented by
hydrogenotrophs from genera Methanobrevibacter and Methanobacterium in all
experiments. This study shows that operational strategies can select hydrogen producing
bacteria, however methanogen activity is not completely inhibited, unless a second heat
treatment is applied.

54
4.1 Introduction
Hydrogen is considered a clean fuel, which can be used directly in energy fuel cells to
produce electricity and has the greatest energy content among conventional fuels.
Moreover, hydrogen can be produced by dark fermentation of organic wastes, making this a
promising technology for a renewable energy source (Kapdan and Kargi, 2006).
For the continuous hydrogen production by dark fermentation, the use of mixed cultures for
the continuous hydrogen production by dark fermentation is more feasible than pure
cultures. Mixed cultures have increased adaptation capacity therefore complex substrates
can be used, and do not require sterile conditions (Abreu et al., 2011; Luo et al., 2011).
Nevertheless, the use of mixed cultures such as anaerobic sludge can promote the
proliferation of microorganisms that consume the hydrogen produced (e.g., methanogens
and homoacetogens), decreasing the system efficiency. This is a common problem in
biomass fixed reactors such as UASB, even though the inoculum used has been subjected
to a pretreatment to select the hydrogen producing microorganisms (Carrillo-Reyes et al.,
2012; Castello et al., 2009; Spagni et al., 2010).
Some strategies to reduce methane production in hydrogenogenic reactors are: i) acidic pH
(Wang et al., 2007), diminishing the pH below the methanogenic optimal (6-7); ii) applying
a shock load, creating an imbalance from the methanogen step due to the accumulation of
the volatile fatty acids (CordRuwisch et al., 1997; Spagni et al., 2010) and iii) repeated heat
treatments (Duangmanee et al., 2007), enriching the biomass with spore forming
microorganisms eliminating the methanogens.
Recently, Luo et al. (2011) analyzed the effect of different pretreatments of the inoculum,
acid treatment, heat treatment and shock load in repeated batch tests, concluding that the
inhibition of methanogenesis and homoacetogenesis was dependent on fermentation
conditions, and not on inoculum pretreatment. However, in that work the methanogen
community structure was not evaluated, only the bacterial one. Abreu et al. (2011) carried
out a similar study, evaluating the effect of different pretreatments (heat treatment, BES
and BES + chloroform) in EGSB reactors performance and in the bacterial community.
Such treatments completely inhibited the methanogens and prompted the homoacetogenic
activity.
In a previous work (Carrillo-Reyes et al., 2011) we evaluated the effect of acid pH, shock
55
loads and repeated heat treatment in UASB reactors to diminish the methane production.
We concluded that the shock load was more efficient than the pH and HRT decrement.
Nonetheless, once the methane production was completely inhibited with the heat
treatment, the homoacetogenic activity became relevant diminishing the hydrogen
producing potential by approximately fourfold.
There is a lack of studies that evaluate the archeal and bacterial community response during
different strategies to reduce the methane production. It is necessary to establish if there is a
link between the diversity and reactor performance and if any specie is determinant in the
methane occurrence after the aforementioned strategies were applied. The use of 16S
rDNA-based methods employing denaturing gradient gel electrophoresis (DGGE) (Davila-
Vazquez et al., 2009), molecular cloning and sequencing (Abreu et al., 2010; Offre et al.,
2009) can provide an accurate estimation of the bacterial and archeal community
composition, distribution and diversity.
Therefore the aim of this work was to evaluate the community dynamics using molecular
techniques during the application of different strategies to inhibit the methanogenic activity
in hydrogen producing UASB reactors that had been in operation for extended periods of
time using cheese whey powder (CWP) solution as a synthetic dairy wastewater.
4.2 Materials and methods
4.2.1 Substrate
The CWP was purchased from Grande Custom Ingredients Group (Wisconsin, USA). The
soluble lactose content of CWP was 75.5% with 11.5% protein (w/w). An initial stock
solution of 100 g CWP/L was centrifuged 10 minutes at 13000 rpm to remove insoluble
material. After that, soluble chemical oxygen demand (COD) of the solution was
determined. The medium contained a known amount of CWP-COD and was supplemented
with a nutrient solution previously described (Carrillo-Reyes et al., 2012). Additional
Na2HPO4 was added to increase the buffer capacity of the medium and controlling the pH
at a desired value.

56
4.2.2 Reactors and inoculum
Three different UASB reactors were used to carry out the present experiments. The
working volumes of the reactors was between 0.47 and 1.3 L, and were inoculated with
heat treated anaerobic sludge from a confectionary factory at San Luis Potosí, México, to
reach a solids concentration from 13 to 20 g VVS/L. The main objective of the reactors
used was the hydrogen production from cheese whey, although eventually during their
operation methane started to be produced concomitant to the hydrogen, for periods not less
than 20 days before the present experiments were performed.
4.2.3 Experimental set-up
Five different experiments (A to E) were carried out to evaluate the effect of different
methane decreasing operational strategies in the microbial community of the
aforementioned UASB reactors. The details of each experiment are described as follows:
Experiment A: the effect of pH reduction was tested by decreasing the reactor pH from 5.63
to 5.0 and 4.5, and reestablishing the pH again to 5.0. OLR and HRT were kept at 20 g
COD/L-d and 6 h respectively.
Experiment B: the effect of the organic shock load was tested by increasing the OLR from
20 to 30 and finally to 40 g COD/L-d. The OLR was increased by incrementing the COD
influent concentration while the HRT was kept constant at 6 h.
Experiment C: the effect of the organic shock load was further tested by operating at the
previous OLR (40 g COD/L-d), but by means of decreasing both the HRT and the COD
influent concentration.
Experiment D: the effect of the organic shock load was also tested in this experiment by
increasing the OLR from 26 to 37 by means of raising the COD concentration in the
influent at constant HRT (13 h). Afterwards the OLR was increased up to 48 g COD/L-d by
decreasing the HRT to 10. Then the HRT was further decreased to 8 h, while reducing the
COD concentration in the influent in order to maintain an OLR of 48 g COD/L-d.

57
Experiment E: the granules of the experiment D were harvested, heat treated (boiled 1 hour)
and re-inoculated to evaluate the effect of a second heat treatment, keeping the same
operational parameters applied in the last stage of experiment D.
The pH in the reactors during experiments B to E was 5.3 - 5.5.
4.2.4 Analytical methods
Hydrogen, CH4 and CO2 were measured with a 1.0 mL Pressure-Lok® syringe (Valco
Instruments, Houston, Texas, USA) by comparing a 500 μL sample from the reactors and
serum bottles headspace with high purity standards (Alltech, Deerfield, Illinois, USA) using
a gas chromatograph (GC, 6890N Network GC System, Agilent Technologies, Waldbronn,
Germany) equipped with a thermal conductivity detector. The column used was a Hayesep
D (Alltech, Deerfield, Illinois, USA) with the following dimensions: 10´ x 1/8’’ x 0.085‖.
Temperatures of the injection port, oven and the detector were 250, 60 and 250 ºC,
respectively. Nitrogen was used as carrier gas with a flow-rate of 12 mL/min. Lactose and
VFA were analyzed by capillary electrophoresis and ethanol by gas chromatography as
previously described (Davila-Vazquez et al., 2008a). COD and VSS were analyzed
according to Standard Methods (APHA/AWWA/WFE, 2005). The biogas measurements
are presented in standard conditions (273.15 K and 1 atm).
4.2.5 Microbial community analyses
DNA extraction. Ten milliliters of sludge withdrawn from each operational condition
evaluated were kept at -20°C. Genomic DNA was extracted the DNA as described
elsewhere (Wisotzkey et al., 1990).
PCR amplification. Amplification of the 16S rRNA gene from the purified nucleic DNA
preparations was carried out by PCR using Taq DNA polymerase (DONGSHENG, China).
Almost complete bacterial 16S rDNA was selectively amplified for cloning and sequencing
using 27-F (5’-AGAGTTTGATCCTGGCCAG-3’) and 1492-R (5’-
GGTTACCTTGTTACGACTT-3’) primers with the following thermocycling program:
94ºC for 3 min; 35 cycles at 94ºC for 1 min, 45ºC for 1 min, and 72ºC for 1 min; and 72ºC
58
for 10 min (Martin-Laurent et al., 2001). For DGGE a specific region of the 16S rDNA was
amplified using the primer 357F-GC (5’-
CGCCCGCCGCGCGCGGCGGGCGGGGCGGGGGCACGGGGGGCCTACGGGAGGC
AGCAG-3´) and the reverse primer 907R (5’-CCGTCAATTCMTTTGAGTTT-3’),
reaction conditions were as follows: 96 °C for 4 min, followed by 10 cycles at 94°C for 30
s, 61°C for 1 min (with a reduction of 0.5 °C in each cycle), and 72°C for 1 min; in
addition, 20 cycles at 94°C for 30 s, 56°C for 1 min and 72°C for 1 min; with a final
extension at 72°C for 7 min were performed (Piña-Salazar, 2011).
For archaea, primers Arch109(K)-F (5’-ACKGCTCAGTAACAC GT-3’) and Uni1492-R
(5’-CGGCTACCTTGTTACGAC-3’) were used for cloning with the following
thermocycling program: 95ºC for 5 min; 25 cycles at 95ºC for 30 s, 52ºC for 40s, and 72ºC
for 90 s; and 72ºC for 5 min (Sousa et al., 2007). Primers A109(T)-F (5’-
ACTGCTCAGTAACACGT-3’) and 515-GC-R
5’CGCCCGGGGCGCGCCCCGGGCGGGGCGGGGGCACGGGGGGATCGTATTACC
GCGGCTGCTGGCAC-3’) were used for the archaeal DGGE analysis, with the following
thermocycling program: 94 °C for 5 min; followed by 30 cycles at 94 °C for 30 s, 52 °C for
1 min, 68 °C for 1 min; followed by 7 min at 68 °C (Roest, 2007).
DGGE analysis. DGGE was performed with Dcode Universal Mutation Detection System
(Biorad, Hercules, California, USA). 20 μL of the PCR products were loaded onto 8%
polyacrylamide gels in 0.5 X TAE buffer (20 mM Tris–acetate, 10 mM sodium acetate, 0.5
mM EDTA, pH 8.0) with a denaturing gradient (urea–formamide) that ranged from 30 to
60% and 30 to 50%, for bacterial and archeal community fingerprint, respectively.
Electrophoresis was carried out at 60°C at a constant voltage of 70 V for 16 hours. The gel
was fixed with acetic acid solution at 10% during 30 min at 40-50 rpm. After it was washed
out three times with deionized water at the same agitation, then the gel was submerged in
AgNO3 solution (1 g/L) during 30 min, without light incidence. Later the gel was
developed with sodium carbonate solution (23.3 g/L) during 15 min. Afterwards it was
submerged in the fixation solution during 5 min, finally the gel was rinsed with deionized
water. The gel bands were observed at visible light, and a photo with a digital camera was
taken. DGGE gels were analyzed with the Cross Checker v 2.91 software (Wageningen
University, The Netherlands) to create a binary matrix, corresponding dendrograms
59
showing the relationships between the DGGE profiles were constructed with Phylogeny
Inference Package v 3.69 (University of Washington, USA), using the Unweighted Pair
Group Method with Arithmetic Mean (UPGMA). Similarity between groups was calculated
using the Dice coefficient.
Cloning. PCR products obtained with the primers pair 27-F and 1492-R, and Arch109(K)-F
and Uni1492-R, were ligated into pGEM-T vector using the pGEM Easy Vector Systems
kit (Promega), and introduced into competent Top10 E. coli. 12 positive transformants were
selected (by blue/white screening) and grown in LB media supplemented with ampicillin.
After cell lysis, inserts were amplified using the primer set M13-F (5’-
CGCCAGGGTTTTCCCAGTCACGAC-3’) and M13-R (5’-
AGCGGATAACAATTTCACACAGG-3’) and the obtained PCR products were analyzed
in agarose gel (1%) in order to select clones with the right insert fragments. Amplicons of
the correct size were screened by amplified ribosomal DNA restriction analysis (ARDRA),
using the restriction enzymes MspI and HinfI, incubated during 2 hours at 37°C. The
restriction fragments were analyzed by electrophoresis in 2.5% (w/v) agarose gel and
visualized with ethidium bromide. Amplification with M13 primers of selected
transformants, with different ARDRA patterns and corresponding to predominant bands in
the DGGE community fingerprint, were subjected to DNA sequence analysis. The PCR
products were sent to purification and sequencing to ―Laboratorio Nacional de
Biotecnología Agrícola, Médica y Ambiental‖ (LANBAMA, IPICYT, Mexico). The
presence of some clones was inferred by the position of their DGGE fragment in the
fingerprint, in relation with fragments in the same position in other samples.
Phylogenetic Analysis. 16S rRNA gene partial sequences were depurated with the BioEdit
V7.1.3 software package (Hall, 1999). Consensus sequences were checked for potential
chimera artifacts by the Pintail software V1.0 (Cardiff University, UK). Similarity searches
for the partial 16S rRNA gene sequences were performed using the NCBI BLAST search
program within the GenBank database. Phylogenic assignment of the sequences to higher-
order taxa was performed using the RDP Naïve Bayesian Classifier. In order to dereplicate
the sequences and to group the 'similar' sequences together in Operational Taxonomic Units
(OTU), the FastGroupII tool was used (Yu et al., 2006). 16S rRNA sequences were further
aligned by using the Clustal X V2.0 software (Larkin et al., 2007). The resulting alignments
60
were used for the construction of a 16S rRNA gene-based phylogenetic tree. Due to the low
number of archaeal sequences recovered, only the bacterial phylogenetic tree is included.
4.2.6 Statistical analysis
In order to explore the effects of the operational parameters (pH, HRT, OLR) and the
repeated heat treatment in the gas and metabolites production, data were analyzed using a
cross-correlation matrix of the Spearman’s rank correlation coefficients (Ramette, 2007).
Then, the significant correlations (P < 0.05) were tested with the non parametric
multivariate analysis of variance (MANOVA) (Anderson, 2001), in order to elucidate the
intensity of such relations. All statistical analyses were performed with the R environment
(R Development Core Team, 2009). Spearman correlations and non parametric MANOVA
were run using the R ―Pspearman‖ and ―Vegan‖ packages, respectively (Oksanen et al.,
2012; Savicky, 2009).
4.3 Results and Discussion
In this study the microbial community dynamics was evaluated during five different
strategies to diminish the methane production in UASB hydrogen producing reactors.
Samples analyzed were taken at each evaluated condition. The average hydrogen and
methane production rate are shown in Figure 4.1. The metabolites concentration for each
experiment is shown in section 3.3 (Figures 3.3 to 3.4).
4.3.1 pH reduction
Figure 4.1a shows that the volumetric hydrogen production rate diminished from 0.51 (with
high variability) to 0.25 L/L-d, from a pH value of 5.63 to 5; whereas the methane
production rate remained the same varying from 0.26 to 0.32 L/L-d. The Spearman’s
correlation coefficients of experiment A showed a positive significant association between
pH and the H2 production rate, acetate, and ethanol production. In other words, the positive
association indicates that pH is directly proportional to metabolites concentration. In

61
contrast, butyrate production was associated negatively with the pH. Similar relations
between pH and the hydrogen and metabolites production were found by Fang and Liu
(2002) in a CSTR at pH values from 4.0 to 7.0. In this sense, according to the MANOVA
results, the pH control explained 36.63 % of the variance of metabolites and H2 production
in experiment A.
The similarity index of the bacterial fingerprint showed 50 % of similitude between the first
and the last condition evaluated in experiment A, explained by a bacterial community
selection. Among all experiments, 23 bacterial OTUs (BacOTU) were identified. The
Figure 4.2 shows the phylogenetic tree indicating the closets relative organisms.
Figure 4.1 Volumetric production rates of Experiment A (a), Experiments B and C (b), and
Experiments D and E (c). H.T. (Heat treatment).

62
The relation of Bacterial OTUs sequenced and the DGGE profile, showed that BacOTUs 1
and 2 that prevailed in experiment A, were related to Blautia hydrogenotrophica and
Oscillibacter valericigenes, reported as homoacetogenic microorganisms (Fonty et al.,
2007). The presence of homoacetogenic activity at pH values below 5.5 have been proved
before, even though this is not the most favorable pH value (Calli et al., 2008).
A higher abundance of OTUs related to Propionibacterium acidipropionici and
Lactobacillus casei, BacOTUs 5 and 6, respectively, were identified a t the end of the
experiment A (pH 5). The former a propionic acid producer (Zhang and Yang, 2009) and
the latter a lactic acid producer, both contributed to the low hydrogen production due to the
use of the available electrons to produce reduced compounds instead of hydrogen. Even
though the low hydrogen production can be explained by the putative presence of hydrogen
consuming and non producing hydrogen bacteria, in the last condition evaluated in
experiment A (pH 5), it was inferred the presence of Enterobacter aerogenes, a hydrogen
producing bacteria (Zhang et al., 2009), related with BacOTU 15.
Table 4.1 shows the archeal OTUs (ArcOTU) identified for experiments A to E. In the case
of experiment A, all the ArcOTU were present in the DNA extracted, except by the
ArcOTU 6. The species related belong to the Methanobacteriaceae family, from the genera
Methanobrevibacter and Methanobacterium, both presenting hydrogenotrophic activity
(Huber, 2001). As Figure 4.1a depicts, the volumetric methane production rate was only
affected at pH 4.5, probably by the low hydrogen production, in the other pH values
evaluated methane was produced at similar rates. Other studies for hydrogen production
have only found methane activity at pH above 5, in completely mixed and fixed biomass
reactors (Fang and Liu, 2002; Wang et al., 2007). Nevertheless, in an anaerobic digester
methane activity was present at pH values between 4.0 to 5.3, which can be explained by an
acclimated consortium and the presence of micro environments (Taconi et al., 2008).
4.3.2 OLR increments
During experiment B the OLR was increased from 20 to 30 and 40 g COD/L-d. According
to the Spearman’s correlations, the increase in the OLR had a significant effect in the
hydrogen, acetate, and propionate production.
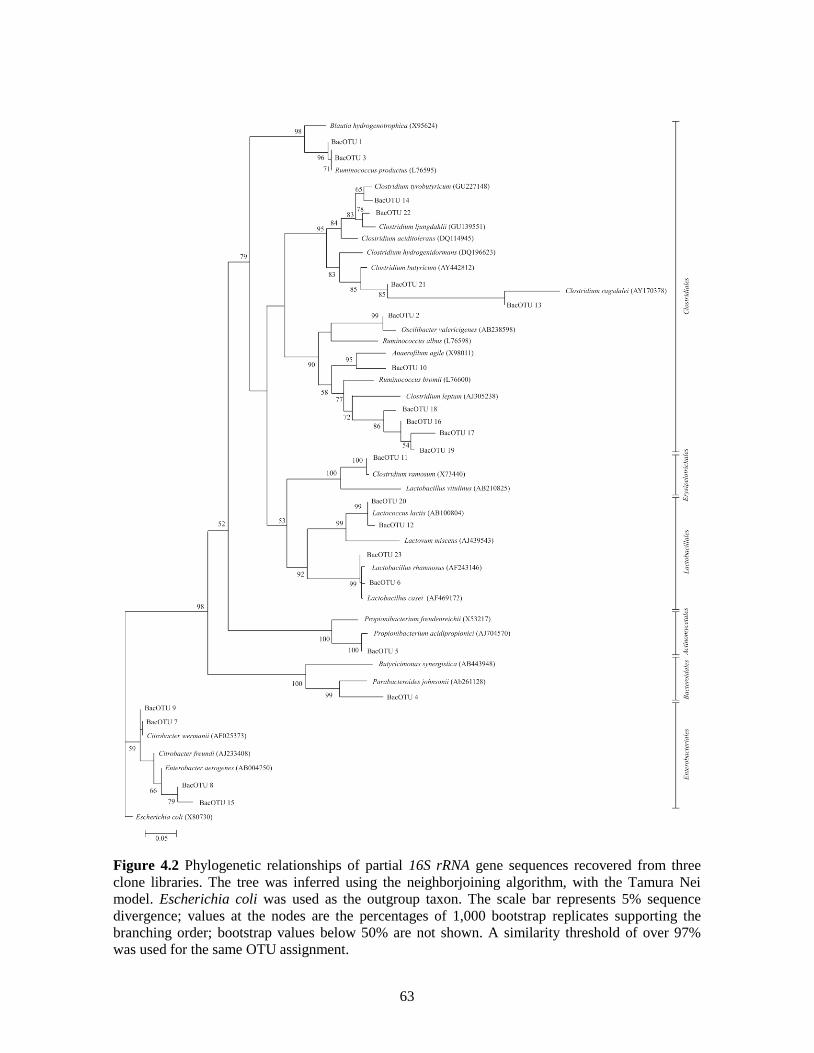
63
Figure 4.2 Phylogenetic relationships of partial 16S rRNA gene sequences recovered from three
clone libraries. The tree was inferred using the neighborjoining algorithm, with the Tamura Nei
model. Escherichia coli was used as the outgroup taxon. The scale bar represents 5% sequence
divergence; values at the nodes are the percentages of 1,000 bootstrap replicates supporting the
branching order; bootstrap values below 50% are not shown. A similarity threshold of over 97%
was used for the same OTU assignment.

64
The MANOVA results showed a significant low variation value of 14.75 %, for the latter
correlation. Figure 4.1b shows that only the first increment, from 20 to 30 g COD/L-d, had
a positive effect in the hydrogen production rate.
The dendrogram (Figure 4.3a) shows that the bacterial communities at 20 and 40 g COD/L-
d in experiment B were clustered together. In these conditions the hydrogen production rate
was similar around 0.28 L/L-d (Figure 4.1b); the DGGE profile shows the same dominant
bacterial species, whereas the methane production rate decreased from 0.71 to 0.22 L/L-d.
Figure 4.3. Bacterial DGGE community fingerprints and corresponding similarity dendrograms and
indexes. a) Experiment B and C, b) Experiment D and E. The numbers correspond to the different
Bacterial OTUs associated with the DGGE fingerprint.
The DGGE bacterial fingerprint from experiment B at 30 g COD/L-d was clustered
separately from the community of the other conditions evaluated. At this condition was
observed the highest and the lowest hydrogen and methane production rate (0.90 and 0.18
L/L-d) respectively, from the experiments B and C.
During the first stage of experiment B (20 g COD/L-d) BactOTUs 5 and 6 related to
Propionibacterium acidipropionici and Lactobacillus casei were identified, which could
reduce the hydrogen production efficiency, as was discussed above. Moreover, it was
identified the BactOTU 4 related to anaerobic fermentative bacteria (Butyricimonas
synergistic and Parabacteroides johnsonii) with non reported hydrogen production capacity
65
(Sakamoto et al., 2007; Sakamoto et al., 2009). When the OLR was increased to 30 g
COD/L-d the dominant BacOTUs 9, 14 and 8 were related to Clostridium tyrobutyricum,
Citrobacter freundii and Enterobacter aerogenes, all hydrogen producers (Jo et al., 2008;
Kumar and Vatsala, 1989; Zhang et al., 2009), corresponding to the highest hydrogen
production rate in experiment B.
In the last condition of experiment B (40 g COD/L-d), even though BacOTUs 9, 8 and 11
were related to hydrogen producers such as Clostridium tyrobutyricum, Enterobacter
aerogenes and Clostridium ramosum (Lin et al., 2006), it was also was present the BacOTU
22, related to Clostridium ljungdahlii, an homoacetogenic organism (Köpke et al., 2010),
reducing the hydrogen production. Another factor that contributed to the low hydrogen
production was the undissociated VFA concentration of 13.4 mM. According to Castro-
Villalobos et al. (2012), a 10 mM concentration of undissociated fermentation by-products
caused a biomass growth inhibition in a hydrogen producing system.
During experiment B all the ArcOTUs included in Table 4.1 were identified, proving that
methane was produced by hydrogenotrophic activity. Methane production was decreased
from 20 to 30 g COD/L-d, as was expected by the increment in the substrate concentration
(Spagni et al., 2010). The Spearman’s correlations showed a negative significant relation
between acetate and butyrate concentration and the volumetric methane production,
confirming statistically this association. The last increment to 40 g COD/L-d did not affect
the methane production in comparison with 30 g COD/L-d, in spite of the low hydrogen
productivity (Figure 4.1b).
4.3.3 HRT decrements
In order to evaluate the effect of the HRT in the experiments C and D (Figures 4.1b and c)
the HRT was diminished from 6 to 3 and from 10 to 8 h, respectively. Bacterial DGGE
fingerprint corresponding to the HRT decrement in the experiment C had 60 % of
similitude with the previous HRT evaluated (Figure 4.3a). This HRT decrement had a
positive effect in the hydrogen and methane production (Figure 4.1b), favored by the low
substrate concentration. According to the MANOVA, the HRT explained 19.7 % of the
experiment variance in a significant way. Important changes in the community due to the

66
HTR reduction were the occurrence of the BacOTU 6 (Lactobacillus casei) and the
disappearance of the BacOTU 11 (Clostridium ramosum), the latter a hydrogen producer.
Table 4.1. Affiliation of the Archaeal OTUs identified showing the highest percentage of identity in
the output result from the analysis in the non-redundant nucleotide database from NCBI using the
BLAST program.
ArcOTU pB sequence Closest relative GenBank
accession number
Percentage of
identity
1 983 Methanobrevibacter arboriphilus NR_042783 99
2 972 Methanobacterium congolense NR_028175 98
3 900 Methanobacterium bryantii NR_042781 96
4 767 Methanobacterium oryzae NR_028171 95
5 959 Methanobacterium palustre NR_041713 96
6 970 Methanobacterium alcaliphilum NR_028228 97
7 839 Methanobacterium congolense NR_028175 97
The bacterial community during the HRT decrement in experiment D had 60 % of
similitude with the community at the previous condition, 48 g CDO/L-d at 10 h of HRT
(Figure 4.3b). However, hydrogen methane production rates remained in similar values
(Figure 4.1c). The BacOTUs 20 and 14 identified in this experiment were related to
Lactococcus lactis, a lactic acid producer microorganism, and Clostridium tyrobutyricum a
hydrogen producer, respectively (Jo et al., 2008). The ArcOTUs identified in both
experiments (C and D) for the HRT decrements were all those listed in Table 1.
Consequently, the HRT did not affect the methane community diversity, only affecting
their activity in experiment C.
In experiment C, the HRT decrement implied a decreased of substrate concentration from
10 to 5 g COD/L, resulting in a decrement of the undissociated acids concentration below
the inhibition threshold for hydrogen production (Castro-Villalobos et al., 2012); explaining
the slight increment in the hydrogen production rate (Figure 4.1b). Otherwise, in
experiment D the reduction of the substrate concentration was from 20 to 16 g COD/L,
keeping the undissociated acids concentration above the inhibition threshold, showing
similar hydrogen and methane productions rates (Figure 4.1c).
67
4.3.4 Heat treatment
The repeated heat treatment of experiment E was the only strategy that inhibited completely
the methane production, increasing the hydrogen production rate from 0.49 to 1.23 L/L-d.
Three samples of biomass were withdrawn from the reactor during this strategy at days 0,
15 and 30. The bacterial DGGE fingerprint shows that the samples taken at day 15 and 30
were clustered together with 82% of similitude (Figure 4.3b).
The BacOTUs identified at day 0, corresponded to the hydrogen producing bacteria
Clostridium butyricum (BacOTU 21) and to the homoacetogenic Clostridium ljungdahlii
(BacOTU 22). The DGGE profile (Figure 4.3b) shows that the abundance of BacOTU 22
diminished at day 15, and the presence of the Enterobacter aerogenes can be inferred,
corresponding to BacOTU 15, a hydrogen producer microorganism. At the end of the
experiment, the bands corresponding to the BacOTUs 15 and 22 (Enterobacter aerogenes
and Clostridium ljungdahlii) disappeared; E. aerogenes is a non spore forming bacteria,
which explains its reduced abundance after the heat treatment.. The BacOTUs 21 and 23,
related to Clostridium butyricum and Lactobacillus rhamnosus, an acid lactic producer,
prevailed during the whole experiment E; the former is a spore forming and the latter is
commonly found in dairy effluents such as the substrate used in the present work (Castello
et al., 2009). The presence of Lactobacillus genus has been reported widely in hydrogen
producing systems, but their capacity to produce hydrogen has to be investigated due to
contradictory results (Castello et al., 2011). As was mentioned in our previous work
(Carrillo-Reyes et al., 2011), in experiment E the homoacetogenic activity was identified in
batch test and increased over the time. Due to the spore forming capacity of
homoacetogenic bacteria, these could survive to the heat treatment (Luo et al., 2011).
Despite the lack of methanogenic activity, was amplified and cloned archeal 16S rDNA,
explained by the low DNA degradation in the reactor.
4.4 Conclusions
The strategies applied to decrease the methane production had an effect in the microbial
community. Among the operational strategies (pH reduction, shock load and HRT
reduction), the shock load enhanced the hydrogen production rate due to the selection of

68
hydrogen producing microorganisms. However, extended operation times selected
organisms that diverted the available electrons to the production of more reduced
compounds such as propionate or lactate. The organic shock load strategy had a limitation,
related to the high concentration of undissociated acids resulting in the inhibition of
hydrogen production.
Only a second heat treatment, applied to the biomass, completely inhibited the
methanogenic activity. However the sporulation capacity selected both hydrogen producing
and homoacetogenic bacteria, the latter reducing the hydrogen producing potential of the
reactor. The presence of microorganisms of the genus Lactobacillus (non-spore forming)
after the heat treatment, highlighted the importance of the indigenous microorganisms load
present in the substrate, indicating that the relevance of this microorganisms in the reactors
performance has to be investigated.
This study shows that operational strategies to decrease methane production can select
hydrogen producing bacteria. However, when methanogen activity is diminished or
completely inhibited, homoacetogenesis bacteria evolve to the main hydrogen consumer
activity in detriment of the hydrogen production potential.
4.5 References
Abreu AA, Alves JI, Pereira MA, Sousa DZ, Alves MM. 2011. Strategies to suppress
hydrogen‐consuming microorganisms affect macro and micro scale structure and
microbiology of granular sludge. Biotechnol Bioeng 108:1766–1775.
Abreu AA, Alves JI, Pereira MA, Karakashev D, Alves MM, Angelidaki I. 2010. Engineered heat
treated methanogenic granules: a promising biotechnological approach for extreme
thermophilic biohydrogen production. Bioresour Technol 101:9577–9586.
Anderson MJ. 2001. A new method for non-parametric multivariate analysis of variance. Austral
Ecol 26:32–46.
APHA/AWWA/WFE. 2005. Standard methods for the examination of water and wastewater. 21th
edn, Washington DC, USA.
Calli B, Zhao J, Nijssen E, Vanbroekhoven K. 2008. Significance of acetogenic H2 consumption in
dark fermentation and effectiveness of pH. Water Sci Technol 57:809.
Carrillo-Reyes J, Celis LB, Alatriste-Mondragon F, Razo-Flores E. 2011. Strategies to decrease the
methane production in UASB hydrogenogenic reactors. In: Ouro Preto, Minas Gerais, Brazil,
p. 8.
Carrillo-Reyes J, Celis LB, Alatriste-Mondragón F, Razo-Flores E. 2012. Different start-up
strategies to enhance biohydrogen production from cheese whey in UASB reactors. Int J
Hydrogen Energy 37:5591–5601.

69
Castello E, García y Santos C, Iglesias T, Paolino G, Wenzelb J, Borzacconia L, Etchebehereb C.
2009. Feasibility of biohydrogen production from cheese whey using a UASB reactor: Links
between microbial community and reactor performance. Int J Hydrogen Energy 34:5674–
5682.
Castello E, Perna V, Wenzel J, Borzacconi L, Etchebehere C. 2011. Microbial community
composition and reactor performance during hydrogen production in a UASB reactor fed
with raw cheese whey inoculated with compost. Water Sci Technol 64:2265–2273.
Castro-Villalobos MC, Garcia-Morales JL, Fernandez FJ. 2012. By-products inhibition effects on
bio-hydrogen production. Int J Hydrogen Energy 37:7077–7083.
CordRuwisch R, Mercz TI, Hoh CY, Strong GE. 1997. Dissolved hydrogen concentration as an on-
line control parameter for the automated operation and optimization of anaerobic digesters.
Biotechnol Bioeng 56:626–634.
Davila-Vazquez G, Cota-Navarro CB, Rosales-Colunga LM, De León-Rodríguez A, Razo-Flores E.
2009. Continuous biohydrogen production using cheese whey: Improving the hydrogen
production rate. Int J Hydrogen Energy 34:4296–4304.
Duangmanee T, Padmasiri SI, Simmons JJ, Raskin L, Sung S. 2007. Hydrogen production by
anaerobic microbial communities exposed to repeated heat treatments. Water Environ Res
79:975–983.
Fang HHP, Liu H. 2002. Effect of pH on hydrogen production from glucose by a mixed culture.
Bioresour Technol 82:87–93.
Fonty G, Joblin K, Chavarot M, Roux R, Naylor G, Michallon F. 2007. Establishment and
Development of Ruminal Hydrogenotrophs in Methanogen-Free Lambs. Appl Environ
Microbiol 73:6391–6403.
Hall TA. 1999. BioEdit: a user-friendly biological sequence alignment editor and analysis program
for Windows 95/98/NT. Nucl Acids Symp Ser 41:95–98.
Huber H. 2001. Euryarchaeota. In: eLS. John Wiley & Sons, Ltd.
http://dx.doi.org/10.1038/npg.els.0004243.
Jo JH, Lee DS, Park D, Park JM. 2008. Biological hydrogen production by immobilized cells of
Clostridium tyrobutyricum JM1 isolated from a food waste treatment process. Bioresour
Technol 99:6666–6672.
Kapdan IK, Kargi F. 2006. Bio-hydrogen production from waste materials. Enzyme Microb Tech
38:569–582.
Köpke M, Held C, Hujer S, Liesegang H, Wiezer A, Wollherr A, Ehrenreich A, Liebl W,
Gottschalk G, Dürre P. 2010. Clostridium Ljungdahlii Represents a Microbial Production
Platform Based on Syngas. PNAS 107:13087–13092.
Kumar GR, Vatsala TM. 1989. Hydrogen production from glucose by Citrobacter freundii. Indian J
Exp Biol 27:824–825.
Larkin MA, Blackshields G, Brown NP, Chenna R, McGettigan PA, McWilliam H, Valentin F,
Wallace IM, Wilm A, Lopez R, Thompson JD, Gibson TJ, Higgins DG. 2007. Clustal W and
Clustal X Version 2.0. Bioinformatics 23:2947–2948.
Lin C-Y, Lee C-Y, Tseng I-C, Shiao IZ. 2006. Biohydrogen production from sucrose using base-
enriched anaerobic mixed microflora. Process Biochemistry 41:915–919.
Luo G, Karakashev D, Xie L, Zhou Q, Angelidaki I. 2011. Long‐term effect of inoculum
pretreatment on fermentative hydrogen production by repeated batch cultivations:
Homoacetogenesis and methanogenesis as competitors to hydrogen production. Biotechnol
Bioeng 108:1816–1827.
Martin-Laurent F, Philippot L, Hallet S, Chaussod R, Germon JC, Soulas G, Catroux G. 2001. DNA
Extraction from Soils: Old Bias for New Microbial Diversity Analysis Methods. Appl
Environ Microbiol 67:2354–2359.
Offre P, Prosser JI, Nicol GW. 2009. Growth of ammonia-oxidizing archaea in soil microcosms is
inhibited by acetylene. FEMS Microbiol Ecol 70:99–108.
70
Oksanen J, Blanchet FG, Kindt R, Legendre P, Minchin PR, O’Hara RB, Simpson GL, Solymos P,
Stevens MHH, Wagner H. 2012. vegan Community Ecology Package. http://CRAN.R-
project.org/package=vegan.
Piña-Salazar EZ. 2011. Desarrollo de biopelículas en un reactor le leho fluidificado de flujo
descendente a diferente relación de DQO/sulfato y tiempo de residencia hidráulico; San Luis
Potosí, S.L.P., México: IPICyT, División de Ciencias Ambientales, Master Thesis.
R Development Core Team. 2009. R: A language and environment for statistical computing.
Vienna, Austria: R Foundation for Statistical Computing 409 p.
Ramette A. 2007. Multivariate analyses in microbial ecology. FEMS Microbiol Ecol 62:142–160.
Roest K. 2007. Microbial community analysis in sludge of anaerobic wastewater treatment systems.
Wageningen University, Ph.D. Thesis; Wageningen, The Netherlands.
Sakamoto M, Kitahara M, Benno Y. 2007. Parabacteroides johnsonii sp. nov., isolated from human
faeces. Int J Syst Evol Microbiol 57:293–296.
Sakamoto M, Takagaki A, Matsumoto K, Kato Y, Goto K, Benno Y. 2009. Butyricimonas
synergistica gen. nov., sp. nov. and Butyricimonas virosa sp. nov., butyric acid-producing
bacteria in the family ―Porphyromonadaceae‖ isolated from rat faeces. Int J Syst Evol
Microbiol 59:1748–1753.
Savicky P. 2009. pspearman: Spearman’s rank correlation test. http://CRAN.R-
project.org/package=pspearman.
Sousa DZ, Pereira MA, Smidt H, Stams AJM, Alves MM. 2007. Molecular assessment of complex
microbial communities degrading long chain fatty acids in methanogenic bioreactors. FEMS
Microbiol Ecol 60:252–265.
Spagni A, Casu S, Farina R. 2010. Effect of the organic loading rate on biogas composition in
continuous fermentative hydrogen production. J Environ Sci Health Part A-Toxic/Hazard
Subst Environ Eng 45:1475–1481.
Taconi KA, Zappi ME, French WT, Brown LR. 2008. Methanogenesis under acidic pH conditions
in a semi-continuous reactor system. Bioresour Technol 99:8075–8081.
Wang Y, Mu Y, Yu HQ. 2007. Comparative performance of two upflow anaerobic biohydrogen-
producing reactors seeded with different sludges. Int J Hydrogen Energy 32:1086–1094.
Wisotzkey JD, Jurtshuk P, Fox GE. 1990. PCR amplification of 16S rDNA from lyophilized cell
cultures facilitates studies in molecular systematics. Current Microbiol 21:325–327.
Yu Y, Breitbart M, McNairnie P, Rohwer F. 2006. FastGroupII: A web-based bioinformatics
platform for analyses of large 16S rDNA libraries. BMC Bioinformatics 7:57.
Zhang A, Yang S-T. 2009. Engineering Propionibacterium acidipropionici for enhanced propionic
acid tolerance and fermentation. Biotechnol Bioeng 104:766–773.
Zhang C, Ma K, Xing X-H. 2009. Regulation of hydrogen production by Enterobacter aerogenes by
external NADH and NAD+. Int J Hydrogen Energy 34:1226–1232.

71
Chapter 5
Implications of the hydrogen consuming microorganisms in two upflow
anaerobic packed-bed reactors treating cheese whey
Summary
Low hydrogen yields in fermentative systems are attributed to the hydrogen consuming
activity of homoacetogens, mainly in fixed biomass reactors. In order to determine the
implication of this activity, two packed-bed reactors were fed with cheese whey at organic
loading rates of 24 and 48 g COD/L-d. Batch assays were carried out to evaluate the
specific hydrogen consuming activity using biomass withdrawn from the reactors. During
the start-up, maximal hydrogen yields of 2.92 and 2.55 mol H2/mol lactose consumed were
achieved. However, a sudden decrease was observed, following a common trend in this
kind of reactors. Batch assays showed homoacetogenesis in the inoculum (obtained from
substrate natural fermentation) and its increment over the operation time, up to certain
moment where it was replaced by hydrogenotrophic methanogenic activity. Once the
methanogenic community was established, its specific activity remained with similar values
throughout the reactors operation. DGGE fingerprints showed increasing bacterial and
archaeal diversity over the time. The present work demonstrated that the hydrogen
consuming activities, homoacetogenic or methanogenic, affected equally the systems
evaluated.

72
5.1 Introduction
Hydrogen production by the fermentative pathway is considered a sustainable alternative
for fossil fuels, due to its highest energetic content; moreover, it can be produced through
the use of wastes or byproducts (Saxena et al., 2009). Cheese whey, a dairy byproduct, is a
potential substrate for hydrogen production, because of its high content of readily
biodegradable carbohydrates (Davila-Vazquez et al., 2009). The hydrogen production
research has been focused on increasing the yield and productivity, evaluating different
factors such as the substrate, reactor configuration, operational parameters and different
sources of inoculum, among others (Valdez-Vazquez and Poggi-Varaldo, 2009).
Respect to the reactor configuration, fixed biomass reactors have been used under the
principle that higher biomass concentration and higher organic loading rates can be applied,
consequently increments in the hydrogen production are expected. In particular, the
anaerobic packed-bed reactors have a simple construction, there is no need of mechanical
agitation, and a low hydraulic retention time can be applied (Peixoto et al., 2011).
One of the highest hydrogen yields achieved in continuous hydrogen systems was 3.25
molhydrogen/molglucose, using a mixed culture as inoculum and a constant nitrogen flush to
diminish the hydrogen partial pressure (Bastidas-Oyanedel et al., 2012). In practice, the
theoretical yield of 4 moles of hydrogen per mol of hexose, is far to be reached in systems
with mixed cultures and fed with real wastewaters.
The low hydrogen production yields can be caused by mixed pathways such as the acetate
and butyrate, or by the production of reduced compounds such as propionate or lactate,
acting as electron sinks (Dinamarca and Bakke, 2009). When the metabolites profile shows
a predominant acetate fermentation and low hydrogen yield, some authors have proposed
the occurrence of homoacetogenic activity, which is the autotrophic acetate production
using hydrogen and carbon dioxide, therefore, diminishing the hydrogen production (Arooj
et al., 2008; Carrillo-Reyes et al., 2011).
There are contradictory results about the relevance of the homoacetogenic activity, whereas
Kraemer and Bagley (2008) established that the homoacetogenic activity was insignificant,
several authors have attributed the low hydrogen yields to this pathway (Dinamarca and
Bakke, 2009; Fontes Lima and Zaiat, 2012).
73
The homoacetogenic activity is promoted by a high hydrogen partial pressure and high
cellular retention time. The hydrogen partial pressure threshold for the homoacetogenic
activity (520-950 ppm) is easily reached in hydrogen producing systems. Moreover the
homoacetogens are a very cosmopolitan trophic group present in anaerobic mixed cultures
and natural environments (Cord-Ruwisch et al., 1988; Dinamarca et al., 2011). Our
previous work confirmed the occurrence of homoacetogenic activity in batch assays using
biomass withdrawn from a hydrogen producing UASB reactor (Carrillo-Reyes et al., 2011).
Arooj et al. (2008) proposed a stoichiometric balance to calculate the hydrogen consumed
by homoacetogenesis based on the theoretical yield and the acetate and butyrate
concentration in the medium.
Homoacetogens are a versatile bacterial functional group, capable of developing an
autotrophic or heterotrophic growth. It is suggested that homoacetogens will switch from
heterotrophic to autotrophic metabolism when beneficial (Dinamarca et al., 2011; Oh et al.,
2003).
The inoculum is an important factor to control in hydrogen producing reactors, commonly
an anaerobic treated sludge is used, although, hydrogenotrophic methanogenic activity can
be found. An alternative to avoid the presence of methanogens is the use of naturally
fermented substrate as inoculum, which may favor the growth of the microorganisms
present in the substrate and in the environment (Fontes Lima and Zaiat, 2012; Peixoto et al.,
2011). According to our knowledge there are not systematic analyses of the relevance of
homoacetogenic activity over the time in hydrogen producing reactors. The emergence of
homoacetogenic activity could be a response of the hydrogen concentration in the reactor,
therefore the specific hydrogen consumption activity could have values according to the
hydrogen production of different reactors.
The aim of the present work was to evaluate the hydrogen consuming activity over the
operation time in two hydrogen producing anaerobic packed bed reactors fed with cheese
whey. The specific hydrogen consuming activity was measured in batch assays using
biomass withdrawn from the reactor, the bacterial diversity was analyzed using PCR-
DGGE techniques.
74
5.2 Materials and Methods
5.2.1 Substrate and mineral medium
Cheese whey powder (CWP) was purchased (Elegé®, Brasil Foods S.A.) and used as the
only carbon and energy source. A CWP solution was prepared to the desired chemical
oxygen demand (COD). A phosphate buffer and nutrients concentration were supplied as
follows (mg/L): K2HPO4, 125; NH4H2PO4, 1500; MgCl2 6H2O, 100; FeSO4 7H2O, 25;
ZnCl2, 75; MnSO4 H2O, 15; CuSO4 5H2O, 5; CoCl2 6H2O, 3; Na2B4O7 10H2O, 0.15;
Na2MoO4 2H2O, 12.5; NiCl2 6H2O, 0.08; Na2SeO3, 0.01. The Na2HPO4 were adjusted
between 1 and 2 g/L to maintain the reactor pH at around 4.9.
5.2.2 Reactor design
Two up-flow anaerobic packed-bed reactors were used (Figure 5.1). The reactors
dimensions were: inner diameter of 80 mm, outer diameter of 88mm, length of 820 mm
giving 2.69 L, 3.88 L and 4 L of liquid, bed, and total volume, respectively. The reactors
were divided into three compartments (the entrance of the influent, the effluent exit and the
fixed-bed), which were separated by a stainless steel mesh. Along the fixed-bed section
there were 5 sampling ports homogeneously distributed, the influent section had an
additional sampling port (Fig. 5.1). The substrate and a effluent recirculation were fed using
two positive displacement pumps (Prominent® Concept Plus). The packing material used
to attach the biomass was recycled low-density polyethylene (10x10x20 mm), a non-porous
material with a surface area of approximately 7.94 m2/g.
5.2.3 Inoculum
The inoculum for each reactor was obtained by the natural fermentation of a CWP solution
(40 g COD/L), which was prepared with tap water and stored in an opened container for
three days. This process favored the fermentation of the substrate by the microorganisms
present in the environment and in the CWP. Between reactor A and B operation was a gap
of 40 days, for each reactor an inoculum was prepared at room conditions.
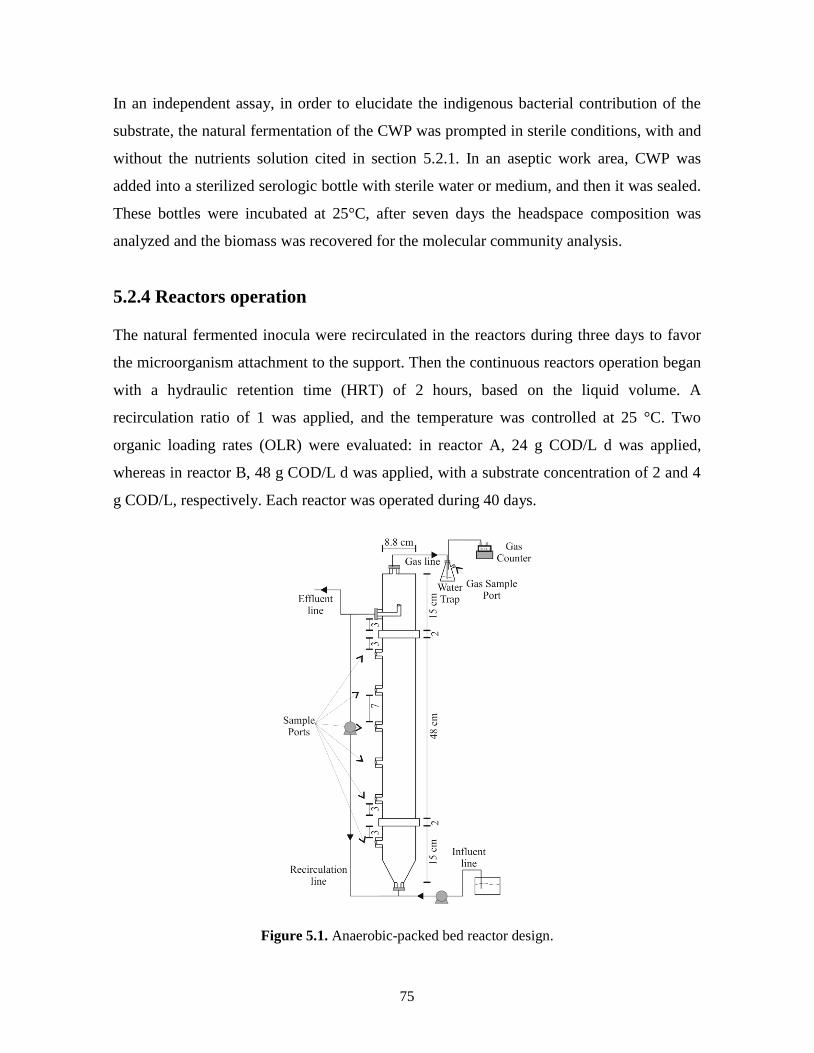
75
In an independent assay, in order to elucidate the indigenous bacterial contribution of the
substrate, the natural fermentation of the CWP was prompted in sterile conditions, with and
without the nutrients solution cited in section 5.2.1. In an aseptic work area, CWP was
added into a sterilized serologic bottle with sterile water or medium, and then it was sealed.
These bottles were incubated at 25°C, after seven days the headspace composition was
analyzed and the biomass was recovered for the molecular community analysis.
5.2.4 Reactors operation
The natural fermented inocula were recirculated in the reactors during three days to favor
the microorganism attachment to the support. Then the continuous reactors operation began
with a hydraulic retention time (HRT) of 2 hours, based on the liquid volume. A
recirculation ratio of 1 was applied, and the temperature was controlled at 25 °C. Two
organic loading rates (OLR) were evaluated: in reactor A, 24 g COD/L d was applied,
whereas in reactor B, 48 g COD/L d was applied, with a substrate concentration of 2 and 4
g COD/L, respectively. Each reactor was operated during 40 days.
Figure 5.1. Anaerobic-packed bed reactor design.
76
5.2.5 Hydrogen consuming activity batch assays
At days 20, 35 and 40 of reactor A operation; and days 20, 29 and 40 of reactor B
operation, biomass samples were withdrawn. To recover the biomass, 50 mL from each
sampling port (6 in total) were withdrawn, mixed, and centrifuged. From each of the
composed biomass samples and from the inoculum of each reactor, the hydrogen
consuming activity batch assays were carried out as follows: in 315 mL bottles, 4.5 g VS/L
of biomass was inoculated in 80 mL of working volume and 225 mL of headspace. Mineral
medium (section 5.2.1) was used and the pH was adjusted with HCl 1 N to maintain similar
conditions as in the reactor. The headspace was flushed with hydrogen (99.9 %) and the
inner pressure was equalized to atmospheric pressure. Then 80 mL of headspace were
removed with a syringe and replaced with CO2 (99.9%), as the only carbon source, to keep
a H2/CO2 ratio of 2/1.
Batch assay were performed in duplicate with a negative control without any biomass. The
H2/CO2 consumption was followed measuring the headspace pressure using a manometer,
and analyzing the headspace composition by gas chromatography. For each bottles the
H2/CO2 was injected two times and its consumption monitored in order to report the
maximum activity. The specific activity was calculated according to the maximum
hydrogen consumption rate and the biomass concentration, and expressed as mL H2
consumed/g SV-d. In order to compare the H2/CO2 consumption and the expected acetate
consistent with the stoichiometry of reaction 5.1, the initial and final acetate concentrations
were also measured.
4H2 + 2CO2 --- CH3COOH + 2H2O (5.1)
5.2.6 Analytical methods
The biogas produced in the reactors was recorded using a MilliGascounter (Ritter®) gas
meter. The composition of the biogas (hydrogen, carbon dioxide and methane) was
determined by gas chromatography (GC 2010 Shimadzu), using a thermal conductivity
detector and argon as the carrier gas. The temperatures of the injector, detector and column
were maintained at 30 °C, 200 °C and 230 °C, respectively.
77
Organic acids and solvents were analyzed with a Shimadzu® high pressure liquid
chromatography system that was composed of an LC-10ADvp pump, an FCV-10ALvp
solenoid valve, a CTO-10Avp oven (working temperature of 45-50 °C), an SCL-10Avp
controller, an SPDM10Avp UV detector with a diode array of 205 nm and an Aminex
HPX-87H ionic exchange column (0.3 m x 7.8 mm). The moving phase was 0.005 M
H2SO4 and had a flow rate of 0.6 mL/min.
Carbohydrate concentrations were determined by the colorimetric method developed by
Dubois et al., (1956). COD and volatile solids (VS) were determined in accordance with the
Standard Methods for Examination of Water and Wastewater (APHA/AWWA/WFE,
2005).
5.2.7 DGGE
The total DNA was extracted from the biomass used in the batch assays using glass beads,
phenol and chloroform method (Griffiths et al., 2000). For the bacterial analysis community
the DNA templates were amplified via a polymerase chain reaction (PCR) using specific
primers for the partial amplification of 16S rRNA genes for bacteria (968f and 1392r) and
archaea (1100f and 1400r) domains (Kudo et al., 1997; Nübel et al., 1996). In both cases, a
GC-clamp was added to the forward primer. The amplified DNA fragments were separated
by denaturing gradient gel electrophoresis (DGGE), with denaturing concentrations of
45%-65%, and 40%-70% (urea and formamide), for bacteria and archaea, respectively.
Shannon–Wiener diversity indices (H) were calculated using the intensities of the bands on
the DGGE fingerprints, expressed as the peak height in the densitometric curves, according
to the equation: H=-Σ(Pi ln(Pi)), where: H is the diversity index and Pi is the importance
probability of the bands in a lane (Pi = ni/N, where ni is the height of an individual peak and
N is the sum of all peak heights in the densitometric curves). The bacterial and archeal
community changes were evaluated using the similarity and diversity indices results from
the DGGE gel analysis.

78
5.3. Results and Discussion
Two fermentative packed-bed reactors fed with CWP were operated during 40 days, the
specific hydrogen consuming activity was evaluated over the time in batch assays.
5.3.1 Reactor performance
Figures 5.2 and 5.3 depict the gas production rates and metabolites concentration,
expressed as equivalent COD (to show the substrate’s electrons directed towards each
compound), from reactor A and B, respectively. During the start up, both reactors showed a
similar performance, reaching the highest hydrogen production at day 5, corresponding to a
yield of 2.92 and 2.55 mol H2/mol lactose consumed, for reactor A and B respectively.
Before day 5, the main metabolites in both reactors were lactic acid and ethanol.
In packed bed reactors, a higher hydrogen production after the start-up and a following
drop has been a common tendency (Figures 5.2a and 5.3a). For instance, Fontes Lima and
Zaiat (2012), achieved a maximal volumetric hydrogen production rate (VHPR) of 6.95 L
H2/L-d, approximately 20 days after the start-up, applying 24 g COD/L-d. Nevertheless
during 80 days of operation the average value was 2.9 ± 1.7 L H2/L-d.
In Reactor A, between days 18 and 26, there was a stable stage with an average VHPR of
1.2 ± 0.4 L H2/L-d, producing mainly butyric acid as metabolite. The highest VHPR
reached in Reactor B was 6.83 L H2/L-d, similar to the production rate (7.69 L H2/L-d)
obtained by Soares-Fernades (2008) using the same reactor configuration at 48 g COD/L d,
but fed with sucrose at 0.5 h of HRT. Even though the double OLR applied in reactor B
compared to Reactor A, in Reactor B a decreasing trend in the VHPR between days 7 and
15 was observed, with an average production rate of 1.5 ± 0.52 L H2/L-d. In this period in
reactor B, the main metabolites produced were butyric acid and ethanol. A similar trend
was also observed in the latter cited work (Soares-Fernades, 2008), where the VHPR
dropped 50 % after 30 days of operation, and the hydrogen production stopped definitively
after 40 days.
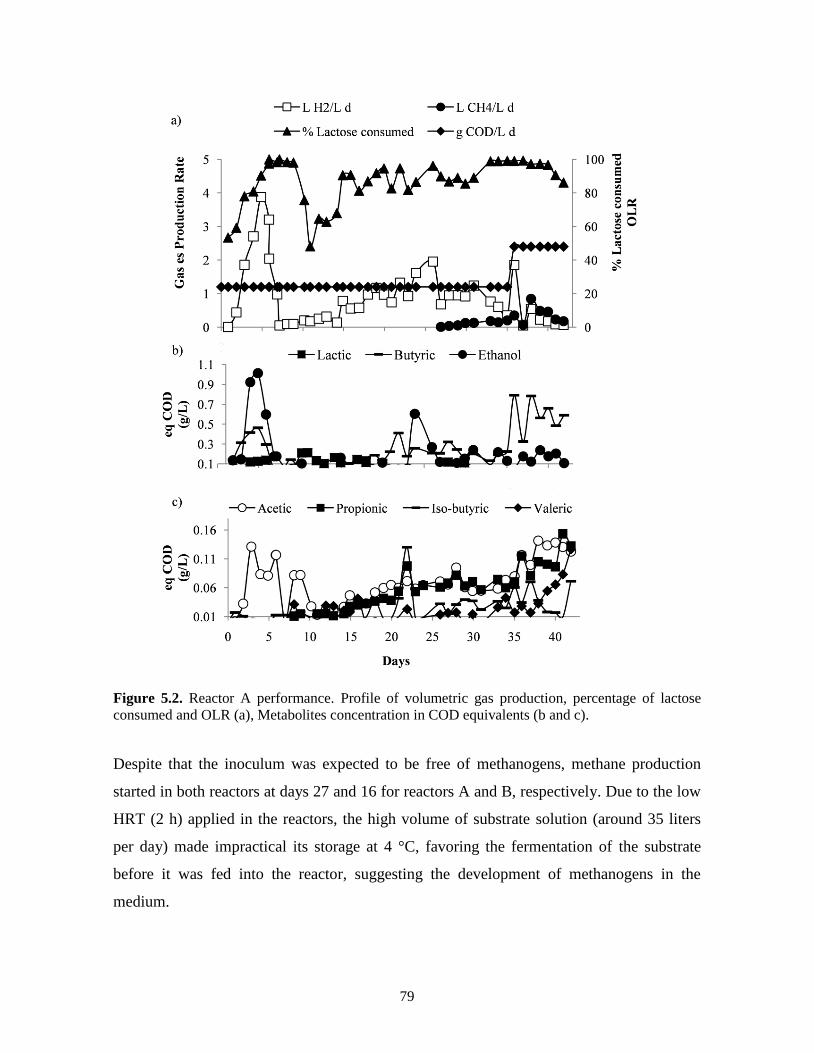
79
Figure 5.2. Reactor A performance. Profile of volumetric gas production, percentage of lactose
consumed and OLR (a), Metabolites concentration in COD equivalents (b and c).
Despite that the inoculum was expected to be free of methanogens, methane production
started in both reactors at days 27 and 16 for reactors A and B, respectively. Due to the low
HRT (2 h) applied in the reactors, the high volume of substrate solution (around 35 liters
per day) made impractical its storage at 4 °C, favoring the fermentation of the substrate
before it was fed into the reactor, suggesting the development of methanogens in the
medium.
80
In reactor A, the VHPR remained at 0.87 ± 0.21 L H2/L-d, between days 27 and 34,
meanwhile the volumetric methane production rate (VMPR) was 0.1 ± 0.07 L CH4/L-d
(Figure 5.2a). During that period the main metabolites produced were ethanol and butyric
acid. In reactor B, the VHPR dropped to 0.24 ± 0.12 L H2/L-d during days 18 to 28. During
the same period, the VMPR was 0.20 ± 0.08 L CH4/L-d. Despite the low hydrogen
production, the main metabolites produced were butyrate and acetate, in similar equivalent
COD concentrations (Figs. 5.2b and c).
In order to diminish the methane production in both reactors by the effect of a shock load
(Carrillo-Reyes et al., 2011), the OLR was increased 100 % at days 35 and 28 in reactor A
and B, respectively (Figures 5.2a and 5.3a). In reactor A the VHPR increased to 1.85 L
H2/L-d at day 36; however, the shock load strategy had a negative effect in the VHPR in
both reactors, decreasing to 0.22 and 0.16 L H2/L-d in reactor A and B, respectively, during
the last operation days. Moreover, the VMPR increased in reactor A to 0.44 L CH4/L-d.
The lactose consumption was higher than 97 % during the shock load, and the metabolites
concentration showed an acetate-butyrate pathway for both reactors.
5.3.2 Hydrogen consumption batch assays
In order to evaluate the specific hydrogen consumption rate, batch assays were carried out
using biomass withdrawn from the reactors. Due to the methane occurrence, the headspace
analysis from the batch assays was used as indicator of homoacetogenic activity, when
hydrogen consumption was detected and methane was not produced; and when methane
production was detected this was an indicator of hydrogenotrophic methanogenic activity.
Table 5.1 shows the specific hydrogen-consuming activity of each sample and the type of
activity developed, either homoacetogenic or methanogenic.
The specific hydrogen consuming assays showed that the inoculum did not have
methanogenic activity but had homoacetogenic activity. The first biomass sample taken
from the reactors showed an increment of the homoacetogenic activity compared to the
inoculum. Before the methane occurrence, the hydrogen partial pressure in reactors A and
B was between 0.51-0.73 and 0.49-0.61 atm, respectively. Those partial pressures were

81
high enough to reach the H2 threshold needed for homoacetogenesis (Cord-Ruwisch et al.,
1988). Therefore, it was assumed that this activity was prompted at such conditions.
Figure 5.3. Reactor B performance. Profile of volumetric gas production, percentage of lactose
consumed and OLR (a), Metabolites concentration in COD equivalents (b and c).
In the Reactor B, the total biomass withdrawn from the sample ports during days 6 to 15 (as
purge sludge) was used to evaluate the hydrogen consuming activity, before the methane
occurrence. On this sample, the first batch assay showed hydrogen consumption due to

82
homoacetogenic activity; in a second feed with H2/CO2 (8 days after the first feed),
hydrogen consumption was due to methanogenic activity, increasing the hydrogen specific
consumption rate (table 5.1). A similar result was found by Dinamarca et al. (2011), where
homoacetogenic activity was present at the batch experiment start-up, and unintended
methane started to be produced after 50 hours. The authors attributed the methane to
acetoclastic activity. In contrast to the present study, where the hydrogenotrophic
methanogenic activity was proved by the hydrogen consumption, and the methane
production according to the headspace composition analysis.
The methane hydrogenogenic activity subsequent to the homoacetogenic activity, as shown
in the batch assays from samples of day 6 to 15 of reactor B, can be explained by the lower
generation time of homoacetogens (1.75 to 29 h) compared to the generation time of
hydrogen consuming methanogens (> 6 h) (Zhang and Noike, 1994).
Table 5.1. Specific hydrogen consuming activity for the biomass withdrawn from the reactors.
Reactor Day mmol H2/g VS d Activity
A
Inoculum 4.92(0.07)1 Homoacetogenic
21 8.34(1.6) Homoacetogenic
35 9.24(0.94) Methanogenic
40 9.07(1.47) Methanogenic
B
Inoculum 3.76(0.53) Homoacetogenic
6-15(First)2 4.83(0.51) Homoacetogenic
6-15(Second)2 6.28(0.79) Methanogenic
20 6.53(0.49) Methanogenic
29 6.59(2.82) Methanogenic
40 7.34(0.17) Methanogenic
1 (standard deviation, n=2);
2 Results corresponding to the fisrt and the second
H2/CO2 feed.
In both reactors the hydrogen consuming activities increased in comparison with the
inoculum, whereas all the results from samples with methanogenic activity in both reactors
did not showed significant difference, according to a statistical test ANOVA (α=0.05),
fobs=0.1893, fcrit= 6.5914. Therefore, the increasing methanogenic activity in the reactors
can be explained by the increment in the biomass concentration, even though a constant
purge of biomass in both reactors was carried out. In packed bed reactors, common
83
problems to overcome are the clogging of the packed-bed and the growth of unwanted
microorganisms attached to the support (Peixoto et al., 2011).
Due to eventual methanogenic activity in the reactors and the batch assays results, it can be
assumed that the hydrogen consuming activity by homoacetogenesis was replaced by the
methanogenesis over the operation time. In reactor A the increment of the specific
hydrogen consuming activity from day 21 (homoacetogenic) to day 35 (methanogenic), was
only 10 %; whereas in reactor B the increment from the sample with biomass of days 6 to
15 (homoacetogenic) to day 20 (methanogenic) was 35%. A higher increased in the specific
hydrogen consumption due to methanogenesis in reactor B compare to reactor A, can be
explained by the different inoculum community structure for each reactor, as is shown in
the next section (Figure 5.4).
5.3.3 DGGE fingerprints
The bacterial and archaeal communities were analyzed by PCR-DGGE of the partial
amplification of the 16S rDNA gene. Figure 5.4 shows the bacterial DGGE fingerprint and
the similarity Dice index for the samples of both reactors. The Shannon–Wiener diversity
index of each sample was calculated to have a numeric comparison point to relate the
number of bands in the gel, corresponding to the number of different 16S rDNA amplified,
and their relative abundances, according to the intensity of each band; results are depicted
in Figure 5.5.
The fermented CWP with and without nutrients were clustered together, close to the
inoculum of reactor B. Even though the inoculum of both reactors were prepared following
the same procedure but at different days (section 5.2.3), the inoculum of reactor A was
cluster separately from the other communities, showing a bacterial selection depending of
the environmental conditions. The cluster distribution shows that at the end of reactor A
operation (day 40), there was a different community selection compare to previous samples
from the same reactor. In contrast to reactor B, the two last fingerprints (day 29 and 40) had
a similarity higher than 80 %.
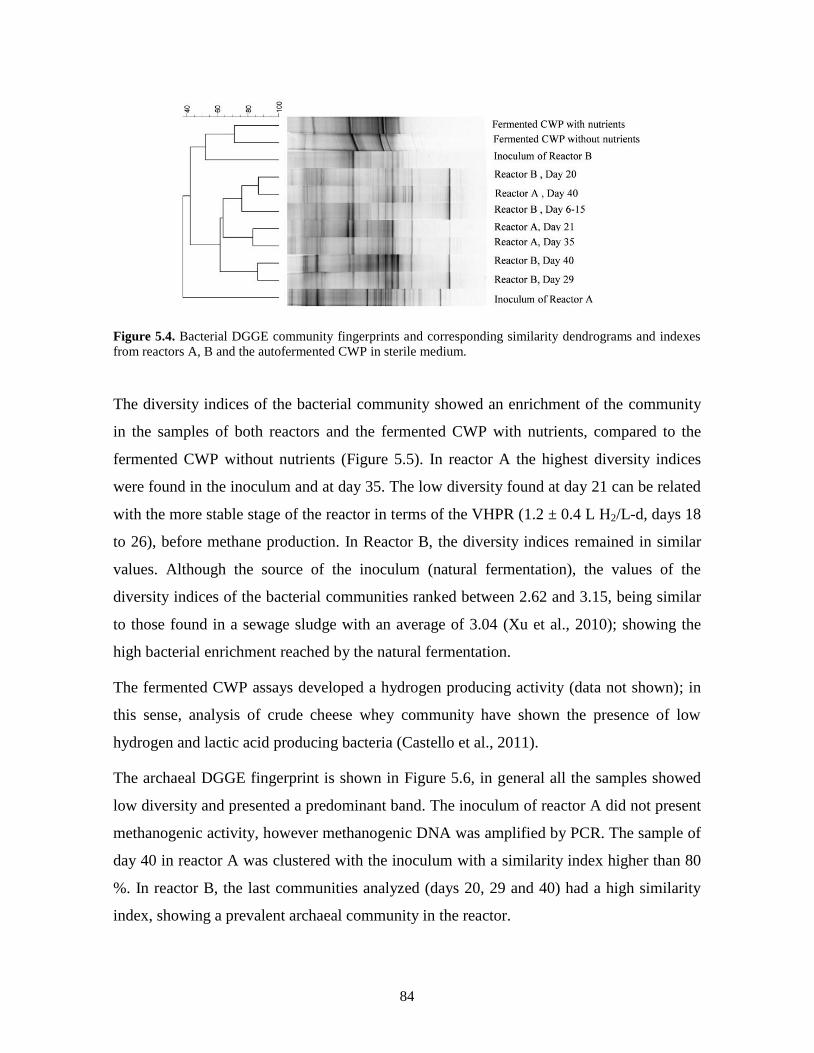
84
Figure 5.4. Bacterial DGGE community fingerprints and corresponding similarity dendrograms and indexes
from reactors A, B and the autofermented CWP in sterile medium.
The diversity indices of the bacterial community showed an enrichment of the community
in the samples of both reactors and the fermented CWP with nutrients, compared to the
fermented CWP without nutrients (Figure 5.5). In reactor A the highest diversity indices
were found in the inoculum and at day 35. The low diversity found at day 21 can be related
with the more stable stage of the reactor in terms of the VHPR (1.2 ± 0.4 L H2/L-d, days 18
to 26), before methane production. In Reactor B, the diversity indices remained in similar
values. Although the source of the inoculum (natural fermentation), the values of the
diversity indices of the bacterial communities ranked between 2.62 and 3.15, being similar
to those found in a sewage sludge with an average of 3.04 (Xu et al., 2010); showing the
high bacterial enrichment reached by the natural fermentation.
The fermented CWP assays developed a hydrogen producing activity (data not shown); in
this sense, analysis of crude cheese whey community have shown the presence of low
hydrogen and lactic acid producing bacteria (Castello et al., 2011).
The archaeal DGGE fingerprint is shown in Figure 5.6, in general all the samples showed
low diversity and presented a predominant band. The inoculum of reactor A did not present
methanogenic activity, however methanogenic DNA was amplified by PCR. The sample of
day 40 in reactor A was clustered with the inoculum with a similarity index higher than 80
%. In reactor B, the last communities analyzed (days 20, 29 and 40) had a high similarity
index, showing a prevalent archaeal community in the reactor.
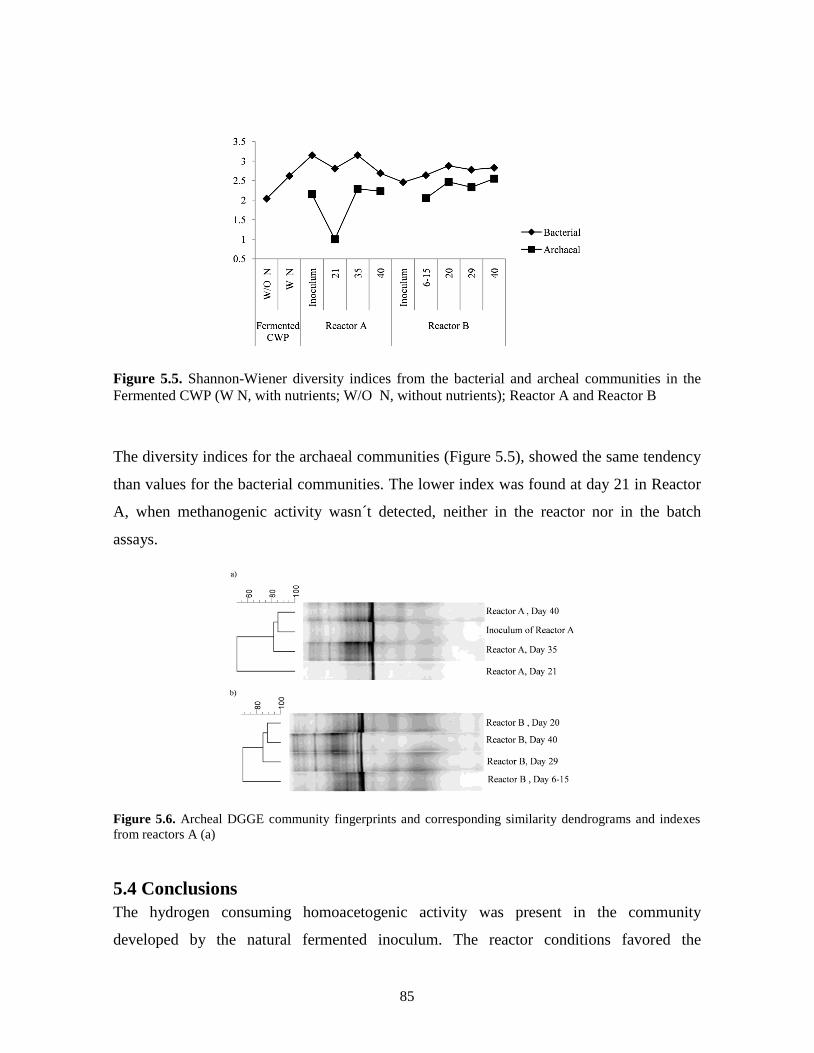
85
Figure 5.5. Shannon-Wiener diversity indices from the bacterial and archeal communities in the
Fermented CWP (W N, with nutrients; W/O N, without nutrients); Reactor A and Reactor B
The diversity indices for the archaeal communities (Figure 5.5), showed the same tendency
than values for the bacterial communities. The lower index was found at day 21 in Reactor
A, when methanogenic activity wasn´t detected, neither in the reactor nor in the batch
assays.
Figure 5.6. Archeal DGGE community fingerprints and corresponding similarity dendrograms and indexes
from reactors A (a)
5.4 Conclusions
The hydrogen consuming homoacetogenic activity was present in the community
developed by the natural fermented inoculum. The reactor conditions favored the

86
homoacetogenic community, increasing their specific activity. Possibly the substrate stock
at room conditions prompted the growth of methanogenic microorganisms, establishing a
community in the reactors as show by the DGGE fingerprints. Even though the low growth
rate of methanogens and the high hydrogen threshold for homoacetogens, once the
methanogenesis was present, it became the responsible of the hydrogen consuming activity.
The change of homoacetogenesis to methanogenesis, did not represent an important
increment in the specific hydrogen consuming activity. Unless methanogenesis can be
avoided, this experience questions the viability of using raw cheese whey as substrate for
hydrogen production at industrial scale.
5.5 References
APHA/AWWA/WFE. 2005. Standard methods for the examination of water and wastewater. 21th
edn, Washington DC, USA.
Arooj MF, Han SK, Kim SH, Kim DH, Shin HS. 2008. Continuous biohydrogen production in a
CSTR using starch as a substrate. Int J Hydrogen Energy 33:3289–3294.
Bastidas-Oyanedel J-R, Mohd-Zaki Z, Zeng RJ, Bernet N, Pratt S, Steyer J-P, Batstone DJ. 2012.
Gas controlled hydrogen fermentation. Bioresour Technol 110:503–509.
Carrillo-Reyes J, Celis LB, Alatriste-Mondragon F, Razo-Flores E. 2011. Strategies to decrease the
methane production in UASB hydrogenogenic reactors. In: Ouro Preto, Minas Gerais, Brazil,
p. 8.
Castello E, Perna V, Wenzel J, Borzacconi L, Etchebehere C. 2011. Microbial community
composition and reactor performance during hydrogen production in a UASB reactor fed
with raw cheese whey inoculated with compost. Water Sci. Technol. 64:2265–2273.
Cord-Ruwisch R, Seitz H-J, Conrad R. 1988. The capacity of hydrogenotrophic anaerobic bacteria
to compete for traces of hydrogen depends on the redox potential of the terminal electron
acceptor. Archives Microbiol 149:350–357.
Davila-Vazquez G, Cota-Navarro CB, Rosales-Colunga LM, De León-Rodríguez A, Razo-Flores E.
2009. Continuous biohydrogen production using cheese whey: Improving the hydrogen
production rate. Int J Hydrogen Energy 34:4296–4304.
Dinamarca C, Bakke R. 2009. Apparent hydrogen consumption in acid reactors: observations and
implications. Water Sci Technol 59:1441–1447.
Dinamarca C, Ganan M, Liu J, Bakke R. 2011. H-2 consumption by anaerobic non-methanogenic
mixed cultures. Water Sci. Technol. 63:1582–1589.
Dubois M, GILLES KA, HAMILTON JK, REBERS PA, SMITH F. 1956. Colorimetric Method
for Determination of Sugars and Related Substances. Anal Chem 28:350–356.
Fontes Lima DM, Zaiat M. 2012. The influence of the degree of back-mixing on hydrogen
production in an anaerobic fixed-bed reactor. Int J Hydrogen Energy 37:9630–9635.
Griffiths RI, Whiteley AS, O’Donnell AG, Bailey MJ. 2000. Rapid Method for Coextraction of
DNA and RNA from Natural Environments for Analysis of Ribosomal DNA- and rRNA-
Based Microbial Community Composition. Appl Environ Microbiol 66:5488–5491.
Kraemer JT, Bagley DM. 2008. Measurement of H2 consumption and its role in continuous
fermentative hydrogen production. Water Sci Technol 57:681.

87
Kudo Y, Nakajima T, Miyaki T, Oyaizu H. 1997. Methanogen flora of paddy soils in Japan. FEMS
Microbiol Ecol 22:39–48.
Nübel U, Engelen B, Felske A, Snaidr J, Wieshuber A, Amann RI, Ludwig W, Backhaus H. 1996.
Sequence heterogeneities of genes encoding 16S rRNAs in Paenibacillus polymyxa detected
by temperature gradient gel electrophoresis. J Bacteriol. 178:5636–5643.
Oh SE, Van Ginkel S, Logan BE. 2003. The relative effectiveness of pH control and heat treatment
for enhancing biohydrogen gas production. Environ Sci Technol 37:5186–5190.
Peixoto G, Saavedra NK, Varesche MBA, Zaiat M. 2011. Hydrogen production from soft-drink
wastewater in an upflow anaerobic packed-bed reactor. Int J Hydrogen Energy 36:8953–
8966.
Saxena RC, Adhikari DK, Goyal HB. 2009. Biomass-based energy fuel through biochemical routes:
A review. Renew Sust Energ Rev 13:167–178.
Soares-Fernades B. 2008. Produção de hidrogênio en reator anaeróbio de leito fixo. PhD Thesis;
São Carlos, Brasil: Universidade de São Paulo.
Valdez-Vazquez I, Poggi-Varaldo HM. 2009. Hydrogen production by fermentative consortia.
Renew Sust Energy Rev 13:1000–1013.
Xu K, Liu H, Li X, Chen J, Wang A. 2010. Typical methanogenic inhibitors can considerably alter
bacterial populations and affect the interaction between fatty acid degraders and
homoacetogens. Appl Microbiol Biotechnol 87:2267–2279.
Zhang TC, Noike T. 1994. Influence of retention time on reactor performance and bacterial trophic
populations in anaerobic digestion processes. Water Res 28:27–36.

88
Chapter 6
Perspectives, conclusions and final remarks

89
6.1 General discussion
In the present thesis, fixed biomass reactors using cheese whey powder as substrate were
evaluated for hydrogen production. The start-up time is a limitation in granular systems,
like the UASB reactors, related to the long time required to obtain a stable community,
usually several months (Chang and Lin, 2004; Mu and Yu, 2006). In Chapter 2 different
start-up strategies and inoculum structures were analyzed in UASB reactors. A
conventional strategy based on the gradual decrease of the HRT from 24 to 6 hours in a
period of 50 days, maintaining a constant OLR at 20 g COD/L-d was the more suitable
strategy, according to the specific hydrogenogenic activity tests (1469.7 and 773.4 mL H2/g
VS-d for R2 and R4, respectively); The VHPR reached under these conditions was between
1 to 1.7 L/L-d in the first 30 days (R4, Figure 2.2d), using a treated granular sludge as
inoculum .
In the start-up of the packed-bed reactor inoculated with natural fermented cheese whey
(Figure 5.2) the VHPR reached values of 3 L/L-d (packed-bed reactor A). However,
between days 18 to 26, there was a stable stage producing 1.2 ± 0.4 L H2/L-d. The VHPR
obtained in the granular system (UASB reactor) and in the biofilm based system (packed-
bed reactor) at similar OLR (20 and 24 g COD/L-d, respectively), had equivalent values, in
spite of the different HRT and inoculum. Other UASB reactors fed with cheese whey at 20
g COD/L-d, had lower VHPRs reporting less than 45 and 500 mL H2/L-d (Castello et al.,
2009; Castello et al., 2011). The latter comparison shows that according to the conditions
evaluated in Chapter 3 and Chapter 5, the UASB and the packed bed reactors have the
equivalent hydrogen producing potential. Recently Chojnacka et al. (2011) found that a
granular based system produced hydrogen significantly more effectively than another
containing only biofilm. Nevertheless, the efficiency of a biofilm system is determined by
the characteristic of the support that allows the biomass adhesion.
Over the operation time of the reactors, microbial activities that diminished the hydrogen
yield were identified, such as methanogenesis and homoacetogenesis. Both processes are a
common concern of fixed biomass reactors (Castello et al., 2009; Moreno-Davila et al.,
2011; Wang et al., 2007). The importance of the hydrogen consuming microorganisms was
evaluated either measuring the hydrogen consuming activities in batch assays using the
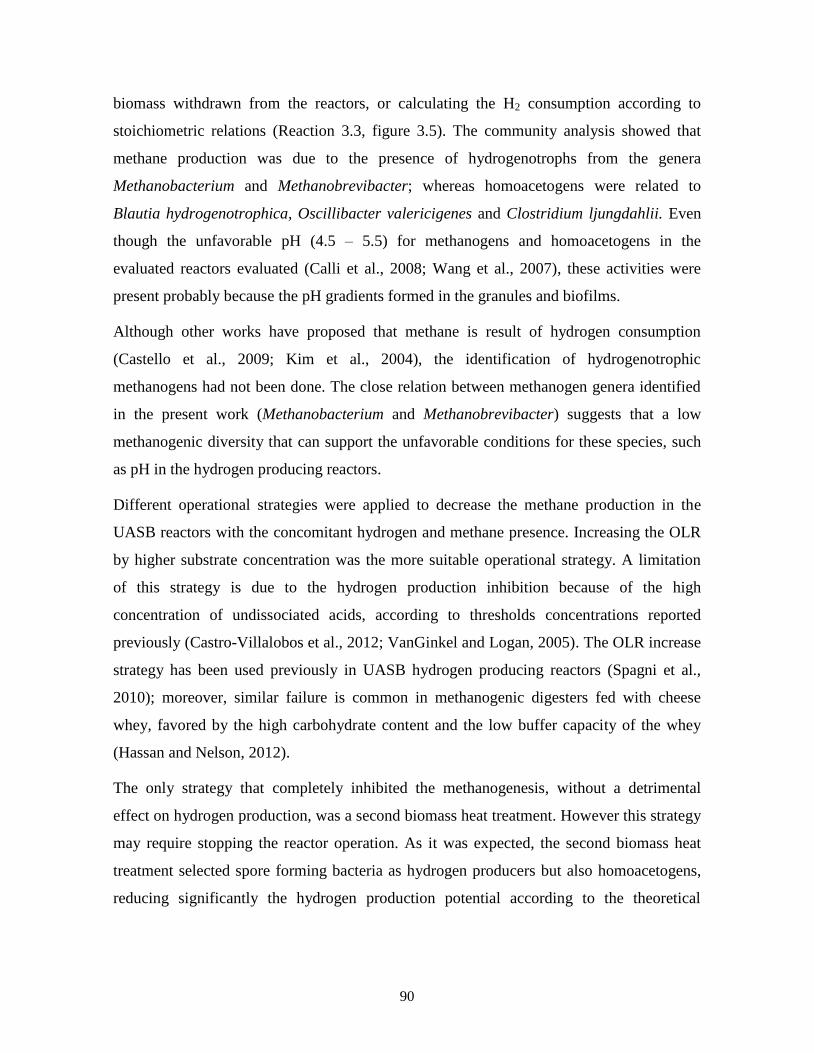
90
biomass withdrawn from the reactors, or calculating the H2 consumption according to
stoichiometric relations (Reaction 3.3, figure 3.5). The community analysis showed that
methane production was due to the presence of hydrogenotrophs from the genera
Methanobacterium and Methanobrevibacter; whereas homoacetogens were related to
Blautia hydrogenotrophica, Oscillibacter valericigenes and Clostridium ljungdahlii. Even
though the unfavorable pH (4.5 – 5.5) for methanogens and homoacetogens in the
evaluated reactors evaluated (Calli et al., 2008; Wang et al., 2007), these activities were
present probably because the pH gradients formed in the granules and biofilms.
Although other works have proposed that methane is result of hydrogen consumption
(Castello et al., 2009; Kim et al., 2004), the identification of hydrogenotrophic
methanogens had not been done. The close relation between methanogen genera identified
in the present work (Methanobacterium and Methanobrevibacter) suggests that a low
methanogenic diversity that can support the unfavorable conditions for these species, such
as pH in the hydrogen producing reactors.
Different operational strategies were applied to decrease the methane production in the
UASB reactors with the concomitant hydrogen and methane presence. Increasing the OLR
by higher substrate concentration was the more suitable operational strategy. A limitation
of this strategy is due to the hydrogen production inhibition because of the high
concentration of undissociated acids, according to thresholds concentrations reported
previously (Castro-Villalobos et al., 2012; VanGinkel and Logan, 2005). The OLR increase
strategy has been used previously in UASB hydrogen producing reactors (Spagni et al.,
2010); moreover, similar failure is common in methanogenic digesters fed with cheese
whey, favored by the high carbohydrate content and the low buffer capacity of the whey
(Hassan and Nelson, 2012).
The only strategy that completely inhibited the methanogenesis, without a detrimental
effect on hydrogen production, was a second biomass heat treatment. However this strategy
may require stopping the reactor operation. As it was expected, the second biomass heat
treatment selected spore forming bacteria as hydrogen producers but also homoacetogens,
reducing significantly the hydrogen production potential according to the theoretical

91
hydrogen consumption. Therefore a more suitable strategy to avoid methanogens was
evaluated, measuring the relevance of the homoacetogenic activity in batch assays.
The use of an inoculum obtained from naturally fermented cheese whey, that in principle
did not have methanogens, was evaluated in packed-bed reactors. Nevertheless methane
occurrence was detected, replacing the homoacetogenic activity over the operation time of
the reactors; demonstrating that hydrogen consumption by homoacetogens can be as
relevant as the methanogenic hydrogen consumption. In this sense, this is the first work
where the homoacetogenic specific activities of continuous hydrogen producing reactors
are evaluated.
Related to the unintended methane occurrence in packed bed reactors inoculated with
naturally fermented cheese whey, it is possible that the high biodegradability of the cheese
whey and its content of nutrients and vitamins enriched the indigenous microorganisms and
those found in the environment (Prazeres et al., 2012). Similar results were found in a
UASB reactor inoculated with kitchen waste compost fed with cheese whey, where no
methane was expected, however, it was detected in a minor concentration after 56 days of
operation (Castello et al., 2011). In this sense, the activity and relevance of the indigenous
microorganisms in the cheese whey had to be elucidated. In the present study the
indigenous bacteria of the CWP presented hydrogen production, proving that the
microorganisms survived the drying process of the raw cheese whey. Otherwise, the
presence of bacteria related to genus Lactobacillus (Figure 4.2) in the present work and
others can reduce the viability of fermentable sugars (Castello et al., 2011). For instance,
Stamatelatou et al., (2011) found lactic acid production in the cheese whey in spite it was
stored at 4 °C.
This work contributes to establish the parameters that can control the methanogenic activity
once it appears in hydrogenogenic systems. One of the most important results is that
methanogenesis replaced to the homoacetogenesis, or vice versa, as happened in the
packed-bed or UASB reactors, respectively. Also it was proved that the hydrogen
production potential of fixed biomass reactors is restricted in similar magnitude by
homoacetogenesis or methanogenesis. Therefore, in this work was elucidated the relevance
92
of the hydrogen consumption in hydrogenogenic fixed biomass reactors, giving a first
approach to control this undesirable activity.
6.2 Conclusions and final remarks
The results of this work showed the importance of choosing adequate starting-up reactor
operational conditions for hydrogen production. Due to the possibility of methanogens
presence in different inocula, it is recommended using high substrate concentration (20 g
COD/L) and an acidic pH around 5.0, as was applied in the strategy B presented in Chapter
2.
Once there was methane occurrence in the UASB hydrogenogenic reactor, the most
suitable strategy to control de methane production was to increase the OLR by increasing
the substrate concentration. In this sense, a recent work evaluated the possibility of shifting
a methanogenic process for hydrogen production with grass silage as substrate, using the
same strategies as in the present work (Pakarinen et al., 2011). These results demonstrate
that such strategies have the potential to control methanogens in hydrogen producing
reactors and according to the literature this strategy can be evaluated using other substrates.
About the inocula evaluated, during the start-up with heat treated anaerobic sludge and the
naturally fermented cheese whey, similar hydrogen rates were produced in stable
conditions. Even though, with the naturally fermented cheese whey yield peaks of 2.9 mol
H2/mol lactose, similar to the yields reported by Davila-Vazquez et al. (2009) were
achieved, and correspond to the highest reported volumetric hydrogen production rates with
cheese whey. This result shows the potential of using the natural fermentation strategy to
inoculate hydrogen-producing reactors, moreover it is cheap and more suitable to use in
real applications than heat-treating an anaerobic sludge.
Another limitation found in the present work is the homoacetogenic presence. As is
established in the literature the hydrogen partial pressure threshold for this activity (520-
950 ppm) is readily reached in hydrogen producing systems (Cord-Ruwisch et al., 1988).
The homoacetogenic activity was assayed in different experiments in the present work, by
batch assays and some organisms related to this activity were identified. Using different
93
reactor configurations, flushing the reactor with N2, or even diminishing the pH have been
proposed as strategies to control homoacetogenic activity; nevertheless, there is a lack of
systematic studies focused on it, evaluating the real effect of the hydrogen partial pressure
in the homoacetogenic activity in hydrogen producing systems. Another challenge to
overcome in the study of homoacetogenic activity is the need of in situ evaluation. As was
mentioned previously, the homoacetogenic bacteria is a versatile group capable to develop
autotrophic or heterotrophic activity, therefore only an in situ activity test can give a
conclusive result. In this sense using molecular biology techniques such as FISH
(fluorescen in situ hybridisation), SIP (stable-isotopes probing), or RNA based target to the
homoacetogenic functional gene can be useful (Radajewski et al., 2003).
An important parameter that was not evaluated in the present study is the cheese whey
nutrient content. As has been mentioned, the cheese whey is rich in nutrients and vitamins
(Prazeres et al., 2012). In the present study the medium was amended with nutrients and
minerals; comparing with the works of Castello et al. (Castello et al., 2009; Castello et al.,
2011) they did not enriched the cheese whey and their production was lower than the
obtained in the present work at similar OLR. In this sense the optimum content of nutrients
in hydrogen producing systems with this substrate has to be investigated.
Even though the limitations of using cheese whey to produce hydrogen were addressed in
the present work, there is an increasing interest of using this process in the valorization of
this waste, mainly for those medium and small size companies that cannot afford the cost of
other technologies for valorization (such as spray dryers or ultrafiltration); having in mind
also the potential reactor failure during the anaerobic digestion of cheese whey. Further
research with the approaches outlined in this chapter are needed, in order to get closer to a
real application of cheese whey to produce hydrogen.
6.3 References
Calli B, Zhao J, Nijssen E, Vanbroekhoven K. 2008. Significance of acetogenic H2 consumption in
dark fermentation and effectiveness of pH. Water Sci Technol 57:809.
Castello E, García y Santos C, Iglesias T, Paolino G, Wenzelb J, Borzacconia L, Etchebehereb C.
2009. Feasibility of biohydrogen production from cheese whey using a UASB reactor: Links
between microbial community and reactor performance. Int J Hydrogen Energy 34:5674–
5682.

94
Castello E, Perna V, Wenzel J, Borzacconi L, Etchebehere C. 2011. Microbial community
composition and reactor performance during hydrogen production in a UASB reactor fed
with raw cheese whey inoculated with compost. Water Sci Technol 64:2265–2273.
Castro-Villalobos MC, Garcia-Morales JL, Fernandez FJ. 2012. By-products inhibition effects on
bio-hydrogen production. Int J Hydrogen Energy 37:7077–7083.
Chang FY, Lin CY. 2004. Biohydrogen production using an up-flow anaerobic sludge blanket
reactor. Int J Hydrogen Energy 29:33–39.
Chojnacka A, Błaszczyk MK, Szczęsny P, Nowak K, Sumińska M, Tomczyk-Żak K,
Zielenkiewicz U, Sikora A. 2011. Comparative analysis of hydrogen-producing
bacterial biofilms and granular sludge formed in continuous cultures of fermentative
bacteria. Bioresour Technol 102:10057–10064. Cord-Ruwisch R, Seitz H-J, Conrad R. 1988. The capacity of hydrogenotrophic anaerobic bacteria
to compete for traces of hydrogen depends on the redox potential of the terminal electron
acceptor. Arch Microbiol 149:350–357.
Davila-Vazquez G, Cota-Navarro CB, Rosales-Colunga LM, De León-Rodríguez A, Razo-Flores E.
2009. Continuous biohydrogen production using cheese whey: Improving the hydrogen
production rate. Int J Hydrogen Energy 34:4296–4304.
Hassan AN, Nelson BK. 2012. Invited review: Anaerobic fermentation of dairy food wastewater. J
Dairy Sci 95:6188–6203.
Kim IS, Hwang MH, Jang NJ, Hyun SHSH, Lee ST. 2004. Effect of low pH on the activity
of hydrogen utilizing methanogen in bio-hydrogen process. Int J Hydrogen Energy
29:1133–1140. Moreno-Davila IMM, Rios-Gonzalez LJ, Garza-Garcia Y, Rodriguez-de la Garza JA, Rodriguez-
Martinez J. 2011. Biohydrogen production from diary processing wastewater by anaerobic
biofilm reactors. Afr J Biotechnol 10:5320–5326.
Mu Y, Yu HQ. 2006. Biological hydrogen production in a UASB reactor with granules. I:
Physicochemical characteristics of hydrogen-producing granules. Biotechnol Bioeng 94:980–
987.
Pakarinen O, Kaparaju P, Rintala J. 2011. The effect of organic loading rate and retention time on
hydrogen production from a methanogenic CSTR. Bioresour Technol 102:8952–8957.
Prazeres AR, Carvalho F, Rivas J. 2012. Cheese whey management: A review. J Environ
Management 110:48–68.
Radajewski S, McDonald IR, Murrell JC. 2003. Stable-isotope probing of nucleic acids: a
window to the function of uncultured microorganisms. Curr Opin Biotechnol 14:296–
302. Spagni A, Casu S, Farina R. 2010. Effect of the organic loading rate on biogas composition in
continuous fermentative hydrogen production. J Environ Sci Health Part A-Toxic/Hazard.
Subst. Environ. Eng. 45:1475–1481.
Stamatelatou K, Antonopoulou G, Tremouli A, Lyberatos G. 2011. Production of Gaseous Biofuels
and Electricity from Cheese Whey. Ind Eng Chem Res 50:639–644.
VanGinkel S, Logan BE. 2005. Inhibition of Biohydrogen Production by Undissociated Acetic and
Butyric Acids. Environ Sci Technol 39:9351–9356.
Wang Y, Mu Y, Yu H-Q. 2007. Comparative performance of two upflow anaerobic biohydrogen-
producing reactors seeded with different sludges. Int J Hydrogen Energy 32:1086–1094.


