decentralized waste resource management: nisargruna experience · 2014-09-12 · decentralized...
TRANSCRIPT

Decentralized waste resource
management: Nisargruna experience
Sharad P. Kale
Head, Technology Transfer and
Collaboration Division
BHABHA ATOMIC RESEARCH CENTRE
MUMBAI 400085

Mumbai
Delhi Kolkata
Chennai
Bengaluru
Pune
e
Guwahati
Kochi
Amritsar
Shrinagar
Jaipur
Bhavnagar
Goa
Hyderabad
Leh
Chandigad
Bhpoal
Patna
Dehradun
Dibrugad
Madurai Trivendrum
Cuttack
Ranchi

8/23/2013 Earth needs your help

WASTE WEALTH
BANK
PERSPECTIVE
METTERS

Glass Metal Green Plastic landfill

Anaerobic digester
Thermophilic Aerobic digester
Recycle
water tank
Methane utilization
Methane holder
Manure pits
Platform
Mixer Solar heater
Compressor
Compressor Gas blower
Gas meter
Weighing Scale
Fly repellent lamp
Gas balloon (O)
Water removal chambers
Manure utilization Methane recycler
2010
Aeration grid

Plants
Primary producers
CO2 + H2O + Sunlight
Animals
Human
Microorganisms
Residues Bio
meth
an
ati
on
C
O2 +
CH
4
Fossil Fuel
Anthropogenic
activities
CO2
CO2 - non-cyclic
CO2 - cyclic

ENVIRONMENTAL SUSTAINABILITY AND
ECONOMICS
• 1 MT biodegradable waste is going to be 1 to 2 MT food
for tomorrow.
• Decentralized plants can substantially reduce
transportation costs and associated hazards.
• 1 MT biodegradable waste resource processing through
Nisargruna generates
• employment for 1 person
• 15-30 Kg fuel (Methane gas)
• 50-90 Kg manure
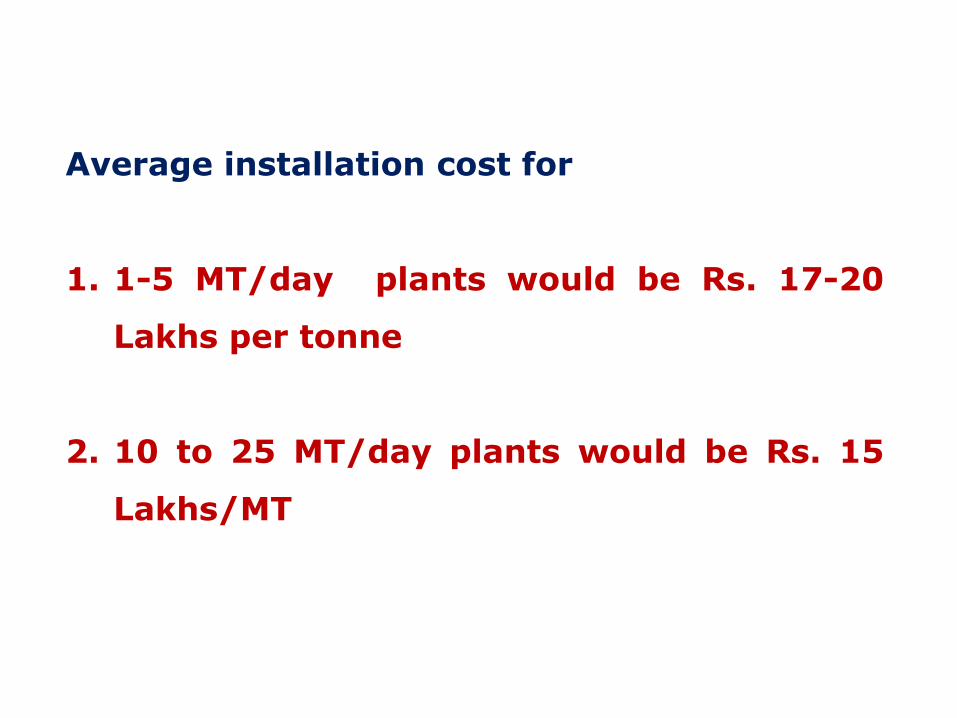
Average installation cost for
1. 1-5 MT/day plants would be Rs. 17-20
Lakhs per tonne
2. 10 to 25 MT/day plants would be Rs. 15
Lakhs/MT

Average O&M cost per annum for
1. 1-5 MT/day plants would be Rs. 1 Lakhs
per tonne
2. 10 to 25 MT/day plants would be Rs. 0.8
Lakhs/MT

Capacity
MT
Space
M2
Quantity processed
in 30 years (MT)
1 60 9900
2 100 19800
5 400 49500
10 1000 99000
25 2000 247500
50 4000 495000
Space economy in Nisargruna plants
Average life of a Nisargruna plant will be 30 years

• Paying back Nature’s loan
• Improving the environment
• Maintaining the resource recycling in equilibrium
• Improving the health aspects of city and country • Reducing carbon emissions through
• Vehicular transportation check
• Using biogas to replace fossil fuels
• Stopping the emission of methane at dumps
• Using manure replacing urea

NISARGRUNA PLANT: RAW MATERIALS
Type of material No. of plants Locations
Kitchen discards > 100 Most of the existing plants
Vegetable market > 30 Some plants receive mix materials
Abattoir discards 4 Deonar, Solapur, Kalyan
Bone protein factory discards
3 Chandrapur
Cattle dung 10 Nasik, Chiplun, Pali, Anjangaon, Vasai, Tara

APPROXIMATE QUANTITY OF MATERIAL PROCESSED AT
MAJOR LOCATIONS
Location Material processed (MT)
Location Material processed (MT)
Anushaktinagar 6000 Pandharpur 1000
Govandi 6000 Kaiga 1000
Matheran 6000 Cochin refinery
800
Kalameshwar 1500 Nasik 1200
Katol 1000 Symbiosis 1000
TIFR 1000 Symbiosis _2 800
INS Kunjali 1500 TCS, Thane 600
Pune (Model Colony)
2000 Alibag 600
Baramati 1000 Roha 1000
Nasik 1000 Pune 1000
Anjangaon 500 Kerala 1500
Chiplun 500 Thane 2000
Pali 500 Ankaleshwar 4000

TRAINING SCHOOL HOSTEL, ANUSHAKTINAGAR
JUNE 2002
4 MT/day
GAS IS USED IN HOSTEL KITCHEN

HIRANANDANI ESTATE, THANE
• 5MT/day hotel and vegetable
market material
• Area 300 m2
• Biogas for electricity
• December 2005

New waste resource processing room Generator
Solar heater
Gas dome
Balloon room
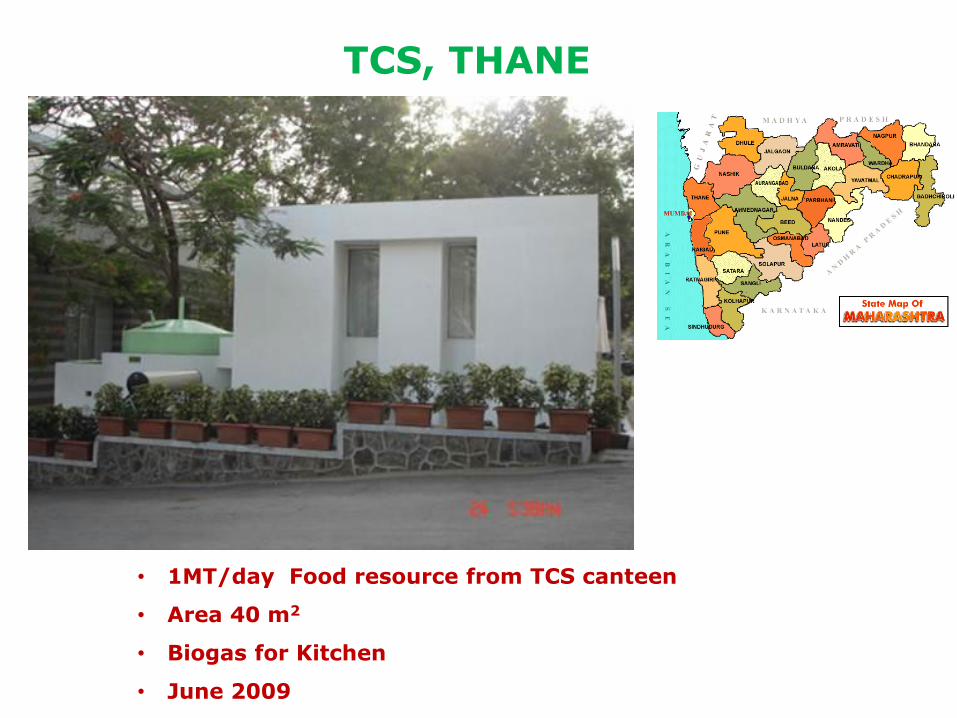
TCS, THANE
• 1MT/day Food resource from TCS canteen
• Area 40 m2
• Biogas for Kitchen
• June 2009

KALAMESHWAR
MUNICIPAL COUNCIL
• 2MT/day hotel and vegetable
market material
• Area 300 m2
• Biogas for electricity (street lights)
• June 2007

0.5 MT/day Food based June 2010 Fabricated in steel Area 30m2
Biogas use in kitchen
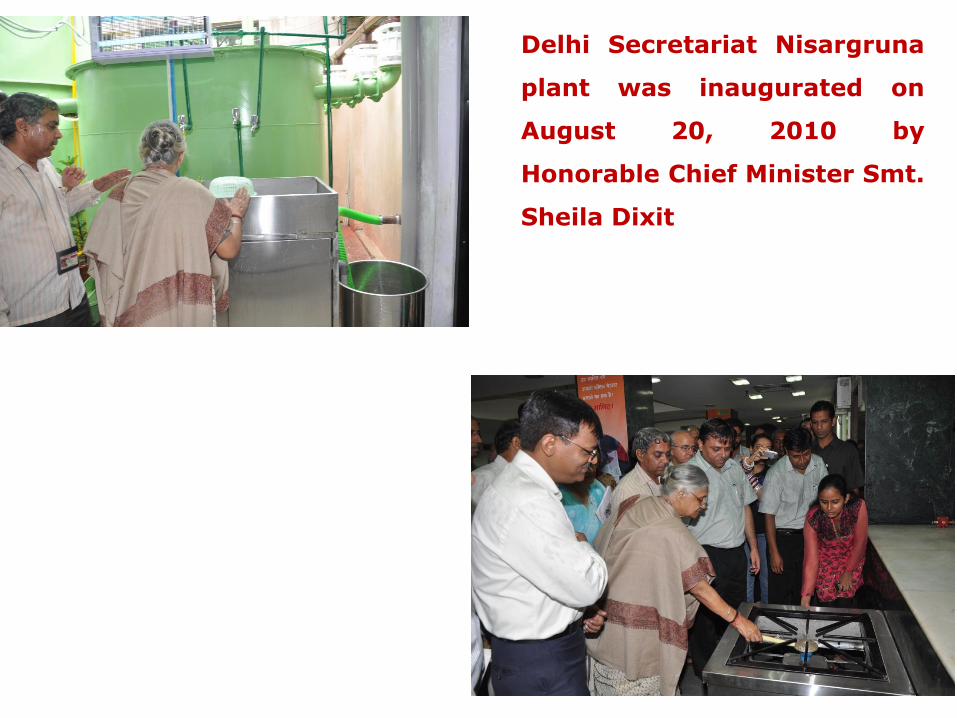
Delhi Secretariat Nisargruna
plant was inaugurated on
August 20, 2010 by
Honorable Chief Minister Smt.
Sheila Dixit

Parameter Quantization
Quantity of resource processed 42000 Kg
Gas utilized in the kitchen 4150 m3
Utilizable gas generation per MT of
resource
98.8 m3
Manure generated 3500 Kg
Actual Performance of Delhi Secretariat Project
from August 2010 to July 2013

NISARGRUNA PLANT CAPACITY 2 MT/day BADDI (Himachal Pradesh)

Average Atmospheric Temperatures in Baddi for the Year
2010 - 2011 ( April 2010 - March 2011)
S. No Month Maximum
(0C)
Minimum
(0C)
1
2
April
May
June
38 - 44 30 -34
3
4
5
July
August
Sept
36 - 40 26 - 32
6
7
8
October
November 25 - 32 18 - 22
9
10
December
January
February
08 - 15.0 3.0 - 6.0
11
12 March 25 - 30 15 - 20

Month Days Resource processed (Kg) Gas M3
Kitchen Cotton Garden Sludge Total
10-Oct 24 5000 0 0 23400 28400 336
10-Nov 29 5800 0 0 31600 37400 455
10-Dec 21 4782 0 0 26250 31032 230
11-Jan 31 5752 0 0 38750 44502 300
11-Feb 28 7193 109 35000 42302 445
11_Mar 31 7977 140 150 39706 47973 782
11_April 30 11800 780 465 41000 54045 1141
11-May 31 14849 485 125 45205 60664 2000
11-June 30 15120 410 150 42794 58474 3000
11_July 31 17253 240 0 54200 71693 3300
11-Aug 31 19625 0 0 51950 71575 3400
11-Sept 30 12085 0 0 60200 72285 1880
11-Oct 31 16680 0 0 49300 65980 2780
11-Nov 30 17388 0 0 52500 69888 3088
11-Dec 31 14693 0 0 54250 68943 3326
12-Jan 31 16474 0 0 47000 63474 2231
12-Feb 29 12123 0 0 38300 50423 426
12_Mar 31 1000 0 0 7300 8300 62
12_April 30 1837 0 0 15200 17037 154
12-May 31 12071 0 0 12000 24071 744
12-June 30 18835 0 0 34600 53435 1722
12_July 31 13062 0 0 19200 32262 1816
12-Aug 31 18583 0 0 37200 55783 2830
12-Sept 30 18182 0 0 36000 54182 2468
12-Oct 31 16360 0 0 33600 49960 2499
12-Nov 21 10516 0 0 22800 33316 1102
Total 765 315040 2164 890 949305 1267399 42517
Data collected from Nisargruna plant at Baddi (Resource processed and biogas generation and utilization)

KALYAN DOMBIVLI MUNICIPAL CORPORATION

Month
Waste processed Efficiency of waste
handling
Generator working hours
Units generated
(Kg) (%) (KW)
Jun-10 2810 4.68 0 0
Jul-10 3600 6 0 0
Aug-10 12450 20.75 60 450
Sep-10 12840 21.4 110 825
Oct-10 25530 42.55 129 967.5
Nov-10 23260 38.77 21 157.5
Dec-10 45075 75.125 168 1260
Jan-11 42250 70.42 212 1590
Feb-11 33225 55.37 56 420
Mar-11 35365 58.94 49 367.5
Apr-11 44375 73.96 103 772.5
May-11 50600 84.33 135 1012.5
Jun-11 28690 47.82 71 532.5
Jul-11 42450 70.75 23 172.5
Aug-11 49140 81.90 0 0
Sep-11 44678 74.46 19.2 144
Oct-11 55428 92.38 54 405
Nov-11 52930 88.22 38.5 288.75
Dec-11 56981 94.97 0 0
Jan-12 55366 92.28 0 0
Feb-12 0.00 0 0
Mar-12 58020 96.70 0 0
Apr-12 55761 92.94 31 232.5
May-12 56879 94.80 196 1470
Total 887703 61.65 1475.7 9365.25

Cochin Refinery Nisargruna biogas plant
• 1MT/day hotel and vegetable
market material
• Area 100 m2
• Biogas for kitchen
• March 2009

0.5 MT kitchen based July 2009 Biogas use in kitchen Area 100m2

• 2MT/day hotel and vegetable
market material
• Area 100 m2
• Biogas for electricity (street lights)
• June 2009

• 0.5MT/day hotel and vegetable market
material
• Area 50 m2
• Biogas for kitchen
• December 2009

TATA INSTITUTE OF SOCIAL SCIENCES, DEONAR MUMBAI
NISARGRUNA BIOGAS PLANT
CAPACITY 0.5MT/DAY
FOOD WASTE RESOURCE FROM INSTITUTE CANTEEN
INSTALLATION: JANUARY 2011
PROJECT COST: Rs. 12 LAKHS
UTILIZATION OF BIOGAS IN CANTEEN OF INSTITUTE
UTILIZATION OF MANURE IN GARDENS OF THE INSTITUTE


Major hurdles and difficulties
• Mental attitude
• Public apathy for both segregation and understanding
significance of waste resource
• ULBs have no designated funds for decentralized waste
resource management
• Involvement of NGOs like Stree Mukti Sangahatana (Rag-
picker’s associations), though clearly directed by Hon’ble
Supreme Court, is minimum.
Policy decisions needed
Fund allocation has to be done

Our eyes can show us what is physical. Our brain tries
to derive usable information from what we see. We
must train our brain to think laterally. That way we can
broaden our horizons of knowledge and scope of work.

8/23/2013 Earth needs your help
Garbage
Sharad P. Kale
Head, Technology Transfer and Collaboration Division
Bhabha Atomic Research Centre
Mumbai 400085
Resource Management