comercio bilateral entre la republica dominicana y estados … · 2013-02-06 · comercio bilateral...
TRANSCRIPT

COMERCIO BILATERAL ENTRE LA REPUBLICA DOMINICANA Y ESTADOS UNIDOS DE AMERICA
Agosto 2005 Este informe fue escrito por Araujo Ibarra & Asociados S.A. para Chemonics International Inc. bajo el Contrato No. PCE-I-19-98-000-15-00.

COMERCIO BILATERAL ENTRE LA REPUBLICA DOMINICANA Y ESTADOS UNIDOS DE AMERICA
RENUNCIA Las perspectivas del autor expresadas en esta publicación no se ven obligadas reflejar las opiniones ni de la Agencia para el Desarrollo Internacional de los Estados Unidos ni del Gobierno de los Estados Unidos.

TABLA DE CONTENIDOS Siglas ii Resumen Ejecutivo iii SECCIÓN I INTRODUCCION I-1 SECCIÓN II ECONOMÍA Y ENTORNO INTERNACIONAL DE LA RD PARA EL AÑO 2004 II-1 SECCIÓN III RELACIONES DE EEUU Y LA RD III-1 SECCIÓN IV BALANZA COMERCIAL DE EEUU CON LA RD IV-1 SECCIÓN V ANALISIS DE LA BALANZA COMERCIAL A DOS DIGITOS DEL ARANCEL V-1
A. Principales Exportaciones de la RD a EEUU V-2
B. Principales Importaciones de la RD Provenientes de EEUU V-5 SECCIÓN VI ANALISIS SECTORIAL VI-1 A. Importaciones de la RD desde EEUU VI-2
B. Exportaciones de la RD a EEUU por Sectores VI-5
C. Balanza Comercial Sectorial VI-7 SECCIÓN VII COMERCIO BILATERAL 10 DIGITOS DEL ARANCEL VII-1 A. Principales Importaciones de la RD desde EEUU a 10 Dígitos VII-2
B. Principales Exportaciones de la RD a EEUU a 10 Dígitos VII-6 SECCIÓN VIII BIBLIOGRAFIA VIII-1 ANEXO A DESCRIPCION DE LOS CAPITULOS DEL ARANCEL A-1

SIGLAS AMCHAM Cámara Americana de Comercio CEPAL Comisión Económica de las Naciones Unidas para la
Latinoamérica y el Caribe CAFTA-DR Tratado de Libre Comercio de Estados Unidos con América
Central y la República Dominicana EEUU Estados Unidos de América
NAFTA Tratado de Libre Comercio de América del Norte RD República Dominicana SEGIR Proyecto de Apoyo al Crecimiento Económico y Reforma
Institucional USAID Agencia de Estados Unidos para el Desarrollo Internacional

Resumen Ejecutivo
Resumen Ejecutivo El presente informe es parte de un grupo de estudios financiados por la Agencia de Estados Unidos para el Desarrollo Internacional (USAID) a través del Proyecto de Apoyo al Crecimiento Económico y Reformas Institucionales (SEGIR por su nombre en inglés), los cuales tienen como objetivo apoyar al Consejo Nacional de Competitividad y a la Cámara Americana de Comercio de la República Dominicana (AMCHAM), en la preparación, identificación y desarrollo de una estrategia para aprovechar las oportunidades de comercio e inversión que presenta el CAFTA-DR para la República Dominicana (RD). El conjunto de estudios consiste de los siguientes cinco módulos: Módulo 1: Comercio Bilateral entre la República Dominicana y Estados Unidos. Módulo 2: Guía de Inversión y de Exportaciones de República Dominicana Módulo 3: Guía Logística de la República Dominicana Módulo 4: Análisis de las importaciones y las exportaciones con sus
correspondientes precios de venta. Módulo 5: Identificación de 200 productos de la RD con mayor potencial en Estados
Unidos (EEUU), analizados a 10 dígitos del arancel. Diseño de un software de computador para el efecto.
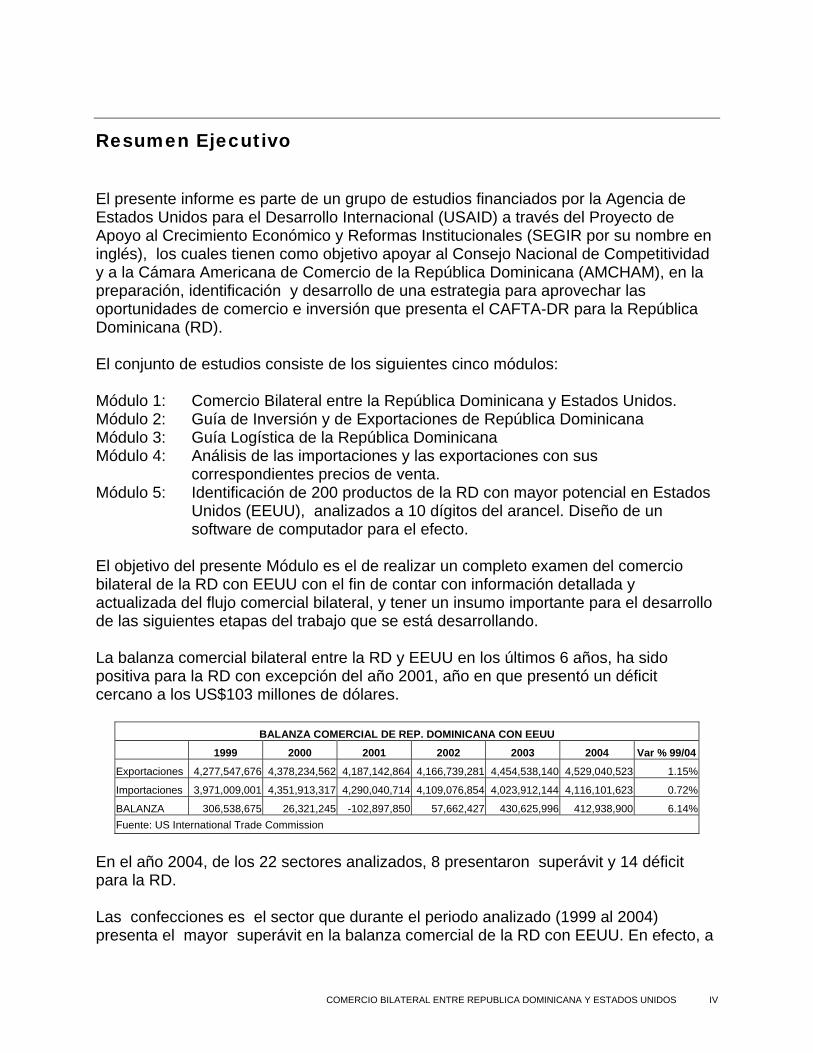
El objetivo del presente Módulo es el de realizar un completo examen del comercio bilateral de la RD con EEUU con el fin de contar con información detallada y actualizada del flujo comercial bilateral, y tener un insumo importante para el desarrollo de las siguientes etapas del trabajo que se está desarrollando. La balanza comercial bilateral entre la RD y EEUU en los últimos 6 años, ha sido positiva para la RD con excepción del año 2001, año en que presentó un déficit cercano a los US$103 millones de dólares.
BALANZA COMERCIAL DE REP. DOMINICANA CON EEUU
1999 2000 2001 2002 2003 2004 Var % 99/04
Exportaciones 4,277,547,676 4,378,234,562 4,187,142,864 4,166,739,281 4,454,538,140 4,529,040,523 1.15%
Importaciones 3,971,009,001 4,351,913,317 4,290,040,714 4,109,076,854 4,023,912,144 4,116,101,623 0.72%
BALANZA 306,538,675 26,321,245 -102,897,850 57,662,427 430,625,996 412,938,900 6.14%Fuente: US International Trade Commission
En el año 2004, de los 22 sectores analizados, 8 presentaron superávit y 14 déficit para la RD. Las confecciones es el sector que durante el periodo analizado (1999 al 2004) presenta el mayor superávit en la balanza comercial de la RD con EEUU. En efecto, a
COMERCIO BILATERAL ENTRE REPUBLICA DOMINICANA Y ESTADOS UNIDOS IV

pesar que de 1999 al 2004 las exportaciones del sector al mercado norteamericano se han disminuido en 2% promedio anual, los productos de este sector participan con cerca del 50% de las exportaciones Dominicanas a los EEUU. En el sector de confecciones, las prendas de vestir en tejido plano son las más representativas de las exportaciones correspondientes a este sector y entre ellas se destacan los pantalones de algodón y de fibras sintéticas para hombre y los brasieres en fibras sintéticas. En segundo lugar, con una gran diferencia, le sigue en importancia los productos del sector de instrumentos de medida, medico quirúrgico y veterinario, sector que presenta en sus exportaciones al mercado norteamericano, desde 1999, un crecimiento promedio anual de 2.88% y ocupa el tercer renglón de las exportaciones sectoriales de la RD a EEUU. Dentro de los productos del sector con mayor valor exportado a EEUU se destaca los demás instrumentos medicoquirúrgicos para uso dental o veterinario y entre los productos que presentan mayor crecimiento promedio anual al mercado norteamericano es importante destacar las jeringas con o sin agujas y sus partes. En tercer lugar, muy cercano al sector de instrumentos de medida, medico quirúrgico y veterinario, se encuentra el agroindustrial, sector que ocupa el segundo renglón de las exportaciones sectoriales de la RD a EEUU y presenta un crecimiento promedio anual desde 1999 de 3.11%, siendo el tabaco el producto que mas contribuye con las exportaciones de este sector al mercado norteamericano. Le siguen en importancia el azúcar y productos a base de cacao como mantequilla, grasa y aceite de cacao.
BALANZA COMERCIAL DE REP. DOMINICANA CON EEUU – DOLARES SECTORES SUPERAVITARIOS
SECTOR EXPORTACIONES IMPORTACIONES BALANZA 2004 2004 2004 TOTAL 4,529,040,523 4,116,101,623 412,938,900Confecciones 2,108,867,629 535,168,250 1,573,699,379Instrumentos de medida, medico quirúrgicos y veterinario 417,038,164 133,577,602 283,460,562
Agroindustrial 419,009,347 212,224,384 206,784,963Joyería y relojería 340,577,792 147,355,058 193,222,734Calzado 137,229,697 22,734,708 114,494,989Metales comunes y sus manufacturas 219,362,328 121,583,692 97,778,636
Manufacturas diversas 34,339,172 18,114,732 16,224,440Minerales no metálicos 37,951,421 29,964,056 7,987,365Fuente: US International Trade Commission
En cuarto y quinto lugar se encuentran los sectores de joyería - relojería y el sector calzado. Los productos de joyería y relojería participan con el 7.5% de las exportaciones de la RD a EEUU y ocupan el 5 renglón en las exportaciones sectoriales dominicanas a Norteamérica con un crecimiento promedio anual de 10.85%. El sector calzado, al contrario del de joyería, presenta desde 1999 una disminución promedia anual en las exportaciones al mercado estadounidense de 10.36%. La tabla anterior
COMERCIO BILATERAL ENTRE REPUBLICA DOMINICANA Y ESTADOS UNIDOS V
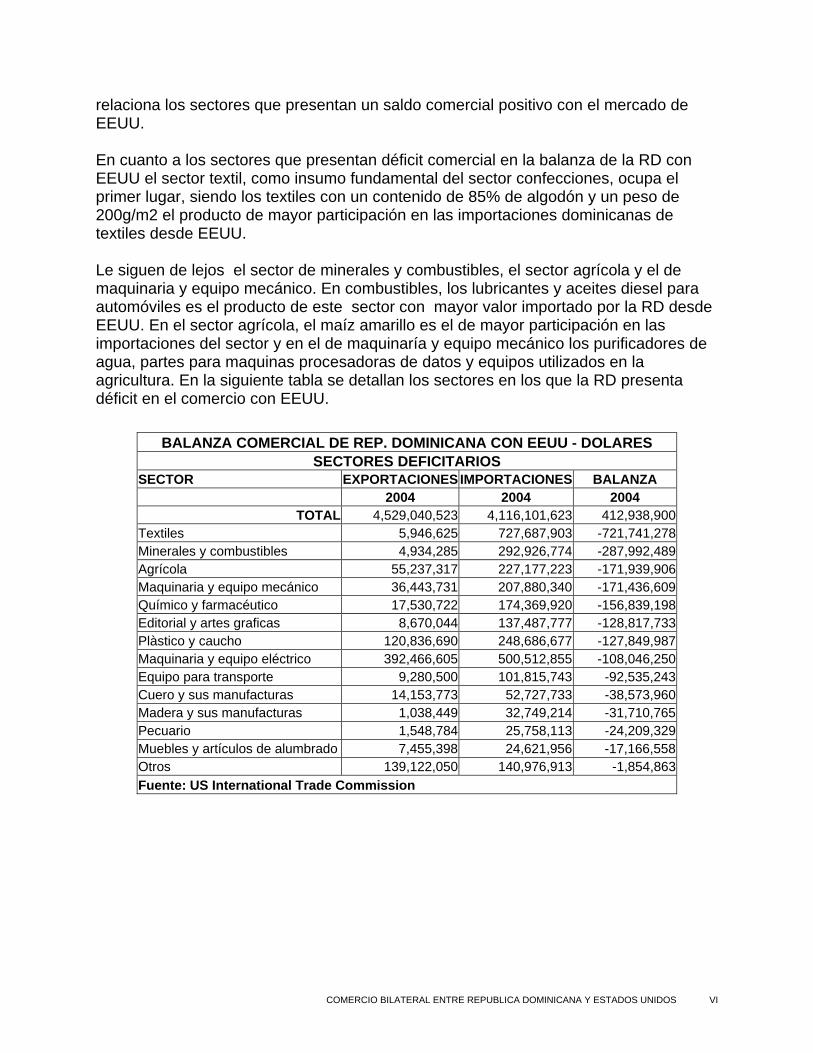
relaciona los sectores que presentan un saldo comercial positivo con el mercado de EEUU. En cuanto a los sectores que presentan déficit comercial en la balanza de la RD con EEUU el sector textil, como insumo fundamental del sector confecciones, ocupa el primer lugar, siendo los textiles con un contenido de 85% de algodón y un peso de 200g/m2 el producto de mayor participación en las importaciones dominicanas de textiles desde EEUU. Le siguen de lejos el sector de minerales y combustibles, el sector agrícola y el de maquinaria y equipo mecánico. En combustibles, los lubricantes y aceites diesel para automóviles es el producto de este sector con mayor valor importado por la RD desde EEUU. En el sector agrícola, el maíz amarillo es el de mayor participación en las importaciones del sector y en el de maquinaría y equipo mecánico los purificadores de agua, partes para maquinas procesadoras de datos y equipos utilizados en la agricultura. En la siguiente tabla se detallan los sectores en los que la RD presenta déficit en el comercio con EEUU. BALANZA COMERCIAL DE REP. DOMINICANA CON EEUU - DOLARES
SECTORES DEFICITARIOS SECTOR EXPORTACIONES IMPORTACIONES BALANZA 2004 2004 2004
TOTAL 4,529,040,523 4,116,101,623 412,938,900Textiles 5,946,625 727,687,903 -721,741,278Minerales y combustibles 4,934,285 292,926,774 -287,992,489Agrícola 55,237,317 227,177,223 -171,939,906Maquinaria y equipo mecánico 36,443,731 207,880,340 -171,436,609Químico y farmacéutico 17,530,722 174,369,920 -156,839,198Editorial y artes graficas 8,670,044 137,487,777 -128,817,733Plàstico y caucho 120,836,690 248,686,677 -127,849,987Maquinaria y equipo eléctrico 392,466,605 500,512,855 -108,046,250Equipo para transporte 9,280,500 101,815,743 -92,535,243Cuero y sus manufacturas 14,153,773 52,727,733 -38,573,960Madera y sus manufacturas 1,038,449 32,749,214 -31,710,765Pecuario 1,548,784 25,758,113 -24,209,329Muebles y artículos de alumbrado 7,455,398 24,621,956 -17,166,558Otros 139,122,050 140,976,913 -1,854,863Fuente: US International Trade Commission
COMERCIO BILATERAL ENTRE REPUBLICA DOMINICANA Y ESTADOS UNIDOS VI

SECCIÓN I
INTRODUCCION
SECCIÓN I INTRODUCCION El presente informe es parte de un grupo de estudios financiados por la Agencia de Estados Unidos para el Desarrollo Internacional (USAID) a través del Proyecto de Apoyo al Crecimiento Económico y Reformas Institucionales (SEGIR por su nombre en inglés), los cuales tienen como objetivo apoyar al Consejo Nacional de Competitividad y a la Cámara Americana de Comercio de la República Dominicana (AMCHAM), en la preparación, identificación y desarrollo de una estrategia para aprovechar las oportunidades de comercio e inversión que presenta el CAFTA-DR para la República Dominicana (RD). El conjunto de estudios consiste de los siguientes cinco módulos: Módulo 1: Comercio Bilateral entre la República Dominicana y Estados Unidos. Módulo 2: Guía de Inversión y de Exportaciones de la República Dominicana Módulo 3: Guía Logística de la República Dominicana Módulo 4: Análisis de las importaciones y las exportaciones con sus
correspondientes precios de venta. Módulo 5: Identificación de 200 productos de la República Dominicana con mayor
potencial en Estados Unidos (EEUU), analizados a 10 dígitos del arancel. Diseño de un software de computador para el efecto.
El objetivo del presente Módulo es el de realizar un completo examen del comercio bilateral de la RD con EEUU con el fin de contar con información detallada y actualizada del flujo comercial bilateral, y tener un insumo importante para el desarrollo de las siguientes etapas del trabajo que se está desarrollando. En el presente documento, se realizan los siguientes análisis:
• Estudio de la Balanza Comercial de EEUU y la RD. • Estudio de los 99 capítulos del arancel, análisis a dos (2) dígitos de todo el
comercio exterior entre los dos países. • Estudio del comercio bilateral por sectores (22), identificando los productos más
dinámicos y representativos de cada sector. • Estudio de las principales importaciones y exportaciones a diez (10) dígitos del
arancel. De forma introductoria se examina brevemente la economía y el entorno internacional de la RD durante el año 2004 y los posibles efectos que traerá la implementación del CAFTA-DR para el país.
COMERCIO BILATERAL ENTRE REPUBLICA DOMINICANA Y ESTADOS UNIDOS I-2 2
SECCIÓN II ECONOMÍA Y ENTORNO INTERNACIONAL DE LA REPÚBLICA DOMINICANA PARA EL AÑO 2004
SECCIÓN II ECONOMÍA Y ENTORNO INTERNACIONAL DE LA REPÚBLICA DOMINICANA PARA EL AÑO 2004 Según la CEPAL1, en el año 2004 la actividad económica de la RD creció 2%, índice que permitió compensar la disminución de 1,9% del 2003 y superar el resultado que se esperaba a inicios de año. Es así como el entorno internacional fue favorable, por lo que el sector exportador presentó un desempeño positivo, aunque moderado. En cuanto a las exportaciones de bienes y servicios éstas moderaron su dinamismo al aumentar sólo 3,8%, comparado con el 8,5% de 2003. Las ventas de bienes nacionales, que representan 23% del total, obtuvieron el mejor desempeño al mantener un alto crecimiento (25%). En particular, sobresalen las de ferroníquel (63%) y de tabaco (116%), que fueron impulsadas por la considerable depreciación cambiaria y los altos precios internacionales. Otros rubros en que se percibieron incrementos fueron las ventas de combustibles en puertos, y un conjunto diversos de bienes no tradicionales de menor importancia relativa. Las adversas condiciones climáticas afectaron la producción de café y cacao, por lo que sus exportaciones retrocedieron. Por cuarto año consecutivo, los exportadores de las zonas francas enfrentaron dificultades para recuperar el elevado dinamismo que les caracterizó en la segunda mitad de los años noventa. En 2004 aumentaron sólo 0,2%, como consecuencia de la intensificación de la competencia de productores asiáticos en los mercados estadounidenses, situación que incumbe también a otros países de la región norte de América Latina. Por su parte las tradicionales exportaciones de vestido y calzado disminuyeron sus envíos al exterior en 5,5% y 3,4%, respectivamente. Otros artículos, en cambio, mejoraron su desempeño; en ese renglón se debe resaltar los artículos de joyería y conexos (19,2%), las manufacturas de tabaco (12,7%) y los productos farmacéuticos (8,3%). Pese a este panorama, en 2004 llegaron nuevas
1 ESTUDIO DE LA CEPAL: “REPÚBLICA DOMINICANA: EVOLUCIÓN ECONÓMICA DURANTE 2004 Y PERSPECTIVAS PARA 2005”. LC/MEX/L.670 21 de julio de 2005
COMERCIO BILATERAL ENTRE REPUBLICA DOMINICANA Y ESTADOS UNIDOS II-2

empresas a las zonas francas, por lo que su número pasó de 531 a 569, y se evidenció un perceptible crecimiento de la ocupación, que llegó a 189.853 personas. Por su parte, el valor de las exportaciones de servicios tuvo un tropiezo al incrementarse sólo 1,8%, luego de haber repuntado 13,1% en 2003. El impacto del huracán Jean en el último trimestre del año 2004 causó algunos daños en la infraestructura hotelera, fenómeno que redujo temporalmente la ocupación en ciertas áreas. 2,8 millones de turistas recibió el país, 4,1% más que en el año anterior, lo cual generó ingresos por 3.180 millones de dólares. En general, el sector enfrentó mejores condiciones externas, teniendo en cuenta que el turismo internacional se reanimó significativamente a raíz de la recuperación económica mundial. También influyó en el sector turismo la devaluación del peso dominicano y el mayor poder adquisitivo del euro frente al dólar, lo cual favoreció a los turistas europeos, quienes representan el 44,9% del total del turismo. Sin embargo, el gasto promedio diario se mantuvo prácticamente constante (0,7%), mientras que la estancia promedio descendió 3,3%. De esta manera, el tradicional superávit en el balance de servicios se elevó a 2.328 millones de dólares, cifra que superó moderadamente al déficit del comercio de mercancías. Las importaciones de bienes repuntaron apenas 2,9%, luego del retroceso de 13,7% del año anterior causado por el desplome de la demanda interna que provocó la crisis bancaria. La recuperación de la actividad productiva destinada al mercado interno determinó que las importaciones crecieran 5,4%, luego de que en 2003 declinaron 18,3%. Así, las compras de bienes intermedios ascendieron 10,9%, pero en esta variación influyó el alza de los precios internacionales del petróleo y sus derivados. Excluyendo al petróleo, los insumos repuntaron 2,8%, ante la mayor actividad en la industria alimenticia, de productos químicos y materias plásticas y las compras de materiales de fundición del hierro y acero. El gradual fortalecimiento del poder adquisitivo de la población impulsó mayores importaciones de bienes de consumo (5,9%), con un aumento especialmente marcado en los bienes duraderos, aunque también es de considerar la reposición de inventarios. Finalmente, el persistente descenso de la inversión explica la caída de las importaciones de bienes de capital (4,9%), frente a la de 29% del año anterior. Fueron especialmente bajas las adquisiciones de equipo de construcción y de transporte.
COMERCIO BILATERAL ENTRE REPUBLICA DOMINICANA Y ESTADOS UNIDOS II-3

SECCIÓN III RELACIONES DE ESTADOS UNIDOS Y LA REPÚBLICA DOMINICANA
SECCIÓN III RELACIONES DE ESTADOS UNIDOS Y LA REPÚBLICA DOMINICANA Es evidente que la entrada en vigencia del Tratado de Libre Comercio (CAFTA-DR) tendrá consecuencias importantes para la RD, tanto en el corto, como en el mediano y largo plazo. Los efectos del tratado se deben a dos aspectos principalmente: - Como primera medida, se observa una marcada disparidad de tamaño y grado de desarrollo entre la economía estadounidense y la economía de la RD. - Por otra parte, la fuerte integración y dependencia económica que históricamente ha tenido Centroamérica y la RD con EEUU, la cual se ha profundizado en las últimas décadas como resultado de:
• Las migraciones masivas hacia EEUU. • La política de apertura externa de Centroamérica desde principios de los
años noventa que ha provocado un aumento sustantivo de las importaciones norteamericanas hacia la región.
• La aplicación de regímenes comerciales unilaterales por parte de EEUU que han favorecido las exportaciones no tradicionales de origen industrial (maquila) y agrícola de Centroamérica hacia ese país2.
Es así como el experto Jorge Máttar3 aseguró que el tratado del CAFTA-DR aumentará la dependencia de los países centroamericanos y de la RD, con la potencia económica mundial. El experto advierte que ya no sólo será México el que se 'resfríe' cuando E.U. 'estornude', sino que los efectos llegarán también fuertes a estos países, aunque con cada etapa económica favorable de la potencia, también saldrá ganando la región. Es por esta razón que de seguir por el mismo camino de México, que es socio de EEUU y Canadá desde 1994 a través del Tratado de Libre Comercio de América del Norte (NAFTA, por sus siglas en inglés), los países firmantes del tratado podrían aumentar su vulnerabilidad a la dinámica económica de esa nación.
Teniendo en cuenta que México concentró aún más su comercio con EEUU con la firma del tratado, los países centroamericanos y la RD van por la misma vía ya que hasta la fecha EEUU acapara entre el 45 y el 55 por ciento de su comercio, dependiendo del país.
2 EL IMPACTO DEL CAFTA SOBRE EL MODELO DE DESARROLLO DE CENTROAMÉRICA (AVANCE DE INVESTIGACIÓN) AGOSTO DE 2004 INVESTIGADOR: ALEXANDER SEGOVIA 3 DIRECTOR ADJUNTO DE LA SEDE EN MÉXICO DE LA CEPAL
COMERCIO BILATERAL ENTRE REPUBLICA DOMINICANA Y ESTADOS UNIDOS III-2
A diferencia del caso mexicano, los países centroamericanos poseen un fuerte comercio con sus vecinos, basado en pequeñas manufacturas como piezas y refacciones de maquinarias y automóviles y productos químicos, a su vez las ventas a los EEUU, son básicamente materias primas como el café, carne y azúcar, además de textiles.
A la luz de la experiencia de México, la RD deberá intentar diversificar su comercio buscando otros nichos de mercado y generando mayor valor agregado; teniendo en cuenta que no se enfrente con factores de difícil competencia como es el caso de China con su mano de obra barata, o como factores climáticos que afecten de forma considerable su economía y por ende sus exportaciones como es el caso del café.
Desde el punto de vista positivo el CAFTA-DR traerá beneficios a los diferentes países, ya que reforzará el nuevo modelo de desarrollo económico que han adoptado la mayoría de ellos desde la década de los noventa, haciendo que el sector privado adquiera cada vez mayor presencia en la economía, y que los gobiernos orienten su economía hacia el exterior, considerando así la apertura externa como el elemento central para que logren un mayor crecimiento y desarrollo.
Teniendo en cuenta este panorama, la RD debe aprovechar los beneficios que trae el CAFTA-DR, para lograr incrementar sus exportaciones hacia ese mercado, pero a la vez, debe diversificar su comercio hacia otros países y ofrecer un mayor valor agregado en sus bienes y servicios.
COMERCIO BILATERAL ENTRE REPUBLICA DOMINICANA Y ESTADOS UNIDOS III-3
SECCIÓN IV BALANZA COMERCIAL DE ESTADOS UNIDOS CON LA REPÚBLICA DOMINICANA

SECCIÓN IV BALANZA COMERCIAL DE ESTADOS UNIDOS CON LA REPÚBLICA DOMINICANA
BALANZA COMERCIAL REPUBLICA DOMINICANA - EU
-1,000,000,000
0
1,000,000,000
2,000,000,000
3,000,000,000
4,000,000,000
5,000,000,000
1999 2000 2001 2002 2003 2004
US$
EXPORTACIONES IMPORTACIONES BALANZA
Fuente: US INTERNATIONAL TRADE COMMISSION El comercio bilateral entre EEUU y la RD en los últimos seis (6) años, ha tenido un incremento moderado, ya que las exportaciones tan solo presentan una variación promedio del 1,15%, mientras que las importaciones de la RD provenientes de EEUU han tenido un incremento tan sólo del 0,72%.
1999 2000 2001 2002 2003 2004 CAMBIO %1999- 2004
EXPORTACION4,277,547,676 4,378,234,562 4,187,142,864 4,166,739,281 4,454,538,140 4,529,040,523 1.15%IMPORTACION 3,971,009,001 4,351,913,317 4,290,040,714 4,109,076,854 4,023,912,144 4,116,101,623 0.72%BALANZA 306,538,675 26,321,245 -102,897,850 57,662,427 430,625,996 412,938,900 6.14%
BALANZA COMERCIAL DE EE.UU. CON REP. DOMINICANA
US DOLARES
Fuente: US INTERNATIONAL TRADE COMMISSION
La variación absoluta de las importaciones de la RD del año 2003 al 2004 fue de US$ 74.5 millones, mientras que la variación en las exportaciones para el mismo periodo fue de US$ 92 millones.
COMERCIO BILATERAL ENTRE REPUBLICA DOMINICANA Y ESTADOS UNIDOS IV-2

SECCIÓN V ANALISIS DE LA BALANZA COMERCIAL A DOS DIGITOS DEL ARANCEL

SECCIÓN V ANALISIS DE LA BALANZA COMERCIAL A DOS DIGITOS DEL ARANCEL
A. Principales Exportaciones de la RD a EEUU Para el siguiente análisis, se compararon las exportaciones realizadas por la RD a EEUU, teniendo en cuenta su clasificación por capítulos (a dos dígitos del arancel); es así como las principales exportaciones que se registran para el año 2004 son las prendas de vestir, seguidas de los instrumentos de medida, precisión óptica y médico quirúrgicos, los cuales representan el 54% del total de las exportaciones de la RD a EEUU. La siguiente tabla muestra, 10 capítulos del arancel, los cuales representan el 87% del total de las exportaciones en el año 2004.
PRINCIPALES EXPORTACIONES DE REPUBLICA DOMINICANA A EE.UU.
CAPITULO TITULO DEL CAPITULO 200462 PRENDAS DE VESTIR TEJIDO PLANO 1.146.791.12461 PRENDAS DE VESTIR DE PUNTO 889.429.44690 INSTRUMENTOS DE MEDIDA, PRECISION,
OPTICA Y MEDICOQUIRURGICOS417.038.164
85 MAQUINARIA Y EQUIPO ELECTRICO 392.466.60571 JOYERIA 340.577.79224 TABACO 226.166.51672 FUNDICION HIERRO Y ACERO 161.418.07364 CALZADO 137.229.69739 PLASTICO Y SUS MANUFACTURAS 119.862.97998 TRATAMIENTO ESPECIAL 109.358.956
POR CAPITULOS
De las exportaciones representadas en estos 10 capítulos, se observa que el 45% lo representan los capítulos 61 y 62 correspondientes a los capítulos de las prendas de vestir, tanto de tejido plano como de punto tal como se deduce de la siguiente gráfica:
COMERCIO BILATERAL ENTRE REPUBLICA DOMINICANA Y ESTADOS UNIDOS V-2
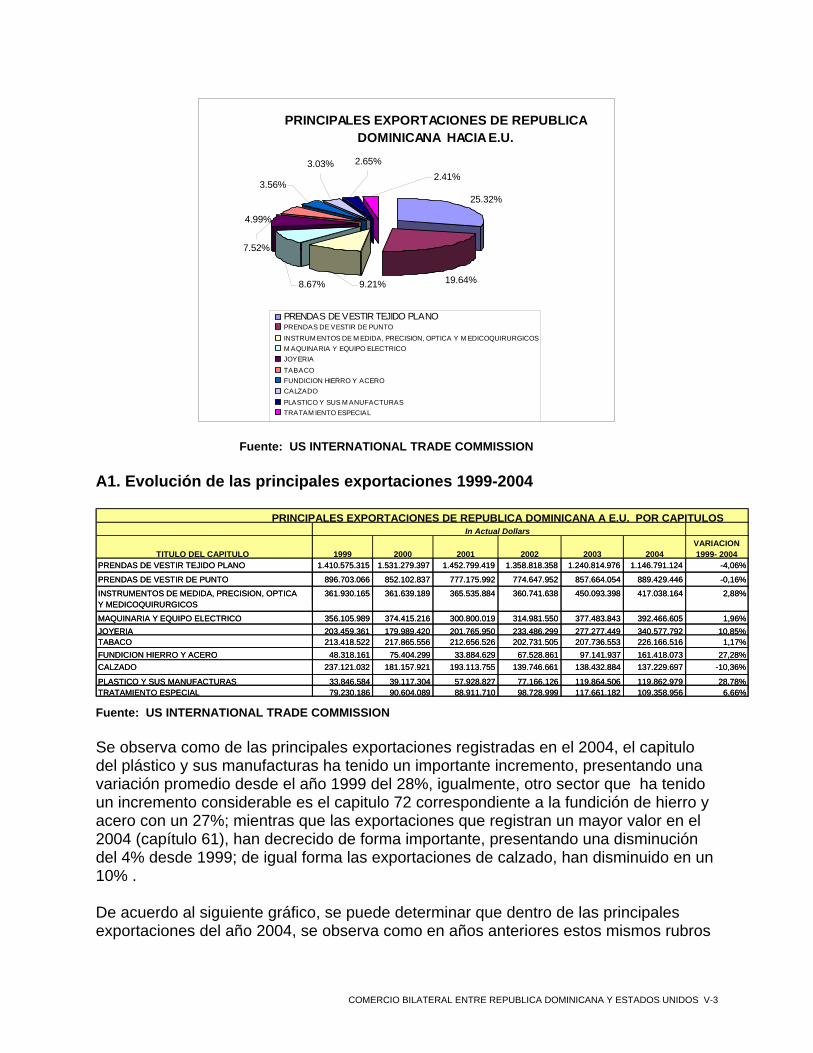
PRINCIPALES EXPORTACIONES DE REPUBLICA
DOMINICANA HACIA E.U.
25.32%
19.64%9.21%8.67%
7.52%
4.99%
2.41%2.65%3.03%
3.56%
PRENDAS DE VESTIR TEJIDO PLANOPRENDAS DE VESTIR DE PUNTOINSTRUM ENTOS DE M EDIDA, PRECISION, OPTICA Y M EDICOQUIRURGICOSM AQUINARIA Y EQUIPO ELECTRICOJOYERIATABACOFUNDICION HIERRO Y ACEROCALZADOPLASTICO Y SUS M ANUFACTURASTRATAM IENTO ESPECIAL
Fuente: US INTERNATIONAL TRADE COMMISSION A1. Evolución de las principales exportaciones 1999-2004
TITULO DEL CAPITULO 1999 2000 2001 2002 2003 2004VARIACION 1999- 2004
PRENDAS DE VESTIR TEJIDO PLANO 1.410.575.315 1.531.279.397 1.452.799.419 1.358.818.358 1.240.814.976 1.146.791.124 -4,06%
PRENDAS DE VESTIR DE PUNTO 896.703.066 852.102.837 777.175.992 774.647.952 857.664.054 889.429.446 -0,16%
INSTRUMENTOS DE MEDIDA, PRECISION, OPTICA Y MEDICOQUIRURGICOS
361.930.165 361.639.189 365.535.884 360.741.638 450.093.398 417.038.164 2,88%
MAQUINARIA Y EQUIPO ELECTRICO 356.105.989 374.415.216 300.800.019 314.981.550 377.483.843 392.466.605 1,96%JOYERIA 203.459.361 179.989.420 201.765.950 233.486.299 277.277.449 340.577.792 10,85%TABACO 213.418.522 217.865.556 212.656.526 202.731.505 207.736.553 226.166.516 1,17%FUNDICION HIERRO Y ACERO 48.318.161 75.404.299 33.884.629 67.528.861 97.141.937 161.418.073 27,28%CALZADO 237.121.032 181.157.921 193.113.755 139.746.661 138.432.884 137.229.697 -10,36%
PLASTICO Y SUS MANUFACTURAS 33.846.584 39.117.304 57.928.827 77.166.126 119.864.506 119.862.979 28,78%
TRATAMIENTO ESPECIAL 79.230.186 90.604.089 88.911.710 98.728.999 117.661.182 109.358.956 6,66%
In Actual DollarsPRINCIPALES EXPORTACIONES DE REPUBLICA DOMINICANA A E.U. POR CAPITULOS
TITULO DEL CAPITULO 1999 2000 2001 2002 2003 2004VARIACION 1999- 2004
PRENDAS DE VESTIR TEJIDO PLANO 1.410.575.315 1.531.279.397 1.452.799.419 1.358.818.358 1.240.814.976 1.146.791.124 -4,06%
PRENDAS DE VESTIR DE PUNTO 896.703.066 852.102.837 777.175.992 774.647.952 857.664.054 889.429.446 -0,16%
INSTRUMENTOS DE MEDIDA, PRECISION, OPTICA Y MEDICOQUIRURGICOS
361.930.165 361.639.189 365.535.884 360.741.638 450.093.398 417.038.164 2,88%
MAQUINARIA Y EQUIPO ELECTRICO 356.105.989 374.415.216 300.800.019 314.981.550 377.483.843 392.466.605 1,96%JOYERIA 203.459.361 179.989.420 201.765.950 233.486.299 277.277.449 340.577.792 10,85%TABACO 213.418.522 217.865.556 212.656.526 202.731.505 207.736.553 226.166.516 1,17%FUNDICION HIERRO Y ACERO 48.318.161 75.404.299 33.884.629 67.528.861 97.141.937 161.418.073 27,28%CALZADO 237.121.032 181.157.921 193.113.755 139.746.661 138.432.884 137.229.697 -10,36%
PLASTICO Y SUS MANUFACTURAS 33.846.584 39.117.304 57.928.827 77.166.126 119.864.506 119.862.979 28,78%RATAMIENTO ESPECIAL 79.230.186 90.604.089 88.911.710 98.728.999 117.661.182 109.358.956 6,66%
In Actual DollarsPRINCIPALES EXPORTACIONES DE REPUBLICA DOMINICANA A E.U. POR CAPITULOS
T
Fuente: US INTERNATIONAL TRADE COMMISSION Se observa como de las principales exportaciones registradas en el 2004, el capitulo del plástico y sus manufacturas ha tenido un importante incremento, presentando una variación promedio desde el año 1999 del 28%, igualmente, otro sector que ha tenido un incremento considerable es el capitulo 72 correspondiente a la fundición de hierro y acero con un 27%; mientras que las exportaciones que registran un mayor valor en el 2004 (capítulo 61), han decrecido de forma importante, presentando una disminución del 4% desde 1999; de igual forma las exportaciones de calzado, han disminuido en un 10% . De acuerdo al siguiente gráfico, se puede determinar que dentro de las principales exportaciones del año 2004, se observa como en años anteriores estos mismos rubros
COMERCIO BILATERAL ENTRE REPUBLICA DOMINICANA Y ESTADOS UNIDOS V-3
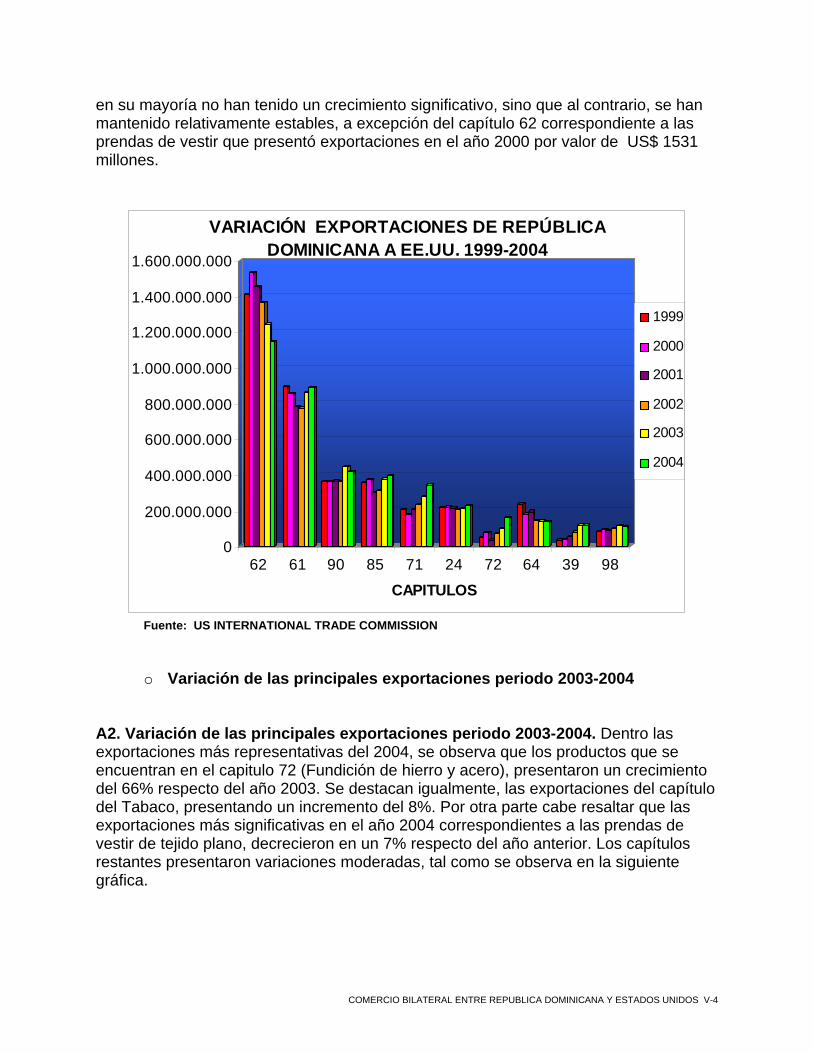
en su mayoría no han tenido un crecimiento significativo, sino que al contrario, se han mantenido relativamente estables, a excepción del capítulo 62 correspondiente a las prendas de vestir que presentó exportaciones en el año 2000 por valor de US$ 1531 millones.
0
200.000.000
400.000.000
600.000.000
800.000.000
1.000.000.000
1.200.000.000
1.400.000.000
1.600.000.000
62 61 90 85 71 24 72 64 39 98
CAPITULOS
VARIACIÓN EXPORTACIONES DE REPÚBLICA DOMINICANA A EE.UU. 1999-2004
1999
2000
2001
2002
2003
2004
Fuente: US INTERNATIONAL TRADE COMMISSION
o Variación de las principales exportaciones periodo 2003-2004 A2. Variación de las principales exportaciones periodo 2003-2004. Dentro las exportaciones más representativas del 2004, se observa que los productos que se encuentran en el capitulo 72 (Fundición de hierro y acero), presentaron un crecimiento del 66% respecto del año 2003. Se destacan igualmente, las exportaciones del capítulo del Tabaco, presentando un incremento del 8%. Por otra parte cabe resaltar que las exportaciones más significativas en el año 2004 correspondientes a las prendas de vestir de tejido plano, decrecieron en un 7% respecto del año anterior. Los capítulos restantes presentaron variaciones moderadas, tal como se observa en la siguiente gráfica.
COMERCIO BILATERAL ENTRE REPUBLICA DOMINICANA Y ESTADOS UNIDOS V-4
0
200.000.000
400.000.000
600.000.000
800.000.000
1.000.000.000
1.200.000.000
1.400.000.000
62 61 90 85 71 24 72 64 39 98
CAPITULOS
EVOLUCIÓN EXPORTACIONES DE REPÚBLICA DOMINICANA A EE.UU. 2003-2004
2003
2004
Fuente: US INTERNATIONAL TRADE COMMISSION
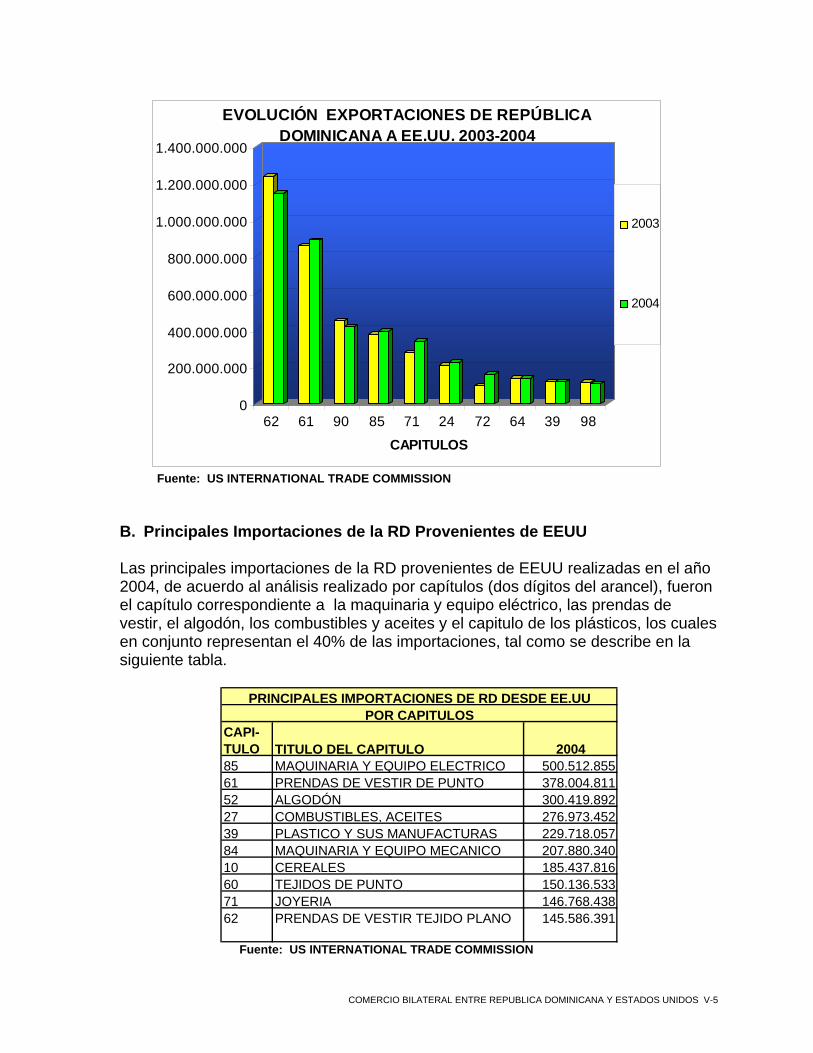
B. Principales Importaciones de la RD Provenientes de EEUU Las principales importaciones de la RD provenientes de EEUU realizadas en el año 2004, de acuerdo al análisis realizado por capítulos (dos dígitos del arancel), fueron el capítulo correspondiente a la maquinaria y equipo eléctrico, las prendas de vestir, el algodón, los combustibles y aceites y el capitulo de los plásticos, los cuales en conjunto representan el 40% de las importaciones, tal como se describe en la siguiente tabla.
CAPI-TULO TITULO DEL CAPITULO 200485 MAQUINARIA Y EQUIPO ELECTRICO 500.512.85561 PRENDAS DE VESTIR DE PUNTO 378.004.81152 ALGODÓN 300.419.89227 COMBUSTIBLES, ACEITES 276.973.45239 PLASTICO Y SUS MANUFACTURAS 229.718.05784 MAQUINARIA Y EQUIPO MECANICO 207.880.34010 CEREALES 185.437.81660 TEJIDOS DE PUNTO 150.136.53371 JOYERIA 146.768.43862 PRENDAS DE VESTIR TEJIDO PLANO 145.586.391
POR CAPITULOSPRINCIPALES IMPORTACIONES DE RD DESDE EE.UU
Fuente: US INTERNATIONAL TRADE COMMISSION
COMERCIO BILATERAL ENTRE REPUBLICA DOMINICANA Y ESTADOS UNIDOS V-5
Las importaciones de la RD provenientes de E.U., se encuentran diversificadas, caso contrario a lo que sucede con las exportaciones, ya que en este caso, ninguna de las partidas a dos dígitos del arancel alcanza a representar el 20% del total de las importaciones.
PRINCIPALES IMPORTACIONES A REPUBLICA DOMINICANA DE E.U.
12.16%
9.18%
7.30%6.73%5.58%
5.05%
4.51%
3.65%3.57% 3.54%
85 MAQUINARIA Y EQUIPO ELECTRICO 61 PRENDAS DE VESTIR DE PUNTO
52 ALGODÓN 27 COMBUSTIBLES, ACEITES
39 PLASTICO Y SUS MANUFACTURAS 84 MAQUINARIA Y EQUIPO MECANICO
10 CEREALES 60 TEJIDOS DE PUNTO
71 JOYERIA 62 PRENDAS DE VESTIR TEJIDO PLANO
Fuente: US INTERNATIONAL TRADE COMMISSION
B1. Evolución de las principales importaciones registradas en el año 2004.
US DOLARES
CAPI-TULO TITULO DEL CAPITULO 1999 2000 2001 2002 2003 2004
VARIACION 1999- 2004
85 MAQUINARIA Y EQUIPO ELECTRICO 510.477.129 507.218.826 458.350.315 429.907.459 394.790.350 500.512.855 -0,39%61 PRENDAS DE VESTIR DE PUNTO 405.216.990 444.642.866 367.576.163 315.743.900 344.016.207 378.004.811 -1,38%52 ALGODÓN 44.268.316 71.173.972 225.496.356 297.980.275 247.332.607 300.419.892 46,67%27 COMBUSTIBLES, ACEITES 56.734.434 142.062.889 101.854.109 103.506.583 334.296.560 276.973.452 37,32%39 PLASTICO Y SUS MANUFACTURAS 112.917.952 145.681.874 191.297.391 243.608.885 236.876.730 229.718.057 15,26%84 MAQUINARIA Y EQUIPO MECANICO 355.640.487 458.609.632 462.716.126 354.634.073 193.239.217 207.880.340 -10,18%10 CEREALES 150.934.162 152.942.553 145.696.147 160.428.351 156.437.689 185.437.816 4,20%60 TEJIDOS DE PUNTO 32.234.910 30.876.773 44.606.917 70.853.804 123.407.701 150.136.533 36,03%71 JOYERIA 35.893.400 57.806.413 111.599.710 139.384.879 167.423.981 146.768.438 32,53%62 PRENDAS DE VESTIR TEJIDO PLANO 623.562.030 667.274.790 406.068.390 297.810.458 232.976.415 145.586.391 -25,24%
EVOLUCION DE LAS PRINCIPALES IMPORTACIONES DE REPUBLICA DOMINICANA DESDE EE.UU.
Fuente: US INTERNATIONAL TRADE COMMISSION
Dentro de las principales importaciones registradas en el año 2004, se destaca la evolución que ha tenido el capítulo 52, correspondiente al algodón, el cual registra una variación promedio anual del 46%, igualmente cabe resaltar el dinamismo que han tenido las importaciones del tejido de punto y de joyería, las cuales tuvieron una
COMERCIO BILATERAL ENTRE REPUBLICA DOMINICANA Y ESTADOS UNIDOS V-6

variación del 36% y 32% respectivamente. Por otra parte es importante resaltar que las importaciones correspondientes al capítulo 62 han decrecido, presentando una variación promedio anual del -25% durante los últimos 6 años. Dentro del periodo analizado, se destacan el crecimiento de las importaciones de la RD del capitulo 84 correspondiente a maquinaria y equipo mecánico del cual se importaron US$ 458 millones en el año 2000; las del capítulo 85 en el año 2004 las cuales fueron de US$ 394 millones y las del capítulo 62 en el año 2000 las cuales fueron de US$ 667 millones. Es importante resaltar que dentro de las importaciones más representativas del año 2004, se observa como en años anteriores, las mismas importaciones han tenido mayores incrementos, como es el caso de los capítulos 62, 84 y 61 correspondientes a las prendas de vestir tejido plano, maquinaria y equipo mecánico, y las prendas de vestir de punto, tal como se presenta en la siguiente gráfica.
0
100.000.000
200.000.000
300.000.000
400.000.000
500.000.000
600.000.000
700.000.000
85 61 52 27 39 84 10 60 71 62CAPITULOS
EVOLUCIÓN IMPORTACIONES DE REPUBLICA DOMINICANA DESDE EU 1999-2004
1999
2000
2001
2002
2003
2004
Fuente: US INTERNATIONAL TRADE COMMISSION
B2. Variación de las principales importaciones periodo 2003-2004. De las principales importaciones de la RD desde EEUU para el año 2004, se destacan el dinamismo que presentaron los productos comprendidos dentro del capítulo 85 correspondiente a la maquinaria y equipo electrónico, registrando una variación del 26% respecto del año anterior. Se presentó un decrecimiento notorio en las importaciones del capitulo 27 (combustible y aceite) y del capitulo 62 (prendas de vestir tejido plano) del 17% y de 37% respectivamente, tal como se muestra en la siguiente gráfica.
COMERCIO BILATERAL ENTRE REPUBLICA DOMINICANA Y ESTADOS UNIDOS V-7

0
100.000.000
200.000.000
300.000.000
400.000.000
500.000.000
600.000.000
85 61 52 27 39 84 10 60 71 62CAPITULOS
EVOLUCIÓN IMPORTACIONES DE REPUBLICA DOMINICANA DESDE EE.UU. 2003-2004
2003
2004
fuente: US INTERNATIONAL TRADE COMMISSION
COMERCIO BILATERAL ENTRE REPUBLICA DOMINICANA Y ESTADOS UNIDOS V-8

SECCIÓN VI ANALISIS SECTORIAL

SECCIÓN VI ANALISIS SECTORIAL
Para el siguiente estudio, los 99 capítulos que tiene el arancel se agruparon en 22 sectores, de acuerdo con la siguiente tabla:
NUMERO SECTORES1 PECUARIO2 AGRICOLA3 AGROINDUSTRIAL4 MINERALES Y COMBUSTIBLES5 QUIMICO Y FARMACEUTICO6 PLASTICO Y CAUCHO7 CUERO Y SUS MANUFACTURAS8 MADERA Y SUS MANUFACTURAS9 EDITORIAL Y ARTES GRAFICAS
10 TEXTILES 11 CONFECCIONES12 CALZADO13 MANUFACTURAS DIVERSAS14 MINERALES NO METALICOS15 JOYERIA Y RELOJERIA16 METALES COMUNES Y SUS MANUFACTURAS17 MAQUINARIA Y EQUIPO MECANICOS18 MAQUINARIA Y EQUIPO ELECTRICO19 EQUIPO PARA TRANSPORTE20 INSTRUMENTOS DE MEDIDA, MEDICOQUIRURGICOS Y VETERINARIO21 MUEBLES Y ARTICULOS DE ALUMBRADO22 OTROS
Para cada sector se analizaron tanto las exportaciones de la RD hacia EEUU, como las importaciones provenientes de ese país, su participación en el total de las mismas y se estudiaron los productos que han tenido mayor dinamismo dentro de cada sector. A. Importaciones de la RD Desde EEUU Las importaciones totales de la RD desde EEUU para el año 2004, fueron de US$ 4.116 millones, las cuales se distribuyen en los 22 sectores, de acuerdo con la siguiente tabla:
COMERCIO BILATERAL ENTRE REPUBLICA DOMINICANA Y ESTADOS UNIDOS VI-2
NUMERO SECTORES
TOTAL SECTOR IMPORTACIONES AÑO 2004
% SOBRE EL TOTAL DE LAS IMPORTACIONES
1 PECUARIO 25.758.113 0,63%2 AGRICOLA 227.177.223 5,52%3 AGROINDUSTRIAL 212.224.384 5,16%4 MINERALES Y COMBUSTIBLES 292.926.774 7,12%5 QUIMICO Y FARMACEUTICO 174.369.920 4,24%6 PLASTICO Y CAUCHO 248.686.677 6,04%7 CUERO Y SUS MANUFACTURAS 52.727.733 1,28%8 MADERA Y SUS MANUFACTURAS 32.749.214 0,80%9 EDITORIAL Y ARTES GRAFICAS 137.487.777 3,34%
10 TEXTILES 727.687.903 17,68%11 CONFECCIONES 535.168.250 13,00%12 CALZADO 22.734.708 0,55%13 MANUFACTURAS DIVERSAS 18.114.732 0,44%14 MINERALES NO METALICOS 29.964.056 0,73%15 JOYERIA Y RELOJERIA 147.355.058 3,58%16 METALES COMUNES Y SUS MANUFACTURAS 121.583.692 2,95%17 MAQUINARIA Y EQUIPO MECANICOS 207.880.340 5,05%18 MAQUINARIA Y EQUIPO ELECTRICO 500.512.855 12,16%19 EQUIPO PARA TRANSPORTE 101.815.743 2,47%20 INSTRUMENTOS DE MEDIDA, MEDICOQUIRURGICOS Y VETERINARIO 133.577.602 3,25%21 MUEBLES Y ARTICULOS DE ALUMBRADO 24.621.956 0,60%22 OTROS 140.976.913 3,43%
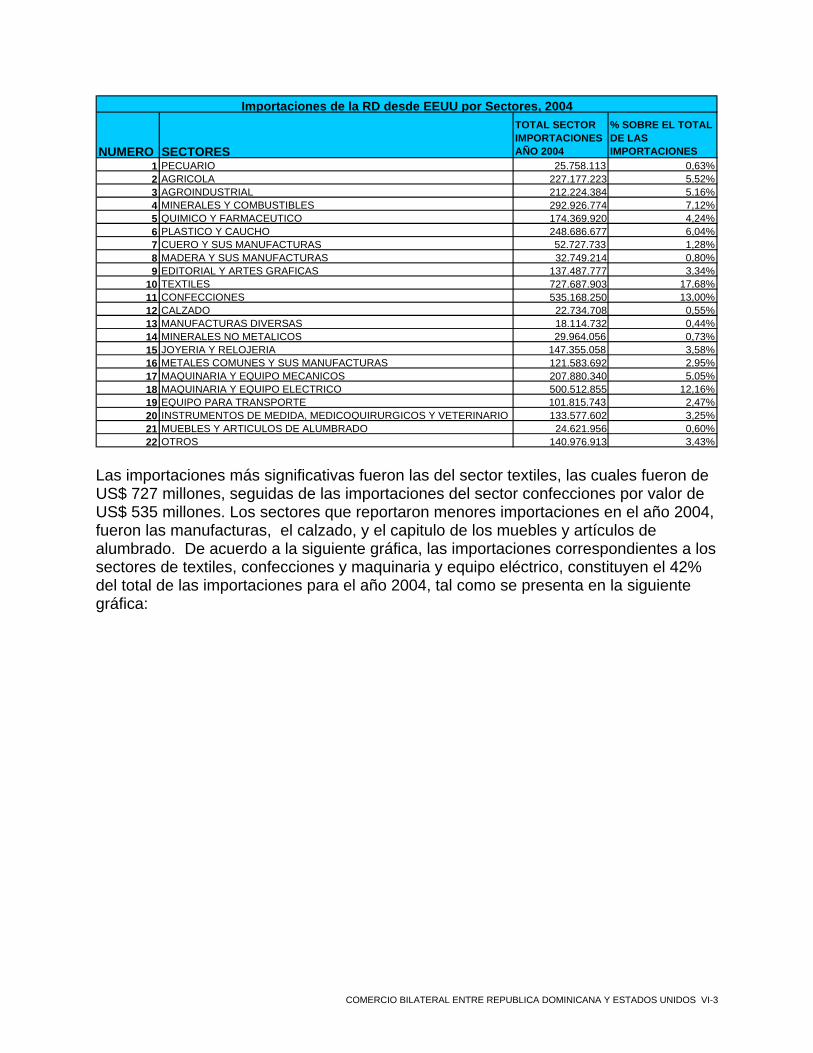
Importaciones de la RD desde EEUU por Sectores, 2004
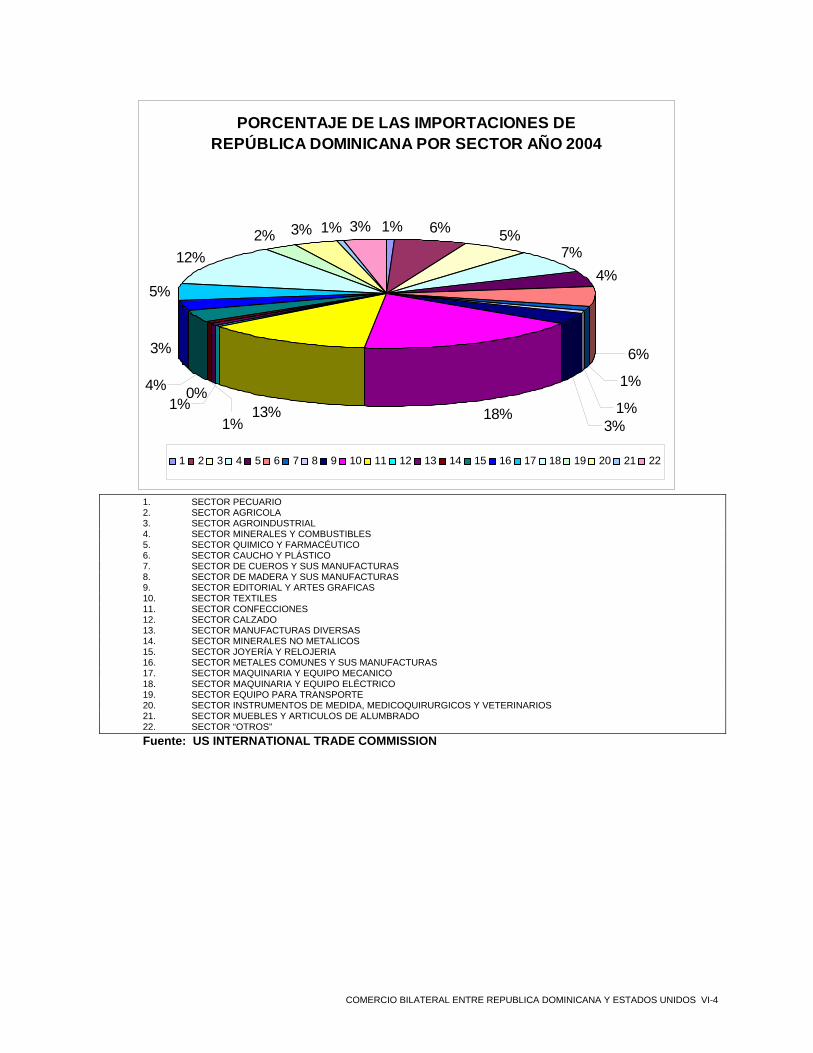
Las importaciones más significativas fueron las del sector textiles, las cuales fueron de US$ 727 millones, seguidas de las importaciones del sector confecciones por valor de US$ 535 millones. Los sectores que reportaron menores importaciones en el año 2004, fueron las manufacturas, el calzado, y el capitulo de los muebles y artículos de alumbrado. De acuerdo a la siguiente gráfica, las importaciones correspondientes a los sectores de textiles, confecciones y maquinaria y equipo eléctrico, constituyen el 42% del total de las importaciones para el año 2004, tal como se presenta en la siguiente gráfica:
COMERCIO BILATERAL ENTRE REPUBLICA DOMINICANA Y ESTADOS UNIDOS VI-3
PORCENTAJE DE LAS IMPORTACIONES DE REPÚBLICA DOMINICANA POR SECTOR AÑO 2004
1% 6% 5%7%
4%
6%
1%
1%18%13%
5%
12%2% 3% 1% 3%
1%4%
3%
0%
3%
1%
1 2 3 4 5 6 7 8 9 10 11 12 13 14 15 16 17 18 19 20 21 22
1. SECTOR PECUARIO 2. SECTOR AGRICOLA 3. SECTOR AGROINDUSTRIAL 4. SECTOR MINERALES Y COMBUSTIBLES 5. SECTOR QUIMICO Y FARMACÉUTICO 6. SECTOR CAUCHO Y PLÁSTICO 7. SECTOR DE CUEROS Y SUS MANUFACTURAS 8. SECTOR DE MADERA Y SUS MANUFACTURAS 9. SECTOR EDITORIAL Y ARTES GRAFICAS 10. SECTOR TEXTILES 11. SECTOR CONFECCIONES 12. SECTOR CALZADO 13. SECTOR MANUFACTURAS DIVERSAS 14. SECTOR MINERALES NO METALICOS 15. SECTOR JOYERÍA Y RELOJERIA 16. SECTOR METALES COMUNES Y SUS MANUFACTURAS 17. SECTOR MAQUINARIA Y EQUIPO MECANICO 18. SECTOR MAQUINARIA Y EQUIPO ELÉCTRICO 19. SECTOR EQUIPO PARA TRANSPORTE 20. SECTOR INSTRUMENTOS DE MEDIDA, MEDICOQUIRURGICOS Y VETERINARIOS 21. SECTOR MUEBLES Y ARTICULOS DE ALUMBRADO 22. SECTOR “OTROS” Fuente: US INTERNATIONAL TRADE COMMISSION
COMERCIO BILATERAL ENTRE REPUBLICA DOMINICANA Y ESTADOS UNIDOS VI-4
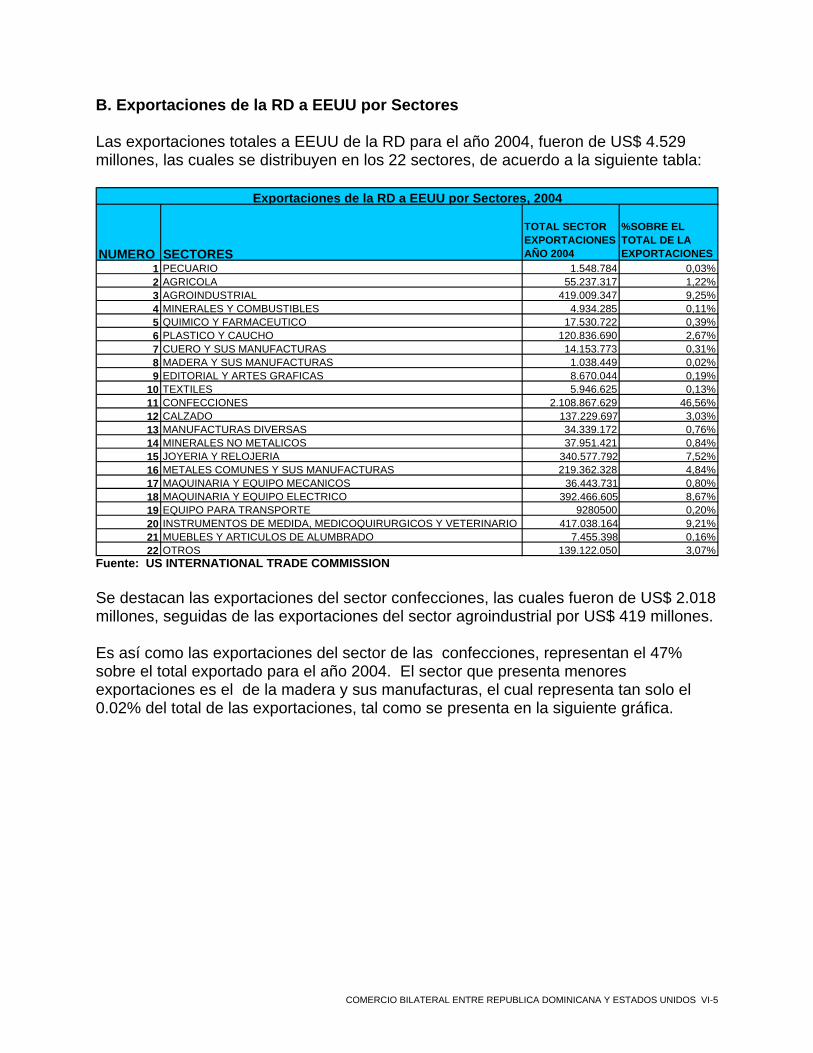
B. Exportaciones de la RD a EEUU por Sectores
Las exportaciones totales a EEUU de la RD para el año 2004, fueron de US$ 4.529 millones, las cuales se distribuyen en los 22 sectores, de acuerdo a la siguiente tabla:
NUMERO SECTORES
TOTAL SECTOR EXPORTACIONES AÑO 2004
%SOBRE EL TOTAL DE LA EXPORTACIONES
1 PECUARIO 1.548.784 0,03%2 AGRICOLA 55.237.317 1,22%3 AGROINDUSTRIAL 419.009.347 9,25%4 MINERALES Y COMBUSTIBLES 4.934.285 0,11%5 QUIMICO Y FARMACEUTICO 17.530.722 0,39%6 PLASTICO Y CAUCHO 120.836.690 2,67%7 CUERO Y SUS MANUFACTURAS 14.153.773 0,31%8 MADERA Y SUS MANUFACTURAS 1.038.449 0,02%9 EDITORIAL Y ARTES GRAFICAS 8.670.044 0,19%
10 TEXTILES 5.946.625 0,13%11 CONFECCIONES 2.108.867.629 46,56%12 CALZADO 137.229.697 3,03%13 MANUFACTURAS DIVERSAS 34.339.172 0,76%14 MINERALES NO METALICOS 37.951.421 0,84%15 JOYERIA Y RELOJERIA 340.577.792 7,52%16 METALES COMUNES Y SUS MANUFACTURAS 219.362.328 4,84%17 MAQUINARIA Y EQUIPO MECANICOS 36.443.731 0,80%18 MAQUINARIA Y EQUIPO ELECTRICO 392.466.605 8,67%19 EQUIPO PARA TRANSPORTE 9280500 0,20%20 INSTRUMENTOS DE MEDIDA, MEDICOQUIRURGICOS Y VETERINARIO 417.038.164 9,21%21 MUEBLES Y ARTICULOS DE ALUMBRADO 7.455.398 0,16%22 OTROS 139.122.050 3,07%
Exportaciones de la RD a EEUU por Sectores, 2004
Fuente: US INTERNATIONAL TRADE COMMISSION Se destacan las exportaciones del sector confecciones, las cuales fueron de US$ 2.018 millones, seguidas de las exportaciones del sector agroindustrial por US$ 419 millones. Es así como las exportaciones del sector de las confecciones, representan el 47% sobre el total exportado para el año 2004. El sector que presenta menores exportaciones es el de la madera y sus manufacturas, el cual representa tan solo el 0.02% del total de las exportaciones, tal como se presenta en la siguiente gráfica.
COMERCIO BILATERAL ENTRE REPUBLICA DOMINICANA Y ESTADOS UNIDOS VI-5

PORCENTAJE DE LAS EXPORTACIONES DE EE.UU POR SECTOR AÑO 2004
0%
1%
9%
0%
3%
0%
0%
0%
47%
0%9% 0% 3%
9%
1%
0%
1%
5%
1%
0%
8%
3%
1 2 3 4 5 6 7 8 9 10 11 12 13 14 15 16 17 18 19 20 21 22
1. SECTOR PECUARIO 2. SECTOR AGRICOLA 3. SECTOR AGROINDUSTRIAL 4. SECTOR MINERALES Y COMBUSTIBLES 5. SECTOR QUIMICO Y FARMACÉUTICO 6. SECTOR CAUCHO Y PLÁSTICO 7. SECTOR DE CUEROS Y SUS MANUFACTURAS 8. SECTOR DE MADERA Y SUS MANUFACTURAS 9. SECTOR EDITORIAL Y ARTES GRAFICAS 10. SECTOR TEXTILES 11. SECTOR CONFECCIONES 12. SECTOR CALZADO 13. SECTOR MANUFACTURAS DIVERSAS 14. SECTOR MINERALES NO METALICOS 15. SECTOR JOYERÍA Y RELOJERIA 16. SECTOR METALES COMUNES Y SUS MANUFACTURAS 17. SECTOR MAQUINARIA Y EQUIPO MECANICO 18. SECTOR MAQUINARIA Y EQUIPO ELÉCTRICO 19. SECTOR EQUIPO PARA TRANSPORTE 20. SECTOR INSTRUMENTOS DE MEDIDA, MEDICOQUIRURGICOS Y VETERINARIOS 21. SECTOR MUEBLES Y ARTICULOS DE ALUMBRADO 22. SECTOR “OTROS” Fuente: US INTERNATIONAL TRADE COMMISSION
COMERCIO BILATERAL ENTRE REPUBLICA DOMINICANA Y ESTADOS UNIDOS VI-6

C. Balanza Comercial Sectorial C1. Sector Pecuario. El sector pecuario está conformado por 5 capítulos, de acuerdo a la siguiente tabla.
CAPITULO DESCRIPCION1 ANIMALES VIVOS2 CARNE 3 PESCADO Y CRUSTACEOS4 LECHE Y PRODUCTOS LACTEOS,
HUEVOS, MIEL5 LOS DEMAS PRODUCTOS DE ORIGEN
ANIMAL
CAPITULOS DEL SECTOR PECUARIO
C1a. Balanza comercial del sector. Los capítulos que representan las mayores importaciones son las del capitulo de la carne, seguido del capitulo cuarto, correspondiente a la leche y los productos lácteos. A diferencia de las importaciones, la RD no exporta carne a E.U., (capitulo 2) sino que sus exportaciones más representativas en este sector son las del pescado y crustáceos (capítulo 3), que como se observa en la siguiente tabla han tenido un dinamismo importante, pasando de US$ 441 mil en 1999 a US$ 839 mil en el año 2004.
COMERCIO BILATERAL ENTRE REPUBLICA DOMINICANA Y ESTADOS UNIDOS VI-7

1999 2000 2001 2002 2003 2004Pe
rcent Change
1999- 2004Exportaciones 1 ANIMALES VIVOS 107,500 51,000 172,000 342,875 110,675 36,484 -19%
Importaciones 1 ANIMALES VIVOS 4,667,192 3,283,126 3,849,940 4,236,424 3,047,394 2,159,490 -14%BALANZA 1 ANIMALES VIVOS -4,559,692 -3,232,126 -3,677,940 -3,893,549 -2,936,719 -2,123,006 -14%
Exportaciones 2 CARNE 0 0 0 0 0 0 -100%
Importaciones 2 CARNE 24,882,937 12,487,517 11,027,301 8,559,486 8,346,426 10,474,704 -16%BALANZA 2 CARNE -24,882,937 -12,487,517 -11,027,301 -8,559,486 -8,346,426 -10,474,704 -16%
Exportaciones 3 PESCADO Y CRUSTACEOS 441,937 837,691 1,195,808 2,165,508 2,489,243 839,971 14%
Importaciones 3 PESCADO Y CRUSTACEOS 3,737,372 3,021,786 42,918,391 4,265,993 3,195,244 2,487,403 -8%BALANZA 3 PESCADO Y CRUSTACEOS -3,295,435 -2,184,095 -41,722,583 -2,100,485 -706,001 -1,647,432 -13%
Exportaciones 4LECHE Y PRODUCTOS LACTEOS, HUEVOS, MIEL 62,742 121,280 236,163 230,335 536,343 563,577 55%
Importaciones 4LECHE Y PRODUCTOS LACTEOS, HUEVOS, MIEL 14,209,370 12,158,840 7,728,995 7,156,256 5,183,144 9,549,716 -8%
BALANZA 4LECHE Y PRODUCTOS LACTEOS, HUEVOS, MIEL -14,146,628 -12,037,560 -7,492,832 -6,925,921 -4,646,801 -8,986,139 -9%
Exportaciones 5LOS DEMAS PRODUCTOS DE ORIGEN ANIMAL 0 0 40,996 100,024 121,016 108,752 38%
Importaciones 5 LOS DEMAS PRODUCTOS 435,657 1,030,612 1,340,183 1,369,147 1,054,471 1,086,800 20%
BALANZA 5LOS DEMAS PRODUCTOS DE ORIGEN ANIMAL -435,657 -1,030,612 -1,299,187 -1,269,123 -933,455 -978,048 18%
CAPITULO
BALANZA COMERCIAL DE REP. DOMINICANA CON EE.UU. :SECTOR PECUARIO
DESCRIPCION In Actual DollarsUS $
CAMBIO%
Fuente: US INTERNATIONAL TRADE COMMISSION El total de exportaciones de la RD realizadas en este sector, para el año 2004, corresponden a US$ 1.548.784, mientras que las importaciones de ese país provenientes de EEUU, fueron de US$ 25.758.113, presentando una balanza de US$ -24.209.329, tal como se establece en la siguiente tabla.
1999 2000 2001 2002 2003 2004Exportaciones 612,179 1,009,971 1,644,967 2,838,742 3,257,277 1,548,784Importaciones 47,932,528 31,981,881 66,864,810 25,587,306 20,826,679 25,758,113Balanza Comercial -47,320,349 -30,971,910 -65,219,843 -22,748,564 -17,569,402 -24,209,329
US $
BALANZA COMERCIAL DE REP. DOMINICANA CON EE.UU. :SECTOR PECUARIO
Fuente: US INTERNATIONAL TRADE COMMISSION
C1b. Principales importaciones del sector. Las principales importaciones de la RD del sector pecuario para el año 2004, se encuentran identificadas en la siguiente tabla.
COMERCIO BILATERAL ENTRE REPUBLICA DOMINICANA Y ESTADOS UNIDOS VI-8

1999 2000 2001 2002 2003 2004 CAMBIO %1999- 2004
1 402100000
Milk and cream, concentrated, whether or not sweetened, in powder, granules or other solid forms, fat content not exceeding 1.5% 9,541,536 7,435,561 3,021,538 1,411,680 1,342,133 5,003,863
-12.11%
2 105110020
Chickens, live, breeding stock, whether or not purebred, weighing not over 185 g each, broiler-type (meat-type) 3,716,544 2,300,726 2,068,178 2,213,991 2,332,697 1,838,488
-13.13%
3 207270090
Turkey cuts and edible offal (including livers), frozen, other 1,798,260 1,977,038 2,147,486 1,462,290 558,273 1,503,785
-3.51%
4 303796090
Fish, n.e.s.o.i., frozen, excluding fillets, livers, roes, and other fish meat of heading 0304 - 146,098 412,252 692,421 314,976 1,076,586
64.76%
5 407000020Birds' eggs, in shell, for hatching 1,497,805 420,096 407,794 655,944 - 994,543
-7.86%
6 406909550Cheese, including mixtures, nesoi 794,988 1,079,874 1,415,309 1,845,071 741,314 830,264
0.87%
7 202306000
Meat of bovine animals, boneless, except processed, frozen 4,840,632 1,047,383 378,674 617,759 1,753,773 719,805
-31.69%
8 207140090
Chicken cuts and edible offal (including livers) frozen, other 1,482,987 1,128,860 452,889 263,703 266,517 696,470
-14.03%
9 206490090
Other offal of swine except livers, edible, frozen 290,115 49,822 366,406 354,434 29,277 677,365
18.48%
10 207250000Turkeys, not cut in pieces, frozen 652,208 485,032 245,664 471,065 407,946 673,838
0.65%
IMPORTACIONES DE REP. DOMINICANA PROVENIENTES DE E.U. A 10 DIGITOS SECTOR PECUARIO
SUBPARTIDA 10 DIG PRODUCTO US $
Fuente: US INTERNATIONAL TRADE COMMISSION
El producto que representó el mayor valor de importaciones para el año 2004 fue el de la leche y nata (crema) concentradas, o con adición de azúcar u otro edulcorante, en polvo, gránulos o demás formas sólidas son un contenido de materias grasas inferior o igual al 1.5% en peso, del cual se importaron US$ 5 millones; sin embargo, se observa como en años anteriores (1999-2001) se ha importado un mayor valor; por lo cual ha tenido una variación promedio anual del -12.11%. Se destacan las importaciones de la partida 303796090 correspondiente a los demás pescados congelados, excepto filetes y demás carne de pescado, producto que ha tenido una variación promedio anual del 64.76%. Las importaciones de estos 10 productos en el año 2004, representan el 54.41% del total de las importaciones del sector, tal como se observa en la siguiente gráfica. Es
COMERCIO BILATERAL ENTRE REPUBLICA DOMINICANA Y ESTADOS UNIDOS VI-9
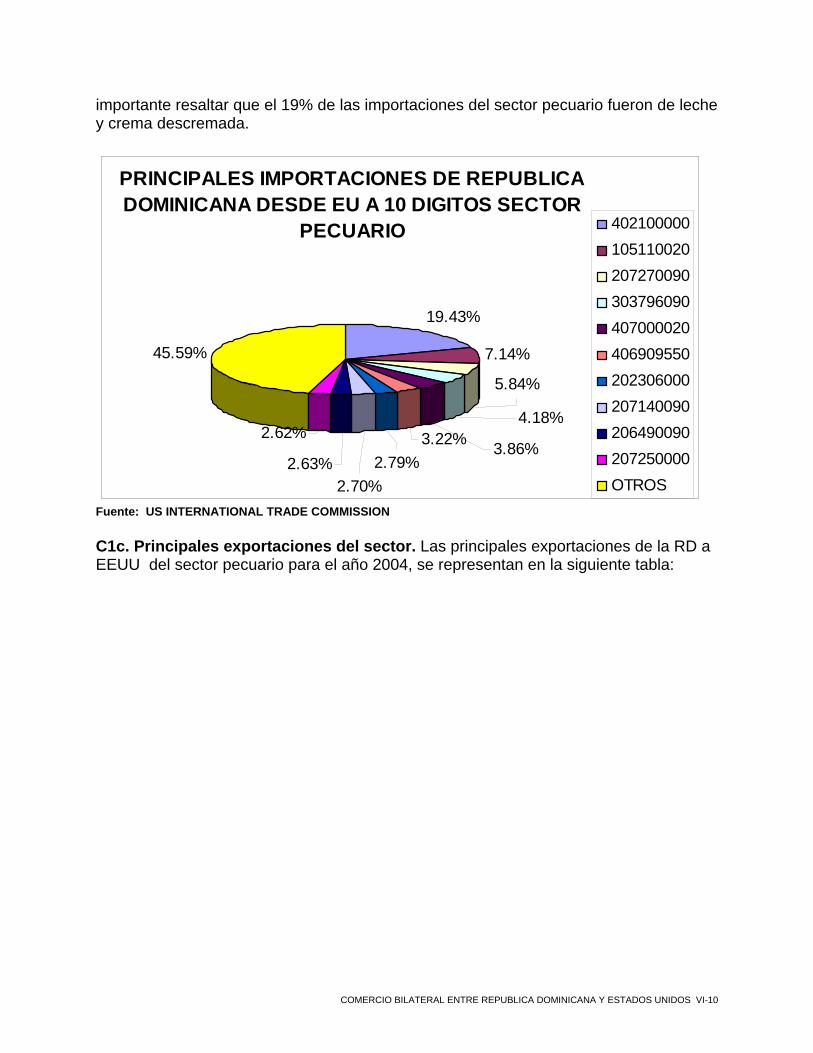
importante resaltar que el 19% de las importaciones del sector pecuario fueron de leche y crema descremada.
PRINCIPALES IMPORTACIONES DE REPUBLICA DOMINICANA DESDE EU A 10 DIGITOS SECTOR
PECUARIO
19.43%
7.14%
2.63%
2.62%
45.59%
2.79%2.70%
3.22% 3.86%
4.18%
5.84%
402100000105110020207270090303796090407000020406909550202306000207140090206490090207250000OTROS
Fuente: US INTERNATIONAL TRADE COMMISSION C1c. Principales exportaciones del sector. Las principales exportaciones de la RD a EEUU del sector pecuario para el año 2004, se representan en la siguiente tabla:
COMERCIO BILATERAL ENTRE REPUBLICA DOMINICANA Y ESTADOS UNIDOS VI-10

1999 2000 2001 2002 2003 2004 CAMBIO %1999- 2004
1
306110000 Rock lobster and other sea crawfish (palinurus spp., panulirus spp., jasus spp.) Including in shell, cooked by steaming or by boiling in water, frozen
132,760 6,120 29,240 377,032 174,748 534,759 32.14%
2406901800 Cheese, edam and
gouda, nesoi0 0 0 0 112,792 211,028 87.09%
3
406307100 Mixtures, processed cheese, containing or processed from american-type cheese (ex cheddar) not grated/powdered, nesoi
0 0 0 4,494 106,997 152,786 483.08%
4
302694099 Fish, excluding fillets, livers and roes, fresh or chilled, nesoi
0 0 2,348 2,370 14,351 147,218 297.27%
5
409000025 Comb honey and honey packaged for retail sale
5,179 9,860 0 2,246 36,728 101,991 81.49%
6
511992000 Parings and similar waste of raw hides or skins; glue stock, not elsewhere specified or included
0 0 40,996 88,938 121,016 70,412 19.76%
7
409000064 Natural honey, not packaged for retail sale, nesoi
55,488 111,420 229,965 111,447 213,503 53,840 -0.60%
8
303794097 Fish, frozen, nesoi, except fillets/livers/roes
0 26,319 40,320 0 0 40,704 11.52%
9
508000000 Coral & similar materials, shells of molluscs, crustaceans, echinoderms, cuttlebone, unworked or simply prepared, not cut to shape, powder and waste
0 0 0 0 0 38,340 0.00%
10
302691040 Fish nesoi excluding fillets, livers and roes, scaled, not otherwise processed, in containers weighing with contents 6.8 kg or less, fresh or chilled
0 0 0 0 0 22,164 0.00%
EXPORTACIONES DE REP DOMINICANA A E.U. 10 DIGITOS SECTOR PECUARIO
SUBPARTIDA 10 DIG PRODUCTO US $
Fuente: US INTERNATIONAL TRADE COMMISSION Las exportaciones más significativas para el año 2004, fueron la langosta congelada y otros crustáceos, de los cuales se exportaron US$ 534.759; subpartida que ha tenido
COMERCIO BILATERAL ENTRE REPUBLICA DOMINICANA Y ESTADOS UNIDOS VI-11
un dinamismo importante en los últimos años, ya que presenta una variación promedio anual de 32%. Es importante destacar, como la RD ha diversificado las exportaciones a EEUU de este sector, teniendo en cuenta que a partir del año 2002, empezaron a exportar quesos procesados (subpartida 406307100) o como en el año 2004, se empiezan a exportar otros tipos de pescado (subpartida 302691040). Las exportaciones de estos 10 productos, representan el 88% de total de las exportaciones de este sector en el año 2004, tal como se observa en el siguiente gráfico. Tan solo los productos identificados con las subpartidas 30610000 y 406901800, correspondientes a la langosta y otros crustáceos, y a los demás quesos gouda y edam representan más del 40% de las exportaciones del sector. C2. Sector Agrícola. El sector agrícola, esta conformado por 9 capítulos, de acuerdo con la siguiente tabla.
CAPITULO DESCRIPCION6 PLANTAS VIVAS Y FLORES7 HORTALIZAS8 FRUTAS9 CAFÉ, TE, MATE ESPECIAS10 CEREALES11 MOLINERIA12 SEMILLAS OLEAGINOSAS, PLANTAS
MEDICINALES, FORRAJE13 GOMAS, RESINAS, JUGOS Y
EXTRACTOS VEGETALES14 MATERIAL TRENZABLE Y DEMAS
PRODUCTOS VEGETALES
SECTOR AGRICOLA
C2a. Balanza comercial del sector. Se destacan las importaciones de cereales, las cuales alcanzaron los US$ 185 millones, igualmente, cabe resaltar las importaciones de semillas las cuales para el año 2004 fueron de US $105 millones. Respecto de las exportaciones de la RD, el capitulo más representativo es el de las frutas, (capitulo 8), las cuales fueron de US$ 28 millones para el año 2004.
COMERCIO BILATERAL ENTRE REPUBLICA DOMINICANA Y ESTADOS UNIDOS VI-12
1999 2000 2001 2002 2003 2004 CAMBIO %DESCRIPCION 1999- 2004
Importaciones6 PLANTAS VIVAS Y
FLORES2.071.236 2.082.305 2.183.171 2.355.783 1.832.418 1.754.930 -3,26%
Exportaciones6 PLANTAS VIVAS Y
FLORES259.944 315.254 258.098 388.302 283.052 274.393 1,09%
BALANZA 6 PLANTAS VIVAS Y
FLORES -1.811.292 -1.767.051 -1.925.073 -1.967.481 -1.549.366 -1.480.537-3,95%
Importaciones 7 HORTALIZAS 16.709.788 17.692.649 19.649.664 16.097.441 14.239.522 19.428.943 3,06%Exportaciones 7 HORTALIZAS 10.536.195 12.424.823 9.913.912 10.283.195 6.435.100 7.327.313 -7,01%BALANZA 7 HORTALIZAS -6.173.593 -5.267.826 -9.735.752 -5.814.246 -7.804.422 -12.101.630 14,41%Importaciones 8 FRUTAS 26.662.928 24.574.025 25.661.827 26.309.436 27.583.313 28.147.534 1,09%Exportaciones 8 FRUTAS 9.027.602 10.578.775 12.686.273 12.975.065 6.417.761 7.228.531 -4,35%BALANZA 8 FRUTAS -17.635.326 -13.995.250 -12.975.554 -13.334.371 -21.165.552 -20.919.003 3,47%
Importaciones9 CAFÉ, TE, MATE
ESPECIAS12.662.546 11.388.360 6.736.123 7.913.859 11.122.572 631.555 -45,10%
Exportaciones9 CAFÉ, TE, MATE
ESPECIAS319.997 468.930 371.542 450.500 580.754 211.345 -7,96%
BALANZA 9 CAFÉ, TE, MATE
ESPECIAS -12.342.549 -10.919.430 -6.364.581 -7.463.359 -10.541.818 -420.210-49,14%
Importaciones 10 CEREALES 0 0 0 0 0 0 -100,00%Exportaciones 10 CEREALES 150.934.162 152.942.553 145.696.147 160.428.351 156.437.689 185.437.816 4,20%BALANZA 10 CEREALES 150.934.162 152.942.553 145.696.147 160.428.351 156.437.689 185.437.816 4,20%Importaciones 11 MOLINERIA 145.403 85.276 102.739 129.921 132.615 28.989 -27,57%Exportaciones 11 MOLINERIA 15.825.732 2.724.397 2.095.597 2.872.389 1.765.921 13.347.546 -3,35%BALANZA 11 MOLINERIA 15.680.329 2.639.121 1.992.858 2.742.468 1.633.306 13.318.557 -3,21%
Importaciones
12 SEMILLAS OLEAGINOSAS, PLANTAS MEDICINALES, FORRAJE
18.321 42.513 48.893 304.749 81.273 105.554 41,94%
Exportaciones
12 SEMILLAS OLEAGINOSAS, PLANTAS MEDICINALES, FORRAJE
2.057.330 2.626.436 3.337.108 1.908.907 1.433.265 12.307.379 43,01%
BALANZA
12 SEMILLAS OLEAGINOSAS, PLANTAS MEDICINALES, FORRAJE 2.039.009 2.583.923 3.288.215 1.604.158 1.351.992 12.201.825
43,02%
Importaciones
13 GOMAS, RESINAS, JUGOS Y EXTRACTOS VEGETALES
3.974.475 5.550.969 7.493.069 7.505.559 6.415.873 5.139.812 5,28%
Exportaciones
13 GOMAS, RESINAS, JUGOS Y EXTRACTOS VEGETALES
2.634.445 2.705.690 2.792.237 1.384.230 1.817.051 992.274 -17,74%
BALANZA
13 GOMAS, RESINAS, JUGOS Y EXTRACTOS VEGETALES
-1.340.030 -2.845.279 -4.700.832 -6.121.329 -4.598.822 -4.147.538
25,35%
Importaciones
14 MATERIAL TRENZABLE Y DEMAS PRODUCTOS VEGETALES
0 0 3.960 0 2.600 0 -100,00%
Exportaciones
14 MATERIAL TRENZABLE Y DEMAS PRODUCTOS VEGETALES
23.400 80.194 60.607 15.936 7.918 50.626 16,69%
BALANZA
14 MATERIAL TRENZABLE Y DEMAS PRODUCTOS VEGETALES 23.400 80.194 56.647 15.936 5.318 50.626
16,69%
BALANZA COMERCIAL DE EE.UU. CON REP. DOMINICANA: SECTOR AGRICOLA
CAPITULO US $
Fuente: US INTERNATIONAL TRADE COMMISSION
COMERCIO BILATERAL ENTRE REPUBLICA DOMINICANA Y ESTADOS UNIDOS VI-13
El total de exportaciones de la RD realizadas en este sector, para el año 2004, corresponden a US$ 55.237.317, mientras que las importaciones de la RD desde EEUU fueron de US$ 227.177.223, presentando una balanza de US$ -171.939.906, tal como se establece en la siguiente tabla:
1999 2000 2001 2002 2003 2004
Exportaciones 62,246,696 61,418,097 61,881,447 60,618,750 61,412,189 55,237,317Importaciones 191618807 184867052 177211521 190706875 175178511 227177223Balanza Comercial -129,372,111 -123,448,955 -115,330,074 -130,088,125 -113,766,322 -171,939,906
Us $
BALANZA COMERCIAL DE REP. DOMINICANA CON EE.UU. : SECTOR AGRICOLA1999 2000 2001 2002 2003 2004
Exportaciones 62,246,696 61,418,097 61,881,447 60,618,750 61,412,189 55,237,317Importaciones 191618807 184867052 177211521 190706875 175178511 227177223Balanza Comercial -129,372,111 -123,448,955 -115,330,074 -130,088,125 -113,766,322 -171,939,906
Us $
BALANZA COMERCIAL DE REP. DOMINICANA CON EE.UU. : SECTOR AGRICOLA
Fuente: US INTERNATIONAL TRADE COMMISSION
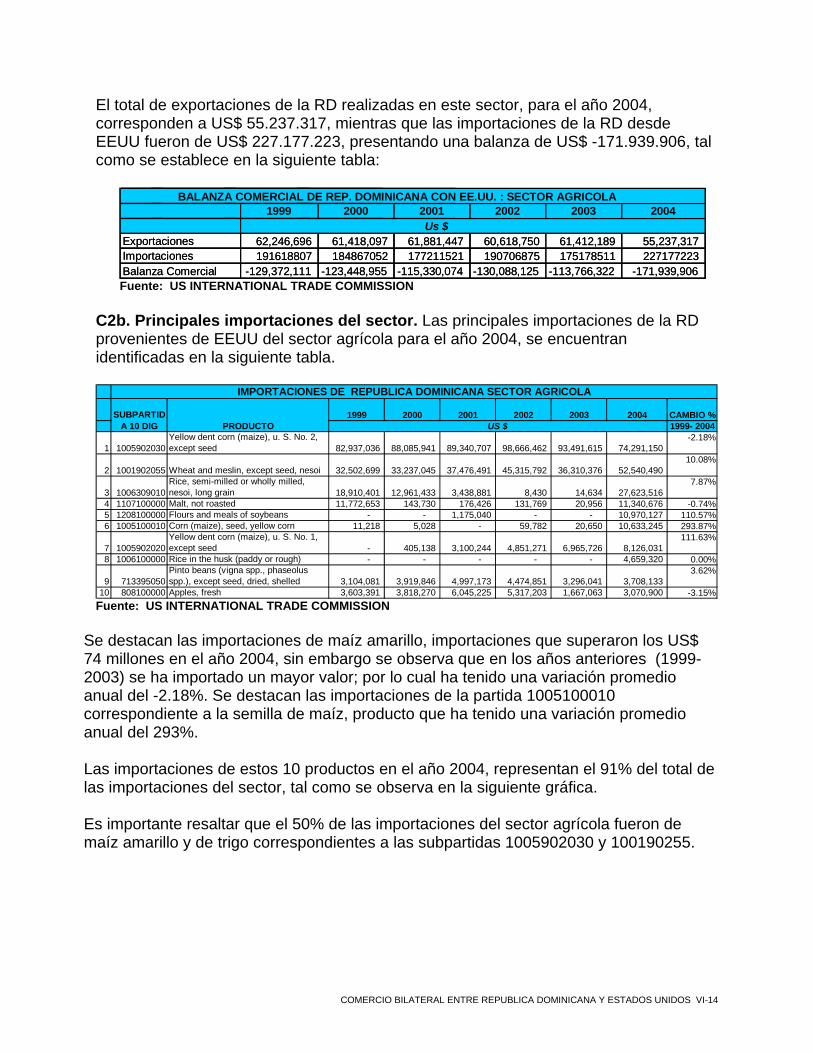
C2b. Principales importaciones del sector. Las principales importaciones de la RD provenientes de EEUU del sector agrícola para el año 2004, se encuentran identificadas en la siguiente tabla.
1999 2000 2001 2002 2003 2004 CAMBIO %1999- 2004
1 1005902030Yellow dent corn (maize), u. S. No. 2, except seed 82,937,036 88,085,941 89,340,707 98,666,462 93,491,615 74,291,150
-2.18%
2 1001902055 Wheat and meslin, except seed, nesoi 32,502,699 33,237,045 37,476,491 45,315,792 36,310,376 52,540,490 10.08%
3 1006309010Rice, semi-milled or wholly milled, nesoi, long grain 18,910,401 12,961,433 3,438,881 8,430 14,634 27,623,516
7.87%
4 1107100000 Malt, not roasted 11,772,653 143,730 176,426 131,769 20,956 11,340,676 -0.74%5 1208100000 Flours and meals of soybeans - - 1,175,040 - - 10,970,127 110.57%6 1005100010 Corn (maize), seed, yellow corn 11,218 5,028 - 59,782 20,650 10,633,245 293.87%
7 1005902020Yellow dent corn (maize), u. S. No. 1, except seed - 405,138 3,100,244 4,851,271 6,965,726 8,126,031
111.63%
8 1006100000 Rice in the husk (paddy or rough) - - - - - 4,659,320 0.00%
9 713395050Pinto beans (vigna spp., phaseolus spp.), except seed, dried, shelled 3,104,081 3,919,846 4,997,173 4,474,851 3,296,041 3,708,133
3.62%
10 808100000 Apples, fresh 3,603,391 3,818,270 6,045,225 5,317,203 1,667,063 3,070,900 -3.15%
IMPORTACIONES DE REPUBLICA DOMINICANA SECTOR AGRICOLA
SUBPARTIDA 10 DIG PRODUCTO US $
Fuente: US INTERNATIONAL TRADE COMMISSION
Se destacan las importaciones de maíz amarillo, importaciones que superaron los US$ 74 millones en el año 2004, sin embargo se observa que en los años anteriores (1999-2003) se ha importado un mayor valor; por lo cual ha tenido una variación promedio anual del -2.18%. Se destacan las importaciones de la partida 1005100010 correspondiente a la semilla de maíz, producto que ha tenido una variación promedio anual del 293%. Las importaciones de estos 10 productos en el año 2004, representan el 91% del total de las importaciones del sector, tal como se observa en la siguiente gráfica. Es importante resaltar que el 50% de las importaciones del sector agrícola fueron de maíz amarillo y de trigo correspondientes a las subpartidas 1005902030 y 100190255.
COMERCIO BILATERAL ENTRE REPUBLICA DOMINICANA Y ESTADOS UNIDOS VI-14
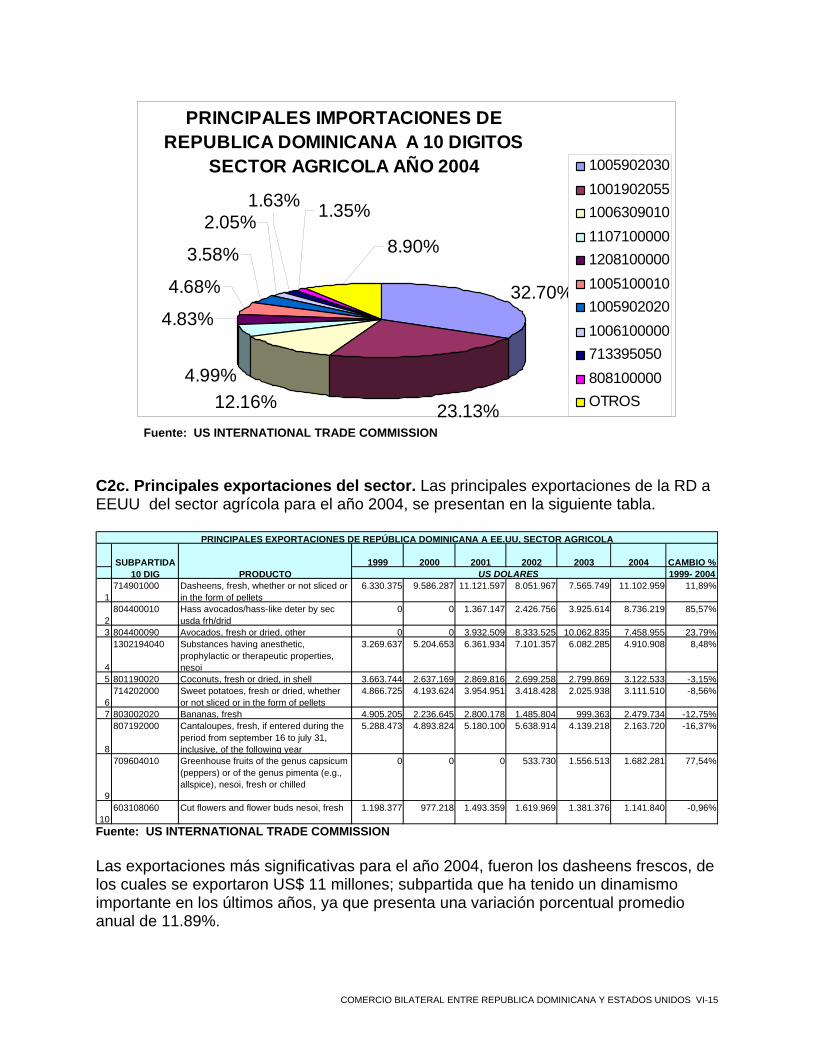
PRINCIPALES IMPORTACIONES DE REPUBLICA DOMINICANA A 10 DIGITOS
SECTOR AGRICOLA AÑO 2004
32.70%
23.13%12.16%4.99%
4.83%
4.68%
3.58%
2.05%1.63% 1.35%
8.90%
10059020301001902055100630901011071000001208100000100510001010059020201006100000713395050808100000OTROS
Fuente: US INTERNATIONAL TRADE COMMISSION C2c. Principales exportaciones del sector. Las principales exportaciones de la RD a EEUU del sector agrícola para el año 2004, se presentan en la siguiente tabla.
1999 2000 2001 2002 2003 2004 CAMBIO %1999- 2004
1714901000 Dasheens, fresh, whether or not sliced or
in the form of pellets6.330.375 9.586.287 11.121.597 8.051.967 7.565.749 11.102.959 11,89%
2804400010 Hass avocados/hass-like deter by sec
usda frh/drid0 0 1.367.147 2.426.756 3.925.614 8.736.219 85,57%
3 804400090 Avocados, fresh or dried, other 0 0 3.932.509 8.333.525 10.062.835 7.458.955 23,79%
4
1302194040 Substances having anesthetic, prophylactic or therapeutic properties, nesoi
3.269.637 5.204.653 6.361.934 7.101.357 6.082.285 4.910.908 8,48%
5 801190020 Coconuts, fresh or dried, in shell 3.663.744 2.637.169 2.869.816 2.699.258 2.799.869 3.122.533 -3,15%
6714202000 Sweet potatoes, fresh or dried, whether
or not sliced or in the form of pellets4.866.725 4.193.624 3.954.951 3.418.428 2.025.938 3.111.510 -8,56%
7 803002020 Bananas, fresh 4.905.205 2.236.645 2.800.178 1.485.804 999.363 2.479.734 -12,75%
8
807192000 Cantaloupes, fresh, if entered during the period from september 16 to july 31, inclusive, of the following year
5.288.473 4.893.824 5.180.100 5.638.914 4.139.218 2.163.720 -16,37%
9
709604010 Greenhouse fruits of the genus capsicum (peppers) or of the genus pimenta (e.g., allspice), nesoi, fresh or chilled
0 0 0 533.730 1.556.513 1.682.281 77,54%
10603108060 Cut flowers and flower buds nesoi, fresh 1.198.377 977.218 1.493.359 1.619.969 1.381.376 1.141.840 -0,96%
SUBPARTIDA 10 DIG PRODUCTO US DOLARES
PRINCIPALES EXPORTACIONES DE REPÚBLICA DOMINICANA A EE.UU, SECTOR AGRICOLA
Fuente: US INTERNATIONAL TRADE COMMISSION
Las exportaciones más significativas para el año 2004, fueron los dasheens frescos, de los cuales se exportaron US$ 11 millones; subpartida que ha tenido un dinamismo importante en los últimos años, ya que presenta una variación porcentual promedio anual de 11.89%.
COMERCIO BILATERAL ENTRE REPUBLICA DOMINICANA Y ESTADOS UNIDOS VI-15

Es importante destacar, como la RD ha diversificado las exportaciones de este sector, teniendo en cuenta que a partir del año 2002, empezaron a exportar pimienta (subpartida 709604010); o como en el año 2001, se empezaron a exportar aguacates. Las exportaciones de estos 10 productos, representan el 83% de total de las exportaciones de este sector en el año 2004, tal como se observa en el siguiente gráfico. Tan solo los productos identificados con las subpartidas 714901000 y 804400010, correspondientes a los dasheens y a los aguacates representan el 30% de las exportaciones del sector.
PRINCIPALES EXPORTACIONES DE REPUBLICA DOMINICANA A 10 DIGITOS SECTOR AGRICOLA
AÑO 2004
20.10%
15.82%
13.50%
8.89%
5.65%
5.63%
4.49%
3.92%
3.05%
2.07%
16.88%
714901000
804400010
804400090
1302194040
801190020
714202000
803002020
807192000
709604010
603108060
OTROS
Fuente: US INTERNATIONAL TRADE COMMISSION C3. Sector Agroindustrial. El sector agroindustrial, esta conformado por 11 capítulos, de acuerdo con la siguiente tabla.
COMERCIO BILATERAL ENTRE REPUBLICA DOMINICANA Y ESTADOS UNIDOS VI-16
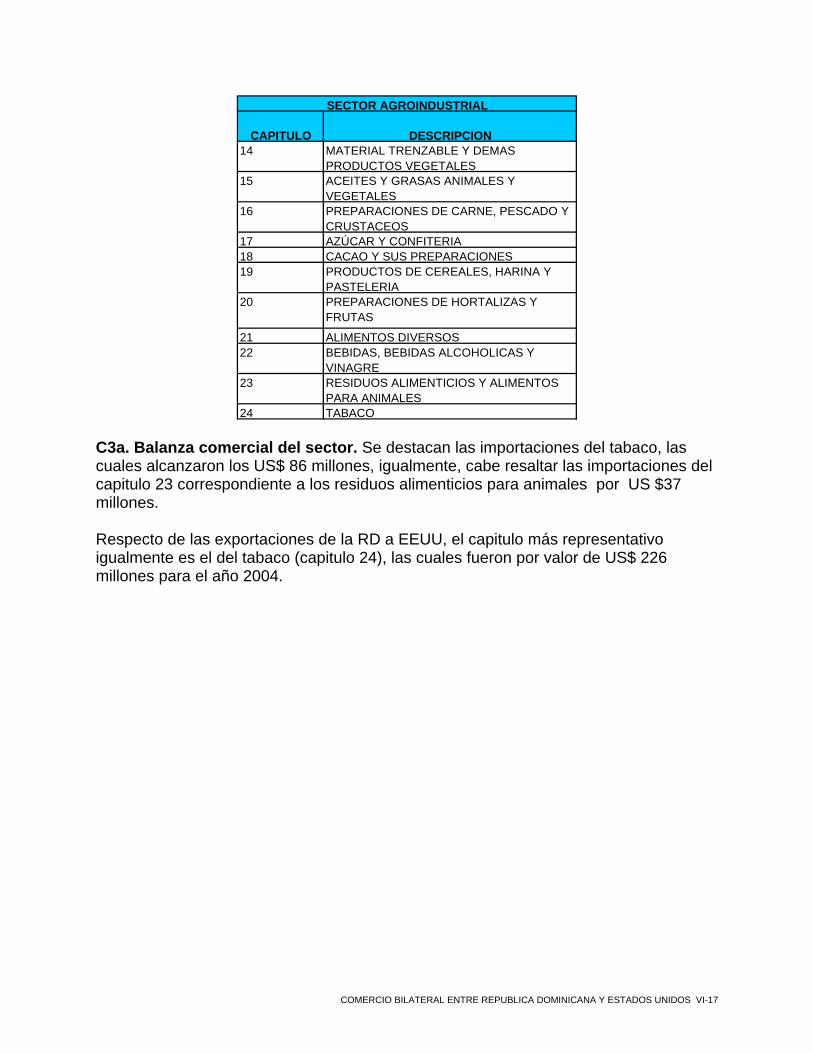
CAPITULO DESCRIPCION14 MATERIAL TRENZABLE Y DEMAS
PRODUCTOS VEGETALES15 ACEITES Y GRASAS ANIMALES Y
VEGETALES16 PREPARACIONES DE CARNE, PESCADO Y
CRUSTACEOS17 AZÚCAR Y CONFITERIA18 CACAO Y SUS PREPARACIONES19 PRODUCTOS DE CEREALES, HARINA Y
PASTELERIA20 PREPARACIONES DE HORTALIZAS Y
FRUTAS
21 ALIMENTOS DIVERSOS22 BEBIDAS, BEBIDAS ALCOHOLICAS Y
VINAGRE23 RESIDUOS ALIMENTICIOS Y ALIMENTOS
PARA ANIMALES24 TABACO
SECTOR AGROINDUSTRIAL
C3a. Balanza comercial del sector. Se destacan las importaciones del tabaco, las cuales alcanzaron los US$ 86 millones, igualmente, cabe resaltar las importaciones del capitulo 23 correspondiente a los residuos alimenticios para animales por US $37 millones. Respecto de las exportaciones de la RD a EEUU, el capitulo más representativo igualmente es el del tabaco (capitulo 24), las cuales fueron por valor de US$ 226 millones para el año 2004.
COMERCIO BILATERAL ENTRE REPUBLICA DOMINICANA Y ESTADOS UNIDOS VI-17
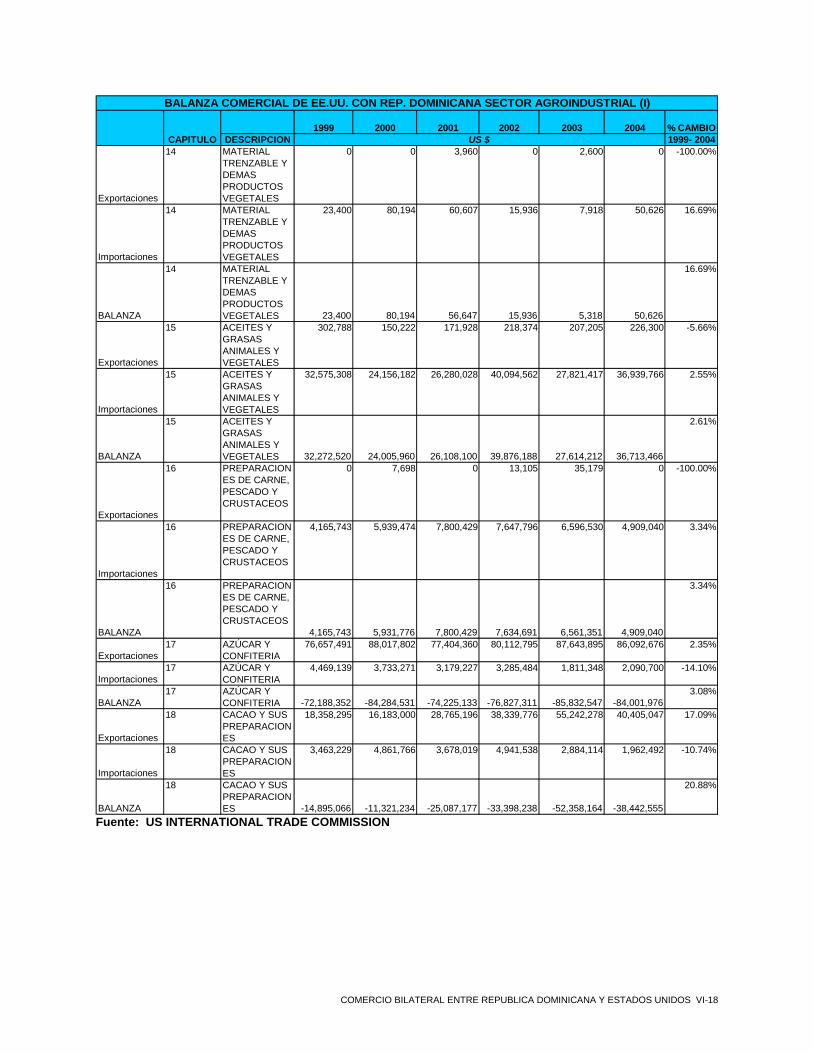
1999 2000 2001 2002 2003 2004 % CAMBIODESCRIPCION 1999- 2004
Exportaciones
14 MATERIAL TRENZABLE Y DEMAS PRODUCTOS VEGETALES
0 0 3,960 0 2,600 0 -100.00%
Importaciones
14 MATERIAL TRENZABLE Y DEMAS PRODUCTOS VEGETALES
23,400 80,194 60,607 15,936 7,918 50,626 16.69%
BALANZA
14 MATERIAL TRENZABLE Y DEMAS PRODUCTOS VEGETALES 23,400 80,194 56,647 15,936 5,318 50,626
16.69%
Exportaciones
15 ACEITES Y GRASAS ANIMALES Y VEGETALES
302,788 150,222 171,928 218,374 207,205 226,300 -5.66%
Importaciones
15 ACEITES Y GRASAS ANIMALES Y VEGETALES
32,575,308 24,156,182 26,280,028 40,094,562 27,821,417 36,939,766 2.55%
BALANZA
15 ACEITES Y GRASAS ANIMALES Y VEGETALES 32,272,520 24,005,960 26,108,100 39,876,188 27,614,212 36,713,466
2.61%
Exportaciones
16 PREPARACIONES DE CARNE, PESCADO Y CRUSTACEOS
0 7,698 0 13,105 35,179 0 -100.00%
Importaciones
16 PREPARACIONES DE CARNE, PESCADO Y CRUSTACEOS
4,165,743 5,939,474 7,800,429 7,647,796 6,596,530 4,909,040 3.34%
BALANZA
16 PREPARACIONES DE CARNE, PESCADO Y CRUSTACEOS
4,165,743 5,931,776 7,800,429 7,634,691 6,561,351 4,909,040
3.34%
Exportaciones17 AZÚCAR Y
CONFITERIA76,657,491 88,017,802 77,404,360 80,112,795 87,643,895 86,092,676 2.35%
Importaciones17 AZÚCAR Y
CONFITERIA4,469,139 3,733,271 3,179,227 3,285,484 1,811,348 2,090,700 -14.10%
BALANZA 17 AZÚCAR Y
CONFITERIA -72,188,352 -84,284,531 -74,225,133 -76,827,311 -85,832,547 -84,001,9763.08%
Exportaciones
18 CACAO Y SUS PREPARACIONES
18,358,295 16,183,000 28,765,196 38,339,776 55,242,278 40,405,047 17.09%
Importaciones
18 CACAO Y SUS PREPARACIONES
3,463,229 4,861,766 3,678,019 4,941,538 2,884,114 1,962,492 -10.74%
BALANZA
18 CACAO Y SUS PREPARACIONES -14,895,066 -11,321,234 -25,087,177 -33,398,238 -52,358,164 -38,442,555
20.88%
BALANZA COMERCIAL DE EE.UU. CON REP. DOMINICANA SECTOR AGROINDUSTRIAL (I)
CAPITULO US $
Fuente: US INTERNATIONAL TRADE COMMISSION
COMERCIO BILATERAL ENTRE REPUBLICA DOMINICANA Y ESTADOS UNIDOS VI-18

1999 2000 2001 2002 2003 2004 CAMBIO %DESCRIPCION 1999- 2004
Exportaciones
19 PRODUCTOS DE CEREALES, HARINA Y PASTELERIA
1,372,568 1,363,517 1,858,849 1,590,707 3,270,651 4,649,315 27.64%
Importaciones
19 PRODUCTOS DE CEREALES, HARINA Y PASTELERIA
16,259,297 14,161,201 12,691,774 13,992,791 8,922,003 7,156,372 -15.14%
BALANZA
19 PRODUCTOS DE CEREALES, HARINA Y PASTELERIA
14,886,729 12,797,684 10,832,925 12,402,084 5,651,352 2,507,057
-29.97%
Exportaciones
20 PREPARACIONES DE HORTALIZAS Y FRUTAS
21,877,909 21,030,572 19,923,004 20,796,441 19,234,288 13,458,107 -9.26%
Importaciones
20 PREPARACIONES DE HORTALIZAS Y FRUTAS
15,293,010 11,545,999 11,101,576 11,055,071 7,186,998 6,706,720 -15.20%
BALANZA
20 PREPARACIONES DE HORTALIZAS Y FRUTAS -6,584,899 -9,484,573 -8,821,428 -9,741,370 -12,047,290 -6,751,387
0.50%
Exportaciones21 ALIMENTOS
DIVERSOS14,602,158 14,281,294 21,017,255 21,680,405 19,265,703 22,945,160 9.46%
Importaciones21 ALIMENTOS
DIVERSOS25,862,319 23,910,804 27,254,693 28,694,798 24,626,057 22,346,272 -2.88%
BALANZA 21 ALIMENTOS
DIVERSOS 11,260,161 9,629,510 6,237,438 7,014,393 5,360,354 -598,888-155.61%
Exportaciones
22 BEBIDAS, BEBIDAS ALCOHOLICAS Y VINAGRE
12,920,998 14,004,254 19,514,704 26,503,613 24,561,417 24,895,409 14.02%
Importaciones
22 BEBIDAS, BEBIDAS ALCOHOLICAS Y VINAGRE
4,646,100 6,005,644 11,559,464 16,051,309 14,044,241 6,443,040 6.76%
BALANZA
22 BEBIDAS, BEBIDAS ALCOHOLICAS Y VINAGRE -8,274,898 -7,998,610 -7,955,240 -10,452,304 -10,517,176 -18,452,369
17.40%
Exportaciones
23 RESIDUOS ALIMENTICIOS Y ALIMENTOS PARA ANIMALES
19,718 204,994 46,632 84,976 19,417 170,817 54.00%
Importaciones
23 RESIDUOS ALIMENTICIOS Y ALIMENTOS PARA ANIMALES
63,973,942 77,066,989 84,076,477 81,437,633 82,553,648 37,130,763 -10.31%
BALANZA
23 RESIDUOS ALIMENTICIOS Y ALIMENTOS PARA ANIMALES 63,954,224 76,861,995 84,029,845 81,352,657 82,534,231 36,959,946
-10.39%
Exportaciones 24 TABACO 213,418,522 217,865,556 212,656,526 202,731,505 207,736,553 226,166,516 1.17%Importaciones 24 TABACO 141,206,056 110,006,517 92,113,811 87,467,251 76,210,247 86,539,219 -9.33%BALANZA 24 TABACO -72,212,466 -107,859,039 -120,542,715 -115,264,254 -131,526,306 -139,627,297 14.10%
BALANZA COMERCIAL DE EE.UU. CON REP. DOMINICANA SECTOR AGROINDUSTRIAL (II)+A53
CAPITULO US $
Fuente: US INTERNATIONAL TRADE COMMISSION
COMERCIO BILATERAL ENTRE REPUBLICA DOMINICANA Y ESTADOS UNIDOS VI-19

Las exportaciones totales del sector agroindustrial para el año 2004 son de US$ de
3b. Principales importaciones del sector. Las principales importaciones de la RD
419.009.347, mientras que las importaciones de la RD provenientes de EEUU son212.215.010, lo cual representa, una balanza de US$206.734.337.
1999 2000 2001 2002 2003 2004
E rtaciones 359,530,447 373,108,909 381,358,454 392,071,697 417,216,586 419,009,347Importaciones 311,937,543 281,468,041 279,796,105 294,684,169 252,664,521 212,275,010Balanza 47,592,904 91,640,868 101,562,349 97,387,528 164,552,065 206,734,337
BALANZA COMERCIAL DE REP. DOMINICANA CON EE.UU. : SECTOR AGROINDUSTRIAL
US $xpo
Fuente: US INTERNATIONAL TRADE COMMISSION Cprovenientes de EEUU del sector agroindustrial para el año 2004, se encuentran identificadas en la siguiente tabla.
1999 2000 2001 2002 2003 2004 CAMBIO %1999- 2004
1 2401102020Connecticut shade tobacco, not stemmed/stripped, containing over 35 percent wrapper tobacco 104,548,492 80,487,666 66,055,546 41,560,848 26,166,580 32,234,620 -20.97%
2 2304000000
Soybean oilcake and other solid residues resulting from the extraction of soy bean oil, whether or not ground or in the form of pellets 54,833,373 65,433,971 71,130,084 69,782,059 73,217,900 30,907,835 -10.83%
3 2401102040Tobacco, not stemmed/stripped, containing over 35 percent wrapper tobacco, nesoi 24,208,959 15,643,764 18,885,032 29,787,549 13,891,071 21,606,251 -2.25%
4 1507100000Soybean oil and its fractions, crude, whether or not degummed 7,217,036 3,754,775 5,609,767 17,569,569 7,509,044 13,894,035 14.00%
5 2401109570
Tobacco nesoi including cigar leaf, not stemmed/stripped, not containing wrapper tobacco or not containing over 35% wrapper tobacco 33,891 282,598 - 9,524,381 11,263,045 11,568,264 221.10%
6 2106906573Preparations for the manufacture of beverages, nesoi 9,800,642 10,043,571 12,763,997 13,950,766 9,824,406 8,825,278 -2.07%
7 2403100060Smoking tobacco, whether or not containing tobacco substitutes in any proportion, nesoi - - 53,487 45,262 5,978,518 6,678,456 399.81%
8 1502000040 Tallow, inedible 8,335,058 6,438,129 6,648,253 6,229,771 5,809,823 6,450,011 -5.00%9 1501000060 Yellow grease - 603,300 2,949,514 3,505,592 4,019,800 5,306,922 72.22%
10 2401202970
Cigar binder tobacco, partly or wholly stemmed/stripped, not threshed, not containing wrapper tobacco, or not containing over 35 percent wrapper tob 6,160 6,160 - 44,534 3,410,498 5,203,804 284.90%
SUBPARTIDA 10 DIG PRODUCTO US $
IMPORTACIONES DE REP. DOMINICANA DESDE EU. SECTOR AGROINDUSTRIAL
Fuente: US INTERNATIONAL TRADE COMMISSION
e destaca el capitulo del tabaco de la “Connecticut Shade”, importaciones que
s años
e destacan las importaciones de la partida 2401109570 correspondiente a otros dio
as importaciones de estos 10 productos en el año 2004, representan el 67% del total de
Ssuperaron los US$ 32 millones en el año 2004, sin embargo se observa que en loanteriores (1999-2001) se ha importado un mayor valor; por lo cual ha tenido una variación promedio anual del -20,97%. Stabacos incluyendo la hoja de cigarro, producto que ha tenido una variación promeanual del 221%. Llas importaciones del sector, tal como se observa en la siguiente gráfica. Es importante resaltar que el 30% de las importaciones del sector agroindustrial fueron de tabaco y de
COMERCIO BILATERAL ENTRE REPUBLICA DOMINICANA Y ESTADOS UNIDOS VI-20
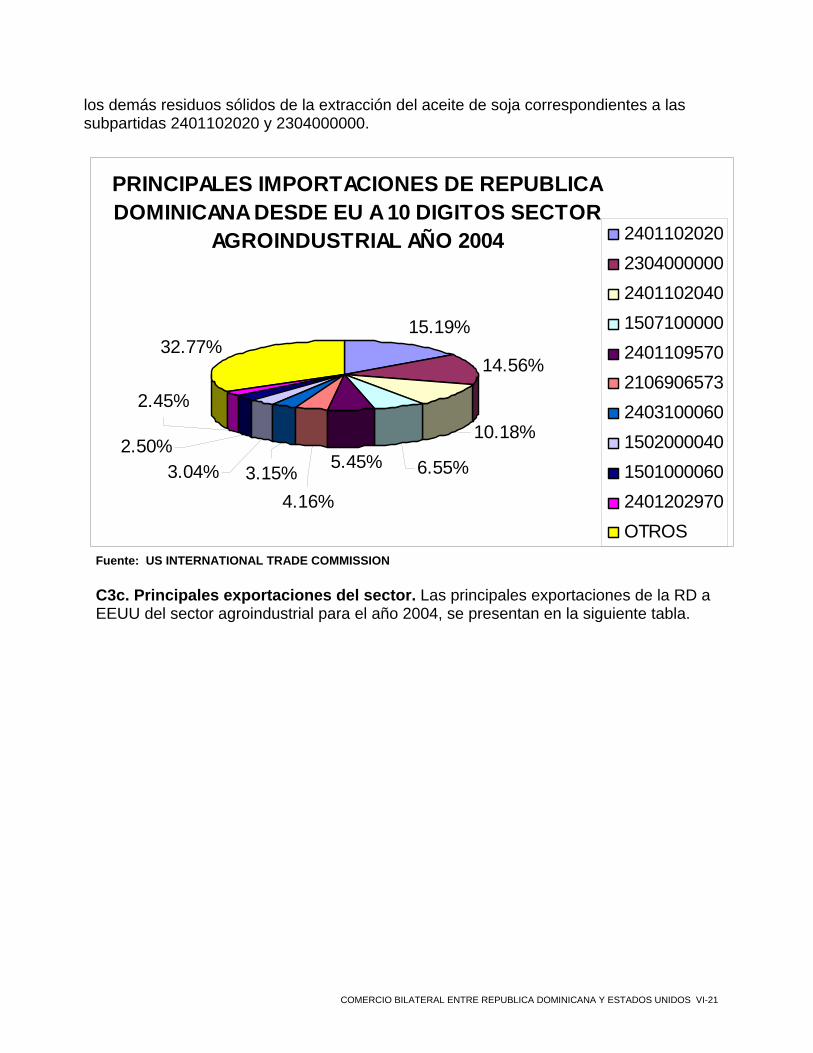
los demás residuos sólidos de la extracción del aceite de soja correspondientes a las subpartidas 2401102020 y 2304000000.
PRINCIPALES IMPORTACIONES DE REPUBLICA DOMINICANA DESDE EU A 10 DIGITOS SECTOR
AGROINDUSTRIAL AÑO 2004
15.19%
14.56%
10.18%
6.55%5.45%
32.77%
4.16%3.15%3.04%
2.50%
2.45%
2401102020230400000024011020401507100000240110957021069065732403100060150200004015010000602401202970OTROS
Fuente: US INTERNATIONAL TRADE COMMISSION
C3c. Principales exportaciones del sector. Las principales exportaciones de la RD a EEUU del sector agroindustrial para el año 2004, se presentan en la siguiente tabla.
COMERCIO BILATERAL ENTRE REPUBLICA DOMINICANA Y ESTADOS UNIDOS VI-21
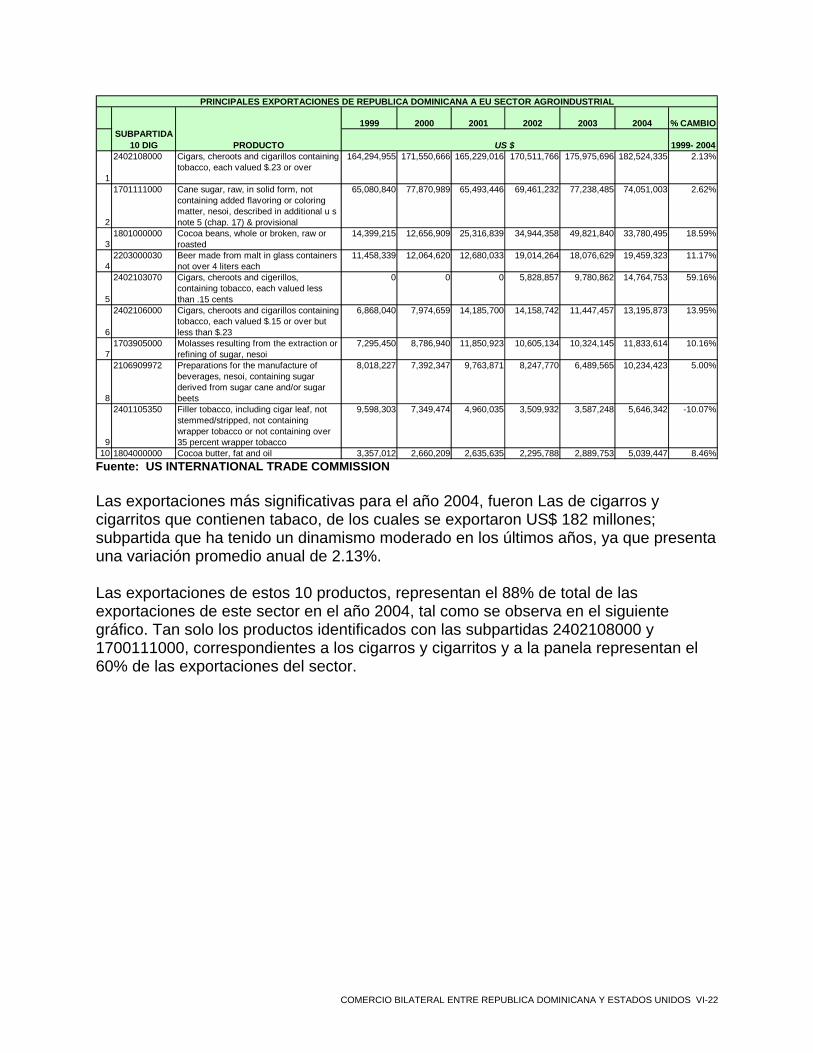
1999 2000 2001 2002 2003 2004 % CAMBIO
1999- 2004
1
2402108000 Cigars, cheroots and cigarillos containing tobacco, each valued $.23 or over
164,294,955 171,550,666 165,229,016 170,511,766 175,975,696 182,524,335 2.13%
2
1701111000 Cane sugar, raw, in solid form, not containing added flavoring or coloring matter, nesoi, described in additional u s note 5 (chap. 17) & provisional
65,080,840 77,870,989 65,493,446 69,461,232 77,238,485 74,051,003 2.62%
31801000000 Cocoa beans, whole or broken, raw or
roasted14,399,215 12,656,909 25,316,839 34,944,358 49,821,840 33,780,495 18.59%
42203000030 Beer made from malt in glass containers
not over 4 liters each11,458,339 12,064,620 12,680,033 19,014,264 18,076,629 19,459,323 11.17%
5
2402103070 Cigars, cheroots and cigerillos, containing tobacco, each valued less than .15 cents
0 0 0 5,828,857 9,780,862 14,764,753 59.16%
6
2402106000 Cigars, cheroots and cigarillos containing tobacco, each valued $.15 or over but less than $.23
6,868,040 7,974,659 14,185,700 14,158,742 11,447,457 13,195,873 13.95%
71703905000 Molasses resulting from the extraction or
refining of sugar, nesoi7,295,450 8,786,940 11,850,923 10,605,134 10,324,145 11,833,614 10.16%
8
2106909972 Preparations for the manufacture of beverages, nesoi, containing sugar derived from sugar cane and/or sugar beets
8,018,227 7,392,347 9,763,871 8,247,770 6,489,565 10,234,423 5.00%
9
2401105350 Filler tobacco, including cigar leaf, not stemmed/stripped, not containing wrapper tobacco or not containing over 35 percent wrapper tobacco
9,598,303 7,349,474 4,960,035 3,509,932 3,587,248 5,646,342 -10.07%
10 1804000000 Cocoa butter, fat and oil 3,357,012 2,660,209 2,635,635 2,295,788 2,889,753 5,039,447 8.46%
SUBPARTIDA 10 DIG PRODUCTO US $
PRINCIPALES EXPORTACIONES DE REPUBLICA DOMINICANA A EU SECTOR AGROINDUSTRIAL
Fuente: US INTERNATIONAL TRADE COMMISSION
Las exportaciones más significativas para el año 2004, fueron Las de cigarros y cigarritos que contienen tabaco, de los cuales se exportaron US$ 182 millones; subpartida que ha tenido un dinamismo moderado en los últimos años, ya que presenta una variación promedio anual de 2.13%. Las exportaciones de estos 10 productos, representan el 88% de total de las exportaciones de este sector en el año 2004, tal como se observa en el siguiente gráfico. Tan solo los productos identificados con las subpartidas 2402108000 y 1700111000, correspondientes a los cigarros y cigarritos y a la panela representan el 60% de las exportaciones del sector.
COMERCIO BILATERAL ENTRE REPUBLICA DOMINICANA Y ESTADOS UNIDOS VI-22

PRINCIPALES EXPORTACIONES DE REPUBLICA DOMINICANA A 10 DIGITOS SECTOR
AGROINDUSTRIAL AÑO 2004
43.56%
17.67%8.06%
4.64%
3.52%
3.15%
2.82%
2.44%
1.35%
1.20%11.57%
24021080001701111000
1801000000
2203000030
24021030702402106000
1703905000
21069099722401105350
1804000000
OTROS
Fuente: US INTERNATIONAL TRADE COMMISSION C4. Sector Minerales y Combustibles. El sector de los minerales y combustibles, esta conformado por 3 capítulos, de acuerdo con la siguiente tabla.
CAPITULO DESCRIPCION25 SAL, AZUFRE, TIERRAS, PIEDRAS, YESOS, CALES
Y CEMENTOS26 MINERALES METALIFEROS, ESCORIAS Y
CENIZAS27 COMBUSTIBLES, ACEITES
SECTOR MINERALES Y COMBUSTIBLE
C4a. Balanza comercial del sector. Se destacan las importaciones de combustibles y aceites, las cuales alcanzaron los US$ 276 millones. Respecto de las exportaciones de la RD, el capitulo más representativo igualmente es el de combustibles (capitulo 27), por valor de de US$ 2.500.000 para el año 2004.
COMERCIO BILATERAL ENTRE REPUBLICA DOMINICANA Y ESTADOS UNIDOS VI-23
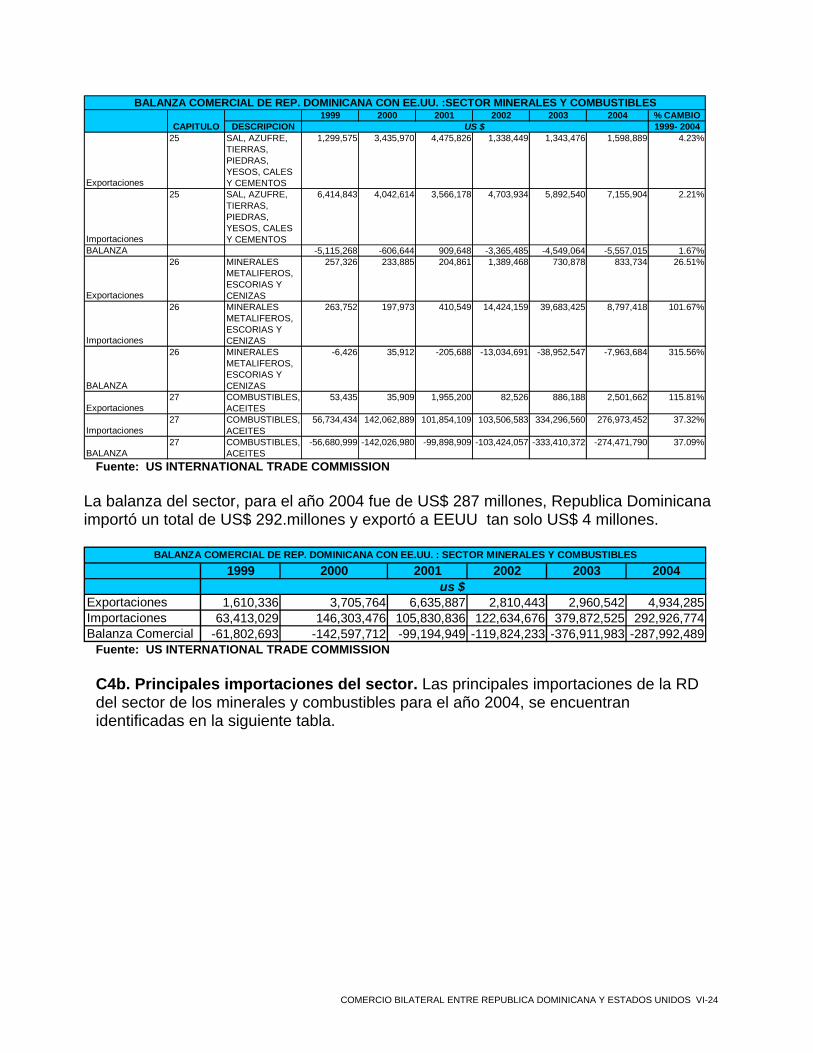
1999 2000 2001 2002 2003 2004 % CAMBIODESCRIPCION 1999- 2004
Exportaciones
25 SAL, AZUFRE, TIERRAS, PIEDRAS, YESOS, CALES Y CEMENTOS
1,299,575 3,435,970 4,475,826 1,338,449 1,343,476 1,598,889 4.23%
Importaciones
25 SAL, AZUFRE, TIERRAS, PIEDRAS, YESOS, CALES Y CEMENTOS
6,414,843 4,042,614 3,566,178 4,703,934 5,892,540 7,155,904 2.21%
BALANZA -5,115,268 -606,644 909,648 -3,365,485 -4,549,064 -5,557,015 1.67%
Exportaciones
26 MINERALES METALIFEROS, ESCORIAS Y CENIZAS
257,326 233,885 204,861 1,389,468 730,878 833,734 26.51%
Importaciones
26 MINERALES METALIFEROS, ESCORIAS Y CENIZAS
263,752 197,973 410,549 14,424,159 39,683,425 8,797,418 101.67%
BALANZA
26 MINERALES METALIFEROS, ESCORIAS Y CENIZAS
-6,426 35,912 -205,688 -13,034,691 -38,952,547 -7,963,684 315.56%
Exportaciones27 COMBUSTIBLES,
ACEITES53,435 35,909 1,955,200 82,526 886,188 2,501,662 115.81%
Importaciones27 COMBUSTIBLES,
ACEITES56,734,434 142,062,889 101,854,109 103,506,583 334,296,560 276,973,452 37.32%
BALANZA 27 COMBUSTIBLES,
ACEITES-56,680,999 -142,026,980 -99,898,909 -103,424,057 -333,410,372 -274,471,790 37.09%
BALANZA COMERCIAL DE REP. DOMINICANA CON EE.UU. :SECTOR MINERALES Y COMBUSTIBLES
CAPITULO US $
Fuente: US INTERNATIONAL TRADE COMMISSION
La balanza del sector, para el año 2004 fue de US$ 287 millones, Republica Dominicana importó un total de US$ 292.millones y exportó a EEUU tan solo US$ 4 millones.
1999 2000 2001 2002 2003 2004
Exportaciones 1,610,336 3,705,764 6,635,887 2,810,443 2,960,542 4,934,285Importaciones 63,413,029 146,303,476 105,830,836 122,634,676 379,872,525 292,926,774Balanza Comercial -61,802,693 -142,597,712 -99,194,949 -119,824,233 -376,911,983 -287,992,489
BALANZA COMERCIAL DE REP. DOMINICANA CON EE.UU. : SECTOR MINERALES Y COMBUSTIBLES
us $
Fuente: US INTERNATIONAL TRADE COMMISSION C4b. Principales importaciones del sector. Las principales importaciones de la RD del sector de los minerales y combustibles para el año 2004, se encuentran identificadas en la siguiente tabla.
COMERCIO BILATERAL ENTRE REPUBLICA DOMINICANA Y ESTADOS UNIDOS VI-24
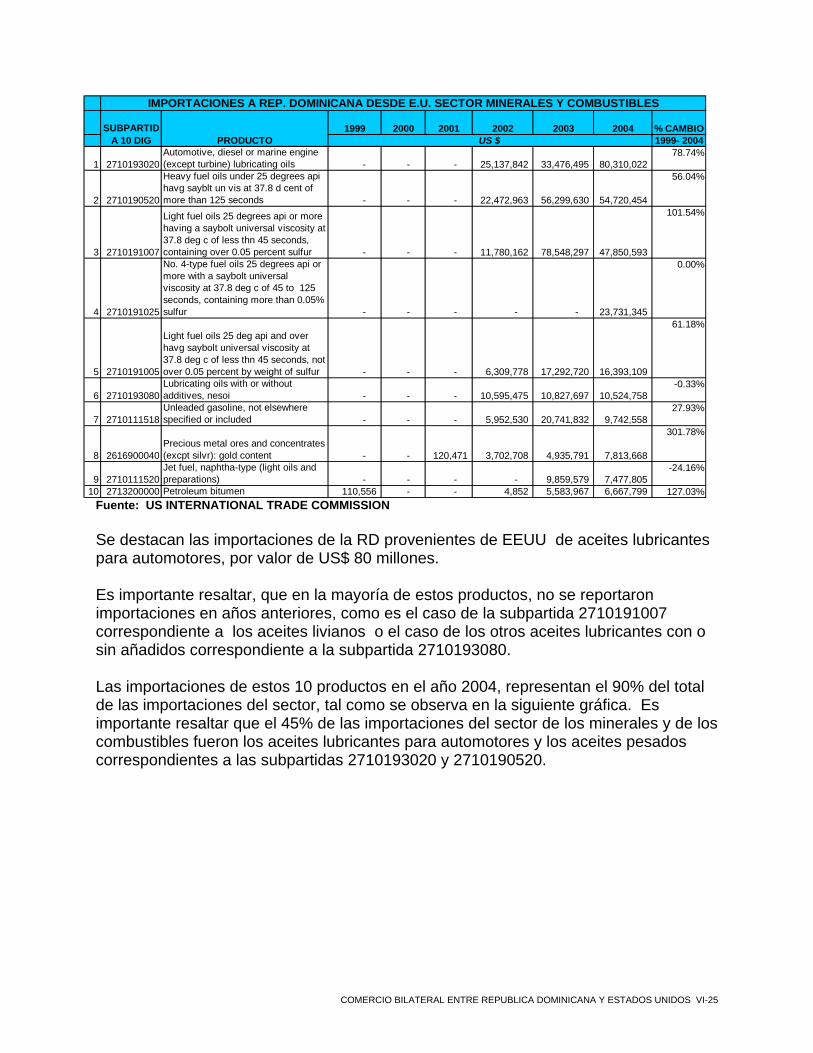
1999 2000 2001 2002 2003 2004 % CAMBIO1999- 2004
1 2710193020Automotive, diesel or marine engine (except turbine) lubricating oils - - - 25,137,842 33,476,495 80,310,022
78.74%
2 2710190520
Heavy fuel oils under 25 degrees api havg sayblt un vis at 37.8 d cent of more than 125 seconds - - - 22,472,963 56,299,630 54,720,454
56.04%
3 2710191007
Light fuel oils 25 degrees api or more having a saybolt universal viscosity at 37.8 deg c of less thn 45 seconds, containing over 0.05 percent sulfur - - - 11,780,162 78,548,297 47,850,593
101.54%
4 2710191025
No. 4-type fuel oils 25 degrees api or more with a saybolt universal viscosity at 37.8 deg c of 45 to 125 seconds, containing more than 0.05% sulfur - - - - - 23,731,345
0.00%
5 2710191005
Light fuel oils 25 deg api and over havg saybolt universal viscosity at 37.8 deg c of less thn 45 seconds, not over 0.05 percent by weight of sulfur - - - 6,309,778 17,292,720 16,393,109
61.18%
6 2710193080Lubricating oils with or without additives, nesoi - - - 10,595,475 10,827,697 10,524,758
-0.33%
7 2710111518Unleaded gasoline, not elsewhere specified or included - - - 5,952,530 20,741,832 9,742,558
27.93%
8 2616900040Precious metal ores and concentrates (excpt silvr): gold content - - 120,471 3,702,708 4,935,791 7,813,668
301.78%
9 2710111520Jet fuel, naphtha-type (light oils and preparations) - - - - 9,859,579 7,477,805
-24.16%
10 2713200000 Petroleum bitumen 110,556 - - 4,852 5,583,967 6,667,799 127.03%
IMPORTACIONES A REP. DOMINICANA DESDE E.U. SECTOR MINERALES Y COMBUSTIBLES
SUBPARTIDA 10 DIG PRODUCTO US $
Fuente: US INTERNATIONAL TRADE COMMISSION
Se destacan las importaciones de la RD provenientes de EEUU de aceites lubricantes para automotores, por valor de US$ 80 millones.
Es importante resaltar, que en la mayoría de estos productos, no se reportaron importaciones en años anteriores, como es el caso de la subpartida 2710191007 correspondiente a los aceites livianos o el caso de los otros aceites lubricantes con o sin añadidos correspondiente a la subpartida 2710193080. Las importaciones de estos 10 productos en el año 2004, representan el 90% del total de las importaciones del sector, tal como se observa en la siguiente gráfica. Es importante resaltar que el 45% de las importaciones del sector de los minerales y de los combustibles fueron los aceites lubricantes para automotores y los aceites pesados correspondientes a las subpartidas 2710193020 y 2710190520.
COMERCIO BILATERAL ENTRE REPUBLICA DOMINICANA Y ESTADOS UNIDOS VI-25

PRINCIPALES IMPORTACIONES DE REP. DOM. DE E.U. A 10 DIGITOS SECTOR MINERALES Y COMBUSTIBLES AÑO
2004
27.43%
18.69%16.34%8.10%
5.60%
3.59%
3.33%
2.67%
2.55%9.42%
2.28%
2710193020271019052027101910072710191025271019100527101930802710111518261690004027101115202713200000OTROS
Fuente: US INTERNATIONAL TRADE COMMISSION
C4c. Principales exportaciones del sector. Las principales exportaciones de la RD a E.U. del sector de los minerales y combustibles para el año 2004, se presentan en la siguiente tabla.
EXPORTACIONES DE REP DOMINICANA A E.U. SECTOR MINERALES Y COMBUSTIBLES
1999 2000 2001 2002 2003 2004 % CAMBIO1999- 2004
1
2710190530 No 6-type fuel oil under 25 degrees api havng saybolt universal viscosity at 37.8 degrees centigrade of more than 125 seconds
0 0 0 0 0 2,483,787 0.00%
2 2520100000 Gypsum; anhydrite 13,890 2,778 0 0 836,259 1,099,464 139.72%
32606000060 Bauxite, calcined not refractory
grade0 0 0 0 0 605,327 0.00%
42517100020 Limestone, crushed or broken,
other than pebbles or gravel508,777 670,741 1,073,288 979,563 361,673 354,850 -6.95%
5 2620193000 Zinc dross and zinc skimmings 239,566 231,485 204,861 119,372 96,104 173,885 -6.21%
6
2517100055 Broken or crushed stone not pebbles or gravel or limestone, for concrete aggregates, road metalling, or railway or other ballast, shingle and flint
0 0 1,004,709 262,754 2,500 96,314 -54.23%
7
2620997580 Residues nesoi not advanced in value or condition and if over 2 percent copper, lead, or zinc is not for recovery thereof: gold content
0 0 0 1,258,811 631,529 47,804 -80.51%
8 2522300000 Hydraulic lime 0 0 0 0 94,577 32,031 -66.13%9 2701190000 Other coal, not agglomerated 0 0 39,288 82,526 57,755 10,867 -34.84%
10 2523900000 Hydraulic cement, other, nesoi 0 0 0 0 0 10,730 0.00%
SUBPARTIDA 10 DIG PRODUCTO US $
Fuente: US INTERNATIONAL TRADE COMMISSION
COMERCIO BILATERAL ENTRE REPUBLICA DOMINICANA Y ESTADOS UNIDOS VI-26

Las exportaciones más significativas para el año 2004, fueron los aceites de combustibles del tipo No. 6, de los cuales se exportaron US$ 2 millones; subpartida que no se había exportado en los años anteriores (1999-2003). Las exportaciones de estos 10 productos, representan el 99% de total de las exportaciones de este sector en el año 2004, tal como se observa en el siguiente gráfico. Tan solo los aceites de combustibles del tipo No. 6 y el yeso natural; anhidrita representan más del 70% de las exportaciones del sector.
PRINCIPALES EXPORTACIONES DE REP DOMINICANA A 10 DIGITOS SECTOR
MINERALES Y COMBUSTIBLES AÑO 2004
50.39%
22.31%
12.28%
7.20%
1.95%
0.22% 0.65%0.97%
3.53%0.22%
0.28%
2710190530252010000026060000602517100020262019300025171000552620997580252230000027011900002523900000OTROS
Fuente: US INTERNATIONAL TRADE COMMISSION C5. Sector Químico y Farmacéutico. El sector químico farmacéutico, está conformado por 11 capítulos, de acuerdo con la siguiente tabla.
COMERCIO BILATERAL ENTRE REPUBLICA DOMINICANA Y ESTADOS UNIDOS VI-27

CAPITULO DESCRIPCION28 QUIMICOS INORGANICOS
29 QUIMICOS ORGANICOS30 PRODUCTOS FARMACEUTICOS31 ABONOS32 EXTRACTOS CURTIENTES, TANINOS,
PIGMENTOS, PINTURAS Y OTROS COLORANTES
33 PERFUMERIA Y COSMETICA34 JABONES, VELAS, CERAS Y
PRODUCTOS PARA ODONTOLOGIA35 MATERIAS ALBUMINOIDEAS,
ALMIDON, COLAS36 POLVORA37 PRODUCTOS FOTOGRAFICOS38 OTROS QUIMICOS
SECTOR QUIMICO Y FARMACEUTICO
C5a. Balanza comercial del sector. Se destacan las importaciones del capitulo de perfumería y cosmética, las cuales alcanzaron los US$ 38 millones en el 2004. Respecto de las exportaciones de la RD a EEUU, el capitulo más representativo igualmente es el 33 (perfumería y cosmética), exportaciones por valor de US$ 9 millones para el año 2004.
COMERCIO BILATERAL ENTRE REPUBLICA DOMINICANA Y ESTADOS UNIDOS VI-28

1999 2000 2001 2002 2003 2004 % CAMBIODESCRIPCION 1999- 2004
Exportaciones28 QUIMICOS
INORGANICOS411,942 831,358 894,283 525,706 794,773 730,390 12.14%
Importaciones28 QUIMICOS
INORGANICOS12,464,839 12,123,576 13,747,617 9,316,748 8,675,851 10,855,080 -2.73%
BALANZA 28 QUIMICOS
INORGANICOS -12,052,897 -11,292,218 -12,853,334 -8,791,042 -7,881,078 -10,124,690-3.43%
Exportaciones29 QUIMICOS
ORGANICOS1,417,143 4,532,869 4,580,088 4,571,098 4,293,325 2,591,465 12.83%
Importaciones29 QUIMICOS
ORGANICOS18,340,259 22,805,837 25,238,086 24,145,972 25,135,619 33,318,606 12.68%
BALANZA 29 QUIMICOS
ORGANICOS -16,923,116 -18,272,968 -20,657,998 -19,574,874 -20,842,294 -30,727,14112.67%
Exportaciones
30 PRODUCTOS FARMACEUTICOS
1,042,541 731,241 1,708,878 1,748,551 1,907,290 1,900,128 12.76%
Importaciones
30 PRODUCTOS FARMACEUTICOS
15,928,540 26,497,836 22,646,830 13,094,018 11,895,888 23,641,601 8.22%
BALANZA
30 PRODUCTOS FARMACEUTICOS -14,885,999 -25,766,595 -20,937,952 -11,345,467 -9,988,598 -21,741,473
7.87%
Exportaciones 31 ABONOS 93,376 59,957 22,972 21,628 16,973 12,982 -32.61%Importaciones 31 ABONOS 19,951,777 12,748,587 20,364,838 15,182,436 19,894,393 23,830,883 3.62%BALANZA 31 ABONOS -19,858,401 -12,688,630 -20,341,866 -15,160,808 -19,877,420 -23,817,901 3.70%
Exportaciones
32 EXTRACTOS CURTIENTES, TANINOS, PIGMENTOS, PINTURAS Y OTROS COLORANTES
413,298 572,365 1,971,625 3,385,718 1,740,447 995,384 19.22%
Importaciones
32 EXTRACTOS CURTIENTES, TANINOS, PIGMENTOS, PINTURAS Y OTROS COLORANTES
13,582,024 13,859,000 16,484,487 17,229,168 14,318,103 14,134,700 0.80%
BALANZA
32 EXTRACTOS CURTIENTES, TANINOS, PIGMENTOS, PINTURAS Y OTROS COLORANTES -13,168,726 -13,286,635 -14,512,862 -13,843,450 -12,577,656 -13,139,316
-0.04%
Exportaciones33 PERFUMERIA Y
COSMETICA1,575,745 2,156,021 11,966,173 16,992,796 10,275,249 9,178,679 42.25%
Importaciones33 PERFUMERIA Y
COSMETICA22,846,250 29,880,015 52,797,115 49,563,081 41,552,512 38,554,591 11.03%
BALANZA 33 PERFUMERIA Y
COSMETICA -21,270,505 -27,723,994 -40,830,942 -32,570,285 -31,277,263 -29,375,9126.67%
BALANZA COMERCIAL DE REP. DOMINICANA CON EE.UU. : SECTOR QUIMICO FARMACÉUTICO
CAPITULO US $
Fuente: US INTERNATIONAL TRADE COMMISSION
COMERCIO BILATERAL ENTRE REPUBLICA DOMINICANA Y ESTADOS UNIDOS VI-29

1999 2000 2001 2002 2003 2004 % CAMBIODESCRIPCION 1999- 2004
Exportaciones
34 JABONES, VELAS, CERAS Y PRODUCTOS PARA ODONTOLOGIA
796,376 903,018 965,660 1,360,858 1,363,658 1,408,440 12.08%
Importaciones
34 JABONES, VELAS, CERAS Y PRODUCTOS PARA ODONTOLOGIA
10,586,417 11,204,462 7,724,351 12,498,045 6,176,248 5,932,923 -10.94%
BALANZA
34 JABONES, VELAS, CERAS Y PRODUCTOS PARA ODONTOLOGIA -9,790,041 -10,301,444 -6,758,691 -11,137,187 -4,812,590 -4,524,483
-14.30%
Exportaciones
35 MATERIAS ALBUMINOIDEAS, ALMIDON, COLAS
562,083 662,508 428,084 249,751 29,317 30,165 -44.29%
Importaciones
35 MATERIAS ALBUMINOIDEAS, ALMIDON, COLAS
4,256,942 5,185,835 11,299,577 7,254,965 8,534,935 6,673,093 9.41%
BALANZA
35 MATERIAS ALBUMINOIDEAS, ALMIDON, COLAS
-3,694,859 -4,523,327 -10,871,493 -7,005,214 -8,505,618 -6,642,928
12.45%
Exportaciones 36 POLVORA 0 0 0 0 0 0 -100.00%Importaciones 36 POLVORA 2,212,968 2,376,343 224,173 83,200 107,674 103,028 -45.85%BALANZA 36 POLVORA -2,212,968 -2,376,343 -224,173 -83,200 -107,674 -103,028 -45.85%
Exportaciones37 PRODUCTOS
FOTOGRAFICOS21,240 4,800 2,857 2,750 37,600 48,422 17.92%
Importaciones37 PRODUCTOS
FOTOGRAFICOS2,353,274 2,663,086 9,462,621 3,145,639 2,637,421 1,994,686 -3.25%
BALANZA 37 PRODUCTOS
FOTOGRAFICOS -2,332,034 -2,658,286 -9,459,764 -3,142,889 -2,599,821 -1,946,264-3.55%
Exportaciones38 OTROS
QUIMICOS250,032 233,887 577,296 474,425 848,021 634,667 20.48%
Importaciones38 OTROS
QUIMICOS19,271,459 20,142,345 18,854,761 21,815,051 15,866,336 15,330,729 -4.47%
BALANZA 38 OTROS
QUIMICOS -19,021,427 -19,908,458 -18,277,465 -21,340,626 -15,018,315 -14,696,062-5.03%
BALANZA COMERCIAL DE REP. DOMINICANA CON EE.UU. : SECTOR QUIMICO FARMACÉUTICO
CAPITULO US $
Fuente: US INTERNATIONAL TRADE COMMISSION
Las importaciones de la RD para los años analizados (1999-2004) fueron mayores que sus exportaciones, presentando una balanza comercial de US$ - 156.839.198, tal como se presenta en la siguiente tabla.
1999 2000 2001 2002 2003 2004Exportaciones 6,583,776 10,688,024 23,117,916 29,333,281 21,306,653 17,530,722Importaciones 141,794,749 159,486,922 198,844,456 173,328,323 154,794,980 174,369,920Balanza Comercial -135,210,973 -148,798,898 -175,726,540 -143,995,042 -133,488,327 -156,839,198
BALANZA COMERCIAL DE REP. DOMINICANA CON EE.UU. : SECTOR QUIMICO FARMACÉUTICO
Fuente: US INTERNATIONAL TRADE COMMISSION
C5b. Principales importaciones del sector. Los principales productos importados de la RD provenientes de EEUU del sector químico y farmacéutico para el año 2004, se encuentran identificadas en la siguiente tabla.
COMERCIO BILATERAL ENTRE REPUBLICA DOMINICANA Y ESTADOS UNIDOS VI-30

1999 2000 2001 2002 2003 2004 % CAMBIO1999- 2004
1 3100000000fertilizers and fertilizer materials 19,951,777 12,748,587 20,364,838 15,182,436 19,894,393 23,830,883
3.62%
2 3306200000
Yarn used to clean between the teeth (dental floss) 165,222 844,401 10,866,701 23,852,406 21,260,267 18,729,640
157.57%
3 3002200000Vaccines for human medicine 132,890 73,277 23,971 12,529 - 12,420,540
147.82%
4 3307900000
Depilatories and other perfumery, cosmetic or toilet preparations, nesoi 799,978 348,503 1,170,397 7,339,084 5,196,662 5,702,146
48.11%
5 2916142020 Methyl methacrylate 403,639 3,200,920 2,888,365 3,019,118 2,896,924 5,206,360 66.77%
6 3506910000
Adhesives based on rubber or plastics (including artificial resins) for use as adhesives, put up for retail sale as adhesive, nt exceed net wt of 1 kg 990,390 1,042,700 2,282,186 2,785,284 4,491,283 3,568,987
29.23%
7 2916125030 Butyl acrylate 1,241,411 1,407,462 1,900,020 1,764,814 2,080,955 3,565,913 23.50%
8 3302100000
Mixture of odoriferous substance & mixture (include alcoholic solution) w/ basis of one/more of these substance, of a kind used food/drink industries 1,431,819 1,831,046 2,116,199 2,165,732 1,813,140 3,552,557
19.93%
9 2902500000 Styrene 808,860 1,622,053 890,781 1,949,053 3,839,990 3,034,219 30.27%
10 2929101500Mixtures of 2,4- and 2,6-toluene diisocyanates 2,547,147 2,565,757 3,020,408 2,862,605 3,599,404 2,927,270
2.82%
IMPORTACIONES DE REP. DOMINICANA DESDE E.U. SECTOR QUIMICO FARMACÉUTICO
SUBPARTIDA 10 DIG PRODUCTO US $
Fuente: US INTERNATIONAL TRADE COMMISSION
Se destacan las importaciones de la RD de fertilizantes, por valor de US $23 millones. Es importante resaltar, que la seda dental presenta una variación promedio anual de 157%, presentando importaciones por US$ 18 millones. Las importaciones de estos 10 productos en el año 2004, representan el 47% del total de las importaciones del sector, tal como se observa en la siguiente gráfica. Es importante resaltar que el 23% de las importaciones del sector químico farmacéutico fueron de la subpartida correspondiente a los fertilizantes y a la seda dental.
COMERCIO BILATERAL ENTRE REPUBLICA DOMINICANA Y ESTADOS UNIDOS VI-31

PRINCIPALES IMPORTACIONES DE REP DOM A 10 DIGITOS SECTOR QUIMICO Y FARMACEUTICO
AÑO 2004
13.67%
10.74%
52.66%
2.05%
3.27%
2.99%
7.12%
2.05%2.04%1.74%
1.68%
3100000000330620000030022000003307900000291614202035069100002916125030330210000029025000002929101500OTROS
Fuente: US INTERNATIONAL TRADE COMMISSION
C5c. Principales exportaciones del sector. Las principales exportaciones de Republica Dominicana a EEUU del sector químico farmacéutico para el año 2004, se presentan en la siguiente tabla:
COMERCIO BILATERAL ENTRE REPUBLICA DOMINICANA Y ESTADOS UNIDOS VI-32
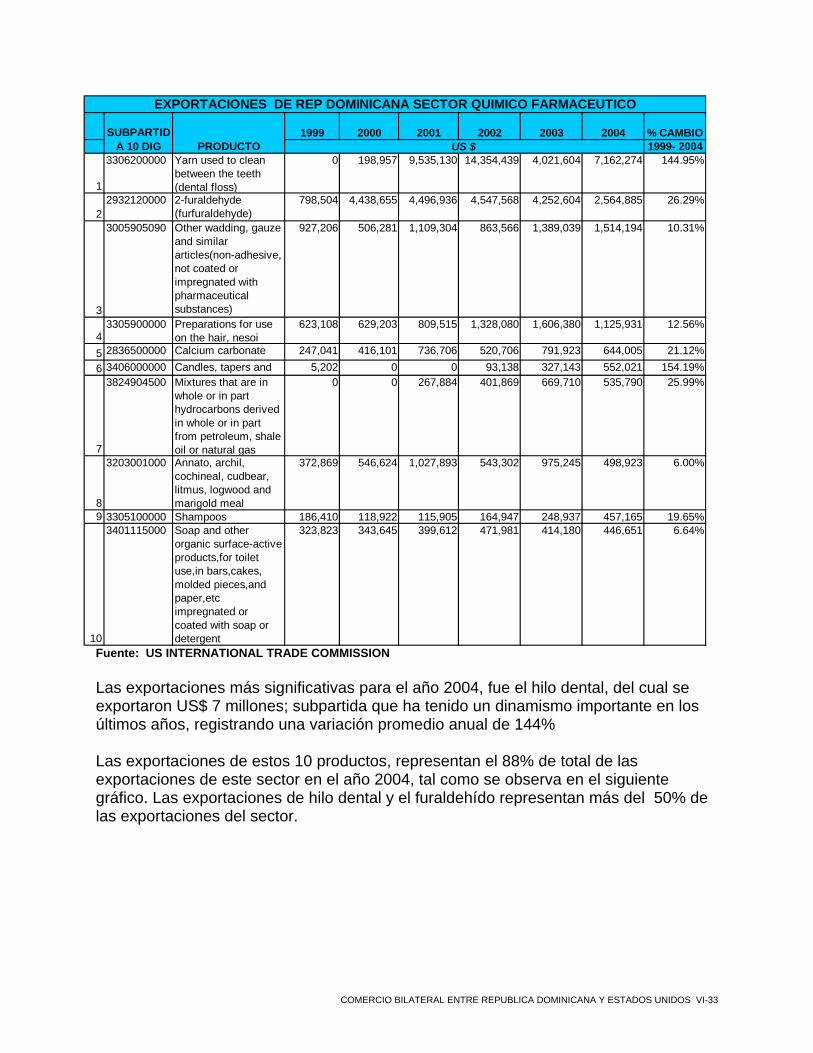
1999 2000 2001 2002 2003 2004 % CAMBIO1999- 2004
1
3306200000 Yarn used to clean between the teeth (dental floss)
0 198,957 9,535,130 14,354,439 4,021,604 7,162,274 144.95%
22932120000 2-furaldehyde
(furfuraldehyde)798,504 4,438,655 4,496,936 4,547,568 4,252,604 2,564,885 26.29%
3
3005905090 Other wadding, gauze and similar articles(non-adhesive, not coated or impregnated with pharmaceutical substances)
927,206 506,281 1,109,304 863,566 1,389,039 1,514,194 10.31%
43305900000 Preparations for use
on the hair, nesoi623,108 629,203 809,515 1,328,080 1,606,380 1,125,931 12.56%
5 2836500000 Calcium carbonate 247,041 416,101 736,706 520,706 791,923 644,005 21.12%6 3406000000 Candles, tapers and 5,202 0 0 93,138 327,143 552,021 154.19%
7
3824904500 Mixtures that are in whole or in part hydrocarbons derived in whole or in part from petroleum, shale oil or natural gas
0 0 267,884 401,869 669,710 535,790 25.99%
8
3203001000 Annato, archil, cochineal, cudbear, litmus, logwood and marigold meal
372,869 546,624 1,027,893 543,302 975,245 498,923 6.00%
9 3305100000 Shampoos 186,410 118,922 115,905 164,947 248,937 457,165 19.65%
10
3401115000 Soap and other organic surface-active products,for toilet use,in bars,cakes, molded pieces,and paper,etc impregnated or coated with soap or detergent
323,823 343,645 399,612 471,981 414,180 446,651 6.64%
SUBPARTIDA 10 DIG PRODUCTO US $
EXPORTACIONES DE REP DOMINICANA SECTOR QUIMICO FARMACEUTICO
Fuente: US INTERNATIONAL TRADE COMMISSION Las exportaciones más significativas para el año 2004, fue el hilo dental, del cual se exportaron US$ 7 millones; subpartida que ha tenido un dinamismo importante en los últimos años, registrando una variación promedio anual de 144% Las exportaciones de estos 10 productos, representan el 88% de total de las exportaciones de este sector en el año 2004, tal como se observa en el siguiente gráfico. Las exportaciones de hilo dental y el furaldehído representan más del 50% de las exportaciones del sector.
COMERCIO BILATERAL ENTRE REPUBLICA DOMINICANA Y ESTADOS UNIDOS VI-33

PRINCIPALES EXPORTACIONES DE REP DOMINICANA A 10 DIGITOS SECOTR QUIMICO Y
FARMACEUTICO AÑO 2004
40.86%
14.63%
11.57%2.55%
2.61%2.85%
3.06%
8.64%
3.67%
6.42%
3.15%
3306200000
2932120000
30059050903305900000
2836500000
3406000000
3824904500
3203001000
3305100000
3401115000
OTROS
Fuente: US INTERNATIONAL TRADE COMMISSION C6. Sector Caucho y Plástico. El sector del caucho y del plástico, esta conformado por 2 capítulos, de acuerdo con la siguiente tabla.
CAPITULO DESCRIPCION39 PLASTICO Y SUS
MANUFACTURAS40 CAUCHO Y SUS
MANUFACTURAS
SECTOR CAUCHO Y PLASTICO
C6a. Balanza comercial del sector. Se destacan las importaciones del capitulo de plástico y caucho (capítulo 39), las cuales alcanzaron los US$ 229 millones en el 2004. Respecto de las exportaciones de la RD, el capitulo más representativo igualmente es el 39, las cuales fueron por valor de US$ 119 millones para el año 2004.
COMERCIO BILATERAL ENTRE REPUBLICA DOMINICANA Y ESTADOS UNIDOS VI-34

1999 2000 2001 2002 2003 2004 CAMBIO %DESCRIPCION 1999- 2004
Exportaciones
39 PLASTICO Y SUS MANUFACTURAS
33,846,584 39,117,304 57,928,827 77,166,126 119,864,506 119,862,979 28.78%
Importaciones
39 PLASTICO Y SUS MANUFACTURAS
112,917,952 145,681,874 191,297,391 243,608,885 236,876,730 229,718,057 15.26%
BALANZA
39 PLASTICO Y SUS MANUFACTURAS
-79,071,368 -106,564,570 -133,368,564 -166,442,759 -117,012,224 -109,855,078
6.80%
Exportaciones
40 CAUCHO Y SUS MANUFACTURAS
71,870 37,322 263,317 405,688 572,897 973,711 68.41%
Importaciones
40 CAUCHO Y SUS MANUFACTURAS
20,060,877 19,387,691 23,049,493 18,102,417 12,925,885 18,968,620 -1.11%
BALANZA
40 CAUCHO Y SUS MANUFACTURAS
-19,989,007 -19,350,369 -22,786,176 -17,696,729 -12,352,988 -17,994,909
-2.08%
BALANZA COMERCIAL DE REP. DOMINICANA CON EE.UU. : SECTOR CAUCHO Y PLASTICO
CAPITULO US $
Fuente: US INTERNATIONAL TRADE COMMISSION
Las importaciones a la RD provenientes de EEUU para los años analizados (1999-2004) fueron mayores que sus exportaciones provenientes de este país, presentando una balanza comercial de US$ -127.849.987.
1999 2000 2001 2002 2003 2004
Exportaciones 33,918,454 39,154,626 58,192,144 77,571,814 120,437,403 120,836,690Importaciones 132,978,829 165,069,565 214,346,884 261,711,302 249,802,615 248,686,677Balanza Comercial -99,060,375 -125,914,939 -156,154,740 -184,139,488 -129,365,212 -127,849,987
BALANZA COMERCIAL DE REP. DOMINICANA CON EE.UU. : SECTOR CAUCHO Y PLASTICO
US $
Fuente: US INTERNATIONAL TRADE COMMISSION
C6b. Principales importaciones del sector. Los principales productos importados de la RD del sector de cauchos y plásticos para el año 2004, se encuentran identificadas en la siguiente tabla.
COMERCIO BILATERAL ENTRE REPUBLICA DOMINICANA Y ESTADOS UNIDOS VI-35

1999 2000 2001 2002 2003 2004 % CAMBIO1999- 2004
1 3916906000
Monofilaments, any cross-sectional dimension exceeds 1mm, rods, sticks & profile shapes, whether or not surface-worked,not worked, plastics, nesoi 1,587,545 5,396,198 8,790,369 32,262,964 52,202,463 34,447,555
85.05%
2 3904100000Polyvinyl chloride,not mixed with any other substances 3,068,601 2,544,052 3,220,028 5,626,848 6,669,621 23,505,434
50.26%
3 3901200000Polyethylene having a specific gravity of 0.94 or more 4,420,309 7,194,508 12,123,686 10,473,025 13,494,250 18,084,652
32.55%
4 3901100020
Polyethylene having a specific gravity of less than 0.94,low density polyethylene,except linear 9,118,587 10,394,624 13,921,213 23,820,261 12,385,796 17,844,934
14.37%
5 3926909887
Articles of plastics & articles of other materials of heading 3901 to 3914, nesoi - - - 6,323,695 14,725,280 14,258,870
50.16%
6 3920100000
Other plates,sheets,film,foil & strip,of plastic, noncelluar & not reinforced,laminated,supported or combined with oth mat,of polymers of ethylene 740,980 1,292,720 6,635,635 10,476,888 11,867,852 11,105,699
71.85%
7 3923900000Articles for the conveyance or packing of goods,etc,of plastic,nesoi 2,507,340 3,529,085 4,811,028 12,251,605 13,444,798 9,397,095
30.24%
8 3923290000Sacks & bags(including cones) of other plastics 18,254,410 3,508,928 2,399,745 4,228,419 8,546,488 8,958,354
-13.27%
9 3901100010
Polyethylene having a specific gravity of less than 0.94,linear low density polyethylene 3,030,175 4,244,549 4,476,726 17,110,390 4,855,924 7,248,649
19.06%
10 3924905500Household articles & toilet articles,of plastic,nesoi 2,953,392 4,372,712 6,727,655 7,166,316 8,057,195 6,876,102
18.41%
IMPORTACIONES DE REP. DOMINICANA DESDE EU. SECTOR CAUCHO Y PLASTICOSSUBPARTIDA
10 DIG PRODUCTO US $
Fuente: US INTERNATIONAL TRADE COMMISSION El producto que presentó el mayor valor de importaciones para el año 2004 fue el monofilamentos del cual se importaron US$ 34 millones; se observa como ha tenido una variación promedio anual del 85%. Se destacan las importaciones de la partida 3920100000 correspondiente a los demás placas, láminas, hojas y tiras de plástico no celular, subpartida que ha tenido un incremento representativo en los últimos años, ya que en 1999 se importaron US$ 740 mil, mientras que para el 2004, las importaciones de esta subpartida fueron de US$ 11 millones Las importaciones de estos 10 productos en el año 2004, representan el 61% del total de las importaciones del sector, tal como se observa en la siguiente gráfica.
COMERCIO BILATERAL ENTRE REPUBLICA DOMINICANA Y ESTADOS UNIDOS VI-36

PRINCIPALES IMPORTACIONES DE REPUBLICA DOMINICANA A 10 DIGITOS SECTOR CAUCHO Y
PLASTICO AÑO 2004
13.85%
4.47%
7.18%
5.73%
7.27%
3.78%3.60%2.91%
2.76%
38.99%
9.45%
3916906000
3904100000
3901200000
3901100020
3926909887
3920100000
3923900000
3923290000
3901100010
3924905500
OTROS
Fuente: US INTERNATIONAL TRADE COMMISSION
C6c. Principales exportaciones del sector. Las principales exportaciones de la RD a EEUU del sector de los cauchos y los plásticos para el año 2004, se presentan en la siguiente tabla.
COMERCIO BILATERAL ENTRE REPUBLICA DOMINICANA Y ESTADOS UNIDOS VI-37

1999 2000 2001 2002 2003 2004 % CAMBIO
1999- 2004
13926909880 Other articles of
plastic,nesoi12,391,159 18,958,727 37,100,208 42,228,759 57,726,426 55,649,189 35.04%
2
3921904010 Plates, sheets, film, foil & strip, reinforced with paper, flexible
0 0 0 8,610,983 32,612,917 30,574,724 88.43%
3 3924103000 Trays,of plastic 1,626,553 1,482,650 2,236,004 3,797,630 4,768,523 4,932,221 24.84%
4
3924102000 Plates,cups,saucers,soup bowls,cereal bowls,sugar bowls,creamers,gravy boats,serving dishes & platters,of plastics
1,401,298 1,758,242 2,197,230 3,546,578 4,189,936 4,787,903 27.86%
5
3924901050 Napkins,table covers,mats,scarves,runners,doilies,centerpieces,antimacassars & furniture slip covers,& like furnishings,of plastic,nesoi
96,288 573,447 756,246 1,576,204 3,255,109 3,349,862 103.37%
6
3923300090 Carboys, bottles, flasks amd similar articles, nesoi
1,074,837 1,055,210 1,632,124 2,587,906 3,238,344 3,284,147 25.03%
7
3920511000 Plates,sheets,film,etc, noncelluar,not reinforced,laminated,combined,of polymethyl methacrylate,flexible
3,938,597 3,558,379 2,756,780 2,138,338 2,668,993 2,322,332 -10.03%
8
3923210090 Sacks and bags (includiing cones) of polymers of ethylene except reclosable with integral extrluded closure, nesoi
195,687 150,828 23,909 118,764 1,498,107 2,152,380 61.54%
9
3920515000 Plates,sheets,film,etc, noncelluar,not reinforced,laminated,combined,of polymethyl methacrylate,nesoi
0 316,789 644,636 609,994 733,079 1,931,401 57.14%
10
3923100000 Boxes,cases,crates & similar articles,of plastic
93,247 288,521 545,426 570,786 311,465 1,560,844 75.69%
EXPORTACIONES DE REP. DOMINICANA A EU SECTOR CAUCHO Y PLÁSTICO
SUBPARTIDA 10 DIG PRODUCTO US $
Fuente: US INTERNATIONAL TRADE COMMISSION
La subpartida más representativa en las exportaciones del año 2004, fue los otros artículos de plástico, de los cuales se exportaron US$ 55 millones; subpartida que ha tenido una variación promedio anual del 35%. Se destacan las exportaciones de la partida 3924901050 correspondiente a los demás vajillas, y demás artículos de uso doméstico y artículos de higiene o de tocador de plástico, los cuales han tenido un incremento representativo en los últimos años, teniendo en cuenta que para el año 1999 se exportaron US$ 96 mil, mientras que para el 2004, las exportaciones de esta subpartida fueron de US$ 3 millones.
COMERCIO BILATERAL ENTRE REPUBLICA DOMINICANA Y ESTADOS UNIDOS VI-38
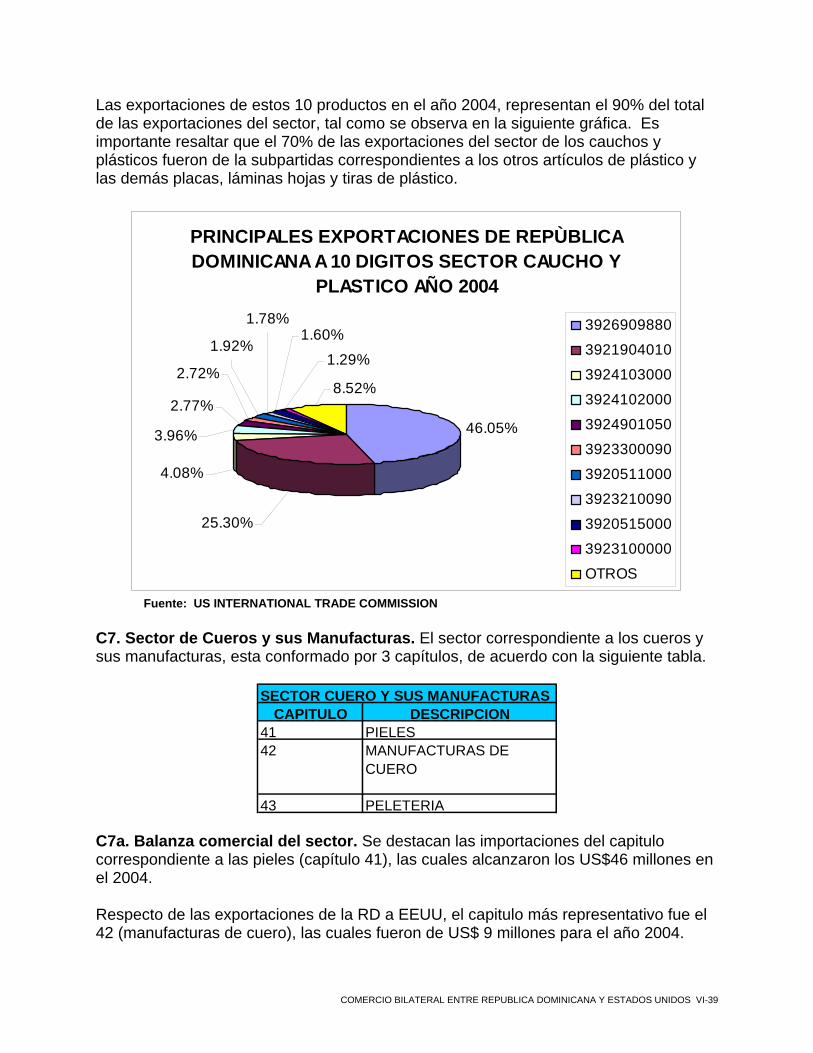
Las exportaciones de estos 10 productos en el año 2004, representan el 90% del total de las exportaciones del sector, tal como se observa en la siguiente gráfica. Es importante resaltar que el 70% de las exportaciones del sector de los cauchos y plásticos fueron de la subpartidas correspondientes a los otros artículos de plástico y las demás placas, láminas hojas y tiras de plástico.
PRINCIPALES EXPORTACIONES DE REPÙBLICA DOMINICANA A 10 DIGITOS SECTOR CAUCHO Y
PLASTICO AÑO 2004
46.05%
25.30%
8.52%
1.29%
1.60%1.78%
1.92%
4.08%
2.77%
3.96%
2.72%
3926909880
3921904010
3924103000
3924102000
39249010503923300090
3920511000
3923210090
3920515000
3923100000
OTROS
Fuente: US INTERNATIONAL TRADE COMMISSION
C7. Sector de Cueros y sus Manufacturas. El sector correspondiente a los cueros y sus manufacturas, esta conformado por 3 capítulos, de acuerdo con la siguiente tabla.
SECTOR CUERO Y SUS MANUFACTURASCAPITULO DESCRIPCION
41 PIELES42 MANUFACTURAS DE
CUERO
43 PELETERIA C7a. Balanza comercial del sector. Se destacan las importaciones del capitulo correspondiente a las pieles (capítulo 41), las cuales alcanzaron los US$46 millones en el 2004. Respecto de las exportaciones de la RD a EEUU, el capitulo más representativo fue el 42 (manufacturas de cuero), las cuales fueron de US$ 9 millones para el año 2004.
COMERCIO BILATERAL ENTRE REPUBLICA DOMINICANA Y ESTADOS UNIDOS VI-39
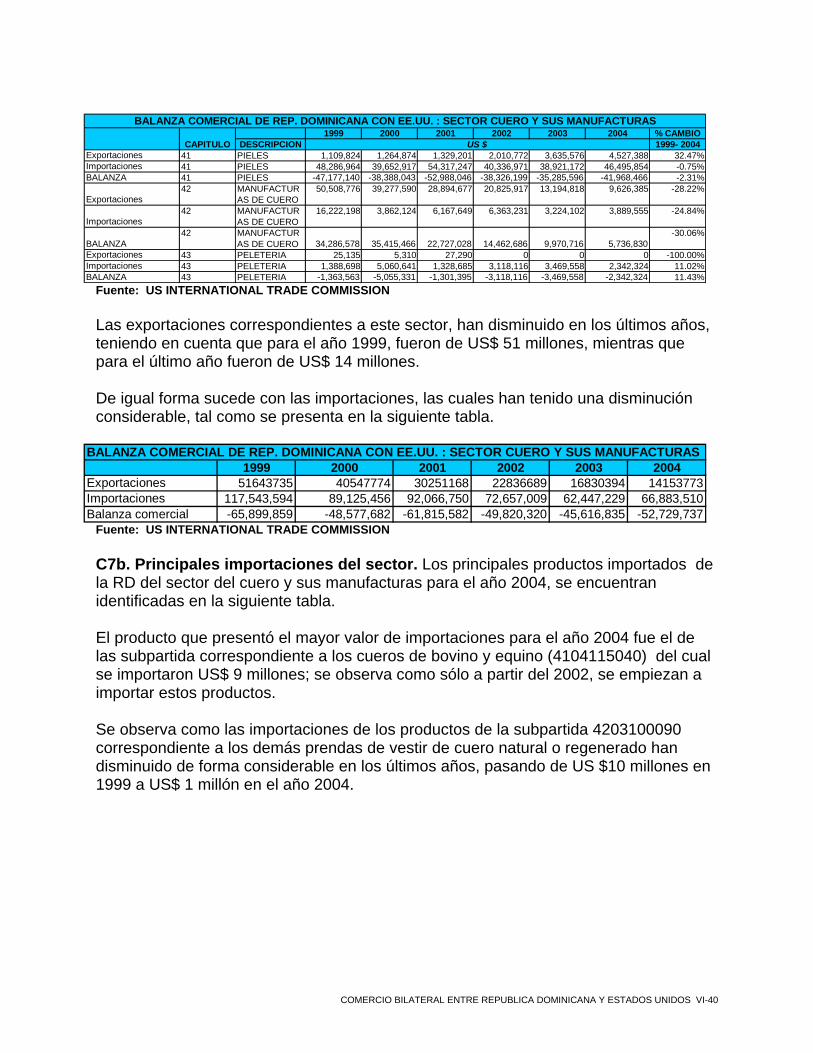
1999 2000 2001 2002 2003 2004 % CAMBIO
DESCRIPCION 1999- 2004Exportaciones 41 PIELES 1,109,824 1,264,874 1,329,201 2,010,772 3,635,576 4,527,388 32.47%Importaciones 41 PIELES 48,286,964 39,652,917 54,317,247 40,336,971 38,921,172 46,495,854 -0.75%BALANZA 41 PIELES -47,177,140 -38,388,043 -52,988,046 -38,326,199 -35,285,596 -41,968,466 -2.31%
Exportaciones42 MANUFACTUR
AS DE CUERO50,508,776 39,277,590 28,894,677 20,825,917 13,194,818 9,626,385 -28.22%
Importaciones42 MANUFACTUR
AS DE CUERO16,222,198 3,862,124 6,167,649 6,363,231 3,224,102 3,889,555 -24.84%
BALANZA 42 MANUFACTUR
AS DE CUERO 34,286,578 35,415,466 22,727,028 14,462,686 9,970,716 5,736,830-30.06%
Exportaciones 43 PELETERIA 25,135 5,310 27,290 0 0 0 -100.00%Importaciones 43 PELETERIA 1,388,698 5,060,641 1,328,685 3,118,116 3,469,558 2,342,324 11.02%BALANZA 43 PELETERIA -1,363,563 -5,055,331 -1,301,395 -3,118,116 -3,469,558 -2,342,324 11.43%
BALANZA COMERCIAL DE REP. DOMINICANA CON EE.UU. : SECTOR CUERO Y SUS MANUFACTURAS
CAPITULO US $
Fuente: US INTERNATIONAL TRADE COMMISSION Las exportaciones correspondientes a este sector, han disminuido en los últimos años, teniendo en cuenta que para el año 1999, fueron de US$ 51 millones, mientras que para el último año fueron de US$ 14 millones. De igual forma sucede con las importaciones, las cuales han tenido una disminución considerable, tal como se presenta en la siguiente tabla.
BALANZA COMERCIAL DE REP. DOMINICANA CON EE.UU. : SECTOR CUERO Y SUS MANUFACTURAS
1999 2000 2001 2002 2003 2004Exportaciones 51643735 40547774 30251168 22836689 16830394 14153773Importaciones 117,543,594 89,125,456 92,066,750 72,657,009 62,447,229 66,883,510Balanza comercial -65,899,859 -48,577,682 -61,815,582 -49,820,320 -45,616,835 -52,729,737
Fuente: US INTERNATIONAL TRADE COMMISSION
C7b. Principales importaciones del sector. Los principales productos importados de la RD del sector del cuero y sus manufacturas para el año 2004, se encuentran identificadas en la siguiente tabla. El producto que presentó el mayor valor de importaciones para el año 2004 fue el de las subpartida correspondiente a los cueros de bovino y equino (4104115040) del cual se importaron US$ 9 millones; se observa como sólo a partir del 2002, se empiezan a importar estos productos. Se observa como las importaciones de los productos de la subpartida 4203100090 correspondiente a los demás prendas de vestir de cuero natural o regenerado han disminuido de forma considerable en los últimos años, pasando de US $10 millones en 1999 a US$ 1 millón en el año 2004.
COMERCIO BILATERAL ENTRE REPUBLICA DOMINICANA Y ESTADOS UNIDOS VI-40

1999 2000 2001 2002 2003 2004 % CAMBIO1999- 2004
1 4104115040
Bovine and equine, wet blues, split grains, in the wet state, full grains, without hair on, but not further prepared, nesoi - - - 4,862,189 1,644,190 9,553,139
40.17%
2 4107926010
Bovine and equine upper leather, except whole hides and skins, grain split,nesoi, prepared after tanning or crusting, except hdg 4114 - - - 4,156,048 5,758,763 8,267,212
41.04%
3 4104115030
Bovine and equine hides or skins, wet blues, not split, full grains in the wet state, without hair on, but not further prepared, nesoi - - - 7,130,709 7,935,983 8,224,807
7.40%
4 4107111000
Bovine upper leather, lining leather, whole,full grains unsplit, surface not>28 sq feet (2.6 m2) prepared after tanning or crusting, nesoi - - - 8,486,872 9,191,023 7,755,489
-4.41%
5 4113200000
Swine leather further prepared after tanning or crusting, including parchment-dressed, without wool or hair on, whether or not split, nesoi - - - 2,488,994 2,495,017 2,268,932
-4.52%
6 4101501010
Cattle hides and skins whole, not pretanned, of a weight exceeding 16 kg - - - 2,577,277 3,226,208 1,755,894
-17.46%
7 4104414000
Bovine and equine upper leather; sole leather, full grains, unsplit in the dry state, crust, but not further prepared, nesoi - - - 236,018 832,608 1,610,052
161.18%
8 4104115070
Bovine and equine, wet blues, split, (except grains), full grain, wet state, without hair on, but not further prepared, nesoi - - - 42,947 - 1,535,569
497.95%
9 4203100090 Articles of apparel, nesoi 10,443,156 1,231,288 2,306,396 2,831,769 173,451 1,141,573 -35.77%
10 4303100060Furskin articles of apparel and clothing accessories, nesoi 807,421 4,309,550 402,673 1,337,259 1,252,755 1,019,909
4.78%
IMPORTACIONES DE REP. DOMINICANA DESDE EU. SECTOR CUERO Y SUS MANUFACTURASSUBPARTID
A 10 DIG PRODUCTO US $
Fuente: US INTERNATIONAL TRADE COMMISSION
Las importaciones de estos 10 productos en el año 2004, representan el 84% del total de las importaciones del sector, tal como se observa en la siguiente gráfica. Es importante resaltar que los productos correspondientes a los cueros de bovino y equino curtido (4104115040) y los cueros preparados después del curtido o secado y cueros y pieles apergaminados de bovino o equino representan el 35% del total de las importaciones de la RD provenientes de EEUU para el periodo 2004.
COMERCIO BILATERAL ENTRE REPUBLICA DOMINICANA Y ESTADOS UNIDOS VI-41
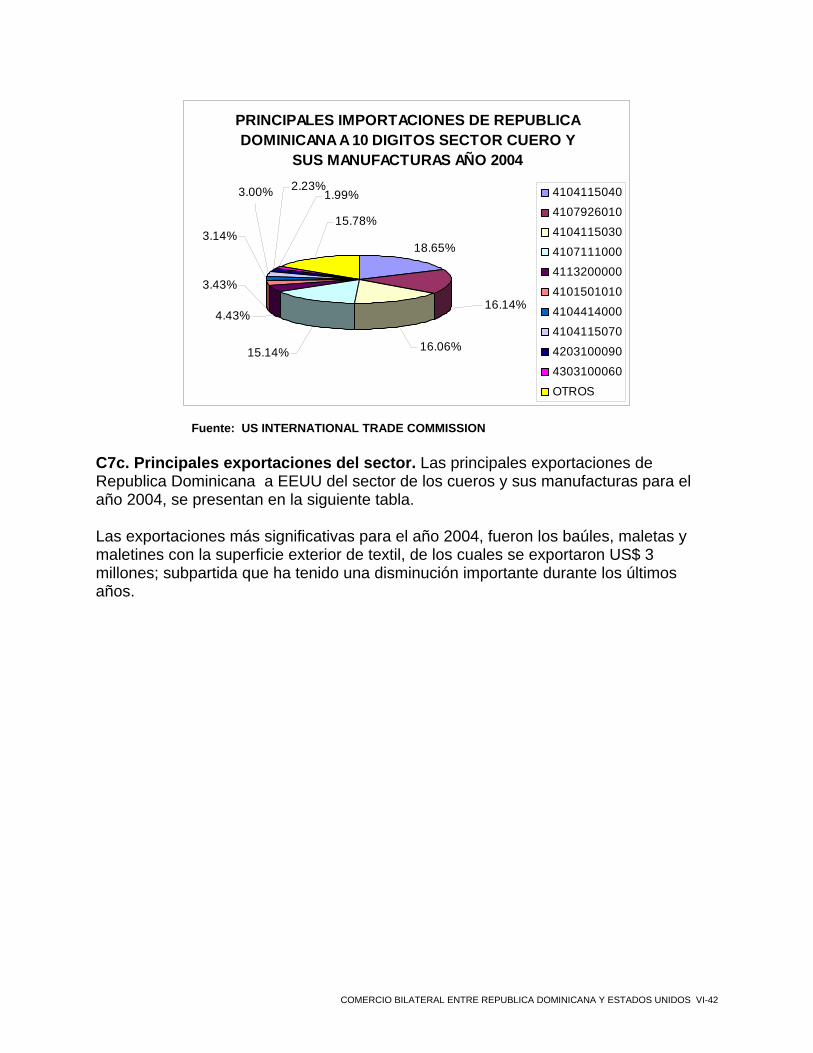
PRINCIPALES IMPORTACIONES DE REPUBLICA DOMINICANA A 10 DIGITOS SECTOR CUERO Y
SUS MANUFACTURAS AÑO 2004
18.65%
16.14%
15.78%
1.99%2.23%3.00%
3.14%
16.06%
4.43%
15.14%
3.43%
4104115040
4107926010
4104115030
41071110004113200000
4101501010
4104414000
4104115070
4203100090
4303100060
OTROS
Fuente: US INTERNATIONAL TRADE COMMISSION C7c. Principales exportaciones del sector. Las principales exportaciones de Republica Dominicana a EEUU del sector de los cueros y sus manufacturas para el año 2004, se presentan en la siguiente tabla. Las exportaciones más significativas para el año 2004, fueron los baúles, maletas y maletines con la superficie exterior de textil, de los cuales se exportaron US$ 3 millones; subpartida que ha tenido una disminución importante durante los últimos años.
COMERCIO BILATERAL ENTRE REPUBLICA DOMINICANA Y ESTADOS UNIDOS VI-42
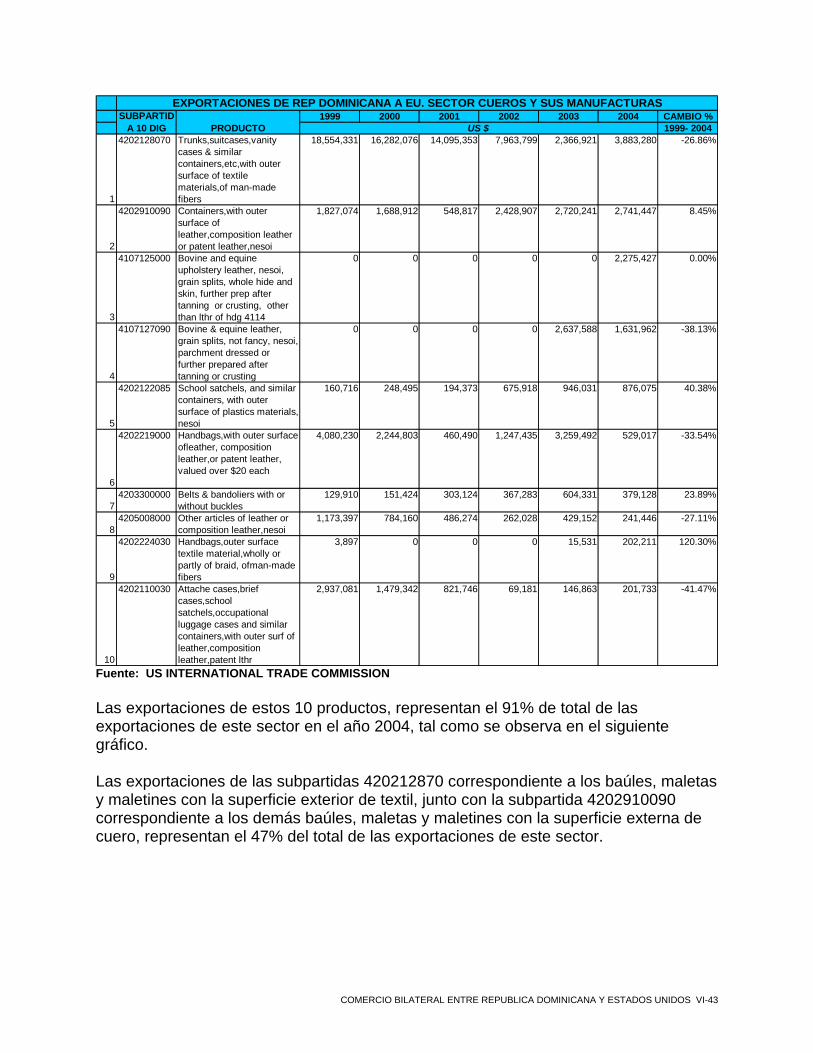
1999 2000 2001 2002 2003 2004 CAMBIO %1999- 2004
1
4202128070 Trunks,suitcases,vanity cases & similar containers,etc,with outer surface of textile materials,of man-made fibers
18,554,331 16,282,076 14,095,353 7,963,799 2,366,921 3,883,280 -26.86%
2
4202910090 Containers,with outer surface of leather,composition leather or patent leather,nesoi
1,827,074 1,688,912 548,817 2,428,907 2,720,241 2,741,447 8.45%
3
4107125000 Bovine and equine upholstery leather, nesoi, grain splits, whole hide and skin, further prep after tanning or crusting, other than lthr of hdg 4114
0 0 0 0 0 2,275,427 0.00%
4
4107127090 Bovine & equine leather, grain splits, not fancy, nesoi, parchment dressed or further prepared after tanning or crusting
0 0 0 0 2,637,588 1,631,962 -38.13%
5
4202122085 School satchels, and similar containers, with outer surface of plastics materials, nesoi
160,716 248,495 194,373 675,918 946,031 876,075 40.38%
6
4202219000 Handbags,with outer surface ofleather, composition leather,or patent leather, valued over $20 each
4,080,230 2,244,803 460,490 1,247,435 3,259,492 529,017 -33.54%
74203300000 Belts & bandoliers with or
without buckles129,910 151,424 303,124 367,283 604,331 379,128 23.89%
84205008000 Other articles of leather or
composition leather,nesoi1,173,397 784,160 486,274 262,028 429,152 241,446 -27.11%
9
4202224030 Handbags,outer surface textile material,wholly or partly of braid, ofman-made fibers
3,897 0 0 0 15,531 202,211 120.30%
10
4202110030 Attache cases,brief cases,school satchels,occupational luggage cases and similar containers,with outer surf of leather,composition leather,patent lthr
2,937,081 1,479,342 821,746 69,181 146,863 201,733 -41.47%
EXPORTACIONES DE REP DOMINICANA A EU. SECTOR CUEROS Y SUS MANUFACTURASSUBPARTID
A 10 DIG PRODUCTO US $
Fuente: US INTERNATIONAL TRADE COMMISSION Las exportaciones de estos 10 productos, representan el 91% de total de las exportaciones de este sector en el año 2004, tal como se observa en el siguiente gráfico. Las exportaciones de las subpartidas 420212870 correspondiente a los baúles, maletas y maletines con la superficie exterior de textil, junto con la subpartida 4202910090 correspondiente a los demás baúles, maletas y maletines con la superficie externa de cuero, representan el 47% del total de las exportaciones de este sector.
COMERCIO BILATERAL ENTRE REPUBLICA DOMINICANA Y ESTADOS UNIDOS VI-43
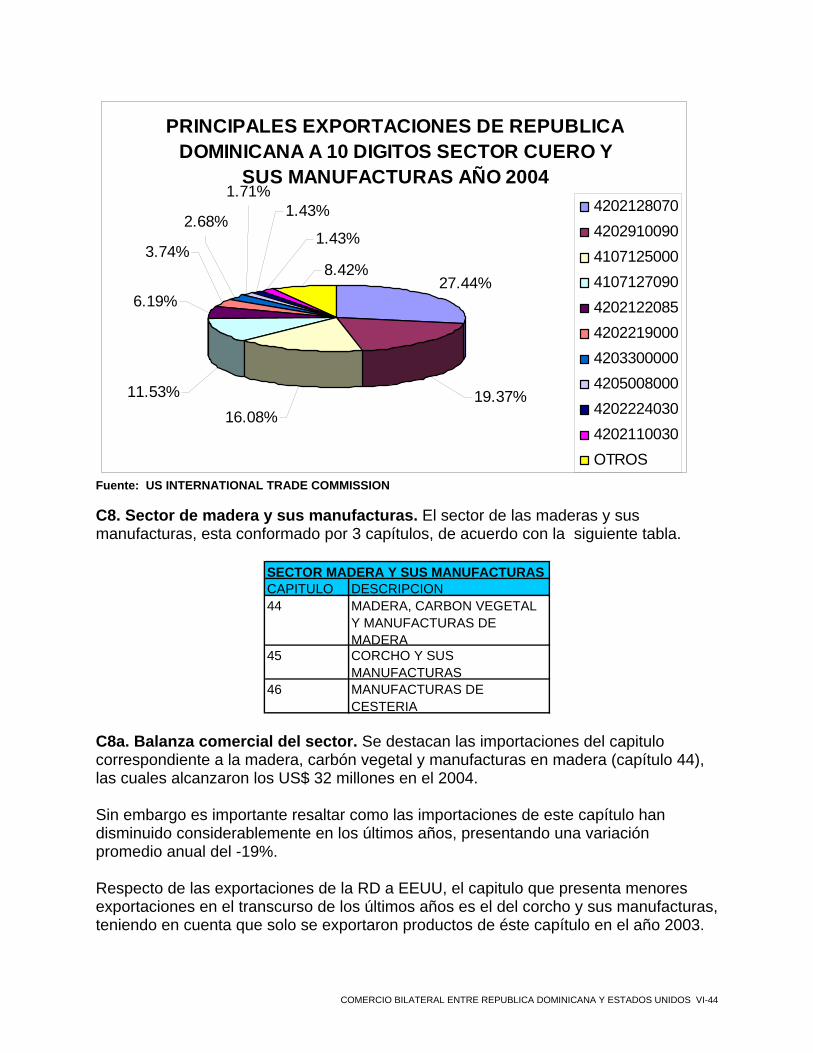
PRINCIPALES EXPORTACIONES DE REPUBLICA DOMINICANA A 10 DIGITOS SECTOR CUERO Y
SUS MANUFACTURAS AÑO 2004
27.44%
3.74%
11.53%
6.19%
16.08%
2.68%
1.71%1.43%
1.43%
8.42%
19.37%
4202128070420291009041071250004107127090420212208542022190004203300000420500800042022240304202110030OTROS
Fuente: US INTERNATIONAL TRADE COMMISSION C8. Sector de madera y sus manufacturas. El sector de las maderas y sus manufacturas, esta conformado por 3 capítulos, de acuerdo con la siguiente tabla.
SECTOR MADERA Y SUS MANUFACTURASCAPITULO DESCRIPCION44 MADERA, CARBON VEGETAL
Y MANUFACTURAS DE MADERA
45 CORCHO Y SUS MANUFACTURAS
46 MANUFACTURAS DE CESTERIA
C8a. Balanza comercial del sector. Se destacan las importaciones del capitulo correspondiente a la madera, carbón vegetal y manufacturas en madera (capítulo 44), las cuales alcanzaron los US$ 32 millones en el 2004. Sin embargo es importante resaltar como las importaciones de este capítulo han disminuido considerablemente en los últimos años, presentando una variación promedio anual del -19%. Respecto de las exportaciones de la RD a EEUU, el capitulo que presenta menores exportaciones en el transcurso de los últimos años es el del corcho y sus manufacturas, teniendo en cuenta que solo se exportaron productos de éste capítulo en el año 2003.
COMERCIO BILATERAL ENTRE REPUBLICA DOMINICANA Y ESTADOS UNIDOS VI-44
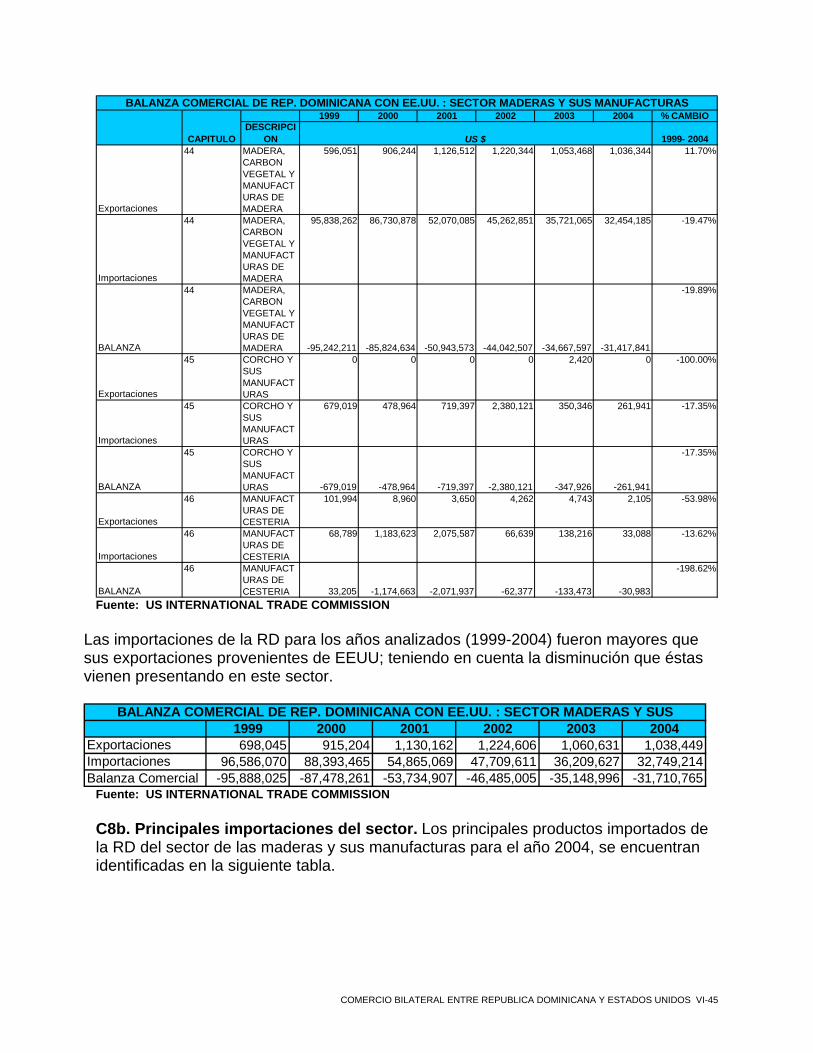
1999 2000 2001 2002 2003 2004 % CAMBIODESCRIPCI
ON 1999- 2004
Exportaciones
44 MADERA, CARBON VEGETAL Y MANUFACTURAS DE MADERA
596,051 906,244 1,126,512 1,220,344 1,053,468 1,036,344 11.70%
Importaciones
44 MADERA, CARBON VEGETAL Y MANUFACTURAS DE MADERA
95,838,262 86,730,878 52,070,085 45,262,851 35,721,065 32,454,185 -19.47%
BALANZA
44 MADERA, CARBON VEGETAL Y MANUFACTURAS DE MADERA -95,242,211 -85,824,634 -50,943,573 -44,042,507 -34,667,597 -31,417,841
-19.89%
Exportaciones
45 CORCHO Y SUS MANUFACTURAS
0 0 0 0 2,420 0 -100
Importaciones
45 CORCHO Y SUS MANUFACTURAS
679,019 478,964 719,397 2,380,121 350,346 261,941 -17.35%
BALANZA
45 CORCHO Y SUS MANUFACTURAS -679,019 -478,964 -719,397 -2,380,121 -347,926 -261,941
-17.35%
Exportaciones
46 MANUFACTURAS DE CESTERIA
101,994 8,960 3,650 4,262 4,743 2,105 -53.98%
Importaciones
46 MANUFACTURAS DE CESTERIA
68,789 1,183,623 2,075,587 66,639 138,216 33,088 -13.62%
BALANZA
46 MANUFACTURAS DE CESTERIA 33,205 -1,174,663 -2,071,937 -62,377 -133,473 -30,983
-198.62%
BALANZA COMERCIAL DE REP. DOMINICANA CON EE.UU. : SECTOR MADERAS Y SUS MANUFACTURAS
CAPITULO US $
.00%
Fuente: US INTERNATIONAL TRADE COMMISSION
Las importaciones de la RD para los años analizados (1999-2004) fueron mayores que sus exportaciones provenientes de EEUU; teniendo en cuenta la disminución que éstas vienen presentando en este sector.
1999 2000 2001 2002 2003 2004Exportaciones 698,045 915,204 1,130,162 1,224,606 1,060,631 1,038,449Importaciones 96,586,070 88,393,465 54,865,069 47,709,611 36,209,627 32,749,214Balanza Comercial -95,888,025 -87,478,261 -53,734,907 -46,485,005 -35,148,996 -31,710,765
BALANZA COMERCIAL DE REP. DOMINICANA CON EE.UU. : SECTOR MADERAS Y SUS
Fuente: US INTERNATIONAL TRADE COMMISSION
C8b. Principales importaciones del sector. Los principales productos importados de la RD del sector de las maderas y sus manufacturas para el año 2004, se encuentran identificadas en la siguiente tabla.
COMERCIO BILATERAL ENTRE REPUBLICA DOMINICANA Y ESTADOS UNIDOS VI-45
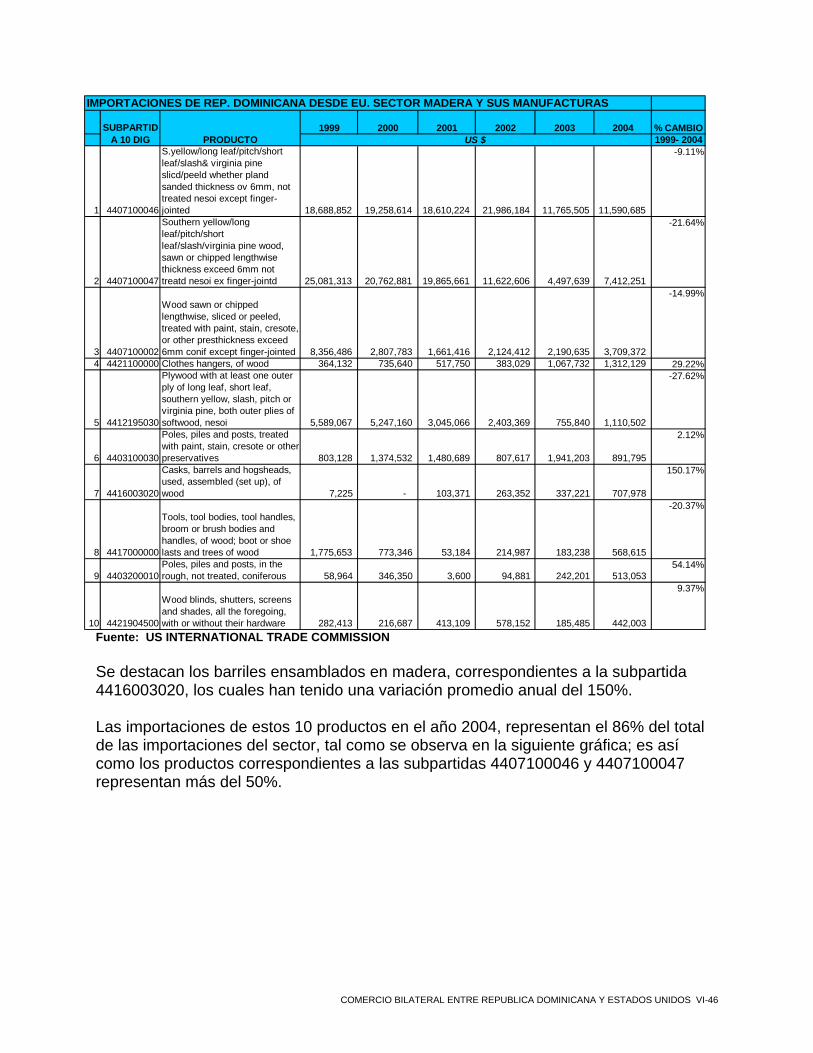
IMPORTACIONES DE REP. DOMINICANA DESDE EU. SECTOR MADERA Y SUS MANUFACTURAS
1999 2000 2001 2002 2003 2004 % CAMBIO1999- 2004
1 4407100046
S.yellow/long leaf/pitch/short leaf/slash& virginia pine slicd/peeld whether pland sanded thickness ov 6mm, not treated nesoi except finger-jointed 18,688,852 19,258,614 18,610,224 21,986,184 11,765,505 11,590,685
-9.11%
2 4407100047
Southern yellow/long leaf/pitch/short leaf/slash/virginia pine wood, sawn or chipped lengthwise thickness exceed 6mm not treatd nesoi ex finger-jointd 25,081,313 20,762,881 19,865,661 11,622,606 4,497,639 7,412,251
-21.64%
3 4407100002
Wood sawn or chipped lengthwise, sliced or peeled, treated with paint, stain, cresote, or other presthickness exceed 6mm conif except finger-jointed 8,356,486 2,807,783 1,661,416 2,124,412 2,190,635 3,709,372
-14.99%
4 4421100000 Clothes hangers, of wood 364,132 735,640 517,750 383,029 1,067,732 1,312,129 29.22%
5 4412195030
Plywood with at least one outer ply of long leaf, short leaf, southern yellow, slash, pitch or virginia pine, both outer plies of softwood, nesoi 5,589,067 5,247,160 3,045,066 2,403,369 755,840 1,110,502
-27.62%
6 4403100030
Poles, piles and posts, treated with paint, stain, cresote or other preservatives 803,128 1,374,532 1,480,689 807,617 1,941,203 891,795
2.12%
7 4416003020
Casks, barrels and hogsheads, used, assembled (set up), of wood 7,225 - 103,371 263,352 337,221 707,978
150.17%
8 4417000000
Tools, tool bodies, tool handles, broom or brush bodies and handles, of wood; boot or shoe lasts and trees of wood 1,775,653 773,346 53,184 214,987 183,238 568,615
-20.37%
9 4403200010Poles, piles and posts, in the rough, not treated, coniferous 58,964 346,350 3,600 94,881 242,201 513,053
54.14%
10 4421904500
Wood blinds, shutters, screens and shades, all the foregoing, with or without their hardware 282,413 216,687 413,109 578,152 185,485 442,003
9.37%
SUBPARTIDA 10 DIG PRODUCTO US $
Fuente: US INTERNATIONAL TRADE COMMISSION Se destacan los barriles ensamblados en madera, correspondientes a la subpartida 4416003020, los cuales han tenido una variación promedio anual del 150%. Las importaciones de estos 10 productos en el año 2004, representan el 86% del total de las importaciones del sector, tal como se observa en la siguiente gráfica; es así como los productos correspondientes a las subpartidas 4407100046 y 4407100047 representan más del 50%.
COMERCIO BILATERAL ENTRE REPUBLICA DOMINICANA Y ESTADOS UNIDOS VI-46

PRINCIPALES IMPORTACIONES DE REPUBLICA DOMINICANA A 10 DIGITOS
SECTOR MADERA Y SUS MANUFACTURAS AÑO 2004
35.39%
22.63%
13.71%
1.35%1.57%1.74%
2.16%
11.33%
3.39%
4.01%
2.72%
4407100046440710004744071000024421100000441219503044031000304416003020441700000044032000104421904500OTROS
Fuente: US INTERNATIONAL TRADE COMMISSION
C8c. Principales exportaciones del sector. Las principales exportaciones de la RD del sector de la madera y sus manufacturas para el año 2004, se presentan en la siguiente tabla.
COMERCIO BILATERAL ENTRE REPUBLICA DOMINICANA Y ESTADOS UNIDOS VI-47
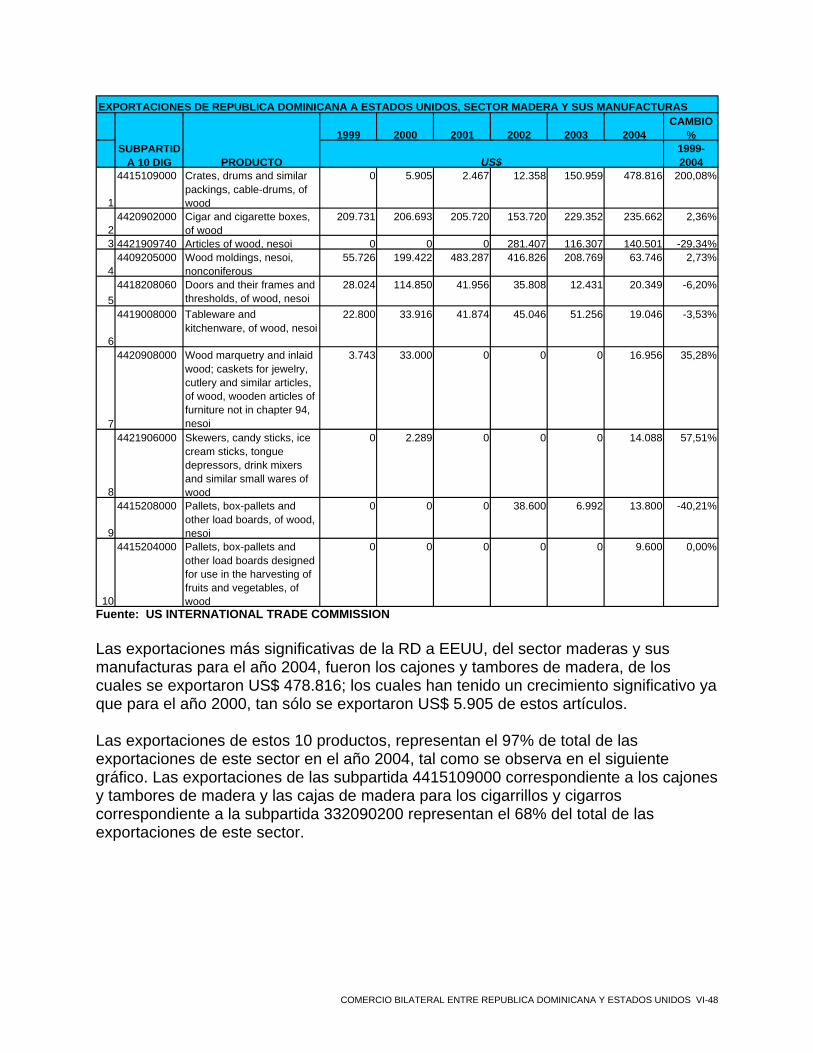
EXPORTACIONES DE REPUBLICA DOMINICANA A ESTADOS UNIDOS, SECTOR MADERA Y SUS MANUFACTURAS
1999 2000 2001 2002 2003 2004CAMBIO
%1999- 2004
1
4415109000 Crates, drums and similar packings, cable-drums, of wood
0 5.905 2.467 12.358 150.959 478.816 200,08%
24420902000 Cigar and cigarette boxes,
of wood209.731 206.693 205.720 153.720 229.352 235.662 2,36%
3 4421909740 Articles of wood, nesoi 0 0 0 281.407 116.307 140.501 -29,34%
44409205000 Wood moldings, nesoi,
nonconiferous55.726 199.422 483.287 416.826 208.769 63.746 2,73%
54418208060 Doors and their frames and
thresholds, of wood, nesoi28.024 114.850 41.956 35.808 12.431 20.349 -6,20%
6
4419008000 Tableware and kitchenware, of wood, nesoi
22.800 33.916 41.874 45.046 51.256 19.046 -3,53%
7
4420908000 Wood marquetry and inlaid wood; caskets for jewelry, cutlery and similar articles, of wood, wooden articles of furniture not in chapter 94, nesoi
3.743 33.000 0 0 0 16.956 35,28%
8
4421906000 Skewers, candy sticks, ice cream sticks, tongue depressors, drink mixers and similar small wares of wood
0 2.289 0 0 0 14.088 57,51%
9
4415208000 Pallets, box-pallets and other load boards, of wood, nesoi
0 0 0 38.600 6.992 13.800 -40,21%
10
4415204000 Pallets, box-pallets and other load boards designed for use in the harvesting of fruits and vegetables, of wood
0 0 0 0 0 9.600 0,00%
SUBPARTIDA 10 DIG PRODUCTO US$
Fuente: US INTERNATIONAL TRADE COMMISSION Las exportaciones más significativas de la RD a EEUU, del sector maderas y sus manufacturas para el año 2004, fueron los cajones y tambores de madera, de los cuales se exportaron US$ 478.816; los cuales han tenido un crecimiento significativo ya que para el año 2000, tan sólo se exportaron US$ 5.905 de estos artículos. Las exportaciones de estos 10 productos, representan el 97% de total de las exportaciones de este sector en el año 2004, tal como se observa en el siguiente gráfico. Las exportaciones de las subpartida 4415109000 correspondiente a los cajones y tambores de madera y las cajas de madera para los cigarrillos y cigarros correspondiente a la subpartida 332090200 representan el 68% del total de las exportaciones de este sector.
COMERCIO BILATERAL ENTRE REPUBLICA DOMINICANA Y ESTADOS UNIDOS VI-48
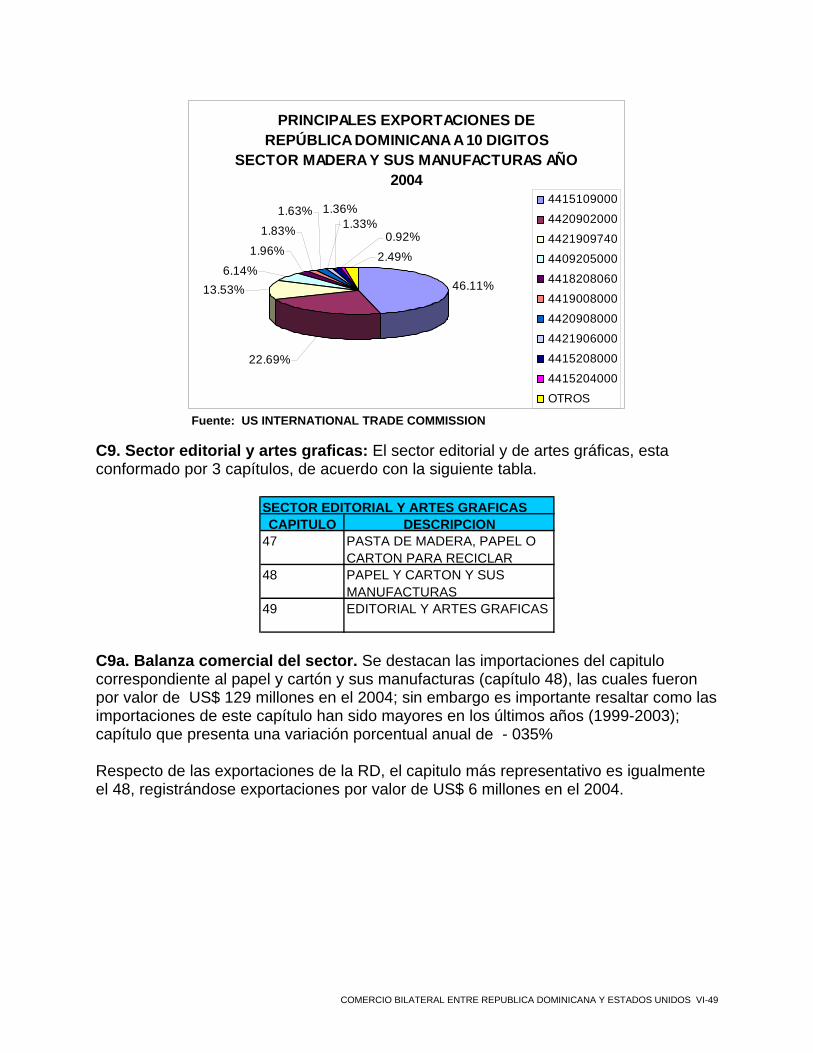
PRINCIPALES EXPORTACIONES DE REPÚBLICA DOMINICANA A 10 DIGITOS
SECTOR MADERA Y SUS MANUFACTURAS AÑO 2004
46.11%
1.83%
6.14%
1.96%
13.53%
1.63% 1.36%1.33%
0.92%
2.49%
22.69%
4415109000
4420902000
4421909740
4409205000
4418208060
4419008000
4420908000
4421906000
4415208000
4415204000
OTROS
Fuente: US INTERNATIONAL TRADE COMMISSION
C9. Sector editorial y artes graficas: El sector editorial y de artes gráficas, esta conformado por 3 capítulos, de acuerdo con la siguiente tabla.
SECTOR EDITORIAL Y ARTES GRAFICASCAPITULO DESCRIPCION
47 PASTA DE MADERA, PAPEL O CARTON PARA RECICLAR
48 PAPEL Y CARTON Y SUS MANUFACTURAS
49 EDITORIAL Y ARTES GRAFICAS
C9a. Balanza comercial del sector. Se destacan las importaciones del capitulo correspondiente al papel y cartón y sus manufacturas (capítulo 48), las cuales fueron por valor de US$ 129 millones en el 2004; sin embargo es importante resaltar como las importaciones de este capítulo han sido mayores en los últimos años (1999-2003); capítulo que presenta una variación porcentual anual de - 035% Respecto de las exportaciones de la RD, el capitulo más representativo es igualmente el 48, registrándose exportaciones por valor de US$ 6 millones en el 2004.
COMERCIO BILATERAL ENTRE REPUBLICA DOMINICANA Y ESTADOS UNIDOS VI-49

1999 2000 2001 2002 2003 2004 % CAMBIODESCRIPCI
ON 1999- 2004
Exportaciones
47 PASTA DE MADERA, PAPEL O CARTON PARA RECICLAR
0 0 0 0 0 0 -100
Importaciones
47 PASTA DE MADERA, PAPEL O CARTON PARA RECICLAR
696,216 1,407,393 2,680,972 3,202,565 1,831,605 2,240,817 26.34%
BALANZA
47 PASTA DE MADERA, PAPEL O CARTON PARA RECICLAR -696,216 -1,407,393 -2,680,972 -3,202,565 -1,831,605 -2,240,817
26.34%
Exportaciones
48 PAPEL Y CARTON Y SUS MANUFACTURAS
2,206,346 4,232,899 5,994,477 8,091,832 8,553,782 6,055,679 22.38%
Importaciones
48 PAPEL Y CARTON Y SUS MANUFACTURAS
131,510,568 130,354,621 140,023,882 144,968,762 130,787,580 129,225,113 -0.35%
BALANZA
48 PAPEL Y CARTON Y SUS MANUFACTURAS -129,304,222 -126,121,722 -134,029,405 -136,876,930 -122,233,798 -123,169,434
-0.97%
Exportaciones
49 EDITORIAL Y ARTES GRAFICAS
530,375 1,372,342 853,871 1,972,175 4,581,986 2,614,365 37.58%
Importaciones
49 EDITORIAL Y ARTES GRAFICAS
10,373,303 10,009,594 5,918,947 8,091,849 7,304,990 6,021,847 -10.31%
BALANZA
49 EDITORIAL Y ARTES GRAFICAS -9,842,928 -8,637,252 -5,065,076 -6,119,674 -2,723,004 -3,407,482
-19.12%
BALANZA COMERCIAL DE REP. DOMINICANA CON EE.UU. : SECTOR EDITORIAL Y ARTES GRAFICAS
CAPITULO US $.00%
Fuente: US INTERNATIONAL TRADE COMMISSION
De acuerdo a la balanza comercial que presenta este sector, se determina como la RD importa un mayor valor desde EEUU de lo que exporta de este país. Es así como las exportaciones para el año 2004 fueron de US$ 8 millones, mientras que las importaciones fueron de US$ 137 millones.
1999 2000 2001 2002 2003 2004Exportaciones 2,736,721 5,605,241 6,848,348 10,064,007 13,135,768 8,670,044Importaciones 142,580,087 141,771,608 148,623,801 156,263,176 139,924,175 137,487,777Balanza Comercial -139,843,366 -136,166,367 -141,775,453 -146,199,169 -126,788,407 -128,817,733
BALANZA COMERCIAL DE REP. DOMINICANA CON EE.UU. :SECTOR EDITORIAL Y ARTES GRAFICAS
Fuente: US INTERNATIONAL TRADE COMMISSION
C9b. Principales importaciones del sector. Los principales productos importados de la RD del sector editorial y artes gráficas para el año 2004, se encuentran identificadas en la siguiente tabla.
COMERCIO BILATERAL ENTRE REPUBLICA DOMINICANA Y ESTADOS UNIDOS VI-50

1999 2000 2001 2002 2003 2004 % cambio
1999- 2004
1 4804110000Kraftliner, uncoated, unbleached, in rolls or sheets 19,689,609 22,056,985 15,156,698 13,862,964 14,398,005 22,257,076
2.48%
2 4811905050
Paper, paperboard, cellulose wadding and webs of cellulose fibers, coated, impregnated or covered, surface-decorated etc,nesoi,wd>15x26x15cm,strps/rll - - - 2,024,203 7,705,960 10,659,978
129.48%
3 4819100040
Cartons, boxes and cases of corrugated paper or paperboard except sanitary food and beverage containers 3,753,258 7,124,466 5,694,134 5,728,574 13,877,655 9,526,184
20.48%
4 4818404030
Diapers and diaper liners, nesoi, of paper, cellulose wadding or webs of cellulose fibers 28,035,662 19,529,282 40,607,012 34,498,177 14,331,902 8,866,342
-20.57%
5 4821100000Paper and paperboard labels of all kinds, printed 2,713,712 2,701,639 3,173,659 4,546,397 4,410,570 5,889,462
16.76%
6 4821904000
Paper and paperboard labels, unprinted, not pressure-sensitive 3,284,130 3,662,945 7,967,030 6,632,720 5,433,275 5,662,362
11.51%
7 4804190000Kraftliner, uncoated, bleached, in rolls or sheets 984,785 1,038,567 1,820,696 2,849,047 5,502,946 4,824,449
37.41%
8 4821902000Paper and paperboard labels, unprinted, pressure-sensitive 2,869,898 4,452,141 3,806,769 3,701,753 4,419,455 4,663,707
10.20%
9 4819504060
Packing containers, nesoi, of paper, paperboard, cellulose wadding or webs of cellulose fibers 387,011 396,420 622,162 2,138,678 2,052,545 4,515,384
63.45%
10 4818900000
Bed sheets and similar household or hospital articles of paper pulp, paper, cellulose wadding or webs of cellulose fibers, nesoi 2,480,661 948,734 2,729,658 4,232,255 6,865,467 4,472,318
12.51%
IMPORTACIONES DE REP. DOMINICANA A EU. SECTOR EDITORIAL Y ARTES GRAFICAS
SUBPARTIDA 10 DIG PRODUCTO us $
Fuente: US INTERNATIONAL TRADE COMMISSION
El papel y cartón para caras (cubiertas) (“kraftliner”) tuvo importaciones en el año 2004 por valor de US$ 22 millones, presentando una variación moderada respecto de los años anteriores del 2.48%.
Se destaca la subpartida 4811905050 correspondiente al papel, cartulina y guata de celulosa, la cual ha tenido un dinamismo importante en los últimos años, teniendo en cuenta que para el año 2000 se importaron US$ 2 millones, mientras que para el 2004, la suma ascendió a US$ 10 millones.
Las importaciones de estos 10 productos en el año 2004, representan el 60% del total de las importaciones del sector, tal como se observa en la siguiente gráfica.
COMERCIO BILATERAL ENTRE REPUBLICA DOMINICANA Y ESTADOS UNIDOS VI-51
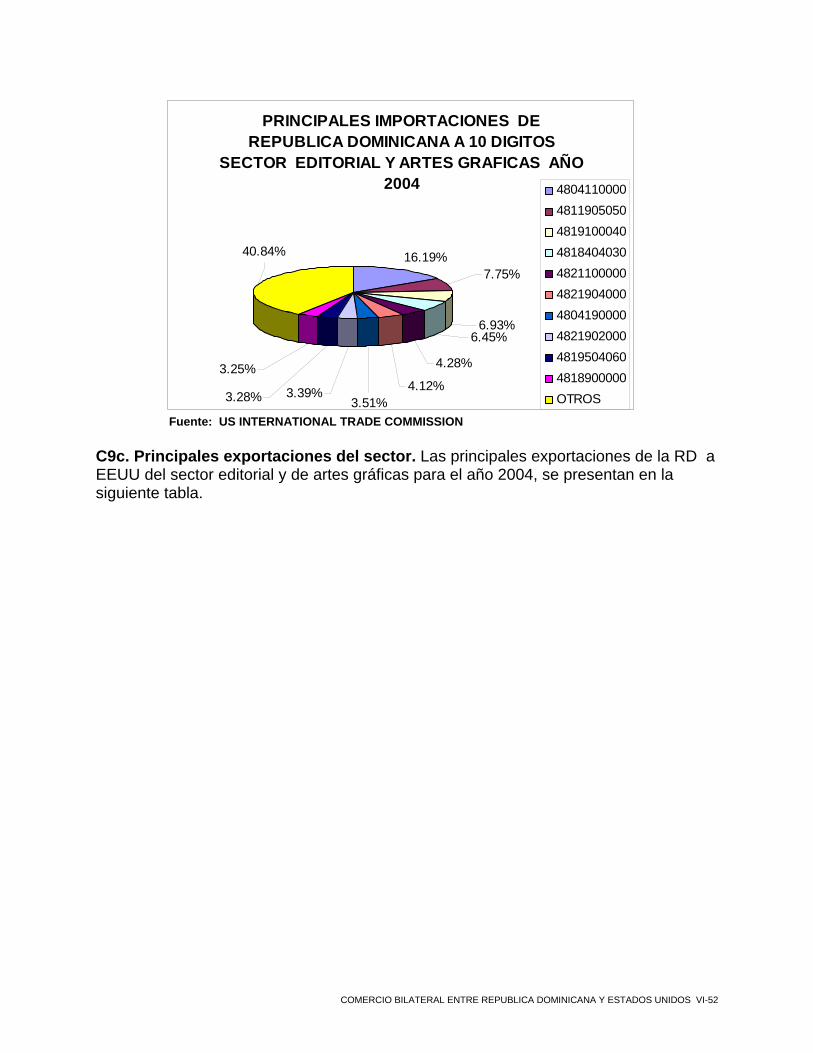
PRINCIPALES IMPORTACIONES DE REPUBLICA DOMINICANA A 10 DIGITOS
SECTOR EDITORIAL Y ARTES GRAFICAS AÑO 2004
16.19%7.75%
40.84%
3.25%
3.28% 3.39%3.51%
6.93%
4.28%
6.45%
4.12%
4804110000481190505048191000404818404030482110000048219040004804190000482190200048195040604818900000OTROS
Fuente: US INTERNATIONAL TRADE COMMISSION
C9c. Principales exportaciones del sector. Las principales exportaciones de la RD a EEUU del sector editorial y de artes gráficas para el año 2004, se presentan en la siguiente tabla.
COMERCIO BILATERAL ENTRE REPUBLICA DOMINICANA Y ESTADOS UNIDOS VI-52
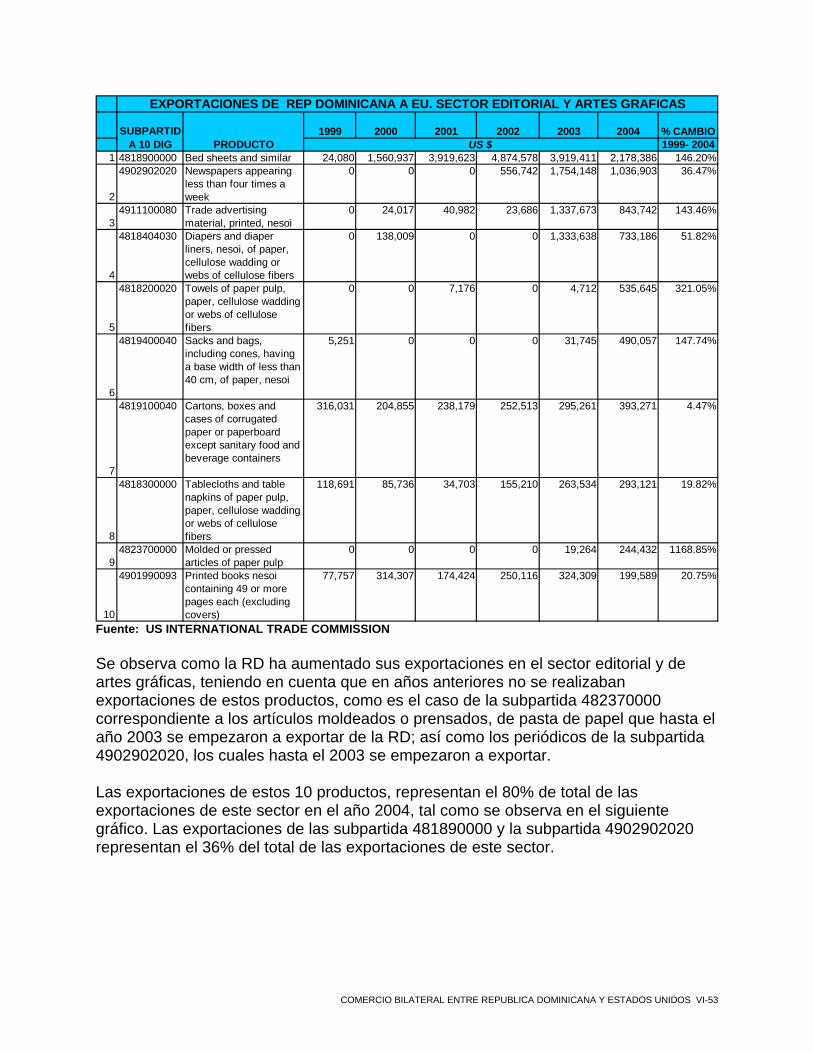
1999 2000 2001 2002 2003 2004 % CAMBIO1999- 2004
1 4818900000 Bed sheets and similar 24,080 1,560,937 3,919,623 4,874,578 3,919,411 2,178,386 146.20%
2
4902902020 Newspapers appearing less than four times a week
0 0 0 556,742 1,754,148 1,036,903 36.47%
34911100080 Trade advertising
material, printed, nesoi0 24,017 40,982 23,686 1,337,673 843,742 143.46%
4
4818404030 Diapers and diaper liners, nesoi, of paper, cellulose wadding or webs of cellulose fibers
0 138,009 0 0 1,333,638 733,186 51.82%
5
4818200020 Towels of paper pulp, paper, cellulose wadding or webs of cellulose fibers
0 0 7,176 0 4,712 535,645 321.05%
6
4819400040 Sacks and bags, including cones, having a base width of less than 40 cm, of paper, nesoi
5,251 0 0 0 31,745 490,057 147.74%
7
4819100040 Cartons, boxes and cases of corrugated paper or paperboard except sanitary food and beverage containers
316,031 204,855 238,179 252,513 295,261 393,271 4.47%
8
4818300000 Tablecloths and table napkins of paper pulp, paper, cellulose wadding or webs of cellulose fibers
118,691 85,736 34,703 155,210 263,534 293,121 19.82%
94823700000 Molded or pressed
articles of paper pulp0 0 0 0 19,264 244,432 1168.85%
10
4901990093 Printed books nesoi containing 49 or more pages each (excluding covers)
77,757 314,307 174,424 250,116 324,309 199,589 20.75%
EXPORTACIONES DE REP DOMINICANA A EU. SECTOR EDITORIAL Y ARTES GRAFICAS
SUBPARTIDA 10 DIG PRODUCTO US $
Fuente: US INTERNATIONAL TRADE COMMISSION
Se observa como la RD ha aumentado sus exportaciones en el sector editorial y de artes gráficas, teniendo en cuenta que en años anteriores no se realizaban exportaciones de estos productos, como es el caso de la subpartida 482370000 correspondiente a los artículos moldeados o prensados, de pasta de papel que hasta el año 2003 se empezaron a exportar de la RD; así como los periódicos de la subpartida 4902902020, los cuales hasta el 2003 se empezaron a exportar.
Las exportaciones de estos 10 productos, representan el 80% de total de las exportaciones de este sector en el año 2004, tal como se observa en el siguiente gráfico. Las exportaciones de las subpartida 481890000 y la subpartida 4902902020 representan el 36% del total de las exportaciones de este sector.
COMERCIO BILATERAL ENTRE REPUBLICA DOMINICANA Y ESTADOS UNIDOS VI-53
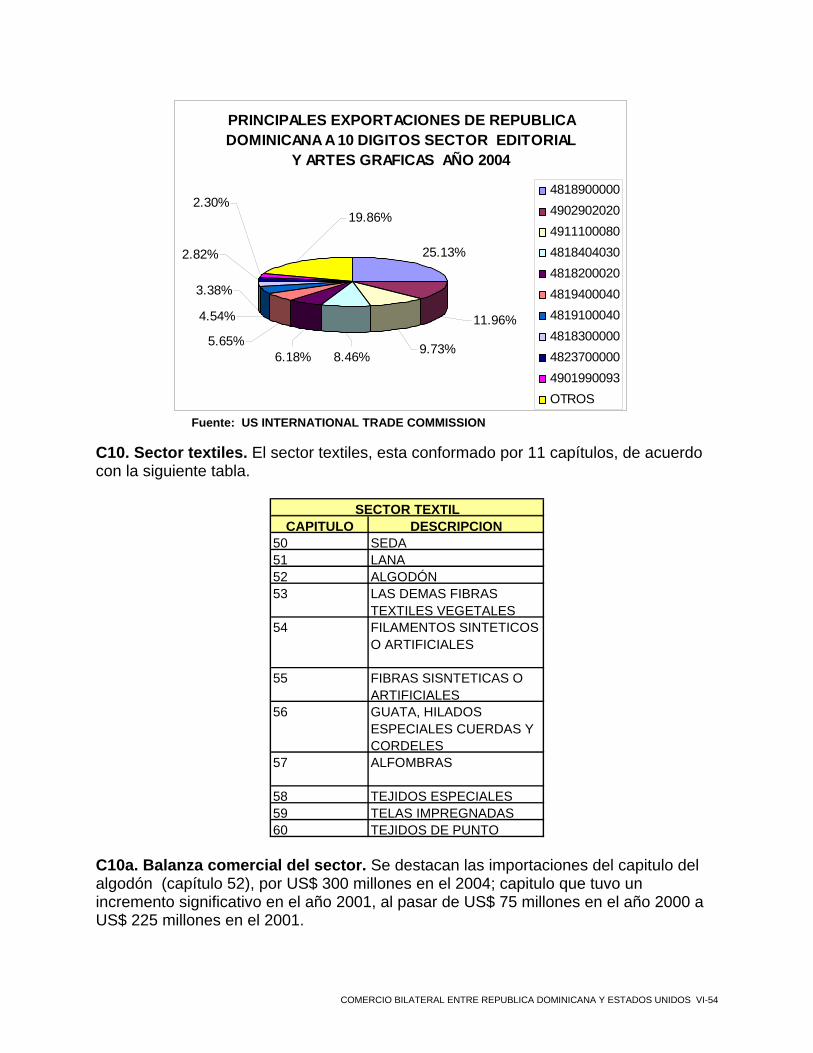
PRINCIPALES EXPORTACIONES DE REPUBLICA DOMINICANA A 10 DIGITOS SECTOR EDITORIAL
Y ARTES GRAFICAS AÑO 2004
25.13%
5.65%8.46%6.18% 9.73%
4.54%
3.38%
2.82%
2.30%19.86%
11.96%
4818900000490290202049111000804818404030481820002048194000404819100040481830000048237000004901990093OTROS
Fuente: US INTERNATIONAL TRADE COMMISSION
C10. Sector textiles. El sector textiles, esta conformado por 11 capítulos, de acuerdo con la siguiente tabla.
CAPITULO DESCRIPCION50 SEDA51 LANA52 ALGODÓN53 LAS DEMAS FIBRAS
TEXTILES VEGETALES54 FILAMENTOS SINTETICOS
O ARTIFICIALES
55 FIBRAS SISNTETICAS O ARTIFICIALES
56 GUATA, HILADOS ESPECIALES CUERDAS Y CORDELES
57 ALFOMBRAS
58 TEJIDOS ESPECIALES59 TELAS IMPREGNADAS60 TEJIDOS DE PUNTO
SECTOR TEXTIL
C10a. Balanza comercial del sector. Se destacan las importaciones del capitulo del algodón (capítulo 52), por US$ 300 millones en el 2004; capitulo que tuvo un incremento significativo en el año 2001, al pasar de US$ 75 millones en el año 2000 a US$ 225 millones en el 2001.
COMERCIO BILATERAL ENTRE REPUBLICA DOMINICANA Y ESTADOS UNIDOS VI-54

Respecto de las exportaciones de la RD, el capitulo más representativo es el 53, correspondiente a las demás fibras textiles vegetales, las cuales registraron exportaciones por valor de US$ 1.481.863 en el 2004.
1999 2000 2001 2002 2003 2004 % CAMBIODESCRIPCION 1999- 2004
Exportaciones 50 SEDA 0 5,332 6,896 2,423 0 146,762 129.05%Importaciones 50 SEDA 2,103,899 2,358,289 1,971,743 3,545,770 4,568,402 1,172,635 -11.03%BALANZA 50 SEDA -2,103,899 -2,352,957 -1,964,847 -3,543,347 -4,568,402 -1,025,873 -13.38%Exportaciones 51 LANA 8,014 4,538 107,424 6,031 24,217 222,711 94.44%Importaciones 51 LANA 2,883,239 856,656 13,323,662 19,597,119 12,007,089 9,450,194 26.80%BALANZA 51 LANA -2,875,225 -852,118 -13,216,238 -19,591,088 -11,982,872 -9,227,483 26.26%Exportaciones 52 ALGODÓN 51,216 18,199 33,804 35,030 28,660 16,720 -20.06%Importaciones 52 ALGODÓN 44,268,316 71,173,972 225,496,356 297,980,275 247,332,607 300,419,892 46.67%BALANZA 52 ALGODÓN -44,217,100 -71,155,773 -225,462,552 -297,945,245 -247,303,947 -300,403,172 46.70%
Exportaciones
53 LAS DEMAS FIBRAS TEXTILES VEGETALES
0 340 0 0 466,220 1,481,863 712.52%
Importaciones
53 LAS DEMAS FIBRAS TEXTILES VEGETALES
313,624 578,939 4,738,012 11,975,718 10,132,165 4,990,229 73.92%
BALANZA
53 LAS DEMAS FIBRAS TEXTILES VEGETALES -313,624 -578,599 -4,738,012 -11,975,718 -9,665,945 -3,508,366
62.08%
Exportaciones
54 FILAMENTOS SINTETICOS O ARTIFICIALES
1,084 5,434 10,905 7,254 38,160 231,850 192.44%
Importaciones
54 FILAMENTOS SINTETICOS O ARTIFICIALES
13,092,711 19,207,530 42,975,722 50,454,454 64,118,049 34,464,768 21.36%
BALANZA
54 FILAMENTOS SINTETICOS O ARTIFICIALES -13,091,627 -19,202,096 -42,964,817 -50,447,200 -64,079,889 -34,232,918
21.20%
Exportaciones
55 FIBRAS SISNTETICAS O ARTIFICIALES
280 1,240 19,679 124,954 37,335 194,076 269.97%
Importaciones
55 FIBRAS SISNTETICAS O ARTIFICIALES
21,973,266 18,864,920 53,763,343 77,587,945 79,365,705 89,965,562 32.57%
BALANZA
55 FIBRAS SISNTETICAS O ARTIFICIALES -21,972,986 -18,863,680 -53,743,664 -77,462,991 -79,328,370 -89,771,486
32.51%
Exportaciones
56 GUATA, HILADOS ESPECIALES CUERDAS Y CORDELES
16,256,810 20,249,429 20,345,671 19,115,585 6,594,627 329,747 -54.14%
Importaciones
56 GUATA, HILADOS ESPECIALES CUERDAS Y CORDELES
7,431,493 16,988,020 19,602,516 19,772,008 28,007,541 29,753,916 31.98%
BALANZA
56 GUATA, HILADOS ESPECIALES CUERDAS Y CORDELES 8,825,317 3,261,409 743,155 -656,423 -21,412,914 -29,424,169
-227.23%
BALANZA COMERCIAL DE REP. DOMINICANA CON EE.UU. :SECTOR TEXTILES (I)
CAPITULO US $
Fuente: US INTERNATIONAL TRADE COMMISSION
COMERCIO BILATERAL ENTRE REPUBLICA DOMINICANA Y ESTADOS UNIDOS VI-55
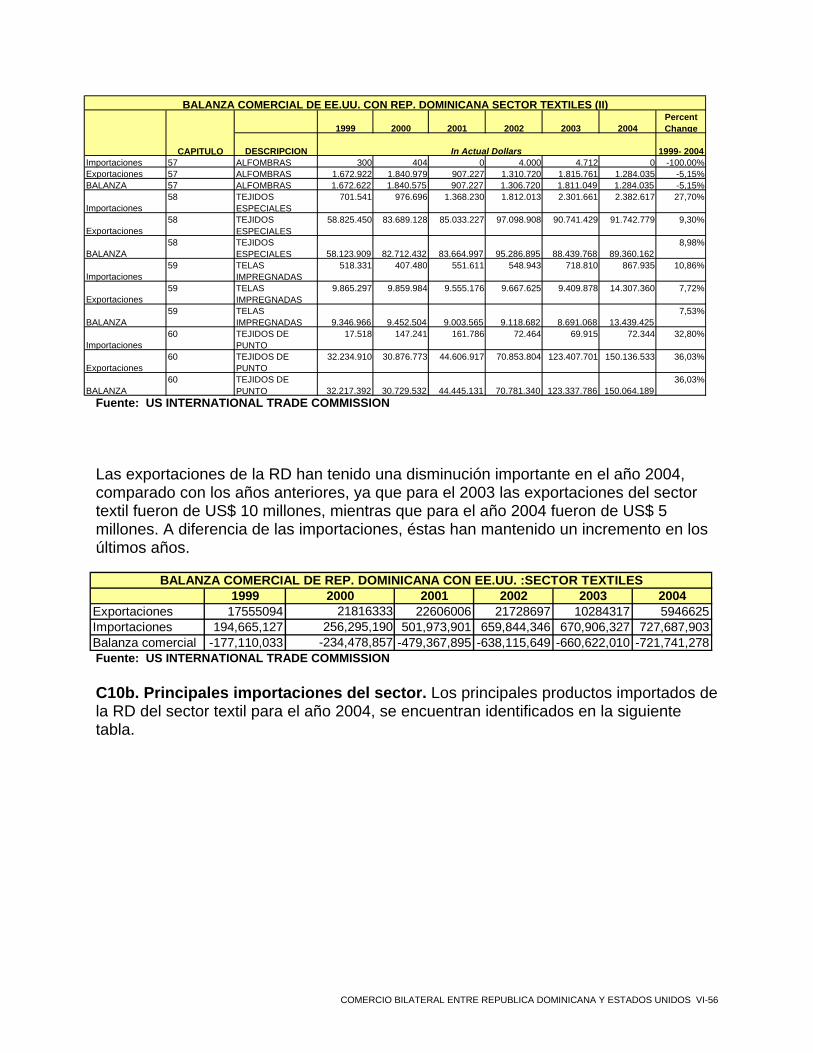
1999 2000 2001 2002 2003 2004Percent Change
DESCRIPCION 1999- 2004Importaciones 57 ALFOMBRAS 300 404 0 4.000 4.712 0 -100,00%Exportaciones 57 ALFOMBRAS 1.672.922 1.840.979 907.227 1.310.720 1.815.761 1.284.035 -5,15%BALANZA 57 ALFOMBRAS 1.672.622 1.840.575 907.227 1.306.720 1.811.049 1.284.035 -5,15%
Importaciones58 TEJIDOS
ESPECIALES701.541 976.696 1.368.230 1.812.013 2.301.661 2.382.617 27,70%
Exportaciones58 TEJIDOS
ESPECIALES58.825.450 83.689.128 85.033.227 97.098.908 90.741.429 91.742.779 9,30%
BALANZA 58 TEJIDOS
ESPECIALES 58.123.909 82.712.432 83.664.997 95.286.895 88.439.768 89.360.1628,98%
Importaciones59 TELAS
IMPREGNADAS518.331 407.480 551.611 548.943 718.810 867.935 10,86%
Exportaciones59 TELAS
IMPREGNADAS9.865.297 9.859.984 9.555.176 9.667.625 9.409.878 14.307.360 7,72%
BALANZA 59 TELAS
IMPREGNADAS 9.346.966 9.452.504 9.003.565 9.118.682 8.691.068 13.439.4257,53%
Importaciones60 TEJIDOS DE
PUNTO17.518 147.241 161.786 72.464 69.915 72.344 32,80%
Exportaciones60 TEJIDOS DE
PUNTO32.234.910 30.876.773 44.606.917 70.853.804 123.407.701 150.136.533 36,03%
BALANZA 60 TEJIDOS DE
PUNTO 32.217.392 30.729.532 44.445.131 70.781.340 123.337.786 150.064.18936,03%
BALANZA COMERCIAL DE EE.UU. CON REP. DOMINICANA SECTOR TEXTILES (II)
CAPITULO In Actual Dollars
Fuente: US INTERNATIONAL TRADE COMMISSION Las exportaciones de la RD han tenido una disminución importante en el año 2004, comparado con los años anteriores, ya que para el 2003 las exportaciones del sector textil fueron de US$ 10 millones, mientras que para el año 2004 fueron de US$ 5 millones. A diferencia de las importaciones, éstas han mantenido un incremento en los últimos años.
1999 2000 2001 2002 2003 2004Exportaciones 17555094 21816333 22606006 21728697 10284317 5946625Importaciones 194,665,127 256,295,190 501,973,901 659,844,346 670,906,327 727,687,903Balanza comercial -177,110,033 -234,478,857 -479,367,895 -638,115,649 -660,622,010 -721,741,278
BALANZA COMERCIAL DE REP. DOMINICANA CON EE.UU. :SECTOR TEXTILES
Fuente: US INTERNATIONAL TRADE COMMISSION
C10b. Principales importaciones del sector. Los principales productos importados de la RD del sector textil para el año 2004, se encuentran identificados en la siguiente tabla.
COMERCIO BILATERAL ENTRE REPUBLICA DOMINICANA Y ESTADOS UNIDOS VI-56

1999 2000 2001 2002 2003 2004 % cambio1999- 2004
1 5212230000
Woven cotton fabrics, under 85% cotton by weight nesoi, dyed fabrics, weighing over 200 g/m2 - - 31,198 389,069 28,913,088 120,375,183
1468.45%
2 5212240000
Woven cotton fabrics, under 85% cotton by weight nesoi, fabrics with yarns of different colors, weighing over 200 g/m2 - - - 330,406 2,015,878 42,513,375
1034.33%
3 6006229080
Other knit or crocheted of dyed cotton fabrics, nesoi (except of single knit const) - - - 11,209,422 34,686,741 36,251,480
79.83%
4 5208130000
Woven fabric of cotton containing 85% or > by weight of cotton weighting < 200 g/m2 3 or 4 thread twill including cross twill unbleached 2,358,386 2,330,439 24,651,041 20,340,699 17,510,903 35,623,504
72.12%
5 5806200000
Narrow woven fabrics, other than goods of heading 5807; nesoi woven fabrics, containing by weight 5% or more of elastomeric yarn or rubber thread 25,047,282 25,526,965 26,968,740 36,684,831 36,641,853 26,259,322
0.95%
6 5513320000
Woven fabrics of synthetic staple fib <85% by wgt of such fib mxd m/scotton wgt <=170g/m2 3-4 thrd twill inc cross twl of polyester staple fibers ydf 2,735 154,618 264,055 4,678,600 10,550,816 18,245,374
481.89%
7 5806322000
Narrow woven fabrics of manmade fiber (other than goods of heading 5807), nesoi 2,943,733 8,758,278 4,413,598 5,214,649 5,550,410 14,878,762
38.27%
8 5503100000
Synthetic staple fibers not carded, combed or otherwise processed for spinning: of nylon or other polyamides 18,825 17,595 18,834 19,990,779 20,162,461 13,074,034
270.11%
9 5516110000
Unbleached or bleached woven fabrics of artificial staple fibers: containing 85 percent or more by weight of artificial staple fibers - - - 18,849 2,936,396 11,117,443
2328.61%
10 6002904000
Other knitted or crocheted cotton fabrics, width not exceeding 30 cm and containing by weight 5 percent or more of elastomeric yarn or rubber thread - - - 5,087,526 9,795,325 10,822,812
45.85%
IMPORTACIONES A REP. DOMINICANA DE E.U. SECTOR TEXTILESSUBPARTID
A 10 DIG PRODUCTO us $
Fuente: US INTERNATIONAL TRADE COMMISSION
En general las importaciones del sector textil han tenido un incremento considerable en los últimos años; se destacan las subpartidas 5516110000 correspondientes a los tejidos de fibras artificiales discontinuas, y la subpartida 5212400000 correspondiente a los demás tejidos de algodón con hilados de distintos colores, las cuales tuvieron una variación promedio anual importante. De acuerdo a la siguiente gráfica se observa como las importaciones del sector no se encuentran concentradas de forma significativa en pocas subpartidas, sino que por el contrario, se encuentran de forma diversificada por los diferentes subpartidas.
COMERCIO BILATERAL ENTRE REPUBLICA DOMINICANA Y ESTADOS UNIDOS VI-57
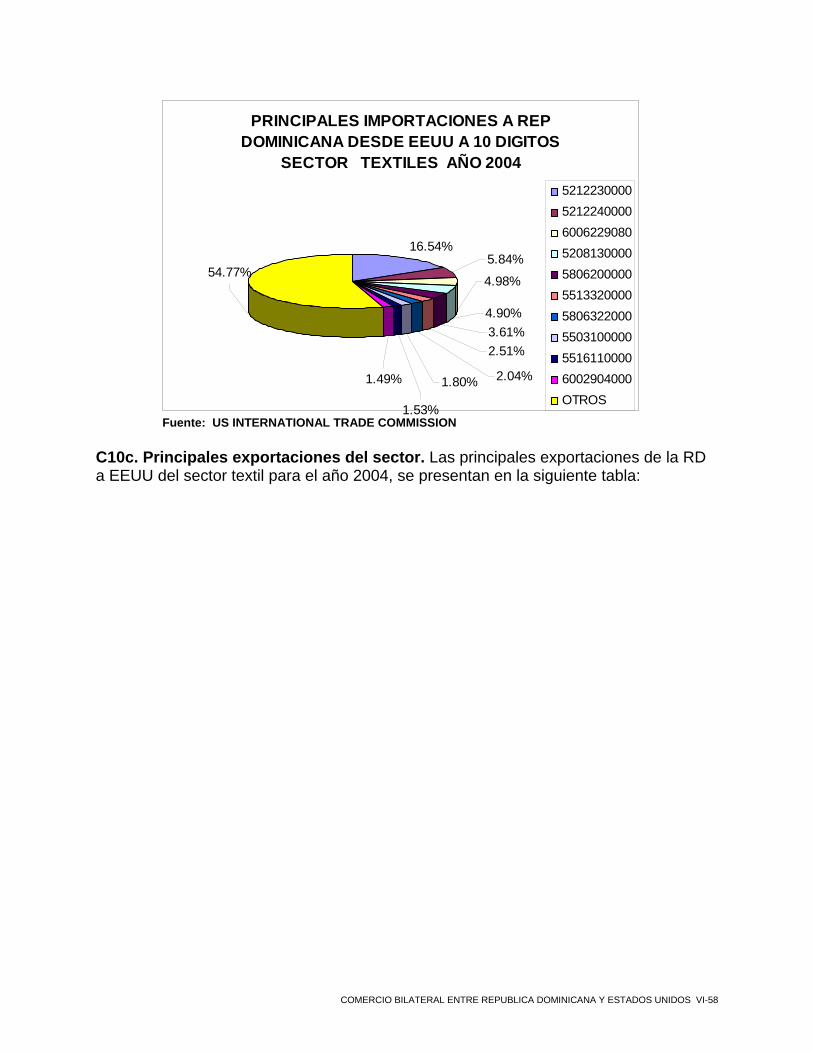
PRINCIPALES IMPORTACIONES A REP DOMINICANA DESDE EEUU A 10 DIGITOS
SECTOR TEXTILES AÑO 2004
16.54%
2.51%
4.90%3.61%
4.98%
2.04%1.80%
1.53%
1.49%
54.77%5.84%
5212230000521224000060062290805208130000580620000055133200005806322000550310000055161100006002904000OTROS
Fuente: US INTERNATIONAL TRADE COMMISSION
C10c. Principales exportaciones del sector. Las principales exportaciones de la RD a EEUU del sector textil para el año 2004, se presentan en la siguiente tabla:
COMERCIO BILATERAL ENTRE REPUBLICA DOMINICANA Y ESTADOS UNIDOS VI-58
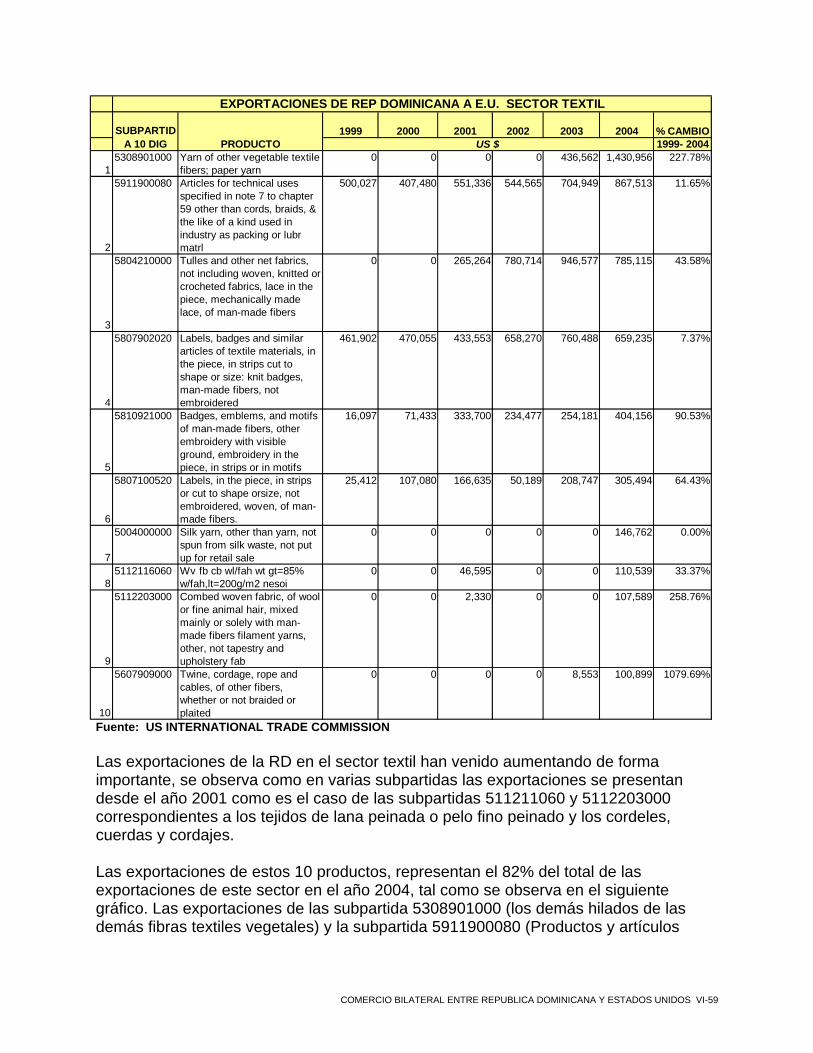
1999 2000 2001 2002 2003 2004 % CAMBIO1999- 2004
15308901000 Yarn of other vegetable textile
fibers; paper yarn0 0 0 0 436,562 1,430,956 227.78%
2
5911900080 Articles for technical uses specified in note 7 to chapter 59 other than cords, braids, & the like of a kind used in industry as packing or lubr matrl
500,027 407,480 551,336 544,565 704,949 867,513 11.65%
3
5804210000 Tulles and other net fabrics, not including woven, knitted or crocheted fabrics, lace in the piece, mechanically made lace, of man-made fibers
0 0 265,264 780,714 946,577 785,115 43.58%
4
5807902020 Labels, badges and similar articles of textile materials, in the piece, in strips cut to shape or size: knit badges, man-made fibers, not embroidered
461,902 470,055 433,553 658,270 760,488 659,235 7.37%
5
5810921000 Badges, emblems, and motifs of man-made fibers, other embroidery with visible ground, embroidery in the piece, in strips or in motifs
16,097 71,433 333,700 234,477 254,181 404,156 90.53%
6
5807100520 Labels, in the piece, in strips or cut to shape orsize, not embroidered, woven, of man-made fibers.
25,412 107,080 166,635 50,189 208,747 305,494 64.43%
7
5004000000 Silk yarn, other than yarn, not spun from silk waste, not put up for retail sale
0 0 0 0 0 146,762 0.00%
85112116060 Wv fb cb wl/fah wt gt=85%
w/fah,lt=200g/m2 nesoi0 0 46,595 0 0 110,539 33.37%
9
5112203000 Combed woven fabric, of wool or fine animal hair, mixed mainly or solely with man-made fibers filament yarns, other, not tapestry and upholstery fab
0 0 2,330 0 0 107,589 258.76%
10
5607909000 Twine, cordage, rope and cables, of other fibers, whether or not braided or plaited
0 0 0 0 8,553 100,899 1079.69%
EXPORTACIONES DE REP DOMINICANA A E.U. SECTOR TEXTIL
SUBPARTIDA 10 DIG PRODUCTO US $
Fuente: US INTERNATIONAL TRADE COMMISSION
Las exportaciones de la RD en el sector textil han venido aumentando de forma importante, se observa como en varias subpartidas las exportaciones se presentan desde el año 2001 como es el caso de las subpartidas 511211060 y 5112203000 correspondientes a los tejidos de lana peinada o pelo fino peinado y los cordeles, cuerdas y cordajes.
Las exportaciones de estos 10 productos, representan el 82% del total de las exportaciones de este sector en el año 2004, tal como se observa en el siguiente gráfico. Las exportaciones de las subpartida 5308901000 (los demás hilados de las demás fibras textiles vegetales) y la subpartida 5911900080 (Productos y artículos
COMERCIO BILATERAL ENTRE REPUBLICA DOMINICANA Y ESTADOS UNIDOS VI-59

textiles para usos técnicos) representan el 39% del total de las exportaciones de este sector.
PRINCIPALES EXPORTACIONES DE REP DOMINICANA E.U. A 10 DIGITOS SECTOR TEXTIL
AÑO 2004
24.06%
14.59%
17.29%
1.70%1.81%
1.86%
2.47%
13.20%6.80%11.09%
5.14%
5308901000
5911900080
5804210000
5807902020
5810921000
5807100520
5004000000
5112116060
5112203000
5607909000OTROS
Fuente: US INTERNATIONAL TRADE COMMISSION
C11. Sector confecciones. El sector confecciones, esta conformado por 4 capítulos, de acuerdo con la siguiente tabla.
CAPITULO DESCRIPCION61 PRENDAS DE VESTIR DE
PUNTO62 PRENDAS DE VESTIR TEJIDO
PLANO63 OTRAS CONFECCIONES
63 OTRAS CONFECCIONES
SECTOR CONFECCIONES
C11a. Balanza comercial del sector. Se destacan las importaciones del capitulo de prendas de vestir de punto (capítulo 61), por valor de US$ 378 millones en el 2004; capitulo que tuvo un incremento significativo en los últimos años. Respecto de las exportaciones de la RD, el capitulo más representativo es el 62, correspondiente a las prendas de vestir de tejido plano, las cuales registraron exportaciones por valor de US$ 1.146 millones en el 2004; las cuales han disminuido durante los últimos años.
COMERCIO BILATERAL ENTRE REPUBLICA DOMINICANA Y ESTADOS UNIDOS VI-60
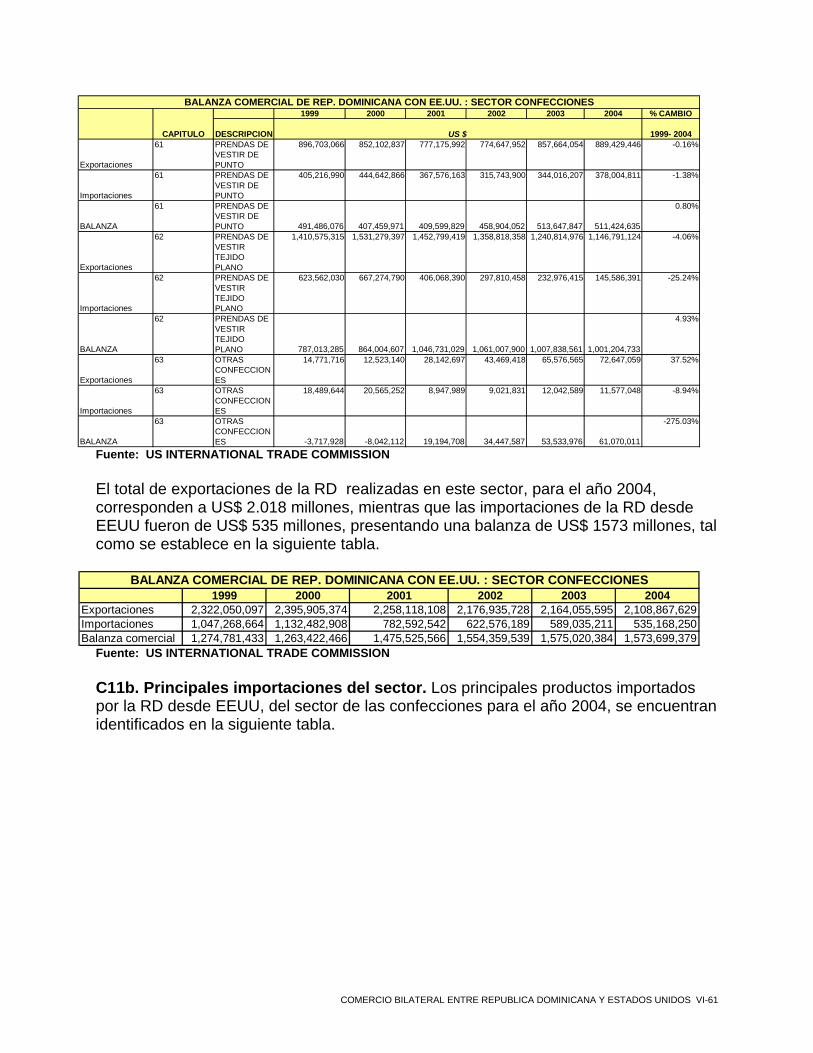
1999 2000 2001 2002 2003 2004 % CAMBIO
DESCRIPCION 1999- 2004
Exportaciones
61 PRENDAS DE VESTIR DE PUNTO
896,703,066 852,102,837 777,175,992 774,647,952 857,664,054 889,429,446 -0.16%
Importaciones
61 PRENDAS DE VESTIR DE PUNTO
405,216,990 444,642,866 367,576,163 315,743,900 344,016,207 378,004,811 -1.38%
BALANZA
61 PRENDAS DE VESTIR DE PUNTO 491,486,076 407,459,971 409,599,829 458,904,052 513,647,847 511,424,635
0.80%
Exportaciones
62 PRENDAS DE VESTIR TEJIDO PLANO
1,410,575,315 1,531,279,397 1,452,799,419 1,358,818,358 1,240,814,976 1,146,791,124 -4.06%
Importaciones
62 PRENDAS DE VESTIR TEJIDO PLANO
623,562,030 667,274,790 406,068,390 297,810,458 232,976,415 145,586,391 -25.24%
BALANZA
62 PRENDAS DE VESTIR TEJIDO PLANO 787,013,285 864,004,607 1,046,731,029 1,061,007,900 1,007,838,561 1,001,204,733
4.93%
Exportaciones
63 OTRAS CONFECCIONES
14,771,716 12,523,140 28,142,697 43,469,418 65,576,565 72,647,059 37.52%
Importaciones
63 OTRAS CONFECCIONES
18,489,644 20,565,252 8,947,989 9,021,831 12,042,589 11,577,048 -8.94%
BALANZA
63 OTRAS CONFECCIONES -3,717,928 -8,042,112 19,194,708 34,447,587 53,533,976 61,070,011
-275.03%
BALANZA COMERCIAL DE REP. DOMINICANA CON EE.UU. : SECTOR CONFECCIONES
CAPITULO US $
Fuente: US INTERNATIONAL TRADE COMMISSION
El total de exportaciones de la RD realizadas en este sector, para el año 2004, corresponden a US$ 2.018 millones, mientras que las importaciones de la RD desde EEUU fueron de US$ 535 millones, presentando una balanza de US$ 1573 millones, tal como se establece en la siguiente tabla.
1999 2000 2001 2002 2003 2004Exportaciones 2,322,050,097 2,395,905,374 2,258,118,108 2,176,935,728 2,164,055,595 2,108,867,629Importaciones 1,047,268,664 1,132,482,908 782,592,542 622,576,189 589,035,211 535,168,250Balanza comercial 1,274,781,433 1,263,422,466 1,475,525,566 1,554,359,539 1,575,020,384 1,573,699,379
BALANZA COMERCIAL DE REP. DOMINICANA CON EE.UU. : SECTOR CONFECCIONES
Fuente: US INTERNATIONAL TRADE COMMISSION
C11b. Principales importaciones del sector. Los principales productos importados por la RD desde EEUU, del sector de las confecciones para el año 2004, se encuentran identificados en la siguiente tabla.
COMERCIO BILATERAL ENTRE REPUBLICA DOMINICANA Y ESTADOS UNIDOS VI-61
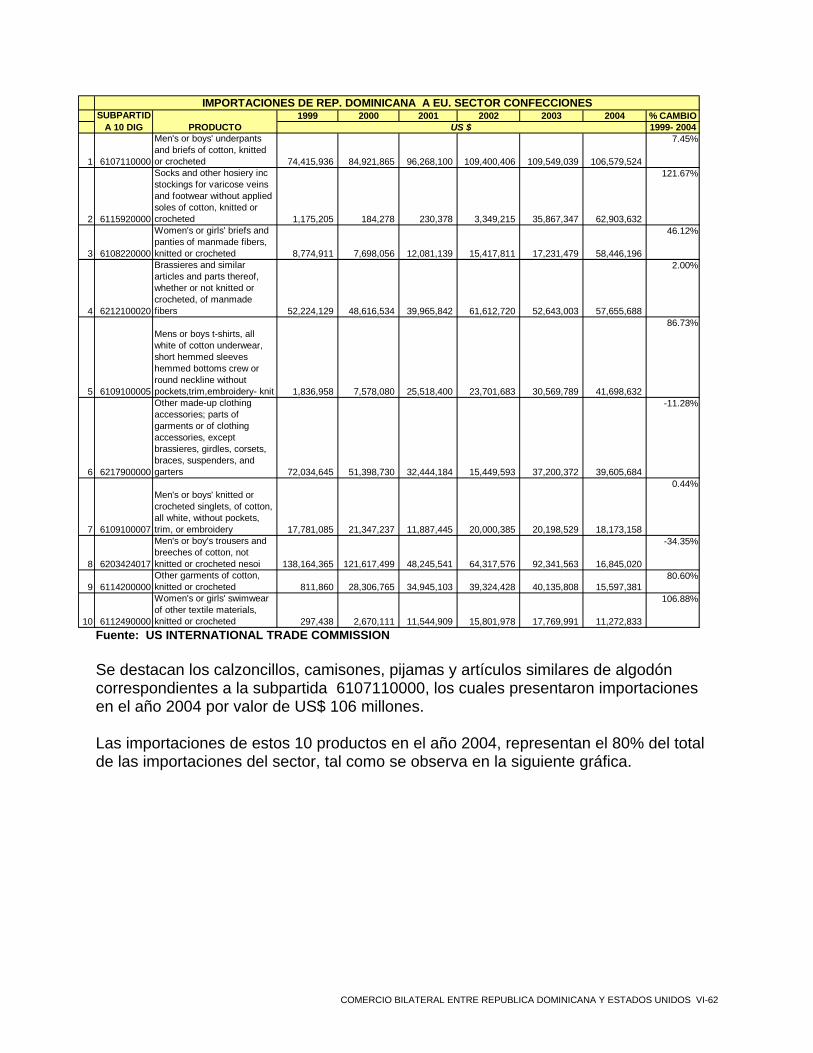
1999 2000 2001 2002 2003 2004 % CAMBIO1999- 2004
1 6107110000
Men's or boys' underpants and briefs of cotton, knitted or crocheted 74,415,936 84,921,865 96,268,100 109,400,406 109,549,039 106,579,524
7.45%
2 6115920000
Socks and other hosiery inc stockings for varicose veins and footwear without applied soles of cotton, knitted or crocheted 1,175,205 184,278 230,378 3,349,215 35,867,347 62,903,632
121.67%
3 6108220000
Women's or girls' briefs and panties of manmade fibers, knitted or crocheted 8,774,911 7,698,056 12,081,139 15,417,811 17,231,479 58,446,196
46.12%
4 6212100020
Brassieres and similar articles and parts thereof, whether or not knitted or crocheted, of manmade fibers 52,224,129 48,616,534 39,965,842 61,612,720 52,643,003 57,655,688
2.00%
5 6109100005
Mens or boys t-shirts, all white of cotton underwear, short hemmed sleeves hemmed bottoms crew or round neckline without pockets,trim,embroidery- knit 1,836,958 7,578,080 25,518,400 23,701,683 30,569,789 41,698,632
86.73%
6 6217900000
Other made-up clothing accessories; parts of garments or of clothing accessories, except brassieres, girdles, corsets, braces, suspenders, and garters 72,034,645 51,398,730 32,444,184 15,449,593 37,200,372 39,605,684
-11.28%
7 6109100007
Men's or boys' knitted or crocheted singlets, of cotton, all white, without pockets, trim, or embroidery 17,781,085 21,347,237 11,887,445 20,000,385 20,198,529 18,173,158
0.44%
8 6203424017
Men's or boy's trousers and breeches of cotton, not knitted or crocheted nesoi 138,164,365 121,617,499 48,245,541 64,317,576 92,341,563 16,845,020
-34.35%
9 6114200000Other garments of cotton, knitted or crocheted 811,860 28,306,765 34,945,103 39,324,428 40,135,808 15,597,381
80.60%
10 6112490000
Women's or girls' swimwear of other textile materials, knitted or crocheted 297,438 2,670,111 11,544,909 15,801,978 17,769,991 11,272,833
106.88%
IMPORTACIONES DE REP. DOMINICANA A EU. SECTOR CONFECCIONESSUBPARTID
A 10 DIG PRODUCTO US $
Fuente: US INTERNATIONAL TRADE COMMISSION
Se destacan los calzoncillos, camisones, pijamas y artículos similares de algodón correspondientes a la subpartida 6107110000, los cuales presentaron importaciones en el año 2004 por valor de US$ 106 millones. Las importaciones de estos 10 productos en el año 2004, representan el 80% del total de las importaciones del sector, tal como se observa en la siguiente gráfica.
COMERCIO BILATERAL ENTRE REPUBLICA DOMINICANA Y ESTADOS UNIDOS VI-62

PRINCIPALES IMPORTACIONES DE REPÚBLICA DOMINICANA A 10 DIGITOS SECTOR
CONFECCIONES AÑO 2004
19.92%
11.75%
19.88%2.11%
2.91%
3.15%
3.40% 10.92%
7.79% 10.77%7.40%
6107110000611592000061082200006212100020610910000562179000006109100007620342401761142000006112490000OTROS
Fuente: US INTERNATIONAL TRADE COMMISSION
C11c. Principales exportaciones del sector. Las principales exportaciones de la RD a EEUU del sector confecciones para el año 2004, se presentan en la siguiente tabla.
COMERCIO BILATERAL ENTRE REPUBLICA DOMINICANA Y ESTADOS UNIDOS VI-63

1999 2000 2001 2002 2003 2004 % CAMBIO1999- 2004
1
6203424015 Men's trousers and breeches, not knitted, of cotton, other
287,610,164 343,379,834 301,256,423 404,679,508 389,497,519 312,154,112 1.65%
2
6203434010 Men's trousers and breeches, not knitted, of synthetic fibers
133,912,780 158,660,908 177,188,281 170,390,699 170,785,483 153,257,479 2.74%
3
6212109020 Brassieres, not containing lace or net or embroidery, of man-made fibers, whether or not knitted or crocheted
148,836,497 131,911,873 122,536,663 142,345,598 117,487,363 152,743,107 0.52%
4
6107110010 Men's underpants and briefs, knitted or crocheted, of cotton
99,521,747 102,306,960 121,677,517 163,962,587 172,783,519 140,870,328 7.20%
5
6115929000 Socks and other hosiery, for varicose veins, and footwear without applied soles, knitted or crocheted, of cotton: not containing lace or net
43,904,239 46,415,201 29,754,473 29,999,595 57,137,647 91,200,887 15.74%
6
6204624020 Women's trousers and breeches, of cotton, not knitted, other
132,597,495 185,345,371 139,042,062 112,697,858 97,412,768 69,229,757 -12.19%
7
6203424010 Men's trousers and breeches, not knitted, of cotton, blue denim
20,635,509 20,980,249 43,133,590 38,477,238 36,931,172 59,090,873 23.42%
8
6108229020 Women's briefs and panties, knitted or crocheted, of man-made fibers
41,620,529 37,468,101 41,414,173 38,701,730 35,459,721 56,126,623 6.16%
9
6107110020 Boys' underpants and briefs, knitted or crocheted, of cotton
21,855,385 21,415,027 13,434,865 30,734,090 51,498,224 52,006,102 18.93%
10
6110202075 Women's or girls' other pullovers, and similar garments, of cotton, knitted or crocheted, containing less than 36 percent by weight of flax fibers
65,922,680 62,863,566 54,867,719 40,478,566 50,523,252 50,952,771 -5.02%
EXPORTACIONES DE REP DOMINICANA A EU. SECTOR CONFECCIONESSUBPARTID
A 10 DIG PRODUCTO US $
Fuente: US INTERNATIONAL TRADE COMMISSION
Para el año 2004, las exportaciones más significativas del sector de las confecciones fueron los pantalones largos, con peto y cortos de algodón de la subpartida 6203424015, las cuales fueron de US$ 312 millones, con una variación promedio anual del 1.65%.
Dentro de las principales exportaciones del sector para el año 2004, la que presentó una mayor variación porcentual anual fue la subpartida 6203424010 correspondiente a los pantalones de hombre de dril azul.
Las exportaciones de estos 10 productos, representan el 56% de total de las exportaciones de este sector en el año 2004, tal como se observa en el siguiente gráfico.
COMERCIO BILATERAL ENTRE REPUBLICA DOMINICANA Y ESTADOS UNIDOS VI-64

PRINCIPALES EXPORTACIONES DE REPÚBLICA DOMINICANA A 10 DIGITOS SECTOR
CONFECCIONES AÑO 2004
14.80%
43.85%
3.28%
6.68%
4.32%
7.24%
2.80%2.66%
2.47%2.42%
2.20%
7.27%
62034240156203434010621210902061071100106115929000620462402062034240106108229020610711002061102020756109100004OTROS
Fuente: US INTERNATIONAL TRADE COMMISSION
C12. Sector calzado. El sector calzado, esta conformado por 1 capítulo, de acuerdo con la siguiente tabla:
CAPITULO DESCRIPCION64 CALZADO
SECTOR CALZADO
C12a. Balanza comercial del sector. Para el caso del sector del calzado, las exportaciones de la RD en los diferentes años analizados son mayores que las importaciones, presentando una balanza comercial para el año 2004 de US$ 114.494.989.
1999 2000 2001 2002 2003 2004
Exportaciones 237,121,032 181,157,921 193,113,755 139,746,661 138,432,884 137,229,697Importaciones 57,374,751 53,792,377 51,215,384 29,708,451 27,397,359 22,734,708Balanza comercial 179,746,281 127,365,544 141,898,371 110,038,210 111,035,525 114,494,989
US $
BALANZA COMERCIAL DE REP. DOMINICANA CON EE.UU. : SECTOR CALZADO
Fuente: US INTERNATIONAL TRADE COMMISSION C12b. Principales importaciones del sector. Los principales productos importados por la RD de EEUU, del sector del calzado para el año 2004, se encuentran identificadas en la siguiente tabla:
COMERCIO BILATERAL ENTRE REPUBLICA DOMINICANA Y ESTADOS UNIDOS VI-65

1999 2000 2001 2002 2003 2004 % CAMBIO1999- 2004
1 6406999500
Footwear parts nesoi and accessories and parts nesoi, including gaiters and similar articles 19,507,258 37,713,662 30,484,618 11,050,829 17,880,967 9,361,563
-13.66%
2 6406100000Footwear uppers and upper parts except stiffeners 25,804,673 4,255,917 3,609,491 4,071,816 2,345,922 6,935,086
-23.11%
3 6406200000
Parts of footwear outer soles and heals of rubber or plastics 5,848,594 5,266,005 5,171,845 1,942,466 1,391,600 2,774,602
-13.86%
4 6402991815
Other footwear with outer soles and uppers of rubber/plastics uppers with external area >90% rubber/plastics tennis, basketball, gym shoes an the like - 93,537 4,353,082 6,621,219 2,921,209 521,875
53.69%
5 6405909000 Other footwear other nesoi 323,310 252,751 666,177 354,726 479,164 347,418 1.45%
6 6403993500
Footwear with uppers of leather and non-leather outer soles, footwear not covering the ankle, tennis, basketball, gym etc shoes for men, youth or boys 55,362 - 273,851 351,948 231,919 284,344
38.72%
7 6404110000
Footwear with uppers of textile materials and outer soles of rubber or plastics, sports footwear, including tennis, basketball, and gym shoes etc 66,424 73,012 351,265 718,898 497,595 225,965
27.74%
8 6402190000
Footwear with outer soles and uppers of rubber or plastics with uppers stitched etc to soles, sports footwear except ski-boots and cc ski footwear 71,300 57,333 168,729 38,772 50,189 224,091
25.74%
9 6403911500
Footwear with uppers of leather and non-leather outer soles, footwear covering the ankle, tennis, basketball, gym etc shoes for men, youth and boys 44,611 100,352 1,685,518 1,782,171 411,194 199,887
34.98%
10 6403594500
Footwear with uppers and outer soles of leather nesoi, footwear not covering the ankle, for women 1,667,338 591,584 335,244 369,569 191,353 179,330
-35.98%
IMPORTACIONES DE REP. DOMINICANA DESDE EU. SECTOR CALZADOSUBPARTID
A 10 DIG PRODUCTO US $
Fuente: US INTERNATIONAL TRADE COMMISSION Se destacan las importaciones de las partes y accesorios del calzado, con importaciones de US$ 9 millones para el año 2004, con una variación promedio anual de -13%, teniendo en cuenta que en años anteriores las importaciones de esta subpartida fueron mayores. Las importaciones de estos 10 productos en el año 2004, representan el 92% del total de las importaciones del sector, tal como se observa en la siguiente gráfica. Es importante destacar que las partes y accesorios del calzado (6406999500) y las partes superiores del calzado y sus partes (640610000), representaron el 70% del total de las importaciones del sector en el año 2004.
COMERCIO BILATERAL ENTRE REPUBLICA DOMINICANA Y ESTADOS UNIDOS VI-66

PRINCIPALES IMPORTACIONES DE REPUBLICA DOMINICANA DESDE EEUU A 10 DIGITOS
SECTOR CALZADO AÑO 2004
41.18%
30.50%
7.39%
0.79%0.88%
0.99%
0.99%
12.20%
1.53%2.30%
1.25%
6406999500640610000064062000006402991815640590900064039935006404110000640219000064039115006403594500OTROS
Fuente: US INTERNATIONAL TRADE COMMISSION
C12c. Principales exportaciones del sector: Las principales exportaciones de la RD a EEUU del sector calzado para el año 2004, se presentan en la siguiente tabla:
COMERCIO BILATERAL ENTRE REPUBLICA DOMINICANA Y ESTADOS UNIDOS VI-67

1999 2000 2001 2002 2003 2004 % CAMBIO1999- 2004
1
6406106500 Parts of footwear other uppers and parts thereof other than stiffeners of leather
166,065,907 107,723,877 104,822,013 62,971,669 61,988,028 57,783,971 -19.03%
2
6403999065 Footwear with outer soles of rubber or plastics and uppers of leather: other ftwr valued over $2.50/pair, exct ftwr with pigskin uppers, for women
12,891,607 8,209,784 8,964,812 6,267,165 7,426,984 18,500,229 7.49%
3
6403996075 Footwear with outer soles of rubber or plastics and uppers of leather: other footwear without pigskin uppers for men.
15,093,763 14,409,716 12,831,897 12,538,821 10,113,287 11,895,482 -4.65%
4
6403916075 Footwear with outer soles of rubber or plastics and uppers of leather: covering the ankle: other footwear for men except with pigskin uppers
2,195,220 4,996,922 2,345,926 6,812,818 8,238,639 9,830,057 34.96%
5
6403919045 Footwear with outer soles of rubber or plastics and uppers of leather: covering the ankle: other footwear for exect with pigskin uppers for women
1,785,766 1,759,771 9,536,302 3,863,978 2,525,884 5,097,708 23.34%
6
6404193020 Ftwr w upper of tex matl & outer sole rub/plas: ftwr w open toes or open heel slip-on >10% by wt r/p up of other, house slippers not covering ankle
0 314 179,557 1,804,039 4,727,346 4,667,698 1004.19%
7
6406100500 Parts of footwear formed uppers other than stiffeners, of composition leather for men youths and boys
232,644 4,272,838 4,846,287 5,032,397 7,429,380 2,851,978 65.08%
8
6404192030 Footwear with uppers of text matls and outer soles rub/plas: other ftwr worn over/in lieu of, to protect against water-chem-inclmnt weather for men
2,123,182 6,993,048 6,030,608 4,339,340 4,097,356 2,851,583 6.08%
9
6404193560 Footwear with outer soles rub/plastic (not for sports), slip-on etc footwear 10% or more (wt) rub/plastic, textile uppers, for women
1,897,753 1,874,147 890,272 1,331,999 1,613,361 2,733,955 7.57%
10
6406996000 Other parts of footwear, insoles, heel cushions, and simialr articles, of leather
937,690 684,134 355,191 1,146,863 2,058,646 1,844,703 14.49%
EXPORTACIONES DE REP DOMINICANA A EU. SECTOR CALZADOSUBPARTID
A 10 DIG PRODUCTO US $
Fuente: US INTERNATIONAL TRADE COMMISSION Las exportaciones más representativas del sector, correspondientes a la subpartida 6406106500, correspondientes a las partes superiores de calzado y sus partes, han tenido un decrecimiento en los últimos años, presentando una variación porcentual promedio del -19%. Las exportaciones de estos 10 productos, representan el 86% de total de las exportaciones de este sector en el año 2004, tal como se observa en el siguiente gráfico.
COMERCIO BILATERAL ENTRE REPUBLICA DOMINICANA Y ESTADOS UNIDOS VI-68

PRINCIPALES EXPORTACIONES DE REPÚBLICA DOMINICANA A 10 DIGITOS SECTOR CALZADO
AÑO 2004
42,11%3,40%
7,16%3,71%
8,67%
2,08%
2,08%1,99% 1,34%
13,97%
13,48%
6406106500640399906564039960756403916075640391904564041930206406100500640419203064041935606406996000OTROS
Fuente: US INTERNATIONAL TRADE COMMISSION C13. Sector manufacturas diversas. El sector de las manufacturas diversas, esta conformado por 7 capítulos, de acuerdo con la siguiente tabla:
CAPITULO DESCRIPCION65 SOMBREROS66 PARAGUAS, BASTONES,
FUSTAS, LATIGOS67 PLUMAS, FLORES
ARTIFICIALES Y MANUFACTURAS PARA EL CABELLO
92 INSTRUMENTOS MUSICALES95 JUGUETES Y JUEGOS96 MANUFACTURAS DIVERSAS97 OBJETO DE ARTE
SECTOR MANUFACTURAS DIVERSAS
C13a. Balanza comercial del sector. Se destacan las importaciones del capitulo correspondiente a las manufacturas diversas (capítulo 96), las cuales fueron de US$ 9 millones en el 2004; importaciones que han decrecido en los últimos años, presentando una variación promedio anual del – 3.38%. Respecto de las exportaciones de la RD a EEUU, el capitulo más representativo es el 65, correspondiente a los sombreros, los cuales registraron exportaciones por valor de US$ 27 millones en el 2004; exportaciones que han disminuido en los últimos años.
COMERCIO BILATERAL ENTRE REPUBLICA DOMINICANA Y ESTADOS UNIDOS VI-69

1999 2000 2001 2002 2003 2004 % CAMBIODESCRIPCI
ON 1999- 2004
Exportaciones65 SOMBRERO
S47,179,381 59,542,036 55,313,179 42,957,980 34,928,276 27,451,095 -10.27%
Importaciones65 SOMBRERO
S848,123 1,077,518 1,171,460 1,449,684 314,907 316,209 -17.91%
BALANZA 65 SOMBRERO
S 46,331,258 58,464,518 54,141,719 41,508,296 34,613,369 27,134,886-10.15%
Exportaciones
66 PARAGUAS, BASTONES, FUSTAS, LATIGOS
0 0 0 0 2,203 2,800 27.10%
Importaciones
66 PARAGUAS, BASTONES, FUSTAS, LATIGOS
14,830 211,505 534,681 393,809 119,095 101,665 46.96%
BALANZA
66 PARAGUAS, BASTONES, FUSTAS, LATIGOS
-14,830 -211,505 -534,681 -393,809 -116,892 -98,865
46.14%
Exportaciones
67 PLUMAS, FLORES ARTIFICIALES Y MANUFACTURAS PARA EL CABELLO
719,542 417,475 441,548 184,718 334,930 376,656 -12.14%
Importaciones
67 PLUMAS, FLORES ARTIFICIALES Y MANUFACTURAS PARA EL CABELLO
465,238 482,272 1,154,139 1,161,175 476,078 406,024 -2.69%
BALANZA 254,304 -64,797 -712,591 -976,457 -141,148 -29,368 -22%
Exportaciones
92 INSTRUMENTOS MUSICALES
23,513 48,157 16,684 3,390 0 39,014 10.66%
Importaciones
92 INSTRUMENTOS MUSICALES
277,988 175,598 567,591 1,540,053 670,158 426,562 8.94%
BALANZA
92 INSTRUMENTOS MUSICALES
-254,475 -127,441 -550,907 -1,536,663 -670,158 -387,548
8.78%
Exportaciones95 JUGUETES
Y JUEGOS4,841,917 6,606,806 6,824,651 5,396,124 4,874,674 3,323,058 -7.25%
Importaciones95 JUGUETES
Y JUEGOS7,568,236 10,482,150 8,383,216 11,817,237 11,920,121 6,624,954 -2.63%
BALANZA 95 JUGUETES
Y JUEGOS -2,726,319 -3,875,344 -1,558,565 -6,421,113 -7,045,447 -3,301,8963.91%
Exportaciones
96 MANUFACTURAS DIVERSAS
4,846,242 4,653,876 3,097,485 3,297,108 2,709,429 2,955,406 -9.42%
Importaciones
96 MANUFACTURAS DIVERSAS
11,929,117 17,916,564 14,506,000 15,504,622 11,553,894 9,993,402 -3.48%
BALANZA
96 MANUFACTURAS DIVERSAS -7,082,875 -13,262,688 -11,408,515 -12,207,514 -8,844,465 -7,037,996
-0.13%
Exportaciones97 OBJETO DE
ARTE217,160 348,377 318,091 420,525 354,600 191,143 -2.52%
Importaciones97 OBJETO DE
ARTE421,335 166,985 1,303,152 594,702 160,431 245,916 -10.21%
BALANZA 97 OBJETO DE
ARTE -204,175 181,392 -985,061 -174,177 194,169 -54,773-23.14%
BALANZA COMERCIAL DE REP. DOMINICANA CON EE.UU. : SECTOR MANUFACTURAS DIVERSAS
CAPITULO US $
Fuente: U.S. International Trade Commission.
COMERCIO BILATERAL ENTRE REPUBLICA DOMINICANA Y ESTADOS UNIDOS VI-70
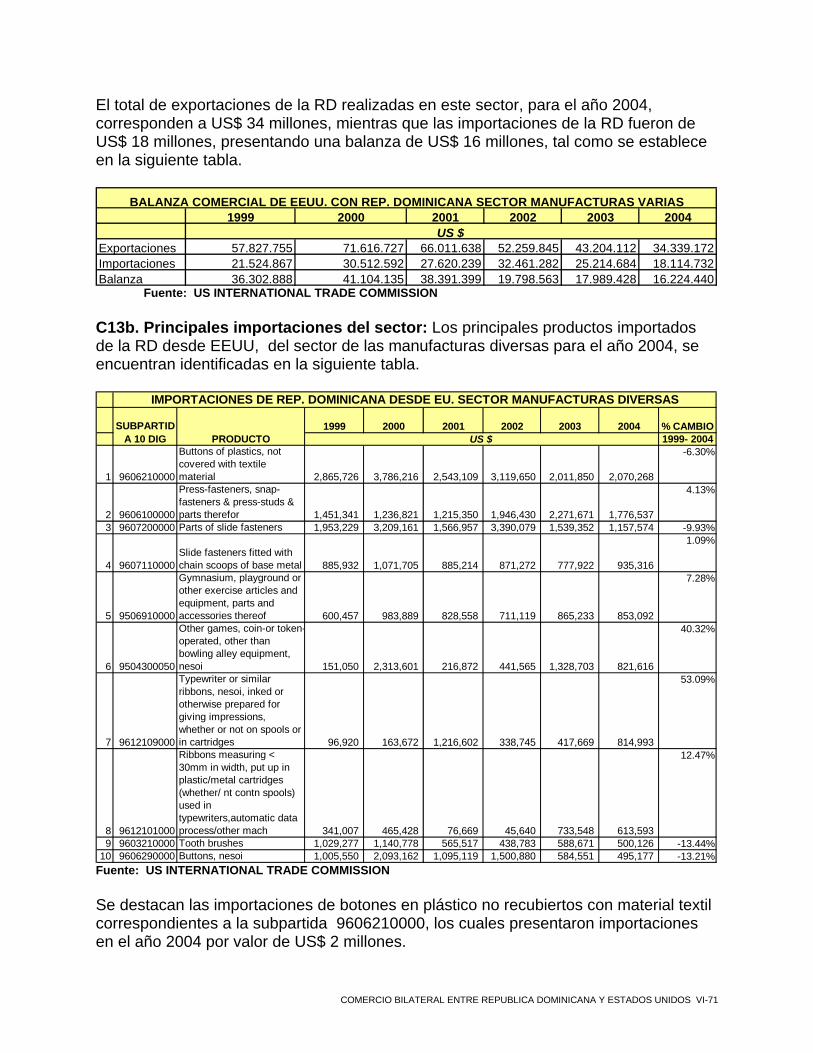
El total de exportaciones de la RD realizadas en este sector, para el año 2004, corresponden a US$ 34 millones, mientras que las importaciones de la RD fueron de US$ 18 millones, presentando una balanza de US$ 16 millones, tal como se establece en la siguiente tabla.
1999 2000 2001 2002 2003 2004
Exportaciones 57.827.755 71.616.727 66.011.638 52.259.845 43.204.112 34.339.172Importaciones 21.524.867 30.512.592 27.620.239 32.461.282 25.214.684 18.114.732Balanza 36.302.888 41.104.135 38.391.399 19.798.563 17.989.428 16.224.440
US $
BALANZA COMERCIAL DE EEUU. CON REP. DOMINICANA SECTOR MANUFACTURAS VARIAS
Fuente: US INTERNATIONAL TRADE COMMISSION
C13b. Principales importaciones del sector: Los principales productos importados de la RD desde EEUU, del sector de las manufacturas diversas para el año 2004, se encuentran identificadas en la siguiente tabla.
1999 2000 2001 2002 2003 2004 % CAMBIO1999- 2004
1 9606210000
Buttons of plastics, not covered with textile material 2,865,726 3,786,216 2,543,109 3,119,650 2,011,850 2,070,268
-6.30%
2 9606100000
Press-fasteners, snap-fasteners & press-studs & parts therefor 1,451,341 1,236,821 1,215,350 1,946,430 2,271,671 1,776,537
4.13%
3 9607200000 Parts of slide fasteners 1,953,229 3,209,161 1,566,957 3,390,079 1,539,352 1,157,574 -9.93%
4 9607110000Slide fasteners fitted with chain scoops of base metal 885,932 1,071,705 885,214 871,272 777,922 935,316
1.09%
5 9506910000
Gymnasium, playground or other exercise articles and equipment, parts and accessories thereof 600,457 983,889 828,558 711,119 865,233 853,092
7.28%
6 9504300050
Other games, coin-or token-operated, other than bowling alley equipment, nesoi 151,050 2,313,601 216,872 441,565 1,328,703 821,616
40.32%
7 9612109000
Typewriter or similar ribbons, nesoi, inked or otherwise prepared for giving impressions, whether or not on spools or in cartridges 96,920 163,672 1,216,602 338,745 417,669 814,993
53.09%
8 9612101000
Ribbons measuring < 30mm in width, put up in plastic/metal cartridges (whether/ nt contn spools) used in typewriters,automatic data process/other mach 341,007 465,428 76,669 45,640 733,548 613,593
12.47%
9 9603210000 Tooth brushes 1,029,277 1,140,778 565,517 438,783 588,671 500,126 -13.44%10 9606290000 Buttons, nesoi 1,005,550 2,093,162 1,095,119 1,500,880 584,551 495,177 -13.21%
IMPORTACIONES DE REP. DOMINICANA DESDE EU. SECTOR MANUFACTURAS DIVERSAS
SUBPARTIDA 10 DIG PRODUCTO US $
Fuente: US INTERNATIONAL TRADE COMMISSION
Se destacan las importaciones de botones en plástico no recubiertos con material textil correspondientes a la subpartida 9606210000, los cuales presentaron importaciones en el año 2004 por valor de US$ 2 millones.
COMERCIO BILATERAL ENTRE REPUBLICA DOMINICANA Y ESTADOS UNIDOS VI-71
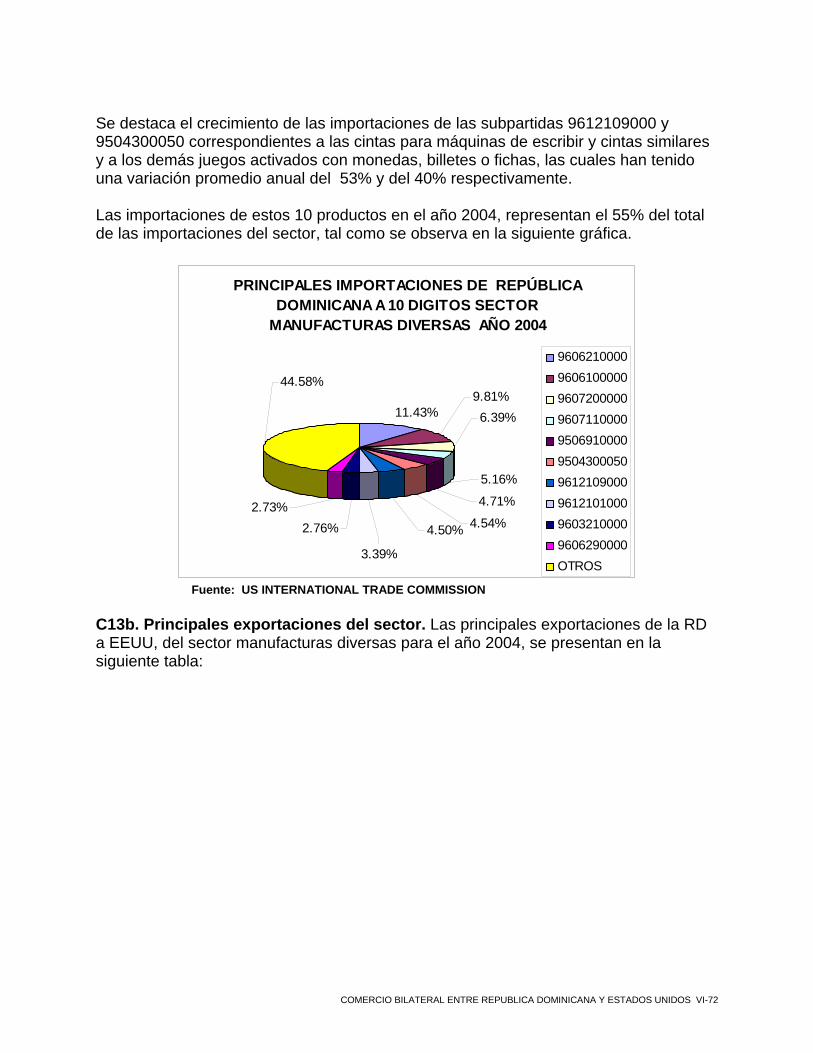
Se destaca el crecimiento de las importaciones de las subpartidas 9612109000 y 9504300050 correspondientes a las cintas para máquinas de escribir y cintas similares y a los demás juegos activados con monedas, billetes o fichas, las cuales han tenido una variación promedio anual del 53% y del 40% respectivamente. Las importaciones de estos 10 productos en el año 2004, representan el 55% del total de las importaciones del sector, tal como se observa en la siguiente gráfica.
PRINCIPALES IMPORTACIONES DE REPÚBLICA DOMINICANA A 10 DIGITOS SECTOR
MANUFACTURAS DIVERSAS AÑO 2004
11.43%
4.54%
5.16%
4.71%
6.39%
4.50%
3.39%
2.76%2.73%
44.58%9.81%
9606210000960610000096072000009607110000950691000095043000509612109000961210100096032100009606290000OTROS
Fuente: US INTERNATIONAL TRADE COMMISSION
C13b. Principales exportaciones del sector. Las principales exportaciones de la RD a EEUU, del sector manufacturas diversas para el año 2004, se presentan en la siguiente tabla:
COMERCIO BILATERAL ENTRE REPUBLICA DOMINICANA Y ESTADOS UNIDOS VI-72
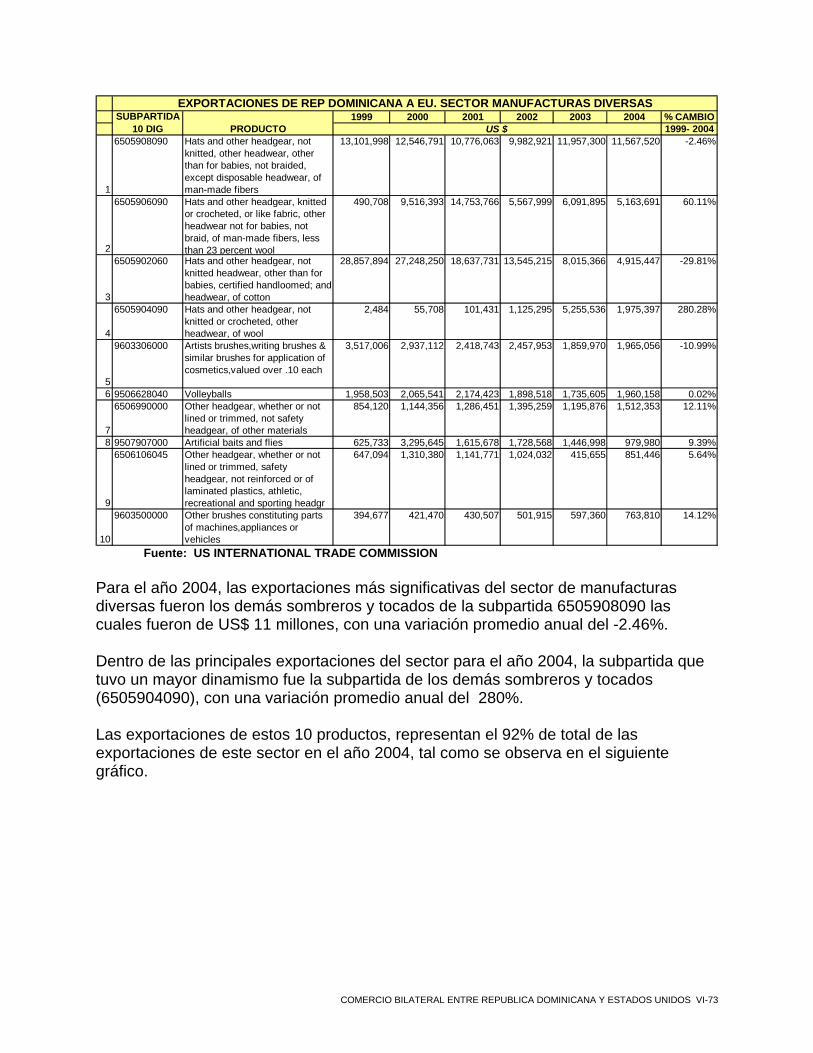
1999 2000 2001 2002 2003 2004 % CAMBIO1999- 2004
1
6505908090 Hats and other headgear, not knitted, other headwear, other than for babies, not braided, except disposable headwear, of man-made fibers
13,101,998 12,546,791 10,776,063 9,982,921 11,957,300 11,567,520 -2.46%
2
6505906090 Hats and other headgear, knitted or crocheted, or like fabric, other headwear not for babies, not braid, of man-made fibers, less than 23 percent wool
490,708 9,516,393 14,753,766 5,567,999 6,091,895 5,163,691 60.11%
3
6505902060 Hats and other headgear, not knitted headwear, other than for babies, certified handloomed; and headwear, of cotton
28,857,894 27,248,250 18,637,731 13,545,215 8,015,366 4,915,447 -29.81%
4
6505904090 Hats and other headgear, not knitted or crocheted, other headwear, of wool
2,484 55,708 101,431 1,125,295 5,255,536 1,975,397 280.28%
5
9603306000 Artists brushes,writing brushes & similar brushes for application of cosmetics,valued over .10 each
3,517,006 2,937,112 2,418,743 2,457,953 1,859,970 1,965,056 -10.99%
6 9506628040 Volleyballs 1,958,503 2,065,541 2,174,423 1,898,518 1,735,605 1,960,158 0.02%
7
6506990000 Other headgear, whether or not lined or trimmed, not safety headgear, of other materials
854,120 1,144,356 1,286,451 1,395,259 1,195,876 1,512,353 12.11%
8 9507907000 Artificial baits and flies 625,733 3,295,645 1,615,678 1,728,568 1,446,998 979,980 9.39%
9
6506106045 Other headgear, whether or not lined or trimmed, safety headgear, not reinforced or of laminated plastics, athletic, recreational and sporting headgr
647,094 1,310,380 1,141,771 1,024,032 415,655 851,446 5.64%
10
9603500000 Other brushes constituting parts of machines,appliances or vehicles
394,677 421,470 430,507 501,915 597,360 763,810 14.12%
EXPORTACIONES DE REP DOMINICANA A EU. SECTOR MANUFACTURAS DIVERSASSUBPARTIDA
10 DIG PRODUCTO US $
Fuente: US INTERNATIONAL TRADE COMMISSION
Para el año 2004, las exportaciones más significativas del sector de manufacturas diversas fueron los demás sombreros y tocados de la subpartida 6505908090 las cuales fueron de US$ 11 millones, con una variación promedio anual del -2.46%.
Dentro de las principales exportaciones del sector para el año 2004, la subpartida que tuvo un mayor dinamismo fue la subpartida de los demás sombreros y tocados (6505904090), con una variación promedio anual del 280%.
Las exportaciones de estos 10 productos, representan el 92% de total de las exportaciones de este sector en el año 2004, tal como se observa en el siguiente gráfico.
COMERCIO BILATERAL ENTRE REPUBLICA DOMINICANA Y ESTADOS UNIDOS VI-73
PRINCIPALES EXPORTACIONES DE REPUBLICA DOMINICANA A 10 DIGITOS SECTOR
MANUFACTURAS DIVERSAS AÑO 2004
33.69%
15.04%
7.82%
2.22%
2.48%2.85%
4.40%
14.31%
5.72%5.75%
5.71%
6505908090
6505906090
6505902060
6505904090
9603306000
9506628040
6506990000
9507907000
6506106045
9603500000
OTROS
Fuente: US INTERNATIONAL TRADE COMMISSION C14. Sector minerales no metálicos. El sector de los minerales no metálicos, esta conformado por 3 capítulos, de acuerdo con la siguiente tabla.
SECTOR MINERALES NO METALICOSCAPITULO DESCRIPCION
68 MANUFACTURAS DE PIEDRA, YESO, CEMENTO
69 PRODUCTOS CERAMICOS
70 VIDRIO Y SUS MANUFACTURAS
C14a. Balanza comercial del sector. Se destacan las importaciones del capitulo correspondiente al vidrio y sus manufacturas (capítulo 70), las cuales fueron de US$ 20 millones en el 2004, presentando una variación promedio anual del – 0.11%. Respecto de las exportaciones de la RD a EEUU, el capitulo más representativo es el 69, correspondiente a los productos cerámicos, los cuales registraron exportaciones por valor de US$ 34 millones en el 2004; exportaciones que han tenido un crecimiento importante en los últimos años.
COMERCIO BILATERAL ENTRE REPUBLICA DOMINICANA Y ESTADOS UNIDOS VI-74

1999 2000 2001 2002 2003 2004 % CAMBIODESCRIPCION 1999- 2004
Exportaciones
68 MANUFACTURAS DE PIEDRA, YESO, CEMENTO
1,054,107 1,485,002 1,836,855 2,265,465 2,987,878 3,556,763 27.54%
Importaciones
68 MANUFACTURAS DE PIEDRA, YESO, CEMENTO
4,449,500 8,189,088 10,709,291 6,369,991 5,621,546 3,699,092 -3.63%
BALANZA
68 MANUFACTURAS DE PIEDRA, YESO, CEMENTO -3,395,393 -6,704,086 -8,872,436 -4,104,526 -2,633,668 -142,329
-46.98%
Exportaciones69 PRODUCTOS
CERAMICOS5,858,243 8,014,437 7,536,311 7,401,023 15,664,534 34,190,599 42.31%
Importaciones69 PRODUCTOS
CERAMICOS5,759,802 3,435,150 3,771,986 3,562,264 5,070,963 5,673,817 -0.30%
BALANZA 69 PRODUCTOS
CERAMICOS 98,441 4,579,287 3,764,325 3,838,759 10,593,571 28,516,782210.73%
Exportaciones70 VIDRIO Y SUS
MANUFACTURAS273,236 162,100 93,922 175,066 1,595,366 204,059 -5.67%
Importaciones70 VIDRIO Y SUS
MANUFACTURAS20,705,636 19,948,694 17,284,931 13,981,209 13,760,715 20,591,147 -0.11%
BALANZA 70 VIDRIO Y SUS
MANUFACTURAS -20,432,400 -19,786,594 -17,191,009 -13,806,143 -12,165,349 -20,387,088-0.04%
CAPITULO US $
BALANZA COMERCIAL DE REP. DOMINICANA CON EE.UU. : SECTOR MINERALES NO METALICOS
Fuente: US INTERNATIONAL TRADE COMMISSION El total de las exportaciones de la RD a EEUU realizadas en este sector, para el año 2004, corresponden a US$ 29 millones, mientras que las importaciones de la RD fueron de US$ 37 millones, presentando una balanza de US$ 7 millones, tal como se establece en la siguiente tabla.
1999 2000 2001 2002 2003 2004
Exportaciones 30,914,938 31,572,932 31,766,208 23,913,464 24,453,224 29,964,056Importaciones 7,185,586 9,661,539 9,467,088 9,841,554 20,247,778 37,951,421BALANZA 23,729,352 21,911,393 22,299,120 14,071,910 4,205,446 -7,987,365
US $
BALANZA COMERCIAL DE REP. DOMINICANA CON EE.UU. : SECTOR MINERALES NO METALICOS
Fuente: US INTERNATIONAL TRADE COMMISSION
C14b. Principales importaciones del sector. Los principales productos importados de la RD del sector de los minerales no metálicos para el año 2004, se encuentran identificadas en la siguiente tabla.
COMERCIO BILATERAL ENTRE REPUBLICA DOMINICANA Y ESTADOS UNIDOS VI-75
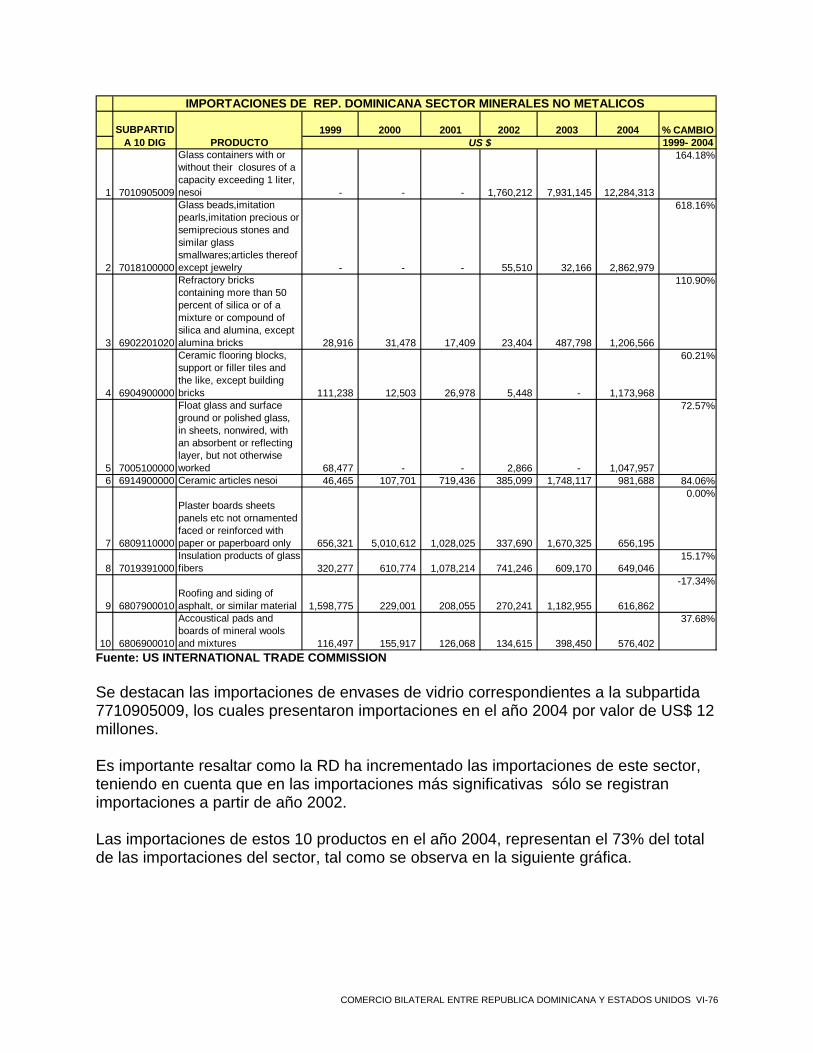
1999 2000 2001 2002 2003 2004 % CAMBIO1999- 2004
1 7010905009
Glass containers with or without their closures of a capacity exceeding 1 liter, nesoi - - - 1,760,212 7,931,145 12,284,313
164.18%
2 7018100000
Glass beads,imitation pearls,imitation precious or semiprecious stones and similar glass smallwares;articles thereof except jewelry - - - 55,510 32,166 2,862,979
618.16%
3 6902201020
Refractory bricks containing more than 50 percent of silica or of a mixture or compound of silica and alumina, except alumina bricks 28,916 31,478 17,409 23,404 487,798 1,206,566
110.90%
4 6904900000
Ceramic flooring blocks, support or filler tiles and the like, except building bricks 111,238 12,503 26,978 5,448 - 1,173,968
60.21%
5 7005100000
Float glass and surface ground or polished glass, in sheets, nonwired, with an absorbent or reflecting layer, but not otherwise worked 68,477 - - 2,866 - 1,047,957
72.57%
6 6914900000 Ceramic articles nesoi 46,465 107,701 719,436 385,099 1,748,117 981,688 84.06%
7 6809110000
Plaster boards sheets panels etc not ornamented faced or reinforced with paper or paperboard only 656,321 5,010,612 1,028,025 337,690 1,670,325 656,195
0.00%
8 7019391000Insulation products of glass fibers 320,277 610,774 1,078,214 741,246 609,170 649,046
15.17%
9 6807900010Roofing and siding of asphalt, or similar material 1,598,775 229,001 208,055 270,241 1,182,955 616,862
-17.34%
10 6806900010
Accoustical pads and boards of mineral wools and mixtures 116,497 155,917 126,068 134,615 398,450 576,402
37.68%
IMPORTACIONES DE REP. DOMINICANA SECTOR MINERALES NO METALICOS
SUBPARTIDA 10 DIG PRODUCTO US $
Fuente: US INTERNATIONAL TRADE COMMISSION Se destacan las importaciones de envases de vidrio correspondientes a la subpartida 7710905009, los cuales presentaron importaciones en el año 2004 por valor de US$ 12 millones. Es importante resaltar como la RD ha incrementado las importaciones de este sector, teniendo en cuenta que en las importaciones más significativas sólo se registran importaciones a partir de año 2002. Las importaciones de estos 10 productos en el año 2004, representan el 73% del total de las importaciones del sector, tal como se observa en la siguiente gráfica.
COMERCIO BILATERAL ENTRE REPUBLICA DOMINICANA Y ESTADOS UNIDOS VI-76

PRINCIPALES IMPORTACIONES DE REPUBLICA DOMINICANA DE E.U. A 10 DIGITOS SECTOR
MINERALES NO METALICOS AÑO 2004
41.00%
9.55%2.19%
2.17%
26.39%
3.50%3.28%
3.92% 4.03%
2.06%
1.92%
7010905009701810000069022010206904900000700510000069149000006809110000701939100068079000106806900010Otros
Fuente: US INTERNATIONAL TRADE COMMISSION
C14c. Principales exportaciones del sector. Las principales exportaciones de la RD a EEUU del sector de los minerales no metálicos para el año 2004, se presentan en la siguiente tabla.
Para el año 2004, las exportaciones más significativas del sector de los minerales no metálicos fueron las virolas de cerámica de porcelain o china de la subpartida 6914104000, las cuales fueron por valor de US$ 22 millones, con una variación promedio anual del 272%.
COMERCIO BILATERAL ENTRE REPUBLICA DOMINICANA Y ESTADOS UNIDOS VI-77

1999 2000 2001 2002 2003 2004 % CAMBIO1999- 2004
1
6914104000 Ceramic ferrules of procelain or china, nov 3mm diam or 25 mm long, fiber channel opening and/or ceramic mating sleeves of alumina or zirconia
0 0 0 0 5,970,545 22,262,437 272.87%
2
6910900000 Ceramic sinks, washbasins, washbasin pedestals, baths, bidets, water closet bowls, flush tanks, urinals and similar sanitary fixt oth thn porceln/chna
238,053 315,174 119,868 2,741,053 840,410 4,076,863 76.49%
36913905000 Ornamental ceramic
articles nesoi1,320,221 1,867,151 690,312 875,136 1,774,689 1,622,130 4.20%
46910100020 Other water closet bowls,
porcelain or china nesoi41,605 44,205 52,034 35,888 453,058 1,242,127 97.24%
56910100015 Flush tanks of porcelain or
china2,114 0 0 0 1,018,122 1,092,136 248.85%
66910100030 Sinks and lavatories of
porcelain or china313,464 568,452 516,185 983,978 1,133,707 1,038,642 27.07%
7 6914908000 Ceramic articles nesoi 778,363 559,766 433,022 461,933 615,246 828,462 1.26%
8
6910100050 Sanitary fixtures of porcelain or china, nesoi (other than water closet bowls, flush tanks, sinks and lavatories)
2,006,827 3,266,431 3,856,446 514,765 866,888 742,863 -18.03%
9 6802990060 Other stone, nesoi 243,098 528,869 262,857 185,608 53,655 681,448 22.89%
10
6802220000 Other calcareous monumental or building stone smply cut or sawn
162,472 133,300 285,044 728,790 752,923 572,953 28.67%
EXPORTACIONES DE REP. DOMINICANA A E.U. SECTOR MINERALES NO METALICOSSUBPARTIDA
10 DIG PRODUCTO US $
Fuente: US INTERNATIONAL TRADE COMMISSION Las exportaciones de estos 10 productos, representan el 56% de total de las exportaciones de este sector en el año 2004, tal como se observa en el siguiente gráfico.
PRINCIPALES EXPORTACIONES DE REPUBLICA DOMINICANA A 10 DIGITOS SECTOR MINERALES NO
METALICOS AÑO 2004
58.66%
2.74%
3.27%
4.27%
1.80% 1.51%
9.99%
1.96%
2.88%
10.74%
2.18%
6914104000691090000069139050006910100020691010001569101000306914908000691010005068029900606802220000OTROS
Fuente: US INTERNATIONAL TRADE COMMISSION
COMERCIO BILATERAL ENTRE REPUBLICA DOMINICANA Y ESTADOS UNIDOS VI-78
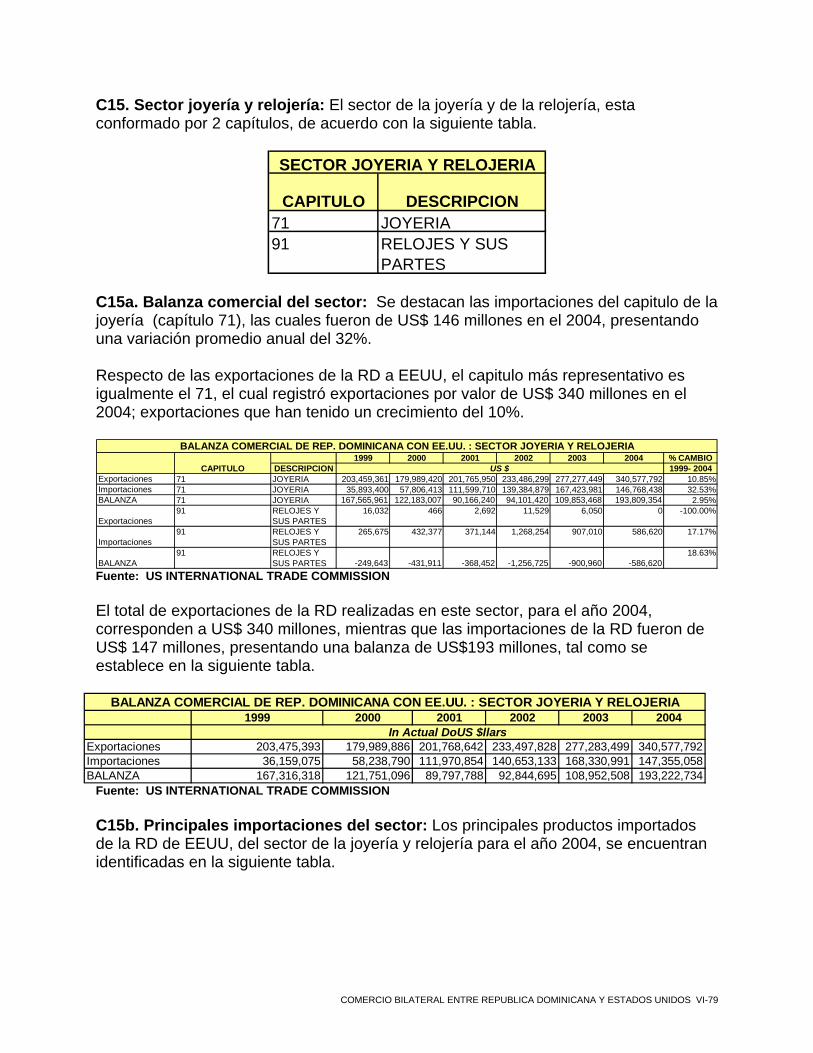
C15. Sector joyería y relojería: El sector de la joyería y de la relojería, esta conformado por 2 capítulos, de acuerdo con la siguiente tabla.
CAPITULO DESCRIPCION71 JOYERIA91 RELOJES Y SUS
PARTES
SECTOR JOYERIA Y RELOJERIA
C15a. Balanza comercial del sector: Se destacan las importaciones del capitulo de la joyería (capítulo 71), las cuales fueron de US$ 146 millones en el 2004, presentando una variación promedio anual del 32%. Respecto de las exportaciones de la RD a EEUU, el capitulo más representativo es igualmente el 71, el cual registró exportaciones por valor de US$ 340 millones en el 2004; exportaciones que han tenido un crecimiento del 10%.
1999 2000 2001 2002 2003 2004 % CAMBIO
DESCRIPCION 1999- 2004Exportaciones 71 JOYERIA 203,459,361 179,989,420 201,765,950 233,486,299 277,277,449 340,577,792 10.85%Importaciones 71 JOYERIA 35,893,400 57,806,413 111,599,710 139,384,879 167,423,981 146,768,438 32.53%BALANZA 71 JOYERIA 167,565,961 122,183,007 90,166,240 94,101,420 109,853,468 193,809,354 2.95%
Exportaciones91 RELOJES Y
SUS PARTES16,032 466 2,692 11,529 6,050 0 -100.00%
Importaciones91 RELOJES Y
SUS PARTES265,675 432,377 371,144 1,268,254 907,010 586,620 17.17%
BALANZA 91 RELOJES Y
SUS PARTES -249,643 -431,911 -368,452 -1,256,725 -900,960 -586,62018.63%
BALANZA COMERCIAL DE REP. DOMINICANA CON EE.UU. : SECTOR JOYERIA Y RELOJERIA
CAPITULO US $
Fuente: US INTERNATIONAL TRADE COMMISSION El total de exportaciones de la RD realizadas en este sector, para el año 2004, corresponden a US$ 340 millones, mientras que las importaciones de la RD fueron de US$ 147 millones, presentando una balanza de US$193 millones, tal como se establece en la siguiente tabla.
1999 2000 2001 2002 2003 2004
Exportaciones 203,475,393 179,989,886 201,768,642 233,497,828 277,283,499 340,577,792Importaciones 36,159,075 58,238,790 111,970,854 140,653,133 168,330,991 147,355,058BALANZA 167,316,318 121,751,096 89,797,788 92,844,695 108,952,508 193,222,734
In Actual DoUS $llars
BALANZA COMERCIAL DE REP. DOMINICANA CON EE.UU. : SECTOR JOYERIA Y RELOJERIA
Fuente: US INTERNATIONAL TRADE COMMISSION
C15b. Principales importaciones del sector: Los principales productos importados de la RD de EEUU, del sector de la joyería y relojería para el año 2004, se encuentran identificadas en la siguiente tabla.
COMERCIO BILATERAL ENTRE REPUBLICA DOMINICANA Y ESTADOS UNIDOS VI-79

1999 2000 2001 2002 2003 2004 % CAMBIO1999- 2004
1 7113190000Jewelry and parts thereof, of precious metal other than silver 19,025,228 19,006,021 77,277,948 90,080,118 86,016,061 43,723,424
18.11%
2 7113110000Jewelry and parts thereof, of silver 815,823 2,856,767 702,203 10,375,710 13,816,832 27,945,148
102.74%
3 7108135000Gold, semimanufactured, nesoi, nonmonetary 9,143,069 7,437,211 13,609,218 16,593,765 26,049,365 17,423,036
13.76%
4 7114190000
Articles of gold or platinum whether or not plated or clad with precious metal - - 1,422,606 7,114,396 9,883,999 16,344,125
125.64%
5 7117900000Imitation jewelry not of base metal 142,208 609,564 1,694,919 3,880,975 11,205,596 15,473,419
155.47%
6 7117190000Other imitation jewelry, base metal, inc precious metal plated 34,249 185,875 895,972 4,178,367 6,012,229 9,509,259
208.11%
7 7113200000Jewelry and parts, base metal clad w precious metal 3,125,410 1,276,360 2,120,261 2,173,648 1,586,786 8,975,375
23.49%
8 7116204050Articles of precious or semiprecious stones, not jewelry 22,112 39,536 367,647 307,004 2,522,777 1,334,570
127.06%
9 7106915000 Unwrought silver, nesoi 890,084 1,061,849 788,675 202,416 595,842 1,314,241 8.11%
10 7102390010
Diamonds except industrial, cut, faceted, set or mounted weighing not over 0.5 carat each 102,775 89,763 82,000 76,480 4,049,472 1,162,222
62.44%
SUBPARTIDA 10 DIG PRODUCTO US $
IMPORTACIONES DE REP. DOMINICANA DESDE EU. SECTOR JOYERIA Y RELOJERIA
Fuente: US INTERNATIONAL TRADE COMMISSION Se destacan las importaciones de los demás metales preciosos, incluso revestidos o chapados de metal precioso (plaqué) correspondientes a la subpartida 7113190000, los cuales presentaron importaciones en el año 2004 por valor de US$ 43 millones. Se destaca el crecimiento de las importaciones de las imitaciones de joyería, la cual ha tenido una variación promedio anual de 155%. Las importaciones de estos 10 productos en el año 2004, representan el 97% del total de las importaciones del sector, tal como se observa en la siguiente gráfica.
COMERCIO BILATERAL ENTRE REPUBLICA DOMINICANA Y ESTADOS UNIDOS VI-80
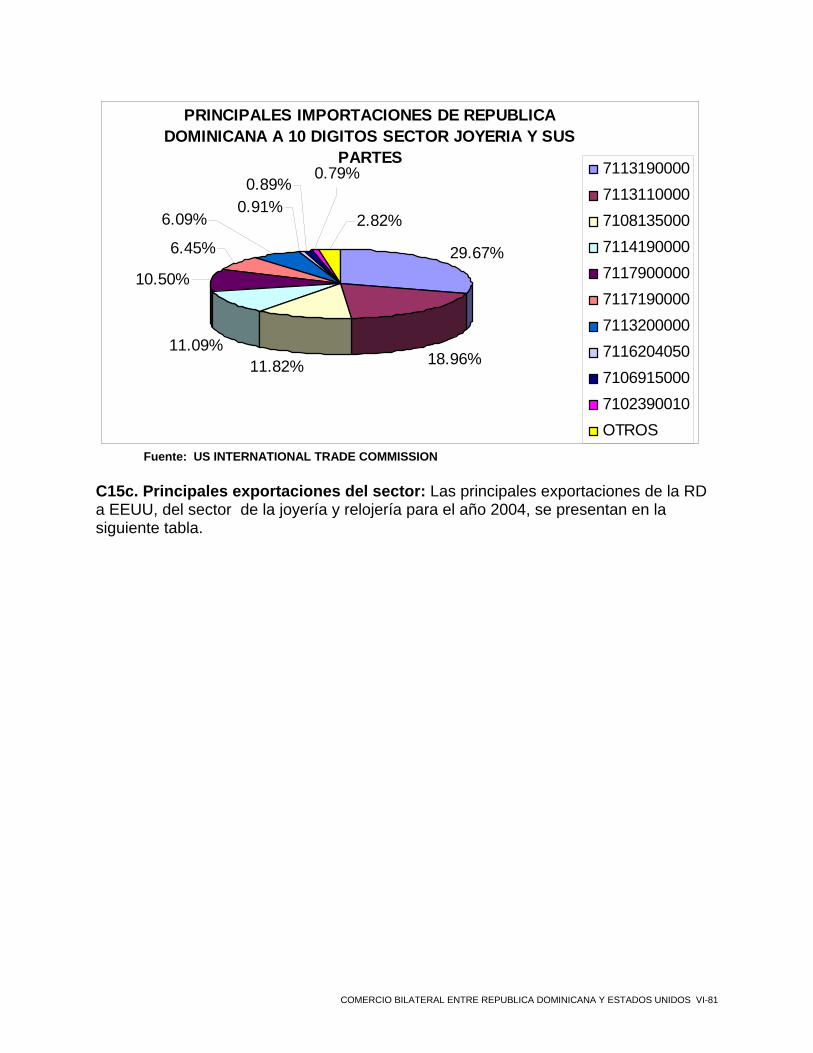
PRINCIPALES IMPORTACIONES DE REPUBLICA DOMINICANA A 10 DIGITOS SECTOR JOYERIA Y SUS
PARTES
29.67%
18.96%11.82%11.09%
10.50%
6.45%
0.91%6.09%
0.89%0.79%
2.82%
7113190000711311000071081350007114190000711790000071171900007113200000711620405071069150007102390010OTROS
Fuente: US INTERNATIONAL TRADE COMMISSION
C15c. Principales exportaciones del sector: Las principales exportaciones de la RD a EEUU, del sector de la joyería y relojería para el año 2004, se presentan en la siguiente tabla.
COMERCIO BILATERAL ENTRE REPUBLICA DOMINICANA Y ESTADOS UNIDOS VI-81
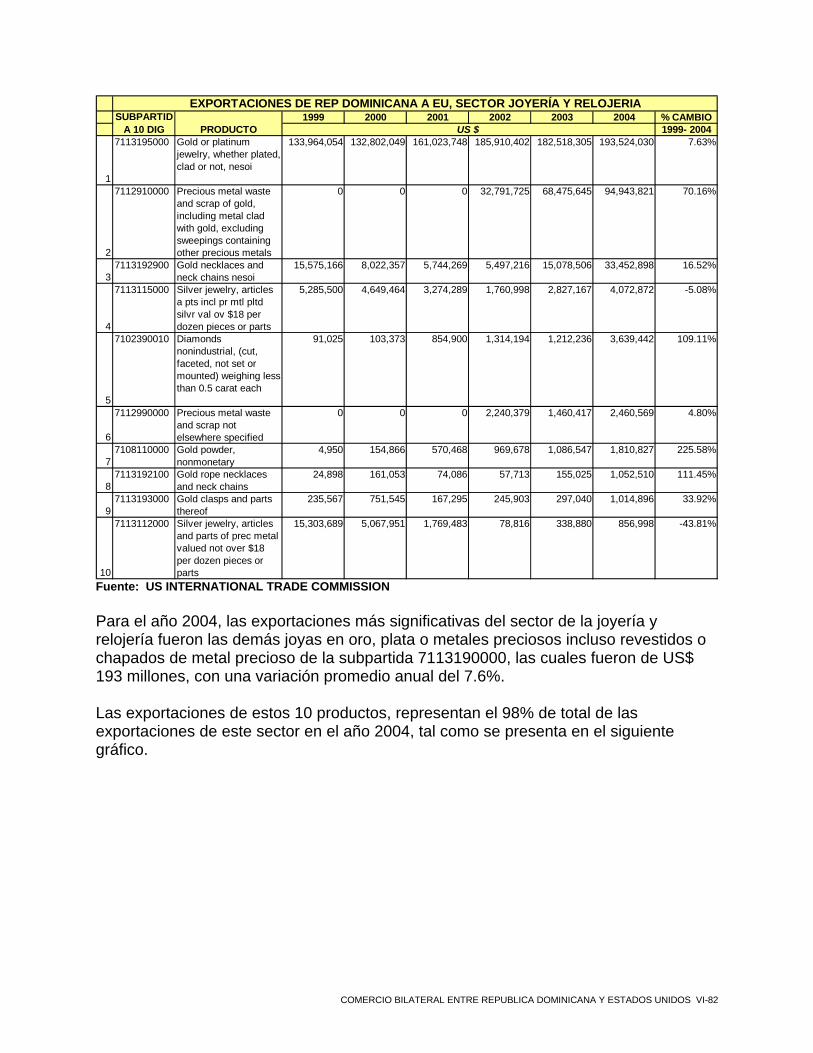
1999 2000 2001 2002 2003 2004 % CAMBIO1999- 2004
1
7113195000 Gold or platinum jewelry, whether plated, clad or not, nesoi
133,964,054 132,802,049 161,023,748 185,910,402 182,518,305 193,524,030 7.63%
2
7112910000 Precious metal waste and scrap of gold, including metal clad with gold, excluding sweepings containing other precious metals
0 0 0 32,791,725 68,475,645 94,943,821 70.16%
37113192900 Gold necklaces and
neck chains nesoi15,575,166 8,022,357 5,744,269 5,497,216 15,078,506 33,452,898 16.52%
4
7113115000 Silver jewelry, articles a pts incl pr mtl pltd silvr val ov $18 per dozen pieces or parts
5,285,500 4,649,464 3,274,289 1,760,998 2,827,167 4,072,872 -5.08%
5
7102390010 Diamonds nonindustrial, (cut, faceted, not set or mounted) weighing less than 0.5 carat each
91,025 103,373 854,900 1,314,194 1,212,236 3,639,442 109.11%
6
7112990000 Precious metal waste and scrap not elsewhere specified
0 0 0 2,240,379 1,460,417 2,460,569 4.80%
77108110000 Gold powder,
nonmonetary4,950 154,866 570,468 969,678 1,086,547 1,810,827 225.58%
87113192100 Gold rope necklaces
and neck chains24,898 161,053 74,086 57,713 155,025 1,052,510 111.45%
97113193000 Gold clasps and parts
thereof235,567 751,545 167,295 245,903 297,040 1,014,896 33.92%
10
7113112000 Silver jewelry, articles and parts of prec metal valued not over $18 per dozen pieces or parts
15,303,689 5,067,951 1,769,483 78,816 338,880 856,998 -43.81%
EXPORTACIONES DE REP DOMINICANA A EU, SECTOR JOYERÍA Y RELOJERIASUBPARTID
A 10 DIG PRODUCTO US $
Fuente: US INTERNATIONAL TRADE COMMISSION
Para el año 2004, las exportaciones más significativas del sector de la joyería y relojería fueron las demás joyas en oro, plata o metales preciosos incluso revestidos o chapados de metal precioso de la subpartida 7113190000, las cuales fueron de US$ 193 millones, con una variación promedio anual del 7.6%.
Las exportaciones de estos 10 productos, representan el 98% de total de las exportaciones de este sector en el año 2004, tal como se presenta en el siguiente gráfico.
COMERCIO BILATERAL ENTRE REPUBLICA DOMINICANA Y ESTADOS UNIDOS VI-82
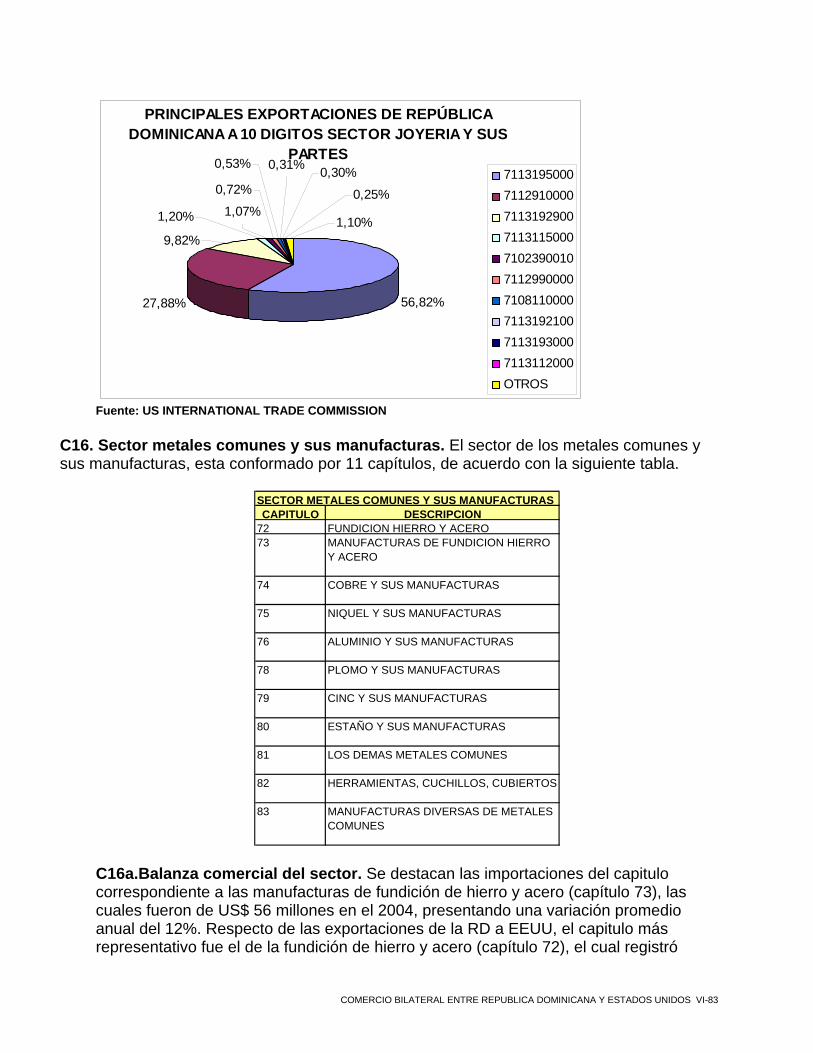
PRINCIPALES EXPORTACIONES DE REPÚBLICA DOMINICANA A 10 DIGITOS SECTOR JOYERIA Y SUS
PARTES
56,82%27,88%
1,07%
0,72%
9,82%
1,20% 1,10%
0,25%
0,30%0,53% 0,31%
7113195000711291000071131929007113115000710239001071129900007108110000711319210071131930007113112000OTROS
Fuente: US INTERNATIONAL TRADE COMMISSION
C16. Sector metales comunes y sus manufacturas. El sector de los metales comunes y sus manufacturas, esta conformado por 11 capítulos, de acuerdo con la siguiente tabla.
SECTOR METALES COMUNES Y SUS MANUFACTURASCAPITULO DESCRIPCION
72 FUNDICION HIERRO Y ACERO73 MANUFACTURAS DE FUNDICION HIERRO
Y ACERO
74 COBRE Y SUS MANUFACTURAS
75 NIQUEL Y SUS MANUFACTURAS
76 ALUMINIO Y SUS MANUFACTURAS
78 PLOMO Y SUS MANUFACTURAS
79 CINC Y SUS MANUFACTURAS
80 ESTAÑO Y SUS MANUFACTURAS
81 LOS DEMAS METALES COMUNES
82 HERRAMIENTAS, CUCHILLOS, CUBIERTOS
83 MANUFACTURAS DIVERSAS DE METALES COMUNES
C16a.Balanza comercial del sector. Se destacan las importaciones del capitulo correspondiente a las manufacturas de fundición de hierro y acero (capítulo 73), las cuales fueron de US$ 56 millones en el 2004, presentando una variación promedio anual del 12%. Respecto de las exportaciones de la RD a EEUU, el capitulo más representativo fue el de la fundición de hierro y acero (capítulo 72), el cual registró
COMERCIO BILATERAL ENTRE REPUBLICA DOMINICANA Y ESTADOS UNIDOS VI-83

exportaciones por valor de US$ 161 millones en el 2004; exportaciones que han tenido una variación promedio anual del 27%.
1999 2000 2001 2002 2003 2004 CAMBIO %DESCRIPCION 1999- 2004
Exportaciones
72 FUNDICION HIERRO Y ACERO
48.318.161 75.404.299 33.884.629 67.528.861 97.141.937 161.418.073 27,28%
Importaciones
72 FUNDICION HIERRO Y ACERO
6.215.607 9.553.230 4.040.766 3.905.274 12.071.434 7.148.945 2,84%
BALANZA
72 FUNDICION HIERRO Y ACERO
42.102.554 65.851.069 29.843.863 63.623.587 85.070.503 154.269.128
29,66%
Exportaciones
73 MANUFACTURAS DE FUNDICION HIERRO Y ACERO
13.233.554 17.490.335 12.041.039 14.697.411 14.667.455 11.189.378 -3,30%
Importaciones
73 MANUFACTURAS DE FUNDICION HIERRO Y ACERO
31.521.979 39.060.414 60.424.025 27.947.381 34.994.536 56.271.320 12,29%
BALANZA
73 MANUFACTURAS DE FUNDICION HIERRO Y ACERO
-18.288.425 -21.570.079 -48.382.986 -13.249.970 -20.327.081 -45.081.942
19,77%
Exportaciones74 COBRE Y SUS
MANUFACTURAS2.269.707 3.345.247 2.957.796 1.799.665 1.483.907 949.645 -15,99%
Importaciones74 COBRE Y SUS
MANUFACTURAS5.049.076 6.219.265 3.896.836 5.164.725 5.563.305 8.200.629 10,19%
BALANZA 74 COBRE Y SUS
MANUFACTURAS -2.779.369 -2.874.018 -939.040 -3.365.060 -4.079.398 -7.250.98421,14%
Exportaciones75 NIQUEL Y SUS
MANUFACTURAS0 14.587 0 0 5.061 350.320 121,37%
Importaciones75 NIQUEL Y SUS
MANUFACTURAS57.783 106.944 24.848 210.326 570.796 2.169.810 106,50%
BALANZA 75 NIQUEL Y SUS
MANUFACTURAS -57.783 -92.357 -24.848 -210.326 -565.735 -1.819.49099,36%
Exportaciones76 ALUMINIO Y SUS
MANUFACTURAS3.654.814 5.477.972 7.086.430 11.205.427 15.586.723 19.884.044 40,32%
Importaciones76 ALUMINIO Y SUS
MANUFACTURAS10.501.689 8.590.425 8.570.051 8.451.914 16.743.696 8.987.367 -3,07%
BALANZA 76 ALUMINIO Y SUS
MANUFACTURAS -6.846.875 -3.112.453 -1.483.621 2.753.513 -1.156.973 10.896.677-209,74%
BALANZA COMERCIAL DE REP. DOMINICANA CON EEUU. SECTOR METALES COMUNES Y SUS MANUFACTURAS (I)
CAPITULO US$
Fuente: US INTERNATIONAL TRADE COMMISSION
COMERCIO BILATERAL ENTRE REPUBLICA DOMINICANA Y ESTADOS UNIDOS VI-84

1999 2000 2001 2002 2003 2004 CAMBIO %DESCRIPCION 1999- 2004
Exportaciones78 PLOMO Y SUS
MANUFACTURAS27.839 11.389 0 6.928 0 0 -100,00%
Importaciones78 PLOMO Y SUS
MANUFACTURAS306.610 139.045 134.530 460.381 1.602.142 1.016.005 27,08%
BALANZA 78 PLOMO Y SUS
MANUFACTURAS -278.771 -127.656 -134.530 -453.453 -1.602.142 -1.016.00529,52%
Exportaciones79 CINC Y SUS
MANUFACTURAS97.380 134.498 42.482 0 0 8.042 -39,27%
Importaciones79 CINC Y SUS
MANUFACTURAS69.577 161.012 135.234 144.997 124.101 237.080 27,79%
BALANZA 79 CINC Y SUS
MANUFACTURAS 27.803 -26.514 -92.752 -144.997 -124.101 -229.038-252,46%
Exportaciones80 ESTAÑO Y SUS
MANUFACTURAS56.152 727.407 539.833 849.300 268.424 583.676 59,72%
Importaciones80 ESTAÑO Y SUS
MANUFACTURAS47.892 79.771 66.729 37.626 87.077 47.377 -0,22%
BALANZA 80 ESTAÑO Y SUS
MANUFACTURAS 8.260 647.636 473.104 811.674 181.347 536.299130,40%
Exportaciones
81 LOS DEMAS METALES COMUNES
19.617 0 0 0 18.620 12.400 -8,77%
Importaciones
81 LOS DEMAS METALES COMUNES
196.849 214.076 102.939 79.326 364.291 1.400.641 48,06%
BALANZA
81 LOS DEMAS METALES COMUNES -177.232 -214.076 -102.939 -79.326 -345.671 -1.388.241
50,93%
Exportaciones
82 HERRAMIENTAS, CUCHILLOS, CUBIERTOS
51.718 64.708 213.394 12.348 49.776 215.420 33,02%
Importaciones
82 HERRAMIENTAS, CUCHILLOS, CUBIERTOS
8.823.616 8.924.427 8.498.609 9.611.054 12.711.787 18.718.545 16,23%
BALANZA
82 HERRAMIENTAS, CUCHILLOS, CUBIERTOS -8.771.898 -8.859.719 -8.285.215 -9.598.706 -12.662.011 -18.503.125
16,10%
Exportaciones
83 MANUFACTURAS DIVERSAS DE METALES COMUNES
16.837.537 16.947.122 17.397.532 17.144.572 18.265.562 24.751.330 8,01%
Importaciones
83 MANUFACTURAS DIVERSAS DE METALES COMUNES
35.081.335 30.219.451 16.864.426 16.299.623 15.050.431 17.385.973 -13,10%
BALANZA
83 MANUFACTURAS DIVERSAS DE METALES COMUNES -18.243.798 -13.272.329 533.106 844.949 3.215.131 7.365.357
-183,41%
BALANZA COMERCIAL DE REP. DOMINICANA CON EEUU. SECTOR METALES COMUNES Y SUS MANUFACTURAS (II)
CAPITULO US$
Fuente: US INTERNATIONAL TRADE COMMISSION
1999 2000 2001 2002 2003 2004
Exportaciones 84.566.479 119.617.564 74.163.135 113.244.512 147.487.465 219.362.328Importaciones 97.872.013 103.268.060 102.458.993 72.312.627 99.883.596 121.583.692BALANZA -13.305.534 16.349.504 -28.295.858 40.931.885 47.603.869 97.778.636
US $
BALANZA COMERCIAL DE REP. DOMINICANA CON EE.UU.: SECTOR METALES COMUNES Y SUS MANUFACTURAS
Fuente: US INTERNATIONAL TRADE COMMISSION
C16b.Principales importaciones del sector. Los principales productos importados de la RD del sector metales comunes y sus manufacturas para el año 2004, se encuentran identificadas en la siguiente tabla.
COMERCIO BILATERAL ENTRE REPUBLICA DOMINICANA Y ESTADOS UNIDOS VI-85

1999 2000 2001 2002 2003 2004 CAMBIO %1999- 2004
1 8205510000
Household tools and parts thereof, base metal 1.019.884 93.875 159.149 1.102.652 4.973.702 13.128.139
66,70%
2 7303000090
Tubes, pipes and hollow profiles of cast iron, nesoi 29.062 229.414 347.008 274.625 1.733.140 13.055.460
239,23%
3 7309000030
Tanks, of iron or steel, of a capacity exceeding 300 liters, whether or not lined or heat insulated, not fitted w mechan or thermal equip not f gases 1.090.859 1.327.136 571.565 496.905 270.557 10.391.935
56,96%
4 8308100000Hooks, eyes and eyelets, of base metal 2.779.850 3.422.754 4.132.562 4.947.567 4.252.483 5.323.790
13,88%
5 7308901000
Columns, pillars, posts, beams, girders and similar structural units of iron or steel 959.660 1.020.354 1.235.134 1.472.611 2.591.225 4.759.046
37,75%
6 7308200000Towers and lattice masts of iron or steel 781.853 1.589.029 3.781.966 1.514.397 339.892 2.939.371
30,32%
7 8305900000
Letter clips, letter corners, paper clips, indexing tags and similar office articles, and parts thereof, of base metal 2.524 39.911 22.673 75.375 2.986.111 2.683.177
303,01%
8 7310290000
Tanks, casks, drums, cans, boxes and sim cont of ios nesoi, capacity less than 50 liters, not fitted with mechanical or thermal equip, not for liq gas 2.912.709 1.988.355 736.932 2.462.753 1.389.849 2.628.182
-2,03%
9 8308906000
Buckles and buckle clasps, and parts thereof, of base metal 934.538 1.110.590 1.097.122 1.345.142 1.663.444 1.836.659
14,47%
10 7306105000
Line pipe for oil or gas not seamless nesoi, of alloy steel 38.877 - - 49.329 - 1.836.025
116,19%
SUBPARTIDA 10 DIG PRODUCTO US $
IMPORTACIONES DE REP. DOMINICANA DESDE EEUU. SECTOR METALES COMUNES Y SUS MANUFACTURAS
Fuente: US INTERNATIONAL TRADE COMMISSION
Se destacan las importaciones de herramientas de mano de la subpartida 8205510000, las cuales fueron por valor de US$ 13 millones en el 2004, presentando una variación promedio anual de 66%. Las importaciones de clips y artículos similares para oficina correspondientes a la subpartida 8305900000 presentan una variación promedio del 303% en los años analizados (1999-2004). Las importaciones de estos 10 productos en el año 2004, representan el 48% del total de las importaciones del sector, tal como se observa en la siguiente gráfica.
COMERCIO BILATERAL ENTRE REPUBLICA DOMINICANA Y ESTADOS UNIDOS VI-86

PRINCIPALES IMPORTACIONES DE REP DOMINICANA A 10 DIGITOS SETOR METALES COMUNES Y SUS MANUFACTURAS AÑO 2004
10.80%10.74%
51.82%
1.51%1.51%
2.21%
2.16%
3.91%2.42%
4.38%8.55%
8205510000730300009073090000308308100000730890100073082000008305900000731029000083089060007306105000OTROS
Fuente: US INTERNATIONAL TRADE COMMISSION
C16c. Principales exportaciones del sector. Las principales exportaciones de la RD del sector metales y sus manufacturas para el año 2004, se presentan en la siguiente tabla. EXPORTACIONES DE REP DOMINICANA A EEUU. SECTOR METALES COMUNES Y SUS MANUFACTURAS
1999 2000 2001 2002 2003 2004 CAMBIO %1999- 2004
1 7202600000 Ferronickel 43.743.327 70.476.065 28.559.976 45.375.351 68.884.857 102.772.348 18,63%
2
7214200000 Other bars and rods iron or nonalloy steel, hot-worked, concrete reinforcing bars and rods
0 0 1.705.599 16.292.371 19.685.184 39.598.564 185,28%
38301406060 Other locks of base
metal, nesoi12.153.495 13.969.029 15.311.003 16.439.383 16.521.629 19.383.690 9,79%
4 7204490080 Other ferrous scrap 0 99.053 76.910 956.077 6.115.401 16.075.788 256,92%
5
7602000090 Aluminum waste and scrap other than used beverage container scrap
2.586.086 3.140.957 2.330.942 3.724.991 8.138.678 14.875.843 41,90%
68305200000 Staples in strips, of
base metal4.383.209 2.317.129 1.908.091 99.749 1.420.558 4.795.970 1,82%
7
7310210050 Cans closed by soldering or crimping, circular cross section, iron or steel, less than 50 liters, nesoi
3.473.114 5.272.381 3.908.668 3.829.160 2.998.700 3.336.413 -0,80%
87616995090 Articles of aluminum
nesoi2.780 1.125.108 3.657.872 3.066.157 2.604.365 2.297.192 283,20%
9
7317005530 Nails, tacks, drawing pins, staples etc of iron or steel nesoi, of round wire, one piece construction, smooth shank, galvanized
5.428.869 7.342.961 5.726.161 5.838.017 4.366.305 2.210.203 -16,45%
10
7217203000 Round wire, iron or nonalloy steel, plated or coated with zinc 1.5 mm or more diameter, under 0.25 percent carbon
404.261 509.516 581.785 1.759.367 1.404.313 1.478.249 29,60%
SUBPARTIDA 10 DIG PRODUCTO US $
Fuente: US INTERNATIONAL TRADE COMMISSION
COMERCIO BILATERAL ENTRE REPUBLICA DOMINICANA Y ESTADOS UNIDOS VI-87
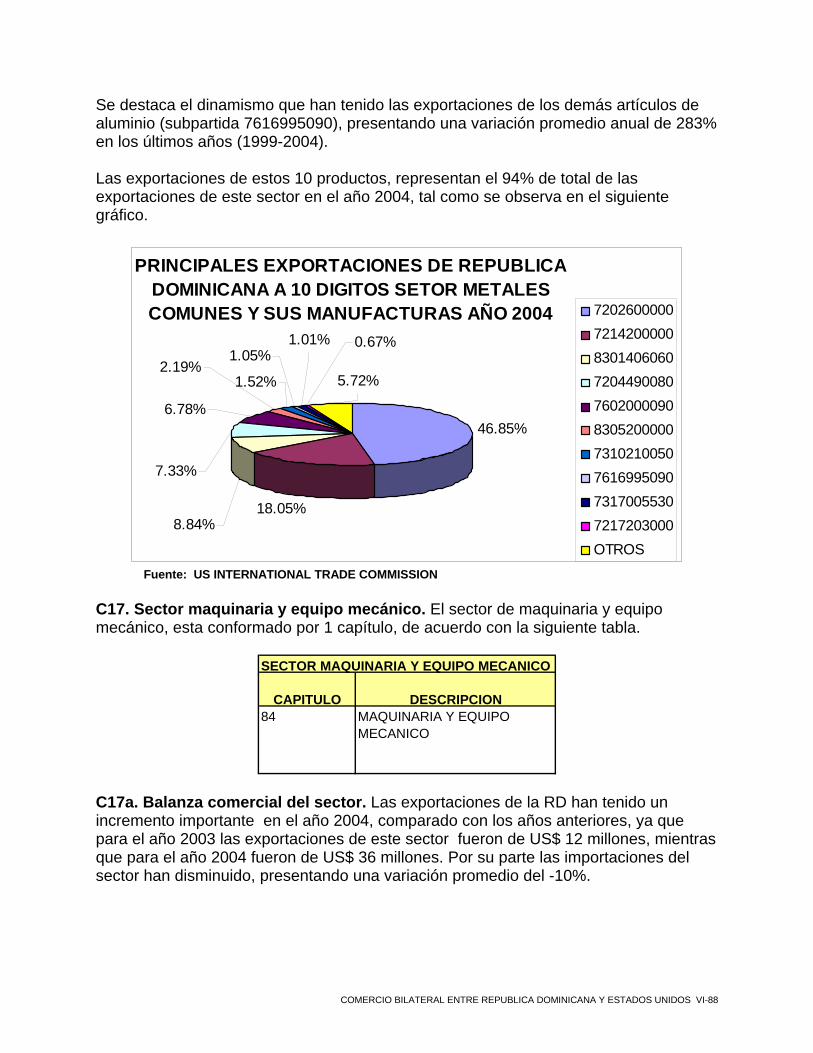
Se destaca el dinamismo que han tenido las exportaciones de los demás artículos de aluminio (subpartida 7616995090), presentando una variación promedio anual de 283% en los últimos años (1999-2004).
Las exportaciones de estos 10 productos, representan el 94% de total de las exportaciones de este sector en el año 2004, tal como se observa en el siguiente gráfico.
PRINCIPALES EXPORTACIONES DE REPUBLICA DOMINICANA A 10 DIGITOS SETOR METALES COMUNES Y SUS MANUFACTURAS AÑO 2004
46.85%
18.05%
5.72%
8.84%
7.33%
2.19%
6.78%
1.05%
1.52%
1.01% 0.67%
7202600000721420000083014060607204490080760200009083052000007310210050761699509073170055307217203000OTROS
Fuente: US INTERNATIONAL TRADE COMMISSION
C17. Sector maquinaria y equipo mecánico. El sector de maquinaria y equipo mecánico, esta conformado por 1 capítulo, de acuerdo con la siguiente tabla.
SECTOR MAQUINARIA Y EQUIPO MECANICO
CAPITULO DESCRIPCION84 MAQUINARIA Y EQUIPO
MECANICO
C17a. Balanza comercial del sector. Las exportaciones de la RD han tenido un incremento importante en el año 2004, comparado con los años anteriores, ya que para el año 2003 las exportaciones de este sector fueron de US$ 12 millones, mientras que para el año 2004 fueron de US$ 36 millones. Por su parte las importaciones del sector han disminuido, presentando una variación promedio del -10%.
COMERCIO BILATERAL ENTRE REPUBLICA DOMINICANA Y ESTADOS UNIDOS VI-88

1999 2000 2001 2002 2003 2004 % CAMBIODESCRIPCION 1999- 2004
Exportaciones
84 MAQUINARIA Y EQUIPO MECANICO
2,401,056 2,715,126 3,250,251 11,319,600 12,111,095 36,443,731 72.28%
Importaciones
84 MAQUINARIA Y EQUIPO MECANICO
355,640,487 458,609,632 462,716,126 354,634,073 193,239,217 207,880,340 -10.18%
BALANZA
84 MAQUINARIA Y EQUIPO MECANICO -353,239,431 -455,894,506 -459,465,875 -343,314,473 -181,128,122 -171,436,609
-13.46%
BALANZA COMERCIAL DE REP. DOMINICANA CON EE.UU. : SECTOR MAQUINARIA Y EQUIPO MECANICO
CAPITULO US $
Fuente: US INTERNATIONAL TRADE COMMISSION
C17b.Principales importaciones del sector: Los principales productos importados de la RD del sector de la maquinaria y equipo mecánico para el año 2004, se encuentran identificadas en la siguiente tabla.
COMERCIO BILATERAL ENTRE REPUBLICA DOMINICANA Y ESTADOS UNIDOS VI-89
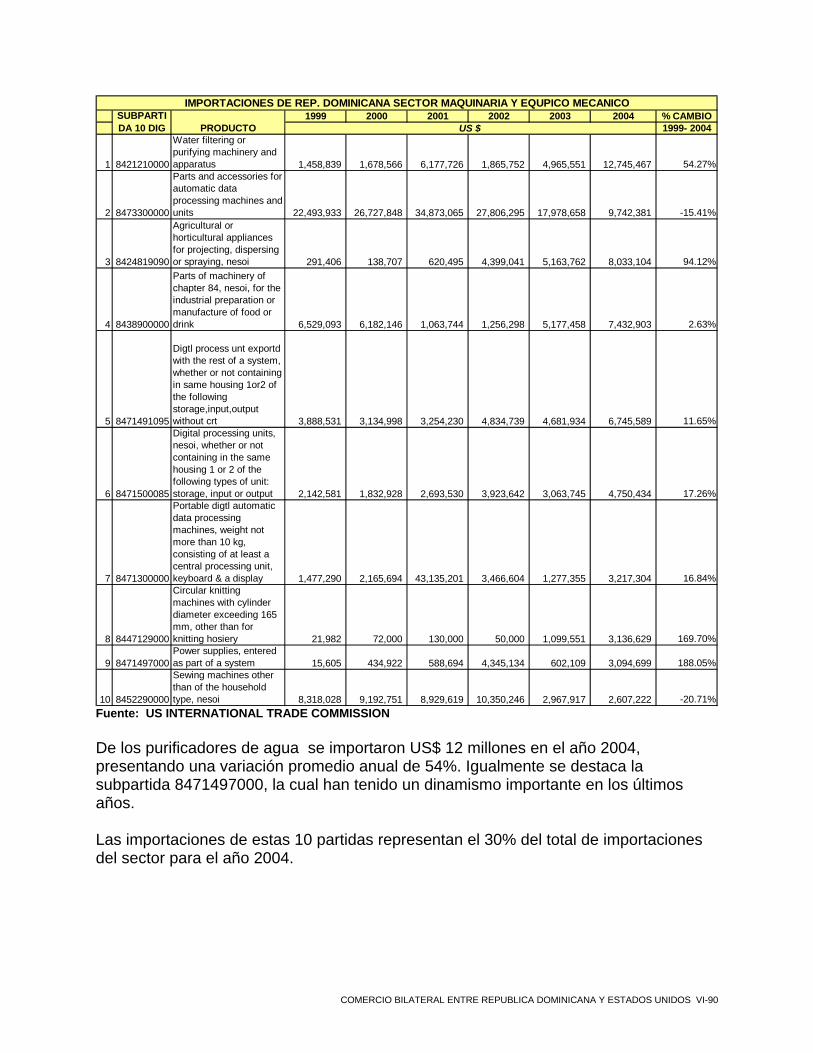
1999 2000 2001 2002 2003 2004 % CAMBIO1999- 2004
1 8421210000
Water filtering or purifying machinery and apparatus 1,458,839 1,678,566 6,177,726 1,865,752 4,965,551 12,745,467 54.27%
2 8473300000
Parts and accessories for automatic data processing machines and units 22,493,933 26,727,848 34,873,065 27,806,295 17,978,658 9,742,381 -15.41%
3 8424819090
Agricultural or horticultural appliances for projecting, dispersing or spraying, nesoi 291,406 138,707 620,495 4,399,041 5,163,762 8,033,104 94.12%
4 8438900000
Parts of machinery of chapter 84, nesoi, for the industrial preparation or manufacture of food or drink 6,529,093 6,182,146 1,063,744 1,256,298 5,177,458 7,432,903 2.63%
5 8471491095
Digtl process unt exportd with the rest of a system, whether or not containing in same housing 1or2 of the following storage,input,output without crt 3,888,531 3,134,998 3,254,230 4,834,739 4,681,934 6,745,589 11.65%
6 8471500085
Digital processing units, nesoi, whether or not containing in the same housing 1 or 2 of the following types of unit: storage, input or output 2,142,581 1,832,928 2,693,530 3,923,642 3,063,745 4,750,434 17.26%
7 8471300000
Portable digtl automatic data processing machines, weight not more than 10 kg, consisting of at least a central processing unit, keyboard & a display 1,477,290 2,165,694 43,135,201 3,466,604 1,277,355 3,217,304 16.84%
8 8447129000
Circular knitting machines with cylinder diameter exceeding 165 mm, other than for knitting hosiery 21,982 72,000 130,000 50,000 1,099,551 3,136,629 169.70%
9 8471497000Power supplies, entered as part of a system 15,605 434,922 588,694 4,345,134 602,109 3,094,699 188.05%
10 8452290000
Sewing machines other than of the household type, nesoi 8,318,028 9,192,751 8,929,619 10,350,246 2,967,917 2,607,222 -20.71%
SUBPARTIDA 10 DIG PRODUCTO US $
IMPORTACIONES DE REP. DOMINICANA SECTOR MAQUINARIA Y EQUPICO MECANICO
Fuente: US INTERNATIONAL TRADE COMMISSION De los purificadores de agua se importaron US$ 12 millones en el año 2004, presentando una variación promedio anual de 54%. Igualmente se destaca la subpartida 8471497000, la cual han tenido un dinamismo importante en los últimos años.
Las importaciones de estas 10 partidas representan el 30% del total de importaciones del sector para el año 2004.
COMERCIO BILATERAL ENTRE REPUBLICA DOMINICANA Y ESTADOS UNIDOS VI-90

PRINCIPALES IMPORTACIONES DE REPUBLICA DOMINICANA A 10 DIGITOS SECTOR
MAQUINARIA Y EQUIPOS MECANICOS AÑO 2004
6.13%
3.86%
3.58%
3.24%
2.29%
1.55%
1.51%
1.49%
1.25%
70.41%
4.69% 8421210000847330000084248190908438900000847149109584715000858471300000844712900084714970008452290000OTROS
Fuente: US INTERNATIONAL TRADE COMMISSION
C17c. Principales exportaciones del sector. Las principales exportaciones de la RD de maquinaria y equipo mecánico para el año 2004, se presentan en la siguiente tabla.
1999 2000 2001 2002 2003 2004 % CAMBIO1999- 2004
1 8473301040 Pts adp mch, nt incptg crt,prt ct asm.,mry modules
0 0 5,000 10,000 0 22,582,209 1552.97%
2 8424819090 Agricultural or horticultural appliances for projecting, dispersing or spraying, nesoi
0 0 826,041 7,535,577 6,929,380 8,035,368 113.47%
3 8421990080 Parts of machinery and apparatus for filtering or purifying liquids and gases, nesoi
0 0 5,788 218,465 837,037 1,425,748 526.86%
4 8418500080 Refrigerating display counters, cabinets, showcases and the like
713,484 380,562 458,881 403,825 262,750 356,820 -12.94%
5 8421394000 Catalytic converters of filtering or purifying machinery and apparatus for gases
0 0 0 0 202,279 346,078 71.09%
6 8471497000 Power supplies for automatic data processing machines or units thereof, nesoi, entered with the rest of a system
0 2,400 3,500 91,612 38,716 325,858 241.35%
7 8438901000 Parts of machinery for sugar manufacture
334,805 0 2,500 171,130 472,490 277,360 -3.69%
8 8478100090 Machinery for preparing or making up tobacco, not specified or included elsewhere in chapter 84
5,721 2,117 0 4,085 18,017 237,334 110.66%
9 8473301080 Pts adp mch, nt incptng crt,prt crt assem.;nesoi
0 0 15,765 0 12,940 236,759 146.72%
10 8414596090 Fans, nesoi, axial 0 0 0 0 73,921 233,054 215.27%
EXPORTACIONES DE REP DOMINICANA SECTOR MAQUINARIA Y EQUIPO MECANICOSUBPARTID
A 10 DIG PRODUCTO U S $
Fuente: US INTERNATIONAL TRADE COMMISSION
COMERCIO BILATERAL ENTRE REPUBLICA DOMINICANA Y ESTADOS UNIDOS VI-91
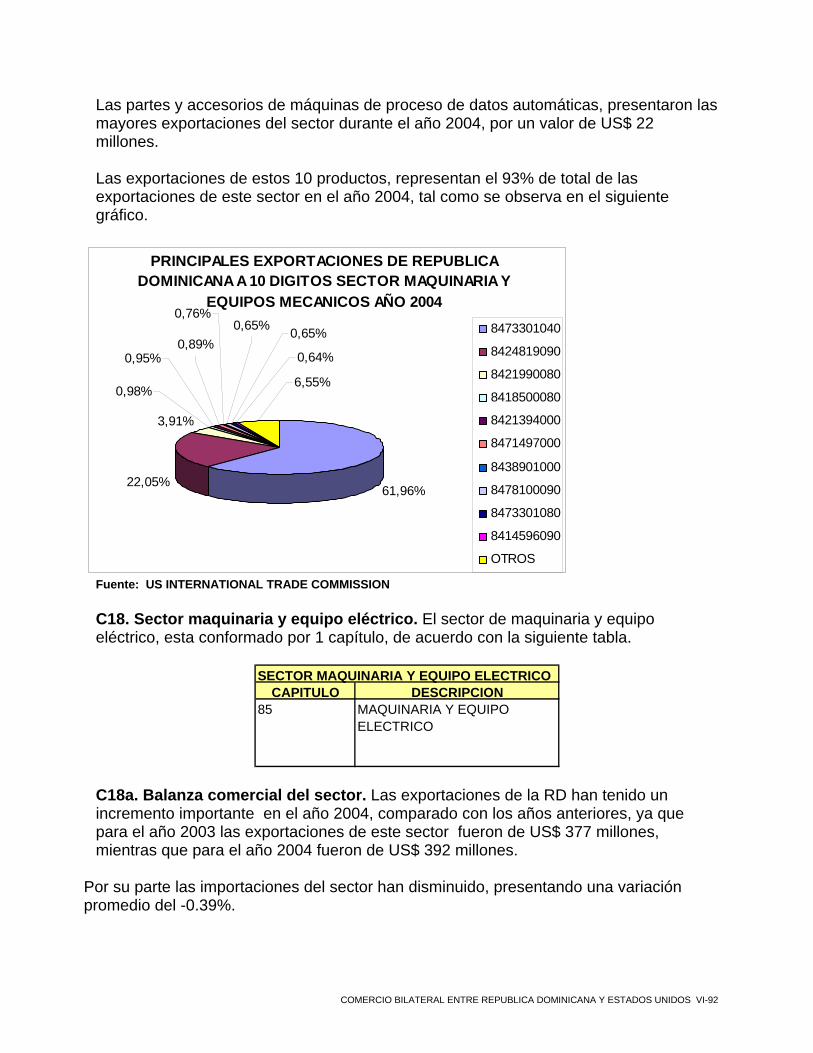
Las partes y accesorios de máquinas de proceso de datos automáticas, presentaron las mayores exportaciones del sector durante el año 2004, por un valor de US$ 22 millones. Las exportaciones de estos 10 productos, representan el 93% de total de las exportaciones de este sector en el año 2004, tal como se observa en el siguiente gráfico.
PRINCIPALES EXPORTACIONES DE REPUBLICA DOMINICANA A 10 DIGITOS SECTOR MAQUINARIA Y
EQUIPOS MECANICOS AÑO 2004
61,96%22,05%
3,91%
0,98%
0,95%0,89%
0,65%0,76%
0,65%
0,64%
6,55%
8473301040
8424819090
8421990080
8418500080
8421394000
8471497000
8438901000
8478100090
8473301080
8414596090
OTROS
Fuente: US INTERNATIONAL TRADE COMMISSION C18. Sector maquinaria y equipo eléctrico. El sector de maquinaria y equipo eléctrico, esta conformado por 1 capítulo, de acuerdo con la siguiente tabla.
SECTOR MAQUINARIA Y EQUIPO ELECTRICOCAPITULO DESCRIPCION
85 MAQUINARIA Y EQUIPO ELECTRICO
C18a. Balanza comercial del sector. Las exportaciones de la RD han tenido un incremento importante en el año 2004, comparado con los años anteriores, ya que para el año 2003 las exportaciones de este sector fueron de US$ 377 millones, mientras que para el año 2004 fueron de US$ 392 millones.
Por su parte las importaciones del sector han disminuido, presentando una variación promedio del -0.39%.
COMERCIO BILATERAL ENTRE REPUBLICA DOMINICANA Y ESTADOS UNIDOS VI-92
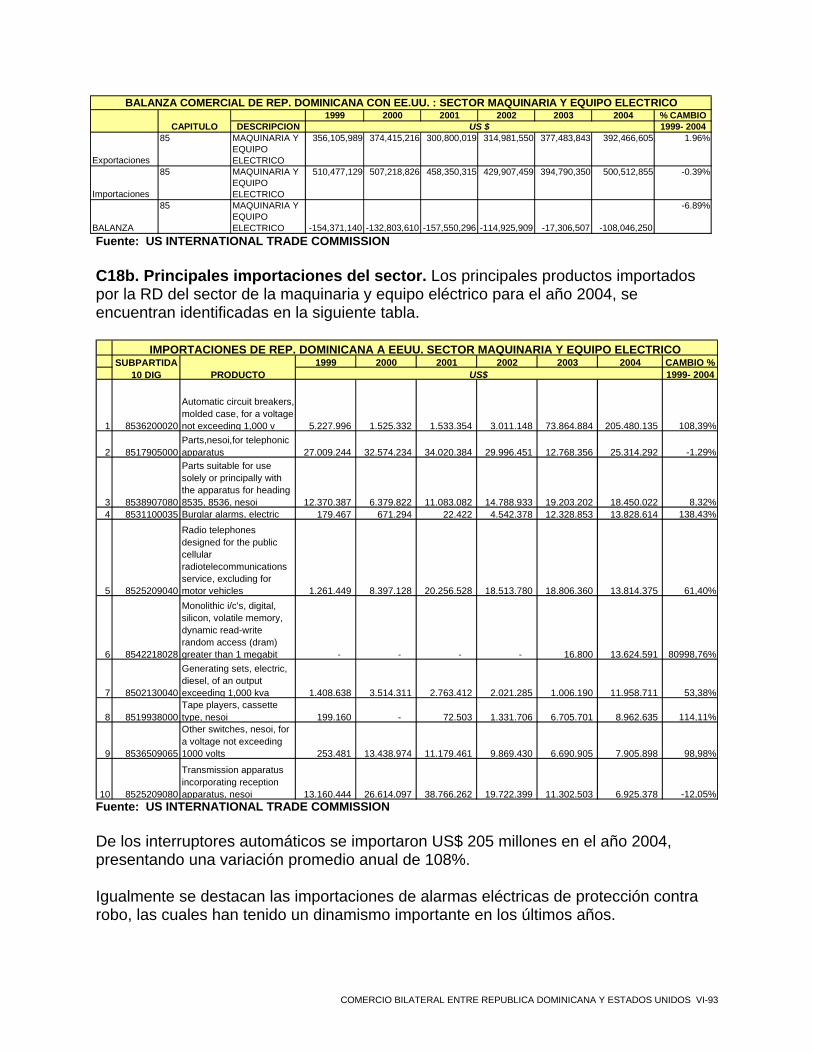
1999 2000 2001 2002 2003 2004 % CAMBIODESCRIPCION 1999- 2004
Exportaciones
85 MAQUINARIA Y EQUIPO ELECTRICO
356,105,989 374,415,216 300,800,019 314,981,550 377,483,843 392,466,605 1.96%
Importaciones
85 MAQUINARIA Y EQUIPO ELECTRICO
510,477,129 507,218,826 458,350,315 429,907,459 394,790,350 500,512,855 -0.39%
BALANZA
85 MAQUINARIA Y EQUIPO ELECTRICO -154,371,140 -132,803,610 -157,550,296 -114,925,909 -17,306,507 -108,046,250
-6.89%
BALANZA COMERCIAL DE REP. DOMINICANA CON EE.UU. : SECTOR MAQUINARIA Y EQUIPO ELECTRICO
CAPITULO US $
Fuente: US INTERNATIONAL TRADE COMMISSION
C18b. Principales importaciones del sector. Los principales productos importados por la RD del sector de la maquinaria y equipo eléctrico para el año 2004, se encuentran identificadas en la siguiente tabla.
1999 2000 2001 2002 2003 2004 CAMBIO %1999- 2004
1 8536200020
Automatic circuit breakers, molded case, for a voltage not exceeding 1,000 v 5.227.996 1.525.332 1.533.354 3.011.148 73.864.884 205.480.135 108,39%
2 8517905000Parts,nesoi,for telephonic apparatus 27.009.244 32.574.234 34.020.384 29.996.451 12.768.356 25.314.292 -1,29%
3 8538907080
Parts suitable for use solely or principally with the apparatus for heading 8535, 8536, nesoi 12.370.387 6.379.822 11.083.082 14.788.933 19.203.202 18.450.022 8,32%
4 8531100035 Burglar alarms, electric 179.467 671.294 22.422 4.542.378 12.328.853 13.828.614 138,43%
5 8525209040
Radio telephones designed for the public cellular radiotelecommunications service, excluding for motor vehicles 1.261.449 8.397.128 20.256.528 18.513.780 18.806.360 13.814.375 61,40%
6 8542218028
Monolithic i/c's, digital, silicon, volatile memory, dynamic read-write random access (dram) greater than 1 megabit - - - - 16.800 13.624.591 80998,76%
7 8502130040
Generating sets, electric, diesel, of an output exceeding 1,000 kva 1.408.638 3.514.311 2.763.412 2.021.285 1.006.190 11.958.711 53,38%
8 8519938000Tape players, cassette type, nesoi 199.160 - 72.503 1.331.706 6.705.701 8.962.635 114,11%
9 8536509065
Other switches, nesoi, for a voltage not exceeding 1000 volts 253.481 13.438.974 11.179.461 9.869.430 6.690.905 7.905.898 98,98%
10 8525209080
Transmission apparatus incorporating reception apparatus, nesoi 13.160.444 26.614.097 38.766.262 19.722.399 11.302.503 6.925.378 -12,05%
IMPORTACIONES DE REP. DOMINICANA A EEUU. SECTOR MAQUINARIA Y EQUIPO ELECTRICOSUBPARTIDA
10 DIG PRODUCTO US$
Fuente: US INTERNATIONAL TRADE COMMISSION
De los interruptores automáticos se importaron US$ 205 millones en el año 2004, presentando una variación promedio anual de 108%. Igualmente se destacan las importaciones de alarmas eléctricas de protección contra robo, las cuales han tenido un dinamismo importante en los últimos años.
COMERCIO BILATERAL ENTRE REPUBLICA DOMINICANA Y ESTADOS UNIDOS VI-93

De acuerdo a la siguiente gráfica se observa como el 40% de las importaciones del sector se encuentran concentradas en la subpartida 8536200020 (interruptores automáticos). Las importaciones de estas 10 partidas representan el 65% del total de importaciones del sector para el año 2004, tal como se presenta en la siguiente gráfica.
PRINCIPALES IMPORTACIONES DE REPÙBLICA DOMINICANA A 10 DIGITOS SECTOR MAQUINARIA
Y EQUIPO ELECTRICO AÑO 2004
41.05%34.81%
5.06%3.69%
2.72%
2.76%2.76%2.39%
1.79%
1.58%
1.38%
8536200020851790500085389070808531100035852520904085422180288502130040851993800085365090658525209080OTROS
Fuente: US INTERNATIONAL TRADE COMMISSION
C18c. Principales exportaciones del sector. Las principales exportaciones de la RD de maquinaria y equipo eléctrico para el año 2004, se presentan en la siguiente tabla.
COMERCIO BILATERAL ENTRE REPUBLICA DOMINICANA Y ESTADOS UNIDOS VI-94

EXPORTACIONES DE REP DOMINICANA A EU. SECTOR MAQUINARIA Y EQUIPO ELECTRICO1999 2000 2001 2002 2003 2004 % CAMBIO
1999- 2004
1
8536200020 Automatic circuit breakers, molded case, for a voltage not exceeding 1,000 v
84,290,540 82,258,438 79,136,542 85,457,635 99,726,559 110,373,281 5.54%
2
8517505000 Carrier-current line system apparatus, telephonic
262,521 56,740 0 0 19,224,784 50,107,920 185.86%
3
8511906040 Other parts for internal combustion engine ignition systems
6,787,543 6,137,843 15,208,843 22,285,716 27,273,686 31,538,108 35.96%
4
8536490065 Contactors for a voltage exceeding 60 v but not exceeding 1,000 v
22,650,036 22,288,950 17,123,952 17,037,302 17,814,056 21,657,283 -0.89%
58531909000 Elc snd/vsual sgn
mch,part,oth12,657,246 16,229,202 17,254,690 24,531,812 21,379,106 18,672,973 8.09%
6
8504314035 Transformers, nesoi, having a power handling capacity less than 40va
539,224 27,387,053 38,481,133 19,569,122 16,900,261 17,683,325 100.98%
7
8505190080 Nonflexible permanent magnets made of materials other than metal
0 0 0 3,753,184 11,214,431 12,659,298 83.66%
88531800050 Other signaling devices,
electric, nesoi0 0 0 9,252,341 10,080,603 11,566,154 11.81%
9
8536308000 Other apparatus for protecting electrical circuits, nesoi
9,472,825 9,098,081 18,681,545 26,500,788 24,213,329 11,253,639 3.51%
10
8504406001 Power supplies suitable for physical incorporation into automatic data processing machines or units thereof, with a power output not exceeding 50 w
0 0 6,205 1,123,007 9,087,777 10,541,596 1093.22%
SUBPARTIDA 10 DIG PRODUCTO US $
Fuente: US INTERNATIONAL TRADE COMMISSION
Al igual que las importaciones, el capítulo que presentó mayores exportaciones en el año 2004 fueron los interruptores eléctricos, los cuales presentan una variación promedio anual del 5%. Las exportaciones de estos 10 productos, representan el 75% de total de las exportaciones de este sector en el año 2004, tal como se observa en el siguiente gráfico. Las exportaciones de las subpartida 853200020 (interruptores eléctricos) y la subpartida 8517505000 (Aparatos para los sistemas de la línea del carrier-current o para los sistemas de la línea digital,) representan el 40% del total de las exportaciones de este sector.
COMERCIO BILATERAL ENTRE REPUBLICA DOMINICANA Y ESTADOS UNIDOS VI-95

PRINCIPALES EXPORTACIONES DE REPUBLICA DOMINICANA A 10 DIGITOS SECTOR
MAQUINARIA Y EQUIPO ELECTRICO AÑO 2004
28.12%24.57%2.69%
2.87%
2.95%
3.23%5.52%
4.76%
4.51%
8.04%
12.77%
8536200020851750500085119060408536490065853190900085043140358505190080853180005085363080008504406001OTROS
Fuente: US INTERNATIONAL TRADE COMMISSION
C19. Sector equipo para transporte. El sector correspondiente a equipo para transporte, esta conformado por 4 capítulos, de acuerdo con la siguiente tabla.
CAPITULO DESCRIPCION86 VEHICULOS Y MATERIAL
FERREO87 VEHICULOS
TERRESTRES Y SU PARTES
88 AERONAVES Y SUS PARTES
89 BARCOS
SECTOR EQUIPO PARA TRANSPORTE
C19a. Balanza comercial del sector. Las importaciones más representativas en este sector son las del capítulo 87, correspondiente a los vehículos terrestres y sus partes, las cuales fueron de US$ 86 millones en el año 2004. Es importante resaltar que en años anteriores, el mismo capitulo presentó mayores importaciones. En el caso de las exportaciones, el capítulo más representativo para el año 2004, fue igualmente el correspondiente a los vehículos terrestres y sus partes, exportaciones por valor de US$ 9 millones.
COMERCIO BILATERAL ENTRE REPUBLICA DOMINICANA Y ESTADOS UNIDOS VI-96

1999 2000 2001 2002 2003 2004 % CAMBIO
DESCRIPCION 1999- 2004
Exportaciones
86 VEHICULOS Y MATERIAL FERREO
3,225 3,600 0 52,000 0 0 -100.00%
Importaciones
86 VEHICULOS Y MATERIAL FERREO
1,430,939 6,340,129 5,338,285 9,218,847 5,852,736 8,521,806 42.88%
BALANZA
86 VEHICULOS Y MATERIAL FERREO -1,427,714 -6,336,529 -5,338,285 -9,166,847 -5,852,736 -8,521,806
42.95%
Exportaciones
87 VEHICULOS TERRESTRES Y SU PARTES
101,834 2,259,338 3,433,819 3,928,726 5,071,946 9,226,900 146.28%
Importaciones
87 VEHICULOS TERRESTRES Y SU PARTES
134,196,273 165,540,780 104,054,644 124,072,411 83,120,053 86,878,454 -8.33%
BALANZA
87 VEHICULOS TERRESTRES Y SU PARTES -134,094,439 -163,281,442 -100,620,825 -120,143,685 -78,048,107 -77,651,554
-10.35%
Exportaciones
88 AERONAVES Y SUS PARTES
2,710 17,000 5,970 0 16,715 50,000 79.14%
Importaciones
88 AERONAVES Y SUS PARTES
3,451,396 1,870,248 21,706,073 16,483,307 3,623,437 5,736,943 10.70%
BALANZA
88 AERONAVES Y SUS PARTES
-3,448,686 -1,853,248 -21,700,103 -16,483,307 -3,606,722 -5,686,943
10.52%
Exportaciones 89 BARCOS 0 124,790 8,000 0 0 3,600 -58.79%Importaciones 89 BARCOS 1,679,784 2,221,470 1,748,972 1,177,981 1,431,759 678,540 -16.58%BALANZA 89 BARCOS -1,679,784 -2,096,680 -1,740,972 -1,177,981 -1,431,759 -674,940 -16.67%
BALANZA COMERCIAL DE REP. DOMINICANA CON EE.UU. : SECTOR EQUIPO DE TRANSPORTE
CAPITULO US $
Fuente: US INTERNATIONAL TRADE COMMISSION Para el caso del sector equipo para transporte, las exportaciones de la RD a EEUU en los diferentes años analizados son menores que las importaciones, presentando una balanza comercial para el año 2004 de US$ -92 millones.
1999 2000 2001 2002 2003 2004
Exportaciones 107,769 2,404,728 3,447,789 3,980,726 5,088,661 9,280,500Importaciones 140,758,392 175,972,627 132,847,974 150,952,546 94,027,985 101,815,743Balanza Comercial -140,650,623 -173,567,899 -129,400,185 -146,971,820 -88,939,324 -92,535,243
US $
BALANZA COMERCIAL DE REP. DOMINICANA CON EE.UU. : SECTOR EQUIPO DE TRANSPORTE
Fuente: US INTERNATIONAL TRADE COMMISSION
C19b. Principales importaciones del sector. Los principales productos importados de la RD desde EEUU, del sector equipo para transporte para el año 2004, se encuentran identificadas en la siguiente tabla.
COMERCIO BILATERAL ENTRE REPUBLICA DOMINICANA Y ESTADOS UNIDOS VI-97

1999 2000 2001 2002 2003 2004 % CAMBIO1999- 2004
1 8703230090
Vehicles,nesoi,used,with spark-ignition internal combustion reciprocating piston engine of a cylinder capacity exceeding 1500, not exceeding 3000 cc 12,984,482 19,323,793 13,672,877 9,804,708 6,995,126 28,302,229 16.86%
2 8703230060
Vehicles,nesoi,new,w/spark-ignition internal combustion reciprocating piston engine of a cyl capacity >1500,not exceedining 3000cc, >4cyl, but <=6 cyl 17,326,243 19,608,593 12,720,548 26,489,011 9,169,461 10,741,523 -9.12%
3 8708998075
Parts and accessories, for motor vehicles of headings 8701 to 8705, nesoi 12,808,082 9,503,806 8,160,141 7,956,503 6,316,145 6,785,520 -11.93%
4 8703240050
Passenger motor vehicles with spark ignition internal combustion piston engine, nesoi, new, with cyl capacity ov 3000 cc, and not more than 4 cylinder 15,000 - 16,949 17,500 - 5,706,318 228.14%
5 8607199000Parts of truck assemblies, nesoi 921,938 5,212,826 4,084,908 2,775,106 2,332,833 3,759,262 32.46%
6 8706001520
Passenger automobile chassis fitted with engines, heading 8703 137,478 3,466,601 2,967,604 5,183,800 11,647,064 3,592,023 92.05%
7 8708990010
Parts and accessories,nesoi,for tractors (except road tractors for semi-trailers) of headings 8701 to 8705 4,312,264 1,658,882 4,434,133 4,837,769 2,799,572 2,407,746 -11.00%
8 8602100000Diesel-electric locomotives - 210,000 - 4,285,578 1,711,101 2,374,322 83.37%
9 8703240060
Passenger motor vehicles w/spark ignition internal combustion piston engine, nesoi, new, with cyl capacity ov 3000 cc & more than 4 but <= 6 cyinders 6,269,748 4,709,612 5,343,708 5,250,294 884,152 2,198,016 -18.91%
10 8703900000Passenger motor vehicles, nesoi 3,681,995 2,735,347 3,015,433 1,738,887 849,614 2,183,866 -9.92%
IMPORTACIONES DE REP. DOMINICANA DESDE EU. SECTOR EQUIPO PARA TRANSPORTESUBPARTID
A 10 DIG PRODUCTO US $
Fuente: US INTERNATIONAL TRADE COMMISSION
Los demás vehículos con motor de pistón identificados con la subpartida 8703230090, presentaron las mayores importaciones del sector durante el 2004, con una variación promedio anual del 16%. Las importaciones de estos 10 productos en el año 2004, representan el 66% del total de las importaciones del sector, tal como se observa en la siguiente gráfica.
COMERCIO BILATERAL ENTRE REPUBLICA DOMINICANA Y ESTADOS UNIDOS VI-98
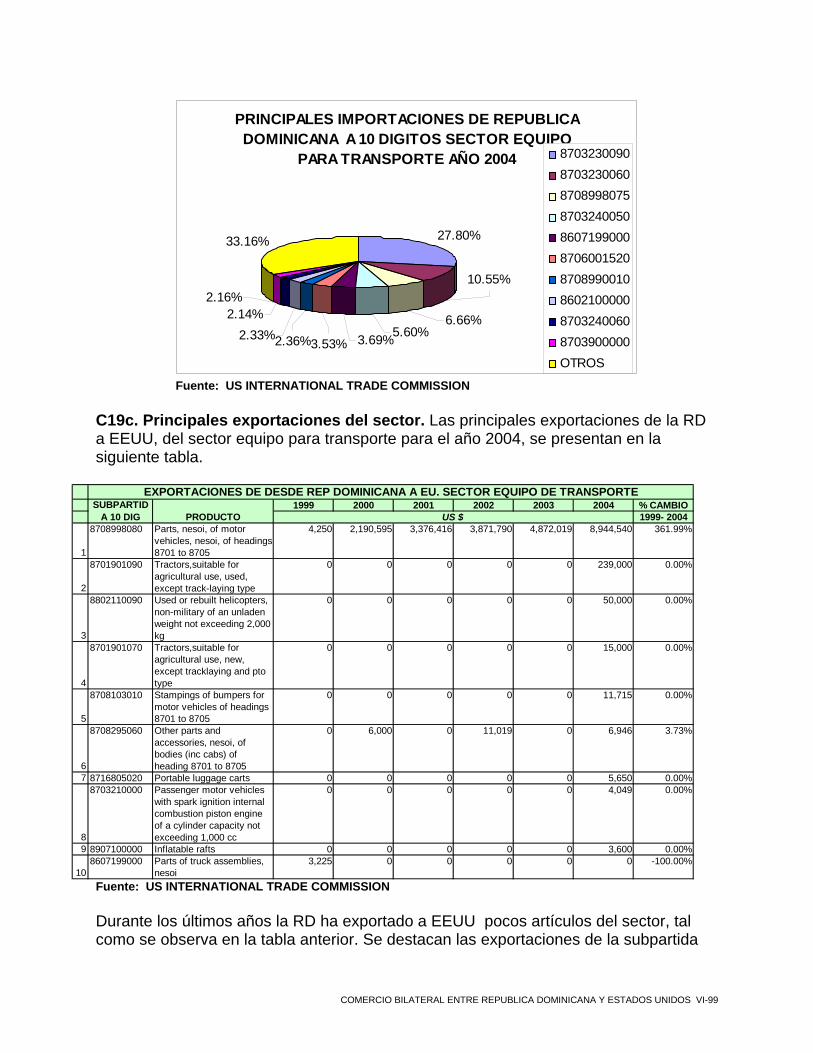
PRINCIPALES IMPORTACIONES DE REPUBLICA DOMINICANA A 10 DIGITOS SECTOR EQUIPO
PARA TRANSPORTE AÑO 2004
33.16%
2.36%
2.16%2.14%
2.33%3.53% 3.69%5.60%
6.66%
10.55%
27.80%
8703230090870323006087089980758703240050860719900087060015208708990010860210000087032400608703900000OTROS
Fuente: US INTERNATIONAL TRADE COMMISSION C19c. Principales exportaciones del sector. Las principales exportaciones de la RD a EEUU, del sector equipo para transporte para el año 2004, se presentan en la siguiente tabla.
1999 2000 2001 2002 2003 2004 % CAMBIO1999- 2004
1
8708998080 Parts, nesoi, of motor vehicles, nesoi, of headings 8701 to 8705
4,250 2,190,595 3,376,416 3,871,790 4,872,019 8,944,540 361.99%
2
8701901090 Tractors,suitable for agricultural use, used, except track-laying type
0 0 0 0 0 239,000 0.00%
3
8802110090 Used or rebuilt helicopters, non-military of an unladen weight not exceeding 2,000 kg
0 0 0 0 0 50,000 0
4
8701901070 Tractors,suitable for agricultural use, new, except tracklaying and pto type
0 0 0 0 0 15,000 0
5
8708103010 Stampings of bumpers for motor vehicles of headings 8701 to 8705
0 0 0 0 0 11,715 0
6
8708295060 Other parts and accessories, nesoi, of bodies (inc cabs) of heading 8701 to 8705
0 6,000 0 11,019 0 6,946 3.73%
7 8716805020 Portable luggage carts 0 0 0 0 0 5,650 0
8
8703210000 Passenger motor vehicles with spark ignition internal combustion piston engine of a cylinder capacity not exceeding 1,000 cc
0 0 0 0 0 4,049 0
9 8907100000 Inflatable rafts 0 0 0 0 0 3,600 0
108607199000 Parts of truck assemblies,
nesoi3,225 0 0 0 0 0 -100.00%
EXPORTACIONES DE DESDE REP DOMINICANA A EU. SECTOR EQUIPO DE TRANSPORTESUBPARTID
A 10 DIG PRODUCTO US $
.00%
.00%
.00%
.00%
.00%
.00%
Fuente: US INTERNATIONAL TRADE COMMISSION
Durante los últimos años la RD ha exportado a EEUU pocos artículos del sector, tal como se observa en la tabla anterior. Se destacan las exportaciones de la subpartida
COMERCIO BILATERAL ENTRE REPUBLICA DOMINICANA Y ESTADOS UNIDOS VI-99
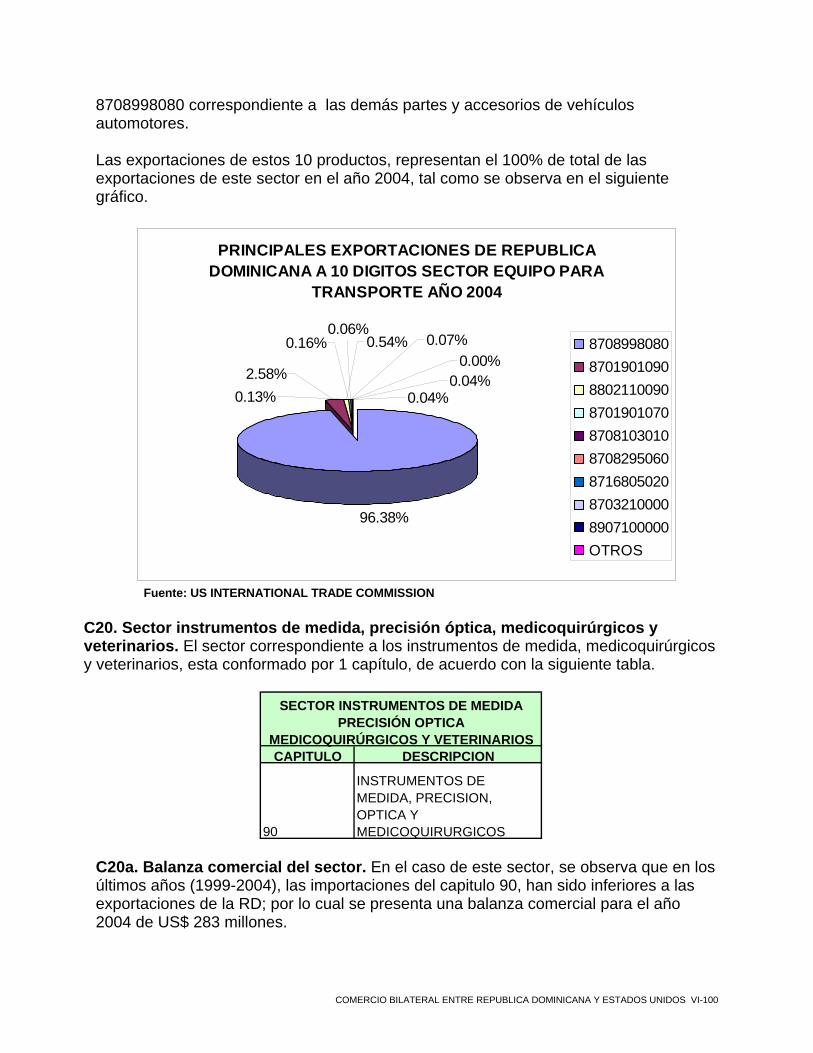
8708998080 correspondiente a las demás partes y accesorios de vehículos automotores. Las exportaciones de estos 10 productos, representan el 100% de total de las exportaciones de este sector en el año 2004, tal como se observa en el siguiente gráfico.
PRINCIPALES EXPORTACIONES DE REPUBLICA DOMINICANA A 10 DIGITOS SECTOR EQUIPO PARA
TRANSPORTE AÑO 2004
0.06%
0.04%
0.00%0.04%
0.07%
0.13%
0.16% 0.54%
2.58%
96.38%
870899808087019010908802110090870190107087081030108708295060871680502087032100008907100000OTROS
Fuente: US INTERNATIONAL TRADE COMMISSION
C20. Sector instrumentos de medida, precisión óptica, medicoquirúrgicos y veterinarios. El sector correspondiente a los instrumentos de medida, medicoquirúrgicos y veterinarios, esta conformado por 1 capítulo, de acuerdo con la siguiente tabla.
CAPITULO DESCRIPCION
90
INSTRUMENTOS DE MEDIDA, PRECISION, OPTICA Y MEDICOQUIRURGICOS
SECTOR INSTRUMENTOS DE MEDIDA PRECISIÓN OPTICA
MEDICOQUIRÚRGICOS Y VETERINARIOS
C20a. Balanza comercial del sector. En el caso de este sector, se observa que en los últimos años (1999-2004), las importaciones del capitulo 90, han sido inferiores a las exportaciones de la RD; por lo cual se presenta una balanza comercial para el año 2004 de US$ 283 millones.
COMERCIO BILATERAL ENTRE REPUBLICA DOMINICANA Y ESTADOS UNIDOS VI-100
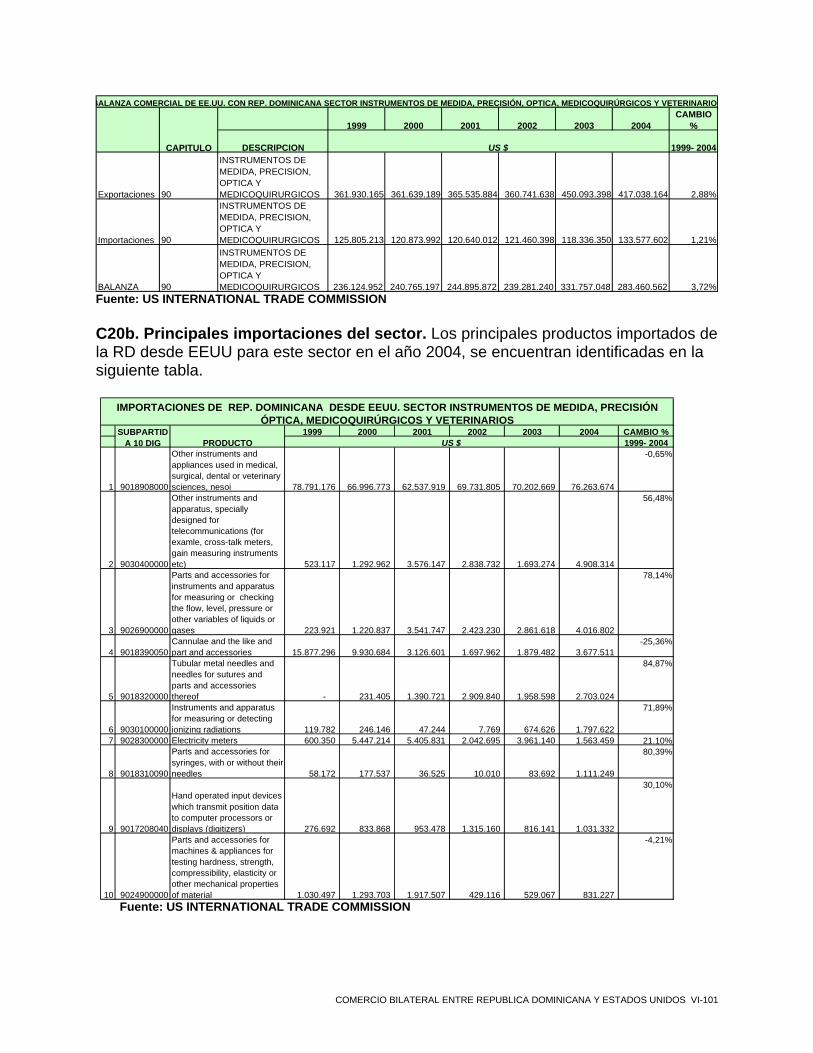
1999 2000 2001 2002 2003 2004CAMBIO
%
DESCRIPCION 1999- 2004
Exportaciones 90
INSTRUMENTOS DE MEDIDA, PRECISION, OPTICA Y MEDICOQUIRURGICOS 361.930.165 361.639.189 365.535.884 360.741.638 450.093.398 417.038.164 2,88%
Importaciones 90
INSTRUMENTOS DE MEDIDA, PRECISION, OPTICA Y MEDICOQUIRURGICOS 125.805.213 120.873.992 120.640.012 121.460.398 118.336.350 133.577.602 1,21%
BALANZA 90
INSTRUMENTOS DE MEDIDA, PRECISION, OPTICA Y MEDICOQUIRURGICOS 236.124.952 240.765.197 244.895.872 239.281.240 331.757.048 283.460.562 3,72%
BALANZA COMERCIAL DE EE.UU. CON REP. DOMINICANA SECTOR INSTRUMENTOS DE MEDIDA, PRECISIÓN, OPTICA, MEDICOQUIRÚRGICOS Y VETERINARIOS
CAPITULO US $
Fuente: US INTERNATIONAL TRADE COMMISSION
C20b. Principales importaciones del sector. Los principales productos importados de la RD desde EEUU para este sector en el año 2004, se encuentran identificadas en la siguiente tabla.
1999 2000 2001 2002 2003 2004 CAMBIO %1999- 2004
1 9018908000
Other instruments and appliances used in medical, surgical, dental or veterinary sciences, nesoi 78.791.176 66.996.773 62.537.919 69.731.805 70.202.669 76.263.674
-0,65%
2 9030400000
Other instruments and apparatus, specially designed for telecommunications (for examle, cross-talk meters, gain measuring instruments etc) 523.117 1.292.962 3.576.147 2.838.732 1.693.274 4.908.314
56,48%
3 9026900000
Parts and accessories for instruments and apparatus for measuring or checking the flow, level, pressure or other variables of liquids or gases 223.921 1.220.837 3.541.747 2.423.230 2.861.618 4.016.802
78,14%
4 9018390050Cannulae and the like and part and accessories 15.877.296 9.930.684 3.126.601 1.697.962 1.879.482 3.677.511
-25,36%
5 9018320000
Tubular metal needles and needles for sutures and parts and accessories thereof - 231.405 1.390.721 2.909.840 1.958.598 2.703.024
84,87%
6 9030100000
Instruments and apparatus for measuring or detecting ionizing radiations 119.782 246.146 47.244 7.769 674.626 1.797.622
71,89%
7 9028300000 Electricity meters 600.350 5.447.214 5.405.831 2.042.695 3.961.140 1.563.459 21,10%
8 9018310090
Parts and accessories for syringes, with or without their needles 58.172 177.537 36.525 10.010 83.692 1.111.249
80,39%
9 9017208040
Hand operated input devices which transmit position data to computer processors or displays (digitizers) 276.692 833.868 953.478 1.315.160 816.141 1.031.332
30,10%
10 9024900000
Parts and accessories for machines & appliances for testing hardness, strength, compressibility, elasticity or other mechanical properties of material 1.030.497 1.293.703 1.917.507 429.116 529.067 831.227
-4,21%
SUBPARTIDA 10 DIG PRODUCTO US $
IMPORTACIONES DE REP. DOMINICANA DESDE EEUU. SECTOR INSTRUMENTOS DE MEDIDA, PRECISIÓN ÓPTICA, MEDICOQUIRÚRGICOS Y VETERINARIOS
Fuente: US INTERNATIONAL TRADE COMMISSION
COMERCIO BILATERAL ENTRE REPUBLICA DOMINICANA Y ESTADOS UNIDOS VI-101
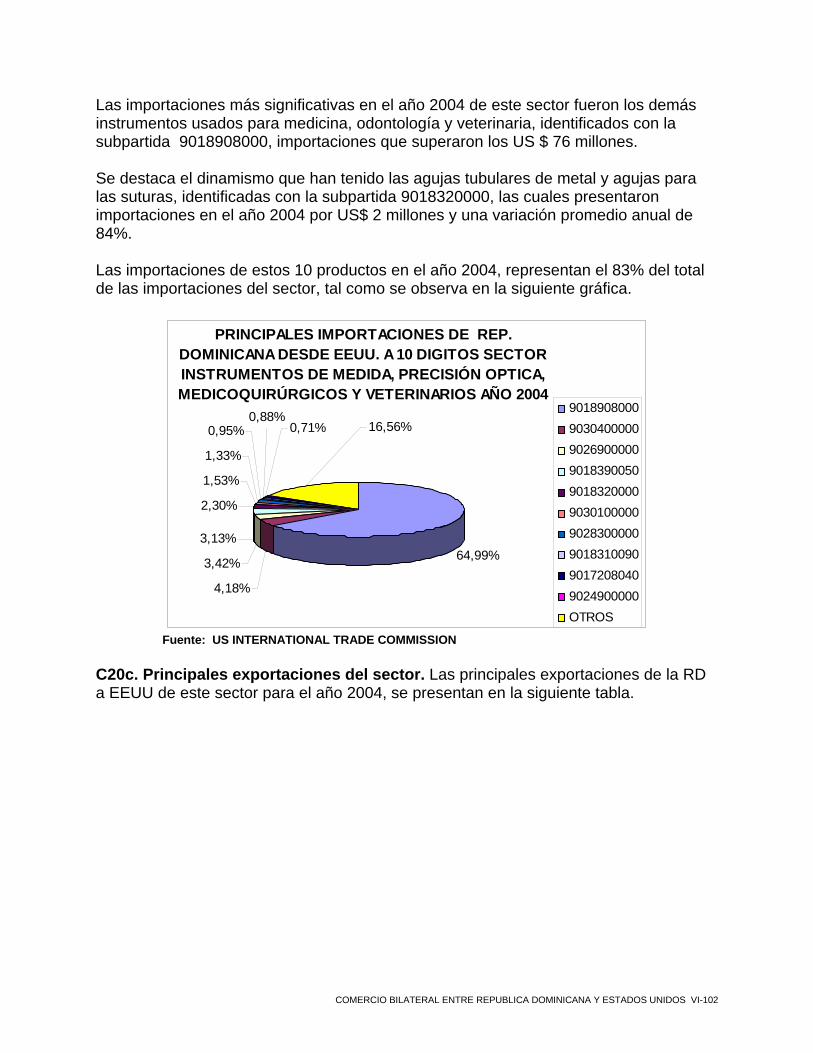
Las importaciones más significativas en el año 2004 de este sector fueron los demás instrumentos usados para medicina, odontología y veterinaria, identificados con la subpartida 9018908000, importaciones que superaron los US $ 76 millones.
Se destaca el dinamismo que han tenido las agujas tubulares de metal y agujas para las suturas, identificadas con la subpartida 9018320000, las cuales presentaron importaciones en el año 2004 por US$ 2 millones y una variación promedio anual de 84%. Las importaciones de estos 10 productos en el año 2004, representan el 83% del total de las importaciones del sector, tal como se observa en la siguiente gráfica.
PRINCIPALES IMPORTACIONES DE REP. DOMINICANA DESDE EEUU. A 10 DIGITOS SECTOR INSTRUMENTOS DE MEDIDA, PRECISIÓN OPTICA, MEDICOQUIRÚRGICOS Y VETERINARIOS AÑO 2004
64,99%
4,18%
3,42%
3,13%
2,30%
1,53%
1,33%
0,95%0,88%
0,71% 16,56%9018908000903040000090269000009018390050901832000090301000009028300000901831009090172080409024900000OTROS
Fuente: US INTERNATIONAL TRADE COMMISSION
C20c. Principales exportaciones del sector. Las principales exportaciones de la RD a EEUU de este sector para el año 2004, se presentan en la siguiente tabla.
COMERCIO BILATERAL ENTRE REPUBLICA DOMINICANA Y ESTADOS UNIDOS VI-102

1999 2000 2001 2002 2003 2004 CAMBIO %1999- 2004
1 9018908000
Other instruments and appliances used in medical, surgical, dental or veterinary sciences, nesoi 342.325.336 339.741.882 343.416.225 344.259.215 427.442.591 384.192.342 2,33%
2 9018390050
Cannulae and the like and part and accessories 6.363.011 4.214.518 6.079.339 9.084.516 12.896.051 20.054.221 25,81%
3 9013809000Othr devs: optical & lcd nspf 532.225 2.227.841 3.403.377 3.690.599 6.406.191 8.667.460 74,73%
4 9014904000
Parts and accessories for navigational instruments of articles covered by subheading 9014.80.50 284.607 1.523.460 2.591.591 1.712.435 1.112.315 820.024 23,57%
5 9032906080
Parts and accessories of automatic regulating instruments or controlling instruments and apparatus, nesoi 2.219.366 2.094.149 1.043.632 962.197 1.037.002 792.452 -18,61%
6 9021904080
Parts and accessories for pacemakers for stimulating heart muscles 0 0 0 0 0 474.257 0,00%
7 9018310080
Other syringes, with or without their needles, nesoi 0 13.292 78.451 77.040 61.144 359.655 128,07%
8 9017800000Other instruments for measuring length, nesoi 0 0 0 0 0 289.320 0,00%
9 9018310090
Parts and accessories for syringes, with or without their needles 0 0 0 2.827 49.043 209.603 761,06%
10 9018199560
Part and accessories for electro-diagnostic apparatus 0 4.875 216.341 167.502 118.223 194.374 151,28%
SUBPARTIDA 10 DIG PRODUCTO US $
EXPORTACIONES DE REP. DOMINICANA A EEUU.: SECTOR INSTRUMENTOS DE MEDIDA, PRECISIÓN ÓPTICA, MEDICOQUIRÚRGICOS Y VETERINARIOS
Fuente: US INTERNATIONAL TRADE COMMISSION
Al igual que en el caso de las importaciones, la subpartida 9018908000 correspondiente a los demás instrumentos usados para medicina, odontología y veterinaria fue la más representativa del sector, presentó exportaciones por US$ 384 millones, con una variación promedio anual del 2.33%.
Las exportaciones de estos 10 productos, representan el 99% de total de las exportaciones de este sector en el año 2004, tal como se observa en el siguiente gráfico. Las exportaciones correspondientes a los demás instrumentos usados para medicina, odontología y veterinaria, representan el 92% del total de las exportaciones de este sector.
COMERCIO BILATERAL ENTRE REPUBLICA DOMINICANA Y ESTADOS UNIDOS VI-103
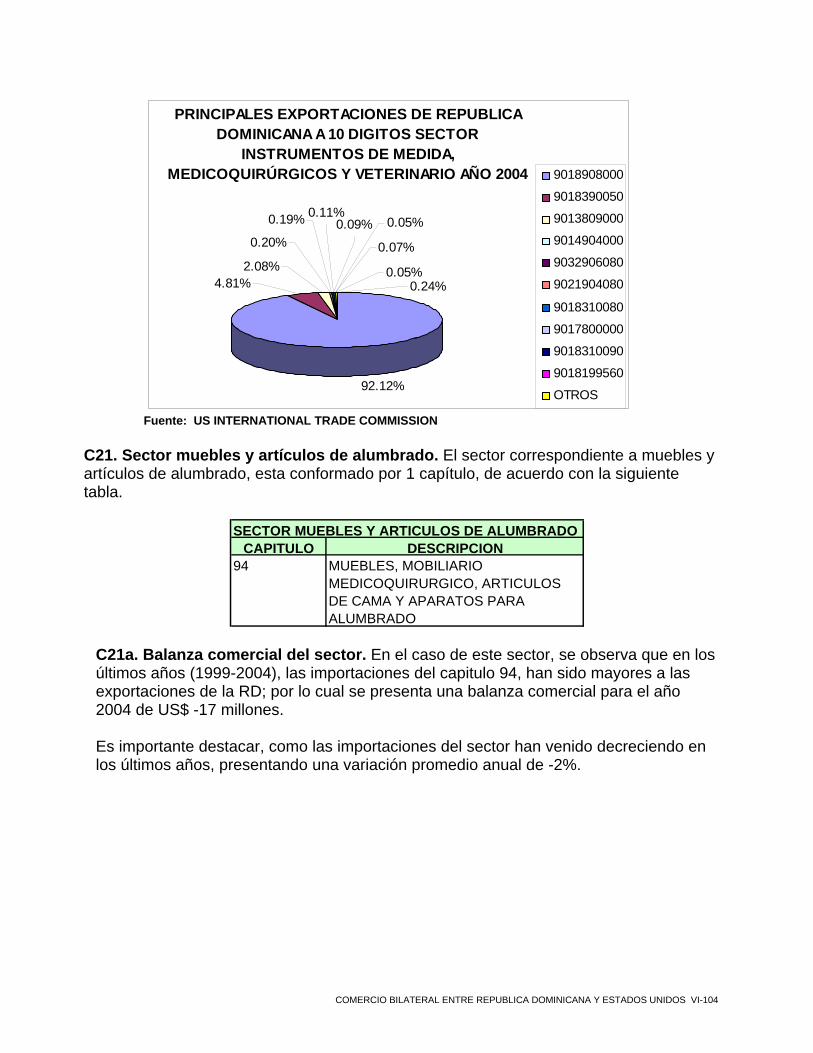
PRINCIPALES EXPORTACIONES DE REPUBLICA DOMINICANA A 10 DIGITOS SECTOR
INSTRUMENTOS DE MEDIDA, MEDICOQUIRÚRGICOS Y VETERINARIO AÑO 2004
92.12%
0.20%
0.19% 0.11%
2.08%
0.09%
0.07%
4.81% 0.24%0.05%
0.05%
9018908000
9018390050
9013809000
9014904000
9032906080
9021904080
9018310080
9017800000
9018310090
9018199560
OTROS
Fuente: US INTERNATIONAL TRADE COMMISSION
C21. Sector muebles y artículos de alumbrado. El sector correspondiente a muebles y artículos de alumbrado, esta conformado por 1 capítulo, de acuerdo con la siguiente tabla.
SECTOR MUEBLES Y ARTICULOS DE ALUMBRADO
CAPITULO DESCRIPCION94 MUEBLES, MOBILIARIO
MEDICOQUIRURGICO, ARTICULOS DE CAMA Y APARATOS PARA ALUMBRADO
C21a. Balanza comercial del sector. En el caso de este sector, se observa que en los últimos años (1999-2004), las importaciones del capitulo 94, han sido mayores a las exportaciones de la RD; por lo cual se presenta una balanza comercial para el año 2004 de US$ -17 millones. Es importante destacar, como las importaciones del sector han venido decreciendo en los últimos años, presentando una variación promedio anual de -2%.
COMERCIO BILATERAL ENTRE REPUBLICA DOMINICANA Y ESTADOS UNIDOS VI-104
1999 2000 2001 2002 2003 2004%
CAMBIO
DESCRIPCION1999- 2004
Exportaciones
94 MUEBLES, MOBILIARIO MEDICOQUIRURGICO, ARTICULOS DE CAMA Y APARATOS PARA ALUMBRADO
5,679,631 6,667,782 6,040,156 6,464,197 6,508,047 7,455,398 5.59%
Importaciones
94 MUEBLES, MOBILIARIO MEDICOQUIRURGICO, ARTICULOS DE CAMA Y APARATOS PARA ALUMBRADO
27,727,667 43,853,499 44,450,615 33,069,741 35,585,271 24,621,956 -2.35%
BALANZA
94 MUEBLES, MOBILIARIO MEDICOQUIRURGICO, ARTICULOS DE CAMA Y APARATOS PARA ALUMBRADO -22,048,036 -37,185,717 -38,410,459 -26,605,544 -29,077,224 -17,166,558
-4.88%
BALANZA COMERCIAL DE REP. DOMINICANA CON EE.UU. : SECTOR MUEBLES Y ARTICULOS DE ALUMBRADO
CAPI-TULO US $
Fuente: US INTERNATIONAL TRADE COMMISSION
C21b. Principales importaciones del sector. Los principales productos importados de la RD desde EEUU, del sector de muebles y artículos de alumbrado para el año 2004, se encuentran identificadas en la siguiente tabla.
IMPORTACIONES DE REP. DOMINICANA SECTOR MUEBLES Y ARTICULOS DE ALUMBRADO
1999 2000 2001 2002 2003 2004 % CAMBIO1999- 2004
1 9406008025Prefabricated buildings of metal 836,466 3,104,429 1,208,951 2,231,043 9,395,125 5,717,186 46.87%
2 9405990000Parts for lamps and lighting fittings, nesoi 366,565 523,029 573,030 771,268 452,620 3,615,799 58.06%
3 9403600000 Wooden furniture, nesoi 4,337,117 5,330,413 3,373,220 3,694,660 2,795,819 2,124,001 -13.31%
4 9403500000Wooden furniture of a kind used in the bedroom 2,020,520 1,158,264 1,439,807 2,221,825 666,266 1,981,872 -0.39%
5 9403909000 Parts of furniture nesoi 1,740,032 1,259,660 2,047,636 1,255,777 996,923 1,720,246 -0.23%
6 9403100040
Metal furniture of a kind used in offices except filing cabinets 1,702,921 558,654 681,935 627,140 345,888 1,261,887 -5.82%
7 9405103000
Chandeliers and other electric ceiling or wall lighting fittings, excluding those used for lighting public open space or thoroughfares, exc household 602,357 1,098,004 1,193,440 1,412,262 2,119,580 977,568 10.17%
8 9403200020
Metal furniture counters, lockers, racks, display cases, shelves, partitions, and similar fixtures, except for office 2,183,905 2,398,686 1,618,435 1,909,230 2,840,468 967,788 -15.02%
9 9403300000Wooden furniture of a kind used in offices 666,509 570,245 1,733,769 928,493 416,951 816,052 4.13%
10 9403907000 Furniture parts of wood 420,312 912,766 673,816 702,689 773,281 696,763 10.64%
SUBPARTIDA 10 DIG PRODUCTO EN US$
Fuente: US INTERNATIONAL TRADE COMMISSION Las importaciones más representativas del sector en el año 2004 fueron las construcciones prefabricadas en metal, por valor de US$ 5 millones, con una variación porcentual del 46%.
COMERCIO BILATERAL ENTRE REPUBLICA DOMINICANA Y ESTADOS UNIDOS VI-105

Las importaciones de estos 10 productos en el año 2004, representan el 80% del total de las importaciones del sector, tal como se observa en la siguiente gráfica. Es importante resaltar como las subpartidas 9406008025 y 9405990000 correspondientes a las construcciones prefabricadas en metal y las partes de lámparas, representan el 35% de total de las importaciones del sector en el año 2004.
PRINCIPALES IMPORTACIONES DE REPUBLICA DOMINICANA A 10 DIGITOS SECTOR MUEBLES Y
ARTICULOS DE ALUMBRADO AÑO 2004
23.22%
14.69%
8.63%8.05%5.13%
3.97%
3.93%
3.31%
2.83% 19.26%
6.99%
9406008025940599000094036000009403500000940390900094031000409405103000940320002094033000009403907000OTROS
Fuente: US INTERNATIONAL TRADE COMMISSION
C21c. Principales exportaciones del sector. Las principales exportaciones de la RD del sector de los muebles y artículos de alumbrado para el año 2004, se presentan en la siguiente tabla.
COMERCIO BILATERAL ENTRE REPUBLICA DOMINICANA Y ESTADOS UNIDOS VI-106
1999 2000 2001 2002 2003 2004 % CAMBIO1999- 2004
19404299090 Mattress of other
material, nesoi1,347,791 1,059,112 923,556 1,100,948 1,099,729 1,067,530 -4.56%
2
9401614010 Household seats with wooden frames, for chairs upholstered, nesoi
634,200 801,468 741,875 547,347 409,486 973,015 8.94%
39403608080 Wooden furniture,
nesoi904,412 1,438,573 1,444,186 1,433,111 1,298,882 896,765 -0.17%
4
9401616010 Household seats with wooden frames, upholstered, nesoi
719,329 96,838 217,675 712,090 792,483 847,870 3.34%
5
9403409060 Cabinets designed for permanent installation of wood of a kind use in the kitchen
434,396 593,543 989,059 1,382,959 972,754 677,329 9.29%
6
9401905020 Seat parts of textile materials, cut to shape, nesoi
0 0 0 0 504,492 607,953 20.51%
7 9404100000 Mattress supports 0 0 21,768 30,416 7,899 598,849 201.88%
8
9403409080 Wooden furniture of a kind used in the kitchen, nesoi
51,144 198,972 15,608 4,000 230,202 496,923 57.58%
99404299010 Uncovered
innerspring units557,240 474,059 346,330 171,699 104,387 312,395 -10.93%
10
9401790025 Household outdoor seats with metal frames, except with textile covered cushions or textile seating or backing material
35,166 13,440 6,320 0 216,728 160,822 35.53%
EXPORTACIONES DE REP DOMINICANA SECTOR MUEBLES Y ARTICULOS DE ALUMBRADOSUBPARTID
A 10 DIG PRODUCTO US $
Fuente: US INTERNATIONAL TRADE COMMISSION
Las exportaciones más significativas de la RD a EEUU del sector muebles y artículos de alumbrado en el año 2004, fue la subpartida correspondiente a los demás colchones de otro material, de los cuales se exportaron US$ 1 millón; presentando una variación promedio anual de -4%
Las exportaciones de estos 10 productos, representan el 89% de total de las exportaciones de este sector en el año 2004, tal como se observa en el siguiente gráfico.
COMERCIO BILATERAL ENTRE REPUBLICA DOMINICANA Y ESTADOS UNIDOS VI-107

PRINCIPALES EXPORTACIONES DE REPUBLICA DOMINICANA A 10 DIGITOS SECTOR MUEBLES Y
ARTICULOS DE ALUMBRADO AÑO 2004
14.32%
13.05%
12.03%11.37%8.15%
8.03%
6.67%
4.19%
2.16%
10.94%
9.09%
9404299090940161401094036080809401616010940340906094019050209404100000940340908094042990109401790025OTROS
Fuente: US INTERNATIONAL TRADE COMMISSION
C22. Sector “otros”. El sector identificado como “otros”, esta conformado por 3 capítulos, de acuerdo con la siguiente tabla.
CAPITULO DESCRIPCION93 ARMAS Y
MUNICIONES
98 TRATAMIENTO ESPECIAL
99 OTROS
SECTOR OTROS
C22a. Balanza comercial del sector. Se destacan las importaciones del capítulo 98 correspondientes a los artículos de tratamiento especial, las cuales en el año 2004 fueron de US$ 138 millones; igualmente, las exportaciones más significativas correspondieron el capitulo 98.
1999 2000 2001 2002 2003 2004 % CAMBIO
DESCRIPCION 1999- 2004
Exportaciones93 ARMAS Y
MUNICIONES0 0 0 0 0 0 -100
Importaciones93 ARMAS Y
MUNICIONES4,958,994 2,117,522 2,955,196 2,083,122 3,072,730 2,056,138 -16.14%
BALANZA 93 ARMAS Y
MUNICIONES -4,958,994 -2,117,522 -2,955,196 -2,083,122 -3,072,730 -2,056,138-16.14%
Exportaciones98 TRATAMIENTO
ESPECIAL79,230,186 90,604,089 88,911,710 98,728,999 117,661,182 109,358,956 6.66%
Importaciones98 TRATAMIENTO
ESPECIAL125,145,582 129,266,872 150,045,899 113,072,203 124,758,302 138,920,775 2.11%
BALANZA 98 TRATAMIENTO
ESPECIAL -45,915,396 -38,662,783 -61,134,189 -14,343,204 -7,097,120 -29,561,819-8.43%
Exportaciones 99 OTROS 22,733,054 23,871,478 22,850,191 23,899,719 26,980,824 29,763,094 5.54%Importaciones 99 OTROS 0 0 0 0 0 0 -100BALANZA 99 OTROS 22,733,054 23,871,478 22,850,191 23,899,719 26,980,824 29,763,094 5.54%
BALANZA COMERCIAL DE REP. DOMINICANA CON EE.UU. : SECTOR OTROS
CAPITULO US $.00%
.00%
Fuente: US INTERNATIONAL TRADE COMMISSION
COMERCIO BILATERAL ENTRE REPUBLICA DOMINICANA Y ESTADOS UNIDOS VI-108

Para el año 2004, se presentó una balanza comercial de US $-1.854.000, con importaciones de la RD de US$ 140 millones y exportaciones por valor de US$ 139 millones.
1999 2000 2001 2002 2003 2004
Exportaciones 101,963,240 114,475,567 111,761,901 122,628,718 144,642,006 139,122,050Importaciones 130,104,576 131,384,394 153,001,095 115,155,325 127,831,032 140,976,913BALANZA -28,141,336 -16,908,827 -41,239,194 7,473,393 16,810,974 -1,854,863
US $
BALANZA COMERCIAL DE REP. DOMINICANA CON EE.UU. : SECTOR OTROS
Fuente: US INTERNATIONAL TRADE COMMISSION
C22b. Principales importaciones del sector. Los principales productos importados de la RD de este sector para el año 2004, se encuentran identificadas en la siguiente tabla.
1999 2000 2001 2002 2003 2004 % CAMBIO1999- 2004
1 9880004000Low value estimate, excluding canada 85,423,344 93,287,267 92,473,735 88,244,618 86,795,965 86,909,690 0.35%
2 9802400000
Articles donated for relief or charity by individuals or private agencies, nesoi 4,950,639 1,422,322 13,432,160 5,229,075 12,350,776 20,894,403 33.37%
3 9802200000
Medicinal & pharmaceutical products donated for relief or charity by individuals or private agencies 5,923,623 1,201,895 23,117,649 6,273,139 17,168,740 19,007,478 26.26%
4 9802300000
All wearing apparel (including footwear and headwear) donated for relief or charity by individuals or private agencies 1,934,182 1,794,229 1,184,447 1,235,878 2,915,875 4,677,530 19.32%
5 9802100000
Commingled food products, donated for relief or charity by individuals or private agencies 508,321 631,419 3,520,826 1,986,783 314,232 4,441,927 54.27%
6 9809005000
Shipments valued $20,000 and under, not identified by kind 21,643,633 27,977,553 9,609,262 7,067,093 3,801,078 2,284,627 -36.22%
7 9306308000 Parts of cartridges, nesoi 263,455 - 21,335 6,000 231,001 909,214 28.11%
8 9303200010Shotguns for sporting, hunting or target-shooting 427,187 232,039 209,266 254,126 459,510 499,449 3.18%
9 9801100000
Value of repairs or alterations of previously imported articles, repaired or altered prior to exportation from united states 1,355,952 707,493 5,694,339 1,833,926 1,048,258 439,135 -20.19%
10 9302000000
Revolvers and pistols, other than those of heading 9303 or 9304 1,870,175 1,026,321 1,430,431 1,017,287 656,725 239,819 -33.69%
IMPORTACIONES DE REP. DOMINICANA SECTOR OTROSSUBPARTID
A 10 DIG PRODUCTO US $
Fuente: US INTERNATIONAL TRADE COMMISSION
Se destacan las importaciones de alimentos donadas, subpartida que ha tenido una variación promedio anual del 54%.
COMERCIO BILATERAL ENTRE REPUBLICA DOMINICANA Y ESTADOS UNIDOS VI-109
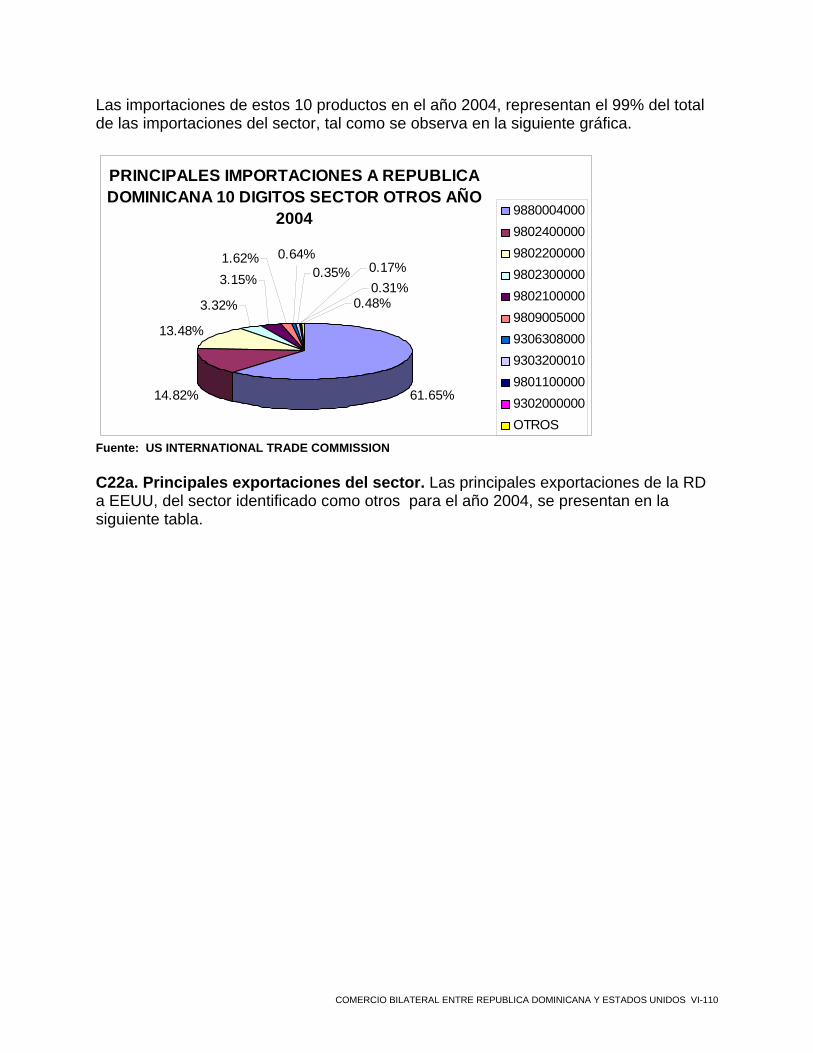
Las importaciones de estos 10 productos en el año 2004, representan el 99% del total de las importaciones del sector, tal como se observa en la siguiente gráfica.
PRINCIPALES IMPORTACIONES A REPUBLICA DOMINICANA 10 DIGITOS SECTOR OTROS AÑO
2004
61.65%14.82%
13.48%
3.32%
3.15%1.62% 0.64%
0.35%0.31%0.17%
0.48%
9880004000980240000098022000009802300000980210000098090050009306308000930320001098011000009302000000OTROS
Fuente: US INTERNATIONAL TRADE COMMISSION C22a. Principales exportaciones del sector. Las principales exportaciones de la RD a EEUU, del sector identificado como otros para el año 2004, se presentan en la siguiente tabla.
COMERCIO BILATERAL ENTRE REPUBLICA DOMINICANA Y ESTADOS UNIDOS VI-110

1999 2000 2001 2002 2003 2004 CAMBIO %1999- 2004
1
9801001097 U.s. goods, nesoi, returned without having been advanced in value or improved in condition while abroad
68,932,114 74,118,134 71,825,136 76,852,310 84,147,337 82,046,994 3.54%
29999950000 Estimated imports of low
valued transactions22,733,054 23,871,478 22,850,191 23,899,719 26,980,824 29,763,094 5.54%
3
9801001049 U.s. goods in headings 8501, 8502 or 8503 returned without having been advanced in value or improved in condition while abroad
17,850 2,244,290 97,728 531,000 1,484,134 9,440,209 250.48%
4
9801001045 U.s. goods in chapter 84 headings, nesoi, returned without having been advanced in value or improved in condition while abroad
2,031,598 2,463,024 4,647,203 2,371,694 1,423,647 2,985,172 8.00%
5
9801001053 U.s. goods in 8517, 8520, 8525, 8527 or 8529 returned without having been advanced in value or improved in condition while abroad
236,096 607,551 1,362,089 2,458,938 15,689,531 2,963,401 65.86%
6
9801001090 U.s. goods provided for in chapter 90 returned without having been advanced in value or improved in condition while abroad
2,747,564 2,184,419 2,275,998 3,131,957 3,732,122 2,697,846 -0.36%
7
9801001055 U.s. goods in chapter 85 headings, nesoi, returned without having been advanced in value or improved in condition while abroad
2,915,649 5,553,391 1,974,277 3,265,675 4,720,906 2,063,322 -6.68%
8
9801001077 U.s. goods provided for in headings 8803 or 8804 returned without having been advanced in value or improved in condition while abroad
51,233 237,724 103,082 337,686 474,994 1,823,076 104.29%
9
9801001051 U.s. goods provided in heading 8504 returned without having been advanced in value or improved in condition while abroad
10,000 86,410 74,161 459,879 1,771,811 1,619,694 176.62%
10
9801002500 Articles reimported without having advanced in value or improved in condition while abroad, or do not conform to specifications
242,556 252,504 144,825 166,464 1,236,039 1,146,336 36.43%
EXPORTACIONES DE REP DOMINICANA SECTOR OTROSSUBPARTID
A 10 DIG PRODUCTO US $
Fuente: US INTERNATIONAL TRADE COMMISSION
Como se puede identificar en la tabla anterior, las exportaciones más significativas del sector en el año 2004 fueron las mercancías, que retornan sin haber obtenido un valor agregado o mejorado en su condición mientras estuvieron en el exterior; las cuales fueron por valor de US $ 84 millones.
COMERCIO BILATERAL ENTRE REPUBLICA DOMINICANA Y ESTADOS UNIDOS VI-111
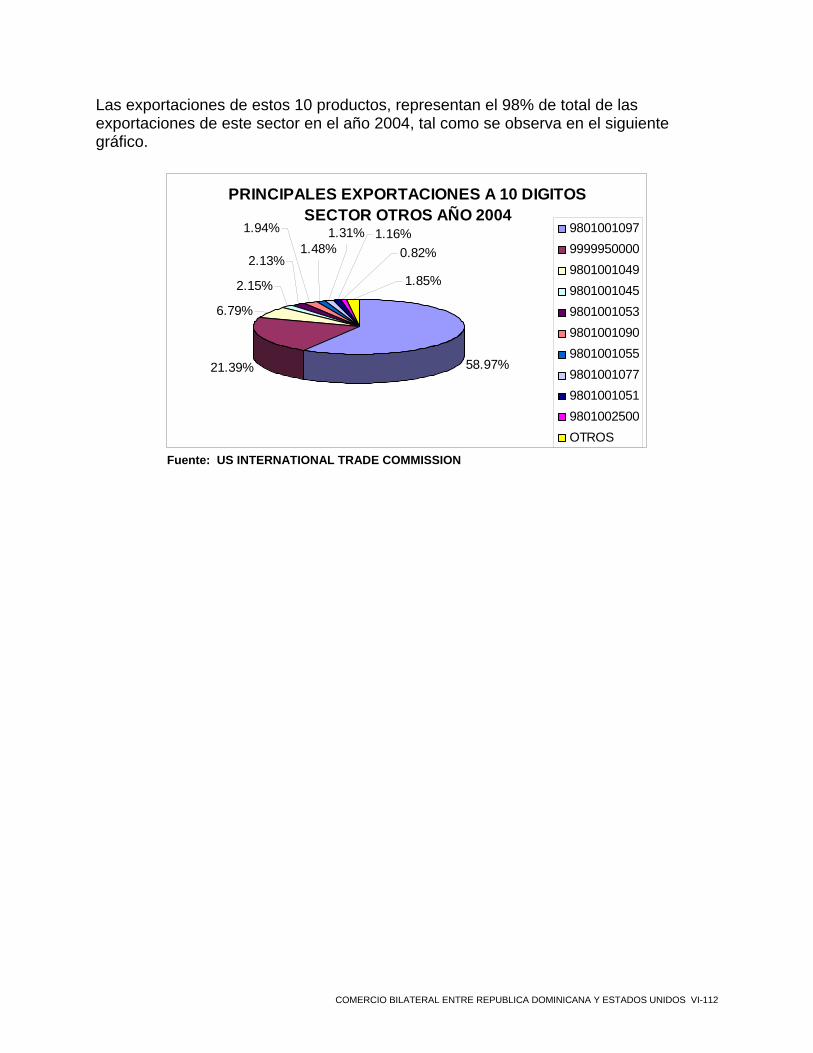
Las exportaciones de estos 10 productos, representan el 98% de total de las exportaciones de este sector en el año 2004, tal como se observa en el siguiente gráfico.
PRINCIPALES EXPORTACIONES A 10 DIGITOS SECTOR OTROS AÑO 2004
58.97%21.39%
6.79%
2.15%
2.13%1.85%
0.82%1.16%1.31%
1.48%1.94% 9801001097
999995000098010010499801001045980100105398010010909801001055980100107798010010519801002500OTROS
Fuente: US INTERNATIONAL TRADE COMMISSION
COMERCIO BILATERAL ENTRE REPUBLICA DOMINICANA Y ESTADOS UNIDOS VI-112

SECCIÓN VII COMERCIO BILATERAL 10 DIGITOS DEL ARANCEL
SECCIÓN VII COMERCIO BILATERAL 10 DIGITOS DEL ARANCEL
A.- Principales Importaciones de la RD desde EEUU a 10 Dígitos Las importaciones totales de la RD desde EEUU en el año 2004 fueron de US$ 4.116.101.623; a continuación se identifican las 74 subpartidas que presentaron un mayor valor en el año 2004, las cuales representan el 55% sobre el total de las mismas. La subpartida que generó mayores importaciones para este año fueron los interruptores automáticos, por un valor de US$ 205 millones, representando el 5% sobre el total de las importaciones registradas en el último año. Esta subpartida presentó una variación promedio anual del 108% durante los últimos años (1999-2004), teniendo en cuenta que para el año 2003, se importaron tan solo US $ 73 millones. La segunda subpartida en orden de importancia, es la 5212230000, correspondiente a los tejidos de algodón teñidos, presentando importaciones por valor de US$ 120 millones en el año 2004. Es importante resaltar que esta subpartida no presentó importaciones en los años 1999 y 2000, mientras que en el 2001 se registraron importaciones por valor de US$ 31.000, incrementándose de forma notable las importaciones para el año 2003 por US$ 28 millones. Se destacan las importaciones de calzoncillos, camisones y pijamas de algodón para hombres o niños correspondientes a la subpartida 6107110000, las cuales fueron por valor de US$ 106 millones en el año 2004. Esta subpartida tuvo una variación promedio anual moderada en comparación con las dos subpartidas analizadas anteriormente, del 7.45%. A continuación se encuentra la tabla donde se identifican las 74 subpartidas que presentaron mayores importaciones en el año 2004; su posición, descripción y el valor de las importaciones, dentro de un rango comprendido desde US$ 205 millones, hasta US$ 10 millones.
COMERCIO BILATERAL ENTRE REPUBLICA DOMINICANA Y ESTADOS UNIDOS VII-2

IMPORTACIONES DE REPUBLICA DOMINICANA DESDE EE.UU. A 10 DIGITOS
2004
1 8536200020Automatic circuit breakers, molded case, for a voltage not exceeding 1,000 v 205.480.135
2 5212230000Woven cotton fabrics, under 85% cotton by weight nesoi, dyed fabrics, weighing over 200 g/m2 120.375.183
3 6107110000Men's or boys' underpants and briefs of cotton, knitted or crocheted 106.579.524
4 9880004000 Low value estimate, excluding canada 86.909.690
5 2710193020Automotive, diesel or marine engine (except turbine) lubricating oils 80.310.022
6 9018908000Other instruments and appliances used in medical, surgical, dental or veterinary sciences, nesoi 76.263.674
7 1005902030 Yellow dent corn (maize), u. S. No. 2, except seed 74.291.150
8 6115920000Socks and other hosiery inc stockings for varicose veins and footwear without applied soles of cotton, knitted or crocheted 62.903.632
9 6108220000Women's or girls' briefs and panties of manmade fibers, knitted or crocheted 58.446.196
10 6212100020Brassieres and similar articles and parts thereof, whether or not knitted or crocheted, of manmade fibers 57.655.688
11 2710190520Heavy fuel oils under 25 degrees api havg sayblt un vis at 37.8 d cent of more than 125 seconds 54.720.454
12 1001902055 Wheat and meslin, except seed, nesoi 52.540.490
13 2710191007
Light fuel oils 25 degrees api or more having a saybolt universal viscosity at 37.8 deg c of less thn 45 seconds, containing over 0.05 percent sulfur 47.850.593
14 7113190000 Jewelry and parts thereof, of precious metal other than silver 43.723.424
15 5212240000Woven cotton fabrics, under 85% cotton by weight nesoi, fabrics with yarns of different colors, weighing over 200 g/m2 42.513.375
16 6109100005
Mens or boys t-shirts, all white of cotton underwear, short hemmed sleeves hemmed bottoms crew or round neckline without pockets,trim,embroidery- knit 41.698.632
17 6217900000
Other made-up clothing accessories; parts of garments or of clothing accessories, except brassieres, girdles, corsets, braces, suspenders, and garters 39.605.684
18 6006229080Other knit or crocheted of dyed cotton fabrics, nesoi (except of single knit const) 36.251.480
19 5208130000
Woven fabric of cotton containing 85% or > by weight of cotton weighting < 200 g/m2 3 or 4 thread twill including cross twill unbleached 35.623.504
20 3916906000
Monofilaments, any cross-sectional dimension exceeds 1mm, rods, sticks & profile shapes, whether or not surface-worked,not worked, plastics, nesoi 34.447.555
SUBPARTIDA 10 DIG PRODUCTO US $
Fuente: US INTERNATIONAL TRADE COMMISSION
COMERCIO BILATERAL ENTRE REPUBLICA DOMINICANA Y ESTADOS UNIDOS VII-3
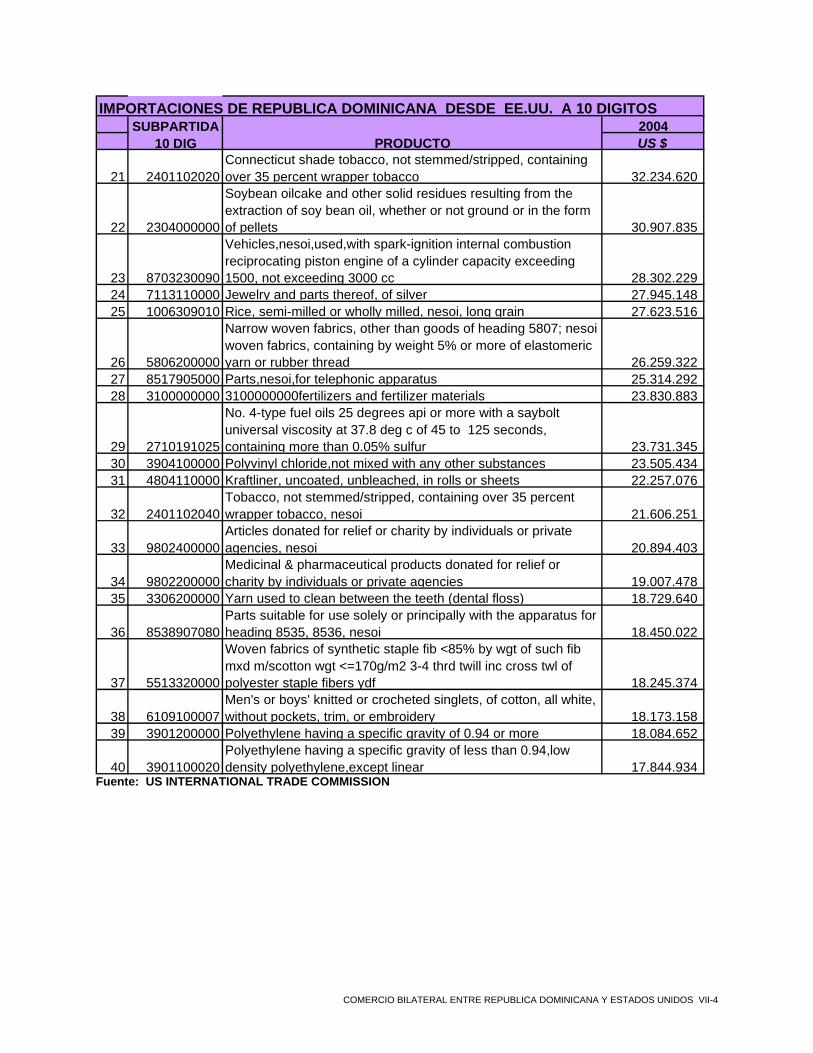
IMPORTACIONES DE REPUBLICA DOMINICANA DESDE EE.UU. A 10 DIGITOS2004
21 2401102020Connecticut shade tobacco, not stemmed/stripped, containing over 35 percent wrapper tobacco 32.234.620
22 2304000000
Soybean oilcake and other solid residues resulting from the extraction of soy bean oil, whether or not ground or in the form of pellets 30.907.835
23 8703230090
Vehicles,nesoi,used,with spark-ignition internal combustion reciprocating piston engine of a cylinder capacity exceeding 1500, not exceeding 3000 cc 28.302.229
24 7113110000 Jewelry and parts thereof, of silver 27.945.148 25 1006309010 Rice, semi-milled or wholly milled, nesoi, long grain 27.623.516
26 5806200000
Narrow woven fabrics, other than goods of heading 5807; nesoi woven fabrics, containing by weight 5% or more of elastomeric yarn or rubber thread 26.259.322
27 8517905000 Parts,nesoi,for telephonic apparatus 25.314.292 28 3100000000 3100000000fertilizers and fertilizer materials 23.830.883
29 2710191025
No. 4-type fuel oils 25 degrees api or more with a saybolt universal viscosity at 37.8 deg c of 45 to 125 seconds, containing more than 0.05% sulfur 23.731.345
30 3904100000 Polyvinyl chloride,not mixed with any other substances 23.505.434 31 4804110000 Kraftliner, uncoated, unbleached, in rolls or sheets 22.257.076
32 2401102040Tobacco, not stemmed/stripped, containing over 35 percent wrapper tobacco, nesoi 21.606.251
33 9802400000Articles donated for relief or charity by individuals or private agencies, nesoi 20.894.403
34 9802200000Medicinal & pharmaceutical products donated for relief or charity by individuals or private agencies 19.007.478
35 3306200000 Yarn used to clean between the teeth (dental floss) 18.729.640
36 8538907080Parts suitable for use solely or principally with the apparatus for heading 8535, 8536, nesoi 18.450.022
37 5513320000
Woven fabrics of synthetic staple fib <85% by wgt of such fib mxd m/scotton wgt <=170g/m2 3-4 thrd twill inc cross twl of polyester staple fibers ydf 18.245.374
38 6109100007Men's or boys' knitted or crocheted singlets, of cotton, all white, without pockets, trim, or embroidery 18.173.158
39 3901200000 Polyethylene having a specific gravity of 0.94 or more 18.084.652
40 3901100020Polyethylene having a specific gravity of less than 0.94,low density polyethylene,except linear 17.844.934
SUBPARTIDA 10 DIG PRODUCTO US $
Fuente: US INTERNATIONAL TRADE COMMISSION
COMERCIO BILATERAL ENTRE REPUBLICA DOMINICANA Y ESTADOS UNIDOS VII-4
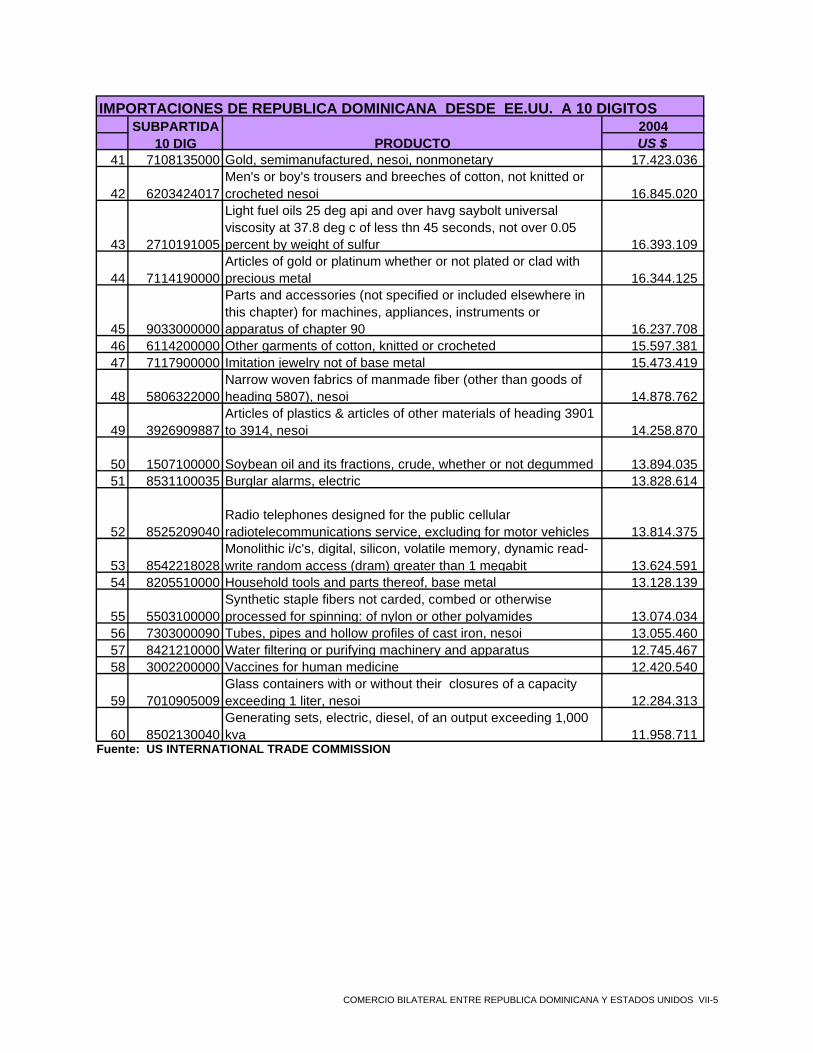
IMPORTACIONES DE REPUBLICA DOMINICANA DESDE EE.UU. A 10 DIGITOS2004
41 7108135000 Gold, semimanufactured, nesoi, nonmonetary 17.423.036
42 6203424017Men's or boy's trousers and breeches of cotton, not knitted or crocheted nesoi 16.845.020
43 2710191005
Light fuel oils 25 deg api and over havg saybolt universal viscosity at 37.8 deg c of less thn 45 seconds, not over 0.05 percent by weight of sulfur 16.393.109
44 7114190000Articles of gold or platinum whether or not plated or clad with precious metal 16.344.125
45 9033000000
Parts and accessories (not specified or included elsewhere in this chapter) for machines, appliances, instruments or apparatus of chapter 90 16.237.708
46 6114200000 Other garments of cotton, knitted or crocheted 15.597.381 47 7117900000 Imitation jewelry not of base metal 15.473.419
48 5806322000Narrow woven fabrics of manmade fiber (other than goods of heading 5807), nesoi 14.878.762
49 3926909887Articles of plastics & articles of other materials of heading 3901 to 3914, nesoi 14.258.870
50 1507100000 Soybean oil and its fractions, crude, whether or not degummed 13.894.035 51 8531100035 Burglar alarms, electric 13.828.614
52 8525209040Radio telephones designed for the public cellular radiotelecommunications service, excluding for motor vehicles 13.814.375
53 8542218028Monolithic i/c's, digital, silicon, volatile memory, dynamic read-write random access (dram) greater than 1 megabit 13.624.591
54 8205510000 Household tools and parts thereof, base metal 13.128.139
55 5503100000Synthetic staple fibers not carded, combed or otherwise processed for spinning: of nylon or other polyamides 13.074.034
56 7303000090 Tubes, pipes and hollow profiles of cast iron, nesoi 13.055.460 57 8421210000 Water filtering or purifying machinery and apparatus 12.745.467 58 3002200000 Vaccines for human medicine 12.420.540
59 7010905009Glass containers with or without their closures of a capacity exceeding 1 liter, nesoi 12.284.313
60 8502130040Generating sets, electric, diesel, of an output exceeding 1,000 kva 11.958.711
SUBPARTIDA 10 DIG PRODUCTO US $
Fuente: US INTERNATIONAL TRADE COMMISSION
COMERCIO BILATERAL ENTRE REPUBLICA DOMINICANA Y ESTADOS UNIDOS VII-5
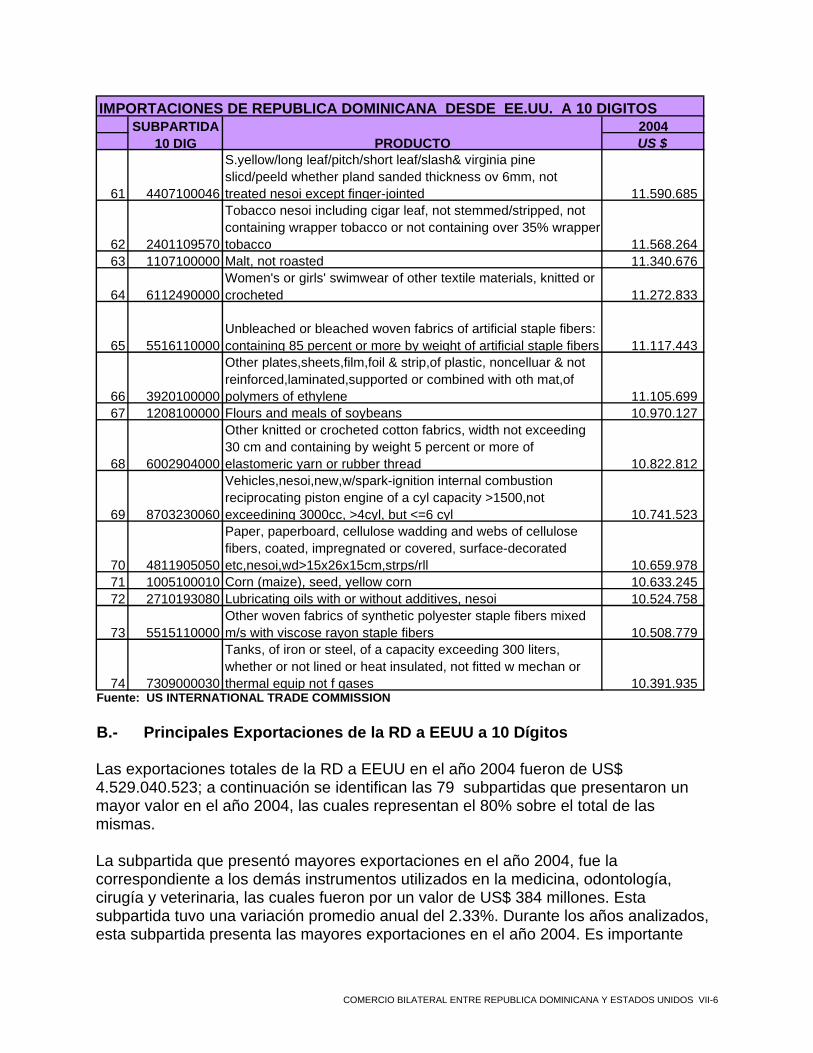
IMPORTACIONES DE REPUBLICA DOMINICANA DESDE EE.UU. A 10 DIGITOS2004
61 4407100046
S.yellow/long leaf/pitch/short leaf/slash& virginia pine slicd/peeld whether pland sanded thickness ov 6mm, not treated nesoi except finger-jointed 11.590.685
62 2401109570
Tobacco nesoi including cigar leaf, not stemmed/stripped, not containing wrapper tobacco or not containing over 35% wrapper tobacco 11.568.264
63 1107100000 Malt, not roasted 11.340.676
64 6112490000Women's or girls' swimwear of other textile materials, knitted or crocheted 11.272.833
65 5516110000Unbleached or bleached woven fabrics of artificial staple fibers: containing 85 percent or more by weight of artificial staple fibers 11.117.443
66 3920100000
Other plates,sheets,film,foil & strip,of plastic, noncelluar & not reinforced,laminated,supported or combined with oth mat,of polymers of ethylene 11.105.699
67 1208100000 Flours and meals of soybeans 10.970.127
68 6002904000
Other knitted or crocheted cotton fabrics, width not exceeding 30 cm and containing by weight 5 percent or more of elastomeric yarn or rubber thread 10.822.812
69 8703230060
Vehicles,nesoi,new,w/spark-ignition internal combustion reciprocating piston engine of a cyl capacity >1500,not exceedining 3000cc, >4cyl, but <=6 cyl 10.741.523
70 4811905050
Paper, paperboard, cellulose wadding and webs of cellulose fibers, coated, impregnated or covered, surface-decorated etc,nesoi,wd>15x26x15cm,strps/rll 10.659.978
71 1005100010 Corn (maize), seed, yellow corn 10.633.245 72 2710193080 Lubricating oils with or without additives, nesoi 10.524.758
73 5515110000Other woven fabrics of synthetic polyester staple fibers mixed m/s with viscose rayon staple fibers 10.508.779
74 7309000030
Tanks, of iron or steel, of a capacity exceeding 300 liters, whether or not lined or heat insulated, not fitted w mechan or thermal equip not f gases 10.391.935
SUBPARTIDA 10 DIG PRODUCTO US $
Fuente: US INTERNATIONAL TRADE COMMISSION
B.- Principales Exportaciones de la RD a EEUU a 10 Dígitos Las exportaciones totales de la RD a EEUU en el año 2004 fueron de US$ 4.529.040.523; a continuación se identifican las 79 subpartidas que presentaron un mayor valor en el año 2004, las cuales representan el 80% sobre el total de las mismas. La subpartida que presentó mayores exportaciones en el año 2004, fue la correspondiente a los demás instrumentos utilizados en la medicina, odontología, cirugía y veterinaria, las cuales fueron por un valor de US$ 384 millones. Esta subpartida tuvo una variación promedio anual del 2.33%. Durante los años analizados, esta subpartida presenta las mayores exportaciones en el año 2004. Es importante
COMERCIO BILATERAL ENTRE REPUBLICA DOMINICANA Y ESTADOS UNIDOS VII-6
resaltar que las exportaciones de esta subpartida corresponden al 8.48% sobre el total de las exportaciones de la RD a EEUU en el año 2004. Los pantalones largos, pantalones con peto, pantalones cortos y shorts, representan el 6,89% sobre el total de las exportaciones para el año 2004. De esta subpartida (6203424015) se exportaron US$ 312 millones, la cual ha tenido una variación promedio anual del 1.65%. En orden de importancia, le siguen las exportaciones de los demás artículos de joyería en oro o platino revestidos o no correspondientes a la subpartida 7113195000, los cuales presentaron exportaciones por valor de US$ 193 millones en el año 2004, con una variación promedio anual de 7,63%. Las exportaciones de esta subpartida representan el 4.27% sobre el total de las exportaciones de la RD para el año 2004. A continuación se encuentra la tabla donde se identifican las 79 subpartidas que presentaron mayores exportaciones en el año 2004; su posición, descripción y el valor de las exportaciones, dentro de un rango comprendido desde US$ 384 millones, hasta US$ 10 millones.
COMERCIO BILATERAL ENTRE REPUBLICA DOMINICANA Y ESTADOS UNIDOS VII-7
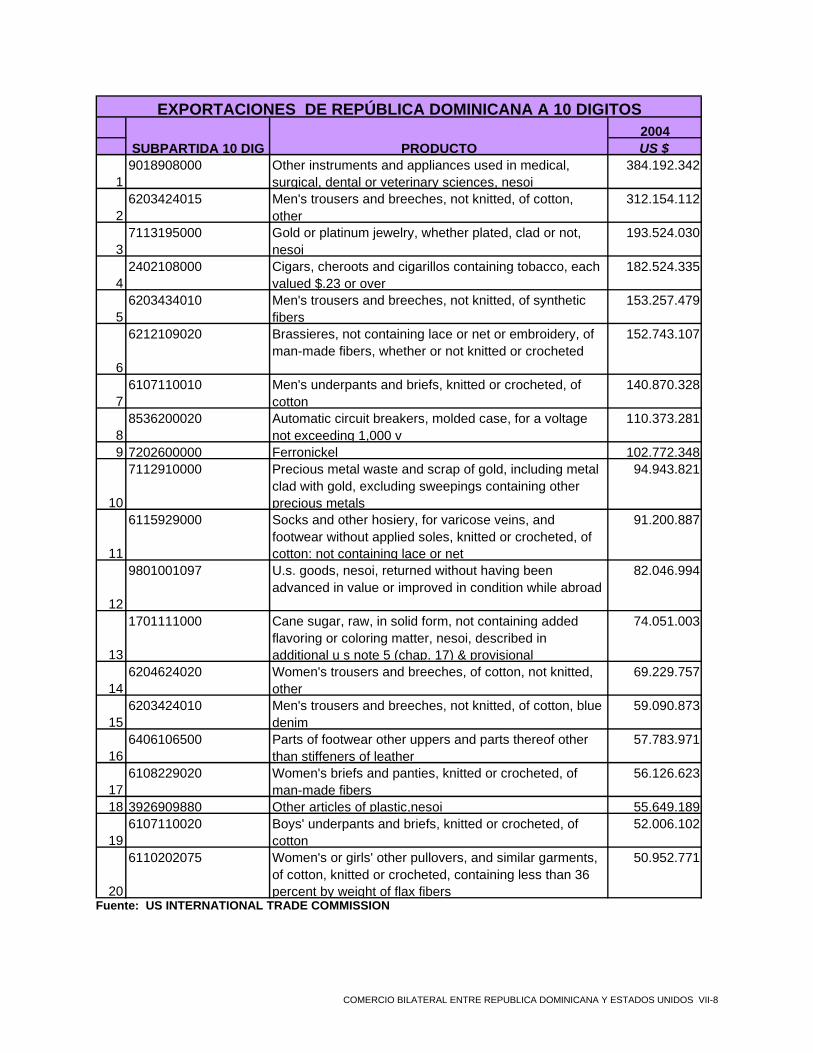
2004
19018908000 Other instruments and appliances used in medical,
surgical, dental or veterinary sciences, nesoi384.192.342
26203424015 Men's trousers and breeches, not knitted, of cotton,
other312.154.112
37113195000 Gold or platinum jewelry, whether plated, clad or not,
nesoi193.524.030
42402108000 Cigars, cheroots and cigarillos containing tobacco, each
valued $.23 or over182.524.335
56203434010 Men's trousers and breeches, not knitted, of synthetic
fibers153.257.479
6
6212109020 Brassieres, not containing lace or net or embroidery, of man-made fibers, whether or not knitted or crocheted
152.743.107
76107110010 Men's underpants and briefs, knitted or crocheted, of
cotton140.870.328
88536200020 Automatic circuit breakers, molded case, for a voltage
not exceeding 1,000 v110.373.281
9 7202600000 Ferronickel 102.772.348
10
7112910000 Precious metal waste and scrap of gold, including metal clad with gold, excluding sweepings containing other precious metals
94.943.821
11
6115929000 Socks and other hosiery, for varicose veins, and footwear without applied soles, knitted or crocheted, of cotton: not containing lace or net
91.200.887
12
9801001097 U.s. goods, nesoi, returned without having been advanced in value or improved in condition while abroad
82.046.994
13
1701111000 Cane sugar, raw, in solid form, not containing added flavoring or coloring matter, nesoi, described in additional u s note 5 (chap. 17) & provisional
74.051.003
146204624020 Women's trousers and breeches, of cotton, not knitted,
other69.229.757
156203424010 Men's trousers and breeches, not knitted, of cotton, blue
denim59.090.873
166406106500 Parts of footwear other uppers and parts thereof other
than stiffeners of leather57.783.971
176108229020 Women's briefs and panties, knitted or crocheted, of
man-made fibers56.126.623
18 3926909880 Other articles of plastic,nesoi 55.649.189
196107110020 Boys' underpants and briefs, knitted or crocheted, of
cotton52.006.102
20
6110202075 Women's or girls' other pullovers, and similar garments, of cotton, knitted or crocheted, containing less than 36 percent by weight of flax fibers
50.952.771
SUBPARTIDA 10 DIG PRODUCTO US $
EXPORTACIONES DE REPÚBLICA DOMINICANA A 10 DIGITOS
Fuente: US INTERNATIONAL TRADE COMMISSION
COMERCIO BILATERAL ENTRE REPUBLICA DOMINICANA Y ESTADOS UNIDOS VII-8
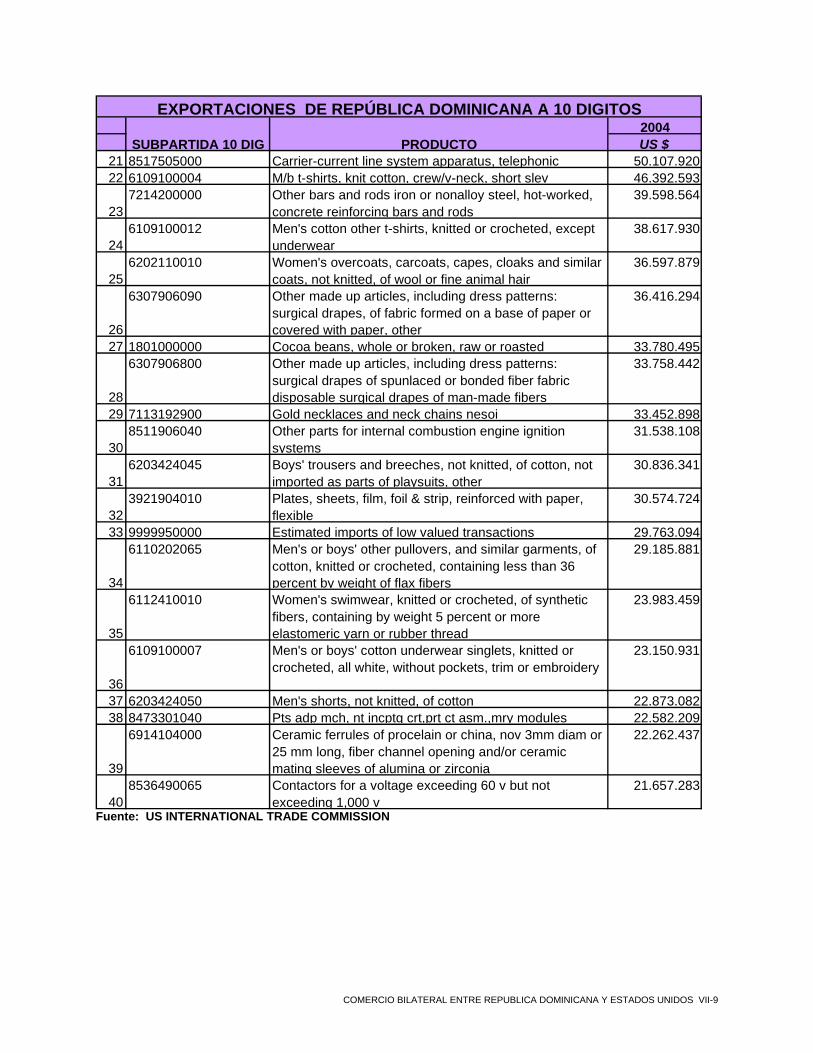
2004
21 8517505000 Carrier-current line system apparatus, telephonic 50.107.92022 6109100004 M/b t-shirts, knit cotton, crew/v-neck, short slev 46.392.593
237214200000 Other bars and rods iron or nonalloy steel, hot-worked,
concrete reinforcing bars and rods39.598.564
246109100012 Men's cotton other t-shirts, knitted or crocheted, except
underwear38.617.930
256202110010 Women's overcoats, carcoats, capes, cloaks and similar
coats, not knitted, of wool or fine animal hair36.597.879
26
6307906090 Other made up articles, including dress patterns: surgical drapes, of fabric formed on a base of paper or covered with paper, other
36.416.294
27 1801000000 Cocoa beans, whole or broken, raw or roasted 33.780.495
28
6307906800 Other made up articles, including dress patterns: surgical drapes of spunlaced or bonded fiber fabric disposable surgical drapes of man-made fibers
33.758.442
29 7113192900 Gold necklaces and neck chains nesoi 33.452.898
308511906040 Other parts for internal combustion engine ignition
systems31.538.108
316203424045 Boys' trousers and breeches, not knitted, of cotton, not
imported as parts of playsuits, other30.836.341
323921904010 Plates, sheets, film, foil & strip, reinforced with paper,
flexible30.574.724
33 9999950000 Estimated imports of low valued transactions 29.763.094
34
6110202065 Men's or boys' other pullovers, and similar garments, of cotton, knitted or crocheted, containing less than 36 percent by weight of flax fibers
29.185.881
35
6112410010 Women's swimwear, knitted or crocheted, of synthetic fibers, containing by weight 5 percent or more elastomeric yarn or rubber thread
23.983.459
36
6109100007 Men's or boys' cotton underwear singlets, knitted or crocheted, all white, without pockets, trim or embroidery
23.150.931
37 6203424050 Men's shorts, not knitted, of cotton 22.873.08238 8473301040 Pts adp mch, nt incptg crt,prt ct asm.,mry modules 22.582.209
39
6914104000 Ceramic ferrules of procelain or china, nov 3mm diam or 25 mm long, fiber channel opening and/or ceramic mating sleeves of alumina or zirconia
22.262.437
408536490065 Contactors for a voltage exceeding 60 v but not
exceeding 1,000 v21.657.283
EXPORTACIONES DE REPÚBLICA DOMINICANA A 10 DIGITOS
SUBPARTIDA 10 DIG PRODUCTO US $
Fuente: US INTERNATIONAL TRADE COMMISSION
COMERCIO BILATERAL ENTRE REPUBLICA DOMINICANA Y ESTADOS UNIDOS VII-9
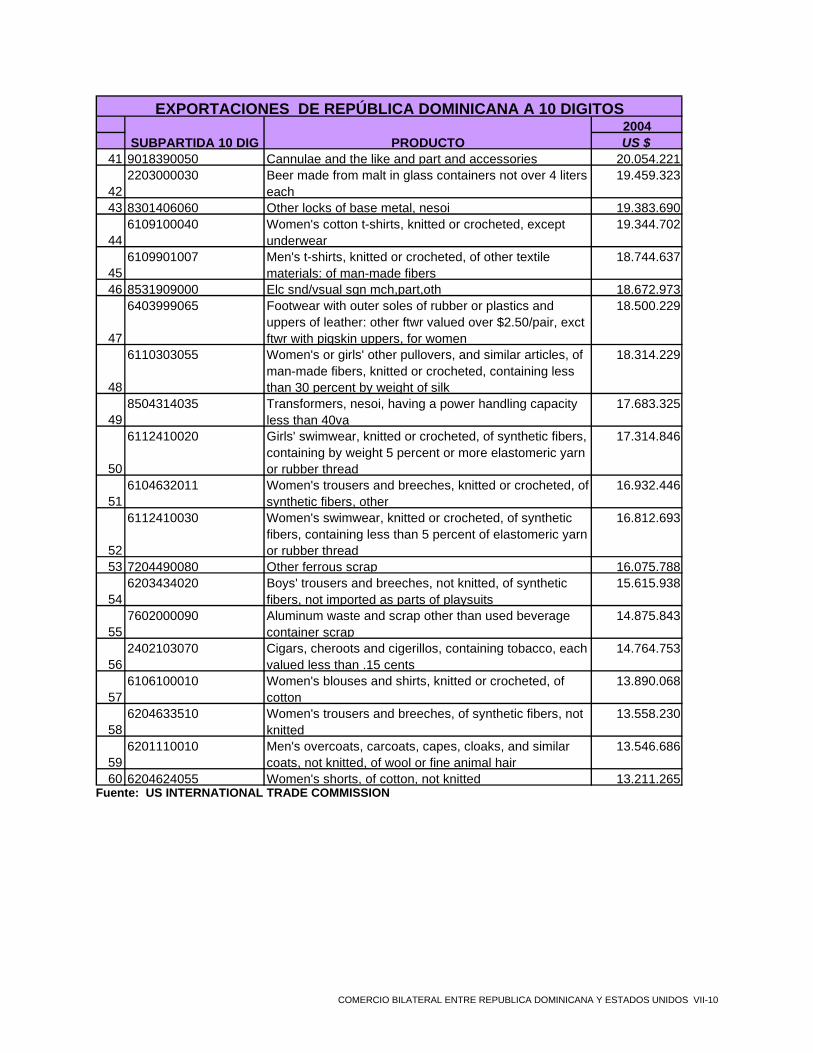
2004
41 9018390050 Cannulae and the like and part and accessories 20.054.221
422203000030 Beer made from malt in glass containers not over 4 liters
each19.459.323
43 8301406060 Other locks of base metal, nesoi 19.383.690
446109100040 Women's cotton t-shirts, knitted or crocheted, except
underwear19.344.702
456109901007 Men's t-shirts, knitted or crocheted, of other textile
materials: of man-made fibers18.744.637
46 8531909000 Elc snd/vsual sgn mch,part,oth 18.672.973
47
6403999065 Footwear with outer soles of rubber or plastics and uppers of leather: other ftwr valued over $2.50/pair, exct ftwr with pigskin uppers, for women
18.500.229
48
6110303055 Women's or girls' other pullovers, and similar articles, of man-made fibers, knitted or crocheted, containing less than 30 percent by weight of silk
18.314.229
498504314035 Transformers, nesoi, having a power handling capacity
less than 40va17.683.325
50
6112410020 Girls' swimwear, knitted or crocheted, of synthetic fibers, containing by weight 5 percent or more elastomeric yarn or rubber thread
17.314.846
516104632011 Women's trousers and breeches, knitted or crocheted, of
synthetic fibers, other16.932.446
52
6112410030 Women's swimwear, knitted or crocheted, of synthetic fibers, containing less than 5 percent of elastomeric yarn or rubber thread
16.812.693
53 7204490080 Other ferrous scrap 16.075.788
546203434020 Boys' trousers and breeches, not knitted, of synthetic
fibers, not imported as parts of playsuits15.615.938
557602000090 Aluminum waste and scrap other than used beverage
container scrap14.875.843
562402103070 Cigars, cheroots and cigerillos, containing tobacco, each
valued less than .15 cents14.764.753
576106100010 Women's blouses and shirts, knitted or crocheted, of
cotton13.890.068
586204633510 Women's trousers and breeches, of synthetic fibers, not
knitted13.558.230
596201110010 Men's overcoats, carcoats, capes, cloaks, and similar
coats, not knitted, of wool or fine animal hair13.546.686
60 6204624055 Women's shorts, of cotton, not knitted 13.211.265
EXPORTACIONES DE REPÚBLICA DOMINICANA A 10 DIGITOS
SUBPARTIDA 10 DIG PRODUCTO US $
Fuente: US INTERNATIONAL TRADE COMMISSION
COMERCIO BILATERAL ENTRE REPUBLICA DOMINICANA Y ESTADOS UNIDOS VII-10

2004
612402106000 Cigars, cheroots and cigarillos containing tobacco, each
valued $.15 or over but less than $.2313.195.873
628505190080 Nonflexible permanent magnets made of materials other
than metal12.659.298
636212200020 Girdles and panty-girdles, of man-made fibers, whether
or not knitted or crocheted12.372.552
64
6403996075 Footwear with outer soles of rubber or plastics and uppers of leather: other footwear without pigskin uppers for men.
11.895.482
651703905000 Molasses resulting from the extraction or refining of
sugar, nesoi11.833.614
66
6108320025 Girls' nightdresses and pajamas, knitted or crocheted, of man-made fibers, other than blanket sleepers
11.731.910
67
6110303040 Men's or boys' sweatshirts, of man-made fibers, knitted or crocheted, containing less than 30 percent by weight of silk or silk waste
11.580.453
68
6505908090 Hats and other headgear, not knitted, other headwear, other than for babies, not braided, except disposable headwear, of man-made fibers
11.567.520
69 8531800050 Other signaling devices, electric, nesoi 11.566.154
708536308000 Other apparatus for protecting electrical circuits, nesoi 11.253.639
71714901000 Dasheens, fresh, whether or not sliced or in the form of
pellets11.102.959
72
6202912011 Women's anoraks, wind-breakers and similar articles, not knitted, of wool or fine animal hair: other than padded or sleeveless jackets
11.014.973
736204624010 Women's trousers and breeches, of cotton, not knitted,
blue denim10.841.646
74
8504406001 Power supplies suitable for physical incorporation into automatic data processing machines or units thereof, with a power output not exceeding 50 w
10.541.596
75
6203332010 Men's suit-type jackets and blazers, not knitted, of synthetic fibers, containing less than 36 percent by weight of wool or fine animal hair
10.453.535
766205302070 Men's other shirts, of man-made fibers, not knitted, with
less than two colors in the warp and/or the filling10.383.864
77
6111206010 Babies garments and clothing accessories, knitted or crocheted, of cotton: sunsuits, washsuits, and similar apparel
10.246.955
78
2106909972 Preparations for the manufacture of beverages, nesoi, containing sugar derived from sugar cane and/or sugar beets
10.234.423
79 6105100010 Men's shirts, knitted or crocheted, of cotton 10.228.651
EXPORTACIONES DE REPÚBLICA DOMINICANA A 10 DIGITOS
SUBPARTIDA 10 DIG PRODUCTO US $
fuente: US INTERNATIONAL TRADE COMMISSION
COMERCIO BILATERAL ENTRE REPUBLICA DOMINICANA Y ESTADOS UNIDOS VII-11

SECCIÓN VIII
BIBLIOGRAFIA
SECCIÓN VIII
BIBLIOGRAFIA CEPAL, “REPÚBLICA DOMINICANA: EVOLUCIÓN ECONÓMICA DURANTE 2004 Y PERSPECTIVAS PARA 2005”. LC/MEX/L.670 21 de julio de 2005 DEPARTAMENTO DE COMERCIO DE ESTADOS UNIDOS, INFORMACIÒN ESTADISTICA EXPORTACIONES DE ESTADOS UNIDOS, ESTADISTICAS DE EXPORTACIÒN AL MUNDO Y A REPUBLICA DOMINICANA 1999, 2000, 2001, 2002, 2003 Y 2004 POR PRODUCTOS, POR SECTORES Y POR CAPITULOS DEL ARANCEL. DEPARTAMENTO DE COMERCIO DE ESTADOS UNIDOS , INFORMACIÒN ESTADISTICA IMPORTACIONES DE ESTADOS UNIDOS, ESTADISTICAS DE IMPORTACION AL MUNDO Y A REPUBLICA DOMINICANA 1999, 2000, 2001, 2002, 2003 Y 2004, POR PRODUCTOS, POR SECTORES Y POR CAPITULOS DEL ARANCEL. SEGOVIA ALEXANDER, “EL IMPACTO DEL CAFTA SOBRE EL MODELO DE DESARROLLO DE CENTROAMÉRICA” (Avance de Investigación) Agosto de 2004
COMERCIO BILATERAL ENTRE REPUBLICA DOMINICANA Y ESTADOS UNIDOS A-2

ANEXO A DESCRIPCION DE LOS CAPÍTULOS DEL ARANCEL
COMERCIO BILATERAL ENTRE REPUBLICA DOMINICANA Y ESTADOS UNIDOS A-2

ANEXO A DESCRIPCION DE LOS CAPÍTULOS DEL ARANCEL
SECTOR CAPITULO DESCRIPCIONPECUARIO 1 ANIMALES VIVOSPECUARIO 2 CARNE PECUARIO 3 PESCADO Y CRUSTACEOSPECUARIO 4 LECHE Y PRODUCTOS LACTEOS, HUEVOS, MIELPECUARIO 5 LOS DEMAS PRODUCTOS DE ORIGEN ANIMALAGRICOLA 6 PLANTAS VIVAS Y FLORESAGRICOLA 7 HORTALIZASAGRICOLA 8 FRUTASAGRICOLA 9 CAFÉ, TE, MATE ESPECIASAGRICOLA 10 CEREALESAGRICOLA 11 MOLINERIAAGRICOLA 12 SEMILLAS OLEAGINOSAS, PLANTAS MEDICINALES, FORRAJEAGRICOLA 13 GOMAS, RESINAS, JUGOS Y EXTRACTOS VEGETALESAGRICOLA 14 MATERIAL TRENZABLE Y DEMAS PRODUCTOS VEGETALESAGROINDUSTRIAL 15 ACEITES Y GRASAS ANIMALES Y VEGETALESAGROINDUSTRIAL 16 PREPARACIONES DE CARNE, PESCADO Y CRUSTACEOSAGROINDUSTRIAL 17 AZÚCAR Y CONFITERIAAGROINDUSTRIAL 18 CACAO Y SUS PREPARACIONESAGROINDUSTRIAL 19 PRODUCTOS DE CEREALES, HARINA Y PASTELERIAAGROINDUSTRIAL 20 PREPARACIONES DE HORTALIZAS Y FRUTASAGROINDUSTRIAL 21 ALIMENTOS DIVERSOSAGROINDUSTRIAL 22 BEBIDAS, BEBIDAS ALCOHOLICAS Y VINAGREAGROINDUSTRIAL 23 RESIDUOS ALIMENTICIOS Y ALIMENTOS PARA ANIMALESAGROINDUSTRIAL 24 TABACOMINERALES Y COMBUSTIBLES 25 SAL, AZUFRE, TIERRAS, PIEDRAS, YESOS, CALES Y CEMENTOSMINERALES Y COMBUSTIBLES 26 MINERALES METALIFEROS, ESCORIAS Y CENIZASMINERALES Y COMBUSTIBLES 27 COMBUSTIBLES, ACEITESQUIMICO Y FARMACEUTICO 28 QUIMICOS INORGANICOSQUIMICO Y FARMACEUTICO 29 QUIMICOS ORGANICOSQUIMICO Y FARMACEUTICO 30 PRODUCTOS FARMACEUTICOSQUIMICO Y FARMACEUTICO 31 ABONOS
QUIMICO Y FARMACEUTICO 32 EXTRACTOS CURTIENTES, TANINOS, PIGMENTOS, PINTURAS Y OTROS COLORANTES
QUIMICO Y FARMACEUTICO 33 PERFUMERIA Y COSMETICAQUIMICO Y FARMACEUTICO 34 JABONES, VELAS, CERAS Y PRODUCTOS PARA ODONTOLOGIAQUIMICO Y FARMACEUTICO 35 MATERIAS ALBUMINOIDEAS, ALMIDON, COLASQUIMICO Y FARMACEUTICO 36 POLVORAQUIMICO Y FARMACEUTICO 37 PRODUCTOS FOTOGRAFICOSQUIMICO Y FARMACEUTICO 38 OTROS QUIMICOSPLASTICO Y CAUCHO 39 PLASTICO Y SUS MANUFACTURASPLASTICO Y CAUCHO 40 CAUCHO Y SUS MANUFACTURASCUERO Y SUS MANUFACTURAS 41 PIELESCUERO Y SUS MANUFACTURAS 42 MANUFACTURAS DE CUEROCUERO Y SUS MANUFACTURAS 43 PELETERIAMADERA Y SUS MANUFACTURAS 44 MADERA, CARBON VEGETAL Y MANUFACTURAS DE MADERAMADERA Y SUS MANUFACTURAS 45 CORCHO Y SUS MANUFACTURASMADERA Y SUS MANUFACTURAS 46 MANUFACTURAS DE CESTERIAEDITORIAL Y ARTES GRAFICAS 47 PASTA DE MADERA, PAPEL O CARTON PARA RECICLAREDITORIAL Y ARTES GRAFICAS 48 PAPEL Y CARTON Y SUS MANUFACTURASEDITORIAL Y ARTES GRAFICAS 49 EDITORIAL Y ARTES GRAFICAS
COMERCIO BILATERAL ENTRE REPUBLICA DOMINICANA Y ESTADOS UNIDOS A-2

SECTOR CAPITULO DESCRIPCIONTEXTILES 50 SEDATEXTILES 51 LANATEXTILES 52 ALGODÓNTEXTILES 53 LAS DEMAS FIBRAS TEXTILES VEGETALESTEXTILES 54 FILAMENTOS SINTETICOS O ARTIFICIALESTEXTILES 55 FIBRAS SISNTETICAS O ARTIFICIALESTEXTILES 56 GUATA, HILADOS ESPECIALES CUERDAS Y CORDELESTEXTILES 57 ALFOMBRASTEXTILES 58 TEJIDOS ESPECIALESTEXTILES 59 TELAS IMPREGNADASTEXTILES 60 TEJIDOS DE PUNTOCONFECCIONES 61 PRENDAS DE VESTIR DE PUNTOCONFECCIONES 62 PRENDAS DE VESTIR TEJIDO PLANOCONFECCIONES 63 OTRAS CONFECCIONESCALZADO 64 CALZADOMANUFACTURAS DIVERSAS 65 SOMBREROSMANUFACTURAS DIVERSAS 66 PARAGUAS, BASTONES, FUSTAS, LATIGOSMANUFACTURAS DIVERSAS 67 PLUMAS, FLORES ARTIFICIALES Y MANUFACTURAS PARA EL CABELLOMINERALES NO METALICOS 68 MANUFACTURAS DE PIEDRA, YESO, CEMENTOMINERALES NO METALICOS 69 PRODUCTOS CERAMICOSMINERALES NO METALICOS 70 VIDRIO Y SUS MANUFACTURASJOYERIA Y RELOJERIA 71 JOYERIAMETALES COMUNES Y SUS MANUFACTURAS 72 FUNDICION HIERRO Y ACEROMETALES COMUNES Y SUS MANUFACTURAS 73 MANUFACTURAS DE FUNDICION HIERRO Y ACEROMETALES COMUNES Y SUS MANUFACTURAS 74 COBRE Y SUS MANUFACTURASMETALES COMUNES Y SUS MANUFACTURAS 75 NIQUEL Y SUS MANUFACTURASMETALES COMUNES Y SUS MANUFACTURAS 76 ALUMINIO Y SUS MANUFACTURASMETALES COMUNES Y SUS MANUFACTURAS 78 PLOMO Y SUS MANUFACTURASMETALES COMUNES Y SUS MANUFACTURAS 79 CINC Y SUS MANUFACTURASMETALES COMUNES Y SUS MANUFACTURAS 80 ESTAÑO Y SUS MANUFACTURASMETALES COMUNES Y SUS MANUFACTURAS 81 LOS DEMAS METALES COMUNESMETALES COMUNES Y SUS MANUFACTURAS 82 HERRAMIENTAS, CUCHILLOS, CUBIERTOS METALES COMUNES Y SUS MANUFACTURAS 83 MANUFACTURAS DIVERSAS DE METALES COMUNESMAQUINARIA Y EQUIPO MECANICOS 84 MAQUINARIA Y EQUIPO MECANICOMAQUINARIA Y EQUIPO ELECTRICO 85 MAQUINARIA Y EQUIPO ELECTRICOEQUIPO PARA TRANSPORTE 86 VEHICULOS Y MATERIAL FERREOEQUIPO PARA TRANSPORTE 87 VEHICULOS TERRESTRES Y SU PARTESEQUIPO PARA TRANSPORTE 88 AERONAVES Y SUS PARTESEQUIPO PARA TRANSPORTE 89 BARCOSINSTRUMENTOS DE MEDIDA, MEDICOQUIRURGICOS Y VETERINARIO 90 INSTRUMENTOS DE MEDIDA, PRECISION, OPTICA Y MEDICOQUIRURGICOS
JOYERIA Y RELOJERIA 91 RELOJES Y SUS PARTESMANUFACTURAS DIVERSAS 92 INSTRUMENTOS MUSICALESOTROS 93 ARMAS Y MUNICIONES
MUEBLES Y ARTICULOS DE ALUMBRADO 94 MUEBLES, MOBILIARIO MEDICOQUIRURGICO, ARTICULOS DE CAMA Y APARATOS PARA ALUMBRADO
MANUFACTURAS DIVERSAS 95 JUGUETES Y JUEGOSMANUFACTURAS DIVERSAS 96 MANUFACTURAS DIVERSASMANUFACTURAS DIVERSAS 97 OBJETO DE ARTEOTROS 98 TRATAMIENTO ESPECIALOTROS 99 OTROS
COMERCIO BILATERAL ENTRE REPUBLICA DOMINICANA Y ESTADOS UNIDOS A-2