yucatan future fund report - the climate group
TRANSCRIPT
User Manual Footprint Manager of the State Government of
Yucatan
Elaborated by: Carbon Trust México S.A. de C.V. Domicilio: Andrés Bello 10, P-10, Col. Polanco, Delegación Miguel Hidalgo, C.P. 11560, Ciudad de México. In collaboration with: Secretaría de Desarrollo Urbano y Medio Ambiente Gobierno del Estado de Yucatán Mérida, Yucatán. Financing by:
2
Content Governor´s speech ....................................................................................................................... 6
Introduction ................................................................................................................................ 7
Background ................................................................................................................................. 8
Carbon Management Plan .................................................................................................................. 8
Sustainable Footprint Initiative ........................................................................................................... 8
General Objective ........................................................................................................................ 9
Carbon Footprint Manager ............................................................................................................... 10
Greenhouse Gas Protocol ............................................................................................................. 10
Scope and Limits ............................................................................................................................... 10
Methodology ..................................................................................................................................... 11
Emissions Report ............................................................................................................................... 13
Emissions reported to the Carbon Footprint Manager .................................................................... 16
Emissions by Scope 1 .................................................................................................................... 16
Emissions by Scope 2 .................................................................................................................... 17
Access to the system .................................................................................................................. 18
Link to the system ............................................................................................................................. 18
Use of the tool ........................................................................................................................... 19
General User .............................................................................................................................. 19
System architecture .......................................................................................................................... 19
Entering data ..................................................................................................................................... 21
User Administrator .................................................................................................................... 27
System Architecture .......................................................................................................................... 27
Administrator Setup ..................................................................................................................... 27
Year Setup ..................................................................................................................................... 28
Conversion factor Setup ............................................................................................................... 28
Emission factor Setup ................................................................................................................... 28
User Setup .................................................................................................................................... 29
Administration synthesis ............................................................................................................. 29
Submission Status ............................................................................................................................. 29
Validation .......................................................................................................................................... 29
Results ....................................................................................................................................... 31
Carbon Dashboard ........................................................................................................................ 31
Outputs ......................................................................................................................................... 32
Logout ....................................................................................................................................... 34
Governmental Reporting Mechanism ......................................................................................... 36
How to collect the information? ....................................................................................................... 37

3
Reports .............................................................................................................................................. 38

4
Figures
Figure 1 Commitment sign of the "Sustainable Footprint” Program ..................................................... 9
Figure 2 Stages of the Program “Sustainable Footprint” ........................................................................ 9
Figure 3 Service of the Footprint Manager ........................................................................................... 11
Figure 4 GHG emissions according to its scope .................................................................................... 13
Figure 5 Login Screen ............................................................................................................................ 18
Figure 6 Change password .................................................................................................................... 19
Figure 7 System Architecture ................................................................................................................ 20
Figure 8 Standard and synthesis sheets ................................................................................................ 20
Figure 9 Reports .................................................................................................................................... 21
Figure 10 Entering Data ........................................................................................................................ 22
Figure 11 Purchased energy data ......................................................................................................... 22
Figure 12 Company vehicle data ........................................................................................................... 23
Figure 13 Year Selection........................................................................................................................ 23
Figure 14 Entering fuel and electricity data .......................................................................................... 24
Figure 15 Uploading Documents........................................................................................................... 25
Figure 16 Select file ............................................................................................................................... 25
Figure 17 Relevant file .......................................................................................................................... 26
Figure 18 Upload document ................................................................................................................. 26
Figure 19 Comments ............................................................................................................................. 27
Figure 20 Administrator User Setup ..................................................................................................... 27
Figure 21 Administrator Setup sheet .................................................................................................... 28
Figure 22 Administration synthesis ....................................................................................................... 29
Figure 23 Submission information ........................................................................................................ 30
Figure 24 Validation .............................................................................................................................. 30
Figure 25 Results Graphs ...................................................................................................................... 32
Figure 26 GHG emissions by scope ....................................................................................................... 33
Figure 27 GHG emissions by scope ....................................................................................................... 34
Figure 28 Log out .................................................................................................................................. 35
Figure 29 Entering data energy consumption....................................................................................... 37
Figure 30 Entering data fuel consumption ........................................................................................... 38

5
Tables
Table 1 Example of calculation of equivalent CO2 emissions for mobile sources ................................ 14
Table 2 Examples of Global Warming Potential (GWP) ........................................................................ 15
Table 3: Calculation of the equivalences of each gas in CO2 using the GWP ........................................ 15
Table 4 Equivalencias de cada gas en CO2 ............................................................................................ 15
Table 5 Calculation of indirect CO2e emissions from electric power consumption ............................. 16

6
Governor´s speech
The State Government of Yucatan shares the global concern
about climate change and recognizes the need to
participate in the effort to address and contain its effects.
Therefore, to be a leading government in sustainable energy
and mitigation of climate change, we have proposed to
reduce greenhouse gas emissions that are generated
directly or indirectly by the State Public Administration. This
will only be achieved with the effort, support and
commitment of all government institutions.
In this regard, it is essential to use a tool to monitor the
performance of our emissions reductions, for which we
have developed a Web Platform for the Monitoring of the
Carbon Management Plan of the State Government of
Yucatan.
This project would not have been possible without the
support of the States & Regions Alliance-Future Fund, and in particular, we thank the governments of
Ontario, Quebec, Scotland, South Australia and Wales and our colleagues from the States & Regions
Alliance for contributing to the development of this project. This will contribute to reach the
established mitigation goals of the State, as well as in the promotion of the transparency of results in
the reduction of GHG emissions both locally and internationally.
7
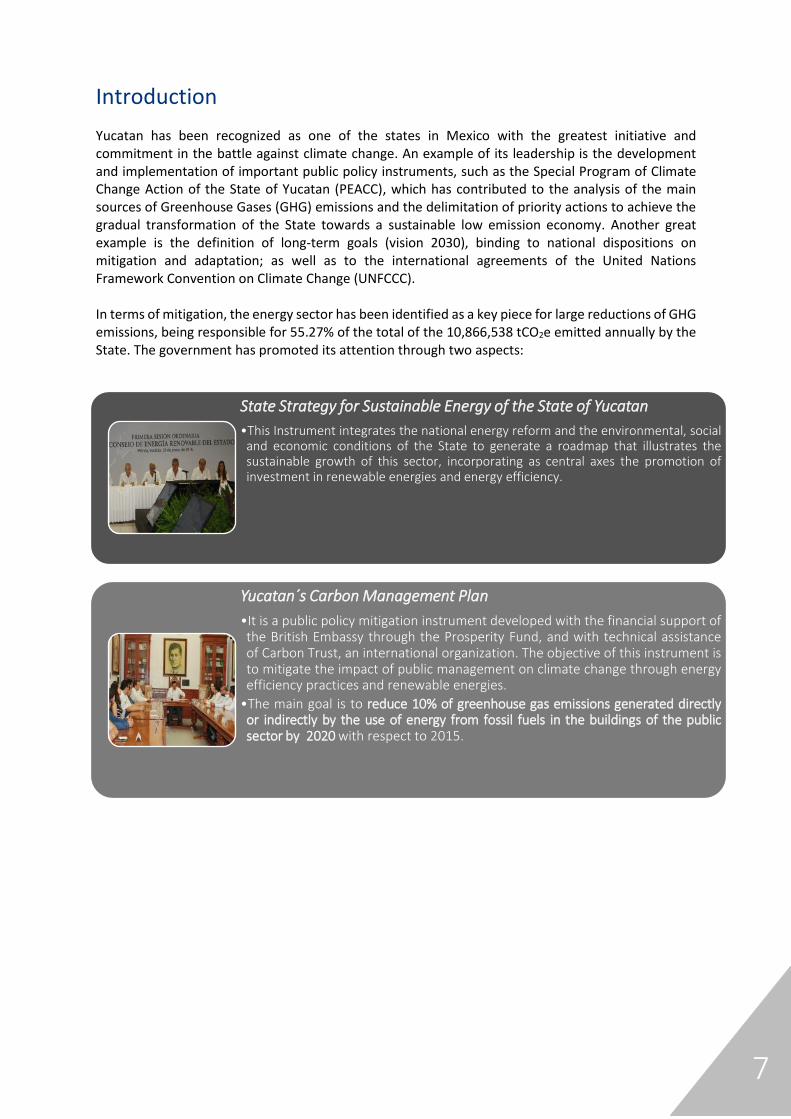
Introduction
Yucatan has been recognized as one of the states in Mexico with the greatest initiative and commitment in the battle against climate change. An example of its leadership is the development and implementation of important public policy instruments, such as the Special Program of Climate Change Action of the State of Yucatan (PEACC), which has contributed to the analysis of the main sources of Greenhouse Gases (GHG) emissions and the delimitation of priority actions to achieve the gradual transformation of the State towards a sustainable low emission economy. Another great example is the definition of long-term goals (vision 2030), binding to national dispositions on mitigation and adaptation; as well as to the international agreements of the United Nations Framework Convention on Climate Change (UNFCCC). In terms of mitigation, the energy sector has been identified as a key piece for large reductions of GHG emissions, being responsible for 55.27% of the total of the 10,866,538 tCO2e emitted annually by the State. The government has promoted its attention through two aspects:
State Strategy for Sustainable Energy of the State of Yucatan
•This Instrument integrates the national energy reform and the environmental, socialand economic conditions of the State to generate a roadmap that illustrates thesustainable growth of this sector, incorporating as central axes the promotion ofinvestment in renewable energies and energy efficiency.
Yucatan´s Carbon Management Plan
•It is a public policy mitigation instrument developed with the financial support ofthe British Embassy through the Prosperity Fund, and with technical assistanceof Carbon Trust, an international organization. The objective of this instrument isto mitigate the impact of public management on climate change through energyefficiency practices and renewable energies.
•The main goal is to reduce 10% of greenhouse gas emissions generated directlyor indirectly by the use of energy from fossil fuels in the buildings of the publicsector by 2020with respect to 2015.

8
Background
Carbon Management Plan
The Carbon Management Plan establishes actions to reduce the consumption of electric power in public buildings and the consumption of gasoline and diesel in the vehicle fleet of the state public administration in a period of five years. The identification of energy efficiency opportunities and the implementation of cost-effective measures will allow the state government to reduce 10% of the GHG emissions generated directly or indirectly using energy from fossil fuels in the public buildings by 2020. This public policy instrument incorporates an analysis of the direct (Scope 1) and indirect (Scope 2) carbon emissions of 2015, derived from the fuel consumption of the state-owned vehicle fleet with an approximate value of 45,290 tons of CO2e, and from the use of electricity in public buildings with a value of 38,966 tons of CO2e. This led to the definition of a baseline of 84,257 tons of CO2e, which percentage value of Scope 1 is 53.8% and 46.2 % of Scope 2. Moreover, the annual costs associated with the use of fuel in the vehicle fleet and electricity consumption in buildings were calculated with the same base year. These costs ascended to 403,908.646 million pesos, equivalent to 63% of the cost for Scope 1 and 37% for Scope 2. The fuel consumption generated a cost of $256, 120,383 million pesos and the electricity consumption a value of $147, 788,263 million pesos. One of the main highlights of the evaluation of energy consumption of public buildings and state-owned facilities is that facilities for the provision of drinking water, offices, hospitals, water treatment plants, schools (high school level), as well as sports units were identified as the main emitters of GHG. To achieve the reduction of GHG emissions, the plan delimits the implementation of energy efficiency actions in coordination with 20 state government institutions, which were identified with the greatest contribution to GHG emissions. As well as the implementation of potential projects of renewable energy.
Sustainable Footprint Initiative
The State has formalized its commitment to reduce the emissions produced by the governmental sector, starting in 2017 with the implementation phase of the Carbon Management Plan through the "Sustainable Footprint: Actions that set the course of the planet" program sponsored by the constitutional Governor, Rolando Rodrigo Zapata Bello (figure 1)

9
Figure 1 Commitment sign of the "Sustainable Footprint” Program Source: SEDUMA
This program promotes energy efficiency and the efficient use of material resources within
public buildings through the implementation of 4 stages (figure 2) of work that include the
training of public officials, the implementation of actions that reduce energy consumption at
the institutional level and the efficient use of paper, as well as mechanisms for monitoring
and evaluating results.
Through these actions, the state government seeks to highlight and potentiate the benefits
of the efficient use of energy resources, as well as to promote the gradual transition towards
the use of renewable energies within the public administration.
Figure 2 Stages of the Program “Sustainable Footprint” Source: SEDUMA
General Objective
The objective of this document is to describe in detail the operation of the "Web Platform for Carbon Footprint Manager". The platform is a tool based on a Service Software (Saas, for its acronym in English) developed by the Carbon Trust under the name of Footprint Manager.
Institutional Commitee startup
Training and implementation of energy efficiency practices
Training and implementation of efficient use of paper practices
Measurement and Validation of results
10
With this tool the Government of Yucatán will seek to estimate its CO2 emissions to contribute to the national mitigation goals.
Carbon Footprint Manager
In accordance with the Greenhouse Gas (GHG) Protocol, the tool allows the calculation and registry of direct (Scope 1) and indirect (Scope 2) emissions.
The Footprint Manager calculates carbon emissions for the following sources: • Purchased energy • Government fleet of vehicles
Greenhouse Gas Protocol
The Greenhouse Gas Protocol (GHG Protocol) is the world's most used greenhouse gas accounting standard by governments and business leaders to understand, quantify and manage greenhouse gas emissions. The GHG Reporting programs provide a platform to collect emissions data from different entities and help to integrate the measurement and reporting of emissions. Mexico is one of the 40 countries that has a mandatory GHG reporting system. Under this scenario, the question that arises is: why is it important to establish an emissions reporting system? Therefore, it is established that it:
➢ Facilitates the formulation of realistic and effective policies by analysing emissions in different level (entity, sector or economy-wide).
➢ Supports policies and regulations such as emissions trading schemes that require very detailed data.
➢ Provides information to stakeholders to facilitate their participation. ➢ Reports national inventories to international organizations (United Nations
Framework Convention on Climate Change.)
Scope and Limits
The Footprint Manager calculates the emissions of greenhouse gases from the buildings and processes of the centralized and decentralized public administration of the State Government of Yucatan, of which they have full authority to introduce and implement policies about real estate and processes. The tool will make it possible to manage data online, as well as to measure and monitor the environmental performance of its dependencies and its users (figure 3). In Carbon Trust´s experience, organizations can reduce their energy costs up to 20% through regular energy monitoring and simple energy efficiency measures.
Supported by Carbon Trust

11
Figure 3 Service of the Footprint Manager Fuente: The Carbon Trust
Methodology
The Footprint Manager is based on the methodology of the Greenhouse Gases Protocol, a recognized international accounting tool, accepted and used by governments and business leaders to understand, quantify and manage greenhouse gas (GHG) emissions. Classification of the emissions according to their scope Scope 1: Direct GHG emissions. Companies report as Scope 1 the direct GHG emissions from their own or controlled sources. Direct GHG emissions are mainly the result of the following type of activities:
➢ Generation of electricity, heat or steam. These emissions result from the combustion of fuels in fixed sources: boilers, furnaces, turbines, etc.
➢ Physical or chemical processes. Most of these emissions result from the manufacture or processing of chemicals and materials, such as cement, aluminium, adipic acid, ammonia manufacturing, and waste processing.
➢ Transport of materials, products, waste and employees. These emissions result from the combustion of fuels in mobile sources that are owned or controlled by the company: trucks, trains, ships, airplanes, buses and automobiles.
➢ Fugitive emissions. These emissions result from intentional or unintentional releases, such as leaks in gaskets, seals or packaging of equipment; methane emissions from coal mines and hydrofluorocarbon emissions (HFCs) from air conditioning and refrigeration equipment; and methane leaks in gas transport.
Scope 2: Indirect GHG emissions Companies report as Scope 2 the emissions produced by the generation of electricity, heat or steam acquired that is consumed in their operations or in their owned or controlled equipment. Scope 2 emissions are a special category of indirect emissions. For many
12
companies, the purchased electricity represents one of the most important sources of GHG emissions, and the most significant opportunity to reduce emissions. Accounting Scope 2 emissions allows companies to assess the risks and opportunities associated with the changing costs of electricity and GHG emissions. Another important reason why companies monitor these emissions is that the information may be required for some GHG programs. Scope 3: Other GHG emissions These indirect emissions are a consequence of the company's activities, but they are produced from sources that are not owned or controlled by the reporting company. Some examples are:
- Production and extraction of purchased materials and fuels - Activities related to transport from vehicles that do not belong or are not controlled
by the reporting entity - Activities related to electricity that are not included in scope 2 - Waste disposal - Outsourced activities
“Footprint Manager” Scope
According to the methodology of the GHG Protocol, the "Footprint Manager" will allow the estimation of the emissions by Scope 1 and 2. The Scope 1, are those direct emissions by fuel consumption in the vehicle fleet of the public administration and Scope 2 are the indirect emissions from the purchase of electric power from the Federal Electricity Commission (CFE).

13
Figure 4 GHG emissions according to its scope Source: GHG Protocol
Emissions Report GHG emissions are calculated by multiplying the activity data, for example, litres of fuel multiplied by the emission factor that represent the activity in question (e.g. tons of CO2 per litre of fuel). Unless otherwise is indicated, all the emissions factors used in the Footprint Manager come from official sources of the federal government published in the framework of the National Registry of Emissions (RENE). Greenhouse gases are reported in units of carbon dioxide equivalent (CO2e), to homologate the different GHGs in CO2e the tool uses the Global Warming Potential (GWP). The GWP values used in the Footprint Manager, as well as the calorific powers are taken from the National Emissions Registry (RENE). The "User's Guide to the National Emissions Registry"1 presents the process to calculate the equivalent CO2 emissions from mobile sources in the following way:
Eco2 = VC x PC x FEco2
ECH4 = VC x PC x FECH4
EN2O = VC x PC x FEN2O Where: Eco2: Emissions of carbon dioxide in tons (t)
1 http://www.semarnat.gob.mx/sites/default/files/documentos/cicc/20160623_guia_rene.pdf

14
ECH4: Methane emissions in kilograms (kg) EN2O: Nitrous oxide emissions in kilograms (kg) VC: Fuel consumption per year in litres (l) or cubic meters (m3) PC: calorific value of each fuel (MJ / l or MJ / m3) FE: Emission factor of each gas (t / MJ or kg / MJ) With data on the fuels of each dependency and the calorific value of the fuels, which can be obtained annually from the National Commission for the Efficient Use of Energy (CONUEE), the data are replaced in the formulas described above. Below is an example with generic data to illustrate the calculation. The example should not be considered as calculations for the dependencies of the State of Yucatan.
Table 1 Example of calculation of equivalent CO2 emissions for mobile sources
Eco2 = VC x PC x FEco2 Fuels VC PC FEco2 (tCO2/MJ) Eco2 (tCO2) Gasoline 4,500,000 (l) 32.216 (MJ/l) 0.0000693 10,046.56 Diesel 3,300,000 (l) 35.5374 (MJ/l) 0.0000741 8,689.96 Natural Gas 3,050,000 (m3) 36.569 (MJ/m3) 0.0000561 6,257.14 TOTAL 24,993.66 ECH4 = VC x PC x FECH4 Fuels VC PC FECH4 (kgCH4/MJ) ECH4 (kg CH4) Gasoline 4,500,000 (l) 32.216 (MJ/l) 0.000025 3,624.30 Diesel 3,300,000 (l) 35.5374 (MJ/l) 0.0000039 457.37 Natural Gas 3,050,000 (m3) 36.569 (MJ/m3) 0.000092 10,261.26 TOTAL 14,342.93 EN2O = VC x PC x FEN2O
Fuels VC PC FEN20 (kg N2O/MJ) EN2O (kg N2O) Gasoline 4,500,000 (l) 32.216 (MJ/l) 0.000008 1,159.78 Diesel 3,300,000 (l) 35.5374 (MJ/l) 0.0000039 457.37 Natural Gas 3,050,000 (m3) 36.569 (MJ/m3) 0.000003 334.61 TOTAL 1,951.75
Source: SEMARNAT
After transforming the units of kilograms to tons of each gas, the result is: ECO2 =24,993.66 [t CO2] ECH4 =14.34 [t CH4] EN2O=1.95 [t N2O] Once the equivalences of each gas have been calculated, they are transformed into carbon dioxide equivalent (CO2e), the following formulas will be used:
Eco2e(co2) = Eco2
Eco2e(CH4) = E(CH4) x GWPCH4
Eco2e(N2O) = E(N2O) x GWPN2O Where: GWP: Global Warming Potential. Eco2e: Emissions of carbon dioxide equivalent of each gas in tons (CH4, N2O) (t)
The following table shows examples of the Global Warming Potential (GWP) of some gases

15
Table 2 Examples of Global Warming Potential (GWP)
Gas or Compounds GWP to 100 years Carbon dioxide (CO2) 1 Methane (CH4) 28 Nitrous Oxide (N2O) 265
Source: SEMARNAT
Using the previous values of the GWP you will get the following results:
Table 3: Calculation of the equivalences of each gas in CO2 using the GWP
Eco2 (t CO2) GWPCO2 ECO2 e(CO2) (t)
Eco2 e(co2) = Eco2 24,993.66 1 24,993.66
EcH4 (t CH4) GWPCH4 ECO2 e(CH4) (t)
Eco2 e(cH4) = E(cH4)*GWPCH4 14.34 28 401.52
EN2O (t N2O) GWPN2O ECO2 e(N2O) (t)
Eco2 e(N2O) = E(N2O)*GWPN2O 1.95 265 516.75 Source: SEMARNAT
Once these values have been obtained, the equivalences of each gas will be added, resulting in the total of CO2 equivalent of all the fuels used by the mobile sources:
Table 4 Equivalencias de cada gas en CO2
ECO2 e(CO2) (t) ECO2 e(CH4) (t) ECO2 e(N2O) (t) ECO2 e total (t)
24,993.66 401.52 516.75 25,911.93
Source: SEMARNAT
The final result is 25,911.93 tCO2e generated in a year for a mobile source. To determine the indirect CO2e emission derived from the electric energy consumption, the following formula will be applied:
Eco2 e = WElect x FEElect Where: Eco2 e: is the equivalent carbon emission from the electric energy consumption in tons (t) WElect: is the annual electricity consumption in Megawatts-hour (MWh) FEElect: it is the emission factor for electricity consumption, tons of CO2 per Megawatts-hour (tCO2/MWh).

16
When the supplier of electricity is the Federal Electricity Commission (CFE), the emission factor for electricity consumption changes annually and must be consulted through the SEMARNAT page before doing the corresponding calculations. Given the case that the electric power supplier is different from the one already mentioned, the emission factor that must be used is provided by the supplier. To carry out the application of this formula it is necessary to previously compile the amount of electricity consumed. In this way the data is grouped and replaced in the corresponding formula:
Table 5 Calculation of indirect CO2e emissions from electric power consumption
WElect (MWh) FEElect (tCO2 / MWh) ECO2 e (t)
55,921.00 0.46 25,499.976
Source: SEMARNAT
The final result is 25,499,976 tCO2e generated in a year by the consumption of electricity.
Emissions reported to the Carbon Footprint Manager
Emissions by Scope 1
Use for stationary fuel sources Stationary fuel sources refer to the direct combustion of fuels in stationary sources within the sites of an organization. For example, natural gas burned in boilers, diesel burned in generators, etc. These are sources of direct GHG emissions from Scope 1. The Mexican government, through the National Institute of Ecology and Climate Change (INECC), in collaboration with the Mexican Petroleum Institute (IMP), publishes the "Emission factors for different types of fossil and alternative fuels consumed in Mexico"2. The objective is to determine the emission factors, based on their carbon content per unit of energy, of the main fuels consumed in Mexico in the energy, transport, industrial, commercial and residential sectors, including: gasoline (magna and premium), diesel (automotive, industrial and marine), fuel oil (light and heavy), coal (thermal and steel), petroleum coke, coal coke, natural gas, propane gas, butane gas, diesel, waste gas, liquefied petroleum gas used in transportation and industry and those used in aviation. Natural Gas
Natural gas is one of the most common sources of emissions for organizations. GHG emissions are obtained using the following formula: Natural gas CO2e (tons) = Natural gas consumed (kWh, m3, tons) x Natural gas emission factor (kg CO2e / kWh, m3, tons)
2 https://www.gob.mx/cms/uploads/attachment/file/110131/CGCCDBC_2014_FE_tipos_combustibles_fosiles.pdf

17
Other fuels
GHG emissions for other on-site fuel sources (eg, fuel oil, diesel, coal) are calculated in the same way as natural gas. Fuels in mobile sources (Company vehicles)
The emissions of the company's vehicles arise from the combustion of liquid fuels in vehicles that are owned or operated by the organization. These are sources of direct GHG emissions from Scope 1. GHG emissions are calculated as follows: Fuel CO2e (tons) = Consumed Fuel (litres, tons, m3, kWh) x Fuel emission factor (kg CO2e / litres, tons, m3, kWh)
Emissions by Scope 2
Purchased energy The purchased energy consists of the electricity consumed in government agencies and entities. These are sources of indirect GHG emissions from Scope 2. Scope 2 emissions are energy emissions that are generated elsewhere but are purchased and consumed in the operations of the reporting organization. Electricity
The GHG emissions of purchased electricity are calculated using the following formula: Electricity CO2e (tons) = Consumed Electricity (kWh) x Country-specific electricity emission factor (kg CO2e / kWh)

18
Access to the system
To access the tool "Footprint Manager” of the State of Yucatan, use the following link:
Link to the system
https://yucatangob.ctfootprintmanager.com/en/
Once you have accessed the link the initial screen will be shown as follows (figure 5):
Figure 5 Login Screen
In this section, the user must enter their Username and Password, which were provided via email. When entering the corresponding data, you must click on Login. Once you have logged in, you can change your Password using the User Option located on the far-right side of the panel, as shown in figure 6.

19
Figure 6 Change password
Use of the tool
The platform has two types of users: - General User: He/She will be responsible of feeding the platform with the energy
information of the properties assigned to the corresponding unit. This user has limited access to the exclusive pages of the dependency at his charge to upload the corresponding information.
- Administrator User: Is responsible for reviewing and approving the information stored in the tool. He has access to all the elements of the tool.
This section is divided into two parts: the first part will describe the use of the tool for the General User and the second part will serve the Administrator User.
General User
In this section, the use of the tool for general users will be described.
System architecture
In figure 7 you can see how the system is structured.

20
Figure 7 System Architecture
In number 1, there is the Navigation Panel, in which all the elements available to the user are presented. This includes:
➢ Dashboard and Outputs for viewing results. ➢ Input sheets for data entry ➢ Overview and Status for tracking data entry progress
Number 2, Double clicking on a sheet opens it in this bar and displays the contents in the viewing panel.
➢ As sheets are opened they will be display along this bar ➢ User can switch between open sheets by clicking on tabs ➢ Sheets can be closed by clicking on the ‘X’ symbol on the tab on this bar.
Number 3 illustrates the icons that will help to export and save the information in EXCEL and PDF files. Some sheets have these icons to export graphs or tables. There are two standard sheets (purchased energy and company vehicles) for the data collection and a summary to collect the uploaded data (figure 8).
Figure 8 Standard and synthesis sheets
21
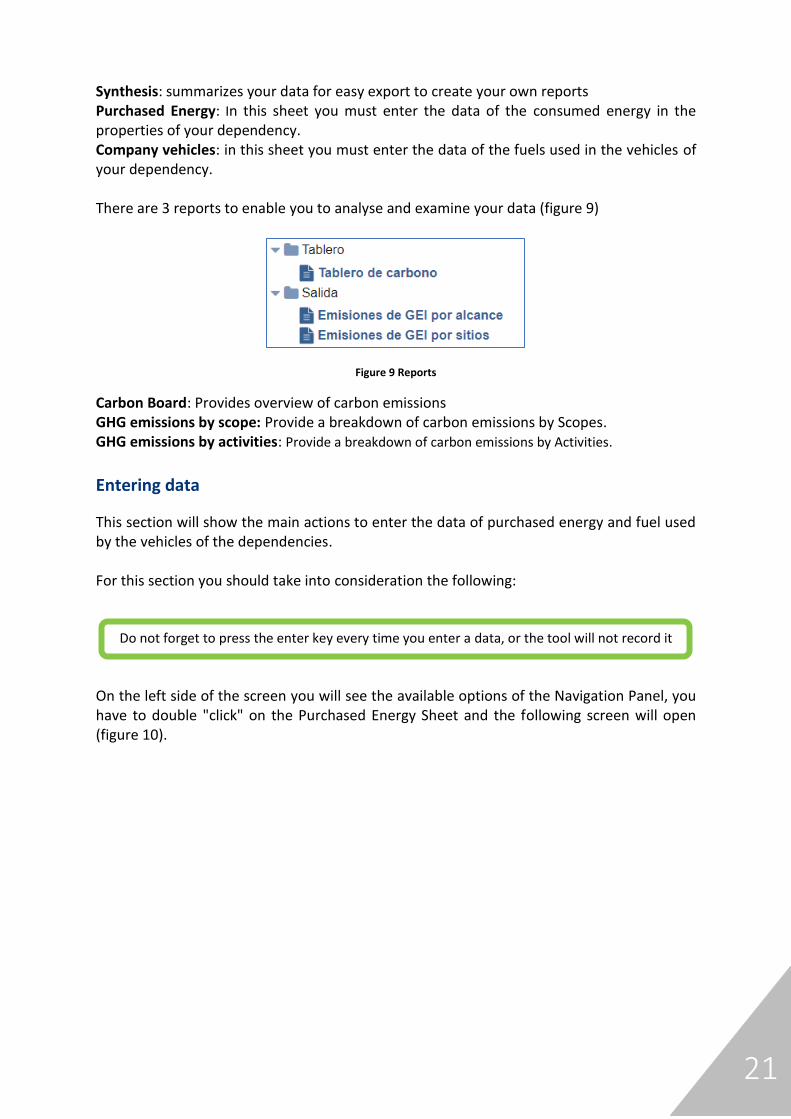
Synthesis: summarizes your data for easy export to create your own reports Purchased Energy: In this sheet you must enter the data of the consumed energy in the properties of your dependency. Company vehicles: in this sheet you must enter the data of the fuels used in the vehicles of your dependency. There are 3 reports to enable you to analyse and examine your data (figure 9)
Figure 9 Reports
Carbon Board: Provides overview of carbon emissions GHG emissions by scope: Provide a breakdown of carbon emissions by Scopes. GHG emissions by activities: Provide a breakdown of carbon emissions by Activities.
Entering data
This section will show the main actions to enter the data of purchased energy and fuel used by the vehicles of the dependencies. For this section you should take into consideration the following:
Do not forget to press the enter key every time you enter a data, or the tool will not record it
On the left side of the screen you will see the available options of the Navigation Panel, you have to double "click" on the Purchased Energy Sheet and the following screen will open (figure 10).

22
Figure 10 Entering Data
To capture the data the user must follow the next steps:
1. Search your “Site”
For the purchased energy data (kWh), you must:
➢ Use the dropdown menu to locate your site (Yucatán -> Dependency -> Category ->
site) (figure 11)
• Yucatán
• Secretary or Dependency (ex. CONALEP)
• Building/Transportation (ex. school)
• Site (i.e. 774830300568 (CONALEP Mérida II))
Figure 11 Purchased energy data
23
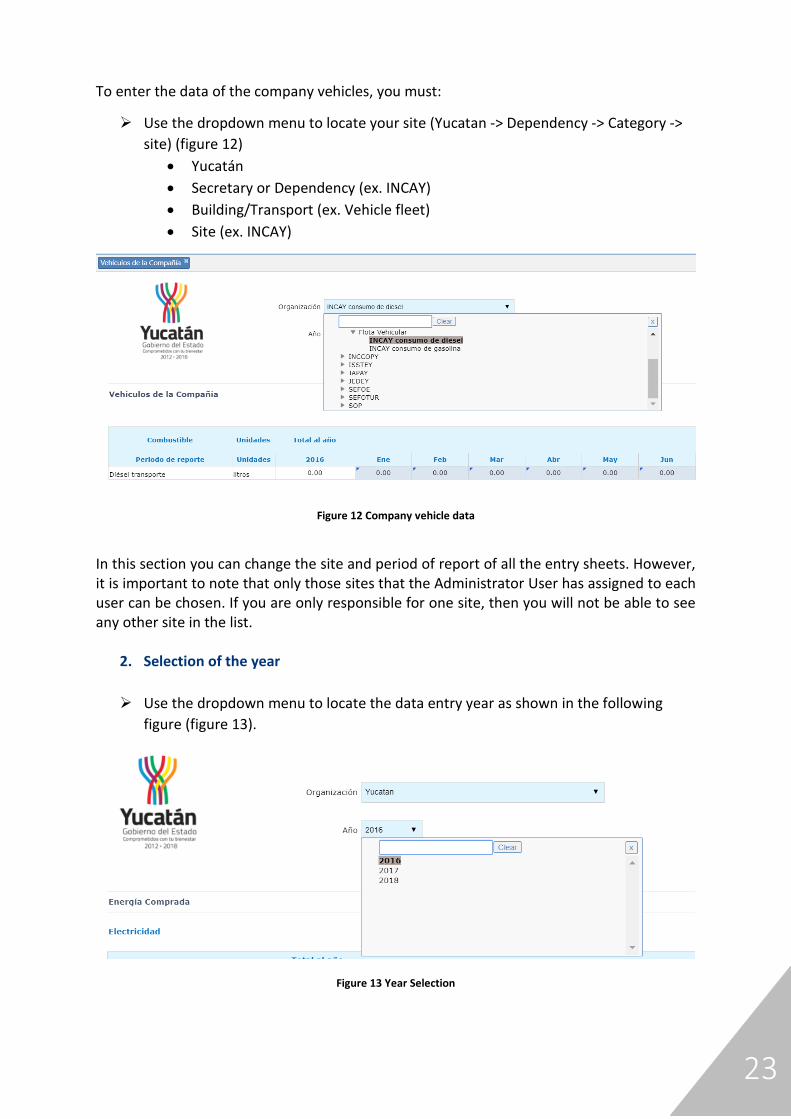
To enter the data of the company vehicles, you must:
➢ Use the dropdown menu to locate your site (Yucatan -> Dependency -> Category ->
site) (figure 12)
• Yucatán
• Secretary or Dependency (ex. INCAY)
• Building/Transport (ex. Vehicle fleet)
• Site (ex. INCAY)
Figure 12 Company vehicle data
In this section you can change the site and period of report of all the entry sheets. However, it is important to note that only those sites that the Administrator User has assigned to each user can be chosen. If you are only responsible for one site, then you will not be able to see any other site in the list.
2. Selection of the year
➢ Use the dropdown menu to locate the data entry year as shown in the following
figure (figure 13).
Figure 13 Year Selection

24
3. Entering Data
In this section you can upload the energy information corresponding to your activity. It is important to mention that to enter the information you must:
1. Do not forget to press the "enter" key every time you enter data or the tool will not record them.
2. When the cell is gray, changes can be made. If the cell is white, it means that it is a saved data and no changes can be made, unless actions are taken to "open" the cell, these will be explained throughout the manual.
The data is entered for each electric bill and fuel consumption in the corresponding
reporting period.
For the entry of electricity / fuel data you must follow the following steps (figure 14):
I. Select the month of the electric bill (kWh) / fuel bill (litres).
II. Enter the consumption for each bill
III. Press the "enter" key to save the data
IV. Do not use commas (,) to separate thousands. For example: 2500 not 2,500.
V. Points (.) Are used to represent decimals, not commas (,)
Figure 14 Entering fuel and electricity data
Once the data has been typed and the "enter" key has been pressed, the tool will still be
available to make changes to any month of the year but only if the colour of the cell is in
grey.
In case it is necessary to make a change, place the cursor in the cell of the month that needs
the change, enter the data and press "enter" to save the new number.
4. Upload documents
A Document Support box is provided to upload the evidence that supports the numbers that
are captured. Documents (e.g invoices, receipts, notes) are required to validate the entered

25
data into the system. The documents can be in the following formats, .jpg, .pdf, .doc, and
.xls.
To enter the documents, you must:
I. Click on the icon to upload information (figure 15)
Figure 15 Uploading Documents
II. Click on choose file/select file (figure 16)
Figure 16 Select file
III. Find the relevant file and click on “open” (figure 17)

26
Figure 17 Relevant file
IV. Click on “upload” (figure 18)
Figure 18 Upload document
5. Comments
A Comments box is provided to allow you to explain the variation of data of the numbers that are captured. Use the comment box to explain some inconsistency in the data, justify the entered data and other matters for the administration to be informed (see figure 19).
27
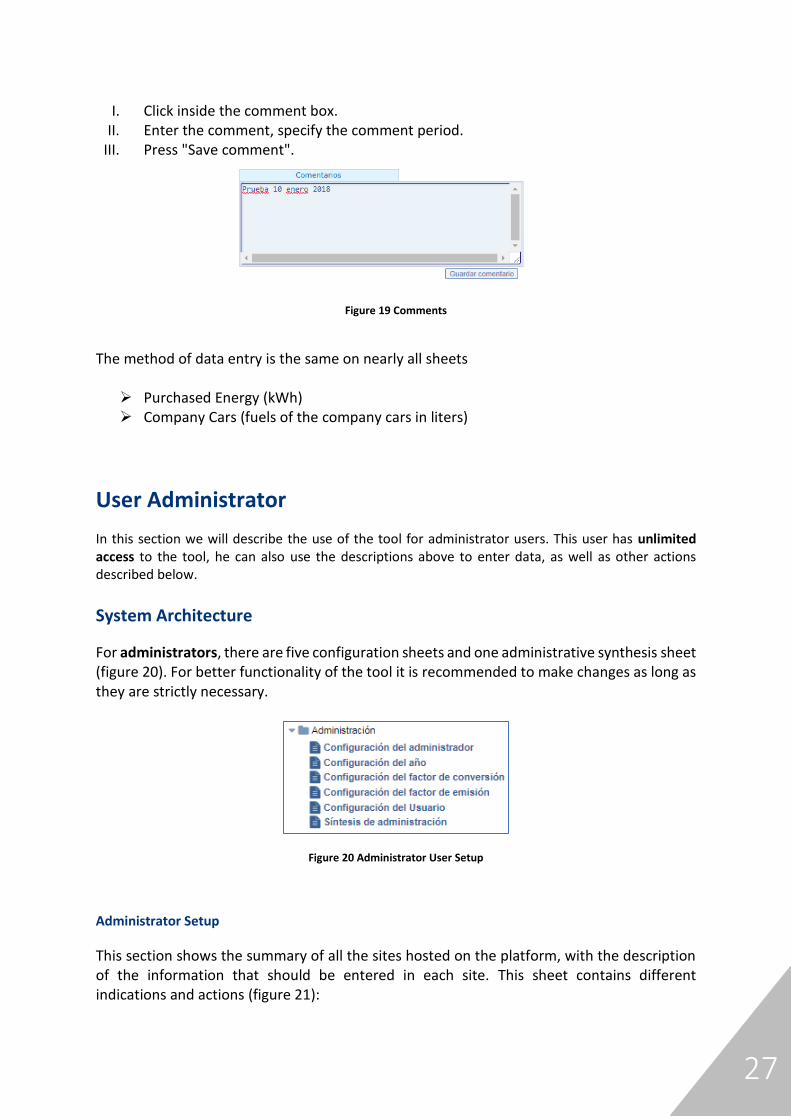
I. Click inside the comment box.
II. Enter the comment, specify the comment period. III. Press "Save comment".
Figure 19 Comments
The method of data entry is the same on nearly all sheets
➢ Purchased Energy (kWh) ➢ Company Cars (fuels of the company cars in liters)
User Administrator
In this section we will describe the use of the tool for administrator users. This user has unlimited access to the tool, he can also use the descriptions above to enter data, as well as other actions described below.
System Architecture
For administrators, there are five configuration sheets and one administrative synthesis sheet (figure 20). For better functionality of the tool it is recommended to make changes as long as they are strictly necessary.
Figure 20 Administrator User Setup
Administrator Setup
This section shows the summary of all the sites hosted on the platform, with the description of the information that should be entered in each site. This sheet contains different indications and actions (figure 21):

28
1. In the Type of Emissions box, the type of emissions to be reported is selected for each
activity, either Electricity or Transport. 2. For the Transport section, the user has to select Mode of Transportation, either Diesel
Fleet or Gasoline Fleet. 3. In the Energy Source section, the user must select the sites where the energy is
consumed. In the drop-down menu you can select the supplier of the electric power: Electricity (CFE network), Electricity (cogeneration), Electricity (Other) and Electricity (renewable in situ). In the case of Transport: Gasoline transport (litres) and Diesel transport (litres). For this version of the tool, it is relevant to consider that the current configuration must be maintained with respect to the electric power coming from the Electricity (CFE grid).
4. In this section, the Administrator User must enter the Cost of energy (electricity and fuels) data on an annual basis.
5. This page has a drop-down menu to select the Year that will be configured 6. Once configured with the needs of the client, it is possible to block the configuration
in order to avoid any error of entry or in the operation of the tool.
Figure 21 Administrator Setup sheet
Year Setup
In this section the topics related to the reporting year of the sites in the tool will be configured, from the activation of the years to be reported to the name of the months that will be used for the report. Likewise, the sheet has the action of “Block Configuration”.
Conversion factor Setup
In this section you can configure the values of the conversion factors for each type of energy used to calculate the tool's emissions. The sheet has the “open” button to make changes and the "Save" to save the changes.
Emission factor Setup
In this section you can configure the values of the emission factors by type of energy source (Electricity (network CFE), Electricity (cogeneration), Electricity (Other) and Electricity

29
(renewable in situ)) and Mode of Transportation (Gasoline transport) (litres) and Diesel transport (litres) used to calculate the emissions of the tool. These can be selected from the drop-down menu in the upper half of the sheet. The sheet has the “open” button to make changes and the "Save" to save the changes.
User Setup
In this sheet you will find all contact information of the users who will upload the corresponding energetic information of all the sites in the tool.
Administration synthesis
It provides a summary of all energy data "uploaded" to the platform with their respective emissions and cost calculations. This data can be exported month by month by selecting the month of your choice with the drop-down menu as shown in figure 22.
Figure 22 Administration synthesis
Submission Status
It provides a summary of the complete or incomplete status of the information entered for all sites, as well as the day of delivery, the contact of the person in charge of uploading the information and the date of approval of the information.
Validation
The data must be sent for each site and for each type of consumption (electricity, fuel) before the deadline agreed with the administrator. Once the data entry for the full year has been completed, the user should follow these steps:
➢ Click on the button (✔) to send (figure 23).

30
➢ Once the data has been sent, the administrator will review and then
approve or reject the data (figure 24).
➢ If the data is rejected, the administrator will include the reason (s) for
rejection.
➢ The data for that site must be forwarded
➢ Once rejected, the administrator must reopen the information entry
process (figure 23).
Figure 23 Submission information
Figure 24 Validation
31
Results
The tool offers a range of analysis graphs that present their results in a clear and easy way to follow. These results will also allow the user to explore and deeply analyse the different elements of its dependency. The results provide a summary by Scope and Activity; and also allow the comparison of specific sites within the dependency from multiple points of view to obtain a better understanding of their environmental profiles. The main results of using the tool to report and measure the energy consumption of the dependencies are: Cost Reduction: Energy is a significant and growing cost for many organizations, by reducing their consumption it provides significant cost savings. Emission Reduction: By reducing energy consumption, CO2 emissions will also be reduced, helping the State to achieve its sustainability objectives. Facilitate compliance: The service facilitates the preparation of data delivery required by the Sustainable Footprint Initiative and at some point, by the RENE, among others. Data Validation: Monitoring energy means being able to easily track performance and validate energy consumption, as well as observe inconsistencies within the energy consumption of the dependencies. Improve Reputation: Being able to demonstrate an effective state management to minimize financial and physical risks and improve reputation as a leader in the country. Commitment of the supply chain and dependencies: The Footprint Manager is a great platform to generate a broader commitment on energy efficiency, good management of resources and the environmental sustainability of your State. As the data is typed by pressing the "enter" key, results can be viewed and analysed through the Carbon Dashboard and Outputs sheets.
Carbon Dashboard
In this section you can obtain a summary of the GHG emission charts by Scope of each site and year of election. The graphics can be exported in PDF format with the icon located in the upper right corner of the screen. This sheet has visualization actions to analyze the results of the entered data (figure 25):
1. In the drop-down menus you can select the year and the site to see the corresponding
graphs. 2. The total GHG emissions are presented by the selected site and year. 3. In this cell you can enter a percentage of emissions target for the selected site and
year in order to observe and contrast the progress that has been made throughout the selected year.

32
4. When selecting each of the circles located on the left side of the legends: Scope 1, Scope 2, Act (Current), Plan and Target (Target), the selected element will disappear to have a clearer view of the other remaining element (s) of the corresponding graph. This allows the user to observe the advance or retreat made in the selected site and year
5. The graph is observed for each Scope and GHG emissions of the selected site and year by month.
Figure 25 Results Graphs
Outputs
In this section we can see the graphs of GHG Emissions by scope and by sites. The presentation of the different graphs of this section is shown in figure 26.

33
Figure 26 GHG emissions by scope
In the number 1 of the previous figure there are three drop-down menus indicating the
options of the Organization (sites), Year and type of graph to be obtained (emissions, energy
and cost).
In number 2, The user will observe the different graphs and data corresponding to the
summary of emissions by scope. This could be observed as a whole and separately from the
site, year and type of graphic that has been selected.
Figure 27 shows the GHG emissions by sites to visualize the progress with respect to the
decrease and / or increase of the emissions of each site, likewise, a comparison between some
of them could be observed.

34
Figure 27 GHG emissions by scope
In number 1 you can select the year to analyse the data and graphs of the selected sites.
Number 2 shows a graph in with the selected sites to observe the relationship between
their emissions (Scopes 1 and 2.)
In number 3, there are five drop-down menus to select the sites that will be compared with
their GHG emissions of Scopes 1 and 2.
Number 4 presents the GHG emissions data of Scopes 1 and 2 for the selected sites.
Logout
Once the data has been saved, the user can exit by using the icon on the upper right corner
as shown in figure 28.

35
Figure 28 Log out
36
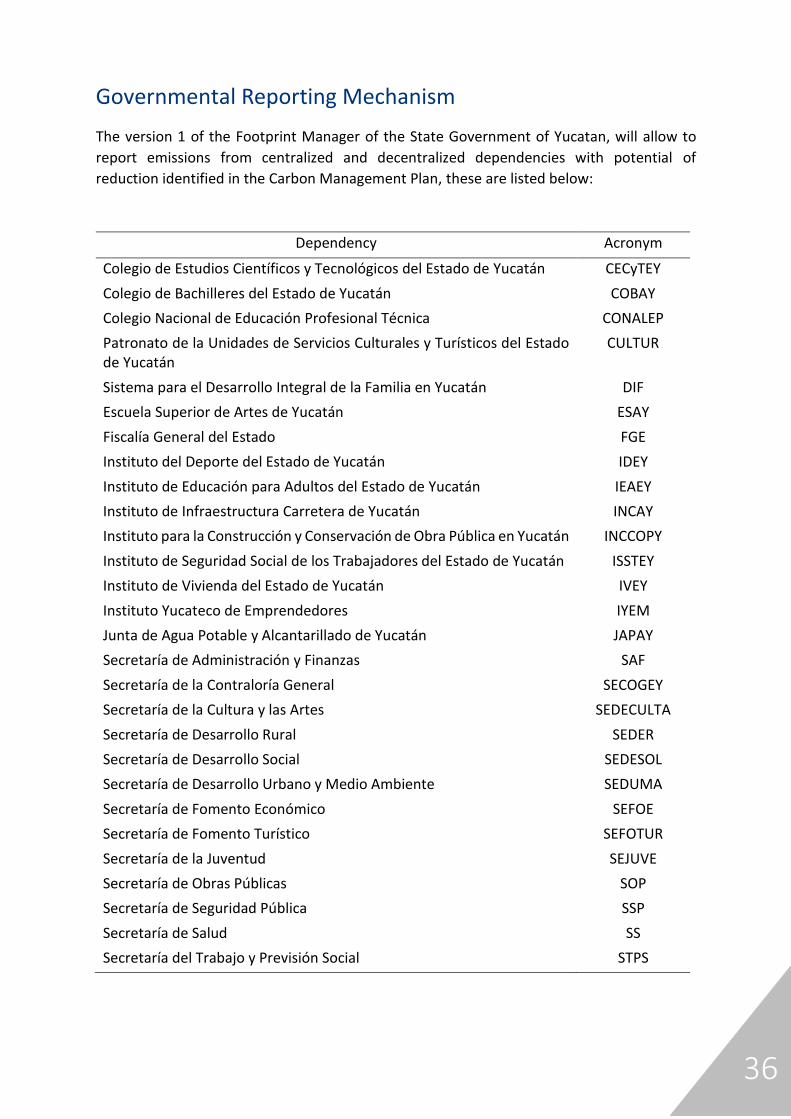
Governmental Reporting Mechanism
The version 1 of the Footprint Manager of the State Government of Yucatan, will allow to
report emissions from centralized and decentralized dependencies with potential of
reduction identified in the Carbon Management Plan, these are listed below:
Dependency Acronym
Colegio de Estudios Científicos y Tecnológicos del Estado de Yucatán CECyTEY
Colegio de Bachilleres del Estado de Yucatán COBAY
Colegio Nacional de Educación Profesional Técnica CONALEP
Patronato de la Unidades de Servicios Culturales y Turísticos del Estado de Yucatán
CULTUR
Sistema para el Desarrollo Integral de la Familia en Yucatán DIF
Escuela Superior de Artes de Yucatán ESAY
Fiscalía General del Estado FGE
Instituto del Deporte del Estado de Yucatán IDEY
Instituto de Educación para Adultos del Estado de Yucatán IEAEY
Instituto de Infraestructura Carretera de Yucatán INCAY
Instituto para la Construcción y Conservación de Obra Pública en Yucatán INCCOPY
Instituto de Seguridad Social de los Trabajadores del Estado de Yucatán ISSTEY
Instituto de Vivienda del Estado de Yucatán IVEY
Instituto Yucateco de Emprendedores IYEM
Junta de Agua Potable y Alcantarillado de Yucatán JAPAY
Secretaría de Administración y Finanzas SAF
Secretaría de la Contraloría General SECOGEY
Secretaría de la Cultura y las Artes SEDECULTA
Secretaría de Desarrollo Rural SEDER
Secretaría de Desarrollo Social SEDESOL
Secretaría de Desarrollo Urbano y Medio Ambiente SEDUMA
Secretaría de Fomento Económico SEFOE
Secretaría de Fomento Turístico SEFOTUR
Secretaría de la Juventud SEJUVE
Secretaría de Obras Públicas SOP
Secretaría de Seguridad Pública SSP
Secretaría de Salud SS
Secretaría del Trabajo y Previsión Social STPS

37
Each of these dependencies will have a username and a password, with which they will be
able to access the platform remotely through the following link:
https://yucatangob.ctfootprintmanager.com/en/
How to collect the information?
Those responsible for registering the information in each dependency will record the electric
consumption of the institution in KWh within the first five calendar days from the final
payment date of the last receipt and will be reported according to the period of consumption,
as exemplified in the following figure.
Figure 29 Entering data energy consumption
To register the fuel consumption, the government's vehicle fleet, is classified into two types:
1) gasoline (Magna or Premium) and 2) Diesel. To facilitate the management of the
information, it is recommended to request from the supplier or suppliers a monthly summary
of the consumption by type of fuel type, this information must be captured in the first five
days of the reported month.
Example
1. Period to upload the
information on the platform: from January 23 to January 28
2. Month to report: December
2015 3. Energy consumption to
report: 1,076 kWh
1
2
3

38
Figure 30 Entering data fuel consumption
Reports
The information of the consumption of electric energy and fuels registered in the Footprint
Manager will allow the generation of monthly GHGH emissions reports for each dependency
mentioned in the previous section. It should be noted that due to the type of tariff and its
respective electricity billing in some public buildings the information captured on the platform
will be bimonthly.
The results obtained monthly from the Footprint Manager will be compiled and processed in
the Planning and Policies for Sustainability Directorate of the Ministry of Urban Development
and Environment, who will be responsible for publishing and disseminating this information
on a half-yearly basis through a governmental report that will be available on the climate
change platform: www.ccpy.gob.mx .This report will be updated every six months.
This report will publish the monthly emissions of 2018 and of subsequent years, it will be
compared with the emissions of the baseline year (2015). The advances will be presented by
the total tons of CO2e direct emissions for the fuel consumption in the government's vehicle
fleet (Scope 1), as well as the total indirect emissions for electricity consumption (Scope 2).
Likewise, the total monthly emissions of the government sector will be reported, as well as
by each governmental institution.
Example 1. Month to report:
November 2016 2. Type of fuel:
Gasoline 3. Total
consumption: 2,961.41 l.

39
Whilst reasonable steps have been taken to ensure that the information contained
within this publication is correct, the authors, the Carbon Trust, its agents, contractors
and sub-contractors give no warranty and make no representation as to its accuracy
and accept no liability for any errors or omissions. Any trademarks, service marks or
logos used in this publication, and copyright in it, are the property of the Carbon Trust.
Nothing in this publication shall be construed as granting any licence or right to use
or reproduce any of the trademarks, service marks, logos, copyright or any proprietary
information in any way without the Carbon Trust’s prior written permission. The
Carbon Trust enforces infringements of its intellectual property rights to the full extent
permitted by law.
The Carbon Trust is a company limited by guarantee and registered in England and
Wales under Company number 4190230 with its Registered Office at: 4th Floor,
Dorset House, 27-45 Stamford Street, London SE1 9NT
© The Carbon Trust 2017. All rights reserved.