redalyc.phenotypic variation and leaf … study.pdf · palabras clave: análisis multivariado,...
TRANSCRIPT
Available in: http://www.redalyc.org/articulo.oa?id=57421427009
Red de Revistas Científicas de América Latina, el Caribe, España y Portugal
Sistema de Información Científica
Ali Sattarian, Mohammad Reza Akbarian, Mehrdad Zarafshar, Piero Bruschi, Payam Fayyaz
PHENOTYPIC VARIATION AND LEAF FLUCTUATING ASYMMETRY IN NATURAL POPULATIONS OF
PARROTIA PERSICA (HAMAMELIDACEAE), AN ENDEMIC SPECIES FROM THE HYRCANIAN FOREST
(IRAN)
Acta Botánica Mexicana, núm. 97, 2011, pp. 65-81,
Instituto de Ecología, A.C.
México
How to cite Complete issue More information about this article Journal's homepage
Acta Botánica Mexicana,
ISSN (Printed Version): 0187-7151
Instituto de Ecología, A.C.
México
www.redalyc.orgNon-Profit Academic Project, developed under the Open Acces Initiative
Acta Botanica Mexicana 97: 65-81 (2011)
65
PHENOTYPIC VARIATION AND LEAF FLUCTUATING ASYMMETRY IN NATURAL POPULATIONS OF PARROTIA PERSICA
(HAMAMELIDACEAE), AN ENDEMIC SPECIES FROM THE HYRCANIAN FOREST (IRAN)
Ali SAttAriAn1, MohAMMAd rezA AkbAriAn2, MehrdAd zArAfShAr3,6, Piero bruSchi4, PAyAM fAyyAz5
1Gonbad-Kavoos University, Department of Forestry, Golestan, Iran.2, 3Tarbiat Modares University, Natural Resources Faculty,
Department of Forestry, Noor, Mazandran, Iran. 4University of Florence, Department of Agriculture Biotechnology,
Section of Environmental and Applied Botany, Florence, Italy.5University of Yasouj, Faculty of Agriculture and Institute of Natural Research
and Environment, Department of Forestry, Yasouj, Iran.6Corresponding author: [email protected]
ABSTRACT
Phenotypic variation in four natural populations of Parrotia persica (Hamamelidaceae), a species considered a living fossil endemic to the Hyrcanian forest, was evaluated through leaf morphometric and multivariate analysis. Furthermore, plasticity and leaf fluctuating asymmetry (LFA) were studied. Our findings clearly displayed significant divergence among sites. The smallest lamina size, the highest plasticity, and the lowest LFA values were recorded in the eastern and more xeric sites (Ghorogh and Daland), thus it seems these sites endure a larger environmental stress. Although our findings showed that multivariate and leaf morphometric analyses are suitable instruments to detect levels of phenotypic variability among P. persica natural populations, further study of allozyme and DNA diversity is necessary.
Key words: leaf morphometrics, multivariate analysis, natural populations, plasticity.
RESUMEN
Se evaluó la variación fenotípica en cuatro poblaciones naturales de Parrotia persica (Hamamelidaceae), una especie endémica considerada como un fósil viviente del bosque
Acta Botanica Mexicana 97: 65-81 (2011)
66
hircaniano, a través de un análisis morfométrico y multivariado de las hojas. Asimismo, se estudiaron la plasticidad y la asimetría foliar fluctuante (AFF). Nuestros hallazgos mostraron claramente una divergencia significativa entre sitios. El tamaño más pequeño de la lámina foliar, la plasticidad más grande y los valores más pequeños de AFF fueron registrados en los sitios más xéricos de la parte oriental (Ghorogh y Daland), por lo que parece que estos sitios están sujetos a un mayor estrés ambiental. Obtuvimos resultados interesantes, pero hace falta realizar nuevos estudios de la diversidad de aloenzimas y ADN.
Palabras clave: análisis multivariado, morfometría foliar, plasticidad, poblaciones naturales.
INTRODUCTION
Parrotia persica C. A. Mey. (Persian ironwood tree) is a biological treasure of the forest ecosystems of Northern Iran, where it is considered as one of the endemic trees to the Hyrcanian forest region. This species is the last representative of a wides-pread and species-rich genus that originated in the Tertiary (Mosaddegh, 2006). Un-fortunately, forest managers usually overlook P. persica because this species does not produce valuable timber. Conversely, it is widely used by indigenous people for char-coal and firewood production. The wood is also used by wood tuners and for weaving telephone poles. Browicz (1982) noted that wood of P. persica was “remarkably hard, heavy, dense and durable”, which is why it is called the iron tree. Although P. persica is not considered to be at risk of extinction, presently it faces conservation problems. Certainly, if the destructive process continues, genetic erosion of the species is likely. For this reason, it is important to collect more information about the adaptation of this species and its ability to respond to different types and patterns of disturbance.
The capability of plants to modify their morphology and physiology in response to environmental conditions is called phenotypic plasticity (Bradshaw, 1965). Phenotypic plasticity plays an important role in resource acquisition by plants; variation of the size and placement of resource-acquiring organs such as leaves are critical to a plant’s adjustment to resource availability. A further source of variation and developmental stability, is the inability of an organism to grow and mature in a steady manner, according to its phenotypic potential, under a wide variety of environmental conditions (Palmer, 1994), and has been mostly studied as fluctuating asymmetry (FA). The idea is that low-quality individuals, with respect to reproductive fitness, are developmentally less stable and unable to develop traits with precisely one value equal on the left and right sides. According to Møller & Swaddle (1997), increase in the variability of cellular growth rates under sub-optimal conditions is a source
Sattarian et al.: Phenotypic variation and leaf fluctuating asymmetry in Parrotia persica
67
of developmental instability and it might induce asymmetric growth in plant organs with bilateral symmetry. Hence, any deviation from the genetically programmed phenotype may indicate the existence of stress during development, which in turn may be related to environmental quality (Leary & Allendorf, 1989). For example, increased FA has been observed both in animals and plants in response to pollution, parasitism, grazing, competition, and drought (Freeman et al., 1995; Kozlov et al., 1996; Alados et al., 2003; Hódar, 2002, Graham et al., 2010).
The central objective of this study was to analyze patterns of morphological diversity and trait asymmetry in four wild populations of P. persica, chosen to cover a wide enough rainfall range to admit predictions of shifts in relative growth optima. Topography and climate features have an important influence on plant diversity and richness of Iran. In particular, drought coinciding with the thermal maximum is a general factor that plays a decisive role in the selection of species that make up the natural vegetation in the Hyrcanian forest (Akhani et al., 2010). A first test was per-formed to verify whether there were significant morphological differences among the populations and whether these were related to environmental characteristics. Secondly, we examined if there were significant differences in levels of FA among populations. Our expectation was for increasing FA away from an optimum especia-lly at higher drought levels.
MATERIALS AND METHODS
SamplingWe sampled four natural populations of Parrotia persica in the Hyrcanian
Forest (Northern Iran), including the Sisangan and Noor populations in the western Hyrcanian forest, and Ghorogh and Daland populations in its eastern portion. The geographical location of the sampling sites and their characteristics are shown in Figure 1 and Table 1, respectively. Rainfall in the region decreases from west to east (Mohajer, 2007). All four study sites have been impacted by humans, especially by tourists for fuel. On May 27 2010, we selected twenty individual trees from each site. To minimize the possibility of intraspecific crossing, at each site the trees were chosen to be at least 50 m apart from each other (Zarafshar et al., 2010). Similarly, in order to minimize positional variability, 20 leaves were collected within the crown from the external part of the canopy on the aspect facing south and always in the middle part of the first flush shoot. Ten leaves were chosen at random from each subsample after elimination of broken, incomplete, or damaged leaves.
Acta Botanica Mexicana 97: 65-81 (2011)
68
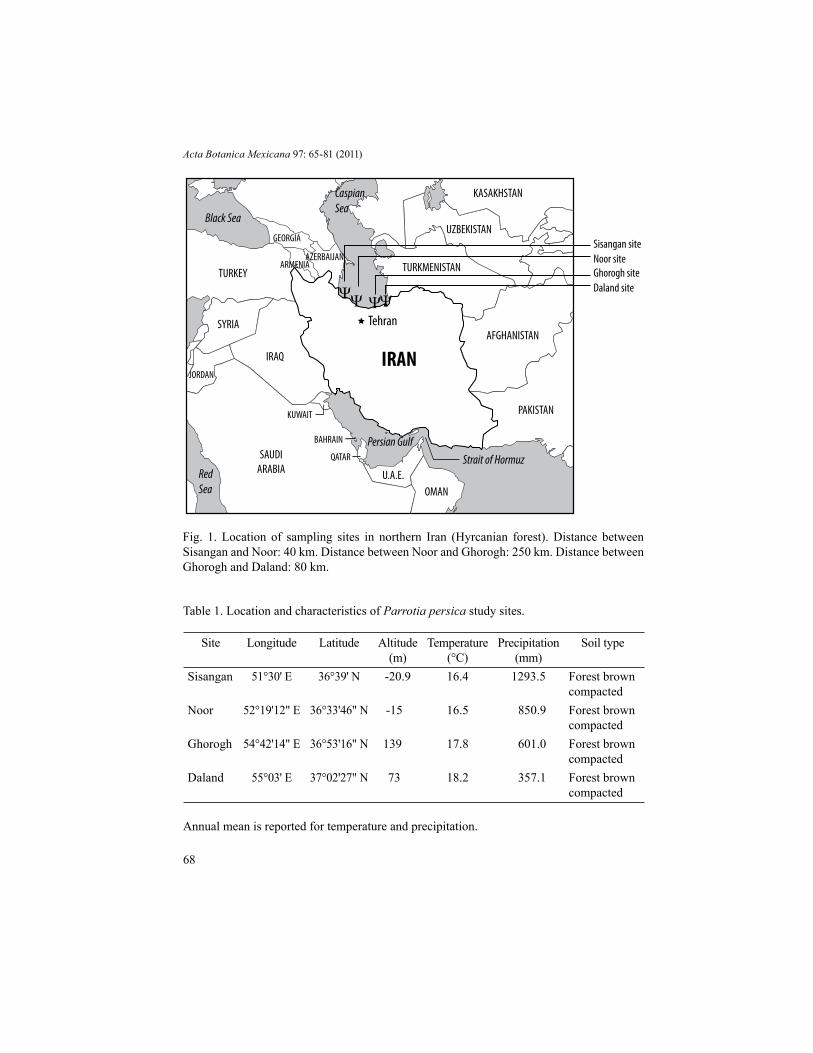
Table 1. Location and characteristics of Parrotia persica study sites.
Annual mean is reported for temperature and precipitation.
Site Longitude Latitude Altitude(m)
Temperature(°C)
Precipitation(mm)
Soil type
Sisangan 51°30' E 36°39' N -20.9 16.4 1293.5 Forest brown compacted
Noor 52°19'12" E 36°33'46" N -15 16.5 850.9 Forest brown compacted
Ghorogh 54°42'14" E 36°53'16" N 139 17.8 601.0 Forest brown compacted
Daland 55°03' E 37°02'27" N 73 18.2 357.1 Forest brown compacted
Fig. 1. Location of sampling sites in northern Iran (Hyrcanian forest). Distance between Sisangan and Noor: 40 km. Distance between Noor and Ghorogh: 250 km. Distance between Ghorogh and Daland: 80 km.
RedSea
CaspianSea
Black Sea
Persian GulfStrait of Hormuz
IRAN
Tehran
IRAQ
SYRIA
TURKEY
GEORGIA
ARMENIAAZERBAIJAN
JORDAN
SAUDIARABIA
OMAN
PAKISTAN
AFGHANISTAN
TURKMENISTAN
UZBEKISTAN
KASAKHSTAN
U.A.E.
KUWAIT
BAHRAIN
QATAR
ΨΨ ΨΨ
Sisangan siteNoor siteGhorogh siteDaland site
Sattarian et al.: Phenotypic variation and leaf fluctuating asymmetry in Parrotia persica
69
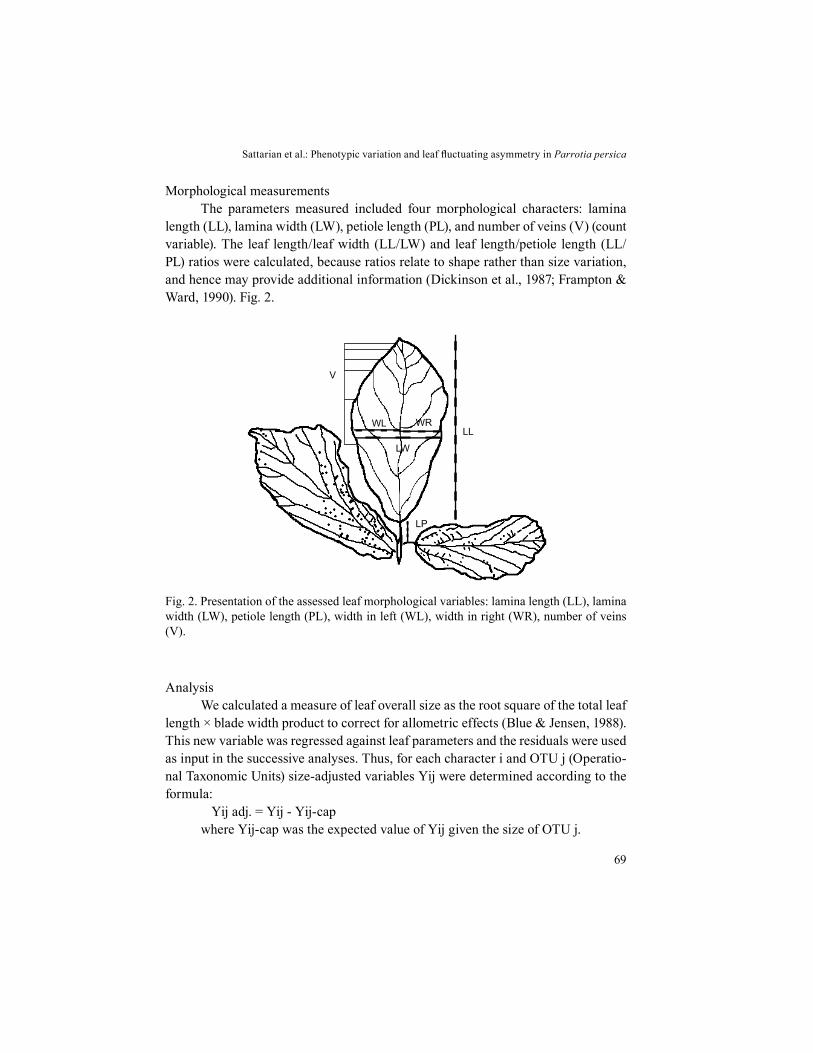
Morphological measurementsThe parameters measured included four morphological characters: lamina
length (LL), lamina width (LW), petiole length (PL), and number of veins (V) (count variable). The leaf length/leaf width (LL/LW) and leaf length/petiole length (LL/PL) ratios were calculated, because ratios relate to shape rather than size variation, and hence may provide additional information (Dickinson et al., 1987; Frampton & Ward, 1990). Fig. 2.
Fig. 2. Presentation of the assessed leaf morphological variables: lamina length (LL), lamina width (LW), petiole length (PL), width in left (WL), width in right (WR), number of veins (V).
V
LLWL WR
LW
LP
AnalysisWe calculated a measure of leaf overall size as the root square of the total leaf
length × blade width product to correct for allometric effects (Blue & Jensen, 1988). This new variable was regressed against leaf parameters and the residuals were used as input in the successive analyses. Thus, for each character i and OTU j (Operatio-nal Taxonomic Units) size-adjusted variables Yij were determined according to the formula:
Yij adj. = Yij - Yij-capwhere Yij-cap was the expected value of Yij given the size of OTU j.
Acta Botanica Mexicana 97: 65-81 (2011)
70
Descriptive statistics were computed for the four study populations. Assump-tions of normality were checked for all variables with Shapiro-Wilk’s test. Principal Components Analysis (PCA) with standardized varimax rotation was used to se-parate interrelationships into statistically independent basic components (Bruschi, 2010). In PCA, eigenvectors were calculated to determine the contribution of each variable to the separation of the populations. An Analysis of Variance (One-way ANOVA) was performed in order to test the main effects of populations on the sco-res of the first three factors extracted in the PCA. A Pearson correlation analysis was performed to identify the significant climatic variables (predictors) affecting PC scores extracted.
In addition, we performed a Discriminant Analysis on the total data set to investigate the multivariate relationships among the morphometric traits, and how they change among the populations. The scatter plot of the discriminant scores co-rresponding to each case of each population in the multivariate space, as defined by the first two discriminant functions, was obtained to help visualize multivariate phenotypic variations. The statistical program SPSS (version 11.5 and 16) was used for all the analyses.
PlasticityTotal within-population plasticity (Pl) was calculated for each parameter using
the smallest (x) and greatest (X) mean values for any given measure, as Pl=1-(x/X) (Ashton et al., 1998; Bruschi et al., 2003).
Leaf fluctuating asymmetrySigned fluctuating asymmetry (R-L) was estimated on the maximum width of
lamina (MW). As suggested by Palmer (1994), distributions of signed asymmetries in all samples were tested for normality (Kolmogorov-Smirnov test) and a mean of zero (one-sample t-test) to detect the presence of antisymmetry and directional as-ymmetry. Skewness and Kurtosis were also calculated for all signed differences bet-ween sides in each of the leaf traits. Given that there was no evidence of antisymme-try (Kolmogorov–Smirnov test: P > 0.10) or directional asymmetry (t-test: P = 0.12), the observed variation in leaf size of P. persica, expressed as the difference between right and left side, was considered to be a measure of FA (Palmer & Strobeck, 1986). FA levels were measured as the absolute difference between sides (FA1) (Palmer, 1994). The mean for a trait in each population was calculated by summing the indi-vidual FA values and dividing the total by the number of individuals in that popu-lation (Palmer & Strobeck, 1986). Linear regressions of │R-L│, against the mean of
Sattarian et al.: Phenotypic variation and leaf fluctuating asymmetry in Parrotia persica
71
the two sides (R+L)/2, were calculated in all samples to test the linear dependency of the asymmetry on trait character size. Because some relationship between indi-vidual trait size and asymmetry was observed, we used (│R-L│/0.5 (R+L) as the FA index, controlled for trait size (Palmer & Strobeck, 1986). A One-way ANOVA was performed to test the main effects of populations on FA values.
RESULTS
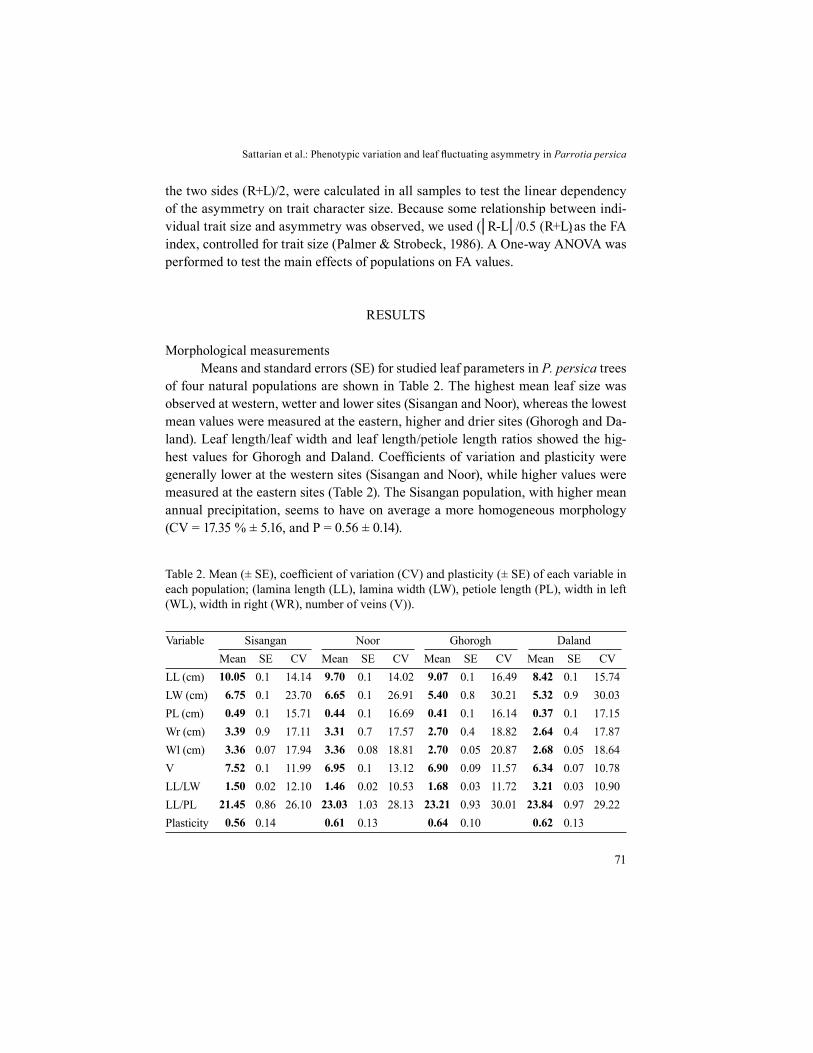
Morphological measurementsMeans and standard errors (SE) for studied leaf parameters in P. persica trees
of four natural populations are shown in Table 2. The highest mean leaf size was observed at western, wetter and lower sites (Sisangan and Noor), whereas the lowest mean values were measured at the eastern, higher and drier sites (Ghorogh and Da-land). Leaf length/leaf width and leaf length/petiole length ratios showed the hig-hest values for Ghorogh and Daland. Coefficients of variation and plasticity were generally lower at the western sites (Sisangan and Noor), while higher values were measured at the eastern sites (Table 2). The Sisangan population, with higher mean annual precipitation, seems to have on average a more homogeneous morphology (CV = 17.35 % ± 5.16, and P = 0.56 ± 0.14).
Table 2. Mean (± SE), coefficient of variation (CV) and plasticity (± SE) of each variable in each population; (lamina length (LL), lamina width (LW), petiole length (PL), width in left (WL), width in right (WR), number of veins (V)).
Variable Sisangan Noor Ghorogh DalandMean SE CV Mean SE CV Mean SE CV Mean SE CV
LL (cm) 10.05 0.1 14.14 9.70 0.1 14.02 9.07 0.1 16.49 8.42 0.1 15.74LW (cm) 6.75 0.1 23.70 6.65 0.1 26.91 5.40 0.8 30.21 5.32 0.9 30.03PL (cm) 0.49 0.1 15.71 0.44 0.1 16.69 0.41 0.1 16.14 0.37 0.1 17.15Wr (cm) 3.39 0.9 17.11 3.31 0.7 17.57 2.70 0.4 18.82 2.64 0.4 17.87Wl (cm) 3.36 0.07 17.94 3.36 0.08 18.81 2.70 0.05 20.87 2.68 0.05 18.64V 7.52 0.1 11.99 6.95 0.1 13.12 6.90 0.09 11.57 6.34 0.07 10.78LL/LW 1.50 0.02 12.10 1.46 0.02 10.53 1.68 0.03 11.72 3.21 0.03 10.90LL/PL 21.45 0.86 26.10 23.03 1.03 28.13 23.21 0.93 30.01 23.84 0.97 29.22Plasticity 0.56 0.14 0.61 0.13 0.64 0.10 0.62 0.13
Acta Botanica Mexicana 97: 65-81 (2011)
72
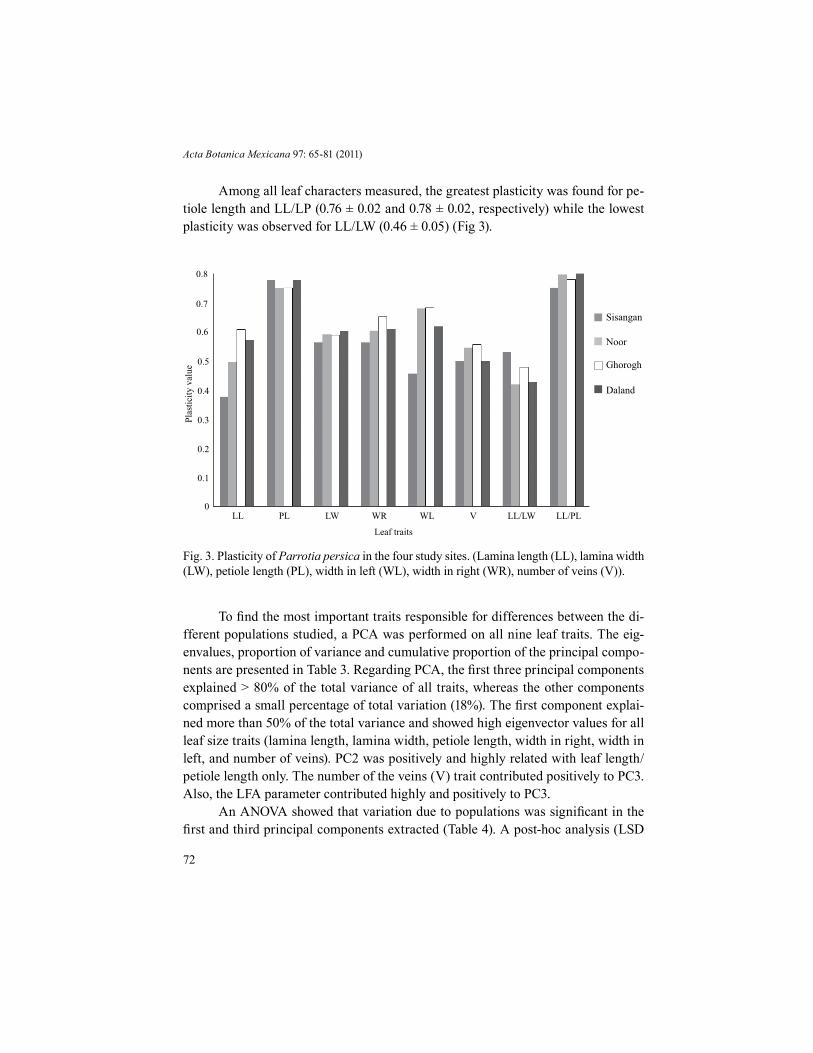
Fig. 3. Plasticity of Parrotia persica in the four study sites. (Lamina length (LL), lamina width (LW), petiole length (PL), width in left (WL), width in right (WR), number of veins (V)).
Plas
ticity
val
ue
Leaf traits
LL PL LW WR WL V LL/LW LL/PL
0.8
0.7
0.6
0.5
0.4
0.3
0.2
0.1
0
Sisangan
Noor
Daland
Ghorogh
Among all leaf characters measured, the greatest plasticity was found for pe-tiole length and LL/LP (0.76 ± 0.02 and 0.78 ± 0.02, respectively) while the lowest plasticity was observed for LL/LW (0.46 ± 0.05) (Fig 3).
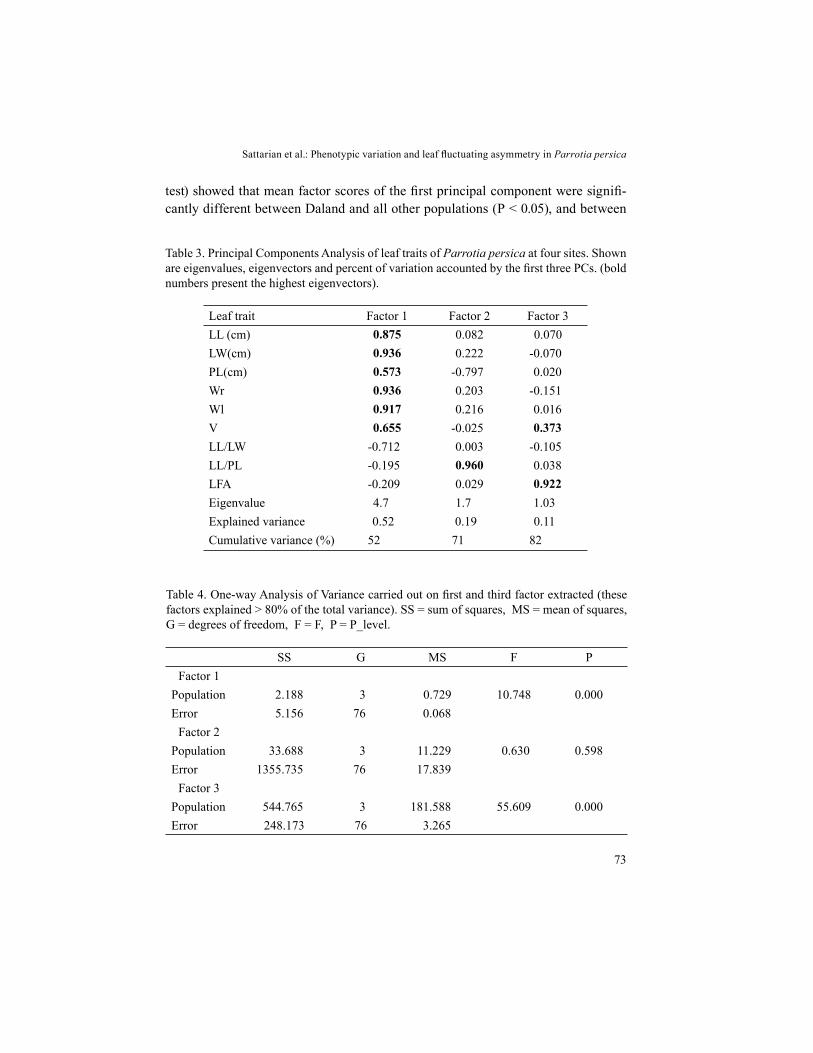
To find the most important traits responsible for differences between the di-fferent populations studied, a PCA was performed on all nine leaf traits. The eig-envalues, proportion of variance and cumulative proportion of the principal compo-nents are presented in Table 3. Regarding PCA, the first three principal components explained > 80% of the total variance of all traits, whereas the other components comprised a small percentage of total variation (18%). The first component explai-ned more than 50% of the total variance and showed high eigenvector values for all leaf size traits (lamina length, lamina width, petiole length, width in right, width in left, and number of veins). PC2 was positively and highly related with leaf length/petiole length only. The number of the veins (V) trait contributed positively to PC3. Also, the LFA parameter contributed highly and positively to PC3.
An ANOVA showed that variation due to populations was significant in the first and third principal components extracted (Table 4). A post-hoc analysis (LSD
Sattarian et al.: Phenotypic variation and leaf fluctuating asymmetry in Parrotia persica
73
Table 3. Principal Components Analysis of leaf traits of Parrotia persica at four sites. Shown are eigenvalues, eigenvectors and percent of variation accounted by the first three PCs. (bold numbers present the highest eigenvectors).
Leaf trait Factor 1 Factor 2 Factor 3LL (cm) 0.875 0.082 0.070LW(cm) 0.936 0.222 -0.070PL(cm) 0.573 -0.797 0.020Wr 0.936 0.203 -0.151Wl 0.917 0.216 0.016V 0.655 -0.025 0.373LL/LW -0.712 0.003 -0.105LL/PL -0.195 0.960 0.038LFA -0.209 0.029 0.922Eigenvalue 4.7 1.7 1.03Explained variance 0.52 0.19 0.11Cumulative variance (%) 52 71 82
Table 4. One-way Analysis of Variance carried out on first and third factor extracted (these factors explained > 80% of the total variance). SS = sum of squares, MS = mean of squares, G = degrees of freedom, F = F, P = P_level.
SS G MS F PFactor 1
Population 2.188 3 0.729 10.748 0.000Error 5.156 76 0.068
Factor 2Population 33.688 3 11.229 0.630 0.598Error 1355.735 76 17.839
Factor 3Population 544.765 3 181.588 55.609 0.000Error 248.173 76 3.265
test) showed that mean factor scores of the first principal component were signifi-cantly different between Daland and all other populations (P < 0.05), and between
Acta Botanica Mexicana 97: 65-81 (2011)
74
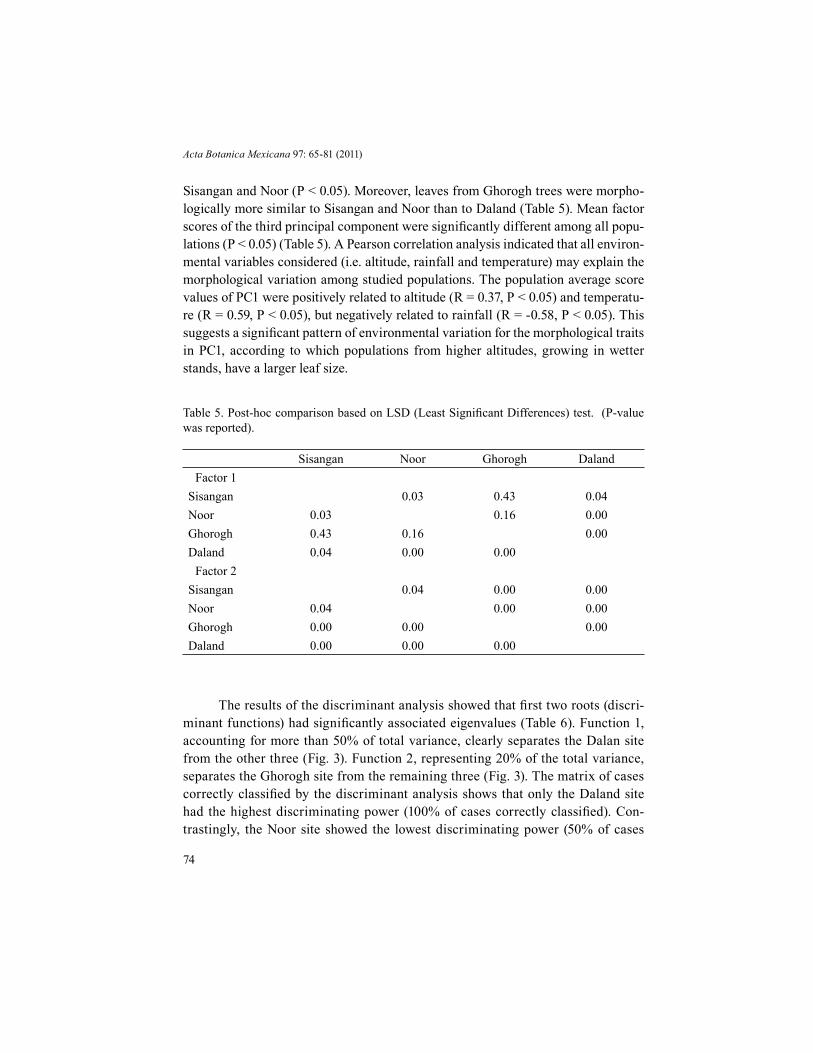
Table 5. Post-hoc comparison based on LSD (Least Significant Differences) test. (P-value was reported).
Sisangan Noor Ghorogh DalandFactor 1
Sisangan 0.03 0.43 0.04Noor 0.03 0.16 0.00Ghorogh 0.43 0.16 0.00Daland 0.04 0.00 0.00
Factor 2Sisangan 0.04 0.00 0.00Noor 0.04 0.00 0.00Ghorogh 0.00 0.00 0.00Daland 0.00 0.00 0.00
Sisangan and Noor (P < 0.05). Moreover, leaves from Ghorogh trees were morpho-logically more similar to Sisangan and Noor than to Daland (Table 5). Mean factor scores of the third principal component were significantly different among all popu-lations (P < 0.05) (Table 5). A Pearson correlation analysis indicated that all environ-mental variables considered (i.e. altitude, rainfall and temperature) may explain the morphological variation among studied populations. The population average score values of PC1 were positively related to altitude (R = 0.37, P < 0.05) and temperatu-re (R = 0.59, P < 0.05), but negatively related to rainfall (R = -0.58, P < 0.05). This suggests a significant pattern of environmental variation for the morphological traits in PC1, according to which populations from higher altitudes, growing in wetter stands, have a larger leaf size.
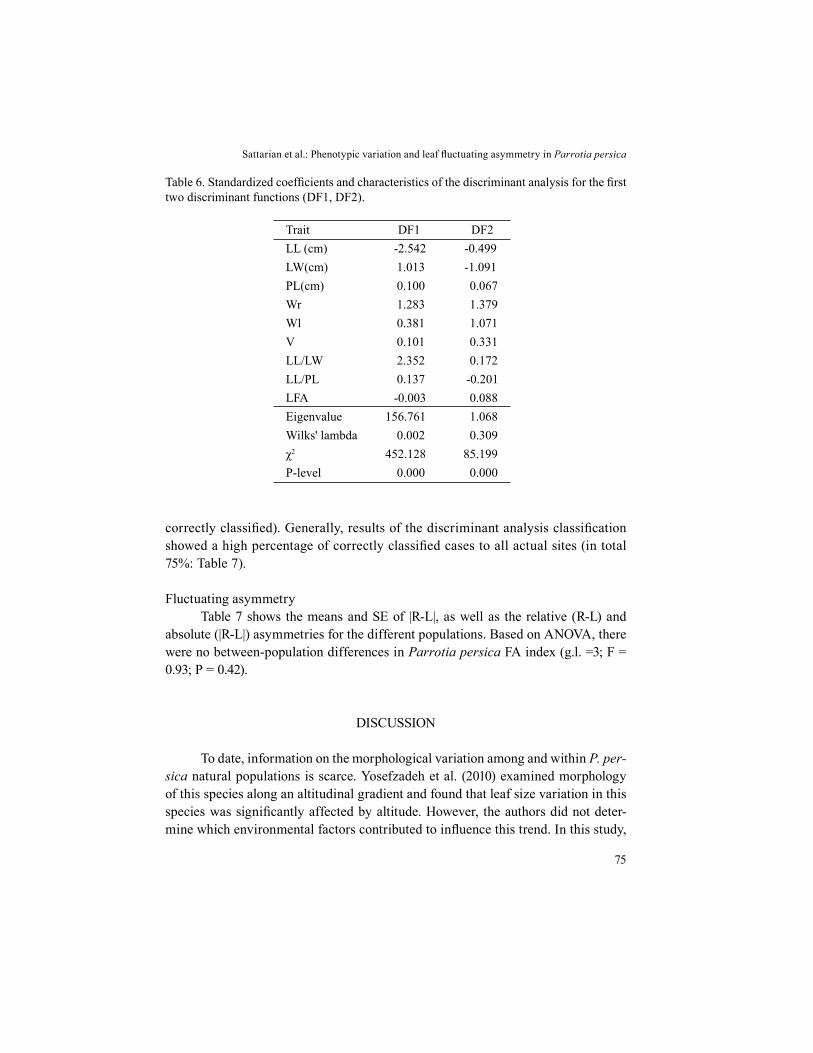
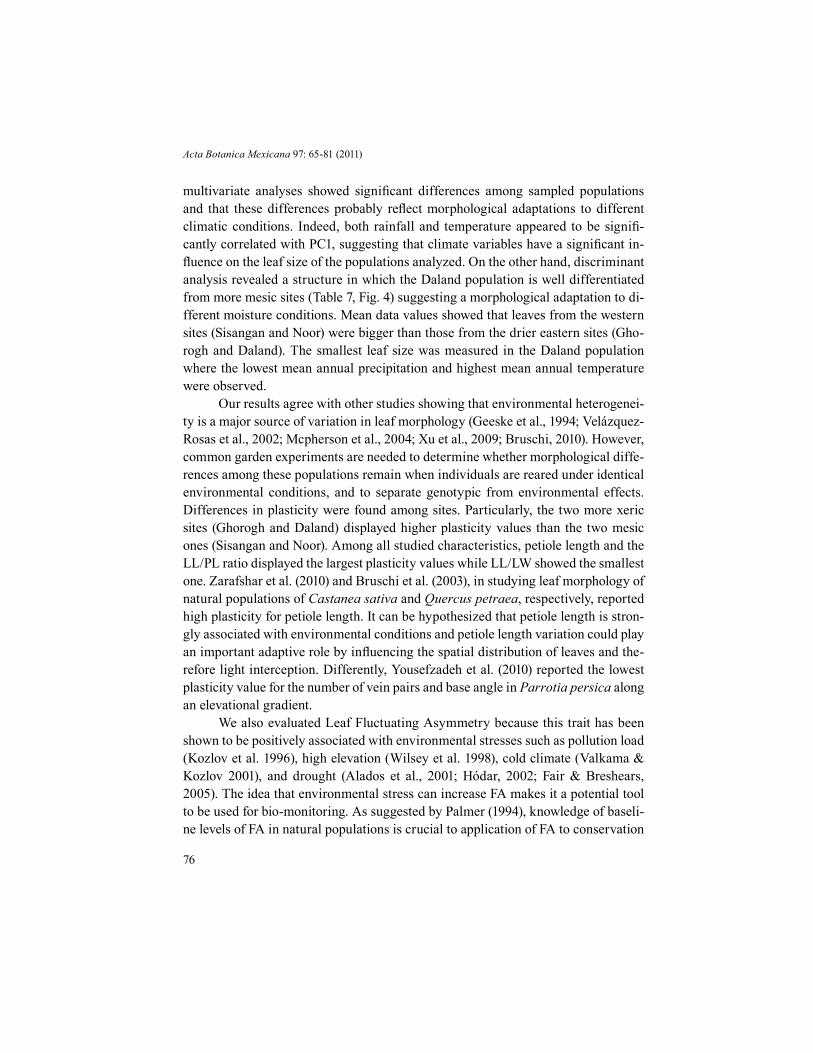
The results of the discriminant analysis showed that first two roots (discri-minant functions) had significantly associated eigenvalues (Table 6). Function 1, accounting for more than 50% of total variance, clearly separates the Dalan site from the other three (Fig. 3). Function 2, representing 20% of the total variance, separates the Ghorogh site from the remaining three (Fig. 3). The matrix of cases correctly classified by the discriminant analysis shows that only the Daland site had the highest discriminating power (100% of cases correctly classified). Con-trastingly, the Noor site showed the lowest discriminating power (50% of cases
Sattarian et al.: Phenotypic variation and leaf fluctuating asymmetry in Parrotia persica
75
Table 6. Standardized coefficients and characteristics of the discriminant analysis for the first two discriminant functions (DF1, DF2).
Trait DF1 DF2LL (cm) -2.542 -0.499LW(cm) 1.013 -1.091PL(cm) 0.100 0.067Wr 1.283 1.379Wl 0.381 1.071V 0.101 0.331LL/LW 2.352 0.172LL/PL 0.137 -0.201LFA -0.003 0.088Eigenvalue 156.761 1.068Wilks' lambda 0.002 0.309χ2 452.128 85.199P-level 0.000 0.000
correctly classified). Generally, results of the discriminant analysis classification showed a high percentage of correctly classified cases to all actual sites (in total 75%: Table 7).
Fluctuating asymmetryTable 7 shows the means and SE of |R-L|, as well as the relative (R-L) and
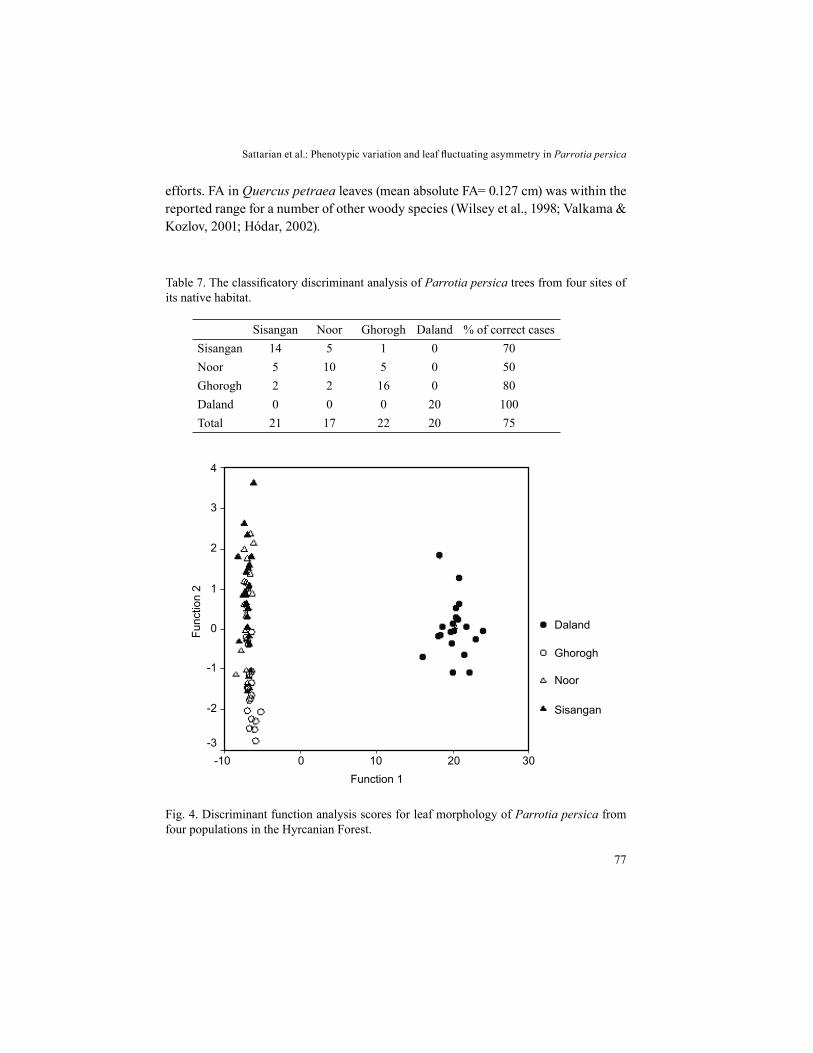
absolute (|R-L|) asymmetries for the different populations. Based on ANOVA, there were no between-population differences in Parrotia persica FA index (g.l. =3; F = 0.93; P = 0.42).
DISCUSSION
To date, information on the morphological variation among and within P. per-sica natural populations is scarce. Yosefzadeh et al. (2010) examined morphology of this species along an altitudinal gradient and found that leaf size variation in this species was significantly affected by altitude. However, the authors did not deter-mine which environmental factors contributed to influence this trend. In this study,
Acta Botanica Mexicana 97: 65-81 (2011)
76
multivariate analyses showed significant differences among sampled populations and that these differences probably reflect morphological adaptations to different climatic conditions. Indeed, both rainfall and temperature appeared to be signifi-cantly correlated with PC1, suggesting that climate variables have a significant in-fluence on the leaf size of the populations analyzed. On the other hand, discriminant analysis revealed a structure in which the Daland population is well differentiated from more mesic sites (Table 7, Fig. 4) suggesting a morphological adaptation to di-fferent moisture conditions. Mean data values showed that leaves from the western sites (Sisangan and Noor) were bigger than those from the drier eastern sites (Gho-rogh and Daland). The smallest leaf size was measured in the Daland population where the lowest mean annual precipitation and highest mean annual temperature were observed.
Our results agree with other studies showing that environmental heterogenei-ty is a major source of variation in leaf morphology (Geeske et al., 1994; Velázquez-Rosas et al., 2002; Mcpherson et al., 2004; Xu et al., 2009; Bruschi, 2010). However, common garden experiments are needed to determine whether morphological diffe-rences among these populations remain when individuals are reared under identical environmental conditions, and to separate genotypic from environmental effects. Differences in plasticity were found among sites. Particularly, the two more xeric sites (Ghorogh and Daland) displayed higher plasticity values than the two mesic ones (Sisangan and Noor). Among all studied characteristics, petiole length and the LL/PL ratio displayed the largest plasticity values while LL/LW showed the smallest one. Zarafshar et al. (2010) and Bruschi et al. (2003), in studying leaf morphology of natural populations of Castanea sativa and Quercus petraea, respectively, reported high plasticity for petiole length. It can be hypothesized that petiole length is stron-gly associated with environmental conditions and petiole length variation could play an important adaptive role by influencing the spatial distribution of leaves and the-refore light interception. Differently, Yousefzadeh et al. (2010) reported the lowest plasticity value for the number of vein pairs and base angle in Parrotia persica along an elevational gradient.
We also evaluated Leaf Fluctuating Asymmetry because this trait has been shown to be positively associated with environmental stresses such as pollution load (Kozlov et al. 1996), high elevation (Wilsey et al. 1998), cold climate (Valkama & Kozlov 2001), and drought (Alados et al., 2001; Hódar, 2002; Fair & Breshears, 2005). The idea that environmental stress can increase FA makes it a potential tool to be used for bio-monitoring. As suggested by Palmer (1994), knowledge of baseli-ne levels of FA in natural populations is crucial to application of FA to conservation
Sattarian et al.: Phenotypic variation and leaf fluctuating asymmetry in Parrotia persica
77
Fig. 4. Discriminant function analysis scores for leaf morphology of Parrotia persica from four populations in the Hyrcanian Forest.
-10 0 10
4
3
2
1
0
-1
-2
-3
Function 1
Daland
Ghorogh
Noor
Sisangan
Func
tion
2
20 30
Table 7. The classificatory discriminant analysis of Parrotia persica trees from four sites of its native habitat.
Sisangan Noor Ghorogh Daland % of correct casesSisangan 14 5 1 0 70Noor 5 10 5 0 50Ghorogh 2 2 16 0 80Daland 0 0 0 20 100Total 21 17 22 20 75
efforts. FA in Quercus petraea leaves (mean absolute FA= 0.127 cm) was within the reported range for a number of other woody species (Wilsey et al., 1998; Valkama & Kozlov, 2001; Hódar, 2002).
Acta Botanica Mexicana 97: 65-81 (2011)
78
Table 8. One-way Analysis of LFA parameters.
Population FA FA ass FA correctMean Std. error Skewness Kurtosis Mean Std. error Mean
Sisangan 0.033 0.038 -0.207 -0.658 0.447 0.020 0.131Noor -0.049 0.035 0.000 -0.935 0.422 0.018 0.127Ghorogh 0.004 0.031 0.124 -0.778 0.371 0.016 0.140Daland -0.036 0.027 1.458 -0.682 0.286 0.018 0.110
In this study we did not find any significant difference among populations. P. persica seems capable of resisting environmental changes, since no effects of climatic influences were detected. Probably, physiological plasticity buffered the environmental stress conditions, allowing the maintenance of the developmental program that is exhibited under optimum or normal conditions. As shown in Ta-ble 8, leaves from wetter sites were more asymmetrical than those of drier sites. Some evidence suggests that FA does not always increase in drier environments, although this may depend on the traits and species being investigated and on the selection history experienced by different populations. For example, in a study conducted during a period of over 8 yr, Valkama & Kozlov (2001) did not find any effect of the amount of rainfall on FA of birch leaves. Llorens et al. (2002) found that drought treatment increased leaf area FA on Vaccinium myrtillus while it did not affect leaf width FA. An analysis of FA in Quercus ilex leaves from areas under different precipitation regimes (Hódar, 2002) showed that plants living in stressful sites were more symmetrical, and that leaves from non-stressful sites were prone to FA in drought years. Moreover, field conditions expose plants to several stresses, the relative roles of which on these populations are not known in this study. Clarke (1993) emphasized that, for developmental stability studies, the ‘use of natural populations is fraught with danger unless there is a good unders-tanding of the genetic structure and evolutionary history of the populations under examination’.
In conclusion, our results indicated considerable leaf variation in the sites studied. Moreover, we showed that multivariate and leaf morphometric analyses are suitable instruments to detect levels of phenotypic variability among P. persica natural populations.
Sattarian et al.: Phenotypic variation and leaf fluctuating asymmetry in Parrotia persica
79
ACKNOWLEDGMENTS
It is our duty to thank Professor John Graham (Department of Biology, Berry College, Georgia, USA) for his valuable comments on the manuscript. Also Timo-thy Kim (Berry College, Georgia, USA) helped us for English grammatical correc-tions.
LITERATURE CITED
Akhani, H., M. Djamali, A. Ghorbanalizadeh & E. Ramezani. 2010. Plant biodiversity of Hyrcanian relict forests, N Iran: an overview of the flora, vegetation, palaeoecology and conservation. Pak. J. Bot., Special Issue (S.I. Ali Festschrift) 42: 231-258.
Alados, C. L., T. Navarro, J. Escós, B. Cabezudo & J. M. Emlen. 2001. Translational and fluctuating asymmetry as tools to detect stress in stress-adapted and nonadapted plants. Int. J. Plant Sci. 162(3): 607-616.
Alados, C. L., Y. Pueyo, M. L. Giner, T. Navarro, J. Escós, F. Barroso, B. Cabezudo & J. M. Emlen. 2003. Quantitative characterization of the regressive ecological succession by fractal analysis of plant spatial patterns. Ecol. Model. 163(1-2): 1-17.
Ashton, P. M. S., L. P. Olander, G. P. Berlyn, R. Thadani & I. R. Cameron. 1998. Change in leaf structure in relation to crown position and tree size of Betula papyrifera within fire-origin stands of interior cedar-hemlock. Can. J. Bot. 76(7): 1189-1187.
Blue, M. P. & R. J. Jensen. 1988. Positional and seasonal variation in oak (Quercus: Fagaceae) leaf morphology. Am. J. Bot. 75: 939-947.
Bradshaw, A. D. 1965. Evolutionary significance of phenotypic plasticity in plants. Adv. Genet. 13:115-155.
Browicz, K. 1982. Chorology of trees and shrubs in south west Asia and adjacent regions. Vol. 1. Polish Scientific Publishers. Warszawa-Poznań. 172 pp.
Bruschi, P. 2010. Geographical variation in morphology of Quercus petraea (Matt.) Liebl. as related to drought stress. Plant Biosyst. 144(1): 298-307.
Bruschi, P., P. Grossoni & F. Bussotti. 2003. Within-and among-tree variation in leaf morphology of Quercus petraea (Matt.) Liebl. natural populations. Trees 17(2): 164-172.
Clarke, G. M. 1993. The genetic basis of developmental stability. I. Relationships between stability, heterozygosity and genomic coadaptation. Genetica 89: 15-23.
Dickinson, T. A., W. H. Parker & R. E. Strauss. 1987. Another approach to leaf shape comparisons. Taxon 36(1): 1-20.
Fair, J. M. & D. D. Breshears. 2005. Drought stress and fluctuating asymmetry in Quercus undulata leaves: confounding effects of absolute and relative amounts of stress? J. Arid Environ. 62(2): 235-249.
Frampton, C. M. & J. M. Ward. 1990. The use of ratio variables in systematics. Taxon 39(4): 586-592.
Acta Botanica Mexicana 97: 65-81 (2011)
80
Freeman D. C., J. H. Graham, D. W. Byrd, E. D. McArthur & W. A. Turner. 1995. Narrow hybrid zone between two subspecies of big sagebrush, Artemisia tridentata (Asteraceae). III. Developmental instability. Am. J. Bot. 82(9): 1144-1152.
Graham, J. H., S. Raz, H. Hel-Or & E. Nevo. 2010. Fluctuating asymmetry: methods, theory, and applications. Symmetry 2(2): 466-540.
Geeske, J., G. Aplet & M. P. Vitousek. 1994. Leaf morphology along environmental gradients in Hawaiian Metrosideros polymorpha. Biotropica 26(1): 17-22.
Hódar, J. A. 2002. Leaf fluctuating asymmetry of Holm oak in response to drought under contrasting climatic conditions. J. Arid Environ. 52(2): 233-243.
Kozlov, M. V., B. J. Wilsey, J. Koricheva & E. Haukioja. 1996. Fluctuating asymmetry of birch leaves increases under pollution impact. J. Appl. Ecol. 33(6): 1489-1495.
Leary, R. F. & F. W. Allendorf. 1989. Fluctuating asymmetry as an indicator of stress: implications for conservation biology. Trends Ecol. Evol. 4(7): 214-217.
Llorens, L., J. Peñuelas & B. Emmet. 2002. Developmental instability and gas exchange responses of a heathland shrub to experimental drought and warming. Int. J. Plant Sci. 163(6): 959-967.
McPherson, S., D. Eamus & B. R. Murray. 2004. Seasonal impacts on leaf attributes of several tree species growing in three diverse ecosystems of south-eastern Australia. Austr. J. Bot. 52: 293-301.
Mohajer, M. R. 2007. Silviculture. University of Tehran Press. Tehran. 387 pp.Møller, A. P. & J. P. Swaddle. 1997. Asymmetry, developmental stability and evolution.
Oxford University Press. Oxford. 291 pp.Mosaddegh, A. 2006. Geography of world forest. University of Tehran Press. Teheran. 404
pp.Palmer, A. R. & C. Strobeck. 1986. Fluctuating asymmetry: measurement, analysis, patterns.
Ann. Rev. Ecol. Syst. 17: 391-421.Palmer, A. R. 1994. Fluctuating asymmetry analyses: a primer. In: Markow, T. A. (ed.).
Developmental instability: its origins and evolutionary implications. Kluwer. Dordrecht, Netherlands. pp. 335-364.
Palmer, A. R. & C. Strobeck. 1997. Fluctuating asymmetry and developmental stability: heritability of observable variation vs. heritability of inferred cause. J. Evolution. Biol. 10(1): 39-49.
Velázquez-Rosas, N., J. Meave & S. Vázquez-Santana. 2002. Elevational variation of leaf traits in montane rain forest tree species at La Chinantla, México. Biotropica 34(4): 534-546.
Valkama, J. & M. V. Kozlov. 2001. Impact of climatic factors on the developmental stability of mountain birch growing in a contaminated area. J. Appl. Ecol. 38: 665-673.
Wilsey, B. J., E. Haukioja, J. Koricheva & M. Sulkinoja. 1998. Leaf fluctuating asymmetry increases with hybridization and elevation in tree-line birches. Ecology 79(6): 2092-2099.
Xu, F., W. Guo, W. Xu, Y. Wei & R. Wang. 2009. Leaf morphology correlates with water and light availability: what consequences for simple and compound leaves? Prog. Nat. Sci. 19(12): 1789-1798.
Sattarian et al.: Phenotypic variation and leaf fluctuating asymmetry in Parrotia persica
81
Yousefzadeh, H., M. Tabari, M. Akbarinia, M. R. Akbarian & F. Bussoti. 2010. Morphological plasticity of Parrotia persica leaves in eastern of Hyrcanain forests (Iran) is related to altitude. Nord. J. Bot. 28(3): 344-349.
Zarafshar, M., M. Akbarinia, P. Bruschi, S. M. Hosseini, H. Yousefzadeh, M. Taieby & A. Sattarian. 2010. Phenotypic variation in chestnut (Castanea sativa Mill.) natural populations in Hyrcanian forest (north of Iran), revealed by leaf morphometrics. Folia Oecol. 37(1): 105-113.
Recibido en octubre de 2010.
Aceptado en agosto de 2011.