urbanización y crecimiento al. pinto rodriguez
TRANSCRIPT
8/12/2019 Urbanización y crecimiento AL. Pinto Rodriguez
http://slidepdf.com/reader/full/urbanizacion-y-crecimiento-al-pinto-rodriguez 1/42
Parte I
Demographic Transformations, Convergencesand Inequalities in Latin America:what the future holds?

8/12/2019 Urbanización y crecimiento AL. Pinto Rodriguez
http://slidepdf.com/reader/full/urbanizacion-y-crecimiento-al-pinto-rodriguez 2/42
8/12/2019 Urbanización y crecimiento AL. Pinto Rodriguez
http://slidepdf.com/reader/full/urbanizacion-y-crecimiento-al-pinto-rodriguez 3/42
25
Urban growth and mobility in Latin America 1
José Marcos P. da Cunha2 Jorge Rodríguez Vignoli3
Abstract Latin America (LA) is the most urbanized region in developing world. This is not due to astatistical ction, but to an actual agglomeration of its population in cities, many of them verylarge (1 million or more inhabitants). This feature has at least two consequences. On one hand,many indicators of the Millennium Development Goals (MDGs) provide a greater degree ofprogress in comparison with other regions in developing world. Considering the nature ofthese goals, concentration in cities facilitates the achievement of the MDG´s. On the otherhand, for LA countries, it is in big cities or metropolitan agglomerations where social problemsare more complex, and also where we can nd the largest concentrations of poverty. Despitesome empirical hypotheses of demographic and economic decentralization from large urbanagglomerations, these areas still remain the arena of the greatest challenges facing oursocieties. Accordingly, monitoring MDGs indicators in the region should be segmented byarea of residence (rural and urban) and city size. Thus, further analysis taking into accountdifferences within metropolitan agglomerations, must be considered. Historically, migrationhas had a central role on the demographic growth of LA cities; therefore, an understandingof changes in trends of the spatial distribution of the population must include a detailedanalysis of migration. By studying migration processes it is possible to understand, at leastin part, the consequences of the intense process of urbanization in LA countries. Indeed,the phenomena of metropolitanization (or demetropolitanization as suggested by someauthors) to some extent, is a reection of migration dynamics. The same can be said regardinginternal problems of the metropolitan areas. Hence, based on censuses data for some keyLatin America countries, this paper will provide evidence on several of these issues and drawattention to the challenges of measurement, analysis, and public policies involved.
1 Paper presented at the XXVI IUSSP International Population Conference, Session 143 (Demographic transformations,convergences and inequalities in Latin America: what the future holds? - Latin American Population Association),
September 27 to October 2, 2009, Marrakech, Morocco.2 University of Campinas (Unicamp), Population Studies Center (NEPO), Email: [email protected] ECLAC (CELADE-Population Division of ECLAC), Email: [email protected]

8/12/2019 Urbanización y crecimiento AL. Pinto Rodriguez
http://slidepdf.com/reader/full/urbanizacion-y-crecimiento-al-pinto-rodriguez 4/42
URBAN GROWTH AND MOBILITY IN LATIN AMERICA26
Introduction
The urbanization process in Latin America (LA) - or at least in a signicant part of theregion- was accelerated in the early 1950´s.The impulse came from transformationsin both society and economy resulting from an industrialization strategy promotedby the governments from most LA countries. This strategy was named “internaldevelopment” or “import substitution”, although most recently a newer - in ouropinion a more acute term has been developed “ State led industrialization ” (Ocampo,2001: 8). This strategy promoted urban activities (industry and services) and favored“modernization” of countryside investments. Both changes involved a dynamiceconomic growth in cities and the creation of a large workforce surplus in rural areasof countries.
This urbanization process has different characteristics from those achieved in thecurrent developed countries, in which urbanization, industrialization and economicdevelopment were concomitant and synergistic. Although, industrializationhas contributed to Latin America´s modernization and has facilitated socialachievements that positioned the region in compliance with most of the MDG’srequirements, its progress was detached, at least partially, from an economic, socialand institutional progress such as the one experimented by the current developedcountries. On the other hand, , this minor development involved a cumulative decitin infrastructure, resources and regulations that caused the urbanization and LatinAmerican cities’ functionalities be marked by poverty, precariousness, informalityand anomy. The 1980’s were particularly hard to cities in the region, since adverseeffects of “structural adjustment” policies carried out during this period in responseto the “debt crisis”, were concentrated on them. The adjustment impact was suchthat, by the end of that decade and the beginning of 1990’s the levels of urbanpoverty had increased considerably and a number of cities faced critical conditions(Rodriguez, 2002, Cunha, 2002). However, the past 15 years have been less severe
to cities, dismissing the catastrophic projections made at the beginning of the1990’s (urban and metropolitan “apocalypse”), even though these cities still record acomplex accumulation of problems and weaknesses.
One of the factors that contributed to attenuate the pressure on cities andmetropolises was the demographic change. In fact, until the 1980’s, acceleratedmetropolitan growth seemed unstoppable. However, from the beginning of the1990´s doubts emerged on its continuity. Furthermore, some researchers suggestedthat the reduction of the pace of spatial concentration of the population and
economic production be sustained, but without a signicant loss of the importanceof metropolises (Rodriguez and Martine, 2008; Cunha, 2002; Rodriguez 2002).
8/12/2019 Urbanización y crecimiento AL. Pinto Rodriguez
http://slidepdf.com/reader/full/urbanizacion-y-crecimiento-al-pinto-rodriguez 5/42
JOSÉ MARCOS P. DA CUNHA AND JORGE RODRÍGUEZ VIGNOLI 27
The changes in migration patterns, in particular internal migration, werefundamental to this moderation of the process of metropolitan growth. On one hand,there was a strong reduction –although not reversal, since net migration from thecountryside persists – of rural to urban migration. On the other hand, and perhapsmost importantly, internal migration no longer predominantly operates at the levelof large regions (or, from here on forward referred as, MAD: Major AdministrativeDivisions), but instead primarily consists of the exchange between municipalities(referred to in this article as MIAD: Minor Administrative Divisions) within the sameMAD. Likewise, it seems that the crisis that ravaged Latin American metropolis in the80´s and 90´s also led to an increase in the relevance of return migration.
The data analysis presented in this study suggests that in terms of urbanpopulation share, the most populated regions or the most inuential in LatinAmerican countries – in general, the regions where the national capitals are located- have experimented losses, but it is difficult to support that Latin American citiessystem are facing a signicant demographic decentralization process. Regardless,this study demonstrates that important changes do exist and a more complex citysystem is emerging as well as a more diverse migration pattern.
Urbanization and its demographic reality
Latin America and the Caribbean4
is the world’s most urbanized developingregion. This is due to a real migration revolution that occurred during the last sevendecades of the 20th century. In fact, 1950´s levels of urbanization in Latin Americaand the Caribbean were lower than those registered in developed regions (NorthAmerica, Europe and Oceania). In less than 40 years, the region reached urbanlevels of Europe and Oceania, thanks to rural exodus which generated an explosiveurban growth. Subsequently, in the past 20 years, urban growth slowed down dueto demographic transition and the reduction of emigration from de countryside.
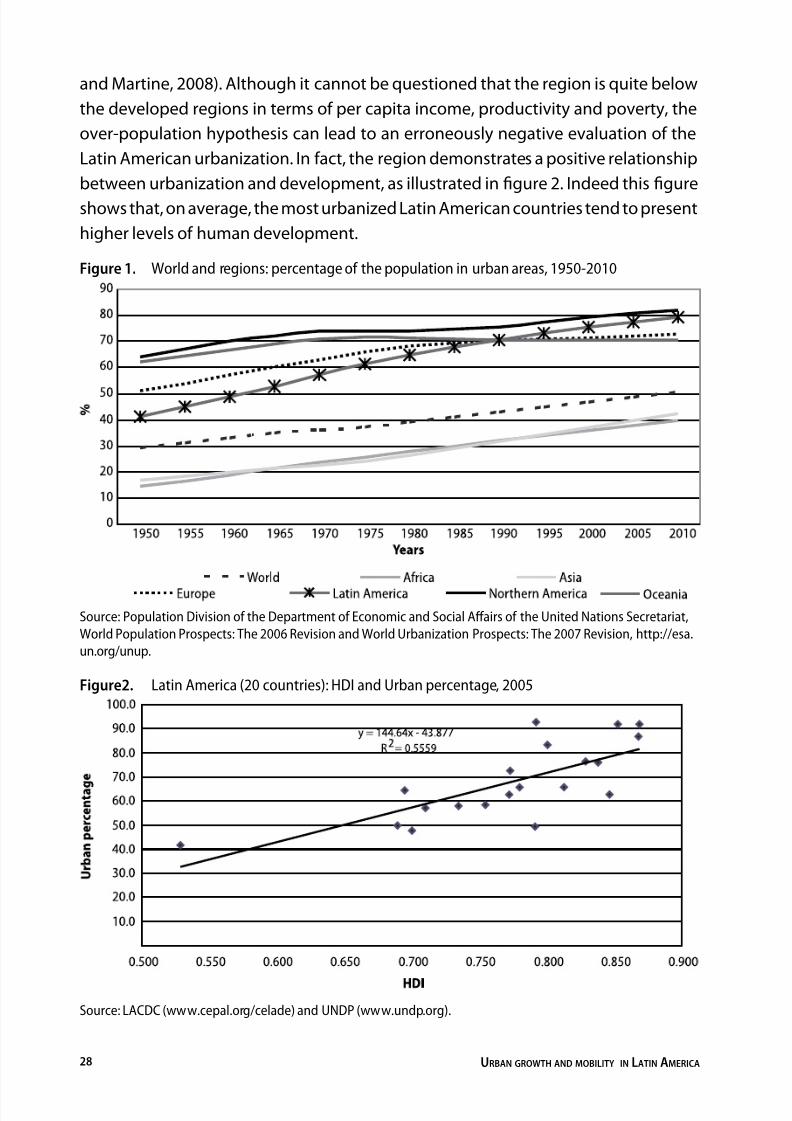
Nevertheless, rural exodus has continued, and so has urbanization. Currently, 80%of the region’s population is urbanized, a level surpassed only by Northern America,as can be seen in gure 1.
Expressions such as over-urbanization and hyper-urbanization have been usedto describe the region´s high levels of urbanization without accompanying the levelof economic and social development typical of industrialized countries (Rodriguez
4 The term Latin America and the Caribbean refers to the 42 countries and territories identied by LACDC as comprising
the region. The term Latin America refers to the 20 countries identied by LACDC as making up the subregion (17 onthe mainland and three Caribbean island territories: Cuba, Dominican Republic and Haiti). For fur ther information, seeLACDC (2005a) or Guzmán et al. (2006).
8/12/2019 Urbanización y crecimiento AL. Pinto Rodriguez
http://slidepdf.com/reader/full/urbanizacion-y-crecimiento-al-pinto-rodriguez 6/42
URBAN GROWTH AND MOBILITY IN LATIN AMERICA28
and Martine, 2008). Although it cannot be questioned that the region is quite belowthe developed regions in terms of per capita income, productivity and poverty, theover-population hypothesis can lead to an erroneously negative evaluation of theLatin American urbanization. In fact, the region demonstrates a positive relationshipbetween urbanization and development, as illustrated in gure 2. Indeed this gureshows that, on average, the most urbanized Latin American countries tend to presenthigher levels of human development.
Figure 1. World and regions: percentage of the population in urban areas, 1950-2010
Source: Population Division of the Department of Economic and Social Affairs of the United Nations Secretariat,World Population Prospects: The 2006 Revision and World Urbanization Prospects: The 2007 Revision, http://esa.un.org/unup.
Figure2. Latin America (20 countries): HDI and Urban percentage, 2005
Source: LACDC (www.cepal.org/celade) and UNDP (www.undp.org).

8/12/2019 Urbanización y crecimiento AL. Pinto Rodriguez
http://slidepdf.com/reader/full/urbanizacion-y-crecimiento-al-pinto-rodriguez 7/42
JOSÉ MARCOS P. DA CUNHA AND JORGE RODRÍGUEZ VIGNOLI 29
On the other hand, the lack of an official denition of “urban” in the region(Cohen, 2006) raises some doubts as to the validity of this high urbanization level,since this high urbanization level may be the result of a “statistical ction”. However,in purely demographic terms, Latin American urbanization is undeniable. Theevidence for this comes from data monitoring the diversity of national denitionsof “urban”, which identify undeniable urban localities in order to avoid problems ofconsistency in comparisons (Montgomery et al., 2004). Calculations for a group of 18countries in the region with data from 2000 round of censuses, 5 indicates that 62% ofthe region´s total population and 81% of urban population were living in cities with20,000 or more inhabitants (CELADE-Population Division of ECLAC, 2007).
Urbanization has continued to advance even though the development modelchanged to one that has granted more economic leadership to rural areas. In effect,the latter is the locus of primary product production for world exports, precisely theengine of the model of openness and deregulation imposed in the 1980´s. In spiteof this, rural population has been shrinking in absolute terms since 1990. Given thispopulation´s natural growth, there seems to be a signicant net rural emigration(specic evidence on the scale of net migration from the countryside will beprovided in a subsequent session). It is therefore possible to conclude that the newdevelopment model has not increased the population’s growth rate in rural areas. This should come as no surprise, as the region had already experienced agricultural
modernization processes that resulted in migratory outows between 1940 and 1980(Alberts and Villa, 1980). Although there has been an agricultural revival since mid-1980s- expressed in a slight increase in added value from agricultural productionwithin total GDP (ECLA, 2005) and a steady share of the total GDP between 1990and 2008 (ECLAC, 2009, BADECON link http://www.cepal.org/estadisticas/bases/). This has mainly been based on large farms and forestry industry that tend to pushout traditional farming. Furthermore, the labor demand of these industries is highlyseasonal, and is therefore, often met by urban workers (LACDC, 2005b).
Thus, there are no signs of counter-urbanization in the region, or does this seemslikely to be triggered by productive activities. As in Europe, if counter-urbanizationwere to occur, it would be the result of housing related forces promoted bytechnological progress, improved infrastructure and connectivity, and changes inpopulation’s structure and people´s purchasing power (Gans, 2007; Ferras, 2007). Inother words, an eventual return to the countryside would not represent a returnto agriculture, but rather a decision to combine the quality of life in rural settings
5
Argentina, Bolivia, Brazil, Chile, Colombia, Costa Rica, Cuba, Dominican Republic Ecuador, Guatemala, Haiti,Honduras, Mexico, Nicaragua, Panama, Paraguay, Bolivarian Republic of Venezuela and Uruguay, which combinedrepresent 95% of the region’s current population.
8/12/2019 Urbanización y crecimiento AL. Pinto Rodriguez
http://slidepdf.com/reader/full/urbanizacion-y-crecimiento-al-pinto-rodriguez 8/42
URBAN GROWTH AND MOBILITY IN LATIN AMERICA30
with the employment, education and leisure opportunities in nearby urban areas.Moreover, it is difficult to conceive of a high quality life in the region´s rural areas,as long as social indicators remain below those of urban settings (LACDC, 2007 and2005b).
In summary, the argument on the validity of the level of urbanization in LatinAmerica is unnecessary from the demographic point of view; however, the discussionon the form of this process is totally valid, particularly the structure of the city systemand the conguration of its metropolises (inside and its surroundings). Both topicswill be discussed in the following sections.
Notwithstanding, to accept the urbanization process as an irreversible feature inthe region, does not imply that rural areas should be forgotten. In particular, in someSouthern American and in most of Meso-American and Caribbean countries, thisareas are still socioeconomically and demographically very relevant. Additionally,there is an extensive amount of literature produced in relation to new forms andcharacteristics of rural social and economic systems; as well as the increasinginterconnection between urban and rural areas. 6 Although there is an intense debaterelated to this topic, there is consensus (some of which is not recent) between thosewho highlight the existence of a rural - urban gradient and not a dichotomy, theemerging urban life in rural environments due to higher residential density and builtlandscape, and the formation of complex habitats that integrate rural and urban
environments; similarly, the current Latin American countryside vision signicantlydiffers from that of the past (associated with traditionalism and neglect) even thoughit´s quality of life indicators are inferior to those in cities.
(De)Concentration, (De)Metropolitanization, Concentrated Deconcentration:What is Latin America´s Situation?
Background
In general, globalization and productive restructuring trigger changes in thedistribution of productive activities in geographical areas producing signicanteffects on the pattern of population settlement and migration ows. This topic hasbeen considered by several researchers, although from different perspectives, suchas the following: Sassen (2007 and 1991); Wong-Gonzales (1990); Harvey (1993);Benko (1996); Castell (1999); Yusuf, Evenett and Wu (2000).
6
The “new rurality” debate and its relation to urbanism is an open discussion and has been the subject of manyresearchers. Please refer to: Ruiz and Delgado, 2008, Hugo et al. (2001), Hayami, (2000), Silva (1997 and 1999), Cunhaand Rodrígues (2001)
8/12/2019 Urbanización y crecimiento AL. Pinto Rodriguez
http://slidepdf.com/reader/full/urbanizacion-y-crecimiento-al-pinto-rodriguez 9/42
JOSÉ MARCOS P. DA CUNHA AND JORGE RODRÍGUEZ VIGNOLI 31
This research does not aim at providing a detailed debate on the impact ofproductive deconcentration itself. However, it is important to highlight some of theimportant points of this discussion. A study on Latin American urban characteristicsshowed that there is a broad and complex discussion on the existence of adeconcentration process in the region (Cunha, 2002). The same analysis pointedout that although some studies and evidence existed on the impact of globalizationand productive restructuring on the decentralization process of economic activityand the spatial distribution of the population in countries such as Mexico, Chileand Brazil, there were also some indications of the contrary. Although it is true that“globalization reinforces the regional specialization strategy” (Pacheco, 1998: 257),it cannot be denied that, as Mills (2000: 69) indicates, “globalization reinforces thebenets of large urban areas”.
According to Benko (1996:52) “the different stages of the production process arelocated in spatial differential modes, implying its technological characteristics and thelevel of qualication they require. Highly technical complex activities and the executivefunctions are reserved to central regions, while repetitive tasks, less qualied, thatrequires considerable workforce, are relegated to the periphery” (free translation).
In other words, when we refer to this question, it seems that we need to considerWon-Gonzales (1990:21)´s warning that “dispersion tendencies or the concentrationof, cannot be generalized” once that “they vary from one productive sector to
another… and also within the different productive segments from the same sector…”.Furthermore, the author emphasizes that dispersion/concentration patterns canalso vary from time to time, which demonstrates the difficulty to establish a uniquepattern of the territorial impact of globalization.
What does the data tell us in this question? Has there been a demographicdeconcentration in Latin America, particularly in the metropolises? Are there anyindications, from the demographic point of view, of the existence of such a process? This is the point of discussion in next section.
Strengthening deconcentration
The urbanization process in Latin America has been historically linked to theformation of large urban and metropolitan agglomerations, generally, established inthe main city, usually the country´s capital. Nowadays, from the point of view of theevolution of the relative distribution of the population between major administrativedivisions (MAD), the fact is that there is no clear evidence of a sustained process ofdemographic deconcentration in Latin American countries, except for a few.
According to the systematized information taken from DEPUALC database(Spatial Distribution of Population and Urbanization in Latin America and the
8/12/2019 Urbanización y crecimiento AL. Pinto Rodriguez
http://slidepdf.com/reader/full/urbanizacion-y-crecimiento-al-pinto-rodriguez 10/42
URBAN GROWTH AND MOBILITY IN LATIN AMERICA32
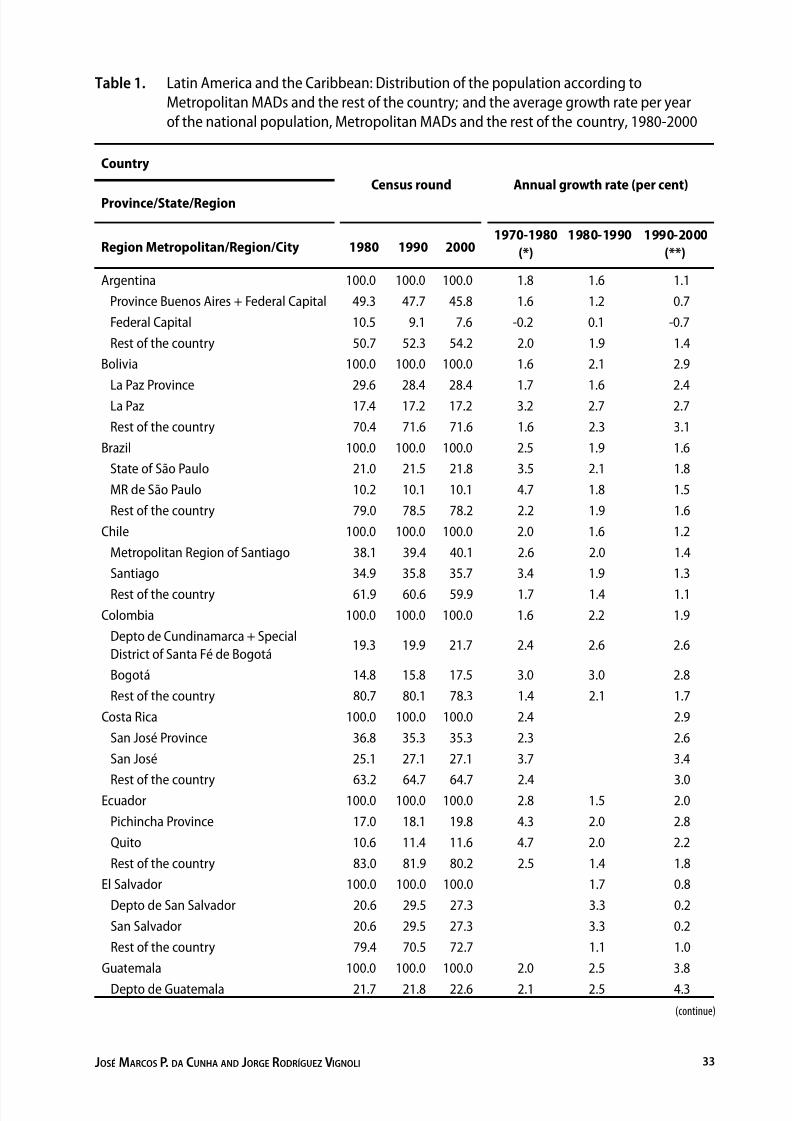
Caribbean) created and maintained by LACDC (www.cepal.org/celade/depualc/) incountries like Argentina, Chile, Panama and Uruguay, over 40% of the populationlive in metropolitan MADs, (where the main city and/or capital is located), while inother countries of the region (like Brazil, Colombia, Ecuador, Mexico and Venezuela(Bol. Rep.)) this concentrated pattern did not exist. As it is shown further on, for manyLatin America countries, the city network is much more complex and involves muchmore of the national territory.
It is also evident that trends of population concentration taking place indifferent metropolitan MADs differ. Data from Table 1 show that, between 1980 and2000, in Chile, Costa Rica, Ecuador, Panama, Paraguay and the Dominican Republic,an increase of the relative participation of corresponding MAD was registered innational population. In the rest of countries included on table 1, there is stability inthe concentration process or a slight reduction of metropolitan density.
As Cunha (2002) stated, it is in fact “premature to claim that the demographicconcentration that has taken place in the region, in the past 40 years is sufferinga conclusive reversion of signicant proportions”. This same research underlinedthat “in the majority of Latin American countries, the metropolitan region (or theregion’s capital when MADs were not constituted yet) still presented an equal oreven larger increase than the country’s, at least up to the 80’s”. Indeed, this trend canbe observed in Table 1.
It is also important to consider that even in countries where the main metropolitanregion has grown slower than the national population, which is the case of Argentina,Bolivia, Brazil, Mexico, Nicaragua and Venezuela (Bol. Rep.), it does not mean that themetropolitan agglomeration phenomenon has stopped or simply disappeared. Datafrom DEPUALC reveals that in many countries in spite of the reduction of total increase,there are large agglomerations expanding faster than national average. For example:Cordoba, San Miguel de Tucuman and Mendoza in Argentina; Belo Horizonte, Curitiba,Brasilia, Fortaleza and Salvador in Brazil; Temuco, Puerto Montt and Antofagasta
in Chile; Cali and Bucaramanga in Colombia; Guayaquil in Ecuador; Monterrey,Guadalajara, Puebla, Juarez City in Mexico; Trujillo and Arequipa in Peru; Maracay,Maracaibo, Valencia and Barquisemento in Venezuela (Bol. Rep.) (Cunha, 2002).
Consequently, empirical evidence suggests that the decreasing importance ofmain cities or metropolitan regions of countries cannot only be substantiated ondemetropolitanization, demographic deconcentration; or the so called counter-urbanization as dened by developed countries. Gradual loss of importance of thegreatest metropolises within the national population is not such a relevant phenomenon;
however, the most interesting fact has happened in other agglomerations of smallersize, which have undergone a considerable population increase.
8/12/2019 Urbanización y crecimiento AL. Pinto Rodriguez
http://slidepdf.com/reader/full/urbanizacion-y-crecimiento-al-pinto-rodriguez 11/42
JOSÉ MARCOS P. DA CUNHA AND JORGE RODRÍGUEZ VIGNOLI 33
Table 1. Latin America and the Caribbean: Distribution of the population according toMetropolitan MADs and the rest of the country; and the average growth rate per yearof the national population, Metropolitan MADs and the rest of the country, 1980-2000
CountryCensus round Annual growth rate (per cent)
Province/State/Region
Region Metropolitan/Region/City 1980 1990 20001970-1980
(*)1980-1990 1990-2000
(**)
Argentina 100.0 100.0 100.0 1.8 1.6 1.1Province Buenos Aires + Federal Capital 49.3 47.7 45.8 1.6 1.2 0.7Federal Capital 10.5 9.1 7.6 -0.2 0.1 -0.7Rest of the country 50.7 52.3 54.2 2.0 1.9 1.4
Bolivia 100.0 100.0 100.0 1.6 2.1 2.9La Paz Province 29.6 28.4 28.4 1.7 1.6 2.4La Paz 17.4 17.2 17.2 3.2 2.7 2.7Rest of the country 70.4 71.6 71.6 1.6 2.3 3.1
Brazil 100.0 100.0 100.0 2.5 1.9 1.6State of São Paulo 21.0 21.5 21.8 3.5 2.1 1.8MR de São Paulo 10.2 10.1 10.1 4.7 1.8 1.5Rest of the country 79.0 78.5 78.2 2.2 1.9 1.6
Chile 100.0 100.0 100.0 2.0 1.6 1.2Metropolitan Region of Santiago 38.1 39.4 40.1 2.6 2.0 1.4Santiago 34.9 35.8 35.7 3.4 1.9 1.3
Rest of the country 61.9 60.6 59.9 1.7 1.4 1.1Colombia 100.0 100.0 100.0 1.6 2.2 1.9
Depto de Cundinamarca + SpecialDistrict of Santa Fé de Bogotá
19.3 19.9 21.7 2.4 2.6 2.6
Bogotá 14.8 15.8 17.5 3.0 3.0 2.8Rest of the country 80.7 80.1 78.3 1.4 2.1 1.7
Costa Rica 100.0 100.0 100.0 2.4 2.9San José Province 36.8 35.3 35.3 2.3 2.6San José 25.1 27.1 27.1 3.7 3.4
Rest of the country 63.2 64.7 64.7 2.4 3.0Ecuador 100.0 100.0 100.0 2.8 1.5 2.0Pichincha Province 17.0 18.1 19.8 4.3 2.0 2.8Quito 10.6 11.4 11.6 4.7 2.0 2.2Rest of the country 83.0 81.9 80.2 2.5 1.4 1.8
El Salvador 100.0 100.0 100.0 1.7 0.8Depto de San Salvador 20.6 29.5 27.3 3.3 0.2San Salvador 20.6 29.5 27.3 3.3 0.2Rest of the country 79.4 70.5 72.7 1.1 1.0
Guatemala 100.0 100.0 100.0 2.0 2.5 3.8Depto de Guatemala 21.7 21.8 22.6 2.1 2.5 4.3
(continue)

8/12/2019 Urbanización y crecimiento AL. Pinto Rodriguez
http://slidepdf.com/reader/full/urbanizacion-y-crecimiento-al-pinto-rodriguez 12/42
URBAN GROWTH AND MOBILITY IN LATIN AMERICA34
(continued)
CountryCensus round Annual growth rate (per cent)
Province/State/Region
Region Metropolitan/Region/City 1980 1990 20001970-1980
(*)1980-1990 1990-2000
(**) Guatemala 19.3 19.0 19.1 1.8 2.4 3.9
Rest of the country 78.3 78.2 77.4 2.0 2.5 3.7Honduras 100.0 100.0 100.0 4.4 2.9
Depto Francisco Morazán 17.1 18.4 18.1 5.1 2.8Tegucigalpa 10.3 12.7 12.5 6.4 2.8Rest of the country 82.9 81.6 81.9 4.2 2.9
Mexico 100.0 100.0 100.0 3.3 2.0 1.8 Federal District and the State of Mexico 24.5 22.2 22.3 4.4 1.0 1.9 Mexico City 21.0 18.6 18.0 4.5 0.8 1.5Rest of the country 75.5 77.8 77.7 3.0 2.3 1.8
Nicaragua 100.0 100.0 100.0 3.6 1.7
Depto de Managua 25.1 24.6 24.6 3.4 1.4Managua 19.8 19.2 19.2 3.4 1.4Rest of the country 74.9 75.4 75.4 3.6 1.7
Panama 100.0 100.0 100.0 2.4 2.6 2.0Panama Province 44.8 46.0 48.9 3.4 2.9 2.6Panama 33.8 36.3 43.0 3.0 3.3 3.7Rest of the country 55.2 54.0 51.1 1.6 2.4 1.4
Paraguay 100.0 100.0 100.0 2.4 3.2 2.2Depto Central (including the DistrictCapital de Asunción)
31.4 32.9 36.3 3.1 3.7 3.2
Gran Asunción 27.1 28.3 31.0 3.3 3.7 3.1Rest of the country 68.6 67.1 63.7 2.1 3.0 1.7
Dominican Republic 100.0 100.0 100.0 3.1 2.2 1.8National District 27.6 30.1 31.9 6.0 2.9 2.5Santo Domingo 23.4 22.1 25.1 6.3 1.7 3.3Rest of the country 72.4 69.9 68.1 2.2 1.9 1.5
Uruguay 100.0 100.0 100.0 0.6 0.6 0.3Depto Montevideo-Canelones 56.7 56.5 55.9 0.7 0.6 0.2Montevideo 51.1 50.3 47.4 0.8 0.5 -0.4Rest of the country 43.3 43.5 44.1 0.4 0.7 0.5
Venezuela (Bol. Rep.) 100.0 100.0 100.0 3.1 2.5 2.2Federal-Miranda District 24.1 22.0 19.4 2.5 1.4 1.1Caracas 18.2 15.3 12.5 1.9 0.5 0.3Rest of the country 75.9 78.0 80.6 3.3 2.8 2.5
Source: LACDC, DEPUALC.(*) For Bolivia, Honduras and Nicaragua, the data period is 1970/90 considering that the 1980 census was notcarried out.(**) For Costa Rica, the data period is 1980/2000 considering that the 1990 census was not carried out.
Although this topic deserves more profound research, this rst look shows that
there are not clear signs of the counter-urbanization phenomenon as in Europe andthe United States (Champion, 1998). Although in the last decades some countries
8/12/2019 Urbanización y crecimiento AL. Pinto Rodriguez
http://slidepdf.com/reader/full/urbanizacion-y-crecimiento-al-pinto-rodriguez 13/42
JOSÉ MARCOS P. DA CUNHA AND JORGE RODRÍGUEZ VIGNOLI 35
like Brazil, Costa Rica, Guatemala, Nicaragua, Cuba, Mexico and Venezuela (Bol.Rep.), experienced a slight degree of demographic deconcentration towards otherregions, the metropolitan phenomenon is still alive and predominant in the regionalscenario.
In summary, Latin American countries tend to present a characteristicconcentration of population in big cities, as it will be discussed further on; therefore,this feature is not likely to suffer any noteworthy modication whatsoever.
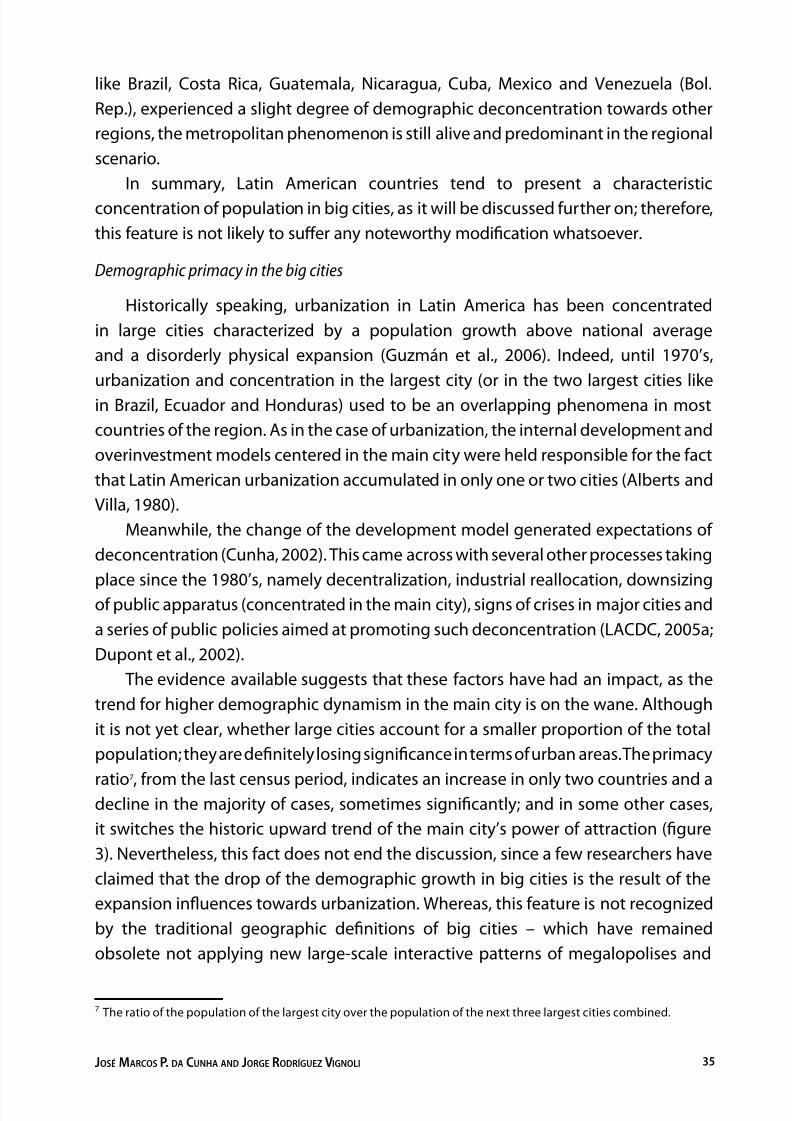
Demographic primacy in the big cities
Historically speaking, urbanization in Latin America has been concentratedin large cities characterized by a population growth above national averageand a disorderly physical expansion (Guzmán et al., 2006). Indeed, until 1970’s,urbanization and concentration in the largest city (or in the two largest cities likein Brazil, Ecuador and Honduras) used to be an overlapping phenomena in mostcountries of the region. As in the case of urbanization, the internal development andoverinvestment models centered in the main city were held responsible for the factthat Latin American urbanization accumulated in only one or two cities (Alberts andVilla, 1980).
Meanwhile, the change of the development model generated expectations ofdeconcentration (Cunha, 2002). This came across with several other processes takingplace since the 1980’s, namely decentralization, industrial reallocation, downsizingof public apparatus (concentrated in the main city), signs of crises in major cities anda series of public policies aimed at promoting such deconcentration (LACDC, 2005a;Dupont et al., 2002).
The evidence available suggests that these factors have had an impact, as thetrend for higher demographic dynamism in the main city is on the wane. Althoughit is not yet clear, whether large cities account for a smaller proportion of the totalpopulation; they are denitely losing signicance in terms of urban areas. The primacy
ratio7
, from the last census period, indicates an increase in only two countries and adecline in the majority of cases, sometimes signicantly; and in some other cases,it switches the historic upward trend of the main city’s power of attraction (gure3). Nevertheless, this fact does not end the discussion, since a few researchers haveclaimed that the drop of the demographic growth in big cities is the result of theexpansion inuences towards urbanization. Whereas, this feature is not recognizedby the traditional geographic denitions of big cities – which have remainedobsolete not applying new large-scale interactive patterns of megalopolises and
7 The ratio of the population of the largest city over the population of the next three largest cities combined.
8/12/2019 Urbanización y crecimiento AL. Pinto Rodriguez
http://slidepdf.com/reader/full/urbanizacion-y-crecimiento-al-pinto-rodriguez 14/42
URBAN GROWTH AND MOBILITY IN LATIN AMERICA36
millionaire cities – the reduction of the primacy ratio, could be a statistical ctionthen. Furthermore in this research, this issue will be discussed and analyzed with thehypothesis of “concentrated deconcentration”.
The traditional pattern of urbanization concentrated in one or two major citieshas made permanent effect in the region in addition to worldwide scale impactof the high primacy ratio present in the majority of these countries. Among theresulting consequences are the extensive number of megalopolises that are nowlocated here 8, and the large proportion of the population living in cities with overone million inhabitants.
Figure 3. Latin America: primacy index, 1950, 1990 and 2000
Source: DEPUALC database. (www.cepal.org/celade/depualc/).
The data on table 2 indirectly show that most countries have a network of
large-sized cities that cover a signicant part of the nation’s total population. Infact, it is perceived that cities with 500 thousand inhabitants or more represent, inpercentage, more than a third of the countries involved. As previously pointed out,in large countries like Argentina, Brazil, Venezuela (Bol. Rep.), places where the MADcontinuously lose signicance – the largest amounts of the population live in thebig cities.
The table also reveals, that cities with population over 500 thousand reducetheir relative importance in only a few countries. It is a fact, the cities’ network in
8 Megalopolises are cities of 10 million or more inhabitants. In 2005, while the regional population represented 8.6%of the world population, it accounted for almost 30% of the world’s megalopolises (United Nations, 2006).

8/12/2019 Urbanización y crecimiento AL. Pinto Rodriguez
http://slidepdf.com/reader/full/urbanizacion-y-crecimiento-al-pinto-rodriguez 15/42
JOSÉ MARCOS P. DA CUNHA AND JORGE RODRÍGUEZ VIGNOLI 37
Latin American countries exhibit increasing complexity as intermediary cities gainmore importance; however, it is unlikely that big cities are losing their leadership inthe demographic, socio-economic and political elds.
Table 2. Percentage evolution of the relative weight of big cities Latin America, selected
countries1980-2000
Country
One million or more 500 to 999 thousands 500 thousand and more
% in 2000Evolution
1980/2000(*)% in 2000
Evolution1980/2000(*)
% in 2000Evolution
1980/2000(*)
Argentina 40.2 -2.5 7.8 -0.9 47.9 -3.5
Bolivia 30.6 9.3 6.2 1.8 36.9 11.1
Brazil 33.6 1.8 3.5 1.1 37.1 2.9
Chile 35.7 0.8 9.8 -0.1 45.5 0.6
Costa Rica 27.1 5.3 - - 27.1 5.3
Ecuador 29.5 3.5 - - 29.5 3.5
Guatemala 19.1 -0.2 - - 19.1 -0.2
Honduras 12.5 2.2 11.3 3.8 23.8 6.0
Mexico 30.1 -1.1 8.8 1.7 38.9 0.6
Nicaragua 19.2 -1.3 2.7 -0.2 21.9 -1.5
Panama 43.0 9.1 - - 43.0 9.1
Paraguay 31.0 3.9 - - 31.0 3.9
DominicanRepublic
25.1 1.7 5.9 1.3 31.0 3.0
Uruguay 47.4 -3.8 - - 47.4 -3.8
Venezuela (Bol.Rep.)
26.5 -3.5 13.3 0.9 39.8 -2.6
Source: ECLAC (CELADE), DEPUALC database.(*) Periods vary according to countries. For Bolivia, Honduras and Nicaragua the period refers to the 70’s and2000’s.
City System and its Structure according to the Categories of Population Size
In order to study the regional system of human settlement in detail, several sizecategories were created. (See Table 3 and gures 4 and 5). 9 Cities with 20 thousand or
9 The categories are: (a) “millionaire” cities (1 million or more inhabitants); (b) large intermediate cities (between
500,000 and 1 million inhabitants); (c) medium-sized intermediate cities (between 50,000 and 500,000 inhabitants);(d) small intermediate cities (between 20,000 and 50,000 inhabitants; and (e) small urban areas (with between 2,000and 20,000 inhabitants).
8/12/2019 Urbanización y crecimiento AL. Pinto Rodriguez
http://slidepdf.com/reader/full/urbanizacion-y-crecimiento-al-pinto-rodriguez 16/42
URBAN GROWTH AND MOBILITY IN LATIN AMERICA38
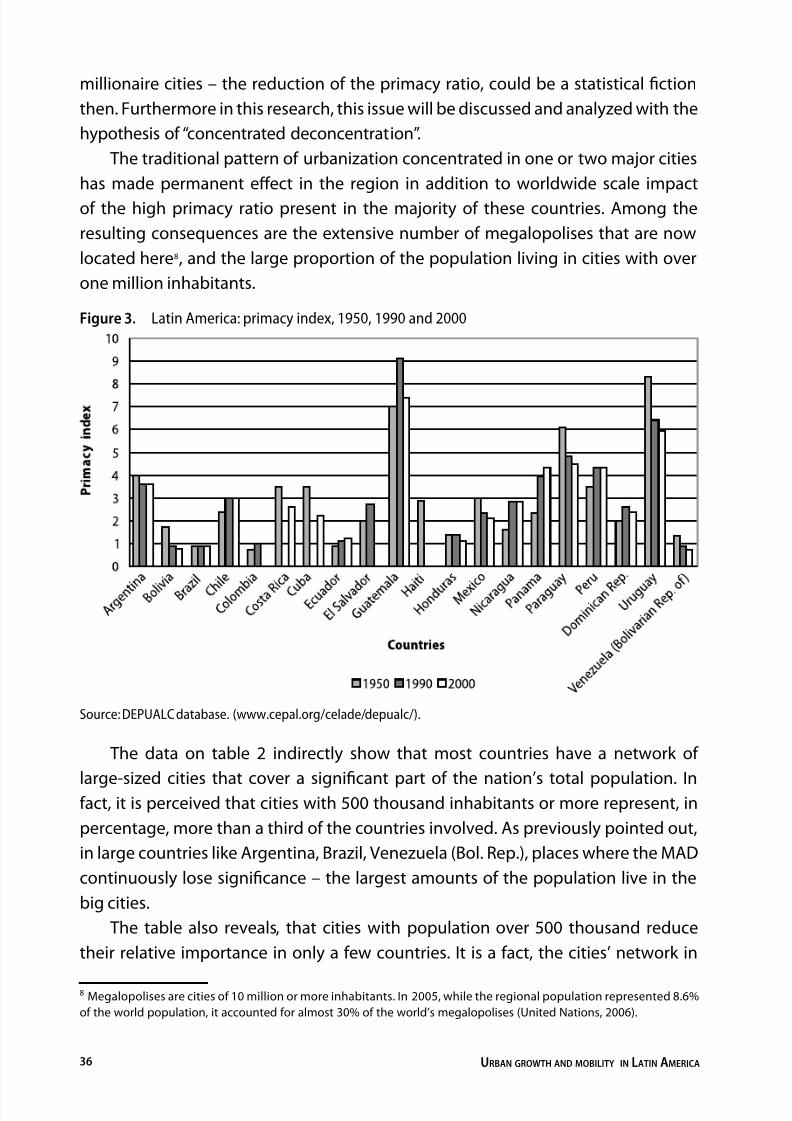
more inhabitants are counted individually. 10 Smaller urban areas are added togetherrather than counted individually. The population in places with fewer than 2,000inhabitants or dispersed populations are counted as residual.
This information was used to create table 3, which shows the number of areasover 20 thousand inhabitants by census and size category. Regional urbanizationhas clearly involved a striking expansion and diversication of the city system, asbetween 1950 and 2000 the region moved from 314 to 1,851 cities with more than20 thousand inhabitants. 11 This more complex urban network forms a social andterritorial basis that is more conductive to regional development, given the long-term disadvantages associated with top-heavy urban systems (Davis and Henderson,2003). Although the number of “millionaire” cities also increased (sevenfold between1950 and 2000) expansion has suffered a slowdown in the 1990’s. Furthermore, thelimited number of cities in the following inferior category suggests that no majorincrease be expected in the present decade. Medium-sized intermediate cities(50,000 to 500,000 inhabitants) and smaller intermediate cities (20,000 to 50,000inhabitants) are growing fast in terms of number of nodes, which conrms the trendtowards a more robust and complex urban system.
Table 3. Latin America and the Caribbean: number of cities in each size category, census rounds1950 to 2000
Size category 1950 1960 1970 1980 1990 2000
1,000,000 and above 5 11 19 26 37 45500,000 to 1,000,000 6 13 17 25 32 40100,000 to 500,000 51 75 132 191 224 27650,000 to 100,000 62 111 154 197 294 37820,000 to 50,000 190 307 446 627 831 1,112Total cities with 20,000 and above 314 517 768 1,066 1,418 1,851
Source: Spatial Distribution of the Population and Urbanization in Latin America and the Caribbean (DEPUALC).Note: Countries included in the table by Census round.
Census round 1950: Argentina, Bolivia, Brazil, Chile, Colombia, Costa Rica, Cuba, Ecuador,El Salvador, Guatemala, Haiti, Honduras, Mexico, Nicaragua, Panama, Paraguay, Peru,Dominican Republic, Venezuela (Bol. Rep.).Excluded: Uruguay (There was not census in this round).
Census round 1960: Argentina , Brazil, Chile, Colombia, Costa Rica, Cuba, Ecuador, ElSalvador, Guatemala, Honduras, Mexico, Nicaragua, Panama, Paraguay, Peru, DominicanRepublic, Venezuela (Bol. Rep.), Uruguay.Excluded: Bolivia and Haiti (There was not census in this round).
10 These cities can therefore be identied and monitored over time using longitudinal analyses. Although this type ofanalysis has been carried out for specic countries (CELADE, 2007), this will not be done here as such a region wide
vision goes beyond the scope of this document.11 Figures shown in table 3 are not fully comparable since the year of available censuses differs from countryto country.

8/12/2019 Urbanización y crecimiento AL. Pinto Rodriguez
http://slidepdf.com/reader/full/urbanizacion-y-crecimiento-al-pinto-rodriguez 17/42
JOSÉ MARCOS P. DA CUNHA AND JORGE RODRÍGUEZ VIGNOLI 39
Census round 1970: Argentina, Bolivia, Brazil, Chile, Colombia, Costa Rica, Cuba, Ecuador,El Salvador, Guatemala, Haiti, Honduras, Mexico, Nicaragua, Panama, Paraguay, Peru,Dominican Republic, Venezuela (Bol. Rep.), Uruguay.
Census round 1980: Argentina, Brazil, Chile, Colombia, Costa Rica, Cuba, Ecuador,Guatemala, Haiti, Honduras, Mexico, Panama, Paraguay, Peru, Dominican Republic,Venezuela (Bol. Rep.), Uruguay.Excluded: Bolivia, El Salvador, Nicaragua (There was not census in this round).
Census round 1990: Argentina, Bolivia, Brazil, Chile, Colombia, Ecuador, El Salvador,Guatemala, Mexico, Nicaragua, Panama, Paraguay, Peru, Dominican Republic, Venezuela(Bol. Rep.), Uruguay.Excluded: Costa Rica, Cuba, Haiti, Honduras (There was not census in this round).
Census round 2000: Argentina, Bolivia, Brazil, Chile, Colombia, Costa Rica, Cuba, Ecuador,Guatemala, Haiti, Honduras, Mexico, Nicaragua, Panama, Paraguay, Dominican Republic,Venezuela (Bol. Rep.), Uruguay.Excluded: El Salvador (data unprocessed yet), Peru (data unprocessed yet).
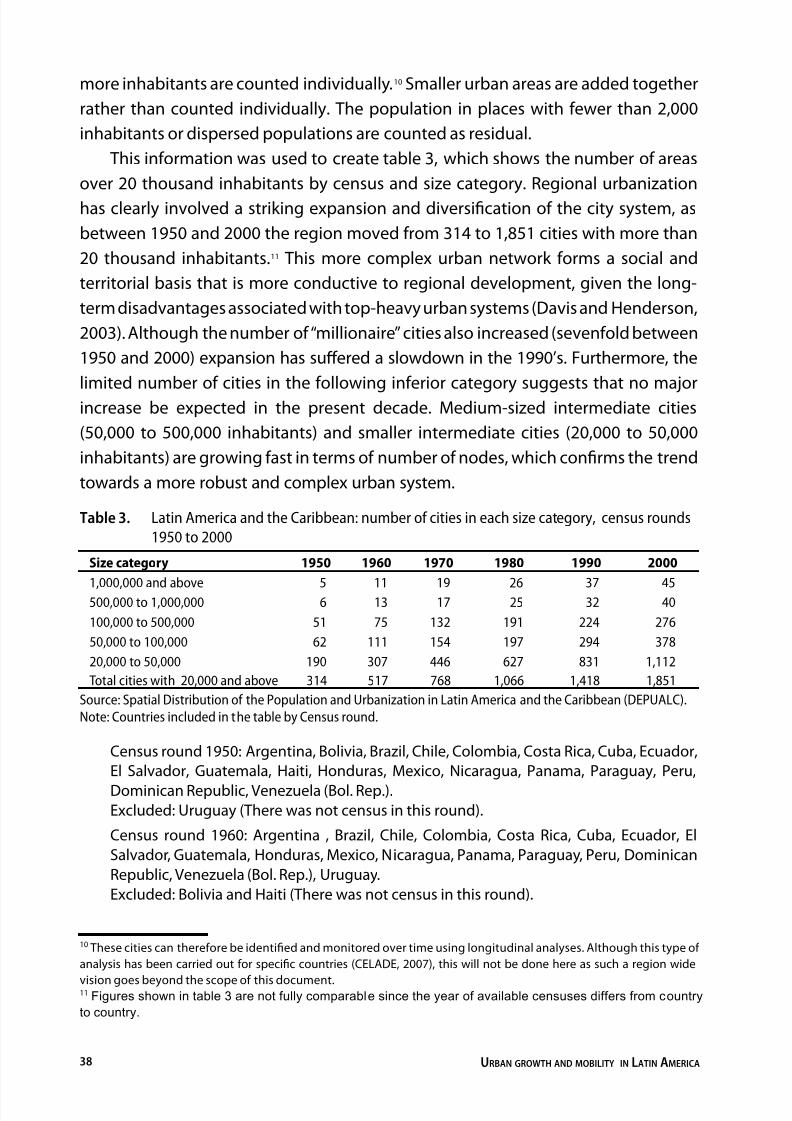
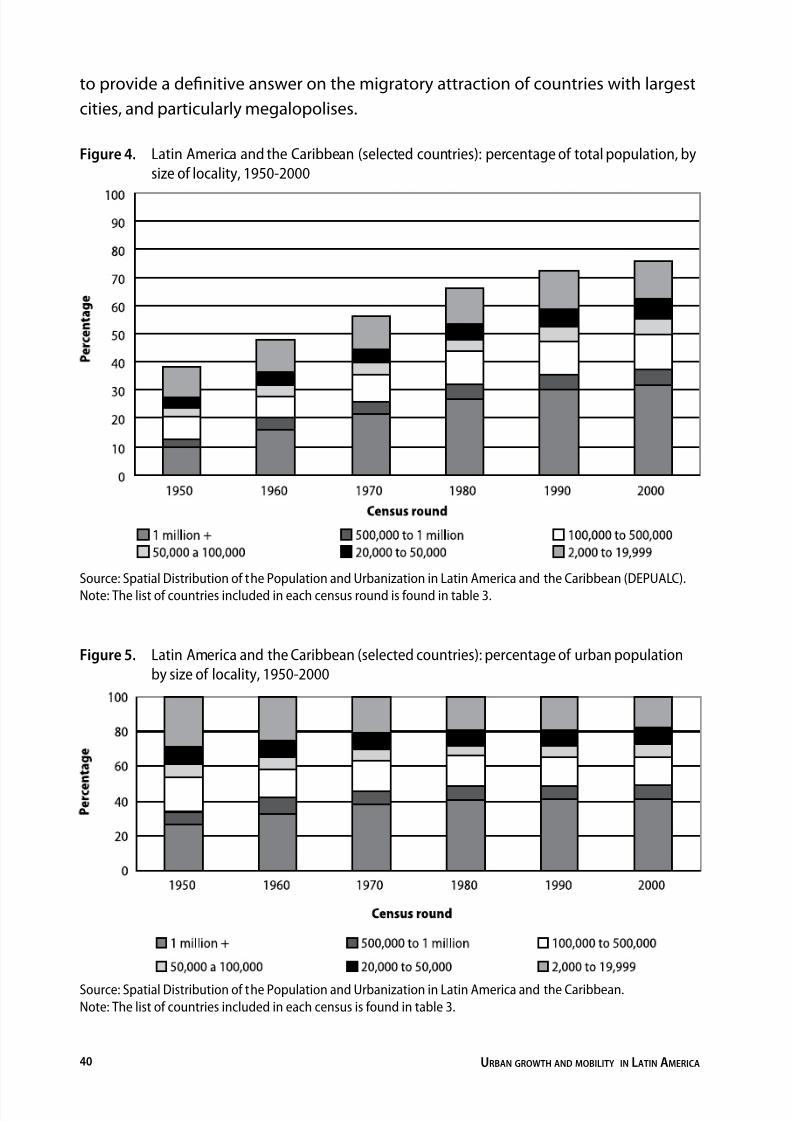
Advanced urbanization and the rise in the number of nodes in each sizecategory of the urban system have increased the relative proportion of all categorieswithin the total population (gure 4). “Millionaire” cities doubled their share to reachextraordinary proportions on a worldwide scale: almost one out of three inhabitantsof the region lives in such cities. Therefore, gure 4 shows that, the increasesignicantly slowed in these cities in the 1990’s, growing at a slightly higher ratethan the total population’s growth rate. In contrast, the current situation shows awider representation of intermediate cities, which substantiates the hypothesis ofdiversication (more population than urban centers). Finally, the smallest categoryof the urban hierarchy is also highly relevant, with an abundance of areas with 2,000and 20,000 inhabitants, often resembling the countryside rather than the rest of thecity system.
The main nding of the study of the urban system’s internal structure (see gure5) was the fast growth of intermediate cities, especially in the past 30 years. Indeed,the proportion of the urban system represented by “millionaire” cities has remained
stable at 40% since 1970, while the share of small locations (fewer than 20,000inhabitants) has fallen from 22% to around 19%, following two decades of decline(such places represented almost 30% of the urban population in 1950). This meansthat 40% of the urban population lives nowadays in intermediate cities (subdividedinto large-intermediate, medium-intermediate and small-intermediate).
In summary, although urbanization in the region is naturally concentrated incities, the form of concentration is diversifying. This is because intermediate citiesare growing faster than “millionaire” cities. That inconsistency may well be due to a
difference in natural growth or migratory growth, which is decisive for the purposeof analysis and policymaking. This point will be addressed in more detail further on,
8/12/2019 Urbanización y crecimiento AL. Pinto Rodriguez
http://slidepdf.com/reader/full/urbanizacion-y-crecimiento-al-pinto-rodriguez 18/42
URBAN GROWTH AND MOBILITY IN LATIN AMERICA40
to provide a denitive answer on the migratory attraction of countries with largestcities, and particularly megalopolises.
Figure 4. Latin America and the Caribbean (selected countries): percentage of total population, bysize of locality, 1950-2000
Source: Spatial Distribution of the Population and Urbanization in Latin America and the Caribbean (DEPUALC).Note: The list of countries included in each census round is found in table 3.
Figure 5. Latin America and the Caribbean (selected countries): percentage of urban populationby size of locality, 1950-2000
Source: Spatial Distribution of the Population and Urbanization in Latin America and the Caribbean.Note: The list of countries included in each census is found in table 3.
8/12/2019 Urbanización y crecimiento AL. Pinto Rodriguez
http://slidepdf.com/reader/full/urbanizacion-y-crecimiento-al-pinto-rodriguez 19/42
JOSÉ MARCOS P. DA CUNHA AND JORGE RODRÍGUEZ VIGNOLI 41
The preceding discussion is not aimed at denying the existence of a tendency –which is still restrained – towards the deconcentration of the population from the bigmetropolitan areas, and above all, from the big Latin American cities. It is true thatgrowth of metropolises has suffered a decline beyond the effects of demographictransition, what might suggest a drop in migration. Along these lines, economictransformations taking place in these countries and their subsequent effectshave strongly contributed to the reallocation of both productive activities and jobs. Although such changes have not seriously affected the dynamics and socio-economic leadership of the main metropolis and its hinterland 12 (i.e. big cities arestill receiving large migration ows from the rest of the country) they have indeedseriously reduced their ability to retain population, triggering a signicant increaseof emigration and a boost return migration 13.
However, what is reinforced in this text is the relative and limited character ofthis process. The information obtained from some of the countries suggests thatthis is not a process towards a signicant “demetropolitanization”, “internalization”,or “deconcentration” of population; instead, it is a process towards a regionalredistribution of the less-concentrated population. This assertion seems to becorrect in Mexico (Chavez and Guadarrama, 2007; Pimentel, 2000) and Brazil(Baeninger, 2000 and 1997) where trends and regional increases, beyond the majormetropolises, are observed; however, a signicant demographic concentration level
is maintained in intermediate and large cities, particularly in urban agglomerates oflarger size.
Migration and Major Cities
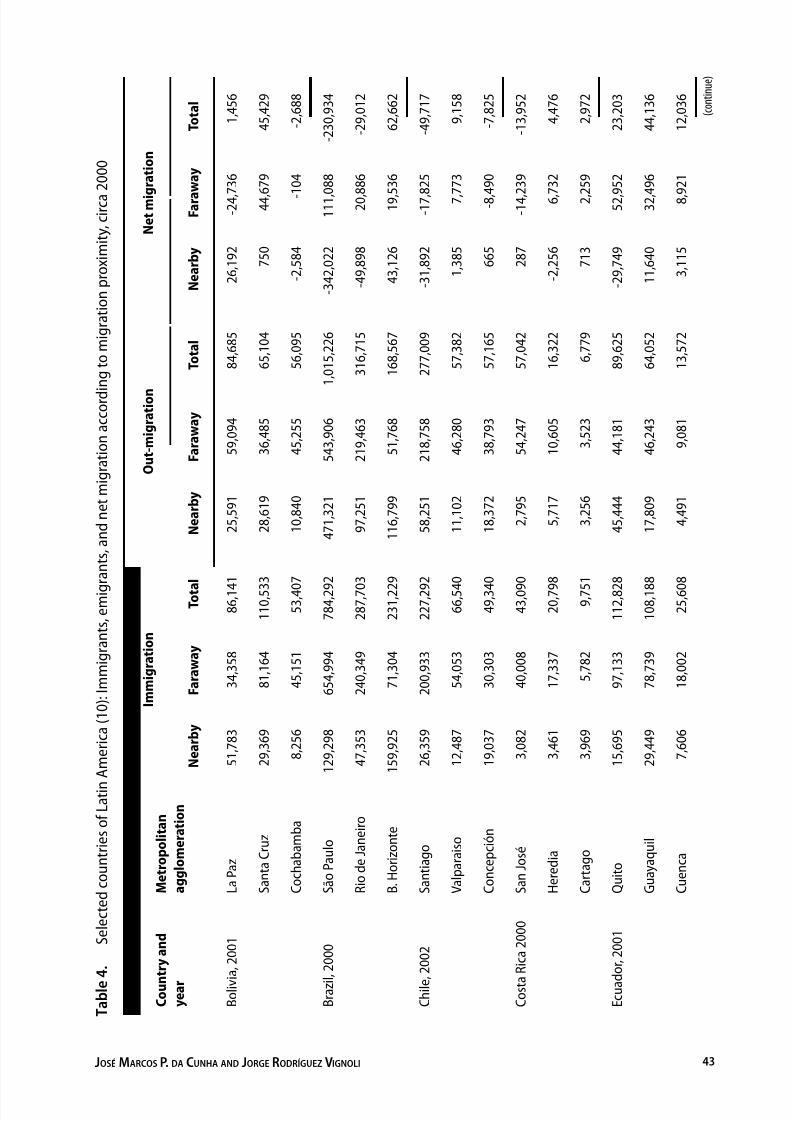
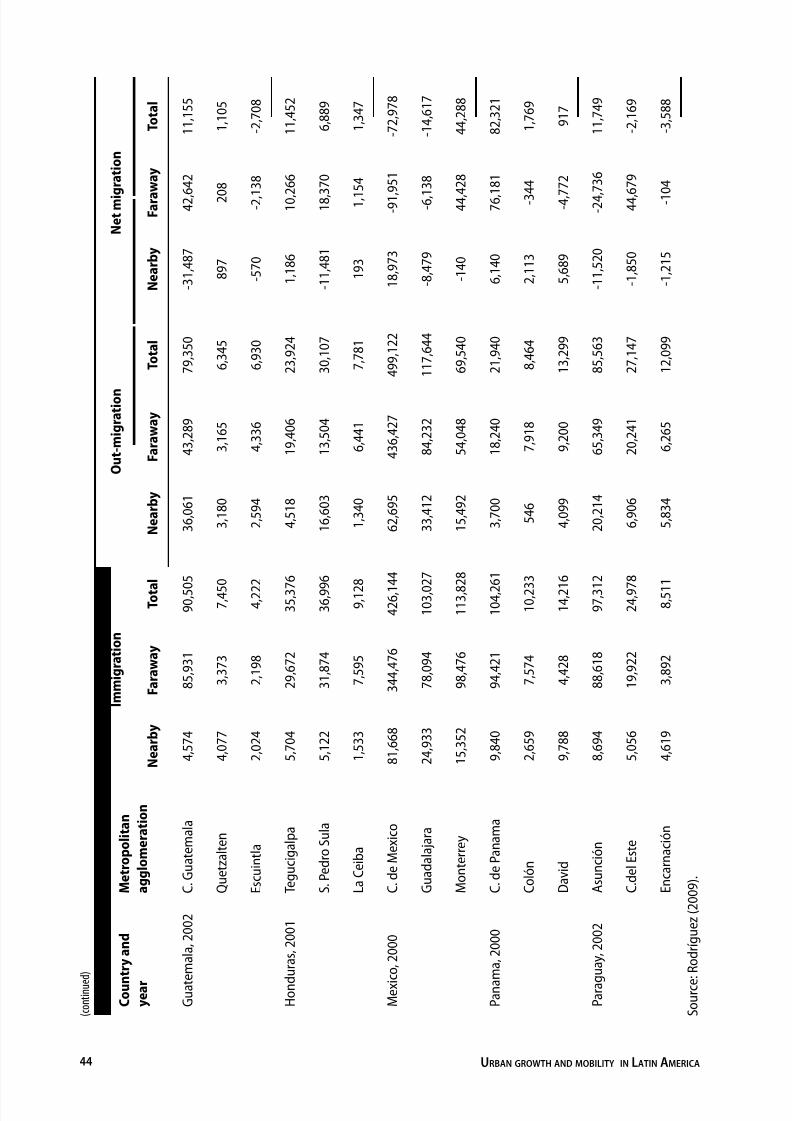
In this section we carry out a preliminary analysis of the three largest cities in 10selected countries of the region. For value-added analysis, substantial distinctionsare made to identify specic migratory patterns for each group between age-groups.
The results in table 4 demonstrate that the top of the urban system remainsattractive, as most cities continue to register net immigration. In countries such asBolivia, Ecuador, Honduras, Panama and Paraguay (almost all of them have an urbanpercentage below the regional average) the most populated city (or the two most
12 Lencioni (1996) discussing the industrial non concentration thesis in the São Paulo MR case, clearly asserts “themetropolis of São Paulo deconcentrates as denial of the mechanisms of concentration and affirms its centrality ... it isa process of centralization of capital that consolidates the hegemony of big business ... and uses spatial dispersionmechanisms—instead of concentration mechanism as a way of structuring space, no longer concentration”(p.207).
For Chile, de Mattos (2001) nds a trend towards reconcentration around the MR of Santiago.13 With regard to return migration, see: Lattes (1995) for the Buenos Aires case; Negrete (1999) for Mexico City andCunha and Baeninger (2000) for São Paulo.

8/12/2019 Urbanización y crecimiento AL. Pinto Rodriguez
http://slidepdf.com/reader/full/urbanizacion-y-crecimiento-al-pinto-rodriguez 20/42
URBAN GROWTH AND MOBILITY IN LATIN AMERICA42
populated) are still major hubs of attraction and therefore remain macrocephalousor bicephalous. 14 However, one in every three cities registers net emigration, whichsuggests that this situation (never heard of in the region before the late 1980’s)might be spreading among the main cities of the region.
Most of the region’s post-net emigration metropolises (cities with 5 million ormore inhabitants) date from the 1980’s (Rodríguez, 2004). This turnaround is due todiseconomies of scale and the shift of urban investment into other areas (UNFPA,2007; Montgomery, 2004). Other factors include difficulties of governance and theproliferation of urban problems such as: lack of public safety, traffic congestion andpollution. Overall, these cities continue to receive strong inows of immigrants eventhough, their ability to retain population has signicantly decreased.
The above is directly related to the hypothesis of “concentrated deconcentration”(whereby people migrate to nearby zones, cities or regional sprawls as part of aprocess of suburbanization (Diniz, 2007)); thus these ows were subdivided into thefollowing two categories: nearby-migration or faraway-migration (table 4). The mainconclusion reached is that “concentrated deconcentration” seems to be operatingonly in the metropolises of Brazil, as net emigration from Greater São Paulo andGreater Rio de Janeiro was indeed exclusively due to exchanges of people withother municipalities within the same state, while both agglomerations continued togain population from migratory exchanges with other states. In all other countries,
large cities posted net emigration in terms of nearby or faraway-migration or just thelatter, which suggests an effective but unclear deconcentration. In several cities thatremain hubs of attraction, the pattern of migratory exchange ts with the hypothesisof concentrated deconcentration, and matches the processes of suburbanization. This is the case of Guatemala City, Quito, San Pedro Sula and Heredia.
The current situation of a few capitals is remarkable, such as La Paz and MexicoCity, where despite of their net out-migration with other regions in the country, theyremain attractive to nearby migrants.
Two key conclusions arise from table 4. The rst is that there is signicantvariability both among and within countries with regard to the levels and indicatorsof net migration in big cities and the composition of the latter according to nearbyand faraway balances. The second is that total net migration (derived from migratoryexchange between the city and the rest of the country) does not necessarily indicatethe real attraction of cities, since for some of them, there seems to be “concentrateddeconcentration” processes taking place, which we shall refer to further on.
14 In the last two cases, the primacy ratio may be falling (see gure 3), while the concentration of the urban system inthe two main cities may be rising.
8/12/2019 Urbanización y crecimiento AL. Pinto Rodriguez
http://slidepdf.com/reader/full/urbanizacion-y-crecimiento-al-pinto-rodriguez 21/42
JOSÉ MARCOS P. DA CUNHA AND JORGE RODRÍGUEZ VIGNOLI 43
T a
b l e
4 .
S e l e c t e d c o u n
t r i e s o
f L a t i n
A m e r i c a
( 1 0 ) : I m m
i g r a n
t s , e m i g r a n
t s , a n
d n e t m
i g r a t i o n a c c o r d
i n g
t o m
i g r a t i o n p r o x i m
i t y , c i r c a
2 0 0 0
C o u n
t r y a n
d
y e a r
M e
t r o p o
l i t a n
a g g
l o m e r a
t i o n
I m m
i g r a
t i o n
O u
t - m i g r a
t i o n
N e
t m i g r a
t i o n
N e a r b y
F a r a w a y
T o t a
l
N e a r b y
F a r a w a y
T o t a l
N e a r b y
F a r a w a y
T o t a l
B o l i v
i a , 2 0 0 1
L a P a z
5 1 , 7 8 3
3 4 , 3 5 8
8 6 , 1 4 1
2 5 , 5 9 1
5 9 , 0 9 4
8 4 , 6 8 5
2 6 , 1 9 2
- 2 4 , 7 3 6
1 , 4 5 6
S a n t a C r u z
2 9 , 3 6 9
8 1 , 1 6 4
1 1 0 , 5 3 3
2 8 , 6 1 9
3 6 , 4 8 5
6 5 , 1 0 4
7 5 0
4 4 , 6 7 9
4 5 , 4 2 9
C o c h a b a m
b a
8 , 2 5 6
4 5 , 1 5 1
5 3 , 4 0 7
1 0 , 8 4 0
4 5 , 2 5 5
5 6 , 0 9 5
- 2 , 5 8 4
- 1 0 4
- 2 , 6 8 8
B r a z i
l , 2 0 0 0
S ã o P a u l o
1 2 9 , 2 9 8
6 5 4 , 9 9 4
7 8 4 , 2 9 2
4 7 1 , 3 2 1
5 4 3 , 9 0 6
1 , 0 1 5 , 2 2 6
- 3 4 2 , 0 2 2
1 1 1 , 0 8 8
- 2 3 0 , 9 3 4
R i o d e
J a n e i r o
4 7 , 3 5 3
2 4 0 , 3 4 9
2 8 7 , 7 0 3
9 7 , 2 5 1
2 1 9 , 4 6 3
3 1 6 , 7 1 5
- 4 9 , 8 9 8
2 0 , 8 8 6
- 2 9 , 0 1 2
B . H
o r i z o n
t e
1 5 9 , 9 2 5
7 1 , 3 0 4
2 3 1 , 2 2 9
1 1 6 , 7 9 9
5 1 , 7 6 8
1 6 8 , 5 6 7
4 3 , 1 2 6
1 9 , 5 3 6
6 2 , 6 6 2
C h i l e
, 2 0 0 2
S a n t i a g o
2 6 , 3 5 9
2 0 0 , 9 3 3
2 2 7 , 2 9 2
5 8 , 2 5 1
2 1 8 , 7 5 8
2 7 7 , 0 0 9
- 3 1 , 8 9 2
- 1 7 , 8 2 5
- 4 9 , 7 1 7
V a l p a r a i s o
1 2 , 4 8 7
5 4 , 0 5 3
6 6 , 5 4 0
1 1 , 1 0 2
4 6 , 2 8 0
5 7 , 3 8 2
1 , 3 8 5
7 , 7 7 3
9 , 1 5 8
C o n c e p c i ó n
1 9 , 0 3 7
3 0 , 3 0 3
4 9 , 3 4 0
1 8 , 3 7 2
3 8 , 7 9 3
5 7 , 1 6 5
6 6 5
- 8 , 4 9 0
- 7 , 8 2 5
C o s t a
R i c a 2 0 0 0
S a n J o s é
3 , 0 8 2
4 0 , 0 0 8
4 3 , 0 9 0
2 , 7 9 5
5 4 , 2 4 7
5 7 , 0 4 2
2 8 7
- 1 4 , 2 3 9
- 1 3 , 9 5 2
H e r e d
i a
3 , 4 6 1
1 7 , 3 3 7
2 0 , 7 9 8
5 , 7 1 7
1 0 , 6 0 5
1 6 , 3 2 2
- 2 , 2 5 6
6 , 7 3 2
4 , 4 7 6
C a r t a g o
3 , 9 6 9
5 , 7 8 2
9 , 7 5 1
3 , 2 5 6
3 , 5 2 3
6 , 7 7 9
7 1 3
2 , 2 5 9
2 , 9 7 2
E c u a d o r ,
2 0 0 1
Q u
i t o
1 5 , 6 9 5
9 7 , 1 3 3
1 1 2 , 8 2 8
4 5 , 4 4 4
4 4 , 1 8 1
8 9 , 6 2 5
- 2 9 , 7 4 9
5 2 , 9 5 2
2 3 , 2 0 3
G u a y a q u
i l
2 9 , 4 4 9
7 8 , 7 3 9
1 0 8 , 1 8 8
1 7 , 8 0 9
4 6 , 2 4 3
6 4 , 0 5 2
1 1 , 6 4 0
3 2 , 4 9 6
4 4 , 1 3 6
C u e n c a
7 , 6 0 6
1 8 , 0 0 2
2 5 , 6 0 8
4 , 4 9 1
9 , 0 8 1
1 3 , 5 7 2
3 , 1 1 5
8 , 9 2 1
1 2 , 0 3 6
( c o n t i n u e
)
8/12/2019 Urbanización y crecimiento AL. Pinto Rodriguez
http://slidepdf.com/reader/full/urbanizacion-y-crecimiento-al-pinto-rodriguez 22/42
URBAN GROWTH AND MOBILITY IN LATIN AMERICA44
C o u n
t r y a n
d
y e a r
M e
t r o p o
l i t a n
a g g
l o m e r a
t i o n
I m m
i g r a
t i o n
O u
t - m i g r a
t i o n
N e
t m i g r a
t i o n
N e a r b y
F a r a w a y
T o t a
l
N e a r b y
F a r a w a y
T o t a l
N e a r b y
F a r a w a y
T o t a l
G u a t e m a l a ,
2 0 0 2
C . G
u a t e m a l a
4 , 5 7 4
8 5 , 9 3 1
9 0 , 5 0 5
3 6 , 0 6 1
4 3 , 2 8 9
7 9 , 3 5 0
- 3 1 , 4 8 7
4 2 , 6 4 2
1 1 , 1 5 5
Q u e t z a l t e n
4 , 0 7 7
3 , 3 7 3
7 , 4 5 0
3 , 1 8 0
3 , 1 6 5
6 , 3 4 5
8 9 7
2 0
8
1 , 1 0 5
E s c u i n t l a
2 , 0 2 4
2 , 1 9 8
4 , 2 2 2
2 , 5 9 4
4 , 3 3 6
6 , 9 3 0
- 5 7 0
- 2 , 1 3 8
- 2 , 7 0 8
H o n d u r a s ,
2 0 0 1
T e g u c i g a l p a
5 , 7 0 4
2 9 , 6 7 2
3 5 , 3 7 6
4 , 5 1 8
1 9 , 4 0 6
2 3 , 9 2 4
1 , 1 8 6
1 0 , 2 6 6
1 1 , 4 5 2
S . P e d r o
S u l a
5 , 1 2 2
3 1 , 8 7 4
3 6 , 9 9 6
1 6 , 6 0 3
1 3 , 5 0 4
3 0 , 1 0 7
- 1 1 , 4 8 1
1 8 , 3 7 0
6 , 8 8 9
L a C e i b a
1 , 5 3 3
7 , 5 9 5
9 , 1 2 8
1 , 3 4 0
6 , 4 4 1
7 , 7 8 1
1 9 3
1 , 1 5 4
1 , 3 4 7
M e x i c o ,
2 0 0 0
C . d
e M e x i c o
8 1 , 6 6 8
3 4 4 , 4 7 6
4 2 6 , 1 4 4
6 2 , 6 9 5
4 3 6 , 4 2 7
4 9 9 , 1 2 2
1 8 , 9 7 3
- 9 1 , 9 5 1
- 7 2 , 9 7 8
G u a d a l a j a r a
2 4 , 9 3 3
7 8 , 0 9 4
1 0 3 , 0 2 7
3 3 , 4 1 2
8 4 , 2 3 2
1 1 7 , 6 4 4
- 8 , 4 7 9
- 6 , 1 3 8
- 1 4 , 6 1 7
M o n
t e r r e y
1 5 , 3 5 2
9 8 , 4 7 6
1 1 3 , 8 2 8
1 5 , 4 9 2
5 4 , 0 4 8
6 9 , 5 4 0
- 1 4 0
4 4 , 4 2 8
4 4 , 2 8 8
P a n a m a ,
2 0 0 0
C . d
e P a n a m a
9 , 8 4 0
9 4 , 4 2 1
1 0 4 , 2 6 1
3 , 7 0 0
1 8 , 2 4 0
2 1 , 9 4 0
6 , 1 4 0
7 6 , 1 8 1
8 2 , 3 2 1
C o
l ó n
2 , 6 5 9
7 , 5 7 4
1 0 , 2 3 3
5 4 6
7 , 9 1 8
8 , 4 6 4
2 , 1 1 3
- 3 4 4
1 , 7 6 9
D a v i d
9 , 7 8 8
4 , 4 2 8
1 4 , 2 1 6
4 , 0 9 9
9 , 2 0 0
1 3 , 2 9 9
5 , 6 8 9
- 4 , 7 7 2
9 1 7
P a r a g u a y ,
2 0 0 2
A s u n c i ó n
8 , 6 9 4
8 8 , 6 1 8
9 7 , 3 1 2
2 0 , 2 1 4
6 5 , 3 4 9
8 5 , 5 6 3
- 1 1 , 5 2 0
- 2 4 , 7 3 6
1 1 , 7 4 9
C . d
e l E s t e
5 , 0 5 6
1 9 , 9 2 2
2 4 , 9 7 8
6 , 9 0 6
2 0 , 2 4 1
2 7 , 1 4 7
- 1 , 8 5 0
4 4 , 6 7 9
- 2 , 1 6 9
E n c a r n a c i ó n
4 , 6 1 9
3 , 8 9 2
8 , 5 1 1
5 , 8 3 4
6 , 2 6 5
1 2 , 0 9 9
- 1 , 2 1 5
- 1 0 4
- 3 , 5 8 8
S o u r c e : R o
d r í g u e z
( 2 0 0 9 ) .
( c o n t i n u e
d )
8/12/2019 Urbanización y crecimiento AL. Pinto Rodriguez
http://slidepdf.com/reader/full/urbanizacion-y-crecimiento-al-pinto-rodriguez 23/42
JOSÉ MARCOS P. DA CUNHA AND JORGE RODRÍGUEZ VIGNOLI 45
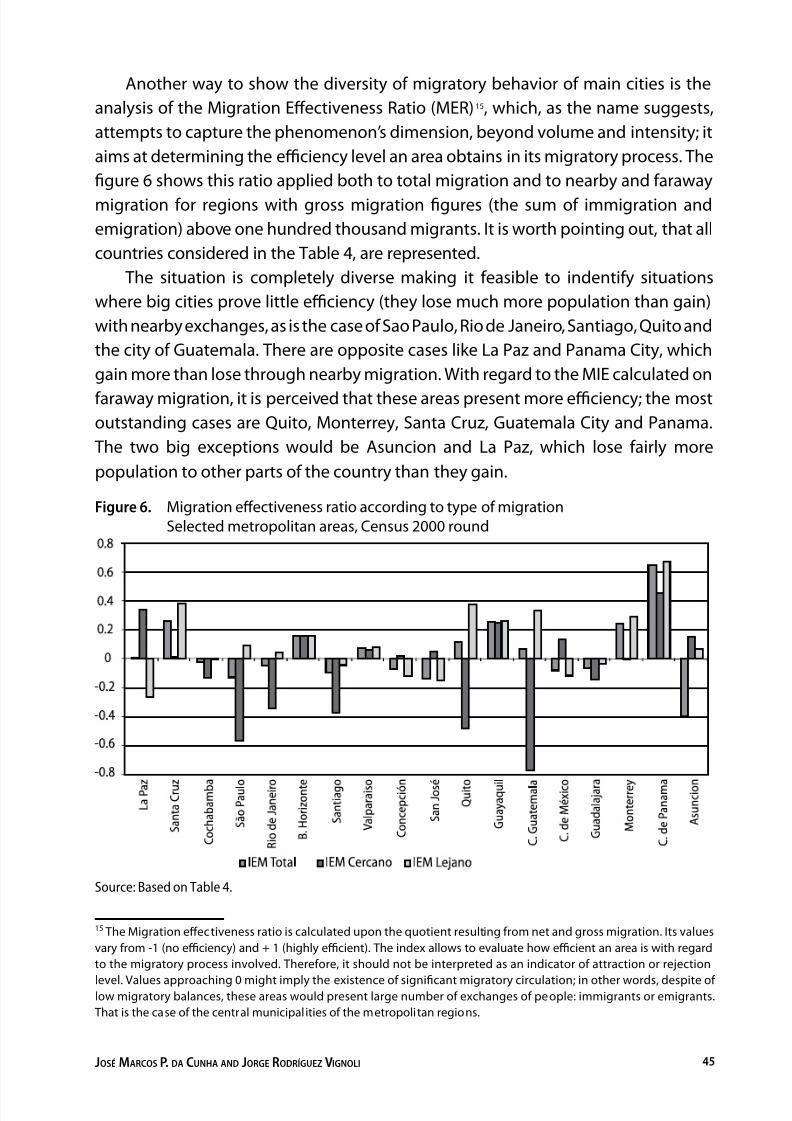
Another way to show the diversity of migratory behavior of main cities is theanalysis of the Migration Effectiveness Ratio (MER) 15, which, as the name suggests,attempts to capture the phenomenon’s dimension, beyond volume and intensity; itaims at determining the efficiency level an area obtains in its migratory process. Thegure 6 shows this ratio applied both to total migration and to nearby and farawaymigration for regions with gross migration gures (the sum of immigration andemigration) above one hundred thousand migrants. It is worth pointing out, that allcountries considered in the Table 4, are represented.
The situation is completely diverse making it feasible to indentify situationswhere big cities prove little efficiency (they lose much more population than gain)with nearby exchanges, as is the case of Sao Paulo, Rio de Janeiro, Santiago, Quito andthe city of Guatemala. There are opposite cases like La Paz and Panama City, whichgain more than lose through nearby migration. With regard to the MIE calculated onfaraway migration, it is perceived that these areas present more efficiency; the mostoutstanding cases are Quito, Monterrey, Santa Cruz, Guatemala City and Panama. The two big exceptions would be Asuncion and La Paz, which lose fairly morepopulation to other parts of the country than they gain.
Figure 6. Migration effectiveness ratio according to type of migrationSelected metropolitan areas, Census 2000 round
Source: Based on Table 4.
15 The Migration effectiveness ratio is calculated upon the quotient resulting from net and gross migration. Its valuesvary from -1 (no efficiency) and + 1 (highly efficient). The index allows to evaluate how efficient an area is with regardto the migratory process involved. Therefore, it should not be interpreted as an indicator of attraction or rejection
level. Values approaching 0 might imply the existence of signicant migratory circulation; in other words, despite oflow migratory balances, these areas would present large number of exchanges of people: immigrants or emigrants. That is the case of the central municipalities of the metropolitan regions.
8/12/2019 Urbanización y crecimiento AL. Pinto Rodriguez
http://slidepdf.com/reader/full/urbanizacion-y-crecimiento-al-pinto-rodriguez 24/42
URBAN GROWTH AND MOBILITY IN LATIN AMERICA46
Nevertheless, it is interesting to observe that the majority of the MRs presentMIEs very close to zero, bringing into light one of the most appealing features ofour metropolitan regions: even the MIEs showing either net losses of populationor little inow are high-circulation areas of population. This proves, in our opinion,the need to revitalize the discussion about concentration/ deconcentration, or morespecically metropolitanization or demetropolitanization.
Notwithstanding, we cannot assure that there is a unique trend in Latin Americarelated to the concentration or deconcentration of population, especially withregard to the role of the metropolitan regions.
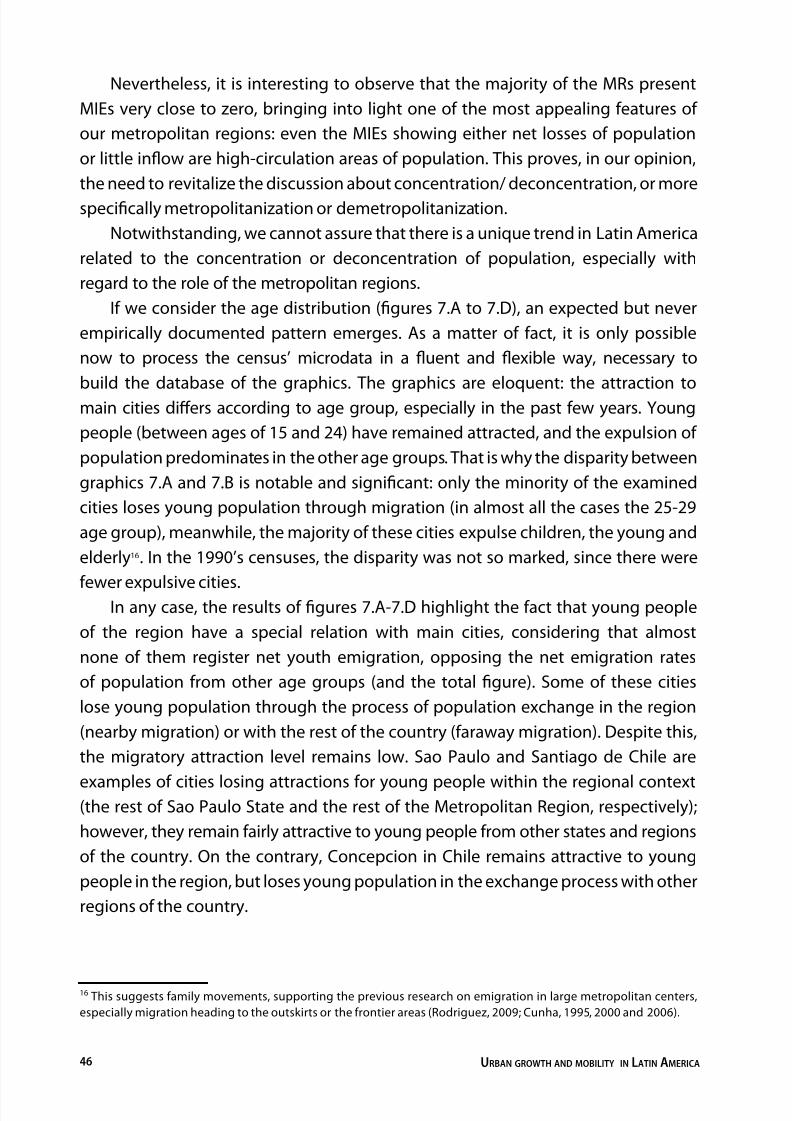
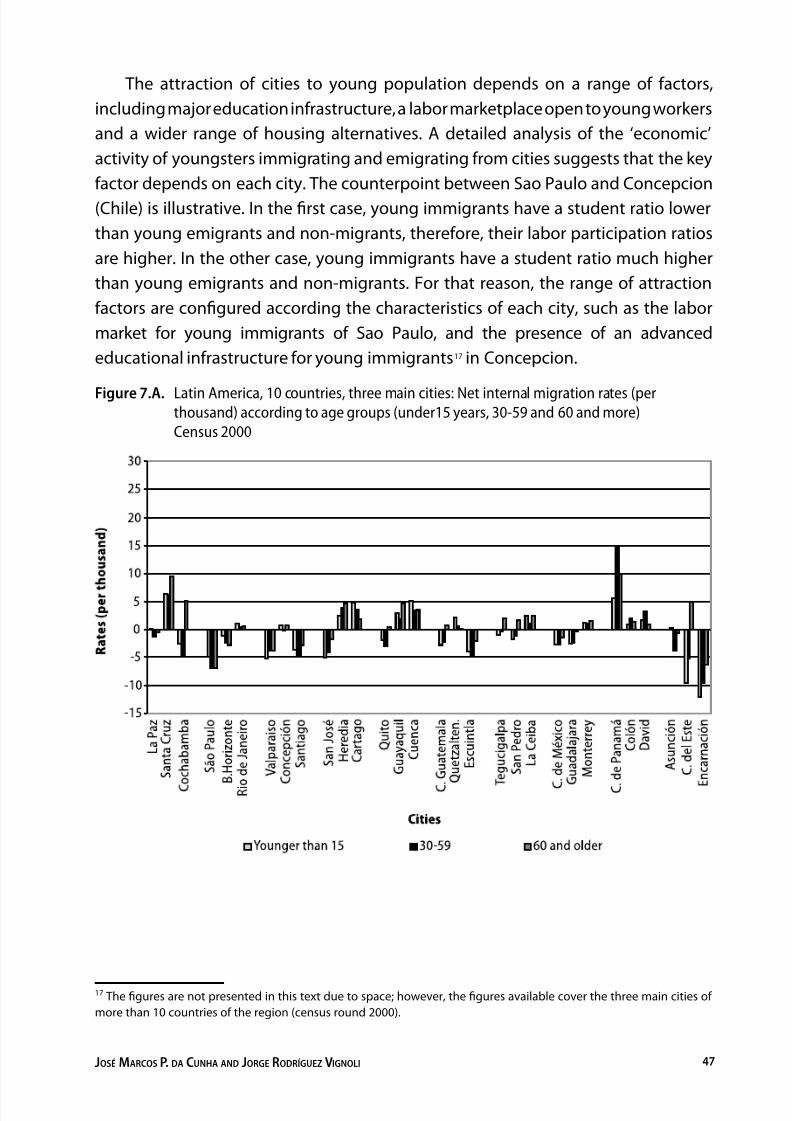
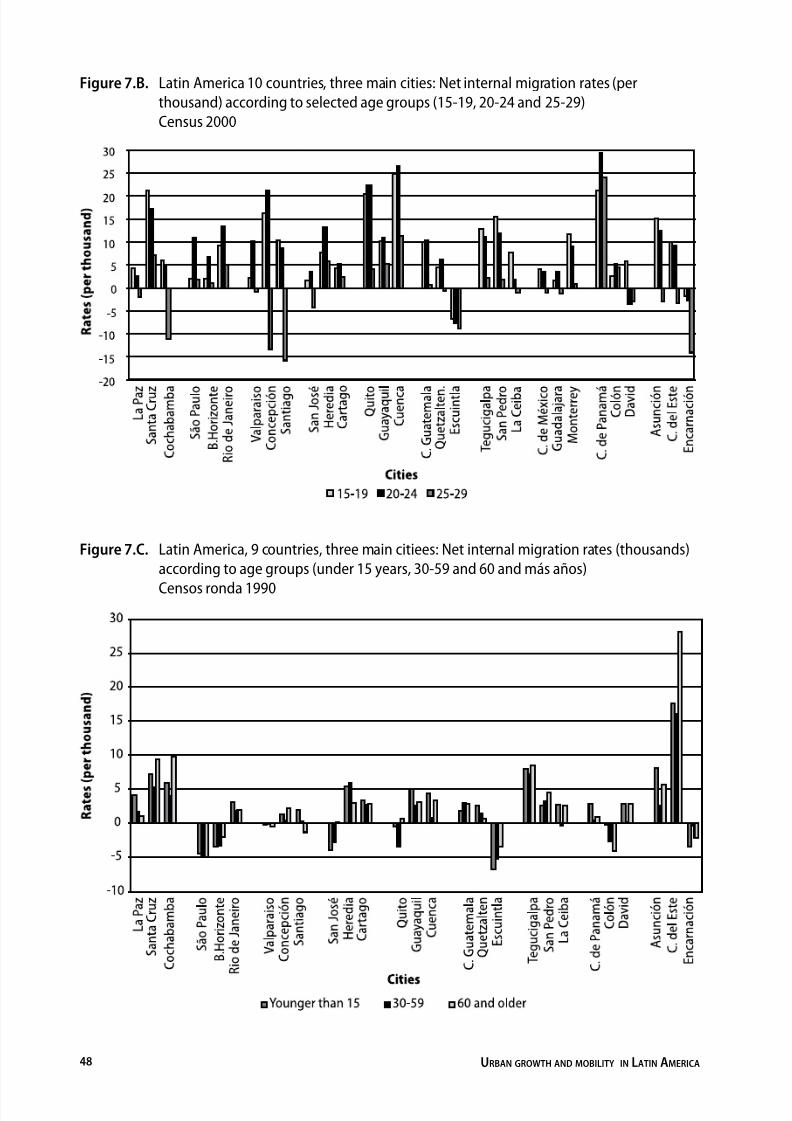
If we consider the age distribution (gures 7.A to 7.D), an expected but neverempirically documented pattern emerges. As a matter of fact, it is only possiblenow to process the census’ microdata in a uent and exible way, necessary tobuild the database of the graphics. The graphics are eloquent: the attraction tomain cities differs according to age group, especially in the past few years. Youngpeople (between ages of 15 and 24) have remained attracted, and the expulsion ofpopulation predominates in the other age groups. That is why the disparity betweengraphics 7.A and 7.B is notable and signicant: only the minority of the examinedcities loses young population through migration (in almost all the cases the 25-29age group), meanwhile, the majority of these cities expulse children, the young andelderly 16. In the 1990’s censuses, the disparity was not so marked, since there were
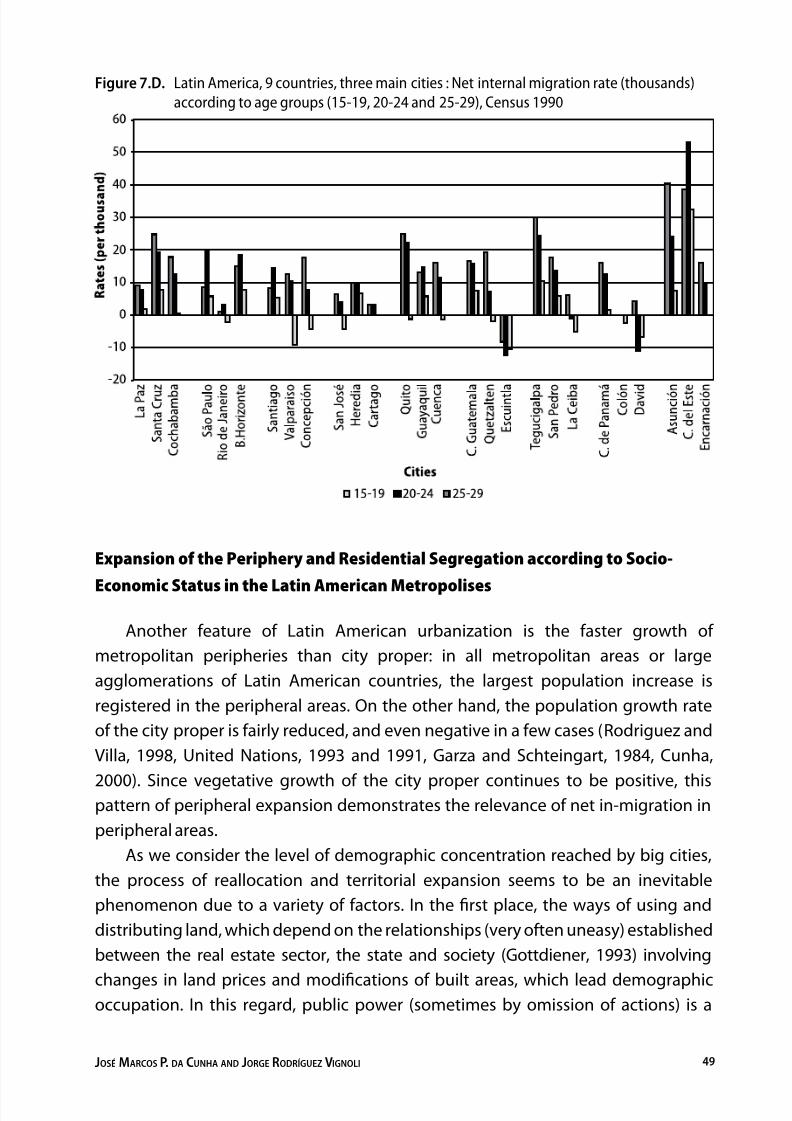
fewer expulsive cities.In any case, the results of gures 7.A-7.D highlight the fact that young peopleof the region have a special relation with main cities, considering that almostnone of them register net youth emigration, opposing the net emigration ratesof population from other age groups (and the total gure). Some of these citieslose young population through the process of population exchange in the region(nearby migration) or with the rest of the country (faraway migration). Despite this,the migratory attraction level remains low. Sao Paulo and Santiago de Chile are
examples of cities losing attractions for young people within the regional context(the rest of Sao Paulo State and the rest of the Metropolitan Region, respectively);however, they remain fairly attractive to young people from other states and regionsof the country. On the contrary, Concepcion in Chile remains attractive to youngpeople in the region, but loses young population in the exchange process with otherregions of the country.
16 This suggests family movements, supporting the previous research on emigration in large metropolitan centers,especially migration heading to the outskirts or the frontier areas (Rodriguez, 2009; Cunha, 1995, 2000 and 2006).
8/12/2019 Urbanización y crecimiento AL. Pinto Rodriguez
http://slidepdf.com/reader/full/urbanizacion-y-crecimiento-al-pinto-rodriguez 25/42
JOSÉ MARCOS P. DA CUNHA AND JORGE RODRÍGUEZ VIGNOLI 47
The attraction of cities to young population depends on a range of factors,including major education infrastructure, a labor marketplace open to young workersand a wider range of housing alternatives. A detailed analysis of the ‘economic’activity of youngsters immigrating and emigrating from cities suggests that the keyfactor depends on each city. The counterpoint between Sao Paulo and Concepcion(Chile) is illustrative. In the rst case, young immigrants have a student ratio lowerthan young emigrants and non-migrants, therefore, their labor participation ratiosare higher. In the other case, young immigrants have a student ratio much higherthan young emigrants and non-migrants. For that reason, the range of attractionfactors are congured according the characteristics of each city, such as the labormarket for young immigrants of Sao Paulo, and the presence of an advancededucational infrastructure for young immigrants 17 in Concepcion.
Figure 7.A. Latin America, 10 countries, three main cities: Net internal migration rates (perthousand) according to age groups (under15 years, 30-59 and 60 and more)Census 2000
17 The gures are not presented in this text due to space; however, the gures available cover the three main cities ofmore than 10 countries of the region (census round 2000).
8/12/2019 Urbanización y crecimiento AL. Pinto Rodriguez
http://slidepdf.com/reader/full/urbanizacion-y-crecimiento-al-pinto-rodriguez 26/42
URBAN GROWTH AND MOBILITY IN LATIN AMERICA48
Figure 7.B. Latin America 10 countries, three main cities: Net internal migration rates (perthousand) according to selected age groups (15-19, 20-24 and 25-29)Census 2000
Figure 7.C. Latin America, 9 countries, three main citiees: Net internal migration rates (thousands)according to age groups (under 15 years, 30-59 and 60 and más años)
Censos ronda 1990
8/12/2019 Urbanización y crecimiento AL. Pinto Rodriguez
http://slidepdf.com/reader/full/urbanizacion-y-crecimiento-al-pinto-rodriguez 27/42
JOSÉ MARCOS P. DA CUNHA AND JORGE RODRÍGUEZ VIGNOLI 49
Figure 7.D. Latin America, 9 countries, three main cities : Net internal migration rate (thousands)according to age groups (15-19, 20-24 and 25-29), Census 1990
Expansion of the Periphery and Residential Segregation according to Socio-
Economic Status in the Latin American Metropolises
Another feature of Latin American urbanization is the faster growth ofmetropolitan peripheries than city proper: in all metropolitan areas or largeagglomerations of Latin American countries, the largest population increase isregistered in the peripheral areas. On the other hand, the population growth rateof the city proper is fairly reduced, and even negative in a few cases (Rodriguez andVilla, 1998, United Nations, 1993 and 1991, Garza and Schteingart, 1984, Cunha,
2000). Since vegetative growth of the city proper continues to be positive, thispattern of peripheral expansion demonstrates the relevance of net in-migration inperipheral areas.
As we consider the level of demographic concentration reached by big cities,the process of reallocation and territorial expansion seems to be an inevitablephenomenon due to a variety of factors. In the rst place, the ways of using anddistributing land, which depend on the relationships (very often uneasy) establishedbetween the real estate sector, the state and society (Gottdiener, 1993) involving
changes in land prices and modications of built areas, which lead demographicoccupation. In this regard, public power (sometimes by omission of actions) is a
8/12/2019 Urbanización y crecimiento AL. Pinto Rodriguez
http://slidepdf.com/reader/full/urbanizacion-y-crecimiento-al-pinto-rodriguez 28/42
URBAN GROWTH AND MOBILITY IN LATIN AMERICA50
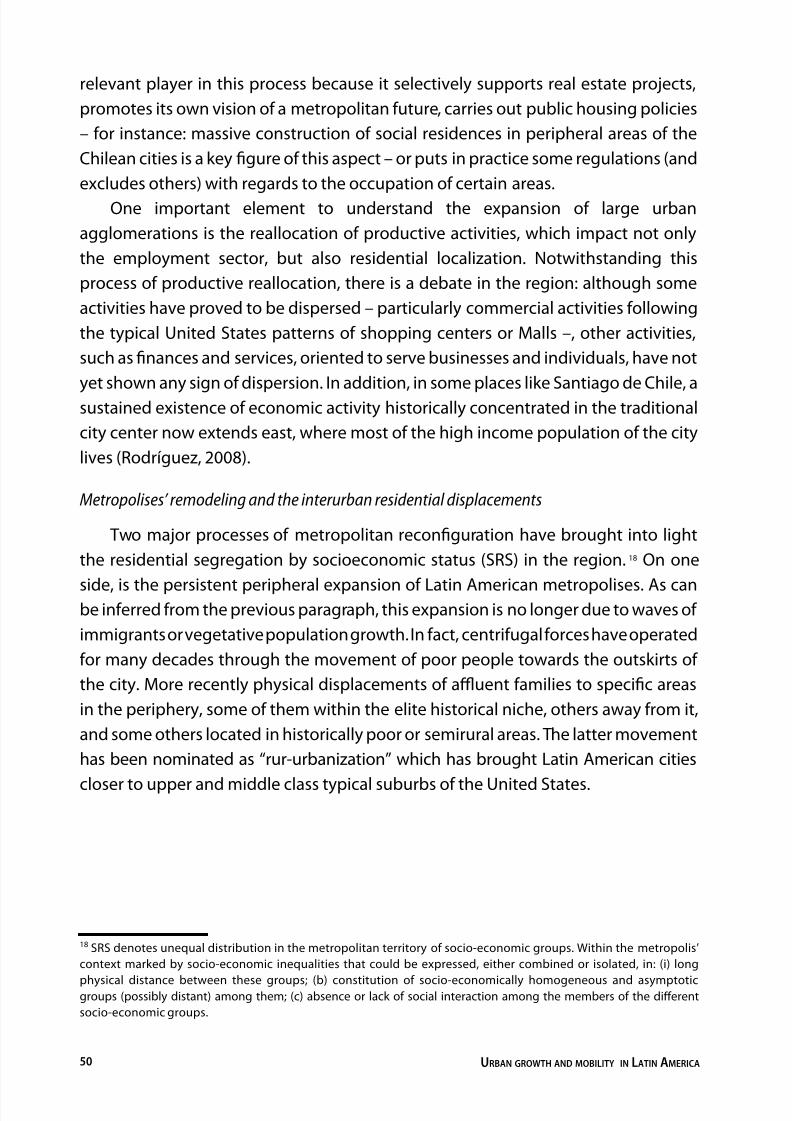
relevant player in this process because it selectively supports real estate projects,promotes its own vision of a metropolitan future, carries out public housing policies– for instance: massive construction of social residences in peripheral areas of theChilean cities is a key gure of this aspect – or puts in practice some regulations (andexcludes others) with regards to the occupation of certain areas.
One important element to understand the expansion of large urbanagglomerations is the reallocation of productive activities, which impact not onlythe employment sector, but also residential localization. Notwithstanding thisprocess of productive reallocation, there is a debate in the region: although someactivities have proved to be dispersed – particularly commercial activities followingthe typical United States patterns of shopping centers or Malls –, other activities,such as nances and services, oriented to serve businesses and individuals, have notyet shown any sign of dispersion. In addition, in some places like Santiago de Chile, asustained existence of economic activity historically concentrated in the traditionalcity center now extends east, where most of the high income population of the citylives (Rodríguez, 2008).
Metropolises’ remodeling and the interurban residential displacements
Two major processes of metropolitan reconguration have brought into lightthe residential segregation by socioeconomic status (SRS) in the region. 18 On one
side, is the persistent peripheral expansion of Latin American metropolises. As canbe inferred from the previous paragraph, this expansion is no longer due to waves ofimmigrants or vegetative population growth. In fact, centrifugal forces have operatedfor many decades through the movement of poor people towards the outskirts ofthe city. More recently physical displacements of affluent families to specic areasin the periphery, some of them within the elite historical niche, others away from it,and some others located in historically poor or semirural areas. The latter movementhas been nominated as “rur-urbanization” which has brought Latin American cities
closer to upper and middle class typical suburbs of the United States.
18 SRS denotes unequal distribution in the metropolitan territory of socio-economic groups. Within the metropolis’context marked by socio-economic inequalities that could be expressed, either combined or isolated, in: (i) long
physical distance between these groups; (b) constitution of socio-economically homogeneous and asymptoticgroups (possibly distant) among them; (c) absence or lack of social interaction among the members of the differentsocio-economic groups.
8/12/2019 Urbanización y crecimiento AL. Pinto Rodriguez
http://slidepdf.com/reader/full/urbanizacion-y-crecimiento-al-pinto-rodriguez 29/42
JOSÉ MARCOS P. DA CUNHA AND JORGE RODRÍGUEZ VIGNOLI 51
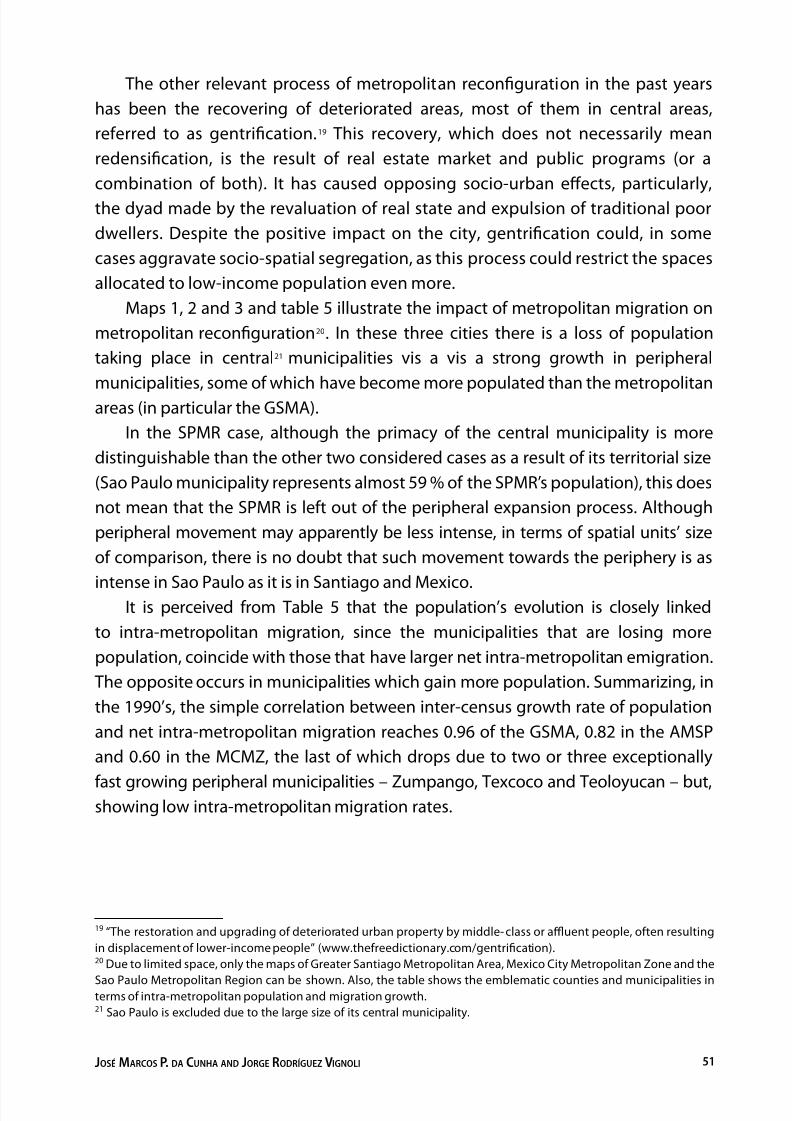
The other relevant process of metropolitan reconguration in the past yearshas been the recovering of deteriorated areas, most of them in central areas,referred to as gentrication. 19 This recovery, which does not necessarily meanredensication, is the result of real estate market and public programs (or acombination of both). It has caused opposing socio-urban effects, particularly,the dyad made by the revaluation of real state and expulsion of traditional poordwellers. Despite the positive impact on the city, gentrication could, in somecases aggravate socio-spatial segregation, as this process could restrict the spacesallocated to low-income population even more.
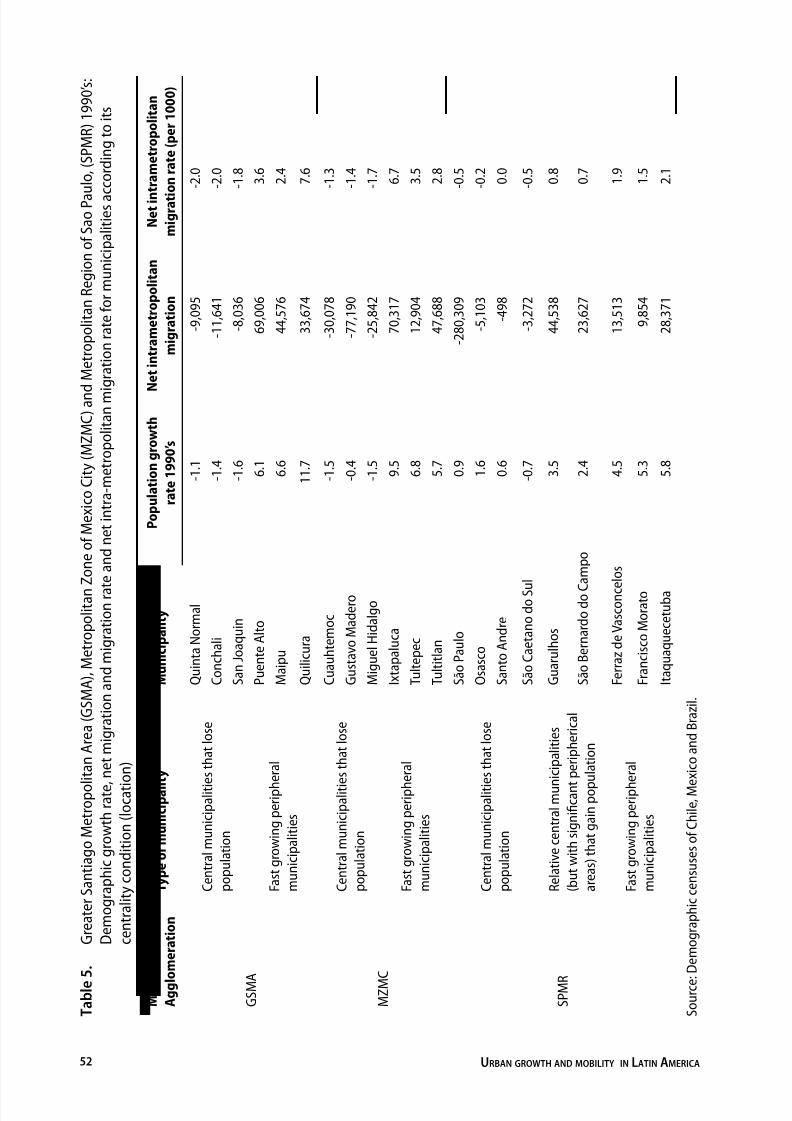
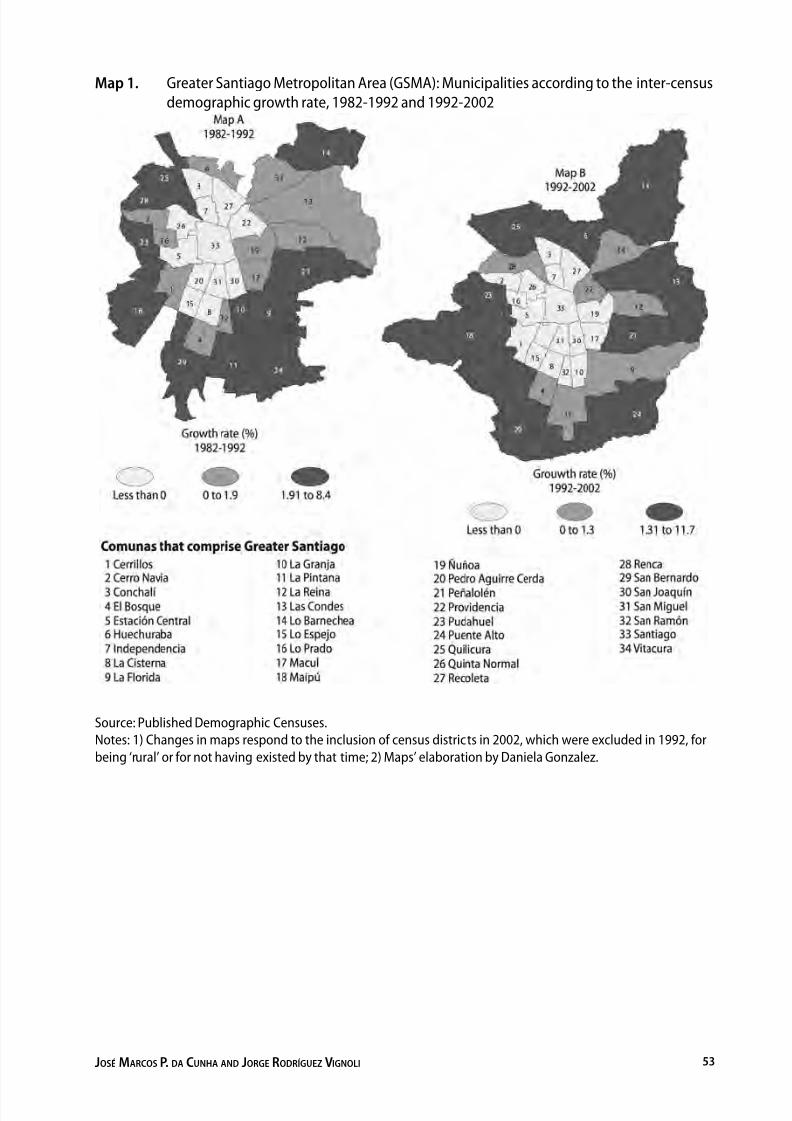
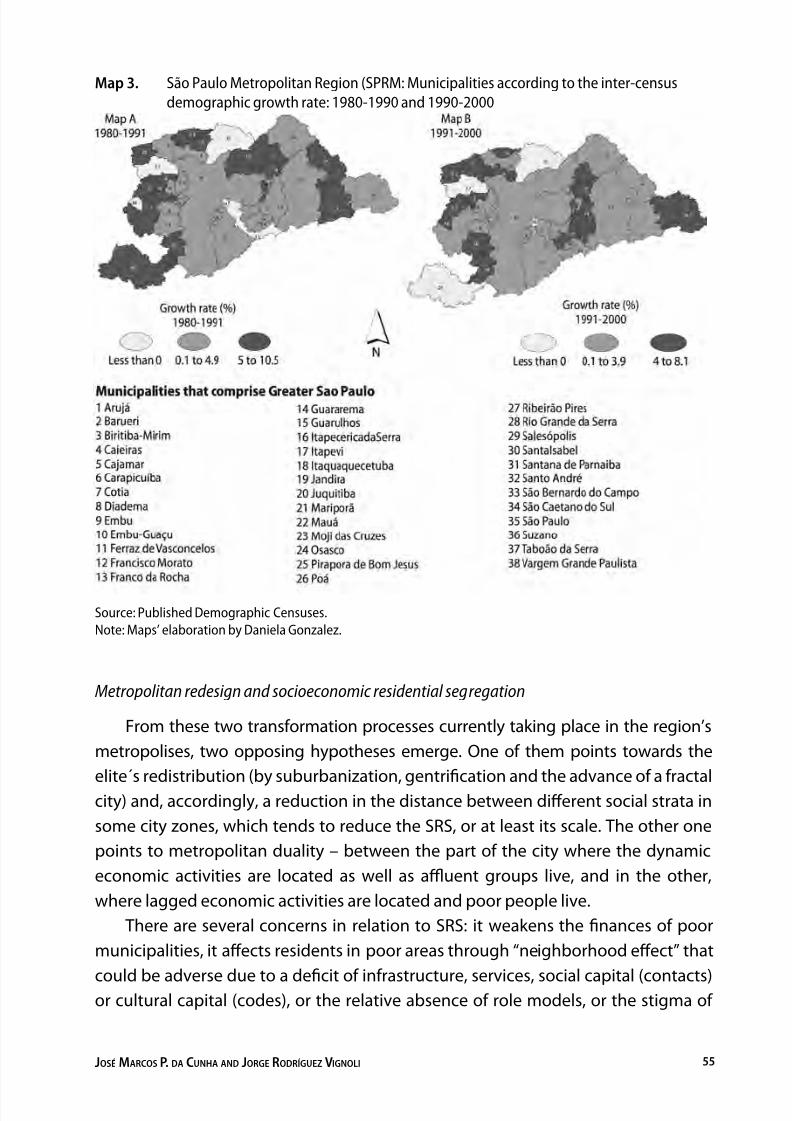
Maps 1, 2 and 3 and table 5 illustrate the impact of metropolitan migration onmetropolitan reconguration 20 . In these three cities there is a loss of populationtaking place in central 21 municipalities vis a vis a strong growth in peripheralmunicipalities, some of which have become more populated than the metropolitanareas (in particular the GSMA).
In the SPMR case, although the primacy of the central municipality is moredistinguishable than the other two considered cases as a result of its territorial size(Sao Paulo municipality represents almost 59 % of the SPMR’s population), this doesnot mean that the SPMR is left out of the peripheral expansion process. Althoughperipheral movement may apparently be less intense, in terms of spatial units’ sizeof comparison, there is no doubt that such movement towards the periphery is as
intense in Sao Paulo as it is in Santiago and Mexico.It is perceived from Table 5 that the population’s evolution is closely linkedto intra-metropolitan migration, since the municipalities that are losing morepopulation, coincide with those that have larger net intra-metropolitan emigration. The opposite occurs in municipalities which gain more population. Summarizing, inthe 1990’s, the simple correlation between inter-census growth rate of populationand net intra-metropolitan migration reaches 0.96 of the GSMA, 0.82 in the AMSPand 0.60 in the MCMZ, the last of which drops due to two or three exceptionally
fast growing peripheral municipalities – Zumpango, Texcoco and Teoloyucan – but,showing low intra-metropolitan migration rates.
19 “The restoration and upgrading of deteriorated urban property by middle-class or affluent people, often resultingin displacement of lower-income people” (www.thefreedictionary.com/gentrication).20 Due to limited space, only the maps of Greater Santiago Metropolitan Area, Mexico City Metropolitan Zone and the
Sao Paulo Metropolitan Region can be shown. Also, the table shows the emblematic counties and municipalities interms of intra-metropolitan population and migration growth.21 Sao Paulo is excluded due to the large size of its central municipality.
8/12/2019 Urbanización y crecimiento AL. Pinto Rodriguez
http://slidepdf.com/reader/full/urbanizacion-y-crecimiento-al-pinto-rodriguez 30/42
URBAN GROWTH AND MOBILITY IN LATIN AMERICA52
T a
b l e
5 .
G r e a t e r
S a n t i a g o
M e t r o p o
l i t a n A r e a
( G S M A ) , M e t r o p o
l i t a n Z o n e o
f M e x i c o
C i t y ( M Z M C ) a n d M e t r o p o
l i t a n R e g
i o n o
f S a o P a u
l o , ( S P M R ) 1 9 9 0 ’ s :
D e m o g r a p
h i c g r o w
t h r a t e
, n e t m
i g r a t i o n a n
d m
i g r a t i o n r a
t e a n
d n e t
i n t r a - m e t r o p o
l i t a n m
i g r a t i o n r a t e
f o r m u n
i c i p a l i t i e s a c c o r d
i n g
t o i t s
c e n t r a l i t y c o n
d i t i o n
( l o c a t i o n
)
M e t r o p o
l i t a n
A g g
l o m e r a
t i o n
T y p e o
f m u n
i c i p a l
i t y
M u n
i c i p a
l i t y
P o p u
l a t i o n g r o w
t h
r a t e 1 9 9 0 ’ s
N e
t i n t r a m e
t r o p o
l i t a n
m i g r a
t i o n
N e
t i n t r a m e
t r o p o
l i t a n
m i g r a t
i o n r a
t e ( p e r
1 0 0 0 )
G S M A
C e n
t r a l m u n
i c i p a l i t i e s
t h a t
l o s e
p o p u
l a t i o n
Q u
i n t a N o r m a l
- 1 . 1
- 9 , 0 9 5
- 2 . 0
C o n c h a l i
- 1 . 4
- 1 1 , 6 4 1
- 2 . 0
S a n J o a q u
i n
- 1 . 6
- 8 , 0 3 6
- 1 . 8
F a s t g r o w
i n g p e r i p h e r a l
m u n
i c i p a l i t i e s
P u e n
t e A l t o
6 . 1
6 9 , 0 0 6
3 . 6
M a i p u
6 . 6
4 4 , 5 7 6
2 . 4
Q u
i l i c u r a
1 1 . 7
3 3 , 6 7 4
7 . 6
M Z M C
C e n
t r a l m u n
i c i p a l i t i e s
t h a t
l o s e
p o p u
l a t i o n
C u a u
h t e m o c
- 1 . 5
- 3 0 , 0 7 8
- 1 . 3
G u s t a v o
M a d e r o
- 0 . 4
- 7 7 , 1 9 0
- 1 . 4
M i g u e l H
i d a l g o
- 1 . 5
- 2 5 , 8 4 2
- 1 . 7
F a s t g r o w
i n g p e r i p h e r a l
m u n
i c i p a l i t i e s
I x t a p a l u c a
9 . 5
7 0 , 3 1 7
6 . 7
T u l t e p e c
6 . 8
1 2 , 9 0 4
3 . 5
T u l t i t l a n
5 . 7
4 7 , 6 8 8
2 . 8
S P M R
C e n
t r a l m u n
i c i p a l i t i e s
t h a t
l o s e
p o p u
l a t i o n
S ã o P a u l o
0 . 9
- 2 8 0 , 3 0 9
- 0 . 5
O s a s c o
1 . 6
- 5 , 1 0 3
- 0 . 2
S a n t o A n
d r e
0 . 6
- 4 9 8
0 . 0
S ã o C a e t a n o
d o S u
l
- 0 . 7
- 3 , 2 7 2
- 0 . 5
R e l a t i v e c e n
t r a l m u n
i c i p a l i t i e s
( b u
t w
i t h s i g n
i c a n
t p e r i p
h e r i c a l
a r e a s ) t h a t g a i n p o p u
l a t i o n
G u a r u
l h o s
3 . 5
4 4 , 5 3 8
0 . 8
S ã o B e r n a r d o
d o C a m p o
2 . 4
2 3 , 6 2 7
0 . 7
F a s t g r o w
i n g p e r i p h e r a l
m u n
i c i p a l i t i e s
F e r r a z d e
V a s c o n c e l o s
4 . 5
1 3 , 5 1 3
1 . 9
F r a n c i s c o
M o r a t o
5 . 3
9 , 8 5 4
1 . 5
I t a q u a q u e c e t u
b a
5 . 8
2 8 , 3 7 1
2 . 1
S o u r c e : D e m o g r a p
h i c c e n s u s e s o
f C h i l e , M e x i c o a n
d B r a z i l .
8/12/2019 Urbanización y crecimiento AL. Pinto Rodriguez
http://slidepdf.com/reader/full/urbanizacion-y-crecimiento-al-pinto-rodriguez 31/42
JOSÉ MARCOS P. DA CUNHA AND JORGE RODRÍGUEZ VIGNOLI 53
Map 1. Greater Santiago Metropolitan Area (GSMA): Municipalities according to the inter-censusdemographic growth rate, 1982-1992 and 1992-2002
Source: Published Demographic Censuses.Notes: 1) Changes in maps respond to the inclusion of census districts in 2002, which were excluded in 1992, forbeing ‘rural’ or for not having existed by that time; 2) Maps’ elaboration by Daniela Gonzalez.

8/12/2019 Urbanización y crecimiento AL. Pinto Rodriguez
http://slidepdf.com/reader/full/urbanizacion-y-crecimiento-al-pinto-rodriguez 32/42
URBAN GROWTH AND MOBILITY IN LATIN AMERICA54
Map 2. Metropolitan Zone of Mexico City (MCMZ): Municipalities according to the inter-censusdemographic growth rate: 1980-1990 and 1990-2000
Source: Published Demographic Censuses.Note: Maps’ elaboration by Daniela Gonzalez.
8/12/2019 Urbanización y crecimiento AL. Pinto Rodriguez
http://slidepdf.com/reader/full/urbanizacion-y-crecimiento-al-pinto-rodriguez 33/42
JOSÉ MARCOS P. DA CUNHA AND JORGE RODRÍGUEZ VIGNOLI 55
Map 3. São Paulo Metropolitan Region (SPRM: Municipalities according to the inter-censusdemographic growth rate: 1980-1990 and 1990-2000
Source: Published Demographic Censuses.Note: Maps’ elaboration by Daniela Gonzalez.
Metropolitan redesign and socioeconomic residential segregation
From these two transformation processes currently taking place in the region’smetropolises, two opposing hypotheses emerge. One of them points towards theelite´s redistribution (by suburbanization, gentrication and the advance of a fractalcity) and, accordingly, a reduction in the distance between different social strata insome city zones, which tends to reduce the SRS, or at least its scale. The other onepoints to metropolitan duality – between the part of the city where the dynamiceconomic activities are located as well as affluent groups live, and in the other,where lagged economic activities are located and poor people live.
There are several concerns in relation to SRS: it weakens the nances of poormunicipalities, it affects residents in poor areas through “neighborhood effect” that
could be adverse due to a decit of infrastructure, services, social capital (contacts)or cultural capital (codes), or the relative absence of role models, or the stigma of
8/12/2019 Urbanización y crecimiento AL. Pinto Rodriguez
http://slidepdf.com/reader/full/urbanizacion-y-crecimiento-al-pinto-rodriguez 34/42
URBAN GROWTH AND MOBILITY IN LATIN AMERICA56
residing in a poor neighborhood. This hinders social integration since it is associatedwith lack of interaction between socioeconomic groups and it is linked with poor-governance and anomie in the “segregated” poor areas. Due to this, it is considereda mechanism that tends to reproduce poverty and inequalities, as well as erodesurban governance and metropolitan development. Such association leads to theconviction that SRS is one of the factors that has contributed to social inequalities inthe region’s cities. 22
Three determinants of SRS need to be theoretically distinguished and, if datapermits, separately quantied: a) selective migration according to socioeconomicstatus; b) vegetative growth of the different social groups; and (c) structural 23 change.Part of the analysis on the trends in SRS’s trends has concentrated on structuralchange; the latter is related to the principles of social mobility, which could alterthe modality and intensity of SRS, with no geographic displacement involved. 24 Ingeneral, these analyses lead to the hypothesis of increasing SRS because both signalthat elites remain isolated or closed from other social groups, and that mobilitystagnates in lower and middle social strata. The other side of the analysis hasunderlined the role of the migratory ows, which can directly remodel the pattern ofSRS´s25 pattern. Several of these analyses give credit to the SRS reduction hypothesis,or at least to its scale, as a result of the emerging urban displacements, particularlythe displacements of the elite from their residential area. It is relevant to identify and
22 However, the division of social groups within the city could also be due to cultural affinity reasons (for example,national, ethnic or linguistic proximity) and in this case, the term segregation would be wrongly used.23 In theory, the change in the social composition of each subdivision within one city could be divided into these threesources making it possible to estimate the contribution of each. However, there are theoretical dilemmas and practicalproblems. Even the simplest calculation, the one presented in this document associated on selectivity migrationinvolves assumptions with regard to the invariability of the analyzed attributes over time, and it is also subject to theknown limitations of census´ migration questions; for example, the loss of intermediate movements (for more details,see Rodriguez 2009, 2007y 2004b). Furthermore, to estimate the vegetative growth of social groups requiresinformation on births and deaths from each one. Consequently, this can only be achieved with vital statistics, which
tend to have omission or quality problems in Latin American countries. Finally, structural change corresponds to themodication of the attributes of those non-migrant individuals who survive along the period of analysis. Rigorously,it implies a follow-up and retrospective analysis, unlikely to happen in the region. The other possibility is to use thetwo subsequent censuses in order to do cohort follow-up (by age and specic characteristics) although in generalsuch follow-up is affected by migration and mortality. Whatever the case, the last component could be obtained as aresidual if the others are well calculated. In summary, breaking down the socioeconomic change of cities is ananalytical and empirical challenge for which we lack reliable data sources.24 An extreme, but intuitive example is that of the sudden process of income redistribution which signicantly andsimultaneously reduces extreme poverty and wealth. Any segregation measure over the extreme poor would beaffected by this change without any physical movement of poor people within the city.25 SRS depends on the socioeconomic composition (selectivity) of the in and out ows, from and towards themetropolises regarding the origin and destination. If the selectivity of the intra-metropolitan migration operates on
the principal of “affinity”¾affluent people migrate to up-scale areas and poor people migrate to poorer areas¾ thenintra-metropolitan migration would tend to worsen SRS; on the contrary, if it operated on a principle of “diversity”, itwould tend to attenuate it.
8/12/2019 Urbanización y crecimiento AL. Pinto Rodriguez
http://slidepdf.com/reader/full/urbanizacion-y-crecimiento-al-pinto-rodriguez 35/42
JOSÉ MARCOS P. DA CUNHA AND JORGE RODRÍGUEZ VIGNOLI 57
quantify the determinants of the trends of the SRS, both for the benet of academicknowledge and for public policy design.
In fact, the intervention directed to inuence SRS should act through proximatedeterminants, which, with the variable temporalities, redene the levels andmodalities of SRS. But such proximate determinants respond to a specic set ofpolicies, programs, incentives or rules. In this sense, changing the selectivity of intrametropolitan migration (to impact SRS through this intermediate variable) requiresdifferent actions to those should the objective be to inuence the SRS throughthe modication of the differential vegetative growths rates of the city´s differentsocioeconomic groups.
Thus, for many years there was only a little research on residential segregation,basically because detailed geographical information was needed. The access tocensus’ micro-data and above all, the technological instruments to processingthem, and the combination of data and geography through the GIS has particularlystarted to modify this situation. For the past 10 years there has been an outburst ofquantitative research on residential segregation. One of the most notable aspectsof this research has been the discrepancy amongst them. Some have found a rathertrend of decreasing SRS, measured through Duncan index of dissimilarity, in theGSMA, whereas, others have found a contrary trend in Sao Paulo and Campinas(Cunha and Jimenez, 2006) in Brazil, Mexico City and Montevideo (Rodriguez, 2008).
A recent work by Rodriguez (2008) discusses in detail the empirical trends of SRSin four major cities and examines the relationship between these tendencies andmigration, particularly intra-metropolitan migration. Although the results involvedonly four of out of the 40 “millionaire” cities in the region, his conclusions suggestareas for future research and could also be applied to those used in this article. Theyare the following:
• The different SRS levels between cities questions the existence of a“regional pattern” in relation to SRS; notwithstanding, all cities share somecharacteristics such as the depopulation of the city center, rapid peripheralexpansion and the precarious state of the latter;
• Dissimilar trends among cities prevents the formation of a “dominant regionalpath”;
• The high sensibility of the estimates according to socioeconomic indicatorsand the measurement of SRS questions categorical statements or thosebased on only one attribute or procedure;
• The variable effects of migration on SRS – measured by new and eleganttechniques – weakens general hypotheses on this relationship
8/12/2019 Urbanización y crecimiento AL. Pinto Rodriguez
http://slidepdf.com/reader/full/urbanizacion-y-crecimiento-al-pinto-rodriguez 36/42
URBAN GROWTH AND MOBILITY IN LATIN AMERICA58
Conclusions
This research is aimed at evaluating the tendencies of urbanization and thestructuring of city systems in Latin America, as well as analyzing the elements ofone of its main components, the internal migration. The nal goal is to update theperspectives on these matters, which sometimes rely on outdated evidence.
Relatively recent gures conrm - which are also useful for the comparison ofcountries -that high urbanization level is an unquestionable fact in the region, althoughthe process takes place differently in each country, both in intensity and form. It isshown how in the last 40 years, Latin America has suffered huge transformations, notonly in the spatial reallocation of the population between the country side and thecity, but also between cities and regions. These transformations were expressed in theconsolidation of metropolitization (one out of three Latin Americans live in a city of1 million or more inhabitants) showing complexity and diversication of the urbannetwork. As a result, the continuous pull of big cities is parallel to higher dynamism inintermediate cities, which explains the current reduction of primacy in most countries.
The process of urbanization and the diversication of the city systems led tothe predominance of migration between cities (over the historical countryside tocity ow), and to a growing heterogeneity of such processes, highlighting the owscoming from the big cities heading to suburbs, nearby places, or more distant cities.
The 1990’s and 2000’s have been underlined by important structural changes inLA, such as the incorporation of domestic economies to the world’s economy andpublic programs aiming at reducing poverty level thus, improving infrastructure andeconomic recuperation compared to the tough 1980’s. Although, recuperation haspresented oscillations and has not yet reduced inequality, it has allowed for increase ofinvestment levels, promoting a physical expansion of cities faster than its demographicgrowth. In light of such transformation, a lot of discussions on the deconcentrationand demetropolitization hypotheses have taken place. The data analyzed show a
moderate trend in this direction, more signicant in some countries than others,where the main cities lose signicance with regard to the other cities, not subject tothe counter-urbanization process itself. Consequently, this deconcentration processstrengthens the city system, although it is deemed to be partial and moderate. Thus,there are legitimate doubts on its sustainability, and according to our conclusions, it isfar from becoming a threat to the protagonism of large urban agglomerations.
The data clearly conrms that, despite the reduced growth of metropolitanareas they still concentrated a signicant fraction of the population in most of
Latin American countries. That is why we also nd a concentration of major social,economic and demographic problems (and challenges) of the region.
8/12/2019 Urbanización y crecimiento AL. Pinto Rodriguez
http://slidepdf.com/reader/full/urbanizacion-y-crecimiento-al-pinto-rodriguez 37/42

8/12/2019 Urbanización y crecimiento AL. Pinto Rodriguez
http://slidepdf.com/reader/full/urbanizacion-y-crecimiento-al-pinto-rodriguez 38/42
URBAN GROWTH AND MOBILITY IN LATIN AMERICA60
References
Alberts, J. and Villa, M (1980) Redistribución espacial de la población en América Latina , SerieE - CELADE, Nº 28, Santiago de Chile: ECLAC.
Baeninger, R. (2000) “Região, metrópole e interior: espaços ganhadores e espaços
perdedoresnas migrações recentes, Brazil, 1980-1996”, Texto NEPO, 35, Campinas: Núcleo deEstudos de População (NEPO), Universidade Estadual de Campinas (UNICAMP).
______ (1997) “Redistribución espacial de la población: características y tendencias del casoBrazileño”, Notas de Población , año 35, Nº 65 (LC/DEM/G.177/E), Santiago de Chile: ECLAC.
Benko, G. (1996) “Organização economica do territorio: algumas reexões sobre a evoluçãono século XX”, Território: globalização e fragmentação , M. Santos; M.A.A. Souza e M.L. Silveira(org.), São Paulo: Editora Hucitec-Anpur, 2a edição.
Castells, M. (1999) A sociedade en rede , São Paulo: Editora Paz e Terra.
Champion, A. (1998) “Population distribution in developed countries: has counter-urbanizationstopped?”, Population Distribution and Migration , New York: United Nations.
Chávez, A.M. and Guadarrama, J. (2007) “La región central de México en transición. Tendenciaseconómicas y migratorias a nales del milenio”, documento presentado en el “Taller nacionalsobre migración interna y desarrollo en México: diagnóstico, perspectivas y políticas”, México,D.F., 16 de abril, available at www.cepal.org/celade/noticias/paginas/3/28353/Chavez_Articulo.pdf.
Cunha, J.M.P. da (2007) “Dinâmica migratória e o processo de ocupação do centro-oeste Brazileiro:o caso de Mato Grosso”, documento apresentado ao seminário “O Brazil e suas fronteiras agríco-
las: diagnósticos e perspectivas”, Campinas, 2 de agosto, available at http://72.232.29.50/~ifnepo/usuario/GerenciaNavegacao.php?caderno_id=638&texto_id=849.
______ (2006) “Dinâmica migratória e o processo de ocupação do Centro-Oeste Brazileiro: ocaso de Mato Grosso”, Revista Brazileira de Estudos de População , Campinas: ABEP, 23.
______ (2002) Urbanización, redistribución espacial de la población y transformacionessocioeconómicas en América Latina , Serie Población y desarrollo , 30 (LC/L.1782-P), Santiago deChile: ECLAC, Naciones Unidas.
______ (2000) “La movilidad intrarregional en el contexto de los cambios migratorios en Brasil
en el período 1970-1991: el caso de la Región Metropolitana de São Paulo”, Notas de Población ,70 (LC/G.2100-P/E), Santiago de Chile: ECLAC.
______ (1995) “Migração intrametropolitana: movimento dos pobres?”, Revista Brazileira deEstudos de População , Campinas: ABEP, 12( 1-2).
Cunha, J.M.P. da and Rodrigues, I. (2001) “Transition space: new standpoint on São PauloState’s (Brazil) population redistribution process”, In XXIV IUSSP General Population Conference ,Salvador (Brazil).
Cunha, J.M.P. da and Jiménez, M.A. (2006) “Segregação e acúmulo de carências: localizaçãoda pobreza e condições educacionais na Região Metropolitana de Campinas”, Novas metró- poles paulistas: população, vulnerabilidade e segregação , J.M.P. da Cunha (org.), Campinas:NEPO/UNICAMP.

8/12/2019 Urbanización y crecimiento AL. Pinto Rodriguez
http://slidepdf.com/reader/full/urbanizacion-y-crecimiento-al-pinto-rodriguez 39/42
JOSÉ MARCOS P. DA CUNHA AND JORGE RODRÍGUEZ VIGNOLI 61
Cunha, J.M.P. da and Baeninger, R. (2000) “A migração nos Estados Brazileiros no períodorecente: principais tendências e mudanças”, In Hogan, D. J. et al. (orgs.) Migração e ambienteem São Paulo: aspectos relevantes da dinâmica recente , Campinas: NEPO/UNICAMP.
Cohen, B. (2006) “Urbanization in developing countries: current trends, future projections andkey challenges for sustainability”, Technologies in Society, 28.
Davis, J. and J. V. Henderson (2003) “Evidence on the political economy of the urbanizationprocess”, Journal of Urban Economics, 53, Elsevier.
De Mattos, C. (2001) “Globalización y metropolización en Santiago de Chile: una historia decontinuidades y cambios”, Metropololización en Chile. Interrogantes y desafíos , Santiago deChile: MIDEPLAN.
Diniz, Clelio (2007) “A região metropolitana de São Paulo: reestructuracãao, espacializacão enovas funcões”, EURE(Santiago), 98, Santiago de Chile: Ponticia Universidad Católica de Chile.
Dupont, V. et al. (coords.) (2002) Metrópolis en movimiento. Una comparación internacional ,Bogotá, Alfaomega.
LACDC (Economic Commission for Latin America and the Caribbean) (2007) Social Panoramaof Latin America 2007 (LC/G.2351-P/E), Santiago de Chile.
______ (2005a) Social Panorama of Latin America 2004 (LC/G.2259-P), Santiago de Chile.
______ (2005b) “Panorama 2005. El nuevo patrón de desarrollo de la agricultura enAmérica Latina y el Caribe”, Project document , No. 30 (LC/W.30), available atwww.cepal.org/publicaciones/xml/9/22749/panorama2005.pdf
Ferras, Carlos (2007) “El enigma de la contraurbanización. Fenómeno empírico y conceptocaótico”, EURE(Santiago), 98, Santiago de Chile: Ponticia Universidad Católica de Chile.
Gans, Paul (2007) “Internal migration patterns in the EU and the future populationdevelopment of large cities in Germany”, presentation at the international seminar“Migration and Development: the case of Latin America”, Santiago de Chile, 7-8 August,available at www.LACDC.org/celade/noticias/paginas/7/29527/Gans.pdf
Garza, G. and Schteingart, M. (1984) “Ciudad de México: dinámica industrial y estructuracióndel espacio en una metrópoli semiperiférica”, Demografía y Economía , 18(4), México, D.F.
Gottdiener, M. (1990) “A teoria da crise e a reestruturação sócio-espacial: o caso dos EstadosUnidos”, Reestruturação urbana: tendências e desaos , L. Valladares e E. Preteceille (coord.), SãoPaulo: Nobel/IUPERJ.
Guzmán, J. M. et al. (2006) “La démographie de l’Amérique latine et de la Caraïbe depuis1950”, Population-F , 61(5-6), available at www.ined.fr/chier/t_publication/1249/publi_pdf1_chronique_ameriquelat.pdf
Harvey, D. (1993) A Produção Social do Espaço , São Paulo: EDUSP.
Hugo, G.; Champion, A. and Lattes, A. (2001) “New conceptualization of settlement fordemography: beyond the rural/urban dichotomy”, IUSSP , Procedings of the XXIV InternationalConference , Salvador (Brazil).
8/12/2019 Urbanización y crecimiento AL. Pinto Rodriguez
http://slidepdf.com/reader/full/urbanizacion-y-crecimiento-al-pinto-rodriguez 40/42
URBAN GROWTH AND MOBILITY IN LATIN AMERICA62
Hayami, Y. (2000) “Toward a new model of rural-urban linkages under globalization”, LocalDynamics in an Era of Globalization: 21st Century Catalysts for Development , S. Yusuf; W. Wu andS. Evenett (eds.), New York: Oxford University Press.
Montgomery, M. (2004) Cities Transformed: Demographic Change and its Implications in theDeveloping World , London, Earthscan.
Lattes, A. (1995) “Urbanización, crecimiento urbano y migraciones en América Latina”,Pensamiento Iberoamericano , 28, Santiago de Chile.
Lencioni, S. (1996) “Reestruturação urbano-industrial no Estado de São Paulo: a região dametrópole desconcentrada”, In Santos, M.; Souza, M.A.A. and Silveira, M.L. (orgs.), Território:globalização e fragmentação. São Paulo: Editora Hucitec-Anpur, 2sd edition.
Mills, E.S. (2000) “The importance of large urban areas and governments’ roles in fosteringthem”, In Yusuf, S.; Wu, W. and Evenett, S. (eds.) Local Dynamics in an Era of Globalization: 21stCentury Catalysts for Development , New York: Oxford University Press.
Negrete, M. (1999) “Desconcentración poblacional en la Región Centro de México”, EstudiosDemográcos y Urbanos , 2 (41) , México, D.F.: Colegio de México.
Ocampo, J. A. (2001) “Retomar la agenda del desarrollo”, Revista de la ECLAC , 74, Santiago deChile.
Pacheco, C. A. (1998). Fragmentação da Nação , Campinas: Instituto de Economia/UNICAMP.
Pimentel, M. (2000) “La reestructuración de los espacios nacionales en los inicios del siglo XXI:continuidad y cambio en la distribución espacial de la población mexicana”, Santiago de Chile:CELADE (mimeo).
Ruiz, N. and Delgado, J. (2008) “Territorio y nuevas ruralidades: un recorrido teórico sobre lastransformaciones de la relación campo-ciudad”, EURE (Santiago), 34(102), Santiago de Chile:Ponticia Universidad Católica de Chile.
Rodríguez, J. (2009) “Dinámica demográca y asuntos de la Agenda Urbana en América Latina:¿qué aporta el procesamiento de microdatos censales?”, Notas de Población , 86 (LC/G.2349-P),Santiago de Chile: CEPAL.
______ (2008) “Movilidad cotidiana, desigualdad social y segregación residencial en cuatrometrópolis de América Latina”, EURE (Santiago), 34(103), Santiago de Chile: Ponticia
Universidad Católica de Chile.______ (2007) “Paradojas y contrapuntos de dinámica demográca metropolitana: algunasrespuestas basada en la explotación intensiva de microdatos censales”, In C. De Mattos y R.Hidalgo (eds.) Santiago de Chile: movilidad espacial y reconguración metropolitana , Santiagode Chile: Universidad Católica de Chile.
______ (2004a) Migración interna en América Latina y el Caribe: estudio regional del período1980-2000 , serie Población y desarrollo , 50 (LC/L.2059-P), Santiago de Chile: CEPAL, NacionesUnidas.
______ (2004b) “Explotando el módulo sobre migración interna de los censos de poblacióny vivienda de América Latina”, REDATAM Informa, 10 (LC/L.2261), Santiago de Chile: CELADE/CEPAL.
8/12/2019 Urbanización y crecimiento AL. Pinto Rodriguez
http://slidepdf.com/reader/full/urbanizacion-y-crecimiento-al-pinto-rodriguez 41/42
JOSÉ MARCOS P. DA CUNHA AND JORGE RODRÍGUEZ VIGNOLI 63
______ (2002) “Distribución espacial de la población de América Latina y el Caribe: tendencias,interpretaciones y desafíos para las políticas públicas” , Serie Población y desarrollo , 32 (LC/L.1831-P), Santiago de Chile: CEPAL, Naciones Unidas.
______ and Martine, G. (2008) “Urbanization in Latin America: experiences and lessonslearned”, In G. Martine et al. (eds.), The New Global Frontier: Cities, Poverty and Environment in
the 21st
century , London: IIED/UNFPA and Earths can Publications.______ and M. Villa (1998) “Distribución espacial de la población, urbanización y ciudadesintermedias: hechos en su contexto”, In Jordan, R. and Simioni, D. Ciudades intermedias en América Latina y el Caribe: propuesta para la gestión urbana , Santiago de Chile:, CEPAL.
Sassen, S. (2007) “El reposicionamiento de las ciudades y regiones urbanas en una economíaglobal: ampliando las opciones de políticas y gobernanza”, EURE(Santiago), 33(100), SantiagoPonticia Universidad Católica de Chile.
______ (1991) The global city, Princeton, Princeton University Press.
Silva, J. (1999) O Novo Rural Brazileiro, Coleção Pesquisas 1, Campinas: Instituto de Economia/UNICAMP.
______ (1997) “O Novo Rural Brazileiro”, Nova Economia , 7(1), Belo Horizonte.
United Nations (2006) World Urbanization Prospects. The 2005 Revision Executive Summary.Fact Sheets. Data Tables (ESA/P/WP/200), New York, Department of Economic and SocialAffairs, Population Division, available at http://www.un.org/esa/population/publications/WUP2005/2005WUPHighlights_Final_Report.pdf
______ (2001) The Components of Urban Growth in Developing Countries (ESA/P/WP.169), NewYork.
______ (1993) Population growth and policies in mega-cities. São Paulo , Departament ofInternacional Economic and Social Affairs, New York.
______ (1991) Population growth and policies in mega-cities. Mexico City , Departament ofInternacional Economic and Social Affairs, New York.
UNFPA (United Nations Population Fund) (2007) State of World Population 2007, New York.
Wong-Gonzáles, P. (1999) “Globalización y virtualización de la economía: impactosterritoriales”, In V Seminario de la Red Iberoamericana de Investigadores sobre Globalización yTerritorio , Toluca: Universidad Autónoma de México.
Yusuf, S.; Wu, W. and Evenett, S. (eds.) (2000) Local Dynamics in an Era of Globalization: 21stCentury Catalysts for Development , New York, Oxford University Press.

8/12/2019 Urbanización y crecimiento AL. Pinto Rodriguez
http://slidepdf.com/reader/full/urbanizacion-y-crecimiento-al-pinto-rodriguez 42/42