the relation between excess control and cost of capital
TRANSCRIPT
1
The Relation between Excess Control and Cost of Capital under Different Law Regimes
Yves Bozec
HEC Montreal 3000 Chemin de la Côte-Sainte-Catherine
Montréal (Québec) H3T 2A7, Canada Phone : +1 (514) 340-6560 Fax : +1 (514) 340-5633
Claude Laurin HEC Montreal
3000 Chemin de la Côte-Sainte-Catherine Montréal (Québec) H3T 2A7, Canada
Phone : +1 (514) 340-6536 Fax : +1 (514) 340-5633
Iwan Meier HEC Montreal
3000 Chemin de la Côte-Sainte-Catherine Montréal (Québec) H3T 2A7, Canada
Phone : +1 (514) 340-3198 Fax : +1 (514) 340-5632
November 30, 2009
2
The Relation between Excess Control and Cost of Capital under Different Law Regimes
Abstract
Prior empirical work examined the relationship between dominant shareholders, whose
voting rights exceed cash flow rights, and firm value. In this study, we adopt a different
perspective and argue that because of the risk imposed on minority shareholders and
debtors such excess control likely increases firms’ weighted-average cost of capital. We
further argue that in legal environments that provide weak investor protection, cost of
capital is likely to be higher. Using panel data of 155 Canadian firms over a four-year
period from 2002 to 2005, we find supporting evidence.
Keywords: Corporate governance, cost of capital, excess control, ownership, dominant shareholders, agency costs. JEL classification: G34
3
I. INTRODUCTION
In the aftermath of one of the most important financial crises in history, many
market observers believe that increasing the quality of corporate governance remains a
key medicine to avoid similar crises in the future. As it is a central issue in governance,
the question of ownership is the subject of many prescriptions. On one hand, a large body
of literature attempts to demonstrate that, because it favors the entrenchment of the
dominant shareholder, high levels of ownership concentration is assumed to be negatively
correlated with firm value (see Claessens et al., 2002, among many others). Also, because
it increases the likelihood of expropriation through an increase in private benefits, the
existence of control enhancing mechanisms, such as dual class shares and pyramid
holdings, is assumed to exacerbate the negative relationship between ownership and firm
value (Bebchuck et al., 2000). The literature documenting the negative relationship
between excess control and proxies for firm value, mostly Tobin’s Q, is growing at an
impressive rate.
But on the other hand, a growing number of market analysts observes that, as
opposed to firms with dispersed ownership which tend to set short-term targets related to
their share price, a certain number of firms controlled by their founding entrepreneurs,
who use control enhancing mechanisms, tends to establish long-term strategies aimed at
creating sustainable value. According to these analysts, if accompanied by laws that
protect minority shareholders, including coat-tail protection, concentrated ownership
should be encouraged rather than fought. To that effect, some pressure groups, including
the Institute for Governance in Private and Public Organizations in Canada, recommend

4
to adopt legislative measures that favor the concentration of voting rights in the hands of
entrepreneurs.
In this paper, we adopt a risk sharing perspective through which excess control is
not necessarily detrimental to firm value. We argue that by increasing the risk of
expropriation, excess control increases the firms cost of capital rather than having a direct
negative effect on firm value per se. We further argue that in legal environments that
provide weaker protection to minority shareholders the use of control enhancing
mechanisms is likely to be more widespread, and the firms’ cost of capital is likely to be
higher.
The association between excess control and the cost of capital is investigated
using a sample of 155 Canadian S&P/TSX firms over a four-year period from 2002 and
2005. In Canada, firms incorporated in all the provinces except Quebec are under
common law legislature. But firms incorporated in Quebec are under a civil law regime
which, according to the literature, offers weaker protection of minority shareholders.
Furthermore, the province of Quebec offers two corporate statutes, namely the
Companies Act (QCA) and the Canada Business Corporations Act (CBCA). As it grants
more power to dominant shareholders, QCA is perceived as being less protective of
minority shareholders. Hence, because of its different laws and corporate statutes, Canada
offers a rich environment to test the complex relationships between ownership, the cost of
capital and investors’ protection.
Results from OLS regressions show a positive, but weak, relationship between
excess control and WACC. Using 2SLS regressions in order to control for endogeneity,
we find a stronger positive association between excess control and WACC, suggesting
5
that the firms’ cost of capital increases with the wedge between the controlling
shareholders’ voting rights and cash flow rights. We also confirm that for firms
incorporated under the less protective Quebec incorporation law the wedge and,
therefore, cost of capital is higher than for firms incorporated in the other provinces under
the common law regime.
II. THEORY AND LITERATURE
Excess Control and Firm Value: The Current View
Over the last decade, the theoretical as well as empirical literature on the
relationship between the separation of ownership and control and firm value has been
enriched at an impressive rate. Because concentrated ownership structure appears to be
the norm around the world (La Porta et al., 1999), researchers have been focusing on type
II agency problems, i.e. conflicts of interests between dominant and minority
shareholders (Villalonga and Amit, 2006). Theoretically, the separation of ownership
rights and control rights should have a negative effect on firm value. As investors
associate excess control with weak governance, they are assumed to discount more
heavily the future cashflows of firms controlled by shareholders who have more voting
rights than cash flow rights. As a result, empirical studies analyzing excess control and
variables related to firm value, most often Tobin’s Q, assume a negative relationship
between the two.
Among the most prominent empirical studies of excess control, Claessens et al.
(2002) were the first to document a negative relationship between excess control and firm
value. Later on, the relationship between excess control and firm value was studied
6
worldwide, including studies by Faccio and Lang (2001) and Barontini and Caprio (2006)
in Western Europe, Cronqvist and Nilsson (2003) in Scandinavia, Joh (2003) and Baek et
al., (2004) in Korea, Villalonga and Amit (2006) and Gompers et al. (2008) in the U.S.
While they yield mixed results, the general conclusion of these studies points towards a
negative relationship between excess control and variables that proxy for firm value. For
Canada, Bozec and Laurin (2004) document a weak, negative relationship between
excess control and firm value. This negative relationship appears to be stronger when
firms are family-controlled (King and Santor, 2007) and when free cashflows are
available (Bozec and Laurin, 2008).
In these studies, the conjecture is that the negative association between excess
control and firm value is the result of weaker governance of firms with concentrated
ownership. It is generally assumed that if governance is weak, then cashflows are likely
to be reduced as a result of poor management. This problem is exacerbated for firms with
a large discrepancy between the controlling shareholder’s voting rights and cash flow
rights which, in addition to poor management, are prone to expropriation. Ceteris
paribus, as firms with concentrated ownership are likely to generate smaller cashflows,
they should have lower values.
But more recently, the assumed link between excess control and weak governance
has been questioned by many market observers (Allaire and Firsirotu, 2009). This
questioning emerges from the counter-factual evidence that the set of firms with excess
control includes a fairly large number of well-governed firms, sometimes owned by
wealthy families. While excess control can lead to disastrous consequences to minority
shareholders, like it was the case in the Conrad Black – Hollinger saga, the governance of
7
firms like Google, Berkshire Hathway, Ford and many other media firms appears to be of
very high quality. To date, empirical research has failed to link excess control and
specific governance variables such as board size, independence and manager
compensation practices (Khalil and Magnan, 2009). As a result, the nature of the
relationship between excess control and the quality of governance, which would
ultimately affect firm value, is still unclear.
Excess Control and Firm Value: An Alternate View
An alternate view to analyze the relationship between excess control and
governance is to tackle the issue from a risk sharing perspective. Through excess control,
dominant shareholders get a form of “guaranteed ownership” which, to them, certainly
has value. When dominant shareholders have a large proportion of voting rights, they are
in a position to block any attempt of hostile takeover and secure their ownership. Among
other things, this form of guaranteed ownership allows them to implement strategies that
provide long-term benefits without fearing the adverse effect of having weaker short-term
results. When long-term benefits exceed myopic short-term benefits, implementing this
kind of strategy is a sign of strong rather than weak governance.
On the other hand, this guaranteed ownership is a form of entrenchment, which
certainly imposes some risk on minority shareholders. Proponents of type II agency
conflicts argue that excess control generates agency costs that, for instance, can take the
form of expropriation through so-called “tunneling”. To that effect Bechuck et al. (2000)
provide an extensive description on how minority shareholders can be expropriated by
dominant shareholder when the latter has excess control. In equilibrium, however, the
8
existence of a very large number of publicly traded firms controlled by dominant
shareholders shows that minority shareholders are willing to accept this risk.
In our view, minority shareholders will accept this risk as long as they perceive
that they are compensated for it. From the firm perspective, more risk usually results in a
higher weighted average cost of capital (WACC), i.e. higher cost of equity and cost of
debt. From the investor’s perspective, higher cost of capital means higher return on their
investment, which is a form of compensation. Therefore, we argue that excess control is
likely to have a more direct relationship with cost of capital than with firm value or
performance, especially since value is not only affected by risk but also by the firm’s
growth opportunities (Hail and Leuz, 2006).
A direct relationship between excess control and WACC does not contradict the
previous literature that hypothesized a negative association between excess control and
firm value. All else equals, firms with higher WACC should have lower values. Our main
contribution is that by focusing on the direct link between excess and WACC, we
recognize that firms endowed with excess control are not necessarily poorly governed. In
fact, these firms could also have sound management that compensates the adverse effects
of higher WACC, and that might explain why testing the indirect link between excess
control and firm value yields mixed results.
Previous Literature
Other studies attempted to link investors’ protection and governance quality with
the cost of capital. Analyzing a sample of more than 30,000 firm year observations from
40 different countries over a ten-year period, Hail and Leuz (2006) conclude that firms in
9
countries with more extensive disclosure requirement, stronger securities regulation and
higher quality legal systems have lower cost of equity capital.
A number of studies analyze the link between governance mechanisms and one
portion of the cost of capital, i.e. cost of equity or cost of debt. For the U.S., Ashbaugh et
al. (2004) also find a negative link between variables that proxy for governance quality
and the cost of equity capital. Among many key results, they find that for a sample of
more than 500 U.S. firms analyzed over a period of six years, the cost of equity capital is
positively associated with ownership concentration, measured using the number of
outside blockholders. Focusing more on financial institutions, Bhojraj and Sengupta
(2003) show a negative link between the quality of governance and the cost of debt.
Some studies attempt to link the overall cost of capital with investors’ protection
and ownership variables. Himmelberg et al. (2002) argue that in countries where investor
protection is relatively low, entrepreneurs are forced to retain a larger share of equity. In
these countries, lower levels of available capital result in higher cost of capital. The
empirical results support their argumentation. In the same vein, Elston and Rondi (2006)
find that concentrated ownership is positively linked to the cost of capital in Italy, but this
link is insignificant in Germany where investor protection is assumed to be stronger and
capital more available. In contrast, Pham et al. (2007) find that Australian firms with
concentrated ownership and small boards tend to have a lower weighted average cost of
capital.
While the above studies focus on ownership concentration, none of them
specifically assesses the relationship between excess control and cost of capital.
Guedhami and Mishra (2007) is one exception as the authors find that excess control is
10
positively associated with the cost of equity, using a multi-country sample of firms. Our
study adds to this literature by investigating the impact of excess control on the firms’
weighted-average cost of capital, including cost of equity and cost of debt, for a sample
of Canadian firms incorporated under different law regimes. As Canadian institutions are
generally believed to offer good protection to minority shareholders, ownership
concentration in Canada is not likely to be strongly linked to the firms’ cost of capital.
However, due to risk sharing and different law regimes, we expect excess control to be
positively associated with the weighted average cost of capital of Canadian firms
especially when firms are incorporated under a regime that offers less protection to
minority shareholders. The next section describes the methodology we use to estimate the
firms cost of capital.
III. METHODOLOGY
Sample Selection
Our study covers a four-year period from 2002 to 2005. We initially select firms
listed on the Toronto Stock Exchange comprising the S&P/TSX composite index in 2005
(n = 209). In line with previous studies, we delete financial companies from the sample
(n = 28) given their unique characteristics. We also eliminate firms with incomplete data
to compute the set of variables described below. Our final sample is an unbalanced panel
of 155 Canadian firms and 589 firms-years observations.
11
Computing the Weighted Average Cost of Capital (WACC)
Over the past two decades, surveys on common practices in capital budgeting
document the widespread use of the weighted average cost of capital (WACC) to assess a
firm’s cost of capital. In a survey of Fortune 500 firms, Bierman (1993) reports that 93%
of the 74 respondents use WACC to discount projected (after-tax) cash flows. Bruner et
al. (1998) interview 27 highly regarded U.S. firms and conclude that 89% of the CFOs
compute WACC. Meier and Tarhan (2007) find that 71% of the 127 respondents to their
survey use WACC. The computation of WACC requires the assessment of the after-tax
cost of debt and the cost of equity, which are then weighted by the market capitalization
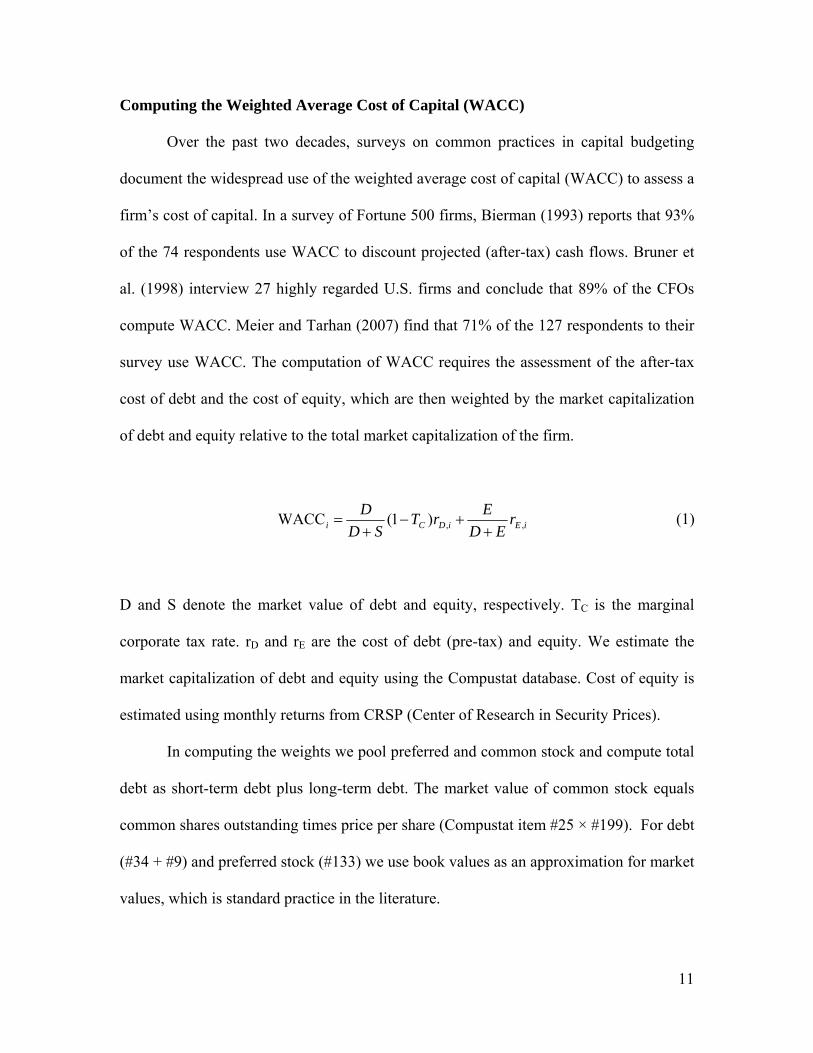
of debt and equity relative to the total market capitalization of the firm.
iEiDCi rED
ErT
SD
D,,)1(WACC
(1)
D and S denote the market value of debt and equity, respectively. TC is the marginal
corporate tax rate. rD and rE are the cost of debt (pre-tax) and equity. We estimate the
market capitalization of debt and equity using the Compustat database. Cost of equity is
estimated using monthly returns from CRSP (Center of Research in Security Prices).
In computing the weights we pool preferred and common stock and compute total
debt as short-term debt plus long-term debt. The market value of common stock equals
common shares outstanding times price per share (Compustat item #25 × #199). For debt
(#34 + #9) and preferred stock (#133) we use book values as an approximation for market
values, which is standard practice in the literature.
12
Estimating the Cost of Equity
The estimation of a company’s cost of equity is more challenging. The primary
approach suggested by academics and used in the industry is the capital asset pricing
model (CAPM). While more complex multi-factor models have been proposed in the
academic literature, such as the Fama and French (1992) three-factor model, the one-
factor CAPM is the preferred choice among firms. Estimating the cost of equity of
individual firms using regression analysis often results in low R-squares. However,
adding explanatory variables tends to increase the estimation error. In fact, Graham and
Harvey (2001) find that three out of four CFOs use the CAPM to determine the firm’s
cost of equity. According to Welch (2008), about the same percentage of finance
professors recommend to use the CAPM to determine the cost of capital for capital
budgeting decisions. Da et al. (2009) also provide evidence supporting the use of the
CAPM for estimating cost of capital. The implementation of the CAPM requires a risk-
free rate, the estimation of the sensitivity of the stock returns to changes in market returns
(beta coefficient) and the equity premium, which quantifies the expected excess return on
the market over the risk-free rate.
The choice of the appropriate risk-free rate is motivated by the average length of a
typical project of a firm. The CAPM is a single-period model and, hence, in order to
estimate the expected return on equity over this period we need to assess the appropriate
time horizon. The risk-free rate then has to correspond to the same time frame. The study
mentioned above by Bruner et al. (1998) documents that most firms use a long-term
government bond yield, such as the yield to maturity on 10-year Treasury bonds, as the
risk-free rate. While the choice of the exact time horizon is difficult it is rarely critical.
13
Typically, the term structure of interest rates flattens out at longer horizons and the
differences between the 10-year and 20-year yields are relatively small. Secondly, in the
CAPM the risk-free rate enters positively as the intercept, but at the same time is
deducted from the expected market return, which balances somewhat out. For our study
we assume an average project life of 10 years and use the 10-year Government of Canada
benchmark yield prevailing at the date of the computation of cost of capital.
As the market return we use the expected return on the S&P/TSX market index.
Booth (2001) provides statistical evidence for Canadian data over the past four decades
that stocks outperformed bonds by about 3%. As this estimate is influenced by a period of
high government deficits in the 70s that pushed interest rates upwards and conditions on
bond markets have changed since then, he recommends using an equity premium of about
4.5% for the Canadian market. This estimate is also in line with recent studies that argue
that the historical equity premium in the U.S. of 7-8% exceeds the ex-ante expected
equity premium (e.g. Jagannathan et al., 2000 and Fama and French, 2002) and survey
answers from financial managers (Graham and Harvey, 2005).
Having assessed the risk-free rate and the equity risk premium we use five years
of monthly return data to estimate a firm’s beta coefficient by regressing a firm’s returns
on the equity risk premium. All returns represent total returns and take into account
reinvested dividend payments. The choice of a five-year horizon balances out the
preference for a large number of observations and that the data should be representative
of the firm’s current characteristics. Besides being commonly applied in the academic
literature, most professional data service providers such as Reuters or Bloomberg also use
five years of monthly data (or two years of weekly data) to estimate company betas. The
14
use of monthly observations avoids the problems of noise inherent in daily data and five
years provide a sufficient number of observations.
Estimating the After-Tax Cost of Debt
The remaining two variables are the cost of debt and the marginal tax rate. We
assess a firm’s cost of debt from its credit rating. Then, based on its credit rating we add a
fraction or multiple of the difference between the weighted average long-term corporate
bond yields computed by Scotia Capital Inc. minus the 10-year Government of Canada
benchmark yield (credit spread) to the 10-year Government of Canada benchmark yield
(riskfree rate). For all firms for which Compustat provides an S&P long-term senior debt
rating we assign the firm to four categories. For firms rated AAA to A- we add 0.5 times
the credit spread, for ratings from BBB+ to BB we apply the credit spread for the average
corporate bond, for ratings from BB- to B we use 1.5 times the credit spread, and for
firms with ratings below B we add twice the credit spread. For all remaining firms
without an S&P rating we base our cost of debt estimate on Altman’s (1968) Z-score.1
For financially healthy firms with a Z-score below 1.81 we use the 10-year Treasury
bond rate plus the average corporate credit spread, for firms with a Z-score between 1.81
and 3 we add 1.5 times the credit spread, and for firms with Z-scores above 3 (unhealthy
firms) we add two times the credit spread.
The tax rate in the WACC equation should represent the marginal tax rate of the
firm. The balance sheet provides information about the average tax rates which we use as
1 Altman’s (1968) model is specified as follows: Z = 1.2 (working capital/total assets) + 1.4 (retained earnings/total assets) + 3.3 (EBIT/total assets) + 0.6 (market value of equity/book value of total liabilities) + (sales/total assets). For the computation we use the following annual Compustat data items: Z = 1.2 × (#119/#6) + 1.4 × (#36/#6) + 3.3 × (#172/#6) + 0.6 × [(#199 × #25)/#181] + #117/#6.
15
an approximation of a firm’s marginal tax rate. For all firms in our sample we compute
the average ratio over the past three years of income tax payments (#16) divided by
income before taxes (#170). To avoid excessive estimates resulting as an artefact of
accounting regulations on deferred taxes and tax credits we winsorize these tax rates at
50%.
Explanatory Variables Ownership Variables
Following the pioneering work of La Porta et al. (1999) and subsequent influential
papers (e.g. Claessens et al., 2000; Faccio and Lang, 2002), this study focuses on the
ultimate, rather than the immediate, controlling shareholder. Pyramid structures in many
corporations in Canada suggest that identifying an immediate controlling shareholder is
not sufficient for defining corporate ownership structure (Bozec and Laurin, 2008). Using
firms’ 2005 proxy circular available on the SEDAR website, we identify the ultimate
owner – i.e, the largest ultimate shareholder whose voting rights are above 10% – and
collect his voting rights (VR), his cash flows rights (CFR) and the gap between his voting
rights and his cash flow rights (EXCESS).2 As an additional metrics of excess control, we
use a dummy variable (SEPARATION) which takes the value of either 1 if the ultimate
shareholder’s voting rights exceed his cash flow rights or 0 otherwise, and a ratio which
consists of cash flow rights over voting rights (CFR/VR). Lastly, we create a dummy
variable (FAMILY) taking the value of one if the ultimate dominant shareholder is a
family.
2 Note that if the firm has no ultimate owner (widely-held firm), VR and CFR are computed using the manager with the greatest voting rights.
16
Law Variables
Firm law variables also come from the SEDAR website. QUEBEC is a dummy
variable identifying firms headquartered in the province of Quebec and captures the
impact of civil law regime. As in Bozec et al. (2008), QUEBEC-QCA (QUEBEC-CBCA)
is a dummy variable taking the value of one if the firm’s law of incorporation is QCA
(CBCA), otherwise zero.
Firm-Specific Controls
We collect the following firm level characteristics from Compustat and Stock
Guide: SIZE, DEBT, AGE, CAPEX, and book-to-market ratio (BM). SIZE is the log of
total assets and DEBT measures the level of debt of the firm defined as the book value of
long-term debt over total assets. AGE is a dummy variable that takes the value of 1 if the
firm has been operating for at least 10 years and 0 otherwise. CAPEX and book-to-
market are proxies for growth opportunities. CAPEX is measured by the ratio of capital
and R&D expenditures over total assets. As in Pham et al. (2007), BM is computed as the
book value of equity divided by the market value of equity.3
Empirical Model
It is well known that in the presence of endogeneity, OLS regression models may
yield biased and inconsistent estimates. Endogeneity is present when the following two
situations happen. First, a control variable is missing from the regression model and is
determining both, the explanatory variable (EXCESS in our case) and the dependent
variable (WACC), which leads to spurious correlation between EXCESS and WACC. 3 We also used the book value of assets divided by the market value of assets as an additional metric.
17
Second, there is a simultaneous causality bias (reverse causality bias), that is EXCESS
may cause WACC which in turn may cause EXCESS. Demsetz and Lehn (1985),
Himmelberg et al. (1999), Demsetz and Villalonga (2001), among others, provide
compelling evidence of the endogeneous nature of ownership structure.
One standard approach to address the endogeneity problem is to run instrumental
variables regressions, estimated using two-stage least squares (2SLS) for panel data
models. We therefore specify the following system of equations:
WACCi,t = δ + θ1 EXCESSi,t + θ2 SIZEi,t + θ3 DEBTi,t + θ4 AGEi,t + θ5 CAPEXi,t
+ θ6 BMi,t + θi YEARj + θj FIRM EFFECTj + ε2 (2a)
EXCESSi,t = α + β1 QUEBECi + β2 QUEBEC-QCAi + β3 FAMILYi,t
+ β4 SIZEi,t + β5 DEBTi,t + β6 AGEi,t + β7 CAPEXi,t + β8 WACCi,t
+ βi SECTORi + βj YEARj + βj FIRM EFFECTj + ε1 (2b)
Equation (2a) is the second stage regression where the firm’s cost of capital
(WACC) is regressed against the wedge between the ultimate dominant shareholder’s
voting rights and cash flow rights (EXCESS), a set of observable firm characteristics
(SIZE, DEBT, AGE, CAPEX, BM), and firm and year effects that aim to control for
unobservable firm heterogeneity. If dominant shareholders who enjoy excess control do
actually increase the risk of minority shareholders’ expropriation, EXCESS should be
positively associated with WACC.
18
In terms of control variables, we argue that older firms are often larger than
younger firms and their operations are more diversified. Therefore, one could expect a
lower firm risk and consequently a lower cost of capital. Leverage (DEBT) may lower
firm’s cost of capital because it offers tax savings (interest payments are tax deductible).
But higher leverage is also associated with higher risk (risk of bankruptcy) and, hence
increases the firm’s WACC (Fama and French, 1992). Previous studies (e.g. Bozec and
Laurin, 2008; Cronqvist and Nilsson, 2003) show that growth opportunities are positively
associated with risk, implying a positive (negative) relationship between WACC and
CAPEX (BM). Note, however, that because these variables are correlated to some degree,
the relationship between WACC and the control variables, including SIZE, DEBT, AGE,
CAPEX and BM, is difficult to predict.
Equation (2b) is the first stage regression where EXCESS, the endogeneous
variable, is regressed on the following instruments: QUEBEC, QUEBEC-QCA, a set of
control variables (FAMILY, SIZE, DEBT, AGE, CAPEX), WACC, and year and firm
effects.
In determining the potential instruments for EXCESS, we follow the law and
finance literature (La Porta et al., 1997; Bozec et al., 2008) and primarily consider the
law variables. La Porta et al. (1997) suggest that ownership concentration is inversely
related to the quality of the protections extended to investors. In their view, investors are
better protected in countries with a common law tradition, compared to those in countries
with a civil law regime. They show that civil law countries exhibit higher levels of
ownership concentration. Although Canada’s legal origin is based on common law
traditions, the province of Quebec is the only civil law jurisdiction in the country.

19
Furthermore, two corporate statutes co-exist in the province of Quebec: the Quebec
Companies Act (QCA), adopted by the Quebec legislator, and the Canada Business
Corporations Act (CBCA), decreed by the federal legislator (Bozec et al. 2008). Both
statutes are available to Quebec firms that want to incorporate their business, but they
differ with respect to the level of legal protection of investors, QCA being perceived as
less protective than CBCA. Bozec et al. (2008) shows that firms from Quebec and,
especially those incorporated under the QCA, exhibit higher levels of ownership
concentration and a more pronounced separation between voting rights and cash flow
rights (EXCESS) than Canadian firms outside Quebec.
Hence, in equation (2b), the parameters β1 (QUEBEC) and β2 (QUEBEC-QCA),
estimate respectively the relationship between legal regime (civil versus common law)
and the law of incorporation (QCA), and EXCESS. Consistent with Bozec et al. (2008),
we expect both QUEBEC and QUEBEC-QCA to be positively associated with EXCESS.
Equation (2b) also includes family ownership (FAMILY), firm size (SIZE), capital
expenditures (CAPEX), firm age (AGE), and leverage (DEBT), since previous studies
(e.g. Bozec et al. 2008; Demsetz and Villalonga, 2001) have shown that these firm-level
controls may have an impact on EXCESS. WACC is added in equation (2b) as an
explanatory variable in order to control for a possible reverse causality. This is consistent
with the view that EXCESS affects WACC which, in turn may determine EXCESS.
Lastly, we also control for year and firm effects in equation (2b).
This system of equations (equations 2a and 2b) allows us to estimate the
association between excess control and WACC while taking into consideration the
endogenous nature of excess control.
20
IV. RESULTS
Descriptive Statistics
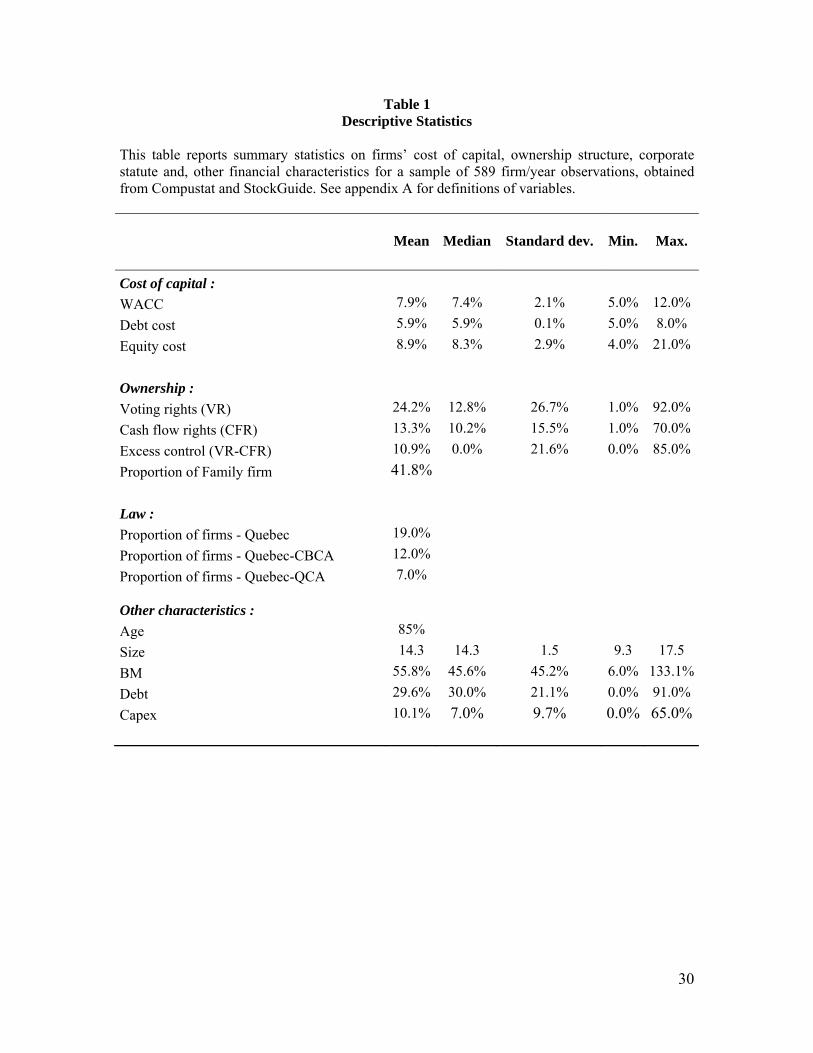
Table 1 reports descriptive statistics for the cost of capital, ownership structure,
law, and firm-specific controls. Table 1 shows that firms’ weighted-average cost of
capital (WACC) is on average 7.9% for the period 2002-2005. Using a sample of
Australian firms, over the period 1994-2003, Pham et al. (2007) report an average of
10%. Table 1 also shows that the average of cost of debt and cost of equity is 5.9% and
8.9% respectively. This is somewhat lower than the cross-country average of cost of
equity (12.7%) reported by Hail and Leuz (2006) for a sample of firms from 40 countries,
between 1992 and 2001.
In terms of ownership structure, our sampled firms display a high level of family
ownership as about 42% of firms are family firms. This statistics is actually 66%
(unreported) if we only consider firms controlled by a dominant shareholder. The
ultimate dominant shareholder holds 24.2% of the voting rights with only 13.3% of the
equity, leading to an average wedge (EXCESS) of 10.9%. Overall, these summary
statistics are quite similar to those of King and Santor (2007) and Bozec et al. (2008) who
also cover Canadian non-financial firms. When comparing with previous cross-country
studies (e.g. La Porta et al., 1999; Faccio and Lang, 2002; Claessens et al., 2000, we note
that the incidence of family ownership and wedge is much more prevalent in Canada than
it is in the U.S., but it is similar to what is observed in most Continental European and
East Asian countries.4
4Faccio and Lang (2002) for instance, find that 48% of European firms are family firms – 71% in France, 69% in Germany and 25% in the UK.

21
Table 1 reports that only 7% of our sampled firms are Quebec firms incorporated
in the province itself (QCA) while 12% of the firms (about 2/3 of Quebec firms) are
incorporated under the federal CBCA corporate law. In terms of firm level controls
(AGE, SIZE, BM, DEBT, and CAPEX), the summary statistics are, once again, broadly
consistent with those of previous Canadian studies.
Insert Table 1 about here
Matrix of Correlation
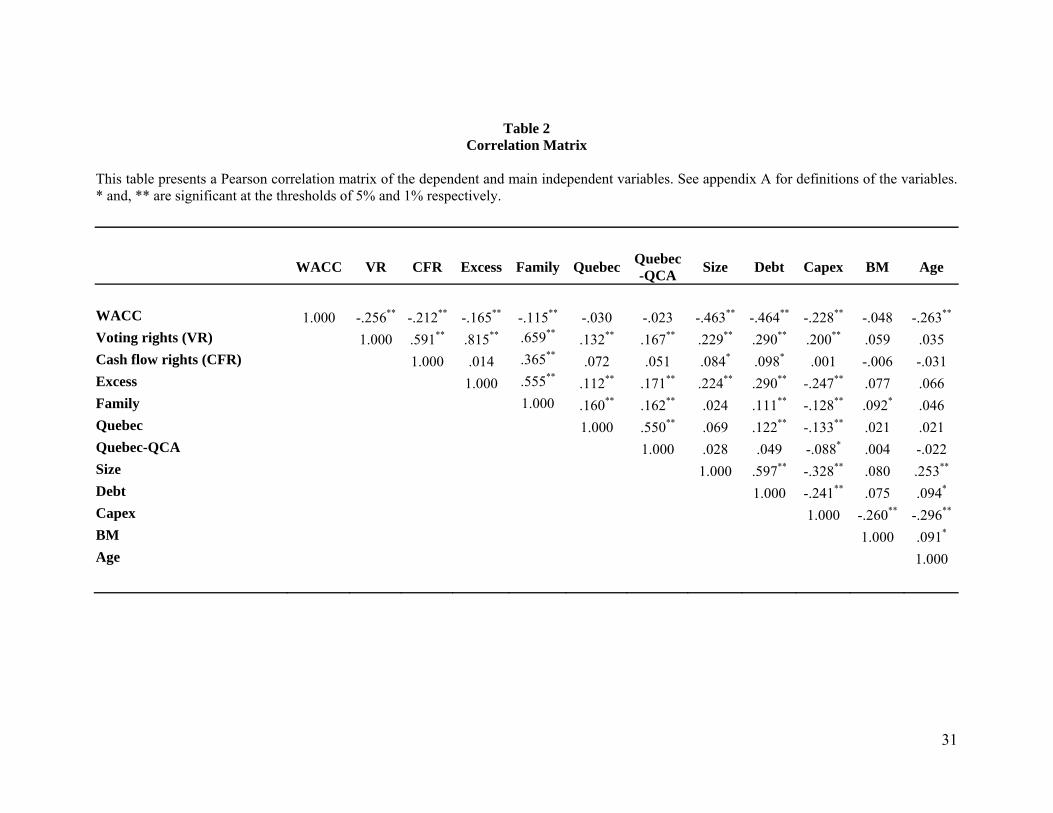
Table 2 reports Pearson’s correlation coefficients between the key variables used
in the empirical analyses. We observe that FAMILIY is highly positively correlated to
each voting rights (VR), cash flow rights (CFR) and EXCESS, consistent with previous
studies showing that ownership concentration, in general, and excess control in particular,
is positively associated with family ownership. Furthermore, these ownership variables
are positively correlated with law variables (QUEBEC and QUEBEC-QCA). This is
consistent with the results obtained by Bozec et al. (2008) on Canadian firms in 1999 and
supports the law and finance theory (La Porta et al. 1998), which argues that both
ownership concentration and excess control are more likely to be observed when there is
less legal investor protection.
Table 2 also shows an unexpected negative correlation between WACC and
EXCESS. However, as expected, DEBT is negatively correlated with WACC but
positively with EXCESS, suggesting that firms where the dominant shareholder’s voting
rights exceed the cash flow rights are more leveraged and thus exhibit a lower cost of
22
capital.5 These preliminary results highlight the need to control for the level of debt when
testing the relationship between WACC and EXCESS. Lastly, and as expected, WACC is
negatively correlated to SIZE, AGE, and BM, as generally shown in previous studies
(e.g. Pham et al. 2007).
Insert Table 2 about here
Multivariate Analysis
Our empirical tests examine the relationship between EXCESS and WACC using
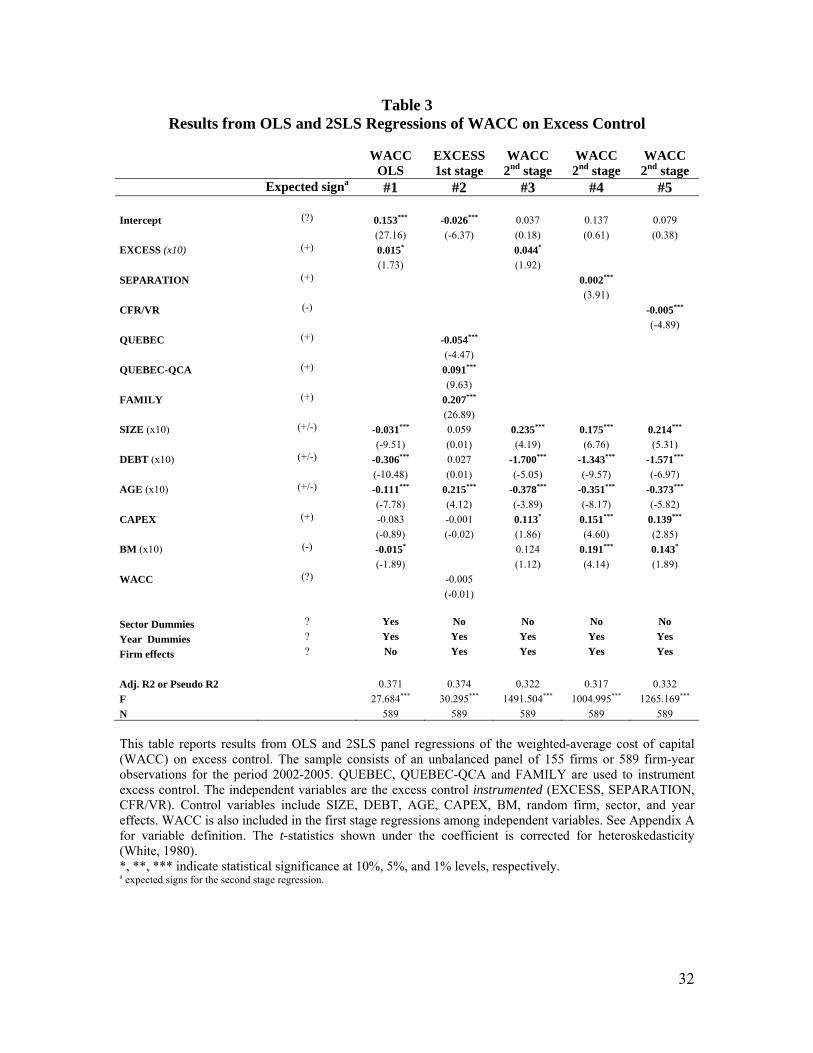
first an ordinary least squares (OLS) regression on the pooled sample period 2002-2005.
The results are reported in first column of Table 3. EXCESS displays a positive and
marginally statistically significant coefficient (p < 0.10), while controlling firm-level
control that potentially influence WACC. This result suggests that the firm’s weighted-
average cost of capital rises as the excess control of the dominant shareholder increases.
Furthermore, the results show that cost of capital decreases with firm size, leverage, and
age. The coefficients for SIZE, DEBT, and AGE are negative and statistically significant
(p < 0.01). BM also displays a weakly significant negative coefficient.
Insert Table 3 about here
OLS estimates could be biased and inconsistent in the presence of endogeneity.
To increase the robustness of our results, we use a two-stage least squares procedure
5 Indeed, in an unreported t-test of mean difference, we observe that firms with excess control have an average debt ratio of 39%, which is statistically different from the average of 26% observed for the subsample of firms without excess. Given that the cost of debt is inferior to the cost of equity (see table 1), high leveraged firms may have lower WACC.
23
(2SLS). The second column of Table 3 displays the results of the first stage regression
where EXCESS is regressed on the determinants including law variables (equation 2b).
We notice that together these factors explain about 37% of the variability of excess
control and that our regression model is robust (F-statistic is 30.295, p < 0.01) which is
indicative of the instruments validity. We also note that the QUEBEC-QCA coefficient is
positive and statistically different from zero (p < 0.01), suggesting that in firms
incorporated under QCA, the dominant shareholder’s excess control is likely to be higher
than in firms located outside Quebec. This is consistent with the results obtained by
Bozec et al. (2008). However, the QUEBEC dummy variable displays a statistically
significant negative coefficient. This result suggests that Quebec firms incorporated
under the more protective CBCA law have lower levels of excess control than firms
outside Quebec. In addition to the law variables, we observe a strong positive relationship
between FAMILY, AGE and EXCESS. As expected, and consistent with the corporate
ownership literature, excess control is largely associated with family ownership. Excess
control is also more likely to be observed in older firms. Lastly, none of the other
determinants (SIZE, DEBT, CAPEX, and WACC) appears to be significantly related to
EXCESS at conventional levels.
The next three columns of Table 3 report the second stage results (equation 2a).
Consistent with the OLS results, the coefficient for EXCESS (column 3) is positive and
statistically significant at conventional levels (p < 0.10). Furthermore, when using
additional metrics for EXCESS (columns 4 and 5), we still observe a positive association
between WACC and excess control. The positive (negative) coefficient for
24
SEPARATION (CFR/VR) is statistically significant at the 1% level, suggesting that,
overall, excess control is positively associated with WACC.
As for the control variables, DEBT and AGE are still displaying a negative
coefficient across all models. SIZE becomes positive, indicating that larger firms have
higher cost of capital. However, these results may potentially reflect multicollinearity
between SIZE, DEBT and AGE. Table 3 also reports a positive coefficient for CAPEX
and BM. These results suggest that firms with highly risky investments such as R&D
investments (CAPEX) or low growth opportunities (BM) are more likely to have higher
returns required from them.
Robustness Checks
To check the robustness of our results, we conduct the following two additional
tests. First, since ownership concentration itself might involve large agency costs, one
can argue that the positive relationship between EXCESS and WACC shown in Table 3
might reflect in part the incidence of ownership concentration. In order to control for this
factor, we re-run our 2SLS panel regressions using the controlling shareholder’s cash
flow rights (CFR) as an additional explanatory variable. In unreported results, we obtain
qualitatively similar regression results. The coefficient for EXCESS is still positive
whereas CFR is negative, consistent with the incentive effect reported by Claessens et al.
(2002) and La Porta et al. (2002).
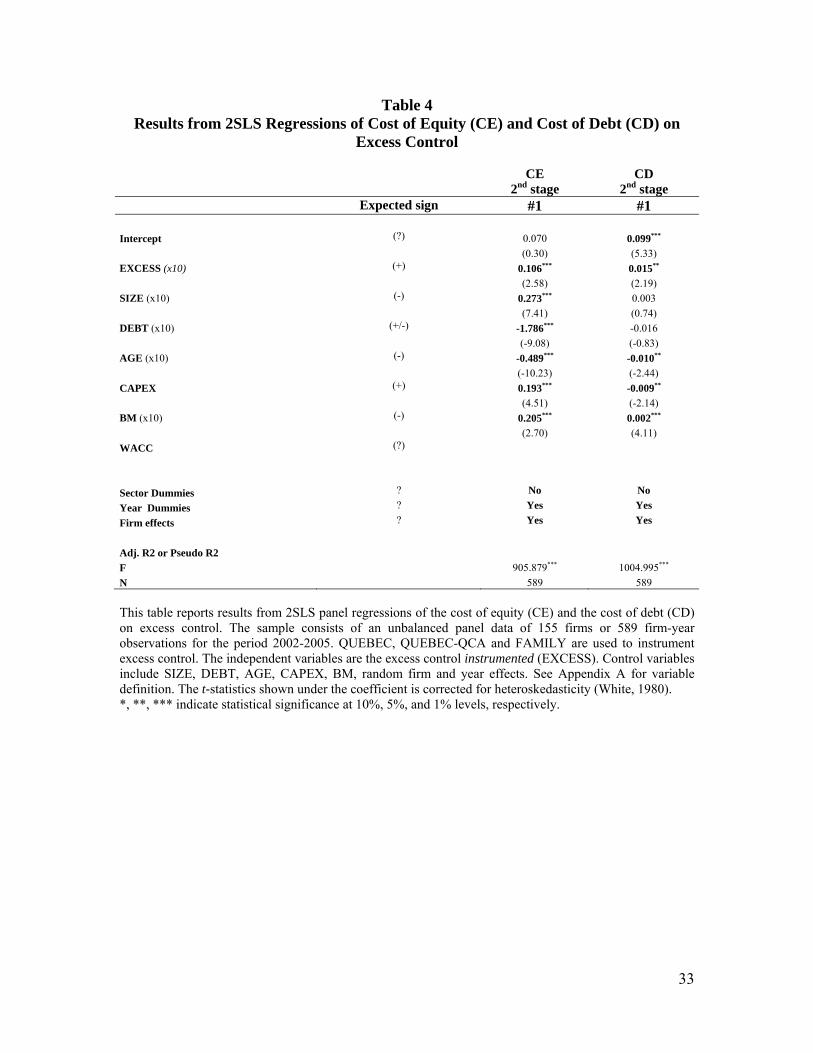
Second, we rerun our 2SLS panel regressions using as dependent variables the
two main components of WACC, that is, the cost of equity (CE) and the cost of debt
(CD). Second stage results are reported in Table 4. Results show that the cost of equity

25
and the cost of debt are both positively associated with EXCESS. These results suggest
that firms with excess control tend to have higher cost of equity and cost of debt. These
results are in line with Guedhami and Mishra (2007) who find a positive relationship
between cost of equity and excess control for a sample of firms from 8 Asian and 13
Western European countries.
Insert Table 4 about here
V. CONCLUSION
The objective of this study is to further investigate the excess control-performance
relationship while proposing an alternative approach: investigating the link between
excess control and firms’ weighted-average cost of capital (WACC). Prior work
predominantly used Tobin’s Q as a proxy for firm value or performance. In this study, we
argue that excess control is likely to have a more direct relationship with cost of capital
than with Tobin’s Q mainly because the assumed link between excess control and weak
governance is not always verified.
We investigate the association between excess control and the cost of capital
using a sample of 155 Canadian firms comprising the S&P/TSX index, over a four-year
period from 2002 and 2005. Our results show a positive relationship between excess
control and WACC, suggesting that the firms’ cost of capital increases with the wedge
between the controlling shareholders’ voting rights and cash flow rights (excess control).
Canadian firms whose controlling shareholders enjoy excess control have higher WACC.
These findings are robust to the use of alternative econometrics techniques including
OLS regressions and panel regressions combining instrumental variables and firm effects.
26
Our results shed some more light on the complex relationships between
ownership, excess control and the firms’ overall performance. As higher costs are likely
to have a negative effect on performance, the positive association between excess control
and WACC could partly explain the negative association between excess control and the
various proxies for firm performance that have been used in many previous studies. Also,
since slightly higher WACC is not likely to heavily plague a firm that is well governed by
a solid entrepreneur who implements and follows a sound long-term strategy, our results
are also consistent with the view of those who argue that the group of firms with excess
control is a mixed bag of poorly and strongly performing firms. In other words, for these
entrepreneurs, higher WACC could be a relatively small price to pay in order to escape
the tyranny of short-term results, often pursued at the expense of longer-term benefits.
A last but, in our view, interesting result of our study is the one showing that a
law regime that offers less protection to minority shareholders is positively associated
with excess control and, therefore, also positively associated with WACC. This result
confirms that the price to pay in order to favor guaranteed ownership, i.e. higher firm
WACC, could be widespread in an economy that offers less protection to minority
shareholders.

27
REFERENCES
Allaire, Yvan and Mihaela Firsirotu (2009). Black Markets… and Business Blues. Montréal: FI Press.
Altman, Edward I. (1968). Financial Ratios, Discriminant Analysis and the Prediction of Corporate Bankruptcy. Journal of Finance, 189–209.
Ashbaugh, H, D. W. Collins & R. Lafond. (2004). Corporate Governance and the Cost of Equity Capital. SSRN working paper.
Baek, J-S., Kang, J.K., & Park, K.S. (2004). Corporate Governance and Firm Value: Evidence from the Korean Financial Crisis. Journal of Financial Economics, 71, 265-313. Barontini, R. & Caprio, L. (2006). The Effect of Ownership Structure and Family Control on Firm Value: Evidence from Continental Europe. European Financial Management, 12, 689-723. Bebchuk, L., Kraakman, R., & Triantis, G. (2000). Stock Pyramids, Cross-Ownership, and Dual Class Equity: The Creation and Agency Cost of Separating Control from Cash Flow Rights. In Randall K. Morck (Ed.), Concentrated Corporate Ownership Chicago, II: University of Chicago Press, 295-315. Bierman, Harold Jr, (1993). Capital Budgeting in 1992: A Survey. Financial Management, Fall 1992, 24.
Bhojraj, Sanjeev and Partha Sengupta (2003). Effect of Corporate Governance on Bond Ratings and Yields: The Role of Institutional Investors and Outside Directors. Journal of Business, 76(3), 455-75.
Booth, Lawrence. (2001). Equity Market Risk Premiums in the U.S. and Canada. Canadian Investment Review, Fall 2001, 34-43.
Bozec, Y and C. Laurin (2004). Concentration des droits de propriété, séparation entre participation au capital et contrôle des votes et performance opérationnelle des sociétés: une étude canadienne. Finance, contrôle, stratégie,Vol. 7, No. 2, 123-64. Bozec, Y. and C. Laurin. (2008). Large Shareholder Entrenchment and Performance: Empirical Evidence from Canada. Journal of Business Finance and Accounting, 35(1), 25-49. Bozec, Y, Rousseau, S. & Laurin, L. (2008). Law of Incorporation and Firm Ownership Structure: The Law and Finance Theory Revisited. International Review of Law and Economics, 28(2), 140-149.
28
Bruner, Robert F., Kenneth M. Eades, Robert S. Harris, and Robert C.Higgins. (1998). Best Practices in Estimating the Cost of Capital: Survey and Synthesis. Financial Practice and Education, Spring/Summer, 13-28.
Claessens, S., Djankov, S., & Lang, L. (2000). The Separation of Ownership and Control in East Asia Corporations. Journal of Financial Economics, 58, 81-112. Claessens, S., Djankov, S., Fan, J. & Lang, L. (2002). Disentangling the Incentive and Entrenchment Effects of Large Shareholdings. Journal of Finance, 57, 2741-2771. Cronqvist, H., & Nilsson, M. (2003). Agency Costs of Controlling Minority Shareholders. Journal of Financial and Quantitative Analysis, 38, 695-719. Da, Zhi, Re-Jin Guo, and Ravi Jagannathan. (2009). CAPM for Estimating the Cost of Equity Capital; Interpreting the Empirical Evidence. SSRN working paper.
Demsetz, H. & Lehn, K. (1985). The Structure of Corporate Ownership: Causes and Consequences. Journal of Political Economy, 93, 1155-1177. Demsetz, H. & Villalonga, V. (2001). Ownership Structure and Corporate Performance. Journal of Corporate Finance, 209-233. Elston, J. A & L. Rondi. (2005). Shareholder Protection and the Cost of Capital: Evidence from German and Italian Firms. SSRN working paper.
Faccio, M. & Lang, L.H.P. (2002). The Ultimate Ownership of Western European Corporations. Journal of Financial Economics, 65, 365-395. Fama, Eugene F., and Kenneth R. French. (1992). The Cross Section of Expected Stock Returns. Journal of Finance, 47, 427-465.
Fama, Eugene F., and Kenneth R. French. (2002). The Equity Premium. Journal of Finance, 57(2), 637-659.
Gompers, P., J. Ishii and A. Metrick. (2008). Extreme Governance: An Analysis of Dual-Class Firms in the United States. Working paper available on the Social Science Research Network, Electronic Library at: www.ssrn.com. Graham, John R., and Campbell R. Harvey. (2001). The Theory and Practice of Corporate Finance: Evidence from the Field. Journal of Financial Economics, 60, 187-243.
Graham, John R., and Campbell R. Harvey. (2005). The Long-Run Equity Risk Premium. Finance Research Letters, 2, 185-194.
Guedhami, O & D. Mishra. (2007). Excess Control, Corporate Governance, and the Implied Cost of Equity: International Evidence. SSRN working paper.
29
Himmelberg, C., Hubbard, R., and I. Love. (2003). Investment, Protection, Ownership and the Cost of Equity Capital. National Bank of Belgium, working paper. Himmelberg, C., Hubbard, R., and D. Palia, D. (1999). Understanding the determinants of managerial ownership and the link between ownership and performance. Journal of Financial Economics 53, 353-384. Hail, L. & Leuz, C. (2006). International Differences in the Cost of Equity Capital: Do Legal Institutions and Securities Regulation Matter? Journal of Finance, 2, 435-470. Jagannathan, Ravi, Ellen R. McGrattan, and Anna Scherbina. (2000). The Declining U.S. Equity Premium. Federal Reserve Bank of Minneapolis Quarterly Review, 3-19.
Joh, S.W. (2003). Corporate Governance and Firm Profitability: Evidence from Korea before the Economic Crisis. Journal of Financial Economics, 68(2), 287-322. Khalil, Samer and Michel L. Magnan. (2009). Dual Class Shares Structures: Entrenchment pr Alignment? Further Evidence from Firms Eliminating Dual Class Shares. Working paper, Concordia University. King, M.R & Santor, E. (2007). Family Values: Ownership Structure, Performance and Capital Structure of Canadian Firms. Working paper 0740 (Bank of Canada), 32 pages. La Porta, R., Lopez-de-Silanes, F., & Shleifer, A. (1999). Corporate Ownership around the World. Journal of Finance, 54(2), 471-518. La Porta, R., Lopez-de-Silanes, F., Shleifer, A., & Vishny, R. (2002). Investor Protection and Corporate Valuation, Journal of Finance, LVII(3), 1147-1170.
La Porta, R., Lopez-de-Silanes, F., Shleifer, A., & Vishny, R. (1998). Law and Finance. Journal of Political Economy, 106(6), 1113-1155. Meier, Iwan, and Vefa Tarhan. (2007). Corporate Investment Decision Practices and the Hurdle Rate Premium Puzzle. SSRN working paper. Pham, P.K., J.A. Suchard and J. Zein. (2007). Corporate Governance, Cost of Capital and Performance: Evidence from Australian Firms. Working Paper available on the Social Science Research Network, Electronic Library at: www.ssrn.com. Villalonga, B. & Amit, R. (2006). How Do Family Ownership, Control, and Management Affect Firm Value? Journal of Financial Economics, 80, 385-417. Welch, Ivo. (2008). The Consensus Estimate for the Equity Premium by Academic Financial Economists in December 2007. Working paper, Brown University.
30
Table 1 Descriptive Statistics
This table reports summary statistics on firms’ cost of capital, ownership structure, corporate statute and, other financial characteristics for a sample of 589 firm/year observations, obtained from Compustat and StockGuide. See appendix A for definitions of variables.
Mean
Median Standard dev. Min. Max.
Cost of capital : WACC 7.9% 7.4% 2.1% 5.0% 12.0%
Debt cost 5.9% 5.9% 0.1% 5.0% 8.0%
Equity cost 8.9% 8.3% 2.9% 4.0% 21.0%
Ownership : Voting rights (VR) 24.2% 12.8% 26.7% 1.0% 92.0%
Cash flow rights (CFR) 13.3% 10.2% 15.5% 1.0% 70.0%
Excess control (VR-CFR) 10.9% 0.0% 21.6% 0.0% 85.0%
Proportion of Family firm 41.8%
Law :
Proportion of firms - Quebec 19.0%
Proportion of firms - Quebec-CBCA 12.0%
Proportion of firms - Quebec-QCA 7.0% Other characteristics :
Age 85%
Size 14.3 14.3 1.5 9.3 17.5
BM 55.8% 45.6% 45.2% 6.0% 133.1%
Debt 29.6% 30.0% 21.1% 0.0% 91.0%
Capex 10.1% 7.0% 9.7% 0.0% 65.0%
31
Table 2 Correlation Matrix
This table presents a Pearson correlation matrix of the dependent and main independent variables. See appendix A for definitions of the variables. * and, ** are significant at the thresholds of 5% and 1% respectively.
WACC VR CFR Excess Family Quebec Quebec-QCA
Size Debt Capex BM Age
WACC 1.000 -.256** -.212** -.165** -.115** -.030 -.023 -.463** -.464** -.228** -.048 -.263**
Voting rights (VR) 1.000 .591** .815** .659** .132** .167** .229** .290** .200** .059 .035 Cash flow rights (CFR) 1.000 .014 .365** .072 .051 .084* .098* .001 -.006 -.031 Excess 1.000 .555** .112** .171** .224** .290** -.247** .077 .066
Family 1.000 .160** .162** .024 .111** -.128** .092* .046 Quebec 1.000 .550** .069 .122** -.133** .021 .021 Quebec-QCA 1.000 .028 .049 -.088* .004 -.022 Size 1.000 .597** -.328** .080 .253** Debt 1.000 -.241** .075 .094* Capex 1.000 -.260** -.296**
BM 1.000 .091* Age 1.000
32
Table 3 Results from OLS and 2SLS Regressions of WACC on Excess Control
WACC EXCESS WACC WACC WACC OLS 1st stage 2nd stage 2nd stage 2nd stage Expected signa #1 #2 #3 #4 #5
Intercept (?) 0.153*** -0.026*** 0.037 0.137 0.079
(27.16) (-6.37) (0.18) (0.61) (0.38)
EXCESS (x10) (+) 0.015* 0.044*
(1.73) (1.92)
SEPARATION (+) 0.002***
(3.91)
CFR/VR (-) -0.005***
(-4.89)
QUEBEC (+) -0.054***
(-4.47)
QUEBEC-QCA (+) 0.091***
(9.63)
FAMILY (+) 0.207***
(26.89)
SIZE (x10) (+/-) -0.031*** 0.059 0.235*** 0.175*** 0.214***
(-9.51) (0.01) (4.19) (6.76) (5.31)
DEBT (x10) (+/-) -0.306*** 0.027 -1.700*** -1.343*** -1.571***
(-10.48) (0.01) (-5.05) (-9.57) (-6.97)
AGE (x10) (+/-) -0.111*** 0.215*** -0.378*** -0.351*** -0.373***
(-7.78) (4.12) (-3.89) (-8.17) (-5.82)
CAPEX (+) -0.083 -0.001 0.113* 0.151*** 0.139***
(-0.89) (-0.02) (1.86) (4.60) (2.85)
BM (x10) (-) -0.015* 0.124 0.191*** 0.143*
(-1.89) (1.12) (4.14) (1.89)
WACC (?) -0.005
(-0.01)
Sector Dummies ? Yes No No No No
Year Dummies ? Yes Yes Yes Yes Yes
Firm effects ? No Yes Yes Yes Yes
Adj. R2 or Pseudo R2 0.371 0.374 0.322 0.317 0.332
F 27.684*** 30.295*** 1491.504*** 1004.995*** 1265.169***
N 589 589 589 589 589
This table reports results from OLS and 2SLS panel regressions of the weighted-average cost of capital (WACC) on excess control. The sample consists of an unbalanced panel of 155 firms or 589 firm-year observations for the period 2002-2005. QUEBEC, QUEBEC-QCA and FAMILY are used to instrument excess control. The independent variables are the excess control instrumented (EXCESS, SEPARATION, CFR/VR). Control variables include SIZE, DEBT, AGE, CAPEX, BM, random firm, sector, and year effects. WACC is also included in the first stage regressions among independent variables. See Appendix A for variable definition. The t-statistics shown under the coefficient is corrected for heteroskedasticity (White, 1980). *, **, *** indicate statistical significance at 10%, 5%, and 1% levels, respectively. a expected signs for the second stage regression.
33
Table 4 Results from 2SLS Regressions of Cost of Equity (CE) and Cost of Debt (CD) on
Excess Control
CE CD 2nd stage 2nd stage Expected sign #1 #1
Intercept (?) 0.070 0.099***
(0.30) (5.33)
EXCESS (x10) (+) 0.106*** 0.015**
(2.58) (2.19)
SIZE (x10) (-) 0.273*** 0.003
(7.41) (0.74)
DEBT (x10) (+/-) -1.786*** -0.016
(-9.08) (-0.83)
AGE (x10) (-) -0.489*** -0.010**
(-10.23) (-2.44)
CAPEX (+) 0.193*** -0.009**
(4.51) (-2.14)
BM (x10) (-) 0.205*** 0.002***
(2.70) (4.11)
WACC (?)
Sector Dummies ? No No Year Dummies ? Yes Yes Firm effects ? Yes Yes
Adj. R2 or Pseudo R2
F 905.879*** 1004.995***
N 589 589
This table reports results from 2SLS panel regressions of the cost of equity (CE) and the cost of debt (CD) on excess control. The sample consists of an unbalanced panel data of 155 firms or 589 firm-year observations for the period 2002-2005. QUEBEC, QUEBEC-QCA and FAMILY are used to instrument excess control. The independent variables are the excess control instrumented (EXCESS). Control variables include SIZE, DEBT, AGE, CAPEX, BM, random firm and year effects. See Appendix A for variable definition. The t-statistics shown under the coefficient is corrected for heteroskedasticity (White, 1980). *, **, *** indicate statistical significance at 10%, 5%, and 1% levels, respectively.
34
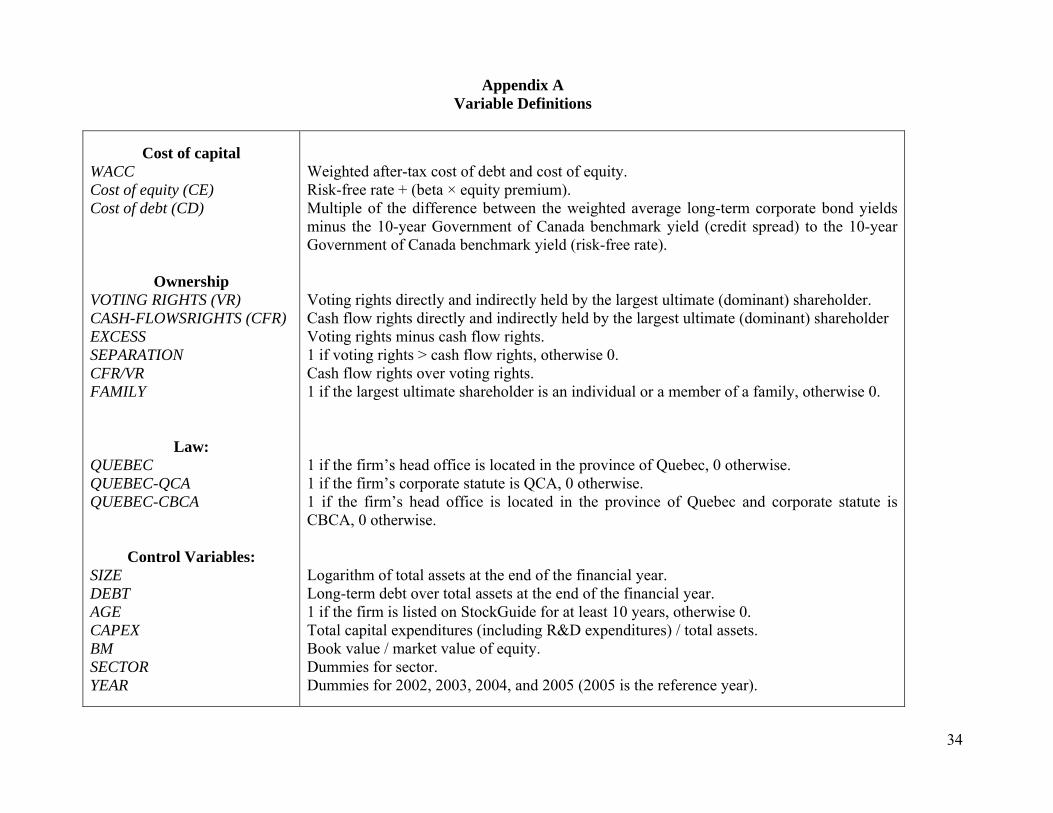
Appendix A Variable Definitions
Cost of capital WACC Cost of equity (CE) Cost of debt (CD)
Ownership VOTING RIGHTS (VR) CASH-FLOWSRIGHTS (CFR) EXCESS SEPARATION CFR/VR FAMILY
Law: QUEBEC QUEBEC-QCA QUEBEC-CBCA
Control Variables: SIZE DEBT AGE CAPEX BM SECTOR YEAR
Weighted after-tax cost of debt and cost of equity. Risk-free rate + (beta × equity premium). Multiple of the difference between the weighted average long-term corporate bond yields minus the 10-year Government of Canada benchmark yield (credit spread) to the 10-year Government of Canada benchmark yield (risk-free rate). Voting rights directly and indirectly held by the largest ultimate (dominant) shareholder. Cash flow rights directly and indirectly held by the largest ultimate (dominant) shareholder Voting rights minus cash flow rights. 1 if voting rights > cash flow rights, otherwise 0. Cash flow rights over voting rights. 1 if the largest ultimate shareholder is an individual or a member of a family, otherwise 0. 1 if the firm’s head office is located in the province of Quebec, 0 otherwise. 1 if the firm’s corporate statute is QCA, 0 otherwise. 1 if the firm’s head office is located in the province of Quebec and corporate statute is CBCA, 0 otherwise. Logarithm of total assets at the end of the financial year. Long-term debt over total assets at the end of the financial year. 1 if the firm is listed on StockGuide for at least 10 years, otherwise 0. Total capital expenditures (including R&D expenditures) / total assets. Book value / market value of equity. Dummies for sector. Dummies for 2002, 2003, 2004, and 2005 (2005 is the reference year).