"te veré volar en la ciudad de la furia"
TRANSCRIPT

“Te veré volar en la ciudad de la furia”Movilidad Urbana
y Data Science
Eduardo Graells-GarridoData Science Institute
Universidad del Desarrollo& Telefonica R&D Fellow
Joint work with Oscar Peredo and José GarcíaTelefonica R&D Chile
Diego Sáez-TrumperEURECAT, Barcelona
July 28th, 2016. Universidad del Desarrollo


Our own version of the Furious City...
Measuring and Understanding Mobility
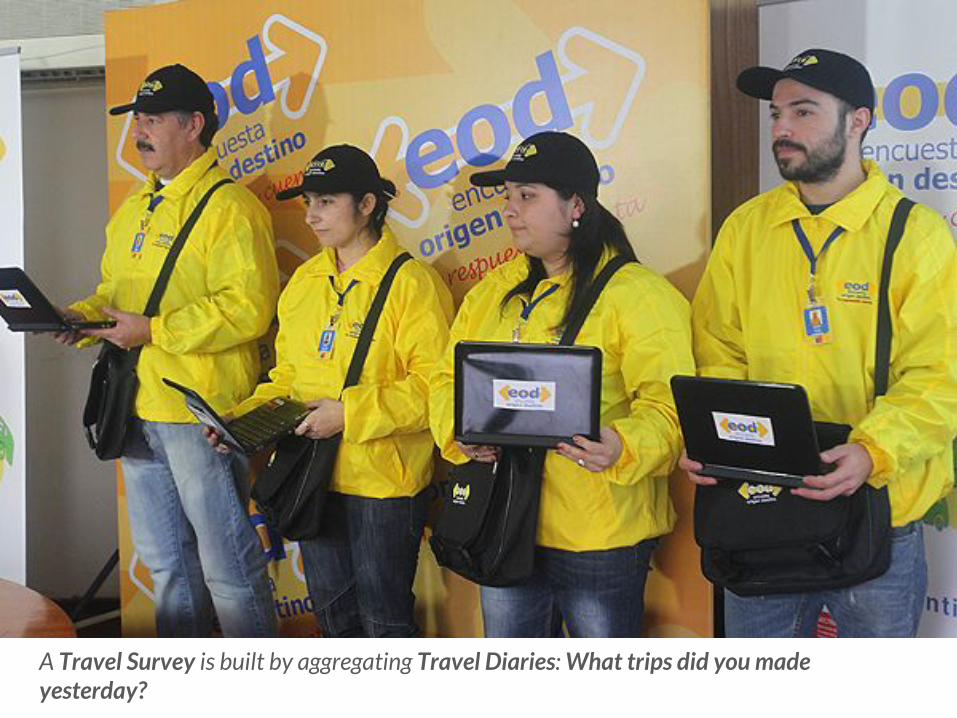
A Travel Survey is built by aggregating Travel Diaries: What trips did you made yesterday?

OD Matrix betweenMunicipalities in Santiago,Aggregated from the Travel Diaries of the Survey(2012)

Trip Start TimesUsage peaks are evident (good)
Trip DurationSelf-reported limitations are evident at 15 minute intervals (not good)

Problems
Cities change faster than the frequency of surveys (10 years!)
Self-reported surveys have many drawbacks (expensive -time and money-, sampling, etc.).
Demand is predicted by ad-hoc surveys and closed/outdated models (e.g., Transantiago)

Mobile Data from Telecommunication Companies

I like to see mobile data as lights in the night.
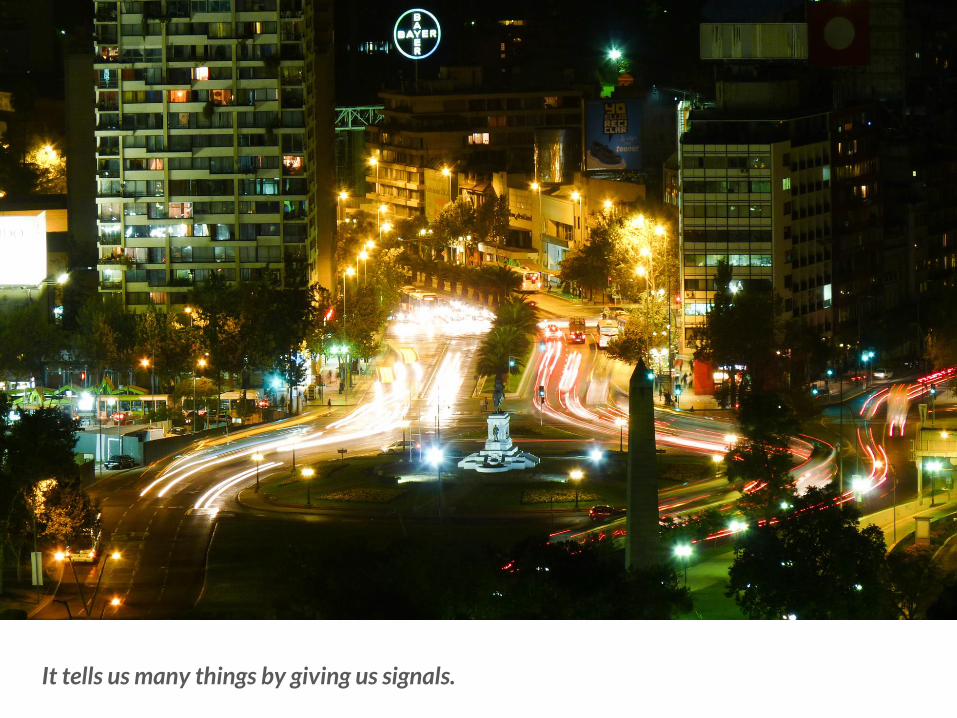
It tells us many things by giving us signals.

In Chile, there are 132 mobile subscriptions per 100 inhabitants. That means that there are lots of signals!

Call Detail RecordsUsed by telecommunications companies to bill customers. They are cheap to obtain (for companies!).
They have been used widely to study human mobility and transport patterns(see our paper for references).
Source: Yves-Alexandre de Montjoye et. al, "Unique in the Crowd: The privacy bounds of human mobility." Scientific Reports

We work with designated zones by urban planners (like Calabrese et al.). These zones are used on the Travel Survey.
This map shows the coverage by Telefónica’s network in Santiago (urban areas)

OD Matrix and Trip Characteristics in Santiago, Chile

Trips
Non-Trips

Reconstructed peaks. One day is anomalous!(it was an important soccer match)
Many days are similar, but two days are anomalous!(it was a public transportation strike - longer commuting times!)
Results of applying the algorithm to all days on the dataset, on a random sample of 35.000 devices per day. (note: OD Survey covers 40.000 people)
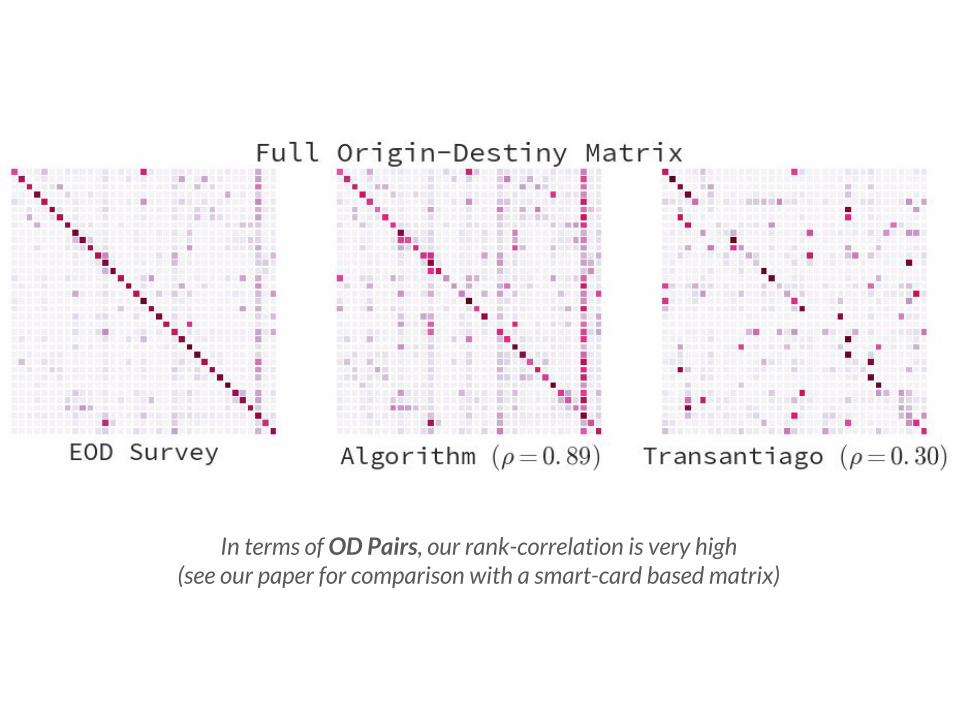
In terms of OD Pairs, our rank-correlation is very high(see our paper for comparison with a smart-card based matrix)

Counting Connections to infer Land Use Patterns

A normal day on the fury city: June 1st, 2015.


A not so normal day on the fury city: June 29th, 2015 (purple). What happened that day?

Places with activity BEFORE working hours
Places with activity AFTER working hours
Business Districts / University Districts
Residential areas (“Dormitory”)
Transition Places between dormitory and non-dormitory areas


Conclusions
Mobile data allows us to model urban mobility at a fraction of the costs of traditional methods...
...and with greater granularity:- Time: how to compare two+ days?
- Space: we can analyze mobility and land use at smaller spatial units than municipalities.
Next steps: use this knowledge to move from the furious city to the happy city.

What are the effects on transportation of unexpected phenomena?How to improve transport flows on these events?
Thank you! Questions?Eduardo [email protected]://carnby.github.io / http://datagramas.cl@carnby
Papers:Graells-Garrido, E.; Peredo, O.; García, (2016, July). Sensing Urban Patterns with Antenna Mappings: The Case of Santiago, Chile. Sensors 2016, 16, 1098. (ISI)
Graells-Garrido, E., Saez-Trumper, D. (2016, May). A Day of Your Days: Estimating Individual Daily Journeys Using Mobile Data to Understand Urban Flow. In Proceedings of the 2nd International Conference on IoT on
the Urban Space. ACM.
Acknowledgements: Anonymous Reviewers, Dani Pajarito, and the following photo sources:https://www.flickr.com/photos/nhojleunamme/6922749700https://www.flickr.com/photos/javoalfaro2/14878702959https://www.flickr.com/photos/danieldiazvera/13996150536https://commons.wikimedia.org/wiki/File:Bandera_Gigante,_partido_Chile_-_Uruguay,_Copa_Am%C3%A9rica_Chile_2015.jpghttps://www.flickr.com/photos/pintamono/2112134295https://www.flickr.com/photos/carlosreusser/10046962135
http://www.lanacion.cl/noticias/site/artic/20140813/imag/foto_0000005320140813095558.jpghttp://www.t13.cl/noticia/nacional/intendencia-suspende-clases-tarde-del-jueves-providencia-y-santiagohttp://www.emol.com/noticias/Nacional/2016/06/09/806917/Fotos-Santiaguinos-difunden-imagenes-de-la-inundacion-que-afecta-a-Providencia.html