piramides de població
TRANSCRIPT

Estadística del Padrón Continuo a 1 de enero de 2013. Datos por municipios
03.- Alicante/Alacant
Población por sexo, municipios y edad (grupos quinquenales).
Unidades:personas
Hombres Mujeres %VARONES %MUJERES
0-4 574 602 -1.7315756131 1.8160427162
5-9 715 653 -2.1569278108 1.9698935111
10-14 799 785 -2.41032912 2.3680955685
15-19 834 760 -2.5159129989 2.2926785122
20-24 796 759 -2.4012790733 2.2896618299
25-29 779 759 -2.349995475 2.2896618299
30-34 1070 973 -3.2278500106 2.935231832
35-39 1094 1045 -3.3002503846 3.1524329542
40-44 1161 1170 -3.5023680956 3.5295182358
45-49 1247 1210 -3.7618027693 3.650185526
50-54 1129 1152 -3.4058342635 3.4752179553
55-59 980 1064 -2.9563486078 3.209749917
60-64 1038 1179 -3.1313161785 3.5566683761
65-69 1312 1329 -3.9578871158 4.009170714
70-74 1133 1108 -3.4179009925 3.3424839362
75-79 809 799 -2.4404959426 2.41032912
80-84 566 592 -1.7074421551 1.7858758937
85-89 354 395 -1.0679055175 1.1915894899
90-94 143 174 -0.4313855622 0.524902712
95-99 38 63 -0.1146339256 0.1900509819
100 y más 1 6 -0.0030166823 0.0181000935
Total 16572 16577
TOTAL V+M 33149
0-4
10-14
20-24
30-34
40-44
50-54
60-64
70-74
80-84
90-94
100 y más
-5 -4 -3 -2 -1 0 1 2 3 4 5
PIRÀMIDE DE POBLACIÓ
Xàbia (Alacant) 2013
%VARONES
%MUJERES

Estadística del Padrón Continuo a 1 de enero de 2013. Datos por municipios
03.- Alicante/Alacant
Población por sexo, municipios y edad (grupos quinquenales).
Unidades:personas

Dénia
Página 4
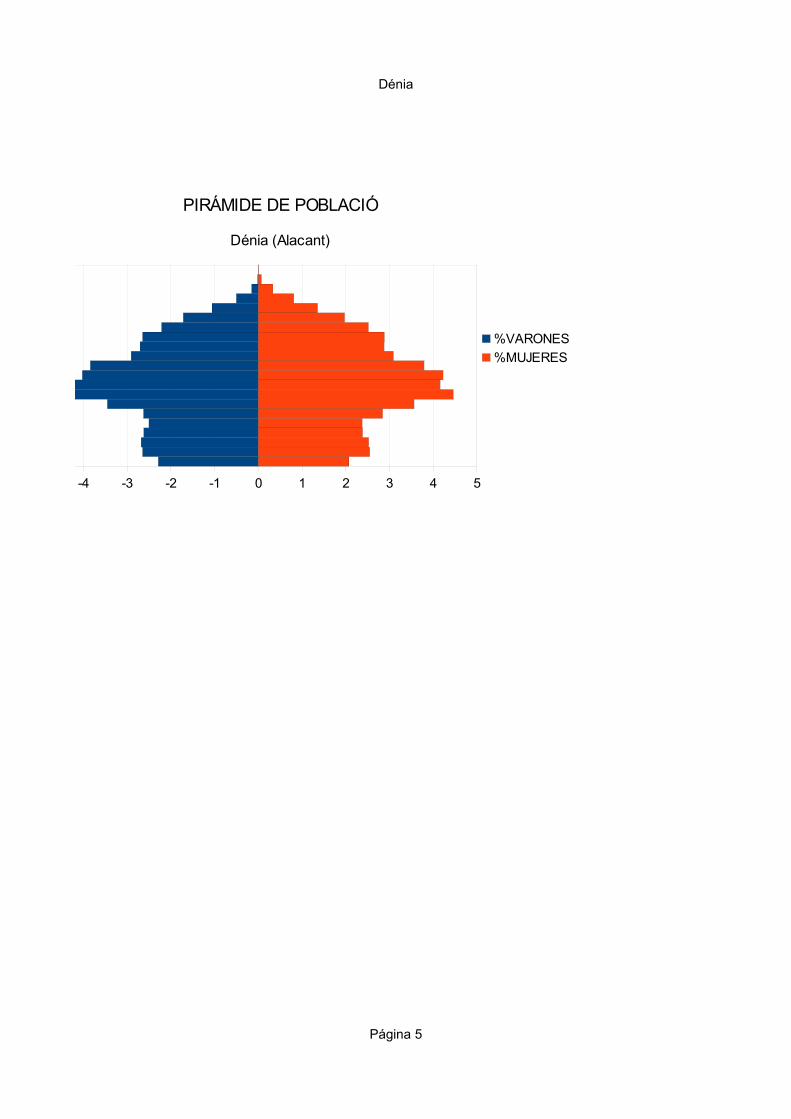
Población por sexo, municipios y edad (grupos quinquenales).
Unidades:personas
Hombres Mujeres %VARONES %MUJERES
0-4 1017 922 -2.287964 2.07424072
5-9 1177 1133 -2.64791901 2.548931384
10-14 1192 1122 -2.68166479 2.524184477
15-19 1165 1059 -2.62092238 2.382452193
20-24 1112 1056 -2.50168729 2.375703037
25-29 1167 1264 -2.62542182 2.843644544
30-34 1535 1583 -3.45331834 3.561304837
35-39 1916 1982 -4.31046119 4.458942632
40-44 1875 1848 -4.21822272 4.157480315
45-49 1789 1878 -4.02474691 4.224971879
50-54 1708 1685 -3.84251969 3.790776153
55-59 1294 1373 -2.91113611 3.088863892
60-64 1203 1279 -2.7064117 2.877390326
65-69 1177 1282 -2.64791901 2.884139483
70-74 983 1119 -2.21147357 2.517435321
75-79 763 877 -1.71653543 1.973003375
80-84 471 602 -1.05961755 1.354330709
85-89 224 360 -0.50393701 0.809898763
90-94 68 148 -0.15298088 0.33295838
95-99 7 30 -0.01574803 0.067491564
100 y más 1 4 -0.00224972 0.008998875
Total 21844 22606
Total V+M 44450
0-4
10-14
20-24
30-34
40-44
50-54
60-64
70-74
80-84
90-94
100 y más
-5 -4 -3 -2 -1 0 1 2 3 4 5
PIRÁMIDE DE POBLACIÓ
Dénia (Alacant)
%VARONES
%MUJERES

Dénia
Página 5
Población por sexo, municipios y edad (grupos quinquenales).
Unidades:personas
0-4
10-14
20-24
30-34
40-44
50-54
60-64
70-74
80-84
90-94
100 y más
-5 -4 -3 -2 -1 0 1 2 3 4 5
PIRÁMIDE DE POBLACIÓ
Dénia (Alacant)
%VARONES
%MUJERES

Alacant
Página 7
03.- Alicante/Alacant
Población por sexo, municipios y edad (grupos quinquenales).
Unidades:personas
Hombres Mujeres %VARONES %MUJERES
0-4 8508 7948 -2.539307331 2.37216915-9 9207 8565 -2.747931664 2.5563196210-14 8428 7834 -2.515430441 2.3381445315-19 8254 7822 -2.463498203 2.3345629920-24 9256 8900 -2.76255626 2.656304125-29 10256 10411 -3.061017394 3.1072788730-34 13434 13115 -4.009526879 3.9143177835-39 15103 14552 -4.507658513 4.3432064340-44 14471 13824 -4.319031076 4.1259267245-49 13157 13285 -3.926853145 3.9650561750-54 11213 12097 -3.3466447 3.6104843455-59 9483 10699 -2.830306937 3.1932356860-64 8346 9604 -2.490956628 2.8664207365-69 7486 8769 -2.234280052 2.6172056970-74 5615 6912 -1.67585927 2.0629633675-79 4785 6715 -1.428136528 2.0041665280-84 3429 5665 -1.02342323 1.6907823385-89 1747 3603 -0.521411602 1.0753554790-94 553 1444 -0.165049007 0.4309778895-99 110 352 -0.032830725 0.10505832100 y más 28 67 -0.008356912 0.0199969Total 162869 172183
Total V+M 335052

Dénia
Página 6
Población por sexo, municipios y edad (grupos quinquenales).
Unidades:personas
Dénia
Página 5
Población por sexo, municipios y edad (grupos quinquenales).
Unidades:personas
0-4
10-14
20-24
30-34
40-44
50-54
60-64
70-74
80-84
90-94
100 y más
-5 -4 -3 -2 -1 0 1 2 3 4 5
PIRÁMIDE DE POBLACIÓ
Dénia (Alacant)
%VARONES
%MUJERES