phd presentation
TRANSCRIPT

Seediscussions,stats,andauthorprofilesforthispublicationat:https://www.researchgate.net/publication/232734552
PhdPresentation
Dataset·November2012
READS
19
Availablefrom:husseinkaraman
Retrievedon:12May2016

RISK AND UNCERTAINTY ASSESSMENT APPLIED TO WATER
QUALITY MANAGEMENT:
A PROBALISTIC DECISION SUPPORT SYSTEM
ByHussein Gamal El Dien Karaman
Researcher AssistantDrainage Research Institute
Under the supervision Of
Prof. Dr. Alla El Zawahry- Faculty of Engineering-Cairo UniversityProf. Dr. Hussam Fahmy- Director of Drainage Research Inst.
Dr. Ahmed Emam- Faculty of Engineering-Cairo University

OUTLINE
• Introduction• Problem Definition• Study Objectives• Literature Review• Proposed Framework• Theoretical Base of the Proposed Framework
– Methodology Rationale– Techniques Used
• Application• Conclusions and Recommendations

INTRODUCTION
• Decision making is the objective of the water resourcesmanagement plans;
• Water quality needs to be managed to provide decisionmakers with information about the present and futurestatus of water quality;
• The National Water Quality Monitoring Network(NWAQMN) was established in the eighteens of the lastcentury;
• The main objective of this network was to monitor thesalinity of the drainage water to fulfill the objectives of thedrainage water reuse project;
• In 1995, the objective of the monitoring network waschanged from monitoring the salinity to monitor the wholewater pollution.

PROBLEM DEFINITION
• The uncertainty in the measured data pose problems tothe decision maker;
• In the case of water quality the uncertainty can be foundon several stages:– Sampling process;– Chemical analysis in the lab;– Reporting process.
• The total number of locations along the Nile Delta isabout 163 locations distributed between the Eastern,Middle and Western Delta;
• Now, the main objective of the monitoring network start tochange from measuring only one variable to measuremore than 46 water quality variables;

STUDY OBJECTIVES
• The main goal of this research is to:-
– Construct a logical framework in the water qualitymanagement process to reflect the stochastic nature ofwater quality to efficiently produce the needed information.

STUDY OBJECTIVES (Cont.)
• The secondary objectives of this research is to:-
– Reduce the number of monitoring points on a drain
catchment selected for the study;
– Construct water quality variants representing several water
quality categories such as (salinity category, Biological
category, Nutrients category…etc) to reduce the efforts in
analyzing each water quality variable solely;
– Dealing with the uncertainty in the historical and predicted
data for each water quality variants.

LETREATURE REVIEW

WATER QUALITY MODELS WITH UNCERTAINTY
• Tung (1996) reviews the application of uncertaintyanalysis in water quality modeling
• Tung identifies two types of uncertainties:– Uncertainty due to inherent randomness of an event;– Uncertainties associated with a lack of complete knowledge
about model processes, parameters, and data uncertainties.

SOURCES OF NOISE
• Timmerman et al., (1996) describe the following data limitations as sources of noise:– Missing values:– Sampling frequencies that change over the period of record– Multiple observations within one sampling period– Uncertainty in the measurement procedures– Censored data– Small sample sizes– Outliers– Problems related to quality of data– Problems related to data presentation

WATER QUALITY MONITORING
• The systematic (or coordinated) operation of the network
is realized by the selection of three basic factors:
– Sampling sites
– Sampling frequencies
– Variables to be sampled
(Harmancioglu et al., 1998b and c).

COMPLEXITY OF WATER QUALITY DATA
• (Sanders et al., 1983) stated that the water quality hasto be recognized as a random process by nature thenmonitoring activities are required to reflect the stochasticnature of water quality to efficiently produce theexpected information.
• Sanders et al. (1983), Cotter (1985) and Karpuzeu etal. (1987) specify the term “monitoring” further to mean“statistical sampling”.

STOCHASTIC MODELING APPLICATION
• (Shamshad et al,2002) compared different stochasticmodels to forecast some water quality variables (DO,BOD and pH) along River Gangs in India;
• He stated that “ The performance of the MultiplicativeARIMA models and deseasonalised model with a FourierSeries technique provided satisfactory forecasting resultsfor the selected water quality variables”

APPLICATION OF (MAT) IN WATER QUALITY DATA
• (Zou and Yu, 1996) have used a general dynamic factormodel to reduce the high dimensionality of the originalmatrix of variables in order to detect trends in time series;
• (S.T. Abdel Gawad et al, 2005) used the principlecomponent analysis (PCA) to condensate and interpretthe variability of numerous water quality variables at BahrEl Baqer drainage catchment (Egypt)

WATER QUALITY INDEX
• (Chapman, 1992) stated that, water quality index is anindicator of the quality of water obtained by aggregatingseveral water quality measurements into one number;
• Canter (1996) stated that, the common criteria forselecting the parameters to be used in the index are:-– Should be routinely monitored,– Represents a potential public health,– Has effect on aquatic ecology, irrigation, recreation and
industrial water uses,– Selected by the water quality experts in the country and
finally selected by other water quality experts all over theworld.

THEORETICAL BASE OF THE PROPOSED
FRAMEWORK

METHODOLOGY RATIONALE
• Classifying and identifying water quality variables;
• Need for minimizing water quality variables:
– Subjectively
– Objectively
• New statistical framework
• Types of modeling process
– Deterministic modeling
– Stochastic modeling
• Semi empirical formulas

PR
OP
OS
ED
FR
AM
EW
OR
K

CL
US
TE
R A
NA
LY
SIS
Cluster Analysis

FA
CT
OR
AN
AL
YS
IS
Factor Analysis

TIM
E S
ER
EIS
AN
AL
YS
IS
Time Series Analysis
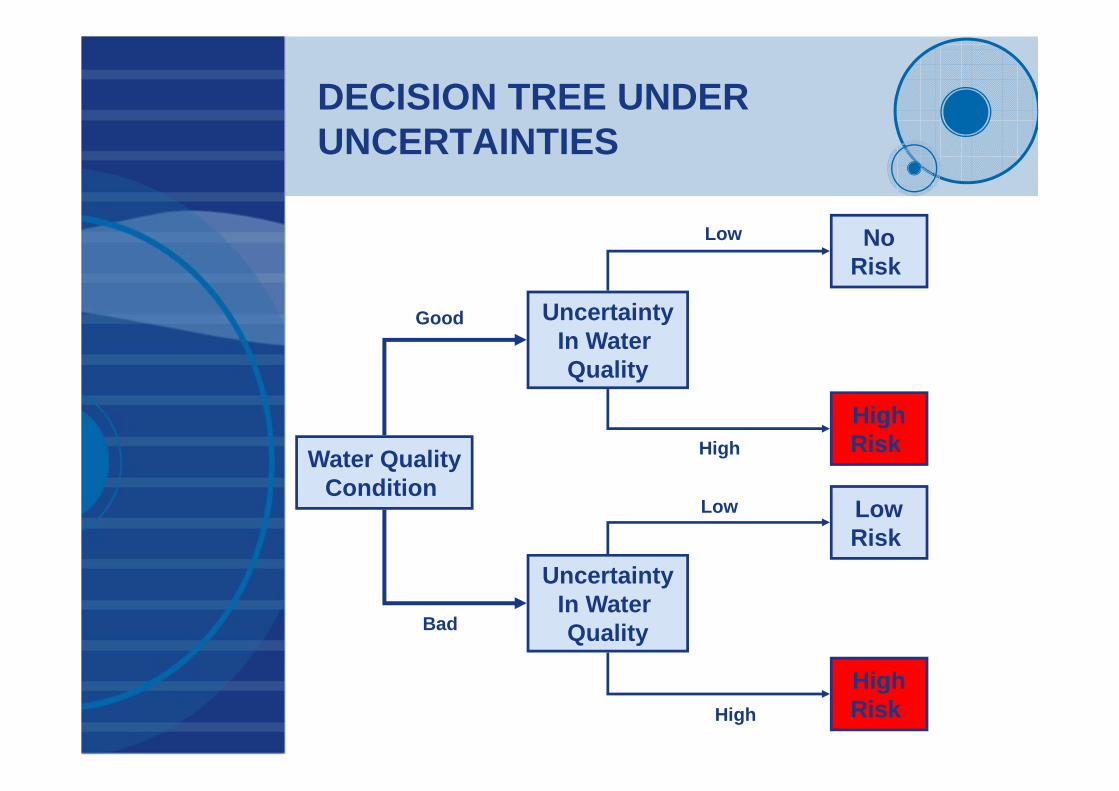
DECISION TREE UNDER UNCERTAINTIES
Water QualityCondition
UncertaintyIn Water Quality
UncertaintyIn Water Quality
NoRisk
HighRisk
LowRisk
HighRisk
Good
Bad
Low
High
Low
High

APPLICATION OF THE PROPOSED FRAMEWORK

PROPOSED STUDY AREAES
No. of Sites
8
No. of Variables
34
Time span
1997-2004
No. of Sites
14
No. of Variables
34
Time span
1997-2004
No. of Sites
10
No. of Variables
34
Time span
1997-2004

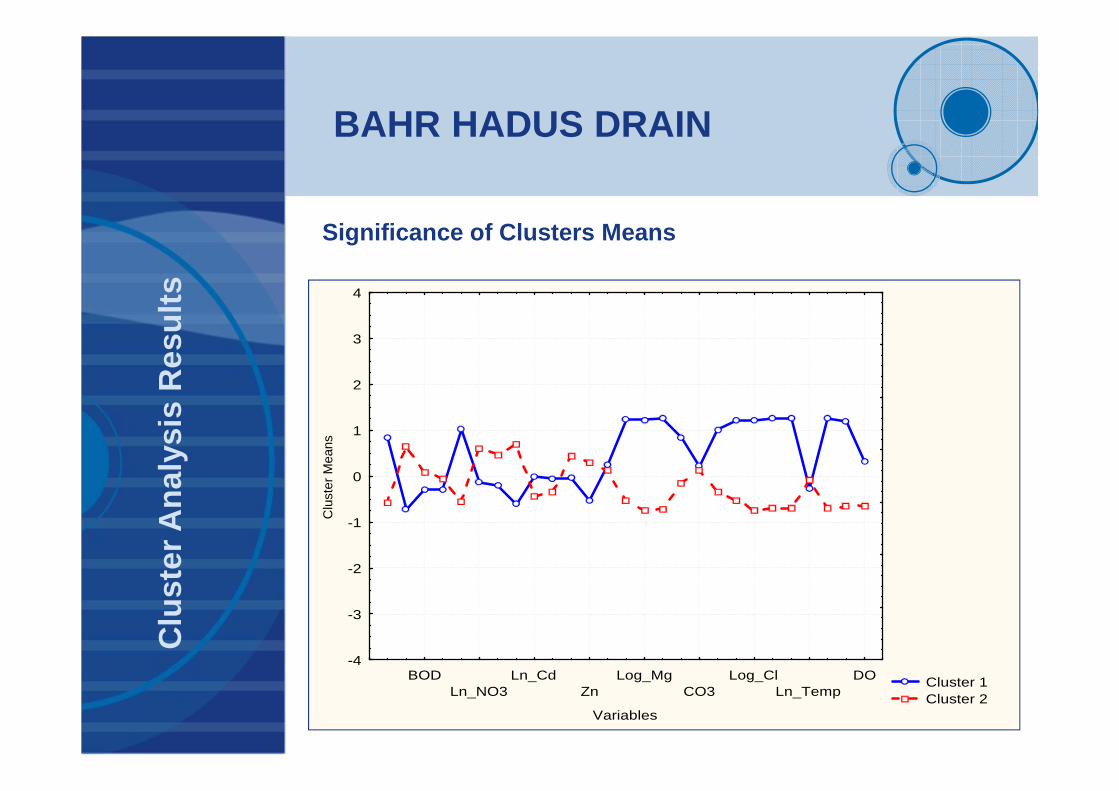
BAHR HADUS DRAINC
lust
er A
nal
ysis
Res
ult
s
EH07
EH17
EH10
EH11
EH09EH06
EH12
EH08
EH02
EH14
EH04
EH15
EH03
EH05
11
Km
5 5 9 35 512 3
Cluster I
Cluster II
Cluster III
Cluster IV

BAHR HADUS DRAIN
Cluster 1 Cluster 2 Cluster 3 Cluster 4
BODLn_NO3
Ln_CdZn
LOG_MgCO3
LOG_ClLn_Temp
DO
Variables
-4
-3
-2
-1
0
1
2
3
4
Clu
ster
An
alys
is R
esu
lts
Significance of Clusters Means

BAHR HADUS DRAIN
EH07
EH17
EH10
EH11
EH09EH06
EH12
EH08
EH02
EH14
EH04
EH15
EH03
EH05
11
Km
5 5 9 35 512 3
Cluster I Cluster II
Clu
ster
An
alys
is R
esu
lts
BAHR HADUS DRAINC
lust
er A
nal
ysis
Res
ult
s
Significance of Clusters Means
Cluster 1 Cluster 2
BODLn_NO3
Ln_CdZn
Log_MgCO3
Log_ClLn_Temp
DO
Variables
-4
-3
-2
-1
0
1
2
3
4
Clu
ster
Mea
ns

FINAL LOCATIONS SELECTION
Drain U.S. Locations D.S. Locations
Bahr Hadus Drain• EH03 • EH05
• EH07• EH08• EH17
Gharbia Drain • MG09• MG10
• MG02
El Umoum Drain• WU01
• WU06• WU09
Clu
ster
An
alys
is R
esu
lts

BAHR HADUS DRAIN (EH03)
Variable Normality Status
P value
P Normal 0.20
Na Normal 0.20
HCO3 Normal 0.15
SO4 Normal 0.15
Cl Normal 0.10
Adj_SAR Normal 0.10
Temperature
Normal 0.20
DO Normal 0.20
Fac
tor
An
alys
is R
esu
lts
Variable P valueNormality
Status
Coliform 0.05 Normal
BOD 0.05 Normal
COD 0.01 Normal
NO3 0.05 Normal
NH4 0.05 Normal
Ca 0.05 Normal
Mg 0.05 Normal
TDS 0.05 Normal
Variables passed Normal Test Variables passed Normal Test after transformation

BAHR HADUS DRAIN (EH03)
Factors% Total Variance
for Each FactorCumulative Total
Variance %
1 29.23 28.23433
2 21.81 51.04909
3 11.08 62.12974
4 8.18 70.30651
Fac
tor
An
alys
is R
esu
lts Percentage of Variance

0
0.5
1
1.5
2
2.5
3
3.5
4
4.5
5
5.5
0 1 2 3 4 5 6 7 8 9 10 11 12 13 14 15 16
Factor Number
Eig
en V
alue
BAHR HADUS DRAIN (EH03)
Fac
tor
An
alys
is R
esu
lts
Turning Point
Scree Test Criterion

BAHR HADUS DRAIN (EH03)
Coliform
BODCOD
NO3
NH4
P
Ca
Mg
Na
HCO3
SO4
Cl
Adj_SAR
Temp
TDS
DO
-1.0 -0.8 -0.6 -0.4 -0.2 0.0 0.2 0.4
Factor 1
-0.8
-0.6
-0.4
-0.2
0.0
0.2
0.4
0.6
0.8
1.0
Fac
tor
2
No Rotation Factor
Fac
tor
An
alys
is R
esu
lts

BAHR HADUS DRAIN (EH03)
Fac
tor
An
alys
is R
esu
lts
Coliform
BODCOD
NO3
NH4 P
Ca
Mg
Na
HCO3
SO4
Cl
Adj_SAR
Temp
TDSDO
-0.6 -0.4 -0.2 0.0 0.2 0.4 0.6 0.8 1.0
Factor 1
-1.0
-0.8
-0.6
-0.4
-0.2
0.0
0.2
0.4
0.6
0.8F
acto
r 2
After applying the Varimax Normalized Rotation Factor

BAHR HADUS DRAIN (EH03)
Fac
tor
An
alys
is R
esu
lts
Variant Coefficients Water Quality Variables
Salt 0.183641 Log Ca
0.077307 Log Mg
0.111268 HCO3
0.138484 SO4
0.220724 Cl
0.167417 Adj_SAR
0.17817 Log TDS
Microbiological 0.421223 Log Coliform
-0.375342 Temperature
-0.553108 DO
Nutrients 0.121606 Log NO3
0.218275 Log NH4
0.239572 P
Biological 0.421179 Log BOD
0.412942 Log COD
Factor Scores coefficient for each component in each factor for

BAHR HADUS DRAIN (EH03)
An
alys
is o
f W
QI
0
200
400
600
800
1000
1200
05-Aug-97 12-Apr-98 18-Dec-98 25-Aug-99 01-May-00 06-Jan-01 13-Sep-01 21-May-02 26-Jan-03 03-Oct-03 09-Jun-04
Time
WQ
I

BAHR HADUS DRAIN (EH03)
Qu
anti
fyin
gU
nce
rtai
nty
and
Ris
kin
the
Var
ian
tsH
isto
rica
lD
ata
0
1.5
3
4.5
6
7.5
9
10.5
12
13.5
15
5-Aug-97 12-Apr-98 18-Dec-98 25-Aug-99 1-May-00 6-Jan-01 13-Sep-01 21-May-02 26-Jan-03 3-Oct-03 9-Jun-04
Time
Sal
t V
aria
nt
Salt Variant U.C.L L.C.L
Uncertainty Values of Salt Variant

BAHR HADUS DRAIN (EH03)
Qu
anti
fyin
gU
nce
rtai
nty
and
Ris
kin
the
Var
ian
tsH
isto
rica
lD
ata
PearsonVI(64.38,8.51,0.66)
0
0.1
0.2
0.3
0.4
0.5
0.6
0.7
0.8
0.9
1
0 2 4 6 8 10 12 14
Salt Variant
Pro
babi
lity
(P)
PearsonVI(64.38,8.51,0.66)
Equivalent Standards= 203 ppm
Risk Values of Salt Variant= 0%

BAHR HADUS DRAIN (EH03)
Dec
isio
nTr
eeU
nd
erR
isk
and
Un
cert
ain
tyC
on
dit
ion
s
0
1.5
3
4.5
6
7.5
9
10.5
12
13.5
15
5-Aug-97 12-Apr-98 18-Dec-98 25-Aug-99 1-May-00 6-Jan-01 13-Sep-01 21-May-02 26-Jan-03 3-Oct-03 9-Jun-04
Time
Sal
t V
aria
nt
Salt Variant U.C.L L.C.L
Case of good water quality conditions and low values of uncertainty (error)

BAHR HADUS DRAIN (EH03)
Dec
isio
nTr
eeU
nd
erR
isk
and
Un
cert
ain
tyC
on
dit
ion
s
0
5
10
15
20
25
5-Aug-97 12-Apr-98 18-Dec-98 25-Aug-99 1-May-00 6-Jan-01 13-Sep-01 21-May-02 26-Jan-03 3-Oct-03 9-Jun-04
Time
Mic
robi
olog
ical
Var
iant
Microbiological U.C.L L.C.L Standards
Case of good water quality conditions and high values of uncertainty (error)

BAHR HADUS DRAIN (EH03)
Dec
isio
nTr
eeU
nd
erR
isk
and
Un
cert
ain
tyC
on
dit
ion
s
0
0.4
0.8
1.2
1.6
2
2.4
2.8
3.2
5-Aug-97 12-Apr-98 18-Dec-98 25-Aug-99 1-May-00 6-Jan-01 13-Sep-01 21-May-02 26-Jan-03 3-Oct-03 9-Jun-04
Time
Mic
rob
iolo
gic
al V
aria
nt
Microbiological Variant U.C.L L.C.L Standard
Case of bad water quality conditions and high values of uncertainty (error)

BAHR HADUS DRAIN (EH03)
Dec
isio
nTr
eeU
nd
erR
isk
and
Un
cert
ain
tyC
on
dit
ion
s
0
20
40
60
80
100
120
140
5-Aug-97 12-Apr-98 18-Dec-98 25-Aug-99 1-May-00 6-Jan-01 13-Sep-01 21-May-02 26-Jan-03 3-Oct-03 9-Jun-04
Time
Bio
log
ical
Var
ian
t
Biological U.C.L L.C.L Standards
Case of bad water quality conditions and low values of uncertainty (error)

BAHR HADUS DRAIN (EH03- Salt Variant)
Tim
e S
erie
s A
nal
ysis
Res
ult
s
Autocorrelation Function
EH03 Salt
Conf. Limit-1.0 -0.5 0.0 0.5 1.00
15 -.144 .0956
14 +.067 .0962
13 +.021 .0969
12 +.179 .0975
11 +.133 .0981
10 +.030 .0988
9 +.137 .0994
8 +.110 .1000
7 -.039 .1006
6 -.014 .1012
5 +.044 .1018
4 +.060 .1024
3 +.272 .1030
2 +.340 .1036
1 +.304 .1042
Lag Corr. S.E.
0
38.17 .0009
35.90 .0011
35.42 .0007
35.38 .0004
32.01 .0008
30.17 .0008
30.08 .0004
28.19 .0004
26.97 .0003
26.82 .0002
26.80 .0001
26.61 .0000
26.27 .0000
19.31 .0001
8.52 .0035
Q p
Partial Autocorrelation Function
EH03 Salt
Conf. Limit-1.0 -0.5 0.0 0.5 1.00
15 -.215 .1060
14 -.025 .1060
13 -.062 .1060
12 +.144 .1060
11 -.011 .1060
10 -.113 .1060
9 +.151 .1060
8 +.184 .1060
7 +.004 .1060
6 -.032 .1060
5 -.069 .1060
4 -.139 .1060
3 +.135 .1060
2 +.273 .1060
1 +.304 .1060
Lag Corr. S.E.
Partial Auto Correlation Function Auto Correlation Function

BAHR HADUS DRAIN (EH03- Salt Variant)
Tim
e S
erie
s A
nal
ysis
Res
ult
s
Original Series of the Salt Variant with The Standards
0
2
4
6
8
10
12
14
16
18
20
5-Aug-97 12-Apr-98 18-Dec-98 25-Aug-99 1-May-00 6-Jan-01 13-Sep-01 21-May-02 26-Jan-03 3-Oct-03 9-Jun-04
Time
Sal
t G
rou
p
Variant Standards at 203ppm

BAHR HADUS DRAIN (EH03- Salt Variant)
Location Variant Non Seasonal Model Seasonal Model
θ d Φ θ d Φ
EH03 Salt 0.765 1 -0.988 1
Tim
e S
erie
s A
nal
ysis
Res
ult
s
Values of the ARIMA Model Parameters
0
1
2
3
4
5
6
7
8
9
10
1-Sep-97 9-May-98 14-Jan-99 21-Sep-99 28-May-00 2-Feb-01 10-Oct-01 17-Jun-02 22-Feb-03 30-Oct-03 6-Jul-04
Time
Sal
t G
rou
p
Original Series Generated Model Series

BAHR HADUS DRAIN (EH03- Salt Variant)
Tim
e S
erie
s A
nal
ysis
Res
ult
s
0
0.5
1
1.5
2
2.5
3
3.5
4
5-Jan-05 15-Apr-05 24-Jul-05 1-Nov-05 9-Feb-06 20-May-06
Time
Sal
t V
aria
nt
Forecasted Values Actual values
Validation process of ARIMA Model

BAHR HADUS DRAIN (EH03- Salt Variant)
Tim
e S
erie
s A
nal
ysis
Res
ult
s
INFORMATION ON DIAGNOSTICS SELECTIVE ARIMA MODEL
SA quality index (stand to 10) 2.239 [0, 10] ad-hoc
STATISTICS ON RESIDUALS
Ljung-Box on residuals 15.87 [0, 33.90] 5%
Box-Pierce on residuals 00.44 [0, 5.990] 5%
Ljung-Box on squared residuals 24.89 [0, 33.90] 5%
Box-Pierce on squared residuals 00.09 [0, 5.990] 5%
Durbin-Watson statistic on residuals 2.16 [min:0, max:4]
DESCRIPTION OF RESIDUALS
Normality 1.30 [0, 5.99] 5%
Skewness 0.00 [-0.57, 0.57] 5%
Kurtosis 2.34 [1.87, 4.13] 5%
OUTLIERS
Percentage of outliers 2.33 % [0%, 5.0 %] ad-hoc
Results of the Statistical Tests Applied on the Residuals of the Selected Model

BAHR HADUS DRAIN (EH03- Salt Variant)
-0.5
-0.4
-0.3
-0.2
-0.1
0
0.1
0.2
0.3
0.4
0.5
1 6 11 16 21 26 31 36
Lag Time
Correlation
Tim
e S
erie
s A
nal
ysis
Res
ult
s
-0.5
-0.4
-0.3
-0.2
-0.1
0
0.1
0.2
0.3
0.4
0.5
1 6 11 16 21 26 31 36
Lag Time
Correlation
The Auto Correlation Function for the Model Residuals
The Partial Auto Correlation Function for the Model Residuals

BAHR HADUS DRAIN (EH03- Salt Variant)
Tim
e S
erie
s A
nal
ysis
Res
ult
s
The Forecasted values of the salt factor with the Equivalent Standards
0
1
2
3
4
5
6
7
8
9
10
3-Dec-02 21-Jun-03 7-Jan-04 25-Jul-04 10-Feb-05 29-Aug-05 17-Mar-06 3-Oct-06
Time
Sal
t G
rou
p
L.C.L Value U.C.L
Calculated Standards are at 203

BAHR HADUS DRAINTi
me
Ser
ies
An
alys
is R
esu
lts
Location Variant Non Seasonal Model Seasonal Model
θ d Φ θ d Φ
EH05 Microbiological -0.661 1 -0.100 -0.200 -0.100
Salt -0.706 1 -0.999 1
Biological 0.552 1 -0.551
EH07 Salt -0.762 1 -0.100 -0.945 1 -0.087
Biological 1 -0.100 -0.636 -0.200 -0.076
Biological 2 -0.624 1 -0.095
Microbiological -0.938 1 -0.905 1
EH08 Microbiological -0.351 -0.789 -0.200 -0.069
Salt 1 -0.581 1 -0.100 -0.534 1 -0.100
Salt 2 -0.283 -0.772 1
Biological -0.936 1 -0.088
EH17 Biological -0.272 1 -0.944 1 -0.096
Salt -0.627 1 -0.919 1
Microbiological -0.464 1
Coefficients of the Selected ARIMA Models to the Other Locations

COMPARISON BETWEEN THE THREE DRAINS
Fac
tor
An
alys
is R
esu
lts
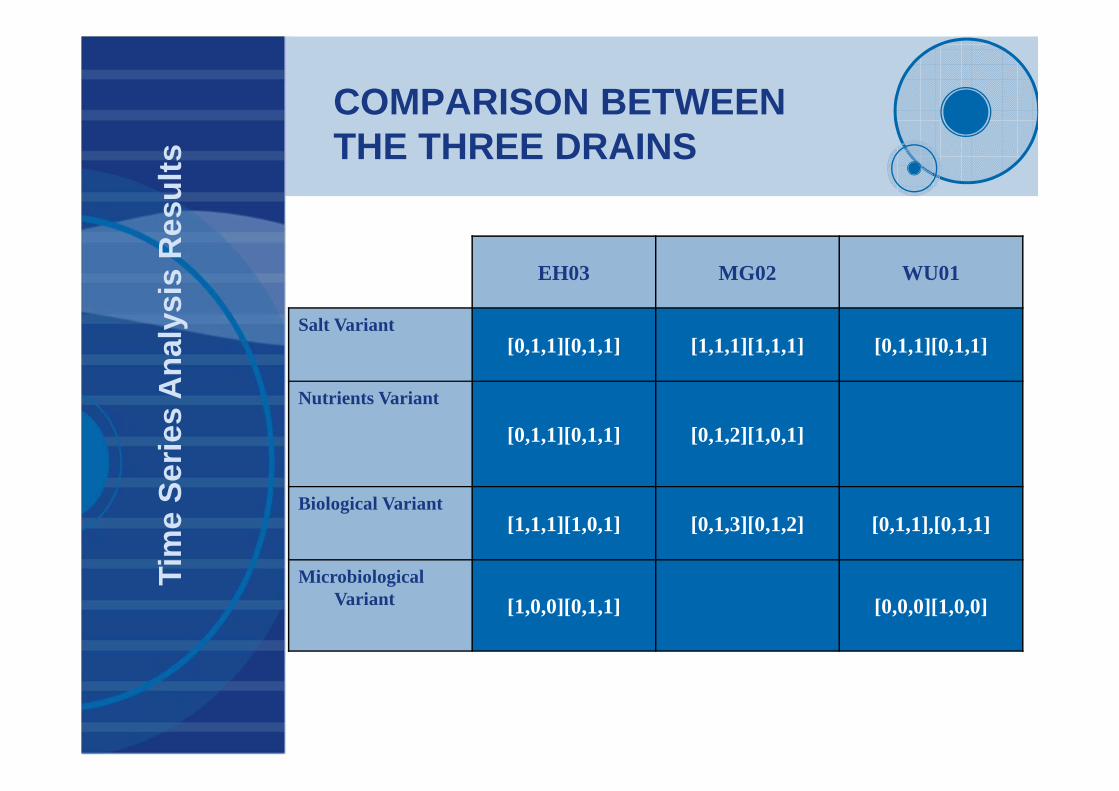
COMPARISON BETWEEN THE THREE DRAINS
Tim
e S
erie
s A
nal
ysis
Res
ult
s
EH03 MG02 WU01
Salt Variant[0,1,1][0,1,1] [1,1,1][1,1,1] [0,1,1][0,1,1]
Nutrients Variant
[0,1,1][0,1,1] [0,1,2][1,0,1]
Biological Variant[1,1,1][1,0,1] [0,1,3][0,1,2] [0,1,1],[0,1,1]
Microbiological Variant [1,0,0][0,1,1] [0,0,0][1,0,0]

UNCERTAINTY STEMMED FROM MONITORING LOCATIONS
0.0
1.0
2.0
3.0
4.0
5.0
6.0
7.0
8.0
9.0
5-Jan-05 15-Apr-05 24-Jul-05 1-Nov-05 9-Feb-06 20-May-06 28-Aug-06 6-Dec-06
Time
Sal
t V
aria
nt
L.C.L Average Value U.C.L Average L.C.L Average U.C.L
Bah
r H
adu
s D
rain

UNCERTAINTY STEMMED FROM MONITORING LOCATIONS
0.00
2.00
4.00
6.00
8.00
10.00
12.00
14.00
16.00
18.00
6-Dec-04 5-May-05 2-Oct-05 1-Mar-06 29-Jul-06
Time
Mic
robio
logic
al V
aria
nt
Average L.C.L Average U.C.L Min L.C.L Average Value Max U.C.L

UNCERTAINTY STEMMED FROM MONITORING LOCATIONS
0.00
0.50
1.00
1.50
2.00
2.50
3.00
3.50
4.00
6-Dec-04 5-May-05 2-Oct-05 1-Mar-06 29-Jul-06
Time
Nutr
ients
Var
ian
t
Average L.C.L Average Value Average U.C.L Min L.C.L Max U.C.L

CONCLUSIONS
• The K-Means algorithm is a suitable technique to apply in theanalysis of water quality data.
• The drainage system at the three drains could be classified intotwo main clusters. The first cluster represents the upstream partof the drain while the second cluster represents the downstreampart of the drain
• Due to the high number of sites in each cluster, another step isapplied to reduce the number of sites along the drain. Thisachieved by applying the multi correlation matrix between themembers of each cluster; this step is an arbitrary step as thissituation may not occur in other drainage catchments.
• The factor analysis technique (Principle component) is also apowerful tool in reducing the number of water quality variablesto meaningful variants from the decision maker point of view.

CONCLUSIONS (Cont.)
• The principle component method succeeded in combining the most relevant variables with each other in separate variants.
• Most of the variants formed in the selected locations at the three drains have the same combination from basic water quality variables. This could lead to using these factors as permanent variants or water quality indices to determine the status of water quality.
• Most of the deduced variants in the five selected monitoring sites exceed the standards set by the Egyptian government except the salt variants in all location, which are below the Egyptian standards.
• The seasonal pattern is found in all the water quality factors as the seasonal ARIMA models are always conjugate to the non seasonal ARIMA models.
• Most of the ARIMA models used in this study have the sameorder except one factor that has a high ARIMA model order.

RECOMMENDATIONS
• The proposed framework should be applied to other several drainage catchments to check if the deduced variants will repeat again with the same basic water quality variables or will change from drain to drain.
• A software interface for the proposed framework is needed to be easy to use in the future.
• The economic dimension should be taken into consideration in the uncertainty analysis as the spatial distribution of the monitoring sites changes and the water quality variables decrease through the analysis.
• Finally, the uncertainty should be taken into consideration in any future water quality studies rather than assuming that all the conditions involving the process of modeling are deterministic.