personalització del cribratge del càncer...
TRANSCRIPT

Personalització del cribratge del càncer colorectal
Gemma Ibáñez Sanz
ADVERTIMENT. La consulta d’aquesta tesi queda condicionada a l’acceptació de les següents condicions d'ús: La difusió d’aquesta tesi per mitjà del servei TDX (www.tdx.cat) i a través del Dipòsit Digital de la UB (diposit.ub.edu) ha estat autoritzada pels titulars dels drets de propietat intel·lectual únicament per a usos privats emmarcats en activitats d’investigació i docència. No s’autoritza la seva reproducció amb finalitats de lucre ni la seva difusió i posada a disposició des d’un lloc aliè al servei TDX ni al Dipòsit Digital de la UB. No s’autoritza la presentació del seu contingut en una finestra o marc aliè a TDX o al Dipòsit Digital de la UB (framing). Aquesta reserva de drets afecta tant al resum de presentació de la tesi com als seus continguts. En la utilització o cita de parts de la tesi és obligat indicar el nom de la persona autora. ADVERTENCIA. La consulta de esta tesis queda condicionada a la aceptación de las siguientes condiciones de uso: La difusión de esta tesis por medio del servicio TDR (www.tdx.cat) y a través del Repositorio Digital de la UB (diposit.ub.edu) ha sido autorizada por los titulares de los derechos de propiedad intelectual únicamente para usos privados enmarcados en actividades de investigación y docencia. No se autoriza su reproducción con finalidades de lucro ni su difusión y puesta a disposición desde un sitio ajeno al servicio TDR o al Repositorio Digital de la UB. No se autoriza la presentación de su contenido en una ventana o marco ajeno a TDR o al Repositorio Digital de la UB (framing). Esta reserva de derechos afecta tanto al resumen de presentación de la tesis como a sus contenidos. En la utilización o cita de partes de la tesis es obligado indicar el nombre de la persona autora. WARNING. On having consulted this thesis you’re accepting the following use conditions: Spreading this thesis by the TDX (www.tdx.cat) service and by the UB Digital Repository (diposit.ub.edu) has been authorized by the titular of the intellectual property rights only for private uses placed in investigation and teaching activities. Reproduction with lucrative aims is not authorized nor its spreading and availability from a site foreign to the TDX service or to the UB Digital Repository. Introducing its content in a window or frame foreign to the TDX service or to the UB Digital Repository is not authorized (framing). Those rights affect to the presentation summary of the thesis as well as to its contents. In the using or citation of parts of the thesis it’s obliged to indicate the name of the author.

Personalització del cribratge del càncer colorectal
Tesi presentada per Gemma Ibáñez Sanz per optar al grau de Doctora en Medicina
Gemma Ibáñez Sanz
Directors de la Tesi
Dr. Victor Moreno Aguado
Dra. Montse Garcia Martínez
Programa de Doctorat en Medicina i Recerca Translacional
Universitat de Barcelona
Barcelona, 2017


“El secret de l’èxit és ser constant en el propòsit”.
Benjamin Franklin


AGRAÏMENTS
Són moltes les persones que m’han ajudat a arribar fins aquí i a totes elles els
vull donar les gràcies.
A en Víctor Moreno, per donar-me l’oportunitat de treballar en el teu equip
d’investigació, donar-me projectes d’investigació tan apassionants com
COLSCREEN i GENRISK. Per ajudar-me tant a millorar els articles que he
escrit o estic escrivint i per deixar-me seguir fent de digestòloga. Gràcies per la
teva ajuda constant, per estar sempre quan ho necessito i per compartir amb mi
el teu talent.
A la Montse Garcia per la teva infatigable dedicació en els dos primers articles i
per llegir i corregir tot el necessari per fer que aquesta tesi tingués cara i ulls.
També t’agreixo molt com em vas acollir en els meus primers dies a l’ICO.
A en Francisco Rodríguez per ser un referent a seguir no només com a
persona sinó com a gran professional. M’has fet de germà gran en moltes
ocasions, per dubtes professionals i per mil i un dubtes de pacients que sempre
m’has resolt amb un gran somriure.
A en Joan Gornals perquè gràcies a tu vaig fer les meves primeres passes en
el món d’investigació. Vas tenir la paciència d’explicar-me com escriure el meu
primer article i vas aconseguir transmetre’m el teu incansable neguit per
investigar.
A la Claudia Consiglieri, per ser tan bona persona i encara millor amiga. Has
estat en el meu costat sempre que t’he necessitat no només com a companya
de treball sinó també com a amiga.
A la meva resident petitona preferida, la Luisa, gràcies per ajudar-me en el nou
article de càncer colorectal.
Al Dr. Xiol, el meu interconsultor d’hepatologia i professor de facultat, per haver
estat tant bona persona, metge i professor de digestiu. A la Carme Baliellas, la
meva tutora, per acompanyar-me en la meva residència i ajudar-me en aquesta
etapa tan difícil. A en Jordi Guardiola per donar-me l’oportunitat de treballar a
un servei de digestiu tan bo com el Bellvitge i alhora deixar-me seguir
investigant a l’altra banda de la Granvia.
Als meus adjunts del servei, perquè en quatre anys he après moltíssimes coses
de vosaltres, ja sigui a planta de tub o de fetge, a endoscòpies o de guàrdia.
Als residents grans i petits per fer que els dies al despatx fossin més divertits i
agradables. A tots i cadascun d’ells gràcies per fer-me riure i fer que la
residència fos una etapa inoblidable.
A les infermeres d’endoscòpies, de planta i d’urgències que et somriuen quan
et veuen i que t’ajuden quan més ho necessites. A més, vull agrair el suport
incondicional a les infermeres de l’ambulatori, en especial a la Carme, que
permeten que els estudis GENRISK i RAID4 siguin una realitat.
Gràcies a tots els companys i companyes del Programa de Prevenció i Control
del Càncer de l’ICO. Gràcies al seu constant treball en el programa de cribratge
i en la seva recerca de nous biomarcadors he pogut realitzar aquesta tesi en
tan poc temps. Gràcies a tots els coautors que formen part d’aquesta tesi, en
especial gràcies a la Núria i l’Anna pel suport estadístic que m’han donat.
Gràcies a l’Eli i la Carmen per ajudar-me a mantenir viu l’estudi COLSCREEN.
També vull agrair als meus companys i companyes de Biomarcadors amb els

que he coincidit al llarg d’aquests dos anys. És impossible citar a totes les
persones que m’ajuden en el meu dia a dia, però a totes elles gràcies.
Gràcies als meus companys de l’Academia de Estudios AMIR, en especial a en
Borja i Carlos. A en Borja, moltes gràcies per donar-me l’oportunitat des de ben
petita de donar classes de digestiu per tota Espanya. He conegut moltes ciutats
noves, aeroports, hotels i les diferents peculiaritats de cada seu. Però, encara
més important, donar classes m’ha ajudat a aprendre molt de digestiu i, a més,
m’ha permès desenvolupar noves habilitats comunicatives.
Per últim, però no menys important, vull donar les gràcies a la meva família i als
meus amics. A la Laura, als meus avis, les meves cosines i cosí, als meus tiets,
a la meva quasi família (“Friends with Kids”), a la Montse Caldú, a les meves
amigues del BàsquetFo i al Nus.
Als meus pares, perquè no sé que faria sense ells. Per estimar-me, recolzar-
me, animar-me, cuidar-me i com diu el papa “donar-me les eines necessàries”
per arribar fins aquí.
A l’Alfons per ser l’amor de la meva vida i el meu millor amic, per entendre totes
les hores que dedico al meu treball i per ajudar-me en els moments difícils.
Moltes gràcies a tots!


ÍNDEX
1. RESUM DEL PROJECTE ......................................................................... 17
2. INTRODUCCIÓ ......................................................................................... 25
2.1. Epidemiologia del càncer colorectal ....................................................... 27
2.2. Història natural del càncer colorectal. Pòlips colorectals ........................ 28
2.3. Prevenció del càncer colorectal .............................................................. 31
2.3.1. Prevenció primària del càncer colorectal ............................................. 31
2.3.2. Prevenció secundària o cribratge del càncer colorectal ...................... 36
2.3.2.1. Programes poblacionals de cribratge de càncer colorectal .............. 37
2.3.2.2. Proves utilitzades en el cribratge del càncer colorectal ................... 40
2.3.2.3. Altres proves de cribratge en el càncer colorectal ........................... 45
2.3.2.4. Beneficis i riscos del programa de cribratge de càncer colorectal ... 47
2.3.2.5. Models de risc per la detecció precoç de càncer colorectal ............. 56
3. HIPÒTESIS I OBJECTIUS ........................................................................ 59
4. METODOLOGIA ....................................................................................... 63
4.1. Programa poblacional de detecció precoç de càncer colorectal - ICO ... 65
4.2. Estudi MCC-Spain .................................................................................. 69
5. RESULTATS ............................................................................................ 71
ARTICLE 1: Prescription drugs associated with false-positive results when
using faecal immunochemical tests for colorectal cancer screening ................ 73
ARTICLE 2: False-negative rate cannot be reduced by lowering the
haemoglobin concentration cut-off in colorectal cancer screening using faecal
immunochemical test ........................................................................................ 81
ARTICLE 3: Risk model for colorectal cancer in Spanish population using
environmental and genetic factors: results from the MCC-Spain study ............ 87
6. DISCUSSIÓ CONJUNTA D’ARTICLES ................................................. 101
7. CONCLUSIONS ..................................................................................... 117
8. REFERÈNCIES BIBLIOGRÀFIQUES .................................................... 121
9. ANNEXOS .............................................................................................. 131
ANNEX 1: Material suplementari article 1 ...................................................... 133
ANNEX 2: Material suplementari article 3 ...................................................... 139
ANNEX 3: Procés editorial i correspondència dels articles ............................ 149
ANNEX 4: Comunicacions a congressos ....................................................... 173

13
ABREVIATURES
ADN: àcid desoxiribonucleic
AINEs: antiinflamatoris no esteroïdals
ARN: àcid ribonucleic
CCR: càncer colorectal
GWAS: estudis d'associació de genoma complet
IBP: inhibidors de la bomba de protons
ICO: Institut Català d’Oncologia
IMC: índex de massa corporal
MCC-Spain: estudi multicas-control de base poblacional espanyola
PDSOF: prova de detecció de sang oculta en femta
PDSOFg: prova de detecció de sang oculta en femta basada en guaiac
PDSOFi: prova de detecció de sang oculta en femta immunològica
SNPs: polimorfismes comuns de nucleòtid únic
SRG: puntuació (score) de risc genètic

15
AJUDA PERSONAL REBUDA
El període de formació del doctorand ha estat realitzat amb el suport de la
següent ajuda personal a la investigació:
Ajut per iniciació a la recerca, convocatòria 2016, per part de la
Fundació Privada: Acadèmia de Ciències Mèdiques de Catalunya i
Balears- Societat Catalana de Digestologia.


1. RESUM DEL PROJECTE

19
Resum
Introducció: La prova de detecció de sang oculta en femta és la prova de
cribratge de càncer colorectal (CCR) més implementada a Europa. Tot i que
aquesta ha demostrat reduir la mortalitat per CCR, encara dista de ser una
prova perfecta donat el seu risc de resultats falsos positius i falsos negatius. Els
efectes adversos del cribratge podrien reduir-se si coneguéssim els
determinants associats a resultats falsos positius i negatius. A més, la
identificació de polimorfismes genètics, en combinació amb altres biomarcadors
moleculars i factors ambientals podria permetre personalitzar el cribratge
poblacional.
Objectius: 1) Identificar els factors associats a un resultat fals positiu de la
prova de detecció de sang oculta en femta immunològica (PDSOFi). 2)
Determinar la proporció de resultats falsos negatius de la PDSOFi i explorar els
seus determinants. 3) Elaborar un model de predicció de risc de CCR basat en
població espanyola que combini la predisposició genètica juntament amb
factors ambientals i antecedents familiars per estratificar la població en grups
de risc de CCR.
Metodologia: Per respondre als primers dos objectius es van utilitzar dades del
programa poblacional de cribratge de CCR que coordina l'Institut Català
d'Oncologia. Es realitzaren dos estudis transversals amb participants en el
cribratge que van obtenir un resultat positiu (n = 427) o negatiu (n = 218) en la
PDSOFi i als que posteriorment se'ls va realitzar una colonoscòpia i un
qüestionari. Finalment, per respondre al tercer objectiu s'aprofitaren les dades
de l'estudi MCC-Spain, que és un estudi de casos i controls multicèntric que va
recollir 1.336 casos de CCR i 2.744 controls. De tots ells disposàvem d’un
qüestionari epidemiològic i un array d’exoma que contenia 21 polimorfismes de
nucleòtid simple associats a risc de CCR. Amb aquestes dades vàrem
desenvolupar un model de predicció de risc per estratificar la població en grups
de risc de CCR.

20
Resultats: Estudi 1: Mitjançant l’estudi que avaluà el risc de resultats falsos
positius en la PDSOFi, s’observà que les variables que van resultar ser
determinants de fals positiu foren: ser dona, haver participat prèviament en el
cribratge, la presència d'hemorroides i/o fissura anal, així com prendre fàrmacs
inhibidors de la bomba de protons. Estudi 2: A l’avaluar el risc de resultats
falsos negatius en la PDSOFi, la proporció de falsos negatius observada va ser
del 15,6%. L’hemoglobina fecal va ser indetectable en un 45,5% dels resultats i
va ser inferior a 4g Hb/g en un 94,0% d’individus amb un resultat fals negatiu.
Estudi 3: Vam observar que les variables (ajustades pel model basal) que es
van associar de forma independent a CCR van ser: el nombre d'al·lels de risc,
antecedents familiars de CCR, l’obesitat, l’activitat física, la ingesta de carn
vermella i vegetals, i el no consum d’antiinflamatoris no esteroïdals. Els
individus del amb més de 25 al·lels de risc tenien un 82% més de risc que els
individus amb menys de 19 al·lels de risc.
Conclusions: 1. L’ús d’inhibidors de la bomba de protons durant la realització de la
PDSOFi podria incrementar la probabilitat d’un resultat fals positiu.
2. Disminuir el llindar de positivitat de la PDSOFi no detectaria més
neoplàsia avançada i augmentaria els costos i els riscos innecessaris per als
pacients.
3. El model de predicció del risc de CCR basat en població espanyola que
combina la predisposició genètica amb factors ambientals i antecedents
familiars podria ser útil per estratificar individus de risc.
21
Resumen
Introducción: La prueba de detección de sangre oculta en heces es la prueba
de cribado de cáncer colorrectal (CCR) más implementada en Europa. Aunque
ésta ha demostrado reducir la mortalidad por CCR, dista de ser una prueba
perfecta dado su riesgo de resultados falsos positivos y falsos negativos. Los
efectos adversos del cribado podrían reducirse si conociéramos los
determinantes asociados a resultados falsos positivos y negativos. Además, la
identificación de polimorfismos genéticos, en combinación con otros
biomarcadores moleculares y factores ambientales podría permitir personalizar
el cribado poblacional.
Objetivos: 1) Identificar los factores asociados a un resultado falso positivo de
la prueba de detección de sangre oculta en heces inmunológica (PDSOHi). 2)
Determinar la proporción de resultados falsos negativos de la PDSOHi y
explorar sus determinantes. 3) Elaborar un modelo de predicción de riesgo de
CCR basado en población española que combine la predisposición genética
junto con factores ambientales y antecedentes familiares para estratificar la
población en grupos de riesgo de CCR.
Metodología: Para responder a los primeros dos objetivos se utilizaron datos
del programa poblacional de cribado de CCR que coordina el Instituto Catalán
de Oncología. Se realizaron dos estudios transversales con participantes en el
cribado que obtuvieron un resultado positivo (n = 427) o negativo (n = 218) en
la PDSOHi y a quienes posteriormente se les realizó una colonoscopia y un
cuestionario. Finalmente, para responder al tercer objetivo se aprovecharon los
datos del estudio MCC-Spain, que es un estudio de casos y controles
multicéntrico que recogió 1.336 casos de CCR y 2.744 controles. De todos ellos
disponíamos de un cuestionario epidemiológico y un array de exoma que
contenía 21 polimorfismos de nucleótido simple asociados a riesgo de CCR.
Con estos datos pudimos desarrollar un modelo de predicción de riesgo para
estratificar la población en grupos de riesgo de CCR.
22
Resultados: Estudio 1: Mediante el estudio que evaluó el riesgo de resultados
falsos positivos en la PDSOHi, se observó que las variables que resultaron ser
determinantes de falso positivo fueron: ser mujer, haber participado
previamente en el cribado, la presencia de hemorroides y/o fisura anal, así
como tomar fármacos inhibidores de la bomba de protones. Estudio 2: Al
evaluar el riesgo de resultados falsos negativos en la PDSOHi, la proporción de
falsos negativos observada fue del 15,6%. La hemoglobina fecal fue
indetectable en un 45,5% de los resultados y fue inferior a 4g Hb/g en un
94,0% de individuos con un resultado falso negativo. Estudio 3: Se observó que
las variables (ajustadas por el modelo basal) que se asociaron de forma
independiente a CCR fueron: el número de alelos de riesgo, antecedentes
familiares de CCR, la obesidad, la actividad física, la ingesta de carne roja y
vegetales, y el no consumo de antiinflamatorios no esteroideos. Los individuos
con más de 25 alelos de riesgo tenían un 82% más de riesgo que los individuos
con menos de 19 alelos de riesgo.
Conclusiones: 1. El uso de inhibidores de la bomba de protones durante la realización de la
PDSOHi podría incrementar la probabilidad de un resultado falso positivo.
2. Disminuir el umbral de positividad de la PDSOHi no detectaría más neoplasia
avanzada y aumentaría los costes y los riesgos innecesarios para los
pacientes.
3. El modelo de predicción del riesgo de CCR basado en población española
que combina la predisposición genética con factores ambientales y
antecedentes familiares podría ser útil para estratificar individuos de riesgo.

23
Abstract Introduction: In Europe, the most commonly implemented test to screen
colorectal cancer (CCR) is the faecal occult blood test. Although it has shown to
reduce CRC mortality, it is far from perfect because of its false positive and
false negative results. The adverse effects of screening could be reduced if we
knew the determinants associated with false positive and negative results. In
addition, the identification of genetic polymorphisms in combination with other
molecular biomarkers and environmental factors could allow personalizing
population screening.
Objectives: 1) To identify the factors associated with a false positive result of
the faecal immunochemical test (FIT). 2) To determine the false negative
proportion in and to explore its determinants. 3) To develop a risk stratification
model that combined environmental factors with family history and genetic
susceptibility to stratify the population in risk groups of CRC.
Methodology: In order to respond to the first two objectives, the population of
the CRC screening program coordinated by the Catalan Institute of Oncology
was used. Two cross-sectional studies were performed with screening
participants who had a positive (n = 427) or negative (n = 218) FIT result and
who subsequently underwent a colonoscopy and a questionnaire. Finally, in
order to respond to the third objective, data from the MCC-Spain study was
used. This multicentre case-control study recollected an epidemiological
questionnaire and an exoma array containing 21 simple nucleotide
polymorphisms associated with CRC risk of 1,336 cases of CRC and 2,744
controls. With these data we developed a risk stratification model to stratify the
population in groups at risk of CRC.
Results: Study 1: While evaluating factors associated with false-positive results
in a CRC screening, the variables associated with a false-positive result were:
women, successive screening, haemorrhoids and/or anal fissure and the use of
proton pump inhibitors. Study 2: When analysing the risk of false negative
results in the FIT, the false negative rate observed was 15.6%. Faecal

24
haemoglobin was undetected in 45.5% and it was below 4 g Hb/g in 94.0% of
the individuals with a FN result. Study 3: The variables (adjusted by the
baseline model) that were independently associated with CRC were: the
number of risk alleles, family history of CRC, alcohol consumption, obesity,
physical activity, red meat and vegetable intake, and nonsteroidal anti-
inflammatory drug use. The risk of subjects with more than 25 risk alleles was
82% higher than subjects with less than 19 alleles.
Conclusions: 1. Concurrent use of proton pump inhibitors at the time of FIT might increase
the likelihood of a false-positive result.
2. Decreasing the positivity threshold of FIT does not increase the detection rate
of advanced neoplasia, but may increase the costs and potential adverse
effects.
3. A Spanish population-based CRC risk prediction model that combines
genetic predisposition with environmental factors and family history may be
useful for stratifying at-risk individuals.

2. INTRODUCCIÓ

27
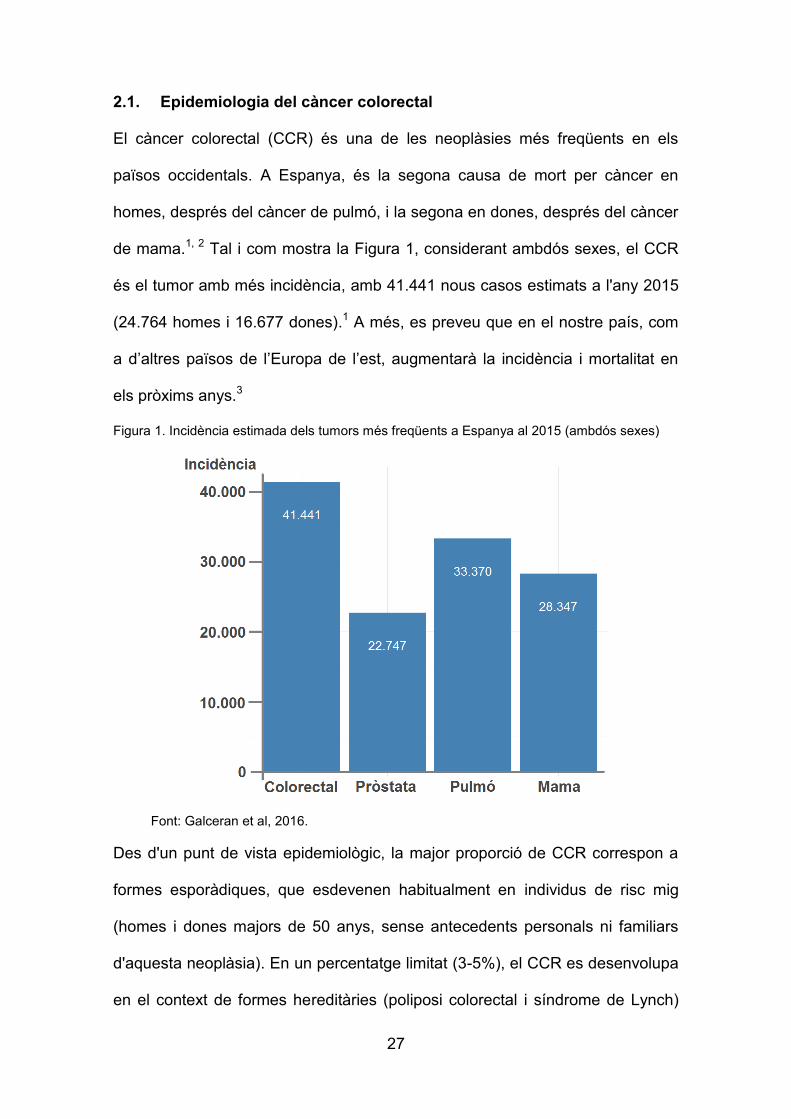
2.1. Epidemiologia del càncer colorectal
El càncer colorectal (CCR) és una de les neoplàsies més freqüents en els
països occidentals. A Espanya, és la segona causa de mort per càncer en
homes, després del càncer de pulmó, i la segona en dones, després del càncer
de mama.1, 2 Tal i com mostra la Figura 1, considerant ambdós sexes, el CCR
és el tumor amb més incidència, amb 41.441 nous casos estimats a l'any 2015
(24.764 homes i 16.677 dones).1 A més, es preveu que en el nostre país, com
a d’altres països de l’Europa de l’est, augmentarà la incidència i mortalitat en
els pròxims anys.3
Figura 1. Incidència estimada dels tumors més freqüents a Espanya al 2015 (ambdós sexes)
Font: Galceran et al, 2016.
Des d'un punt de vista epidemiològic, la major proporció de CCR correspon a
formes esporàdiques, que esdevenen habitualment en individus de risc mig
(homes i dones majors de 50 anys, sense antecedents personals ni familiars
d'aquesta neoplàsia). En un percentatge limitat (3-5%), el CCR es desenvolupa
en el context de formes hereditàries (poliposi colorectal i síndrome de Lynch)

28
on la causa genètica està ben establerta i, només un percentatge molt limitat
(<1%) són en context d’una malaltia inflamatòria intestinal de llarga evolució.
Finalment, en un 25-30% de pacients existeixen antecedents familiars de CCR,
encara que sense arribar a complir els criteris diagnòstics de les formes
hereditàries, el denominat CCR familiar.4
2.2. Història natural del càncer colorectal. Pòlips colorectals
La clàssica seqüència adenoma-carcinoma descriu l’acumulació d’una sèrie de
mutacions genètiques que permet la progressió a adenoma avançat i a càncer
invasiu.5 Durant els darrers 30 anys, aquest model s'ha utilitzat com a marc
essencial per entendre la patogènia del CCR. Més recentment, gràcies a la
caracterització molecular i fenotípica s’ha demostrat heterogeneïtat patogènica i
vies alternatives de carcinogènesi. És important destacar que aquestes vies
alternatives al model adenoma-carcinoma convencional representen el 15%-
30% dels casos de CCR. Així, diverses línies d'evidència suggereixen que
alguns subtipus de pòlips serrats són lesions precursores per a càncers
d'origen no adenomatós, la denominada "via serrada".6
La gran majoria dels CCR es desenvolupen a partir d’un pòlip però en canvi,
només un petit nombre de pòlips (5-10%) esdevenen càncers.7 Els pòlips
corresponen a tota aquella lesió que protueix des de la paret cap a la llum
intestinal. Segons la classificació de Paris, els pòlips del còlon els dividim en
funció de la base de sustentació es divideixen en polipoides i no polipoides.8
Segons les seves característiques histopatològiques es divideixen en 3 grups;
els pòlips adenomatosos que representen el grup més freqüent (70%), els
pòlips serrats (10-25%) i un grup heterogeni (10-20%) format per pòlips

29
inflamatoris i hamartomatosos (veure Taula 1). En funció del grau de displàsia
es divideixen en displàsia d’alt i baix grau. La presència d’adenomes avançats
(definits com tenir un adenoma ≥1 cm i/o presència d’histologia vellosa i/o
presència de displàsia d’alt grau) i la presència de múltiples adenomes són els
factors que contribueixen a un major risc de desenvolupar CCR.9-11 En els
casos de displàsia d’alt grau, denominat també carcinoma “in situ”, les cèl·lules
neoplàsiques estan confinades a la mucosa i, per tant, el risc de disseminació
es nul, a diferència del càncer invasiu on ja hi ha àrees d’invasió de la capa
muscular de la mucosa de la paret intestinal. Així, parlem de CCR quan les
cèl·lules neoplàsiques han sobrepassat la muscularis mucosa i infiltren la capa
submucosa de la paret intestinal.
Taula 1. Tipus de pòlips colorectals
Tipus de pòlips colorectals
Pòlips neoplàsics
Adenomes o Tubulars o Tubulovellosos o Vellosos
Pòlips serrats amb displàsia o Pòlip o adenoma serrat sèssil amb displàsia o Adenoma serrat tradicional
Pòlips no neoplàsics
• Pòlips serrats sense displàsia: pòlips hiperplàstics, pòlip/adenoma serrat sèssil sense displàsia
• Pòlips inflamatoris • Pòlips hamartomatosos
Les mesures de vigilància dels pòlips colorectals després de la seva resecció
varien en funció del nombre, mida i histologia dels pòlips ressecats en un
pacient. L’algoritme de vigilància més utilitzat al nostre entorn és el proposat
per la Guia Europea de qualitat dels programes de cribratge i diagnòstic de
CCR (Figura 2).12

30
En general, en el cas de pacients amb un o dos adenomes tubulars amb
displàsia de baix grau i menors a 10mm es recomana retornar al programa de
cribratge. La colonoscòpia de control als 3 anys es recomana per aquells
pacients amb lesions de risc intermedi (tenir tres o quatre adenomes; o un
adenoma de 10-19mm; o component vellós; o displàsia d’alt grau). I, als
pacients amb cinc o més adenomes menors a 10mm o amb un adenoma major
o igual a 20mm es recomana colonoscòpia en un any.
Figura 2.Classificació dels resultats de la colonoscòpia i recomanacions de seguiment
Font: von Karsa et al., 2013.

31
2.3. Prevenció del càncer colorectal
Tot i que el CCR suposa la segona causa de mort per càncer,
és un dels tumors amb més possibilitats de prevenció. Per a això, cal
intensificar els esforços en els diferents nivells d'actuació (prevenció
primària, secundària, terciària). La prevenció primària té com a objectiu evitar
l'aparició del CCR a la població general mitjançant la modificació d'hàbits
dietètics i el seguiment d'estils de vida saludables. La prevenció secundària o
cribratge té com a objectiu detectar el càncer o els pòlips en una fase precoç,
abans que apareguin símptomes, en pacients identificats amb una major
probabilitat de CCR. La prevenció terciària fa referència a tots els procediments
o tractaments que es realitzen en els pacients amb la malaltia per tal d'evitar les
complicacions clíniques i les recaigudes.
2.3.1. Prevenció primària del càncer colorectal
La dieta i els estils de vida juguen un paper important en la carcinogènesi del
CCR (Taula 2). En els darrers anys, estudis epidemiològics i experimentals han
associat la ingesta d’alguns aliments i nutrients amb el risc de CCR.13, 14 Així,
els vegetals15 i la fruita15 són els aliments amb major evidència de disminuir el
risc d’aquest càncer. En canvi, el consum de carn vermella i processada16 està
associat a un augment de risc de CCR. A més, hi ha evidència substancial que
el calci17 podria tenir un potencial efecte quimiopreventiu. Pel que fa a altres
suplements (la vitamina A, la vitamina C, la vitamina D, la vitamina E i l'àcid
fòlic), ara per ara els estudis mostren una associació inconsistent amb el
CCR.17

32
No obstant, en realitat les persones no prenem nutrients de forma separada
sinó que consumim menjars que combinen aliments i nutrients. Per això, els
patrons de dieta també s’han analitzat i s’ha vist que la dieta occidental
(“western”) és la que podria augmentar el risc de CCR mentre que la dieta
mediterrània resultaria protectora.18
En la carcinogènesi del CCR s’ha vist que no només és important la dieta sinó
també l’estil de vida. S’ha demostrat que tenir un pes saludable,19 una elevada
activitat física,20 no fumar21 i tenir un consum d'alcohol limitat22 s'associen amb
una menor incidència de CCR. Així, també s’ha evidenciat una possible
associació amb la síndrome metabòlica, síndrome en augment en països
occidentals, a través del probable estrès oxidatiu i l’estat d’insulinoresistència
que aquesta comporta.23, 24 De fet, és la combinació d’un estil de vida i dieta no
saludable el que explicaria part de l’augment d’incidència de CCR a Europa.3, 25
Totes aquestes evidències han quedat reflectides en el darrer informe del
World Cancer Research Fund i al Codi Europeu Contra el Càncer on es fa
èmfasi de la importància de consumir cereals integrals, llegums, fruites i
verdures i evitar la carn processada i limitar el consum de carn vermella.26
L’adherència a aquestes recomanacions podrien reduir un 25% el risc de
CCR.27
La quimioprevenció es defineix com la utilització d’un component químic
específic per prevenir, inhibir o revertir la carcinogènesi abans del seu
desenvolupament clínic. Aquesta intervenció pot ser iniciada abans del
desenvolupament de lesions precursores o durant l'acumulació d'alteracions
moleculars, cel·lulars i histopatològiques prèvies al desenvolupament d'una
malaltia invasiva. En relació a fàrmacs, no hi ha cap agent quimiopreventiu

33
segur i efectiu per reduir la incidència de pòlips i/o CCR. Des de ja fa dècades,
l'acumulació d'evidències a partir d'estudis observacionals i assaigs aleatoris28-
32 suggereix que l'aspirina i altres fàrmacs antiinflamatoris no esteroïdals (AINE)
protegeixen contra el desenvolupament d'adenomes del còlon i el CCR i
redueixen la recurrència de la malaltia.30, 31, 33, 34 Tot i així, la United States
Preventive Services Task Force35 recentment només recomana l’ús d’àcid
acetilsalicílic per reduir el CCR en adults d’entre 50 a 69 anys amb elevat risc
cardiovascular. No es recomana l’ús d’aquest principi actiu de forma
generalitzada a individus més joves o sense malaltia cardiovascular donat el
risc d’hemorràgia digestiva o intracerebral. Altres fàrmacs com les estatines36 i
altres suplements (esmentats ja en l’apartat de dieta) han estat estudiats però
sense prou seguretat i/o evidència per ser utilitzat com agents quimiopreventius
en la població general.

34
Taula 2. Riscs relatius de cada factor respecte el risc de càncer colorectal
Variable Nivell RR (IC 95%) Vegetals Ingesta més alta versus ingesta més baixa
(≥284.5 vs. ≤95,1 g/dia) 0,91 (0,86-0,96)15
Fruita Ingesta més alta versus ingesta més baixa (≥342,7 vs. ≤92,8 g/dia)
0,90 (0,83-0,98)15
Carn vermella Ingesta més alta versus ingesta més baixa (>45 vs. 0-22g/dia)
1,11 (1,01-1,22)16
Calci Ingesta més alta versus ingesta més baixa (0 vs.≥200 mg/dia)
0,80 (0,70-0,92)17
Vitamina D Ús versus no ús (0 vs. >0–400 UI/dia) 0.92 (0.78-1.09)17 Pes IMC≥30 kg/m2 versus IMC<25 kg/m2
Circumferència abdominal augmentada (Homes≥ 102 cm; dones ≥ 88 cm) versus normal
1,33 (1,25-1,42)19 1,46 (1,33-1,60)19
Activitat física Quartils d’activitat física en el temps lliure 0,81 (0,75-0,88)20 Tabac 5 versus 0 paquets/any
30 versus 0 paquets/any 1,06 (1,03–1,08)14 1,26 (1,17–1,36)14
Alcohol ≥50g/dia versus 0g/dia 1,52 (1,27-1,81)22 Síndrome metabòlica
Tenir síndrome metabòlic versus no tenir-ne 1,33 (1,18-1,50)23
Antecedents familiars
Tenir un antecedent familiar de primer grau versus no tenir cap antecedent
1,88 (1,72-1,93)4
Àcid acetilsalicílic Ús regular versus placebo a assaigs clínics aleatoritzats
0,58 (0,44-0,78)37
Antiinflamatoris no esteroïdals
Antiinflamatoris no esteroïdals versus placebo en la recurrència d’adenoma a l’any a assaigs clínics aleatoritzats
0,68 (0,63-0,73)32
Estatines Estatines versus placebo a assaigs clínics aleatoritzats
0,89 (0,74-1,07)36
IMC: índex de massa corporal
La World Cancer Research Fund global network (http://www.wcrf.org) en el seu
darrer informe ha reportat que disminuiria un 47% la incidència de CCR
aproximadament al Regne Unit si es mengés millor, es begués amb moderació,
es realitzés activitat física i es mantingués un pes saludable (Taula 3).

35
Taula 3. Possibilitat de prevenció amb canvis d’estils de vida i cribratge en el CCR en països
desenvolupats.
Càncers previnguts per
100.000 habitantsa
Estimació del càncer
previngut (%)
Canvi estils de vidab 1.530 45
Cribratge 867 26
Canvis estils de vida i cribratge 2.007 59
aIncidència acumulada (0-74 anys) en països amb ingressos elevats és de 3.400 per 100.000 habitants (Globocan 2012) bEstimacions de càncer previngut seguint una apropiada dieta, nutrició, activitat física i aconseguint pes saludable. Font: http://www.wcrf.org
Malgrat que molts estudis afirmen que la modificació de l’estil de vida
provocaria una gran reducció del càncer, estudis aleatoritzats no han demostrat
que canvis en la dieta influeixin en la recurrència d’adenomes.38-40 De fet, s’ha
vist que tot i la recomanació general de la importància de millorar els estils de
vida, la prevalença dels factors de risc associats a CCR no ha disminuït a la
població occidental, ni als supervivents d’un CCR.41-43
En algunes poblacions de menor nivell sociocultural, això es podria atribuir a
desconeixement però en la major part dels casos es produeix perquè implica
canvis profunds de comportament, i no només això sinó que posteriorment s’ha
de mantenir l’hàbit saludable. Per aquesta raó, a la nostra població l’aplicació
d’un cribratge de qualitat és la forma més efectiva de disminuir el risc de CCR.

36
2.3.2. Prevenció secundària o cribratge del càncer colorectal
El cribratge és la recerca sistemàtica, mitjançant una prova o exploració, d’una
malaltia en fase precoç o de lesions precursores a aquesta, en una població
asimptomàtica.
Wilson i Junger44 van definir els principis necessaris per implantar un programa
de cribratge i, posteriorment, la Organització Mundial de la Salut al 2008 va
presentar una revisió de criteris adaptats als avenços tecnològics.45 Aquests
principis modificats es mostren a la Taula 4.
Taula 4: Principis d’un programa de cribratge segons l’Organització Mundial de la Salut
El programa de cribratge ha de respondre a una necessitat reconeguda.
Els objectius de detecció han de ser definits des del principi.
Hi ha d'haver una població definida.
Hi ha d'haver evidència científica de l'eficàcia del programa de cribratge.
El programa ha d'integrar l'educació, les proves, els serveis clínics i de gestió
dels programes.
Ha d'haver garantia de qualitat, amb mecanismes per minimitzar els riscos
potencials del cribratge.
El programa ha d'assegurar l'elecció informada, la confidencialitat i el respecte
per l'autonomia.
El programa ha de promoure l'equitat i l'accés a la detecció de tota la població
diana.
L'avaluació del programa s'ha de planificar des del principi.
Els beneficis generals de cribratge han de compensar el danys.
Font: Andermann et al., 2008
El CCR és una entitat susceptible de cribratge, atès que constitueix un
problema de salut important per la seva elevada incidència i morbimortalitat

37
associada, es coneix la seva història natural, es disposa de mètodes
diagnòstics que permeten detectar la malaltia en fases inicials i el seu
tractament és més efectiu quan es diagnostica en un estadi precoç. A més, el
cribratge de CCR ha demostrat ser més cost-efectiu que el cribratge de càncer
de mama i el de cèrvix.46
L'objectiu d'aquest cribratge és reduir la mortalitat per CCR. A més, a diferència
d’altres cribratges, donat que en alguns casos es pot detectar la lesió
preneoplàstica i actuar sobre ella, en el cribratge de CCR pot disminuir-se la
incidència encara que d’una forma limitada.
2.3.2.1. Programes poblacionals de cribratge de càncer colorectal
Des del punt de vista organitzatiu, el cribratge del càncer es pot oferir a la
població com un programa organitzat (dirigit al conjunt de la població) o com a
cribratge oportunista (realitzat a una persona quan es presenta en un servei
sanitari) (Taula 5). L’evidència disponible indica que els programes organitzats
permeten aconseguir una cobertura més àmplia i equitat en el seu accés.47

38
Taula 5. Diferències entre cribratge organitzat i cribratge oportunista
Aspecte del cribratge Cribratge organitzat Cribratge oportunista
Mètode de cribratge (Ex: PDSOF, colonoscòpia, etc.) Fixat i escollit pel govern Variable: escollit per l’individu
o el proveïdor
Població diana Conjunt de la població amb una edat específica (equitat)
Variable: per recomanació mèdica o sol·licitud de
l’individu
Estratègia d’invitació Activa: qualsevol persona dins la població diana
Passiva: no hi ha estratègia consistent
Objectiu Reduir la mortalitat +/-incidència a nivell poblacional
Reduir la mortalitat +/- incidència a nivell individual
Sensibilitat de la prova No es busca la prova més sensible per usar-la a nivell
poblacional.
S’usa la prova amb més sensibilitat.
Especificitat de la prova Important l’elevada
especificitat per evitar el cost de falsos positius i efectes
adversos
Menys important
Interval de cribratge Fixat per maximitzar el
benefici poblacional a un cost raonable
Variable. Normalment més freqüent per maximitzar la
protecció de l’individu
Recursos sanitaris disponibles
Limitats a la població segons política de salut
Limitat a nivell individual. Sobretot depèn dels ingressos
i assegurances privades. Valoració de la tecnologia sanitària
Ha demostrat ser millor el benefici que el risc
No és necessari que es demostri eficàcia
Garantia de qualitat Els objectius establerts s’han d’aconseguir i monitoritzar
Els objectius s’estableixen però pot ser que es
monitoritzin o no
Percentatge de participació Especificada, monitoritzada i
una baixa participació resultarà en un esforç
organitzatiu per millorar-ho
Pot o no ser especificada, monitoritzada. Poca oportunitat
per una millora a nivell poblacional
Avaluació i monitorització Cobertura Resultats Qualitat
Difícil d’avaluar i monitoritzar
Relació amb el risc de càncer
No necessàriament les persones d’alt risc, però sí el grup d’edat que rebrà més
benefici del cribratge
No necessàriament les persones d’alt risc, pot portar
al cribratge excessiu de persones de baix risc i al no
cribratge de persones d’alt risc
Beneficis Maximitzats per la població dins dels possibles recursos Maximitzats per l’individu
Riscos Minimitzats per la població dins dels possibles recursos
No necessàriament minimitzats
PDSOFi: prova de detecció de sang oculta en femta immunològica.
La Unió Europea fomenta la implementació de cribratge organitzat versus
oportunista i proposa indicadors48 clau de rendiment per a l'assegurament de la
qualitat, i per a monitoritzar i comparar els resultats dels programes de

39
cribratge. Actualment, 20 dels 28 estats de la Unió Europea estan iniciant o
implementant un programa organitzat de cribratge de CCR (Figura 3).49
Figura 3. Distribució dels programes de cribratge de CCR a la Unió Europea
Font: Ponti et al, 2017.
Els prerequisits per a un cribratge de càncer organitzat segons la International
Agency for Research on Cancer són: a) llei o una notificació oficial que
especifica la població objectiu, proves de detecció i intervals de cribratge; b) el
finançament públic; c) planificació ben definida per convidar els homes i les
dones elegibles; d) un equip de gestió responsable de l’execució del programa;
e) una estructura robusta per assegurar la garantia de qualitat.49 A més, per fer
un correcte seguiment dels resultats del cribratge cal seguir uns indicadors ja
establerts. Atès que els programes de cribratge conviden a persones sanes,
sense símptomes, és fonamental aconseguir un efectiu control de qualitat per

40
garantir que els beneficis del cribratge (major supervivència i qualitat de vida)
superin els danys (resultats falsos negatius i falsos positius, les complicacions
relacionades). A aquest efecte, els programes de detecció tenen la
responsabilitat de garantir que la qualitat s'ha optimitzat en tots els sentits: alta
qualitat, procediment segur i una experiència satisfactòria. A més, aconseguir
una implementació amb èxit d’un programa de cribratge requereix una
acceptació social acompanyat del seguiment de les millors evidències i la
verificació d’una adequada actuació en cada fase de la implementació del
cribratge.50
2.3.2.2. Proves utilitzades en el cribratge del càncer colorectal
En la valoració del risc individual de CCR s'ha de considerar l'edat i els
antecedents personals i familiars d'adenomes colorectals i CCR. En absència
d’antecedents personals o familiars, l’edat és el factor més important identificat
per risc de càncer. Per això, actualment l’estratègia de cribratge poblacional es
basa en l’edat (dels 50 als 69 anys) per la seva implantació. No s’ha definit
quina és la “millor” estratègia pel cribratge de CCR però les guies posen de
manifest la necessitat de realitzar el cribratge, independentment de l’estratègia
utilitzada, donat que el màxim benefici obtingut en la reducció de mortalitat
prové precisament del fet de participar, més que de l’estratègia utilitzada amb
aquest fi.49, 51, 52 Les estratègies més emprades en el cribratge poblacional
inclouen una prova de detecció de sang oculta en femta (PDSOF), la
sigmoidoscòpia (en combinació o no amb una PDSOF) i la colonoscòpia.
A Europa la majoria de programes realitzen cribratge entre els 50 i 74 anys,
cada 2 anys si el cribratge és amb una PDSOF, o cada 10 i 5-10 anys si es
realitza amb colonoscòpia o sigmoidoscòpia, respectivament (veure Figura 4).

41
Actualment a Espanya, es realitza cribratge a homes i dones d’entre 50 i 69
anys sense antecedents personals ni familiars de CCR i es realitza amb la
PDSOFi amb una periodicitat biennal. Catalunya, a través de l’Institut Català
d’Oncologia, va ser la pionera en la implementació d’un programa de cribratge
poblacional a Espanya a través d’un estudi pilot amb la ciutat de l’Hospitalet de
Llobregat.
Figura 4. Proves utilitzades en el cribratge de càncer colorectal a la Unió Europea
C: colonoscòpia; PDSOFi: prova de detecció de sang oculta en femta immunològica; PDSOFg: prova de detecció de sang oculta en femta basada en guaiac; S: sigmoidoscòpia. Font: Ponti et al, 2017.

42
Les proves utilitzades en el cribratge de CCR actualment a Europa són de dos
tipus (Figura 5):51
PDSOF (basada en guaiac o immunoquímica): aquestes proves són
efectives en identificar CCR precoçment i, per tant, poden disminuir la mortalitat
per CCR. Alguns pòlips preneoplàstics poden ser detectats, oferint la
possibilitat per la polipectomia i per evitar un càncer, però aquesta oportunitat
per la prevenció és limitada i no és l’objectiu primari d’aquestes proves de
cribratge.53
Proves endoscòpiques (sigmoidoscòpia o colonoscòpia): són les proves
capaces de detectar CCR i lesions preneoplàstiques. Si són realitzades
adequadament poden disminuir no només la mortalitat per CCR sinó també la
incidència de CCR gràcies a la polipectomia de les lesions preneoplàstiques
detectades.51, 54, 55
Figura 5. Tipus de proves de cribratge
CCR: càncer colorectal; PDSOF: prova de detecció de sang oculta en femta.
43
2.3.2.2.1. Proves de detecció de sang oculta en femta
La prova de detecció de sang oculta en femta basada en guaiac (PDSOFg) i la
prova de detecció immunològica de sang oculta en femta (PDSOFi) es basen
en la detecció de sang que prové de la mucosa del còlon o recte ulcerada.
Múltiples assaigs clínics aleatoritzats han demostrat una reducció de la
mortalitat per CCR en un 16% amb cribratge basat en PDSOFg.56 Malgrat
l’absència d’assaigs clínics aleatoritzats amb la PDSOFi, dades prospectives
donen suport a la seva eficàcia com una eina de cribratge.56-59 A més, en
comparació amb la PDSOFg, la PDSOFi té una millor sensibilitat, especificitat,
adherència i, a més, és automatitzada, objectiva i no requereix d’una dieta
especial abans de la seva realització.60
La PDSOFi detecta sang a la femta a través d’anticossos contra la globina
humana. S’usen PDSOFi qualitatives, quantitatives, de diferents marques i amb
diferents llindars de detecció d’hemoglobina. La PDSOFi més freqüentment
utilitzada és OC-Sensor (Eiken Chemical Co., Japan) amb un llindar de 20µg
Hb/g (100ng Hb/mL). En un context de cribratge poblacional, s’ha descrit que
OC-Sensor té una sensibilitat del 79% i una especificitat del 91% per detectar
un CCR61 i una sensibilitat del 29% i una especificitat del 97% per detectar un
adenoma avançat.62
2.3.2.2.2. Proves endoscòpiques
La sigmoidoscòpia és l’exploració endoscòpica des del recte fins a 60 cm de
marge anal (angle esplènic). Assaigs clínics aleatoritzats han demostrat que el
cribratge amb sigmoidoscòpia, seguits d’una colonoscòpia si es detecten pòlips
preneoplàstics, disminueix la mortalitat per CCR en un 73% respecte a no fer

44
cribratge.54, 63 Només requereix preparació amb ènemes rectals, dura poc i es
pot fer sense sedació. No obstant, a Espanya aquesta tècnica no s’utilitza i, a
més, el benefici d’aquesta tècnica està limitada al còlon distal (recte, sigma i
còlon descendent). Tenir pòlips distals està associat amb un augment de la
prevalença de neoplàsia proximal sincrònica però un 2-5% de pacients poden
tenir lesions preneoplàstiques proximals aïllades.64
La colonoscòpia és la prova patró or per la detecció precoç i prevenció del CCR
tant distal com proximal. Es considera la primera tècnica diagnòstica a realitzar
després d’una prova de cribratge, ja sigui una PDSOF o la sigmoidoscòpia o
una prova d’imatge.12, 53 El problema de la colonoscòpia és el major cost i
necessitat de recursos i la menor acceptabilitat65 per la població donat que pot
provocar més complicacions com dolor abdominal, hemorràgia i perforació; la
preparació pot ser mal tolerada; i precisa sedació per evitar el malestar i dolor
abdominal que pot aparèixer durant el procediment.51, 66, 67
Tot i que manquen dades d’assaigs clínics avaluant l’efecte sobre la taxa de
mortalitat, aquesta prova també és adequada com una possible estratègia de
cribratge en base a estudis epidemiològics que han demostrat la disminució de
la mortalitat amb el cribratge amb colonoscòpia.55, 68-70 Hi ha varis assaigs
clínics actualment en curs per comparar una estratègia de cribratge mitjançant
colonoscòpia completa amb la PDSOFi utilitzant com a objectiu primari la
mortalitat per CCR.71-74 Un dels 3 estudis (COLONPREV) va publicar una
anàlisi intermèdia després de la primera ronda de cribratge.71 En aquest estudi,
els individus eren convidats a una colonoscòpia de cribratge (n=26.703) o a
una PDSOFi biennal (n=26.599) utilitzant el dispositiu OC-Sensor amb un punt
de tall de 15 µg Hb/g. La participació va ser més gran en el grup de la PDSOFi

45
(34,2% enfront de 24,6%), sense diferència en la detecció de CCR. La detecció
de neoplàsia avançada va ser major en els individus aleatoritzats a
colonoscòpia (1,9% enfront de 0,9%) però l’efectivitat comparativa a llarg
termini està pendent de determinar.
2.3.2.3. Altres proves de cribratge en el càncer colorectal
La colonoscòpia virtual o colonografia mitjançant tomografia computada (TC) és
una tècnica d’imatge que permet visualitzar el còlon mitjançant una
reconstrucció tridimensional. S’ha descrit una sensibilitat del 67-94% i una
especificitat del 86-97% per detectar adenomes majors o iguals a 1 cm.63 Tot i
així, no es disposen dades que avaluïn l’ús d’aquesta tècnica com a primera
prova de cribratge. Tot i que podria ser una prova amb una major acceptació i
adherència per part de la població, aquesta tècnica té un cost elevat, requereix
d’una preparació del còlon, pot detectar troballes extraintestinals comportant la
necessitat de noves proves i implica radiació corporal.
La càpsula endoscòpica és una tècnica d’imatge que consisteix en la ingesta
d’una càpsula amb una càmera en cada extrem que a mesura que circula pel
tub digestiu va captant imatges de la mucosa intestinal. Concretament,
actualment s’està utilitzant la càpsula endoscòpica de segona generació que ha
demostrat en una metaanàlisi una sensibilitat i especificitat per pòlips majors o
iguals a 6 mm 84% i 64%, respectivament.75 Actualment no està aprovada per
la FDA per realitzar cribratge poblacional. Basant-se en aquests resultats,
podria ser una alternativa adequada a la colonoscòpia en els pacients que no
volen ser sotmesos a colonoscòpia o per a aquells en què no és tècnicament
factible.

46
En els darrers anys, l’ús de marcadors d’ADN, ARN i proteïnes en teixits
biològics per la detecció precoç del CCR ha incrementat exponencialment. La
detecció en femta de marcadors moleculars de l’ADN alterat procedent de
cèl·lules tumorals es basa en la capacitat d’exfoliació de les cèl·lules de la
neoplàsia i de mantenir el seu ADN estable en femta. Així, es poden analitzar
mutacions, inestabilitat de microsatèl·lits i canvis epigenètics en diversos
gens.76 No obstant, de moment només les proves de detecció d’ADN han estat
sotmesos a totes les proves de desenvolupament i clíniques necessàries per
valorar la seva utilitat en la pràctica clínica. Recentment, una prova de detecció
de sang oculta i ADN en femta (Cologuard® Multitarget Stool DNA, Exact
Sciences, Madison) ha demostrat una major sensibilitat (92%), tot i que amb
una menor especificitat (87%) que la PDSOFi per la detecció de CCR precoç i
adenomes avançats.77 La PDSOFi anual és més efectiva que realitzar la
PDSOF amb ADN cada 3 anys,78 de manera que aquesta nova prova és poc
probable que reemplaci la PDSOFi en programes organitzats de cribratge.
Una línia paral·lela és el descobriment de nous marcadors de la metilació de
l’ADN tumoral en plasma. Entre aquests, la FDA aprovà una prova que detecta
la metilació en el gen SEPT9 en sang (Epigenomics, Seattle). Manquen estudis
que avaluïn el seu impacte en la reducció de la mortalitat per CCR. En un
estudi prospectiu realitzat en població de cribratge, SEPT9 ADN va mostrar una
baixa sensibilitat (48%) tot i una elevada especificitat (92%) per la detecció de
CCR.79 Donat que és una tècnica inferior a la PDSOFi, la United States Multi-
Society Task Force no recomana el seu ús pel cribratge.

47
2.3.2.4. Beneficis i riscos del programa de cribratge de càncer
colorectal
Si bé l’objectiu de la detecció precoç d’un càncer és principalment reduir la
mortalitat per aquesta causa, abans de recomanar un cribratge cal tenir en
compte que la seva implementació obtindrà un beneficis però també efectes
adversos (Figura 6).
Figura 6. Riscs i beneficis del cribratge de CCR
CCR: càncer colorectal; PDSOF: prova de detecció de sang oculta en femta.
La qualitat d’un programa de cribratge és molt important a l’hora de determinar
la corba tant dels beneficis com dels efectes adversos i la relació entre recursos
emprats i efectes adversos.80 Quan la qualitat del cribratge és baixa, la relació
entre benefici i risc, a qualsevol intensitat de cribratge, canvia, com mostra la
Figura 7, i és possible que els efectes adversos siguin superiors al benefici del
cribratge.

48
Figura 7. Efectes adversos i beneficis en funció de la qualitat del cribratge
Font: Gray et al, 1998.
Un cribratge s'hauria d'oferir sempre dins d'un context d’un programa organitzat
amb un rigorós sistema d'avaluació del procés i dels resultats.
Les activitats d'avaluació i control dels programes permeten conèixer el grau
d'assoliment dels objectius del cribratge i emprendre les accions correctores
que es considerin necessàries per desenvolupar una gestió adequada
del programa i propiciar una utilització adequada i eficient dels recursos.
Els programes de cribratge de CCR han de garantir el compliment dels requisits
de qualitat establerts per la guia Europea,12 entre els quals
cal destacar que les colonoscòpies siguin efectuades per professionals
específicament acreditats i mitjançant procediments objecte de validació
continuada per assolir el màxim grau possible de seguretat.
Com ja hem esmentat abans el cribratge té un clar benefici donat que s’ha
demostrat que la detecció precoç del CCR es eficaç per reduir la mortalitat i, en
alguns casos, també la incidència de CCR.
A) Baixa
Qualitat
Extensió del cribratge
Efectes adversos
Efec
te
Beneficis
Efectes adversos
Extensió del cribratge
B) Baixa Qualitat
Efec
te
Beneficis Beneficis
Beneficis
Efectes adversos
Extensió del cribratge
B) Alta Qualitat
Efec
te
A) Baixa Qualitat
Extensió del cribratge
Efec
te

49
2.3.2.4.1. Efectes adversos
2.3.2.4.1.1. Falsos positius
Pel que fa als riscs derivats del cribratge, l’efecte advers més freqüent és el
nombre de falsos positius. La definició de fals positiu està en debat, però en
general, es defineix fals positiu l’obtenir una PDSOFi positiva (≥20 µg Hb/g)
seguida d’una colonoscòpia sense lesions de risc intermedi o alt o CCR.
Segons la guia Europea12 (veure Figura 2). Un fals positiu pot comportar una
angoixa pel pacient,81-83 un cost addicional per la sanitat pública84 i la realització
de colonoscòpies no indicades amb els seus potencials riscs. De fet, és la
realització d’una colonoscòpia, tècnica diagnòstica realitzada posterior a una
PDSOF positiva, el que comporta les complicacions més greus del cribratge,
com són l’hemorràgia i la perforació. La taxa de complicacions és de 4
perforacions i 8 hemorràgies greus per 10.000 procediments.51
Reduir el nombre de falsos positius vol dir millorar la balança risc-benefici del
cribratge. Ara per ara, hi ha alguns estudis que han analitzat els factors
associats a un resultat fals positiu amb la PDSOFi.85-89 Wong et al.85 reportà
que un 81% i Stegeman86 un 65% dels pacients que van obtenir un positiu a la
PDSOFi i no tenien neoplàsia avançada (absència d’un adenoma ≥10mm,
component vellós o displàsia d’alt grau a la colonoscòpia). S’ha descrit que
l’edat,85, 86 el tabac,85 el sexe,86 els antiinflamatoris no esteroïdals,86 els
antiagregants90 i les hemorroides,87 s’associen a un fals positiu de la PDSOFi.
El nostre grup d’investigació91 va analitzar el cribratge a la població d’Hospitalet
de Llobregat entre els anys 2000 i 2010 basat en PDSOFg. En aquell moment
es va descriure una taxa de resultats positius del 55,2% i els factors associats a
un fals positiu van ser el sexe femení, la primera ronda de cribratge del

50
programa, el cribratge successiu i el diagnòstic de fissura anal o hemorroides.
A més, cal tenir en compte que si la colonoscòpia no es realitza seguint els
criteris de qualitat necessaris,92 una lesió que havia estat detectada per la
PDSOFi podria passar desapercebuda en la colonoscòpia i ser definida
erròniament com a fals positiu. Per últim, la presència d’una lesió al tracte
gastrointestinal alt sembla no estar associat amb la positivitat de una PDSOFi
per la degradació de la globina per proteases durant el pas gastrointestinal.88, 93
2.3.2.4.1.2. Falsos negatius
Tot i que la PDSOFi té una elevada sensibilitat, el fet que el risc de CCR al llarg
de la vida (0-74 anys) sigui aproximadament un 4%,2 provoca que el benefici
individual sigui petit. A més, aquesta relativa baixa sensibilitat comporta la
presència de resultats falsos negatius. Es defineix fals negatiu obtenir una
PDSOFi negativa (<20 µg Hb/g) seguida d’una colonoscòpia amb lesions de
risc intermedi o alt o CCR. La presència de resultats falsos negatius confereix
falsa seguretat als participants del cribratge i genera un retard en la detecció de
la neoplàsia amb el conseqüent augment del nombre de CCR d’interval (CCR
detectat després d’una PDSOF i abans de que s’hagi realitzat la següent
invitació al programa de cribratge).94 Estudis previs han descrit una proporció
de resultats falsos negatius del 6,4%95 i 7,7%.86 Els factors que s’han descrit
associats a un possible fals negatiu amb la PDSOFi són: la localització
proximal,96 la mida i la severitat de la lesió,97 la morfologia no polipoide
(Classificació de París:8 0-IIb, 0-IIc,0-III),98 el retràs en l’anàlisi99 i la
temperatura ambiental.100

51
Alguns han examinat el CCR d’interval després d’una PDSOF negativa.101-105
En una avaluació del Programa de detecció de càncer d’intestí del Servei
Nacional de Salut a Anglaterra, un 14% de CCR identificats van ser d'interval,
tots ells seguint d’una PDSOFg negativa.104 Més recentment, van der Vlugt et
al.105 ha descrit un 23% de CCR d’interval després de tres rondes de cribratge
amb PDSOFi (llindar de 10 g Hb/g).
Tot i així, cal destacar que s’ha de demostrat que el cribratge successiu cada 1
o 2 anys permet la detecció de lesions prèviament no detectades i, així, es
disminueix el risc del CCR d’interval.106
2.3.2.4.1.3. Sobrediagnòstic i seguiment inadequat
Un altre efecte advers del cribratge és el sobrediagnòstic que es defineix com
el fet de diagnosticar un càncer que mai hagués esdevingut simptomàtic ni
hagués reduït l’esperança de vida d’un individu. Aquest terme s’utilitza per
referir-se a lesions petites de lent creixement que romandrien asimptomàtiques
durant tota la vida del pacient; diagnòstic en pacients amb expectativa de vida
curta, per la seva edat o la seva morbiditat; tumor de creixement ràpid però en
pacient que mor per una altra causa; o casos en què el tractament pal·lia els
símptomes però no retarda la mort.107 Aquest risc és major quan usem proves
de cribratge més sensibles com la colonoscòpia, que detecta pòlips de molt
petita mida. Tenint en compte que en el moment de la colonoscòpia no podem
identificar quins pòlips són els que en un futur més o menys llunyà
evolucionaran a càncer invasiu, actualment es realitza polipectomia de tots els
pòlips (excepte pòlips d’aspecte hiperplàstic localitzats a sigma i recte). Així, tot
52
i que la polipectomia és un procediment terapèutic de baix risc, hi ha pacients
que rebran el tractament i mai no desenvoluparan càncer.
Actualment Luo et al.108 ha reportat entorn a un 7% de sobrediagnòstic amb el
cribratge amb PDSOFg biennal entre els 50-74 anys. Brenner et al.109 va
quantificar l’efecte del sobrediagnòstic en el cribratge de CCR analitzant
aproximadament 4 milions de colonoscòpies de cribratge realitzades al llarg de
10 anys. Tal i com s’observa a la Figura 8, la probabilitat de que un CCR es
detecti precoçment augmenta amb l’edat, així van descriure una probabilitat del
0,5% als 55 anys i entorn un 2% als 80 anys en homes i des de quasi 0,3% als
55 anys i entorn un 1,7% als 80 anys en dones. La probabilitat de
sobrediagnòstic és inferior al 0,1% als 65 anys entre els homes i als 71 anys en
dones, i aquesta augmenta gradualment a 0,9% i 0,6% als 80 anys, en homes i
dones, respectivament. Van estimar una proporció de sobrediagnòstic en
individus de 55-79 anys del 11% en homes i 8% en dones. Mentre que en
pacients majors de 75 anys es produïa un 28% de sobrediagnòstic. Les
probabilitats de prevenció eren majors si usaven la colonoscòpia de cribratge al
voltant dels 60 anys (prop del 5% en homes, 3,5% en dones) i més baixes en
edat més avançada (< 2% als 80 anys en homes i dones). Tot i que el potencial
risc de sobrediagnòstic s'utilitza sovint com un argument en contra de les
diferents possibilitats de cribratge, Brenner et al.109 conclou que el nombre de
casos amb sobrediagnòstic és molt petit en comparació amb el nombre de
càncers previnguts i detectats precoçment.

53
Figura 8. Probabilitat de tenir un CCR previngut o detectat precoçment i de tenir
sobrediagnòstic de CCR d’acord a sexe i l’edat en el moment de la colonoscòpia de cribratge
Font: Brenner et al., 2015.
D’altra banda, una major detecció de pòlips genera un nou problema, i és que
en molts casos la detecció de pòlips obligarà a la realització de colonoscòpies
de seguiment.110 Actualment, la Guia Europea de qualitat dels programes de
cribratge de CCR,12 limita el seguiment endoscòpic només a pacients amb
lesions d’intermedi o alt risc, retornant a cribratge als pacients amb lesions de
baix risc. Un tipus de vigilància inadequada seria repetir massa precoçment una
prova de cribratge en no seguir les recomanacions de les guies vigents. Un
exemple d’aquesta vigilància inadequada s’observa en el treball de Zorzi et
al.111 que va observar un seguiment endoscòpic inadequat en el 67% i el 7%
dels pacients amb lesions de baix risc o sense adenoma, respectivament,
provocant un gran augment de la demanda endoscòpica. Així mateix, altres
autors112-115 també han reportat que no només hi ha un augment innecessari de
colonoscòpies de seguiment després d’una polipectomia de pacients amb
lesions de baix risc, sinó que, el que és més preocupant, és que s’està

54
realitzant un ús a la baixa de les colonoscòpies de seguiment necessàries en el
subgrup de pacients amb lesions de risc intermedi i alt risc.
Finalment, podríem estar fent recomanacions de seguiment inadequades per
falta d’estudis longitudinals especialment en les lesions serrades (que
actualment fem seguiment similar als adenomes quan la via de carcinogènesi
és diferent) i perquè la periodicitat de la colonoscòpia es basa únicament en el
tipus i característiques de les lesions, sense tenir en compte factors de risc
personals com la diabetis mellitus, el tabac o la predisposició genètica, entre
d’altres.
2.3.2.4.1.4. Ús inadequat
Un altre efecte advers del cribratge de CCR és l’ús excessiu de proves de
cribratge. Cal abordar aquest problema perquè innecessàriament pot
augmentar el dany al pacient generat per un sobrediagnòstic (incloent les
complicacions de la colonoscòpia), l’augment de la càrrega de treball de la
unitat d’endoscòpia i el consum de recursos de la sanitat pública.
Pot produir-se un ús excessiu, en primer lloc perquè, com hem dit abans,
aproximadament el 96% d’individus2 no desenvoluparan un CCR
independentment de si realitzem cribratge o no. Per tant, molts individus hauran
de ser sotmesos a proves de cribratge per aconseguir un benefici en una
minoria. De fet, s’ha vist en estudis aleatoritzats que la reducció en la mortalitat
només podrà ser reproduïda si la participació és adequada.116
Per una altra banda, cal tenir en compte un altre tipus d’ús excessiu del
cribratge que consistiria en la implementació d’una prova de cribratge en
individus que tenen una comorbiditat important o una edat que limita

55
l’esperança de vida i que, per tant, no es beneficiarien d’una detecció precoç de
càncer. En pacients que tenen l’edat de cribratge però comorbiditat importants,
caldria que d’alguna manera s’evités que el pacient participés en la següent
ronda de cribratge. Les comorbiditats i estat general basal del pacient són
determinants extremadament importants dels beneficis i riscos del cribratge.117
Un altre aspecte en discussió és fins quina edat ha de prolongar-se la
recomanació de cribratge. A Catalunya, s’implementa dels 50 als 69 anys
ambdós inclosos, mentre que a d’altres països europeus és dels 50 als 74
anys. En el grup de 75 a 85 anys, es recomana individualitzar en funció del
sexe, raça, comorbiditats, la història prèvia de participació en el cribratge i
l’esperança de vida, entre d’altres.118, 119 Pel contrari, existeix consens en
contra de fer detecció precoç en individus amb edats superiors als 85 anys amb
una esperança de vida inferior als 10 anys.52
Recentment, la United States Multi-Society Task Force ha reportat que el
cribratge pot ser beneficiós en persones de fins 86 anys sense cribratge previ
però que cal valorar-ho individualment segons les comorbiditats i l’esperança
de vida. Mentre que persones amb proves de cribratge prèviament realitzades,
sobretot en el cas de tenir una colonoscòpia normal prèvia, es podria aturar el
cribratge als 75 anys o quan la seva esperança de vida sigui menor a 10
anys.120
Així, la decisió sobre si recomanar o no el cribratge en un pacient ancià
requereix una avaluació individualitzada que va més enllà de la presa de
decisions basades únicament en l'edat sinó del balanç entre els riscos i
beneficis en funció de la seva salut i preferències en general. La detecció de

56
CCR podria ser més eficaç i cost-efectiva si es consideressin els factors
individuals de cada pacient d’edat avançada.119
2.3.2.5. Models de risc per la detecció precoç de càncer colorectal
Donats aquests efectes adversos, s’ha començat a pensar en estratègies de
cribratge més personalitzades basades en el risc individual de càncer.
L’objectiu d’aquesta personalització és potenciar els beneficis i, per tant, reduir
la probabilitat de possibles efectes adversos escurçant l’interval entre proves en
aquells individus amb més risc i allargant l’interval de cribratge en aquells amb
un menor risc. L’estratègia actual de realitzar el cribratge tenint en compte
només l’edat major a 50 anys per aplicar un mateix tipus de cribratge
poblacional sense tenir en compte el risc individual de CCR té varies
conseqüències. En primer lloc, pacients de baix risc estan sent sotmesos a
riscos innecessaris i generant una despesa sanitària evitable. Per altra banda,
a pacients d’alt risc se’ls està indicant l’ús d’una PDSOF sent potser una
estratègia diagnòstica subòptima en aquest subgrup d’individus. A més, el fet
de no conèixer el risc individual de CCR probablement disminueix la
participació i adherència al cribratge.
Tot això ha fet que s’hagin començat a crear models de predicció121 de lesions
preneoplàstiques o CCR per aconseguir una certa personalització del cribratge
de CCR. En la població general, entre els factors de risc pel CCR es troben els
antecedents personals o familiars de pòlips i/o CCR i els factors ambientals.122
A banda de les formes hereditàries, la major part del risc familiar de CCR
sembla ser conseqüència de l’efecte conjunt de múltiples variants genètiques
de baix risc o baixa penetrància. Els estudis d'associació de genoma complet

57
(GWAS)123 han identificat, i segueixen identificant, polimorfismes comuns de
nucleòtid únic (SNPs) associats a un major risc de CCR.123 Tot i que el risc
associat amb la variació en cada locus és modest, els genotips de risc són
comuns en la població i, per tant, la seva contribució a la incidència global de
CCR és significativa124 i, en gran mesura, independent de la història familiar.
Un cribratge que inclogués variables ambientals, història familiar i
polimorfismes de susceptibilitat genètica associats a CCR podria millorar
l’eficàcia d’un programa de cribratge.
Els models creats fins ara han inclòs els tradicionals factors de risc de CCR
com l’edat, el sexe, la història familiar, el tabac, l’alcohol, l’índex de massa
corporal, l’activitat física, la dieta i, alguns fàrmacs (antiinflamatoris no
esteroïdals, calci i vitamines).121 A més, amb la identificació dels SNPs, estudis
recents han incorporat la informació de susceptibilitat genètica juntament amb
algun factor de risc tradicional.121, 125-127 El desenvolupament de models de risc
que incorporen les dades de biomarcadors i de SNPs juntament amb
informació de factors de risc ambientals ofereix la possibilitat de millorar el
procés de cribratge de CCR actual, maximitzant la detecció de lesions de risc o
CCR. Un model de risc poligènic que combinés la informació genètica i els
factors ambientals tindria el potencial de permetre una millor selecció dels
individus que s'han de sotmetre a una colonoscòpia. De fet, alguns estudis
previs ja han reportat resultats que apunten que les variants genètiques de
baixa penetrància podrien funcionar en aquesta direcció, mostrant millores en
la precisió discriminatòria en relació a un model que no les inclogués.128 El
model podria permetre seleccionar pacients amb una major predisposició de
CCR en els quals l’estratègia de cribratge inicial més òptima seria la

58
colonoscòpia i no una PDSOF. A més, l’estratificació de risc juntament amb un
bon consell genètic, permetria augmentar la percepció de risc i,
conseqüentment una major participació i adherència al cribratge. A més, el fet
que un individu realment percebi risc de desenvolupar càncer podria fer que
millorés els seus estils de vida, i així, contribuiria a la reducció de la incidència
de CCR.
D’altra banda, els models de risc creats fins ara no s’han implementat donada
la limitada capacitat per predicció i dificultat d’aplicació. El fet simplement
d’implementar una PDSOF a nivell poblacional és molt més senzill i econòmic
que aconseguir variables clíniques dels pacients i realitzar una prova genètica.
Calen més estudis per valorar la generalització, utilitat i cost-eficiència de
realitzar un genotipat i adquirir variables clíniques per permetre l’estratificació
del cribratge poblacional.

3. HIPÒTESIS I OBJECTIUS


61
3.1. Hipòtesis
La precisió de la prova de cribratge estarà condicionada pel tipus de prova que
estem utilitzant, la PDSOFi, però també per les circumstàncies individuals dels
participants en el programa: concentració d'hemoglobina en sang, consum de
fàrmacs, presència d'altres lesions sagnants en el tracte gastrointestinal o la
morfologia, localització i mida dels pòlips, entre d’altres. Els efectes adversos
del cribratge podrien reduir-se si coneguéssim els determinants associats a
resultats falsos positius o negatius.
També podríem reduir aquests riscos utilitzant estratègies més personalitzades
de cribratge, basades en risc de CCR individual i la probabilitat d’efectes
adversos.
Una fracció del risc de patir CCR es deu a l'adquisició hereditària de variants
genètiques que modifiquen certes funcions cel·lulars, possiblement a
l’interactuar amb exposicions ambientals. La identificació d'aquestes variants,
en combinació amb altres factors ambientals pot permetre elaborar models per
estratificar la població en grups de risc als quals es pugui oferir estratègies de
prevenció personalitzades.

62
3.2. Objectius
1. Identificar els factors associats d’un resultat fals positiu de la PDSOFi en
un programa poblacional de cribratge de CCR, amb especial atenció a la
prescripció de fàrmacs.
2. Determinar la proporció de resultats falsos negatius de la PDSOFi i
explorar els seus determinants en un programa de cribratge de CCR.
3. Elaborar un model de predicció del risc de CCR basat en població
espanyola que combini la predisposició genètica (polimorfismes de
nucleòtid simple comuns associats a un major risc de CCR), factors
ambientals i els antecedents familiars per estratificar la població en grups
de risc de CCR.

4. METODOLOGIA


65
4.1. Programa poblacional de detecció precoç de càncer colorectal - ICO
El primer i segon article que formen aquesta Tesi Doctoral han pogut realitzar-
se gràcies a les dades del programa de cribratge de CCR que lidera l’Institut
Català d’Oncologia (ICO). L’any 2000 es va iniciar la implementació d’un
programa de cribratge biennal a l’Hospitalet de Llobregat, constituint així el
primer programa poblacional de detecció precoç de CCR a Espanya.
Posteriorment, al 2004, s’afegeix Vilafranca del Penedès, i és al 2015 quan
l’ICO assumeix l’expansió del programa a l’àrea Metropolitana Nord
(Barcelonès Nord, Baix Maresme i Maresme Central) i Sud (Baix Llobregat i
Garraf) amb una població total de 474.000 persones.
A Catalunya s’ha implementat la PDSOFi biennal com a estratègia de cribratge
i s’adreça a una població diana d'homes i dones de 50 a 69 anys (veure Figura
9). Els criteris d’exclusió per a participar són: antecedents personals de CCR o
adenomes, antecedents familiars de CCR, malaltia inflamatòria intestinal,
colonoscòpia en els darrers 5 anys, PDSOF en els darrers 2 anys, malaltia
terminal o severa. Es convida a la població elegible a participar en el programa
mitjançant una carta. Actualment, l’obtenció de la mostra es realitza a domicili,
mentre l’entrega i recollida de la prova s’efectua a través de les oficines de
farmàcia adscrites al programa de prevenció de CCR.

66
Figura 9. Esquema general del programa de detecció precoç de càncer colorectal a Catalunya
TSOF: prova de detecció precoç de càncer colorectal
A les primeres tres rondes de cribratge es va utilitzar una PDSOFg (Hema-
screen, Immunostics Inc.) i des de la quarta ronda s’utilitza una PDSOFi (OC-
Sensor, Eiken Chemical Co.) amb un punt de tall establert per la positivitat de la
prova de 20 g d’hemoglobina/g de femta. En cas de resultat negatiu, l’usuari
rep una carta amb el resultat, i és convidat a tornar a participar als dos anys.
Als casos amb resultat positiu se’ls ofereix realitzar una colonoscòpia al seu
hospital de referència. Si no es troben lesions preneoplàstiques, els participants
són convidats de nou al programa al cap de 10 anys (si encara compleixen
criteris d’inclusió). En cas de trobar lesions associades a intermedi o alt risc de
CCR són remesos per seguiment a atenció primària o atenció especialitzada en
funció de la patologia trobada.

67
El primer article que forma aquesta Tesi Doctoral tenia com a població diana
tots els homes i dones de 50-69 anys de l’Hospitalet de Llobregat i Vilafranca
del Penedès. Es van incloure aquells que obtingueren un resultat positiu en la
PDSOFi, es realitzaren una colonoscòpia entre gener i juliol del 2014 i
contestaren a una enquesta telefònica (Figura 10).
Figura 10. Esquema general de l’estudi 1
PDSOFi: prova de detecció de sang oculta en femta immunològica.

68
El segon article que forma aquesta Tesi Doctoral tenia com a població diana
tots els homes i dones de 50-69 anys de l’Hospitalet de Llobregat. Es van
incloure aquells que obtingueren un resultat negatiu en la PDSOFi en la sisena
ronda de cribratge (novembre 2013 i novembre 2014), es realitzaren una
colonoscòpia i contestaren a una enquesta telefònica (Figura 11).
Figura 11. Esquema general de l’estudi 2
PDSOFi: prova de detecció de sang oculta en femta immunològica.
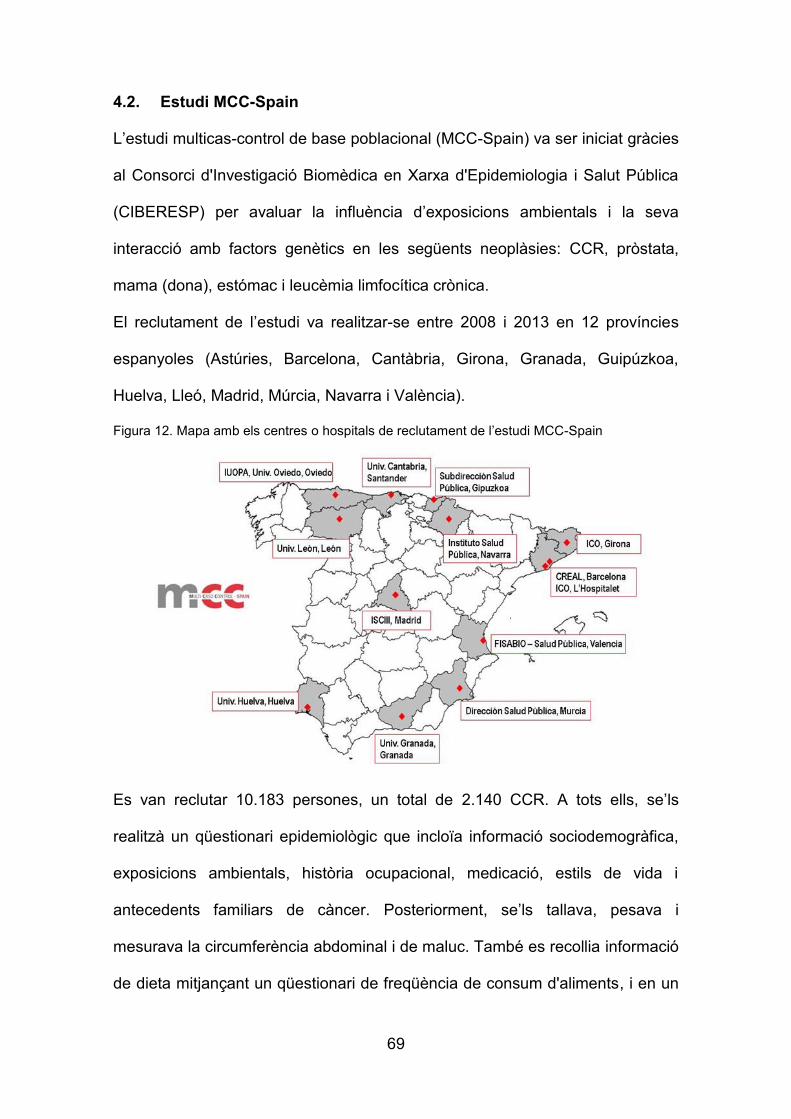
69
4.2. Estudi MCC-Spain
L’estudi multicas-control de base poblacional (MCC-Spain) va ser iniciat gràcies
al Consorci d'Investigació Biomèdica en Xarxa d'Epidemiologia i Salut Pública
(CIBERESP) per avaluar la influència d’exposicions ambientals i la seva
interacció amb factors genètics en les següents neoplàsies: CCR, pròstata,
mama (dona), estómac i leucèmia limfocítica crònica.
El reclutament de l’estudi va realitzar-se entre 2008 i 2013 en 12 províncies
espanyoles (Astúries, Barcelona, Cantàbria, Girona, Granada, Guipúzkoa,
Huelva, Lleó, Madrid, Múrcia, Navarra i València).
Figura 12. Mapa amb els centres o hospitals de reclutament de l’estudi MCC-Spain
Es van reclutar 10.183 persones, un total de 2.140 CCR. A tots ells, se’ls
realitzà un qüestionari epidemiològic que incloïa informació sociodemogràfica,
exposicions ambientals, història ocupacional, medicació, estils de vida i
antecedents familiars de càncer. Posteriorment, se’ls tallava, pesava i
mesurava la circumferència abdominal i de maluc. També es recollia informació
de dieta mitjançant un qüestionari de freqüència de consum d'aliments, i en un

70
96% es van obtenir mostres per extracció de material genètic (76% sang i 27%
saliva). En alguns casos també es van obtenir mostres d’ungles, cabells i orina.
A un subgrup de 1.336 casos i 2744 controls es van analitzar polimorfismes
genètics amb un microarray de genotipat (Infinium Human Exome BeadChip,
Illumina, San Diego, USA). Aquest array contenia 21 SNPs de risc per CCR
identificats en estudis de GWAS.
Figura 13. Esquema general de l’estudi 3
AINEs: antiinflamatoris no esteroïdals; Antec Familiars: antecedents familiars; IMC: índex de massa corporal; SNP: polimorfismes comuns de nucleòtid únic.

5. RESULTATS


ARTICLE 1: Prescription drugs associated with false-positive results when using faecal immunochemical tests for colorectal cancer screening
Ibáñez-Sanz G, Garcia M, Rodríguez-Moranta F, Binefa G, Gómez-Matas J, Domènech X, Vidal C, Soriano A, Moreno V, on behalf of the ‘Adverse Effects on Colorectal Cancer Screening in Catalonia (EACC) Study’ Working Group. Digestive and Liver Disease. 2016; 48(10):1249-54.

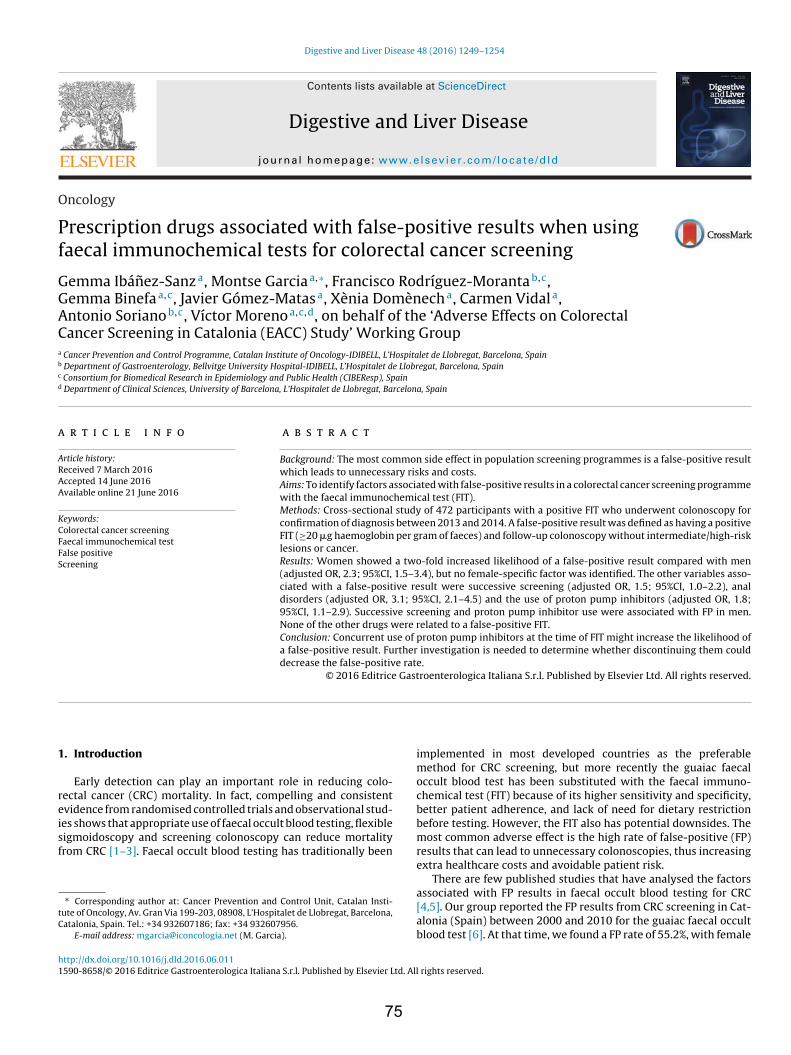
O
Pf
GGACa
b
c
d
a
ARAA
KCFFS
1
reisf
tC
h1
Digestive and Liver Disease 48 (2016) 1249–1254
Contents lists available at ScienceDirect
Digestive and Liver Disease
journa l homepage: www.e lsev ier .com/ locate /d ld
ncology
rescription drugs associated with false-positive results when usingaecal immunochemical tests for colorectal cancer screening
emma Ibánez-Sanza, Montse Garciaa,∗, Francisco Rodríguez-Morantab,c,emma Binefaa,c, Javier Gómez-Matasa, Xènia Domènecha, Carmen Vidala,ntonio Sorianob,c, Víctor Morenoa,c,d, on behalf of the ‘Adverse Effects on Colorectalancer Screening in Catalonia (EACC) Study’ Working Group
Cancer Prevention and Control Programme, Catalan Institute of Oncology-IDIBELL, L’Hospitalet de Llobregat, Barcelona, SpainDepartment of Gastroenterology, Bellvitge University Hospital-IDIBELL, L’Hospitalet de Llobregat, Barcelona, SpainConsortium for Biomedical Research in Epidemiology and Public Health (CIBEResp), SpainDepartment of Clinical Sciences, University of Barcelona, L’Hospitalet de Llobregat, Barcelona, Spain
r t i c l e i n f o
rticle history:eceived 7 March 2016ccepted 14 June 2016vailable online 21 June 2016
eywords:olorectal cancer screeningaecal immunochemical testalse positivecreening
a b s t r a c t
Background: The most common side effect in population screening programmes is a false-positive resultwhich leads to unnecessary risks and costs.Aims: To identify factors associated with false-positive results in a colorectal cancer screening programmewith the faecal immunochemical test (FIT).Methods: Cross-sectional study of 472 participants with a positive FIT who underwent colonoscopy forconfirmation of diagnosis between 2013 and 2014. A false-positive result was defined as having a positiveFIT (≥20 �g haemoglobin per gram of faeces) and follow-up colonoscopy without intermediate/high-risklesions or cancer.Results: Women showed a two-fold increased likelihood of a false-positive result compared with men(adjusted OR, 2.3; 95%CI, 1.5–3.4), but no female-specific factor was identified. The other variables asso-ciated with a false-positive result were successive screening (adjusted OR, 1.5; 95%CI, 1.0–2.2), analdisorders (adjusted OR, 3.1; 95%CI, 2.1–4.5) and the use of proton pump inhibitors (adjusted OR, 1.8;
95%CI, 1.1–2.9). Successive screening and proton pump inhibitor use were associated with FP in men.None of the other drugs were related to a false-positive FIT.Conclusion: Concurrent use of proton pump inhibitors at the time of FIT might increase the likelihood ofa false-positive result. Further investigation is needed to determine whether discontinuing them coulddecrease the false-positive rate.© 2016 Editrice Gastroenterologica Italiana S.r.l. Published by Elsevier Ltd. All rights reserved.
. Introduction
Early detection can play an important role in reducing colo-ectal cancer (CRC) mortality. In fact, compelling and consistentvidence from randomised controlled trials and observational stud-
es shows that appropriate use of faecal occult blood testing, flexibleigmoidoscopy and screening colonoscopy can reduce mortalityrom CRC [1–3]. Faecal occult blood testing has traditionally been∗ Corresponding author at: Cancer Prevention and Control Unit, Catalan Insti-ute of Oncology, Av. Gran Via 199-203, 08908, L’Hospitalet de Llobregat, Barcelona,atalonia, Spain. Tel.: +34 932607186; fax: +34 932607956.
E-mail address: [email protected] (M. Garcia).
ttp://dx.doi.org/10.1016/j.dld.2016.06.011590-8658/© 2016 Editrice Gastroenterologica Italiana S.r.l. Published by Elsevier Ltd. All
75
implemented in most developed countries as the preferablemethod for CRC screening, but more recently the guaiac faecaloccult blood test has been substituted with the faecal immuno-chemical test (FIT) because of its higher sensitivity and specificity,better patient adherence, and lack of need for dietary restrictionbefore testing. However, the FIT also has potential downsides. Themost common adverse effect is the high rate of false-positive (FP)results that can lead to unnecessary colonoscopies, thus increasingextra healthcare costs and avoidable patient risk.
There are few published studies that have analysed the factors
associated with FP results in faecal occult blood testing for CRC[4,5]. Our group reported the FP results from CRC screening in Cat-alonia (Spain) between 2000 and 2010 for the guaiac faecal occultblood test [6]. At that time, we found a FP rate of 55.2%, with femalerights reserved.

1 nd Liv
saa
wlhRfhau(witlsFt
2
2
b((iipw(lC
wifdwwc
2
wwoiwiimmapict(p
250 G. Ibánez-Sanz et al. / Digestive a
ex, first screening round of the programme, successive screeningnd diagnosis of haemorrhoids or anal fissure to be significantlyssociated with a FP result.
Our previous research emphasised the need to determinehether women have more FP results because of an inherently
ower pre-test probability of developing CRC or because theyave gender-specific risk factors (differential prescription drugs).egardless of gender, it would also be interesting to explore other
actors associated with FP results. For instance, drugs with potentialaemorrhagic risk may increase the FP rate, and some studies havelready shown that antiplatelet agents (APAs) [7–9], oral anticoag-lants (OACs) [8–11] and/or non-steroidal anti-inflammatory drugsNSAIDs) [5] can affect FIT results. Therefore, other drugs associatedith gastrointestinal bleeding, such as selective serotonin reuptake
nhibitors (SSRIs) which affect platelet aggregation [12] and pro-on pump inhibitors (PPIs) which may cause haemorrhage in theower gastrointestinal tract [13–17], could affect the FP rate. In thistudy, we aimed to identify factors associated with FP results in aIT-based CRC screening programme, with special attention giveno prescription drugs.
. Methods
.1. Screening procedure
Briefly, in 2000, a biennial screening programme was launchedy the Catalan Institute of Oncology. Since 2010, the OC-SensorEiken Chemical Co., Japan), with a cut-off of faecal haemoglobinHb) of ≥20 �g Hb/g faeces (≥100 ng Hb/mL buffer), has been usedn this programme. A detailed description of the FIT performances provided elsewhere [18,19]. Diagnostic colonoscopies after aositive FIT result were performed by experienced endoscopists,ith patients under conscious sedation. The target population
n = 77,150) included all men and women aged 50–69 years from’Hospitalet de Llobregat and Vilafranca del Penedès (Barcelona,atalonia, Spain).
The participation rate in the most recent screening roundas 40.6%. Subjects were excluded according to the follow-
ng criteria: gastrointestinal symptoms, personal history of CRC,amily history of CRC, prior adenomas, inflammatory bowelisease, criteria for hereditary CRC syndromes, colonoscopyithin the previous five years or faecal occult haemoglobin testithin the last two years, terminal disease and severe disabling
onditions.
.2. Study subjects
We included participants with a positive FIT result who under-ent total colonoscopy between January 2014 and July 2014 andho answered a phone questionnaire administered by a nurse
r a medical doctor (n = 472). A FP result was defined as a pos-tive FIT result (≥20 �g Hb/g) followed by a colonoscopy result
ithout either intermediate/high-risk lesions or CRC. Accord-ng to “European guidelines for quality assurance in CRC” [20],ntermediate-risk lesions were defined as 3–4 tubular adenomas
easuring <10 mm with low-grade dysplasia or as ≥1 adenomaeasuring 10–19 mm, while high-risk lesions were defined as ≥5
denomas or ≥1 adenoma measuring ≥20 mm. All the partici-ants with a FP result were followed until April 2016 to identify
f a follow-up colonoscopy, upper gastrointestinal endoscopy or
apsule endoscopy explained the FP result by FIT. The study pro-ocol was approved by the ethics committee of our institutionPR138/12), and we obtained oral informed consent before thehone interview.76
er Disease 48 (2016) 1249–1254
2.3. Data collection
The CRC screening programme information system allowedrecording: sex, age (divided into 50–59 years and 60–69 years),blood Hb concentration and screening variables (number of indi-vidual participations, faecal Hb concentration and colonoscopyfindings). Anaemia was defined according to WHO recommen-dations (men Hb < 130 g/L; women Hb < 120 g/L) [21], and the Hbconcentrations were obtained from the routine blood analyses car-ried before the colonoscopy.
Level of education (less than primary education; at leastsecondary education) and clinical data (age at menopause, gas-trointestinal diseases associated with bleeding (haemorrhoids, analfissures, peptic ulcers, hiatus hernias and oesophageal varices)were gathered through a retrospective questionnaire. Informationabout the prescribed medication was self-reported in the ques-tionnaire and extracted from the computerised Catalan healthcaredatabase (SAP, Institut Català de la Salut). We analysed prescriptioninformation for the following drugs: PPIs (omeprazole, esomepra-zole, lansoprazole, pantoprazole and rabeprazole), NSAIDs (allcyclooxygenase 1 and 2 inhibitors), APAs (acetylsalicylic acid, tri-flusal, clopidogrel, prasugrel, ticagrelor, ticlopidine and cilostazol),OACs (acenocoumarol, warfarin, dabigatran, apixaban and rivarox-aban) and SSRIs (citalopram, escitalopram, fluoxetine, fluvoxamine,paroxetine and sertraline).
2.4. Data analysis
Multivariate logistic regression models were performed to iden-tify variables associated with the FP results. Adjusted odds ratios(ORs) and their 95% confidence intervals (CIs) were estimated. Wealso computed models stratified by sex and examined interactionsbetween the different covariates. Statistical analysis was carriedout using R statistical software (R Foundation for Statistical Com-puting, Vienna, Austria).
3. Results
3.1. Participant characteristics
The overall proportion of FP results was 53.8% (n = 254), althoughthis figure would have decreased to 37.7% (n = 178) had low-riskadenomas been included in the definition of a positive colonoscopy.Table 1 summarises the sociodemographic, screening and clinicalcharacteristics of the participants. It was notable that there weremore male participants in our study, because men had more posi-tive results by FIT testing. The overall average response rate to thequestionnaire was 76.6% (472 of 616 subjects), which correspondedto 74.0% (95%CI, 69.5–78.5) for men and 80.4% (95%CI, 75.5–85.3)for women. Moreover, only 11.2% of subjects had anaemia, and themean blood Hb was 142.5 g/L (standard deviation: ±17.3 g/L). Themedian faecal Hb concentration was significantly higher amongmen than among women (p = 0.049), but there were no differencesby age (p = 0.22). The median faecal Hb for a FP result was 48 �gHb/g (95%CI, 40.34–55.26) and 64 �g Hb/g (95%CI, 53.76–74.64)for a true-positive result (p = 0.0004); however, the range of fae-cal Hb values was similar in both groups, with no predictive ability(area under the receiver operator characteristics curve, 0.6; 95%CI,0.5–0.6).
3.2. Factors associated with FP results
Rescreening was a risk factor associated with FP results, thoughit was borderline significant in the multivariate analysis (adjustedOR, 1.5; 95%CI, 1.0–2.3). Women were two-fold more likely to havea FP result compared with men (adjusted OR, 2.3; 95%CI, 1.5–3.4).
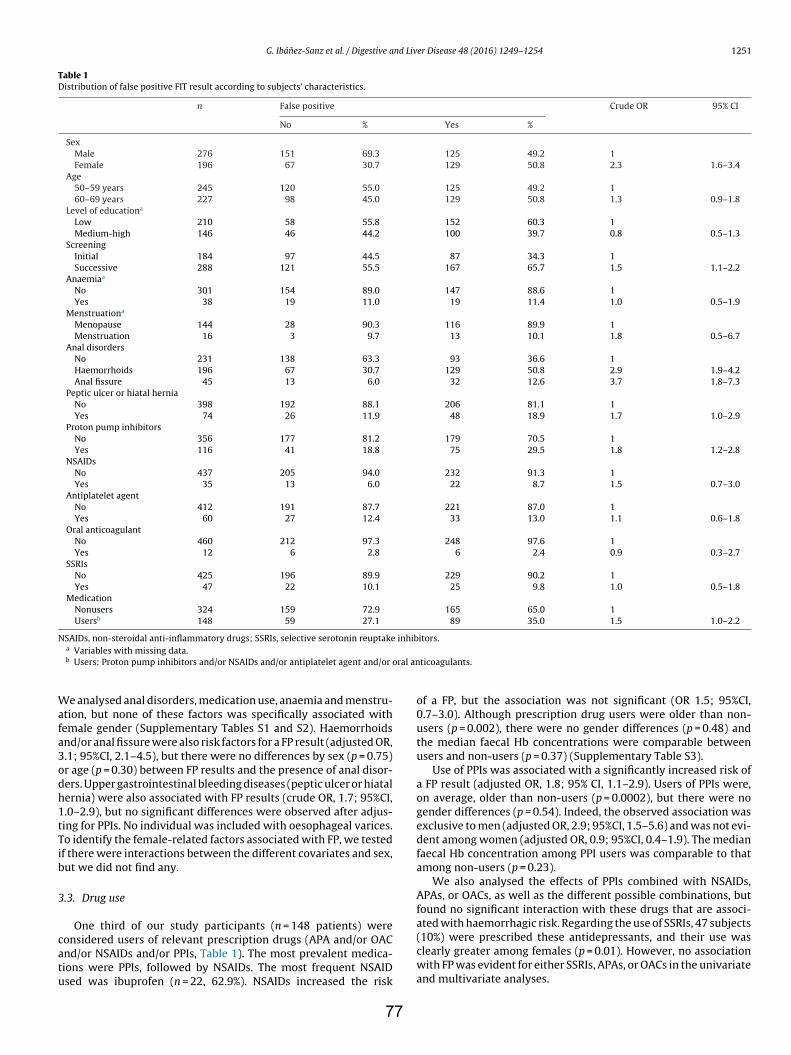
G. Ibánez-Sanz et al. / Digestive and Liver Disease 48 (2016) 1249–1254 1251
Table 1Distribution of false positive FIT result according to subjects’ characteristics.
n False positive Crude OR 95% CI
No % Yes %
SexMale 276 151 69.3 125 49.2 1Female 196 67 30.7 129 50.8 2.3 1.6–3.4
Age50–59 years 245 120 55.0 125 49.2 160–69 years 227 98 45.0 129 50.8 1.3 0.9–1.8
Level of educationa
Low 210 58 55.8 152 60.3 1Medium-high 146 46 44.2 100 39.7 0.8 0.5–1.3
ScreeningInitial 184 97 44.5 87 34.3 1Successive 288 121 55.5 167 65.7 1.5 1.1–2.2
Anaemiaa
No 301 154 89.0 147 88.6 1Yes 38 19 11.0 19 11.4 1.0 0.5–1.9
Menstruationa
Menopause 144 28 90.3 116 89.9 1Menstruation 16 3 9.7 13 10.1 1.8 0.5–6.7
Anal disordersNo 231 138 63.3 93 36.6 1Haemorrhoids 196 67 30.7 129 50.8 2.9 1.9–4.2Anal fissure 45 13 6.0 32 12.6 3.7 1.8–7.3
Peptic ulcer or hiatal herniaNo 398 192 88.1 206 81.1 1Yes 74 26 11.9 48 18.9 1.7 1.0–2.9
Proton pump inhibitorsNo 356 177 81.2 179 70.5 1Yes 116 41 18.8 75 29.5 1.8 1.2–2.8
NSAIDsNo 437 205 94.0 232 91.3 1Yes 35 13 6.0 22 8.7 1.5 0.7–3.0
Antiplatelet agentNo 412 191 87.7 221 87.0 1Yes 60 27 12.4 33 13.0 1.1 0.6–1.8
Oral anticoagulantNo 460 212 97.3 248 97.6 1Yes 12 6 2.8 6 2.4 0.9 0.3–2.7
SSRIsNo 425 196 89.9 229 90.2 1Yes 47 22 10.1 25 9.8 1.0 0.5–1.8
MedicationNonusers 324 159 72.9 165 65.0 1Usersb 148 59 27.1 89 35.0 1.5 1.0–2.2
NSAIDs, non-steroidal anti-inflammatory drugs; SSRIs, selective serotonin reuptake inhibitors.
oral an
Wafa3odh1tTib
3
catu
a Variables with missing data.b Users: Proton pump inhibitors and/or NSAIDs and/or antiplatelet agent and/or
e analysed anal disorders, medication use, anaemia and menstru-tion, but none of these factors was specifically associated withemale gender (Supplementary Tables S1 and S2). Haemorrhoidsnd/or anal fissure were also risk factors for a FP result (adjusted OR,.1; 95%CI, 2.1–4.5), but there were no differences by sex (p = 0.75)r age (p = 0.30) between FP results and the presence of anal disor-ers. Upper gastrointestinal bleeding diseases (peptic ulcer or hiatalernia) were also associated with FP results (crude OR, 1.7; 95%CI,.0–2.9), but no significant differences were observed after adjus-ing for PPIs. No individual was included with oesophageal varices.o identify the female-related factors associated with FP, we testedf there were interactions between the different covariates and sex,ut we did not find any.
.3. Drug use
One third of our study participants (n = 148 patients) were
onsidered users of relevant prescription drugs (APA and/or OACnd/or NSAIDs and/or PPIs, Table 1). The most prevalent medica-ions were PPIs, followed by NSAIDs. The most frequent NSAIDsed was ibuprofen (n = 22, 62.9%). NSAIDs increased the risk77
ticoagulants.
of a FP, but the association was not significant (OR 1.5; 95%CI,0.7–3.0). Although prescription drug users were older than non-users (p = 0.002), there were no gender differences (p = 0.48) andthe median faecal Hb concentrations were comparable betweenusers and non-users (p = 0.37) (Supplementary Table S3).
Use of PPIs was associated with a significantly increased risk ofa FP result (adjusted OR, 1.8; 95% CI, 1.1–2.9). Users of PPIs were,on average, older than non-users (p = 0.0002), but there were nogender differences (p = 0.54). Indeed, the observed association wasexclusive to men (adjusted OR, 2.9; 95%CI, 1.5–5.6) and was not evi-dent among women (adjusted OR, 0.9; 95%CI, 0.4–1.9). The medianfaecal Hb concentration among PPI users was comparable to thatamong non-users (p = 0.23).
We also analysed the effects of PPIs combined with NSAIDs,APAs, or OACs, as well as the different possible combinations, butfound no significant interaction with these drugs that are associ-ated with haemorrhagic risk. Regarding the use of SSRIs, 47 subjects
(10%) were prescribed these antidepressants, and their use wasclearly greater among females (p = 0.01). However, no associationwith FP was evident for either SSRIs, APAs, or OACs in the univariateand multivariate analyses.
1252 G. Ibánez-Sanz et al. / Digestive and Liver Disease 48 (2016) 1249–1254
Table 2Multivariate-adjusted risk factors associated with a false-positive FIT result.
Overall OR adjusted 95%CI Men OR adjusted 95%CI Women OR adjusted 95%CI
SexMale 1Female 2.3 1.5–3.4
Age50–59 years 1 1 160–69 years 1.0 0.7–1.5 0.8 0.5–1.4 1.2 0.7–2.3
Haemorrhoid or anal fissureNo 1 1 1Yes 3.1 2.1–4.5 3.0 1.8–4.9 3.5 1.9–6.6
Successive screeningsNo 1 1 1Yes 1.5 1.0–2.2 2.0 1.2–3.3 1.1 0.5–2.0
PPIsNo 1 1 1Yes 1.8 1.1–2.9 2.9 1.5–5.5 0.9 0.4–1.9
NSAIDs or APA or OACNo 1 1 1Yes 1.0 0.6–1.6 0.8 0.4–1.5 1.4 0.6–3.4
O les shP antipl
3
cwetlpgBpd
3
cf
4
psf
trrnidrlestiPi[ir
Rs derived from a multivariate logistic regression model adjusted by all the variabPI, proton pump inhibitors; NSAIDs, non-steroidal anti-inflammatory drugs; APA,
.4. Follow-up of subjects with FP results
During the surveillance, 12 patients (4.72%) underwent aolonoscopy. The colonoscopies were normal in 5 patients, bute found a lesion with haemorragic risk in 7 patients in whom
ither colonic angiodysplasia (n = 2) or polyps were detected (n = 5;he polyps were either high-risk lesions [n = 1], intermediate-riskesions [n = 1], or low-risk lesions [n = 3]). In total, 10 (3.94%)atients had an upper endoscopy performed. We identified upper-astrointestinal lesions in seven patients: hiatal hernia (n = 3),arrett’s oesophagus (n = 2), erosive gastritis (n = 1) or a gastricolyp (n = 1). Only one patient underwent capsule endoscopy whichetected ileal erosions and a colonic angiodysplasia.
.5. Multivariate analysis of the factors associated with FP results
Multivariate logistic regression analysis revealed that sex, suc-essive screening, anal disorders and PPIs were significant riskactors for a FP result (Table 2).
. Discussion
In this study of FP results in a population-based CRC screeningrogramme using FIT, we identified female gender, successivecreening, haemorrhoids or anal fissure, and PPI use to be riskactors for FP results.
To the best of our knowledge, though there is preliminary datahat may explain this finding, the association of PPI use with FPesults has not been previously reported. PPIs reduce the occur-ence of peptic ulcers and are an important treatment for acuteon-variceal upper gastrointestinal bleeding [21]. By contrast, acid
nhibition does not confer protection to NSAID-induced damageistal to the ligament of Treitz [16,22–24], and, in fact, studieseport that PPIs could contribute to small intestinal injury. Wal-ace et al. [13] and Blacker et al. [25] have reported that PPIsxacerbate NSAID-induced small intestinal injury in rodents. Theirtudy showed that PPIs induced a low acid gastric environmenthat resulted in dysbiosis, which exacerbated NSAID-induced smallntestinal injury. In addition, Fujimori et al. [17] suggested thatPIs not only exacerbated but also induced small intestinal injury
n humans. Indeed, a recent randomised placebo-controlled trial26] showed that PPI use increased the risk of short-term NSAID-nduced small bowel injury. Miyake et al. [15] and Lanas et al. [14]eported that PPIs were associated with a small increased risk of78
own in the table.atelet agents; OAC, oral anticoagulants.
lower gastrointestinal bleeding after adjusting for potential con-founders. Another two studies indicated that faecal calprotectinlevels, which are a marker of gut inflammation, were significantlyelevated in patients using PPIs [27,28]. Our results are consistentwith this emergent evidence that PPIs might be associated withlesions of the lower gastrointestinal tract [14,15,17]. The fact thatwe found no difference between the median faecal Hb concentra-tion among PPI users and non-users suggests that the higher FP ratewas unrelated to the degree of bleeding.
Another explanation would be that PPIs delay globin’s degrada-tion from the upper gastrointestinal tract and may facilitate theidentification of globin by FIT. That is to say that PPIs “allow”the diagnosis of upper lesions because the increased gastric pHmay prevent the conversion of pepsinogen to pepsin and trypsino-gen to trypsin [29], both of which are necessary for degradingfood proteins, including globin, into peptides. Consistent with thishypothesis, an unpublished investigation [30] has analysed FITaccuracy among PPI users in 1003 symptomatic patients with pos-itive FIT results. In a multivariate analysis, they found that PPI usewas the only risk factor for FP results, and that their use reduced FITaccuracy for detecting CRC. This might explain why upper gastroin-testinal bleeding diseases (peptic ulcers and hiatal hernias) wereassociated with FP results in our univariate analyses, though notafter being adjusted for PPI use (p = 0.19), while PPI use adjusted forhiatal hernias and peptic ulcers was significantly associated withFP results (p = 0.03). This is consistent with evidence that FIT is spe-cific for bleeding diseases of the lower gastrointestinal tract. Chianget al. [31] verified FIT’s performance for predicting lesions of thelower gastrointestinal tract, and they confirmed that the resultswere not confounded by the presence of upper gastrointestinaltract lesions. When comparing the prevalence rates of lower andupper gastrointestinal tract lesions between participants with pos-itive and negative faecal test results, they found that such lesionswere present in approximately 20% of all subjects. Levi et al. [32]performed upper gastrointestinal endoscopy in 160 patients withpositive FIT results not explained by colonoscopy, and concludedthat FIT positivity was not correlated with finding lesions likely tobleed on upper gastrointestinal endoscopy, and argued that thisprocedure was probably unsuitable for patients with positive FITand negative colonoscopy.
PPI use was a risk factor for FP results after multivariate analysis.However, in the models stratified by sex, the statistical associationwas not observed among women. We think that this can be relatedby random variation, given the relatively small sample size (only

nd Liv
1vn
tsFputoacfOwdabeftp
anatd
oibitwwcpmaimrCuftg
ppttdtb
stbttFfr
[
[
[
[
[
G. Ibánez-Sanz et al. / Digestive a
96 women). Therefore, larger prospective studies are needed toalidate these results, because their confirmation may lead to theeed to advise patients to discontinue PPIs before a FIT.
Consistent with our previous study of FP results with the guaiacest [6], the risk of FP results with the FIT increased with successivecreening, while women showed a two-fold greater likelihood of aP compared with men. We wanted to gather information regardingrescription drug use because our initial hypothesis was that SSRIse, due to its effect on platelet aggregation [12], could explainhe difference between the sexes because they are prescribed moreften to women. Also, there is evidence that SSRIs may be associ-ted with upper gastrointestinal bleeding, especially when usedoncurrently with NSAIDs, APAs or OACs [33–35]. Although weound the expected association between SSRIs and women (crudeR, 2.8; 95%CI, 1.5–5.2), their use was not shown to be associatedith FP results, even when there was concurrent use of these otherrugs. Indeed, we could find no risk factor related to female gendernd the risk of a FP result. Gender differences were not explainedy anal disorders, medication use, anaemia or menstruation. Nev-rtheless, we still believe there might be some as yet unknownactors that increase the likelihood of bleeding and that will explainhe observed gender differences in FP results, other than the lowerre-test probability of developing CRC.
The likelihood of detecting occult blood from haemorrhoids andnal fissures should be limited because of their location and theeeded hemolysis before an FIT can detect globin. But, in our study,nal disorders had a clear association with FP results, especiallyhe presence of an anal fissure, which conflicts with the lower ratesescribed in previous studies [6,36].
Although APAs and OACs increase the risk of occult andvert gastrointestinal bleeding, it remains uncertain whether anyncrease in gastrointestinal bleeding actually manifests in FP resultsy FIT. Our findings, and those reported in previous studies [7,10],
ndicate that the positive predictive value of FIT does not tendo decrease during antithrombotic treatment. Regarding NSAIDs,e showed that they were not statistically significantly associatedith FP results (OR, 1.5; 95%CI, 0.7–3.0), but this may have been
aused by having identified too few subjects using these drugs. Aossible explanation for the inclusion of fewer users than expecteday be that NSAIDs are the most frequent drug used sporadically
nd purchased over the counter, with a retrospective design lack-ng the sensitivity to detect these users. To minimise this limitation,
edication was based not only on self-reports but also on dataetrieved from the computerised “electronic prescriptions” in theatalan healthcare database. We also considered cases to be non-sers when sporadic use of a drug was unclear, which may haveurther underestimated the effects. Therefore, we cannot excludehe possibility that over the counter drug use, especially of anal-esics and NSAIDs, may have been underreported.
During the follow-up of subjects with FP results, 9.1% (n = 23) ofatients underwent an endoscopic procedure, and only 3.1% (n = 8)atients were diagnosed with a lesion in lower gastrointestinalract that could explain the FIT result. It is important to highlighthat no patient was diagnosed with a CRC, but that one patient wasiagnosed with a high-risk lesion (a large flat polyp located behindhe colonic haustrum in the right colon), which had been missedy colonoscopy.
In conclusion, this study was based on a population-basedcreening programme that used FIT as a screening test, and washe first to assess the impact of not only NSAIDs, APAs, and OACs,ut also of PPIs and SSRIs, on the FP rate. Indeed, despite the fact thathe number of people with long-term use of PPIs has increased over
he last decade, there remains limited data regarding their effect onIT results. In this study, we confirm the previously reported riskactors for FP results, and also suggest that PPI use is may be a newisk factor. Although this raises the question of whether PPIs should[
79
er Disease 48 (2016) 1249–1254 1253
be discontinued before FIT, larger prospective studies are neededto confirm these findings.
Funding
This study was partially cofunded by the Carlos III HealthInstitute, the European Regional Development Fund – a wayto build Europe- (PI12/00992, PI14/00613, RD12/003670053,CB07/02/2005) and by the Department of Universities and Research(2014SGR635, 2014SGR647), Government of Catalonia.
Conflict of interestNone declared.
Acknowledgements
The authors belong to the Adverse Effects on Colorectal Can-cer Screening in Catalonia (EACC) Study’ working group. Additionalmembers of the ‘Adverse Effects on Colorectal Cancer Screeningin Catalonia (EACC) Study’ working group are: Núria Milà, LlúciaBenito, Núria Maiz, Laura Pareja, Òlbia Serra.
Appendix A. Supplementary data
Supplementary data associated with this article can be found, inthe online version, at http://dx.doi.org/10.1016/j.dld.2016.06.011.
References
[1] Hewitson P, Glasziou P, Watson E, et al. Cochrane systematic review of colorec-tal cancer screening using the fecal occult blood test (hemoccult): an update.American Journal of Gastroenterology 2008;103:1541–9.
[2] Tang V, Boscardin WJ, Stijacic-Cenzer I, et al. Time to benefit for colorectal can-cer screening: survival meta-analysis of flexible sigmoidoscopy trials. BritishMedical Journal 2015;350:h2228.
[3] Brenner H, Stock C, Hoffmeister M. Effect of screening sigmoidoscopyand screening colonoscopy on colorectal cancer incidence and mortality:systematic review and meta-analysis of randomised controlled trials andobservational studies. British Medical Journal 2014;348:g2467.
[4] Stegeman I, de Wijkerslooth TR, Stoop EM, et al. Risk factors for false positiveand for false negative test results in screening with fecal occult blood testing.International Journal of Cancer 2013;133:2408–14.
[5] Wong MC, Ching JY, Chan VC, et al. Factors associated with false-positiveand false-negative fecal immunochemical test results for colorectal cancerscreening. Gastrointestinal Endoscopy 2015;81:596–607.
[6] Garcia M, Mila N, Binefa G, et al. False-positive results from colorectal can-cer screening in Catalonia (Spain), 2000–2010. Journal of Medical Screening2012;19:77–82.
[7] Bujanda L, Lanas A, Quintero E, et al. Effect of aspirin and antiplatelet drugson the outcome of the fecal immunochemical test. Mayo Clinic Proceedings2013;88:683–9.
[8] Gandhi S, Narula N, Gandhi S, et al. Does acetylsalicylic acid or warfarin affectthe accuracy of fecal occult blood tests. Journal of Gastroenterology and Hepa-tology 2013;28:931–6.
[9] Levi Z, Rozen P, Hazazi R, et al. Sensitivity, but not specificity, of a quantitativeimmunochemical fecal occult blood test for neoplasia is slightly increased bythe use of low-dose aspirin, NSAIDs, and anticoagulants. American Journal ofGastroenterology 2009;104:933–8.
10] Bujanda L, Sarasqueta C, Lanas A, et al. Effect of oral anticoagulants onthe outcome of faecal immunochemical test. British Journal of Cancer2014;110:1334–7.
11] Imperiale TF. Continue or discontinue warfarin for fecal occult blood testingin 2010? Does the published evidence provide an answer. American Journal ofGastroenterology 2010;105:2036–9.
12] Tseng YL, Chiang ML, Lane HY, et al. Selective serotonin reuptake inhibitorsreduce P2Y12 receptor-mediated amplification of platelet aggregation. Throm-bosis Research 2013;131:325–32.
13] Wallace JL, Syer S, Denou E, et al. Proton pump inhibitors exacerbateNSAID-induced small intestinal injury by inducing dysbiosis. Gastroenterology2011;141:1314–22.
14] Lanas A, Carrera-Lasfuentes P, Arguedas Y, et al. Risk of upper and lower gas-trointestinal bleeding in patients taking nonsteroidal anti-inflammatory drugs,
antiplatelet agents, or anticoagulants. Clinical Gastroenterology and Hepatol-ogy 2015;13:906–12.15] Miyake K, Akimoto T, Hanada Y, et al. Proton pump inhibitors are associ-ated with lower gastrointestinal tract bleeding in low-dose aspirin users withischaemic heart disease. Digestive and Liver Disease 2015;47:757–62.

1 nd Liv
[
[
[
[
[
[
[
[
[
[
[
[
[
[
[
[
[
[
[
[
254 G. Ibánez-Sanz et al. / Digestive a
16] Goldstein JL, Eisen GM, Lewis B, et al. Video capsule endoscopy to prospec-tively assess small bowel injury with celecoxib, naproxen plus omeprazole,and placebo. Clinical Gastroenterology and Hepatology 2005;3:133–41.
17] Fujimori S, Takahashi Y, Tatsuguchi A, et al. Omeprazole increased small intesti-nal mucosal injury in two of six disease-free cases evaluated by capsuleendoscopy. Digestive Endoscopy 2014;26:676–9.
18] Garcia M, Mila N, Binefa G, et al. Fecal hemoglobin concentration as a measureof risk to tailor colorectal cancer screening: are we there yet. European Journalof Cancer Prevention 2015;24:321–7.
19] Peris M, Espinas JA, Munoz L, et al. Lessons learnt from a population-basedpilot programme for colorectal cancer screening in Catalonia (Spain). Journalof Medical Screening 2007;14:81–6.
20] Atkin WS, Valori R, Kuipers EJ, et al. European guidelines for quality assur-ance in colorectal cancer screening and diagnosis. Endoscopy 2012;44(Suppl.3):SE151–63.
21] Leontiadis GI, Sreedharan A, Dorward S, et al. Systematic reviews of theclinical effectiveness and cost-effectiveness of proton pump inhibitors inacute upper gastrointestinal bleeding. Health Technology Assessment 2007;11:1–164.
22] Maiden L, Thjodleifsson B, Theodors A, et al. A quantitative analysis of NSAID-induced small bowel pathology by capsule enteroscopy. Gastroenterology2005;128:1172–8.
23] Kuramoto T, Umegaki E, Nouda S, et al. Preventive effect of irsogladine oromeprazole on non-steroidal anti-inflammatory drug-induced esophagitis,peptic ulcers, and small intestinal lesions in humans, a prospective randomizedcontrolled study. BMC Gastroenterology 2013;13:85.
24] Zhang S, Chao GQ, Lu B. Proton pump inhibitors are not the key for thera-pying non-steroidal anti-inflammatory drugs-induced small intestinal injury.Rheumatology International 2013;33:2513–21.
25] Blackler RW, De Palma G, Manko A, et al. Deciphering the pathogenesis of
NSAID-enteropathy using proton pump inhibitors and a hydrogen sulfide-releasing NSAID. American Journal of Physiology Gastrointestinal and LiverPhysiology 2015;308:G994–1003.26] Washio E, Esaki M, Maehata Y, et al. Proton pump inhibitors increase inci-dence of nonsteroidal anti-inflammatory drug-induced small bowel injury: a
[
80
er Disease 48 (2016) 1249–1254
randomized, placebo-controlled trial. Clinical Gastroenterology and Hepatol-ogy 2016;14:809–15.
27] Andreasson K, Saxne T, Scheja A, et al. Faecal levels of calprotectin in systemicsclerosis are stable over time and are higher compared to primary Sjogren’ssyndrome and rheumatoid arthritis. Arthritis Research & Therapy 2014;16:R46.
28] Poullis A, Foster R, Mendall MA, et al. Proton pump inhibitors are associatedwith elevation of faecal calprotectin and may affect specificity. European Jour-nal of Gastroenterology & Hepatology 2003;15:573–4.
29] Wang J, Barbuskaite D, Tozzi M, et al. Proton pump inhibitors inhibit pan-creatic secretion: role of gastric and non-gastric H+/K+-ATPases. PLOS ONE2015;10:e0126432.
30] Rodriguez Alonso L, Rodríguez Moranta F, Martín Cardona A, et al. Losinhibidores de la bomba de protones reducen la precisión del test de sangreoculta en heces inmunológico. XIX Reunión Anual de la Asociación Espanola deGastroenterología. Gastroenterología y Hepatología 2016:75.
31] Chiang TH, Lee YC, Tu CH, et al. Performance of the immunochemical fecal occultblood test in predicting lesions in the lower gastrointestinal tract. CanadianMedical Association Journal 2011;183:1474–81.
32] Levi Z, Vilkin A, Niv Y. Esophago-gastro-duodenoscopy is not indicated inpatients with positive immunochemical test and nonexplanatory colonoscopy.European Journal of Gastroenterology & Hepatology 2010;22:1431–4.
33] Anglin R, Yuan Y, Moayyedi P, et al. Risk of upper gastrointestinal bleed-ing with selective serotonin reuptake inhibitors with or without concurrentnonsteroidal anti-inflammatory use: a systematic review and meta-analysis.American Journal of Gastroenterology 2014;109:811–9.
34] Oka Y, Okamoto K, Kawashita N, et al. Meta-analysis of the risk of uppergastrointestinal hemorrhage with combination therapy of selective serotoninreuptake inhibitors and non-steroidal anti-inflammatory drugs. Biological &Pharmaceutical Bulletin 2014;37:947–53.
35] Wallerstedt SM, Gleerup H, Sundstrom A, et al. Risk of clinically relevant
bleeding in warfarin-treated patients – influence of SSRI treatment. Pharma-coepidemiology and Drug Safety 2009;18:412–6.36] van Turenhout ST, Oort FA, Terhaar sive Droste JS, et al. Hemorrhoids detectedat colonoscopy: an infrequent cause of false-positive fecal immunochemicaltest results. Gastrointestinal Endoscopy 2012;76:136–43.

ARTICLE 2: False-negative rate cannot be reduced by lowering the haemoglobin concentration cut-off in colorectal cancer screening using faecal immunochemical test
Ibañez-Sanz G, Garcia M, Milà N, Rodríguez-Moranta F, Binefa G, Gómez-Matas J, Benito L, Padrol I, Barenys M, Moreno V. European Journal of Cancer Prevention. 2017; 26(5):365-367.


False-negative rate cannot be reduced by lowering thehaemoglobin concentration cut-o�n colorectal cancerscreening using faecal immunochemical testGemma Ibañez-Sanz a, Montse Garcia a, Núria Milàa,Francisco Rodríguez-Moranta b,c, Gemma Binefa a, Javier Gómez-Matasa,Llúcia Benitoa, Isabel Padrola, Mercè Barenys d,e and Victor Morenoa,c,e
The aim of this study was to analyse false-negative (FN)results of the faecal immunochemical test (FIT) and itsdeterminants in a colorectal cancer screening programme inCatalonia. We carried out a cross-sectional study among218 screenees with a negative FIT result who agreed toundergo a colonoscopy. A false-negative result was de�nedas the detection, at colonoscopy, o�ntermediate/high-riskpolyps or colorectal cancer in a patient with a previousnegative FIT ( < 20 µgHb/g). Multivariate logistic regressionmodels were constructed to identify sociodemographic(sex, age) and screening variables (quantitative faecalhaemoglobin, colonoscopy �ndings) related to FN results.Adjusted odds ratios and their 95% con�dence intervalswere estimated. There were 15.6% FN FIT results. Faecalhaemoglobin was undetected in 45.5% of these results andwas below 4 µgHb/g in 94.0% of the individuals with a FNresult. About 60% of the lesions were located in theproximal colon, whereas the expected percentage was 30%.
Decreasing the positivity threshold of FIT does not increasethe detection rate of advanced neoplasia, but may increasethe costs and potential adverse e�ects. European Journal ofCancer Prevention 26:365 –367 Copyright © 2017Wolters Kluwer Health, Inc. All rights reserved.
European Journal of Cancer Prevention 2017, 26: 365 –367
Keywords: adverse e�ects, colorectal cancer screening,faecal immunochemical test, false negative
aCancer Prevention and Control Programme, Catalan Institute of Oncology,IDIBELL, bDepartment of Gastroenterology and Hepatology, University Hospitalof Bellvitge-IDIBELL, cConsortium for Biomedical Research in Epidemiology andPublic Health (CIBEResp), dDepartment of Gastroenterology and Hepatology,Hospital of Viladecans and eDepartment of Clinical Sciences, University ofBarcelona, Barcelona, Spain
Correspondence to Montse Garcia, PhD, Cancer Prevention and Control Unit,Catalan Institute of Oncology, Av. Gran Via, 199-203, L ’Hospitalet de Llobregat,08908 Barcelona, Catalonia, SpainTel: + 34 932 607 186; fax: + 34 932 607 956; e-mail: [email protected]
Received 9 March 2016 Accepted 29 June 2016
IntroductionColorectal cancer (CRC) screening by faecal occult bloodtesting has been shown to reduce CRC incidence andmortality. This has led to the widespread implementationo�aecal-based CRC screening programmes. Althoughthe faecal immunochemical test (FIT) has been reportedto be more sensitive than the guaiac-based faecal occultblood test, it is still far from a perfect screening test. Thediagnostic accuracy of FIT may vary depending on thecut-o� value for a positive test result and brand. Themost commonly used FIT is OC-Sensor (EikenChemical Co. Ltd, Tokyo, Japan), with a thresholdconcentration of 20µgHb/g (100 ngHb/ml). A meta-analysis (Lee et al., 2014) reported a pooled estimationof sensitivity and speci�city for OC-Sensor (EikenChemical Co. Ltd) for CRC in average-risk asymptomaticpatients of 0.86 [95% con�dence interval (CI), 0.68 to0.95] and 91% (95% CI, 0.87 to 0.94), respectively. Thesensitivity of FIT for detecting advanced neoplasia(intermediate/high-risk lesions/CRC) is much lower,leading to many false negative (FN) results) and o�ersfalse reassurance to participants.
Here, we aimed to determine the FN result proportion ina population-based CRC screening programme using
FIT to identify risk factors associated with a FN resultand to explore potential improvements related to de�n-ing an optimal cut-o� for positivity.
Material and methodsScreening procedureA detailed description of the population-based screeningprocedure has been provided elsewhere (Garcia et al.,2015). Brie�y, in 2000, a biennial screening programmewas launched by the Catalan Institute of Oncology(Barcelona, Spain). From 2010, we have been using thequantitative FIT OC-Sensor, with a cut-o� o�aecalhaemoglobin (f-Hb) o�ess than 20 µgHb/g faeces(< 100 ngHb/ml bu�er).
The CRC Screening Programme in L ’Hospitalet deLlobregat (Barcelona, Catalonia, Spain) invited 58 184men and women aged 50–69 years to participate in thesixth round of screening from 26 November 2012 to 3November 2014. About 40% of the individuals invitedagreed to participate (n = 22 970). Of those, 21 726 indi-viduals had a negative result in FIT and 1229 individualshad a positive test (positivity rate: 5.4%). The studyparticipants were individuals with a negative FITbetween November 2013 and October 2014. A random
Short paper 365
0959-8278 Copyright © 2017 Wolters Kluwer Health, Inc. All rights reserved. DOI: 10.1097/CEJ.0000000000000281
83
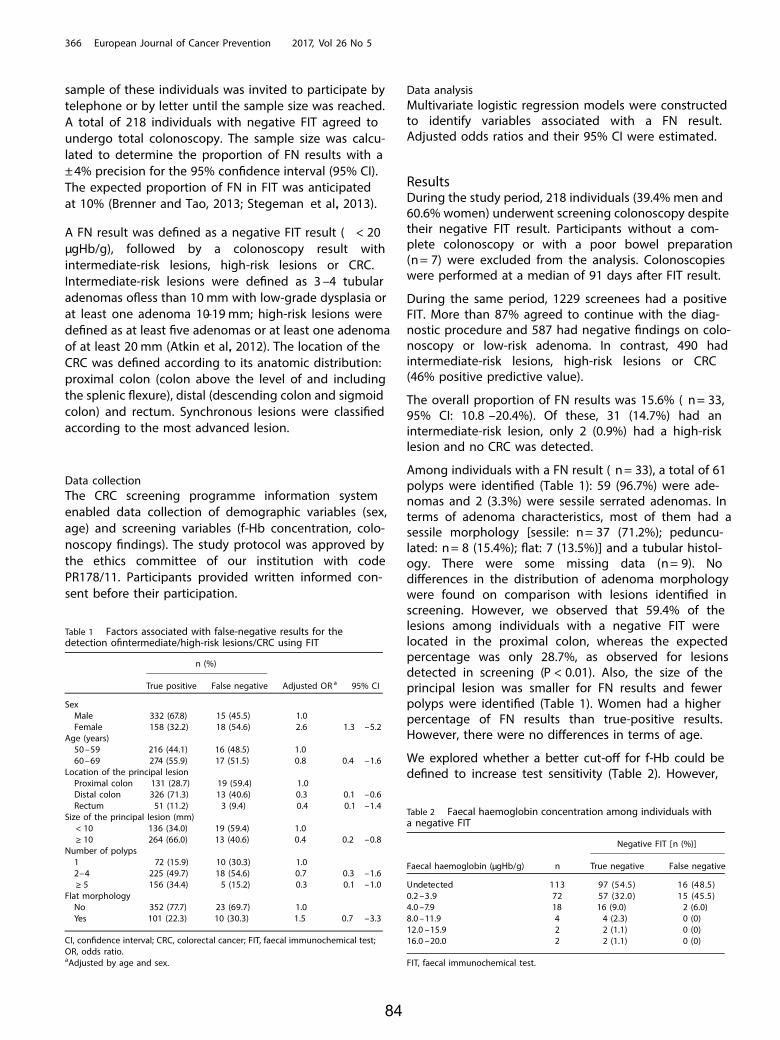
sample of these individuals was invited to participate bytelephone or by letter until the sample size was reached.A total of 218 individuals with negative FIT agreed toundergo total colonoscopy. The sample size was calcu-lated to determine the proportion of FN results with a± 4% precision for the 95% con�dence interval (95% CI).The expected proportion of FN in FIT was anticipatedat 10% (Brenner and Tao, 2013; Stegeman et al., 2013).
A FN result was de�ned as a negative FIT result ( < 20µgHb/g), followed by a colonoscopy result withintermediate-risk lesions, high-risk lesions or CRC.Intermediate-risk lesions were de�ned as 3 –4 tubularadenomas o�ess than 10 mm with low-grade dysplasia orat least one adenoma 10–19 mm; high-risk lesions werede�ned as at least �ve adenomas or at least one adenomaof at least 20 mm (Atkin et al., 2012). The location of theCRC was de�ned according to its anatomic distribution:proximal colon (colon above the level of and includingthe splenic �exure), distal (descending colon and sigmoidcolon) and rectum. Synchronous lesions were classi�edaccording to the most advanced lesion.
Data collectionThe CRC screening programme information systemenabled data collection of demographic variables (sex,age) and screening variables (f-Hb concentration, colo-noscopy �ndings). The study protocol was approved bythe ethics committee of our institution with codePR178/11. Participants provided written informed con-sent before their participation.
Data analysisMultivariate logistic regression models were constructedto identify variables associated with a FN result.Adjusted odds ratios and their 95% CI were estimated.
ResultsDuring the study period, 218 individuals (39.4% men and60.6% women) underwent screening colonoscopy despitetheir negative FIT result. Participants without a com-plete colonoscopy or with a poor bowel preparation(n = 7) were excluded from the analysis. Colonoscopieswere performed at a median of 91 days after FIT result.
During the same period, 1229 screenees had a positiveFIT. More than 87% agreed to continue with the diag-nostic procedure and 587 had negative �ndings on colo-noscopy or low-risk adenoma. In contrast, 490 hadintermediate-risk lesions, high-risk lesions or CRC(46% positive predictive value).
The overall proportion of FN results was 15.6% ( n = 33,95% CI: 10.8 –20.4%). Of these, 31 (14.7%) had anintermediate-risk lesion, only 2 (0.9%) had a high-risklesion and no CRC was detected.
Among individuals with a FN result ( n = 33), a total of 61polyps were identi�ed (Table 1): 59 (96.7%) were ade-nomas and 2 (3.3%) were sessile serrated adenomas. Interms of adenoma characteristics, most of them had asessile morphology [sessile: n = 37 (71.2%); peduncu-lated: n = 8 (15.4%); �at: 7 (13.5%)] and a tubular histol-ogy. There were some missing data (n = 9). Nodi�erences in the distribution of adenoma morphologywere found on comparison with lesions identi�ed inscreening. However, we observed that 59.4% of thelesions among individuals with a negative FIT werelocated in the proximal colon, whereas the expectedpercentage was only 28.7%, as observed for lesionsdetected in screening (P < 0.01). Also, the size of theprincipal lesion was smaller for FN results and fewerpolyps were identi�ed (Table 1). Women had a higherpercentage of FN results than true-positive results.However, there were no di�erences in terms of age.
We explored whether a better cut-o� for f-Hb could bede�ned to increase test sensitivity (Table 2). However,
Table 1 Factors associated with false-negative results for thedetection o�ntermediate/high-risk lesions/CRC using FIT
n (%)
True positive False negative Adjusted OR a 95% CI
SexMale 332 (67.8) 15 (45.5) 1.0Female 158 (32.2) 18 (54.6) 2.6 1.3 –5.2
Age (years)50 –59 216 (44.1) 16 (48.5) 1.060 –69 274 (55.9) 17 (51.5) 0.8 0.4 –1.6
Location of the principal lesionProximal colon 131 (28.7) 19 (59.4) 1.0Distal colon 326 (71.3) 13 (40.6) 0.3 0.1 –0.6Rectum 51 (11.2) 3 (9.4) 0.4 0.1 –1.4
Size of the principal lesion (mm)< 10 136 (34.0) 19 (59.4) 1.0≥ 10 264 (66.0) 13 (40.6) 0.4 0.2 –0.8
Number of polyps1 72 (15.9) 10 (30.3) 1.02–4 225 (49.7) 18 (54.6) 0.7 0.3 –1.6≥ 5 156 (34.4) 5 (15.2) 0.3 0.1 –1.0
Flat morphologyNo 352 (77.7) 23 (69.7) 1.0Yes 101 (22.3) 10 (30.3) 1.5 0.7 –3.3
CI, con�dence interval; CRC, colorectal cancer; FIT, faecal immunochemical test;OR, odds ratio.aAdjusted by age and sex.
Table 2 Faecal haemoglobin concentration among individuals witha negative FIT
Negative FIT [n (%)]
Faecal haemoglobin (µgHb/g) n True negative False negative
)5.84(61)5.45(79311detcetednU0.2 – )5.54(51)0.23(75279.34.0 –7.9 18 16 (9.0) 2 (6.0)8.0 –11.9 4 4 (2.3) 0 (0)12.0 –15.9 2 2 (1.1) 0 (0)16.0 –20.0 2 2 (1.1) 0 (0)
FIT, faecal immunochemical test.
366 European Journal of Cancer Prevention 2017, Vol 26 No 5
84

f-Hb was undetectable in 48.5% of the patients with a FNresult and was below 8µgHg/g in up to 94%. Eight caseswith values between 8 and 20µgHg/g were true negative(Table 2). There was no di�erence in the time delaybetween the faeces collection and the laboratory analysisdate among FN and true-negative patients (P = 0.62).
DiscussionIn this study, carried out in a population-based CRCscreening programme using FIT, we observed an overallproportion of 15.6% FN results. This is a relatively highvalue compared with other studies (Brenner and Tao, 2013;Stegeman et al., 2013), which detected between 6.4 and7.7%. However, di�erences in screening age group and thecut-o�evel of these studies constrain their comparability.Also, our population might have some selection bias as weincluded screenees who voluntarily agreed to undergo acolonoscopy despite their negative FIT.
Awareness of the FN rate should be emphasized toclinicians and patients to ensure that those with symp-toms are not falsely reassured and slip through thediagnostic net. Although our study was not powered tospeci�cally estimate false-negative CRC, it is importantto highlight that no CRC was found and only two patients(2.1%) had sessile serrated adenoma, which is similar to aprevious study carried out in a FIT-based screeningprogramme in Spain (Alvarez et al., 2013). Table 1 showsthat women have more FN and this could be explainedby the fact that they have lower f-Hb probably because oftheir slower colonic transit time (Fraser et al., 2015).There were more lesions in the distal than the proximalcolon, which can be caused by the partial degradation ofHb during bowel passage, suggesting a di�erential sen-sitivity of FIT with respect to left-sided and right-sidedlesions (Haug et al., 2011). It is also important to highlightthat the three lesions in the rectum were detected inwomen. This could be related to previous reports of ahigher occurrence of rectal cancer among women in stu-dies o�nterval cancers, which often are related to FNresults (Digby et al., 2015). Moreover, lesions detected inthe FN group were smaller than those detected inscreening, which can be explained by the fact that f-Hb isrelated to the size of the lesions (Digby et al., 2013).
A key �nding was that most of the FN had an almostundetectable concentration o�-Hb. This indicates thatthese FN lesions would had not been identi�ed bylowering the threshold o�-Hb and, taking into accountthat some countries have a limited colonoscopy capacity,future studies should compare these results using ahigher cut-o� f-Hb concentration (Digby et al., 2015). Wealso analysed whether sample processing delay couldin�uence f-Hb concentration, although no di�erenceswere observed between true and FN results.
In conclusion, decreasing the positivity threshold of FITdoes not increase the detection rate of advanced neoplasia,
but may increase the costs and potential adverse e�ects.However, we should not ignore gastrointestinal symptomsand better inform our target population that successivescreening is required to detect CRC early.
AcknowledgementsThe authors are part of the Adverse E�ects on ColorectalCancer Screening in Catalonia (EACC) Study ’ workinggroup. Other members of the ‘Adverse E�ects onColorectal Cancer Screening in Catalonia (EACC) Study ’working group are Núria Maiz, Laura Pareja, Òlbia Serra,Antonio Soriano and Carmen Vidal. Sample collection ofthis work was supported by ICOBIOBANC, sponsoredby the Catalan Institute of Oncology.
This study was partially cofunded by the Carlos IIIHealth Institute, the European Regional DevelopmentFund – a way to build Europe (PI11/01439, PI14-00613,PI12/00992, RD12/003670053) and by the Department ofUniversities and Research (2014SGR635, 2014SGR647),Government of Catalonia.
Author contributions: Study design: V.M., G.I. and M.G.;literature review: G.I. and M.G.; analysis: N.M., J.G.M.;draft of the manuscript: G.I., M.G. and V.M.; acquisition ofdata: L.B., I.P., M.B., F.R.M.; G.B.; revision of the manu-script: all authors.
Con�icts o�nterestThere are no con�icts o�nterest.
ReferencesÁlvarez C, Andreu M, Castells A, Quintero E, Bujanda L, Cubiella J, et al.,
ColonPrev Study Investigators (2013). Relationship of colonoscopy-detectedserrated polyps with synchronous advanced neoplasia in average-risk indivi-duals. Gastrointest Endosc 78 :333.e1 –341.e1.
Atkin WS, Valori R, Kuipers EJ, Ho� G, Senore C, Segnan N, et al., InternationalAgency for Research on Cancer (2012). European guidelines for qualityassurance in colorectal cancer screening and diagnosis. First Edition –colonoscopic surveillance following adenoma removal.Endoscopy 44 (Suppl3):SE151 –SE163.
Brenner H, Tao S (2013). Superior diagnostic performance o�aecal immuno-chemical tests for haemoglobin in a head-to-head comparison with guaiacbased faecal occult blood test among 2235 participants of screening colo-noscopy. Eur J Cancer 49 :3049 –3054.
Digby J, Fraser CG, Carey FA, McDonald PJ, Strachan JA, Diament RH, et al.(2013). Faecal haemoglobin concentration is related to severity of colorectalneoplasia. J Clin Pathol 66 :415 –419.
Digby J, Fraser CG, Carey FA, Lang J, Stanners G, Steele. RJ (2015). Intervalcancers using a quantitative faecal immunochemical test (FIT) for haemoglobinwhen colonoscopy capacity is limited. J Med Screen [Epub ahead of print].
Fraser CG, Auge JM, PROCOLON Group (2015). Faecal haemoglobin con-centrations do vary across geography as well as with age and sex: rami�ca-tions for colorectal cancer screening. Clin Chem Lab Med 53 :e235 –e237.
Garcia M, Milà N, Binefa G, Benito L, Gonzalo N, Moreno V (2015). Fecalhemoglobin concentration as a measure of risk to tailor colorectal cancerscreening: are we there yet? Eur J Cancer Prev 24 :321 –327.
Haug U, Knudsen AB, Brenner H, Kuntz KM (2011). Is fecal occult blood testingmore sensitive for left- versus right-sided colorectal neoplasia? A systematicliterature review.Expert Rev Mol Diagn 11 :605 –616.
Lee JK, Liles EG, Bent S, Levin TR, Corley DA (2014). Accuracy o�ecal immu-nochemical tests for colorectal cancer: systematic review and meta-analysis.Ann Intern Med 160 :171.
Stegeman I, de Wijkerslooth TR, Stoop EM, van Leerdam M, van Ballegooijen M,Kraaijenhagen RA, et al. (2013). Risk factors for false positive and for falsenegative test results in screening with fecal occult blood testing.Int J Cancer133 :2408 –2414.
False negatives in CRC screening Ibañez-Sanz et al. 367
85


ARTICLE 3: Risk model for colorectal cancer in Spanish population using environmental and genetic factors: results from the MCC-Spain study
Ibáñez-Sanz G, Díez-Villanueva A, Alonso MH, Rodríguez-Moranta F, Pérez-Gómez B, Bustamante M, Martin V, Llorca J, Amiano P, Ardanaz E, Tardón A, Jiménez-Moleón JJ, Peiró R, Alguacil J, Navarro C, Guinó E, Binefa G, Navarro PF, Espinosa A, Dávila-Batista V, Molina AJ, Palazuelos C, Castaño-Vinyals G, Aragonés N, Kogevinas M, Pollán M, Moreno V. Scientific Reports. 2017; 24;7:43263.


1Scientific RepoRts | 7:43263 | DOI: 10.1038/srep43263
www.nature.com/scientificreports
Risk Model for Colorectal Cancer in Spanish Population Using Environmental and Genetic Factors: Results from the MCC-Spain studyGemma Ibáñez-Sanz1, Anna Díez-Villanueva1, M. Henar Alonso1,2, Francisco Rodríguez-Moranta2,3, Beatriz Pérez-Gómez2,4,5, Mariona Bustamante2,6, Vicente Martin2,7, Javier Llorca2,8, Pilar Amiano2,9, Eva Ardanaz2,10, Adonina Tardón2,11, Jose J. Jiménez-Moleón2,12, Rosana Peiró2,13, Juan Alguacil2,14, Carmen Navarro2,15, Elisabet Guinó1,2, Gemma Binefa1,2, Pablo Fernández Navarro2,4,5, Anna Espinosa2,6, Verónica Dávila-Batista7, Antonio José Molina2,7, Camilo Palazuelos8, Gemma Castaño-Vinyals2,6,16,17, Nuria Aragonés2,4,5, Manolis Kogevinas2,6,16,17,18, Marina Pollán2,4,5 & Victor Moreno1,2,19
Colorectal cancer (CRC) screening of the average risk population is only indicated according to age. We aim to elaborate a model to stratify the risk of CRC by incorporating environmental data and single nucleotide polymorphisms (SNP). The MCC-Spain case-control study included 1336 CRC cases and 2744 controls. Subjects were interviewed on lifestyle factors, family and medical history. Twenty-one CRC susceptibility SNPs were genotyped. The environmental risk model, which included alcohol consumption, obesity, physical activity, red meat and vegetable consumption, and nonsteroidal anti-inflammatory drug use, contributed to CRC with an average per factor OR of 1.36 (95% CI 1.27 to 1.45). Family history of CRC contributed an OR of 2.25 (95% CI 1.87 to 2.72), and each additional SNP contributed an OR of 1.07 (95% CI 1.04 to 1.10). The risk of subjects with more than 25 risk alleles (5th quintile) was 82% higher (OR 1.82, 95% CI 1.11 to 2.98) than subjects with less than 19 alleles (1st quintile). This risk model, with an AUROC curve of 0.63 (95% CI 0.60 to 0.66), could be useful to stratify individuals. Environmental factors had more weight than the genetic score, which should be considered to encourage patients to achieve a healthier lifestyle.
1Cancer Prevention and Control Program, Catalan Institute of Oncology-IDIBELL, L’Hospitalet de Llobregat, Spain. 2CIBER Epidemiología y Salud Pública (CIBERESP), Madrid, Spain. 3Gastroenterology Department, Bellvitge University Hospital-IDIBELL, L’Hospitalet de Llobregat, Spain. 4Environmental and Cancer Epidemiology Department, National Center of Epidemiology - Instituto de Salud Carlos III, Madrid, Spain. 5Oncology and Hematology Area, IIS Puerta De Hierro, Cancer Epidemiology Research Group, Madrid, Spain. 6ISGlobal Centre for Research in Environmental Epidemiology (CREAL), Barcelona, Spain. 7Instituto de Biomedicina (IBIOMED). Grupo de investigación en interacciones gen ambiente y salud. Universidad de León, León, Spain. 8Universidad de Cantabria - IDIVAL, Santander, Spain. 9Public Health Division of Gipuzkoa, Biodonostia Research Institute, San Sebastian, Spain. 10Navarra Public Health Institute, Navarra, Spain. 11University Institute of Oncology of Asturias (IUOPA), Universidad de Oviedo, Oviedo, Spain. 12Instituto de Investigación Biosanitaria de Granada (ibs.GRANADA), Hospitales Universitarios de Granada, Granada, Spain. 13Fundación para el Fomento de la Investigación Sanitaria y Biomédica de la Comunitat Valenciana FISABIO–Salud Pública, Valencia. 14Centre for Research in Health and Environment (CYSMA), Universidad de Huelva, Huelva, Spain. 15Department of Epidemiology, Murcia Regional Health Council, IMIB-Arrixaca and Department of Health and Social Sciences, Universidad de Murcia, Murcia, Spain. 16IMIM (Hospital Del Mar Medical Research Institute), Barcelona, Spain. 17Universitat Pompeu Fabra (UPF), Barcelona, Spain. 18School of Public Health, Athens, Greece. 19Department of Clinical Sciences, Faculty of Medicine, University of Barcelona, Barcelona, Spain. Correspondence and requests for materials should be addressed to V.M. (email: [email protected])
Received: 29 September 2016
Accepted: 20 January 2017
Published: 24 February 2017
OPEN
89
www.nature.com/scientificreports/
2Scientific RepoRts | 7:43263 | DOI: 10.1038/srep43263
Colorectal cancer (CRC) screening by faecal occult blood testing has been demonstrated to reduce CRC inci-dence and mortality1, as well as being a cost-effective strategy compared to no screening2,3. Recent evidence of the benefit-harms balance of cancer screening has led to proposals for more personalized strategies based on individ-ual cancer risk. Effectiveness of a screening strategy depends on the average cancer risk of the target population. Today, the target population is defined basically by age (≥ 50 years old), which has been called a ‘one-size-fits-all’ strategy4. This strategy implies performing unnecessary screening tests in low-risk people leading to avoidable risks for patients and extra costs for the healthcare system. On the other hand, high-risk patients may receive non-invasive testing, which is a suboptimal screening technique in their case. A risk-based CRC screening that included environmental risk factors, family history of CRC, and information derived from genetic susceptibility loci could improve not only the efficacy of the screening program but also the adherence of high-risk patients when properly informed of their personal risk.
Several risk prediction models, either for CRC or advanced neoplasia, have been previously developed, all with limited discriminating ability5–10. These studies have encompassed the traditional environmental risk factors for CRC including age, sex, family history of CRC, smoking, alcohol, Body Mass Index (BMI), physical activity, diet, and some drugs (nonsteroidal anti-inflammatory drugs (NSAID), acetylsalicylic acid (ASA), calcium and vitamins). Furthermore, with the identification of CRC-associated common single-nucleotide polymorphisms (SNPs), a few studies have added genetic susceptibility information together with some of the clinical risk fac-tors6,11–14. Each common low-penetrance allele is associated with a small increase in risk of CRC, but the com-bined effect of multiple SNPs may achieve a higher degree of risk discrimination, which could be useful to stratify the population15–18. In this study we have developed a risk stratification model that combines environmental factors with family history and genetic susceptibility. Furthermore, we have interpreted the relative contribution of these factors and the utility of the model for risk stratification and public health intervention.
Materials and MethodsStudy population. A detailed description of the MCC-Spain case-control study has been provided else-where19. Briefly, between 2008–2013, 10183 subjects aged 20–85 years were enrolled in 23 hospitals and primary care centres in 12 Spanish provinces (Madrid, Barcelona, Navarra, Girona, Gipuzkoa, León, Asturias, Murcia, Huelva, Cantabria, Valencia, and Granada). Eligible subjects included histological confirmed incident cases of CRC (n = 2171). Potential controls that reported having had a diagnosis of CRC were excluded. Both cases and controls were free of personal CRC history. Controls were frequency-matched to cases, by age, sex, and region, ensuring that in each region there was at least one control of the same sex and a 5-year interval for each case. For the present study, a subset including 1336 CRC cases and 2744 controls with genotype data were analysed.
Data collection. A structured computerized epidemiological questionnaire was administered by trained personnel in a face-to-face interview. Also, subjects filled in a semi-quantitative Food Frequency Questionnaire (FFQ), and blood samples and anthropometric data were obtained following the study protocol.
Only variables clearly related with CRC were considered for the development of risk models. The variables considered were: family history of CRC (none versus first or second or third-degree); cigarette smoking, grouped into non-smokers and smokers (including former and current); average alcohol consumption between 30 and 40 years of age (in standard units of alcohol, SUA), categorized into low-risk and high-risk consumption (> 4 SUA/day in men and > 2 SUA/day in women)20; BMI (calculated with the weight reported at 45 years of age), which was categorized according to World Health Organization criteria as underweight, normal weight, and overweight (< 30 kg/m2) versus obese (≥ 30 kg/m2); average physical exercise, measured from self-reported leisure-time activ-ity performed in the past 10 years and used to estimate the Metabolic Equivalent of Task (MET) per hour per week, calculated using the Ainsworth’s compendium of physical activities21, and categorized as no physical activity in leisure time (0 MET) and any physical activity in spare time (> 0 MET); red meat consumption, including meat from mammals (cattle, oxen, veal, beef, pork, etc.), meat from hunting birds (duck, pheasant, etc.), organ meats (liver, brains, etc.), cured meat (ham, bacon, etc.), and processed meat (hot dogs, sausages, meat balls, etc.). High intake of red meat was considered eating ≥ 65 g/day; vegetables, classified as low or high intake using 200 g/day as cut-off.
All the patients’ drugs were recorded but only nonsteroidal anti-inflammatory drugs (NSAIDs) (cyclooxygenase 1 and 2 inhibitors) and ASA were taken into account for this study. Patients were considered users of NSAIDs/ASA if they consumed ≥ 1 times/day for at least 1 year.
The location of the CRC was defined according to its anatomic distribution: proximal colon (colon above the level of the splenic flexure, or including it), distal (descending colon and sigmoid colon), and rectum.
All procedures performed in studies involving human participants were in accordance with the ethical stand-ards of the institutional and/or national research committee, and with the 1964 Helsinki Declaration and its later amendments or comparable ethical standards. The protocol of MCC-Spain was approved by each of the ethics committees of the participating institutions. The specific study reported here was approved by the Bellvitge Hospital Ethics Committee with reference PR 149/08. Informed consent was obtained from all individual partic-ipants included in the study.
Genotyping. The Infinium Human Exome BeadChip (Illumina, San Diego, USA) was used to genotype > 200000 coding markers plus 5000 additional custom SNPs selected from previous GWAS studies or genes of interest. The genotyping array included 25 SNPs previously identified as susceptibility variants for CRC in genome-wide association studies (GWAS)22. Ten SNPs were in the commercial array; we included in the custom content 15 more that had been identified at the time of designing the array (July 2012). For regions where multi-ple SNPs had been reported, we included only the most statistically significant SNP for each locus when linkage disequilibrium was > 0.5. As a result, we included a total of 21 SNPs in the final analysis, detailed in Table 1.
90

www.nature.com/scientificreports/
3Scientific RepoRts | 7:43263 | DOI: 10.1038/srep43263
Statistical analysis. Multivariate logistic regression models were used to build risk models. All models were adjusted by a propensity score23 to reduce bias related to differences in case and control selection frequencies, and account for the frequency matched design of the study. The propensity score model was constructed as the individual prediction (in logit scale) of a logistic regression in which case/control status was modelled with age, sex, level of education, recruiting centre, and the first 3 principal components of genetic ancestry obtained from genotyping data. The interactions between age and sex and centre and sex were also included in the model. The propensity score was added as a continuous variable to adjust the risk models. Since age and sex were used as stratification factors for frequency matching the selection of controls, these variables cannot contribute to the risk model.
An environmental risk score (ERS) was built including all the significant covariates that can be modified (alcohol use, BMI, physical exercise, red meat and vegetable intake, and NSAIDs/ASA use). Family history was not considered in this environmental score since it is not modifiable, and its effect was assessed as a separate fac-tor. Missing values in variables were imputed using the expected value derived from a model built with complete cases. For categorical variables, the most frequent value was imputed.
To assess genetic susceptibility, an additive genetic risk score (GRS) was put together. Each SNP was coded as 0, 1, or 2 copies of the risk allele except for the SNP rs5934683 in chromosome X that was coded 0, 0.5, and 1. We defined the GRS as the count of risk alleles across all 21 SNPs, ranging from 12 to 33. Since the published effects of each SNP were similar, an unweighted GRS was preferred. We also explored the models using weights derived from the GWAS publications and models fitted to our data, but the predictive accuracy was very similar.
The predictive accuracy of models was assessed with the area under the ROC curve (AUROC), adjusted for the propensity score. Data were split into quintiles of propensity scores, and the weighted mean of the AUROC for each quintile model was calculated. Weights were proportional to the number of cases in each quintile. To account for potential overfitting that could overestimate the effect of GRS, especially for more complex models using weights, 5-fold cross validation was used to estimate the AUROC. In addition, the 95% CIs were calculated using bootstrapping techniques on top of the cross-validated estimates.
To estimate the potential public health impact of the ERS and GRS, we applied the estimated odds ratios (OR) to population average CRC incidence estimations published by the International Agency for Research on Cancer (IARC). Data were extracted from the publication Cancer Incidence in Five Continents (CI5) Volume X, for the Spanish cancer registries24. Average age and gender-specific cumulative risks for the Spanish population were
SNP Chr Position Mapped GeneRisk
AlleleRisk Allele Frequency
Reported p-value
Reported OR
OR MCC-Spain 95% CI
p-value
rs10752881 1 183004356 KRT18P28 - LAMC1 A 0.76 5.0E-06 1.07 1.11 1.01–1.21 0.04
rs6691170 1 221872104 DUSP10 - QRSL1P2 T 0.31 1.0E-09 1.06 1.09 0.99–1.20 0.08
rs10936599 3 169774313 MYNN C 0.19 3.0E-08 1.04 1.10 0.98–1.23 0.11
rs1321311 6 36655123 N/A C 0.30 1.0E-10 1.10 1.03 0.93–1.15 0.54
rs7758229 6 160419220 SLC22A3 T 0.67 8.0E-09 1.28 1.07 0.96–1.18 0.21
rs16892766 8 116618444 LINC00536 - EIF3H C 0.39 3.0E-18 1.27 1.17 0.98–1.39 0.08
rs6983267 8 127401060 CCAT2 - LOC101930033 G 0.82 1.0E-14 1.27 1.10 1.00–1.21 0.04
rs10795668 10 8659256 RNA5SP299 - LINC00709 G 0.73 5.0E-15 1.15 1.06 0.95–1.17 0.30
rs4948317 10 58811675 BICC1 C 0.30 7.0E-08 1.10 1.07 0.97–1.18 0.19
rs3802842 11 111300984 COLCA2 - COLCA1 C 0.08 6.0E-10 1.11 1.09 0.98–1.20 0.12
rs3824999 11 74634505 POLD3 G 0.13 4.0E-10 1.08 1.09 1.00–1.20 0.06
rs10879357 12 72020783 TPH2 G 0.50 3.0E-06 1.25 1.00 0.91–1.11 0.94
rs11169552 12 50761880 DIP2B - ATF1 C 0.82 2.0E-10 1.09 1.02 0.91–1.14 0.80
rs7315438 12 115453598 TBX3 - UBA52P7 T 0.41 6.0E-06 1.11 1.03 0.94–1.13 0.53
rs4444235 14 53944201 RPS3AP46 - MIR5580 C 0.43 8.0E-10 1.11 1.03 0.94–1.13 0.51
rs9929218 16 68787043 CDH1 G 0.46 1.0E-08 1.10 1.13 1.01–1.25 0.03
rs4939827 18 48927093 SMAD7 T 0.27 8.0E-28 1.20 1.22 1.11–1.34 0.03
rs10411210 19 33041394 RHPN2 C 0.31 5.0E-09 1.15 1.01 0.88–1.16 0.92
rs4925386 20 62345988 LAMA5 C 0.58 2.0E-10 1.08 1.08 0.98–1.19 0.14
rs961253 20 6423634 FGFR3P3 - CASC20 A 0.28 2.0E-10 1.12 1.10 1.00–1.22 0.05
rs5934683 X 9783434 GPR143 - SHROOM2 C 0.57 7.0E-10 1.07 1.04 0.93–1.17 0.46
Table 1. Association between the 21 selected previously reported SNPs and risk of CRC in the study population. SNPs associated with CRC risk in MCC population with p < 0.05 are highlighted in bold.
91

www.nature.com/scientificreports/
4Scientific RepoRts | 7:43263 | DOI: 10.1038/srep43263
projected according to combinations of ERS and GRS to define risk strata. For these estimates, the published cumulative risks were multiplied by the ORs estimated from out risk models. We used the average number of risk factors and risk alleles in the population as reference categories for these calculations. Also, the sensitivity and specificity values for a selection of risk scores were used, combined with the cumulative risk of developing CRC cancer for age decades from 40 years to 80 years old, in order to estimate the positive and negative predictive values. The Bayes theorem was used for these calculations.
Statistical analysis was carried out using R statistical software (R Foundation for Statistical Computing, Vienna, Austria).
ResultsCase and control characteristics are detailed in Table 2. Variables were coded with the lower CRC risk category as reference to simplify the effects of comparison and calculation of risk scores. All the environmental variables considered for the risk model were significantly associated with CRC, after adjusting for the propensity score. The crude ORs were very similar for the categorizations selected, ranging from 1.29 (BMI ≥ 30 mg/kg2) to 1.57 (NSAID/ASA). The multivariate model with all environmental factors showed that all were independently con-tributing to CRC risk (Table 3). Tobacco was not included in the model since smoking was no longer significant when other factors were considered (adjusted OR 1.06, 95% CI 0.91 to 1.23). The ERS, calculated as the count of risk factors, indicated that on average the adjusted OR was 1.36 (95% CI 1.27 to 1.45). Figure 1 shows the distri-bution of the ERS for cases and controls, and the estimated risk of CRC according to the number of risk factors, compared to an average individual (ERS = 3).
Family history of CRC was strongly associated with CRC (adjusted OR 2.27, 95% CI 1.88 to 2.74). We com-bined first, second, or third-degree relatives with CRC in the risk group, since the ORs were very similar. This variable was independent of the environmental risk factors.
Out of 21 GWAS SNPs analysed, only 5 were statistically significant in our data (rs10752881, rs6983267, rs9929218, rs4939827, rs961253; Table 1). The contribution to risk of each SNP in the MCC-Spain study was
Characteristic
Control Case
Crude OR 95% CIn % n %
Age
25–50 years 394 14.43 80 6.04 1.00
50–70 years 1441 52.76 649 48.98 2.22 1.71–2.87
70–90 years 909 33.28 607 45.81 3.29 2.53–4.27
Sex
Female 1275 46.47 471 35.25 1.00
Male 1469 53.53 865 64.75 1.59 1.39–1.82
Family History of CRC
No 2411 87.86 1044 78.14 1.00
Yes 333 12.14 292 21.86 2.25 1.87–2.71
Smoking
Non-smoker 1195 43.55 557 41.69 1.00
Former/Current smoker 1549 56.45 779 58.31 1.20 1.04–1.38
Alcohol
Low consumption 2317 84.44 1036 77.54 1.00
High consumption 427 15.56 300 22.46 1.38 1.16–1.63
Body Mass Index at age 45
< 30 kg/m2 2556 93.15 1194 89.37 1.00
≥ 30 kg/m2 188 6.85 142 10.63 1.36 1.07–1.73
Physical activity in leisure time (MET)
Yes 1687 61.48 717 53.67 1.00
No 1057 38.52 619 46.33 1.37 1.19–1.58
Vegetables
> 200 g/day 846 30.83 345 25.82 1.00
≤ 200 g/day 1898 69.17 991 74.18 1.39 1.19–1.62
Red meat
≤ 65 g/day 1621 59.07 662 49.55 1.00
> 65 g/day 1123 40.93 674 50.45 1.38 1.20–1.59
NSAID/ASA
Regular use in the last year 1995 72.70 1064 79.64 1.00
Non-use/sporadically use 749 27.30 272 20.36 1.54 1.31–1.82
Table 2. Characteristics of the MCC-Spain study participants. MET: Metabolic equivalent of task per hour per week; NSAID: Nonsteroidal anti-inflammatory drugs; ASA: acetylsalicylic acid.
92

www.nature.com/scientificreports/
5Scientific RepoRts | 7:43263 | DOI: 10.1038/srep43263
small, with per allele ORs in the range of 1.00 to 1.22. The GRS built as the unweighted count of risk alleles was significantly associated with CRC, with an average per-allele OR of 1.07 (95% CI 1.04 to 1.10). The GRS was sig-nificantly associated with family history, but it only explained 0.3% of the variability. Subjects with family history had an average of 0.45 (95% CI 1.18 to 1.78, p = 0.0004) more risk alleles, and four SNPs (rs16892766, rs10795668, rs9929217, and rs4939827) were associated with family history of CRC with p-value < 0.05. When the GRS was adjusted for family history of CRC, the OR was 1.07 (95% CI 1.05 to 1.10, p = 1.2e-8). Cases had an average of 22.73 alleles while controls had 22.10, with ample overlap as shown in the histogram of Fig. 2. The difference in mean GRS was 0.63 alleles (95% CI 0.44 to 0.82; p = 1.2e-10). There was an 82% increase in CRC risk (OR 1.82, 95% CI 1.11 to 2.98) between subjects with ≤ 18 risk alleles (first quintile) and those with ≥ 26 risk alleles (fifth quintile). As shown in Fig. 2, the increase in risk per allele was linear, indicating the independent additive contri-bution of each allele to the GRS. The risk of CRC doubled for a difference of 10 risk alleles (OR 1.96, 95%CI 1.54 to 2.50). The GRS was independent of environmental variables. Also, no significant interactions were observed between the GRS and age, sex, or any of the environmental variables included in the multivariate model.
Regarding tumour location, there were 30.7% (n = 405) tumours located in the rectum, 40.2% (n = 531) in the distal colon, and 29.1% (n = 385) in the proximal colon (15 subjects had missing data). The analysis stratified by cancer location did not show relevant differences (Supplementary Table 1). In general, both environmental and genetic factors had greater effects in rectal than colon cancer. High intake of red meat was the factor with major differences between colon and rectal cancers.
Adjusted ORa CI 95%
Genetic Risk Score GRS (per allele) 1.07 1.04–1.10
Family history of CRC 2.25 1.87–2.72
Environmental risk factors
Alcohol 1.34 1.12–1.60
BMI ≥ 30 kg/m2 1.29 1.01–1.65
No physical activity 1.34 1.16–1.55
Vegetables ≤ 200 g/day 1.35 1.15–1.58
Red meat > 65 g/day 1.29 1.12–1.49
No NSAID/ASA regular use 1.57 1.33–1.86
ERS (per factor) 1.36 1.27–1.45
Table 3. Multivariate-adjusted risk factors associated with CRC. CRC: colorectal cancer; GRS: genetic risk score; ERS: environmental risk score; BMI: body mass index; NSAID: nonsteroidal anti-inflammatory drugs; ASA: acetylsalicylic acid. aAll variables are adjusted by propensity score and all the variables shown in the table. bThe reference category is 22 risk alleles, the average in the population.
Figure 1. Distribution and CRC risk of the environmental risk score in cases and controls. The left axis scale indicates the OR for CRC according to the number of environmental risk factors. The category of tree factors was selected as reference (OR = 1), because this is the average in the population. The right axis scale indicates the proportion of cases and controls shown in bars for each number of environmental risk factors.
93

www.nature.com/scientificreports/
6Scientific RepoRts | 7:43263 | DOI: 10.1038/srep43263
Predictive accuracy of the risk model. The contribution to CRC risk prediction was estimated for mod-ifiable environmental risk factors, family history, and the GRS. Figure 3 shows the individual (red discontinuous line) and cumulative (black continuous line) contribution of each environmental factor to the risk. The cumu-lative contribution of the seven environmental factors resulted in a cross-validated AUROC of 0.60 (95% CI 0.57 to 0.61). Family history, which is not modifiable but can be obtained by interview, increased the AUROC to 0.61 (95% CI 0.59 to 0.64). The GRS, on its own, had an AUROC of 0.56 (95% CI 0.54 to 0.58). The increase in AUROC for the model with the GRS on top of ERS and family history (FH) was 0.02, with an overall AUROC of 0.63 (95% CI 0.60 to 0.66). This 5-fold cross-validated AUROC was smaller than the direct estimate of the model, which was 0.65, indicating some optimism in the estimate even when an unweighted GRS was used. When we explored weighted models for the GRS, the 5-fold cross-validated AUROC was 0.62 (95%CI 0.60 to 0.65) for weights derived from published GWAS and 0.63 (95% CI 0.61 to 0.66) for weights derived from the fitted logistic regression model.
Figure 2. Distribution and CRC risk of the genetic risk score in cases and controls. The left axis scale indicates the OR for CRC according to the number of risk alleles. The group of 22 alleles was selected as reference category (OR = 1), because this is the average in the population. The right axis scale indicates the proportion of cases and controls shown in bars for each allele.
Figure 3. Individual and cumulative contribution of each factor to CRC predictive accuracy. The area under the ROC curve (AUROC), as indicator of predictive accuracy for each variable in the risk model, is shown. The left discontinuous (red) line indicates the individual contribution of each variable, and the right continuous (black) line indicates the cumulative contribution, bottom to top. Environmental variables are sorted by increasing AUROC. CRC: colorectal cancer; NSAID: nonsteroidal anti-inflammatory drugs; ASA: acetylsalicylic acid; BMI: body mass index.
94

www.nature.com/scientificreports/
7Scientific RepoRts | 7:43263 | DOI: 10.1038/srep43263
Estimating the potential public health impact of a risk model to stratify screening or modify risk factors in the Spanish average risk population. A simple calculation of the relative risk could be made using the following risk score (RS) equation: RS = 1.36(ERS-3) * 2.25FH * 1.07(GRS-22). An individual with no family history (FH = 0), three environmental risk factors (ERS = 3), and 22 risk alleles (GRS = 22) would have the average population risk (RS = 1). In contrast, a subject with 6 environmental risk factors (ERS = 6), family history (FH = 1), and 28 risk alleles (GRS = 28) would have an RS of 7.25 times the average risk. The distribution in the population of the RS is shown in Supplementary Figure 1.
As lifetime cumulative risk is a better individual measure of the impact of cancer burden, we calculated indi-vidual risk by applying the estimated RS to specific cumulative risk of CRC of the Spanish population. For this calculation, Spanish cancer incidence data obtained from cancer registries were used. Figure 4 shows how cumu-lative incidence curves are shifted according to the risk score. Supplementary Figures 2 and 3 show these analyses but specific to the ERS and GRS, respectively. As it is already known, men have a higher incidence of CRC than women, and incidence grows exponentially from 50 years of age for both sexes.
From Fig. 4 (numbers are shown in Supplementary Table 2) we can estimate that a Spanish man with average risk score (RS = 1, 22 risk alleles) has a lifetime cumulative risk of CRC of approximately 10% (5% in the case of a woman). In contrast, the lifetime cumulative risk would increase to 20% and 10% for men and women, respec-tively, among subjects with a risk score of 2 (29 risk alleles). The risk for a hypothetical individual at age 50 with an RS of 2 is similar as that for an individual with average risk alleles (GRS = 22) but younger (45 years old for men). In other words, at age 45, this man with RS = 2 would be at the same risk as a man with RS = 1 at age 50. At older ages, since the effect is multiplicative, the relative risk anticipation is greater. The cumulative risk of CRC during the screening age period (50–69), in this scenario, would double: from 3% to 6% among men and from 2% to 4% for women.
The sensitivity, specificity, and likelihood ratios of the risk model to detect CRC for selected risk score cut-offs are shown in Table 4. The use of a high cut-off (RS = 5) offers high specificity (98.94%) but low sensi-tivity (8.38%). These figures can be useful to assess the relative interest of extending the age of CRC screening for selected strata of the population with such high risk scores, either before age 50 or after age 69. As Fig. 5 and Supplementary Table 3 show, the positive predictive value of the model increases only in a relevant way at older ages, when the prior probability of CRC is higher, especially for RS over 2. The cumulative risk of developing CRC during the age range 70–79 is almost 40% for subjects with a risk score of 5.
DiscussionWe assessed the potential utility of a risk prediction model for CRC that combines modifiable risk factors with family history of CRC and a genetic risk score based on 21 susceptibility SNPs. We have observed that modifiable risk factors have a stronger value for risk prediction than does genetic susceptibility. Though the added value of each SNP is small, the combination of 21 SNPs adds significantly to the predictive power of the risk model.
Our study is large enough to confirm that established risk factors are associated with risk: family history of CRC, high consumption of alcohol, obesity, lack of physical activity in leisure time, high intake of red meat, low intake of vegetables, and non-use of NSAIDs/ASA. These risk factors were selected based on previous evidence reported in systematic reviews and meta-analyses25–31. All were independent predictors of CRC in an average risk population, with the exception of smoking, which was only significant in the univariate analysis. A recent
Figure 4. Estimation of CRC incidence in Spain by sex, age (years), and risk score. Color lines indicate age-specific cumulative risk rates of CRC per 100 individuals in Spain according to sex and risk score (RS), for a selection of values. The cumulative risk curve for the average individual corresponds to RS = 1. The risk score can be calculated as RS = 1.36(ERS-3) * 2.25FH * 1.07(GRS-22), where ERS is the number of environmental risk factors (average 3 in the population), FH is the presence of family history of CRC (0 = no, 1 = yes), and GRS is the number of risk alleles (average 22 in the population).99
95

www.nature.com/scientificreports/
8Scientific RepoRts | 7:43263 | DOI: 10.1038/srep43263
meta-analysis on smoking has shown that the effect is small for CRC, with a summary OR smaller than 1.25, and larger for rectal than colon cancer32. We also analysed other covariates that have been associated with CRC (diabetes mellitus, inflammatory bowel disease, and diverticulitis) but they were not associated with CRC in our study, perhaps because of the small number of affected individuals. Nor was intake of vitamin D, calcium, or folic acid associated with CRC. We opted not to include statins in the model since there is controversy regarding these drugs and CRC risk33.
Our study confirms that family history of CRC is the strongest single risk factor for CRC. We found a signifi-cant association between the GRS and family history, which highlights the importance of genetic susceptibility in CRC, though family history could also contribute to risk through shared lifestyle or environmental factors. Also, gene-environment interactions may play a role in this type of cancer34–36.
Our analysis has shown that the ERS, built as an additive model of modifiable factors, has stronger association with CRC than the GRS. On average, each environmental risk factor increases CRC risk by 35%, while each risk allele only increases it by 7%. This implies that the change of one modifiable risk factor towards healthier lifestyle might offset the effect of 4 risk alleles. Given the fact that environmental factors explain a significant part of the CRC risk, we believe it to be important to give thought to incorporating clinical data to improve current screening and encourage patients to achieve a healthier lifestyle.
We also believe it is important to consider that our genotyping array only had 21 susceptibility SNPs, and today more than 60 have been identified in diverse GWAS studies22. Though SNPs identified more recently have smaller effects (in the range of 5% increased risk per allele) and smaller allele frequencies, their addition may still increase the predictive accuracy of the model in a relevant way. In our Spanish population only five SNPs out of the 21 analysed were significantly associated with CRC risk. This might be related to lack of statistical power, since with 1300 cases and 2700 controls we only have 30% power to detect an OR of 1.10, but some of the SNPs may also have effects limited to specific populations. It is reassuring, however, that all SNPs analysed had an effect in the same direction as reported in the discovery study.
Several risk prediction models for advanced neoplasia or CRC have previously been published, with AUROC between 0.65 and 0.758. Our estimate of predictive accuracy, corrected for overfitting through cross-validation, is slightly smaller (AUROC: 0.63, 95% CI 0.60 to 0.66), but our model could not include age and gender because these factors were used to match the controls. Also the estimated risk per allele (OR 1.07, 95% CI 1.04 to 1.10)
Risk score Sensitivity SpecificityPositive
Likelihood RatioNegative
Likelihood Ratio
0.25 98.50 7.87 1.07 0.19
0.5 91.39 30.72 1.32 0.28
1 71.48 60.13 1.79 0.47
2 41.62 84.66 2.71 0.69
4 13.55 97.89 6.41 0.88
5 8.38 98.94 7.93 0.93
6 5.39 99.31 7.78 0.95
Table 4. Predictive performance indexes of the risk score for selected cutoffs.
Figure 5. Positive predictive value for CRC according to age range and risk score. Colour lines indicate the positive predictive value (PPV) for CRC for each age range. Estimates are derived from sensitivity and specificity of the risk model (Table 4) for each risk score applied to the cumulative risk of developing CRC in the age range, using Bayes’ theorem.
96

www.nature.com/scientificreports/
9Scientific RepoRts | 7:43263 | DOI: 10.1038/srep43263
was similar to those reported by studies which included genetic biomarkers and phenotypic variables (AUROC: 0.51–0.73)6,11–14. Dunlop et al.12 used the combined effect of age, gender, family history, and 10 SNPs to assess CRC risk. They reported an AUROC of 0.59 and a mean per-allele increase in risk of 9%. Yarnall et al.11 combined alcohol intake with 14 SNP obtaining an AUROC of 0.61. Hsu et al.6 developed a risk determination model based on family history and 27 SNPs with an AUC of 0.56 and a risk per allele of 1.02–1.12. Finally, Jung et al.14 reported an AUC of 0.74 with a model that included age, sex, smoking status, fasting serum glucose, family history of colorectal cancer, and 23 SNP.
Our study, which used more SNPs than most previous studies, as well as questionnaire data including diet, confirms that the AUROC increases with more SNPs. Furthermore, the aim of our study was also to build a risk model useful to tailoring CRC screening programs according to individuals’ characteristics and calculating the potential impact of determining an individual risk score in a CRC screening population. The risk model, applied to Spanish cancer registry cumulative risk of CRC, has shown that 3 modifiable risk factors or 10 risk alleles have an expected advance of 5 years in the incidence curve of men by age 50 (2.5 years for women). The absolute effect on incidence is larger at older ages, since the effect is multiplicative. This implies that screening in average-risk populations probably should start earlier, at 45 years, for individuals with more risk factors, and could be delayed to 55 years old (or 60) for individuals with fewer risk factors or risk alleles.
Our calculations also show that it would be most useful to extend the age of CRC screening for high risk pop-ulation after age 69. The positive predictive value of the model increases significantly at older ages, when the prior probability of CRC is higher. Since the conditional life expectancy of a person at age 70 still is long, extending the screening until age 79 might yield a greater reduction in CRC burden.
Moreover, we could also use the risk model to select high-risk subjects in whom colonoscopy might be the optimal initial screening technique rather than the less sensitive faecal occult blood test that is currently imple-mented in Spain and many other countries in Europe37. Another important point to highlight is that the use of prediction models, together with good communication tools, could increase the individual perceived risk, and consequently the participation rate and adherence to screening, especially in high-risk subjects. Moreover, the awareness of a personal risk of CRC might improve people’s lifestyle and thereby reduce CRC incidence.
This study has some limitations. Our model was developed within a retrospective case-control setting, and relied on self-reported data. So, measurement error and recall bias may have led to an underestimation of the predictive accuracy. Cases and controls were not well matched regarding age, sex, and education. However, we performed all the analyses adjusted for a propensity score to reduce the possible bias related to this problem. The model is only applicable to asymptomatic individuals from the general population (average risk); subjects with symptoms or several affected relatives should be referred to colonoscopy independently of the risk score.
As already mentioned, this study only included 21 risk SNPs, while more than sixty have already been identified. More studies are needed to determine the generalizability, usefulness of information, and the cost-effectiveness of applying individual genotyping in a CRC screening program. However, it should be noted that the cost of whole-genome genotyping is decreasing, its determination only needs to be performed once in a lifetime, and the data probably will be useful for predicting risk of other diseases in addition to cancer.
In conclusion, we assessed the predictive accuracy of a model for CRC that could be useful to stratify the pop-ulation into risk categories and tailor CRC screening by adapting the onset age, the intensity, and the screening test. In our model, although the genetic factors are significant contributors, the modifiable risk factors contribute more significantly. Risk assessment may increase screening participation and adoption of healthier lifestyles.
References1. Hewitson, P., Glasziou, P., Watson, E., Towler, B. & Irwig, L. Cochrane systematic review of colorectal cancer screening using the
fecal occult blood test (hemoccult): an update. Am J Gastroenterol 103, 1541–1549 (2008).2. Cruzado, J., Sanchez, F. I., Abellan, J. M., Perez-Riquelme, F. & Carballo, F. Economic evaluation of colorectal cancer (CRC)
screening. Best Pract Res Clin Gastroenterol 27, 867–880 (2013).3. Wong, M. C., Ching, J. Y., Chan, V. C. & Sung, J. J. The comparative cost-effectiveness of colorectal cancer screening using faecal
immunochemical test vs. colonoscopy. Sci Rep 5, 13568 (2015).4. Lieberman, D. A. et al. Race, ethnicity, and sex affect risk for polyps > 9 mm in average-risk individuals. Gastroenterology 147,
351–358; quiz e314–355 (2014).5. Imperiale, T. F., Monahan, P. O., Stump, T. E., Glowinski, E. A. & Ransohoff, D. F. Derivation and validation of a scoring system to
stratify risk for advanced colorectal neoplasia in asymptomatic adults: a cross-sectional study. Ann Intern Med 163, 339–346 (2015).6. Hsu, L. et al. A model to determine colorectal cancer risk using common genetic susceptibility loci. Gastroenterology 148, 1330–1339
e1314 (2015).7. Shaukat, A. et al. Development and validation of a clinical score for predicting risk of adenoma at screening colonoscopy. Cancer
Epidemiol Biomarkers Prev 24, 913–920 (2015).8. Usher-Smith, J. A., Walter, F. M., Emery, J. D., Win, A. K. & Griffin, S. J. Risk prediction models for colorectal cancer: a systematic
review. Cancer Prev Res (Phila) 9, 13–26 (2016).9. Ohno, T. et al. Development of a novel scoring system for predicting the risk of colorectal neoplasia: a retrospective study. PLoS One
11, e0157269 (2016).10. Wang, H. M. et al. A new method for post Genome-Wide Association Study (GWAS) analysis of colorectal cancer in Taiwan. Gene
518, 107–113 (2013).11. Yarnall, J. M., Crouch, D. J. & Lewis, C. M. Incorporating non-genetic risk factors and behavioural modifications into risk prediction
models for colorectal cancer. Cancer Epidemiol 37, 324–329 (2013).12. Dunlop, M. G. et al. Cumulative impact of common genetic variants and other risk factors on colorectal cancer risk in 42,103
individuals. Gut 62, 871–881 (2013).13. Jo, J. et al. Prediction of colorectal cancer risk using a genetic risk score: the Korean Cancer Prevention Study-II (KCPS-II). Genomics
Inform 10, 175–183 (2012).14. Jung, K. J. et al. A colorectal cancer prediction model using traditional and genetic risk scores in Koreans. BMC Genet 16, 49 (2015).15. Valle, L. Genetic predisposition to colorectal cancer: where we stand and future perspectives. World J Gastroenterol 20, 9828–9849
(2014).16. Peters, U., Bien, S. & Zubair, N. Genetic architecture of colorectal cancer. Gut 64, 1623–1636 (2015).
97

www.nature.com/scientificreports/
1 0Scientific RepoRts | 7:43263 | DOI: 10.1038/srep43263
17. Muller, B. et al. Improved prediction of complex diseases by common genetic markers: state of the art and further perspectives. Hum Genet 135, 259–272 (2016).
18. Chatterjee, N., Shi, J. & Garcia-Closas, M. Developing and evaluating polygenic risk prediction models for stratified diseaseprevention. Nat Rev Genet 17, 392–406 (2016).
19. Castano-Vinyals, G. et al. Population-based multicase-control study in common tumors in Spain (MCC-Spain): rationale and studydesign. Gac Sanit 29, 308–315 (2015).
20. Cordoba, R. et al. Recomendaciones sobre el estilo de vida. Aten Primaria 46 Suppl 4, 16–23 (2014).21. Ainsworth, B. E. et al. Compendium of physical activities: an update of activity codes and MET intensities. Med Sci Sports Exerc 32,
S498–504 (2000).22. Burdett, T. et al. The NHGRI-EBI Catalog of published genome-wide association studies, www.ebi.ac.uk/gwas.23. Mansson, R., Joffe, M. M., Sun, W. & Hennessy, S. On the estimation and use of propensity scores in case-control and case-cohort
studies. Am J Epidemiol 166, 332–339 (2007).24. Forman, D. et al. Cancer Incidence in Five Continents, Vol. X (electronic version), http://ci5.iarc.fr (2013).25. Alexander, D. D., Weed, D. L., Miller, P. E. & Mohamed, M. A. Red meat and colorectal cancer: a quantitative update on the state of
the epidemiologic science. J Am Coll Nutr 34, 521–543 (2015).26. Aune, D. et al. Nonlinear reduction in risk for colorectal cancer by fruit and vegetable intake based on meta-analysis of prospective
studies. Gastroenterology 141, 106–118 (2011).27. Ma, Y. et al. Obesity and risk of colorectal cancer: a systematic review of prospective studies. PLoS One 8, e53916 (2013).28. Liu, L. et al. Leisure time physical activity and cancer risk: evaluation of the WHO’s recommendation based on 126 high-quality
epidemiological studies. Br J Sports Med 50, 372–378 (2016).29. Fedirko, V. et al. Alcohol drinking and colorectal cancer risk: an overall and dose-response meta-analysis of published studies. Ann
Oncol 22, 1958–1972 (2011).30. Johns, L. E. & Houlston, R. S. A systematic review and meta-analysis of familial colorectal cancer risk. Am J Gastroenterol 96,
2992–3003 (2001).31. Cuzick, J. et al. Aspirin and non-steroidal anti-inflammatory drugs for cancer prevention: an international consensus statement.
Lancet Oncol 10, 501–507 (2009).32. Cheng, J. et al. Meta-analysis of prospective cohort studies of cigarette smoking and the incidence of colon and rectal cancers. Eur J
Cancer Prev 24, 6–15 (2015).33. Lytras, T., Nikolopoulos, G. & Bonovas, S. Statins and the risk of colorectal cancer: an updated systematic review and meta-analysis
of 40 studies. World J Gastroenterol 20, 1858–1870 (2014).34. Sharafeldin, N. et al. A candidate-pathway approach to identify gene-environment interactions: analyses of colon cancer risk and
survival. J Natl Cancer Inst 107 (2015).35. Kantor, E. D. & Giovannucci, E. L. Gene-diet interactions and their impact on colorectal cancer risk. Curr Nutr Rep 4, 13–21 (2015).36. Hutter, C. M. et al. Characterization of gene-environment interactions for colorectal cancer susceptibility loci. Cancer Res 72,
2036–2044 (2012).37. Frampton, M. J. et al. Implications of polygenic risk for personalised colorectal cancer screening. Ann Oncol 27, 429–434 (2016).
AcknowledgementsBiological samples were stored at the biobanks supported by Instituto de Salud Carlos III- FEDER: Parc de Salut MAR Biobank (MARBiobanc) (RD09/0076/00036), ‘Biobanco La Fe’ (RD 09 0076/00021) and FISABIO Biobank (RD09 0076/00058), as well as at the Public Health Laboratory of Gipuzkoa, the Basque Biobank, the ICOBIOBANC (sponsored by the Catalan Institute of Oncology), the IUOPA Biobank of the University of Oviedo, and the ISCIII Biobank. SNP genotyping services were provided by the Spanish ‘Centro Nacional de Genotipado’ (CEGEN-ISCIII). We thank all the subjects who participated in the study and all MCC-Spain collaborators. This work was supported by the ‘Acción Transversal del Cancer’, approved by the Spanish Ministry Council on the 11th October 2007, by the Instituto de Salud Carlos III, co-founded by FEDER funds –‘a way to build Europe’ (grants PI08/1770, PI08/0533, PI08/1359, PI09/00773, PI09/01286, PI09/01903, PI09/02078, PI09/01662, PI11/01403, PI11/01889, PI11/00226, PI11/01810, PI11/02213, PI12/00488, PI12/00265, PI12/01270, PI12/00715, PI12/00150, PI14/01219, PI14/00613, and PI15/00069). Support was also provided by the Fundación Marqués de Valdecilla (grant API 10/09); the Junta de Castilla y León (grant LE22A10-2); the Consejería de Salud of the Junta de Andalucía (2009-S0143); the Conselleria de Sanitat of the Generalitat Valenciana (grant AP 061/10); the Recercaixa (grant 2010ACUP 00310); the Regional Government of the Basque Country; the Consejería de Sanidad de la Región de Murcia; European Commission grants FOOD-CT-2006-036224-HIWATE; the Spanish Association Against Cancer (AECC) Scientific Foundation; the Catalan Government DURSI (grant 2014SGR647); the Fundación Caja de Ahorros de Asturias; the University of Oviedo; Societat Catalana de Digestologia; and COST action BM1206 Eucolongene.
Author ContributionsStudy conception and design: Victor Moreno and Gemma Ibáñez-Sanz. Statistical analysis: Anna Díez-Villanueva, M. Henar Alonso, Pablo Fernández Navarro and Elisabet Guinó. Preparation of genetic data: Victor Moreno, Mariona Bustamante, Camilo Palazuelos and Anna Espinosa. Coordination of substudy sites, recruitment and acquisition of data: Francisco Rodríguez-Moranta, Beatriz Pérez-Gómez, Vicente Martin, Javier Llorca, Pilar Amiano, Eva Ardanaz, Adonina Tardón, Jose J. Jiménez-Moleón, Rosana Peiro, Juan Alguacil, Carmen Navarro, Gemma Binefa Verónica Dávila-Batista, Antonio José Molina Gemma Castaño-Vinyals, Nuria Aragonés, Manolis Kogevinas and Marina Pollan. Drafting of the manuscript: Victor Moreno and Gemma Ibáñez-Sanz. Contributions to the final version of the manuscript were made by all authors.
Additional InformationSupplementary information accompanies this paper at http://www.nature.com/srepCompeting financial interests: The authors declare no competing financial interests.
98

www.nature.com/scientificreports/
1 1Scientific RepoRts | 7:43263 | DOI: 10.1038/srep43263
How to cite this article: Ibáñez-Sanz, G. et al. Risk Model for Colorectal Cancer in Spanish Population Using Environmental and Genetic Factors: Results from the MCC-Spain study. Sci. Rep. 7, 43263; doi: 10.1038/srep43263 (2017).Publisher's note: Springer Nature remains neutral with regard to jurisdictional claims in published maps and institutional affiliations.
This work is licensed under a Creative Commons Attribution 4.0 International License. The images or other third party material in this article are included in the article’s Creative Commons license,
unless indicated otherwise in the credit line; if the material is not included under the Creative Commons license, users will need to obtain permission from the license holder to reproduce the material. To view a copy of this license, visit http://creativecommons.org/licenses/by/4.0/
© The Author(s) 2017
99


6. DISCUSSIÓ CONJUNTA D’ARTICLES

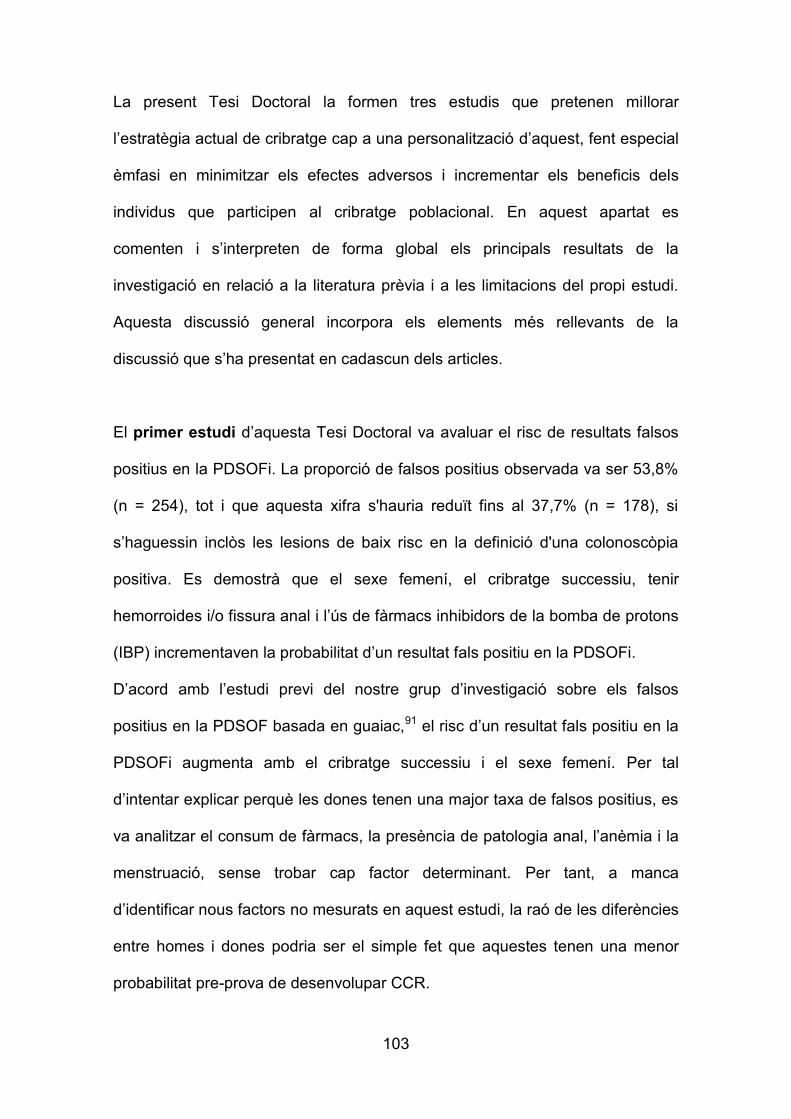
103
La present Tesi Doctoral la formen tres estudis que pretenen millorar
l’estratègia actual de cribratge cap a una personalització d’aquest, fent especial
èmfasi en minimitzar els efectes adversos i incrementar els beneficis dels
individus que participen al cribratge poblacional. En aquest apartat es
comenten i s’interpreten de forma global els principals resultats de la
investigació en relació a la literatura prèvia i a les limitacions del propi estudi.
Aquesta discussió general incorpora els elements més rellevants de la
discussió que s’ha presentat en cadascun dels articles.
El primer estudi d’aquesta Tesi Doctoral va avaluar el risc de resultats falsos
positius en la PDSOFi. La proporció de falsos positius observada va ser 53,8%
(n = 254), tot i que aquesta xifra s'hauria reduït fins al 37,7% (n = 178), si
s’haguessin inclòs les lesions de baix risc en la definició d'una colonoscòpia
positiva. Es demostrà que el sexe femení, el cribratge successiu, tenir
hemorroides i/o fissura anal i l’ús de fàrmacs inhibidors de la bomba de protons
(IBP) incrementaven la probabilitat d’un resultat fals positiu en la PDSOFi.
D’acord amb l’estudi previ del nostre grup d’investigació sobre els falsos
positius en la PDSOF basada en guaiac,91 el risc d’un resultat fals positiu en la
PDSOFi augmenta amb el cribratge successiu i el sexe femení. Per tal
d’intentar explicar perquè les dones tenen una major taxa de falsos positius, es
va analitzar el consum de fàrmacs, la presència de patologia anal, l’anèmia i la
menstruació, sense trobar cap factor determinant. Per tant, a manca
d’identificar nous factors no mesurats en aquest estudi, la raó de les diferències
entre homes i dones podria ser el simple fet que aquestes tenen una menor
probabilitat pre-prova de desenvolupar CCR.

104
Cal destacar que és el primer estudi que analitza si els inhibidors selectius de la
recaptació de la serotonina, a través del seu efecte sobre l’agregació
plaquetària,129 podrien explicar la diferència de falsos positius entre ambdós
sexes, donat que són més prescrits a les dones. Tot i que no es van obtenir
diferències en el risc de falsos positius i l’ús dels inhibidors selectius de la
recaptació de la serotonina, fins ara ningú mai havia investigat l’efecte
d’aquests fàrmacs sobre la precisió de la PDSOFi.
Alguns estudis mostren una manca d'associació entre els resultats de la
PDSOFi i la presència d'hemorroides.86-88 De fet, van Turehout et al.87 descriu
que la probabilitat que es detecti sang a la PDSOFi provinent d’hemorroides
hauria de ser limitada donada la localització i la necessitat de que la globina
s’hemolitzi abans la PDSOFi pugui detectar-la. En canvi, seguint la línia dels
nostres resultats, Garcia et al.91 i Kim et al.130 mostren una clara relació amb la
patologia anal i la probabilitat d’obtenir un fals positiu.
El resultat més important a destacar d’aquest estudi és l’associació dels IBP
amb un resultat fals positiu en la PDSOFi. Aquest resultat no explica la major
freqüència de falsos positius a les dones, perquè l’efecte era molt més clar
entre els homes. Fins ara no coneixem cap estudi publicat que hagi analitzat
l’associació entre l’ús d’IBP i obtenir un resultat fals positiu a la PDSOFi.
Recentment, s'ha descrit que els IBP poden provocat efectes diversos a
l'intestí. S'ha trobat que predisposen a la lesió de l'intestí prim induïda per
AINEs, promouen canvis en el microbioma intestinal i inhibeixen la secreció
pancreàtica.131-135 A més, també està descrit que aquest grup de fàrmacs pot
augmentar el risc d’hemorràgia digestiva baixa.136, 137 Nosaltres no vam trobar
diferències entre la mitjana de concentració d’hemoglobina fecal entre individus

105
que prenien IBP respecte els que no en prenien. Això, suggereix que l’augment
de falsos positius pot no relacionar-se amb la probabilitat de sagnat. Pensem
que l’explicació més plausible és que els IBP retarden la degradació de la
globina que prové del tracte gastrointestinal alt i això faria que la PDSOFi
perdés la seva organoespecificitat88, 93 en detectar globina no degradada
provinent del tracte alt. Dit d’una altra manera, els IBP “permetrien” el
diagnòstic de lesions del tracte alt perquè l’augment del pH gàstric podria evitar
que el pepsinogen i el tripsinogen, enzims necessaris per a la degradació de
proteïnes (com la globina), s’activessin.133 D’acord amb aquesta hipòtesi, una
investigació del nostre grup pendent de ser publicada138 ha analitzat la precisió
de la PDSOFi en 1.003 pacients simptomàtics i han trobat que l’únic factor de
risc d’obtenir un resultat fals positiu en la PDSOFi era l’ús d’IBP.
La primera implicació que s’obté del primer estudi és que el factor de risc més
important per obtenir falsos positius és tenir patologia hemorroïdal o fissura
anal. Tenint en compte que un fals positiu implica realitzar una colonoscòpia,
procediment amb cost sanitari elevat i que pot comportar efectes adversos en
el pacient, seria necessari buscar una estratègia que disminuís el nombre de
falsos positius per la presència d’hemorroides i/o fissura anal. Per exemple, el
farmacèutic que recull la PDSOFi del cribratge poblacional podria preguntar a
l’usuari si en aquell moment té molèsties anals o si pateix habitualment
d’hemorroides. Si fos així i la PDSOFi tingués un resultat positiu, es podria
recomanar l’aplicació de tractament tòpic durant 2-3 setmanes i un cop hagués
finalitzat el tractament repetir de nou la PDSOFi. Per validar aquesta
recomanació caldria fer un estudi prospectiu i un protocol abans de la seva
instauració.

106
La pregunta clau que genera l’article és “Hauríem d’interrompre el tractament
amb IBP abans de la PDSOFi?”. Per això, caldria valorar el balanç de riscos i
beneficis que impliquen la discontinuació dels IBPs previs a la PDSOFi. Ja hem
comentat què implica obtenir un resultat positiu, però retirar un IBP també
podria estar associat a efectes adversos especialment si la indicació era la
protecció de fàrmacs gastrolesius, doncs en aquest cas la retirada de l’IBP
podria provocar una hemorràgia digestiva alta. Si en canvi, la indicació fos la
dispèpsia funcional o la malaltia per reflux gastroesofàgic podria provocar un
empitjorament clínic del pacient temporalment. Si al final es cregués convenient
plantejar la retirada temporal de l’IBP en alguns individus, la següent pregunta
que ens hauríem de fer és: “Durant quan de temps cal retirar l’ús d’IBP prèvia a
la realització de la PDSOFi?”. Tot i que la vida plasmàtica d’aquests fàrmacs és
de 30 a 120 minuts i la inhibició irreversible de la bomba de protons de la
cèl·lula parietal pot persistir durant 48-72h, en veritat no sabem quan duren els
canvis produïts en la secreció pancreàtica o la microbiota intestinal. Tampoc
sabem si per produir l’efecte cal que l’ús sigui continuat ni tampoc sabem quina
dosis o freqüència és necessària. A més, també caldrà descobrir quin és el
mecanisme pel qual es produeix aquest efecte. Si fos per un canvi en la
microbiota, caldria també fer estudis amb altres tractaments que modifiquen la
microbiota intestinal com els antibiòtics. Si fos per descens del pH gàstric i, la
conseqüent no activació de les proteases pancreàtiques, caldria veure també si
els inhibidors del receptor H2 (ranitidina i similars) o bé altres tractaments
utilitzats pel reflux gastroesofàgic (almagat, bicarbonat, magnesi, etc.)
produeixen aquest efecte. Per tal de respondre totes aquestes qüestions,
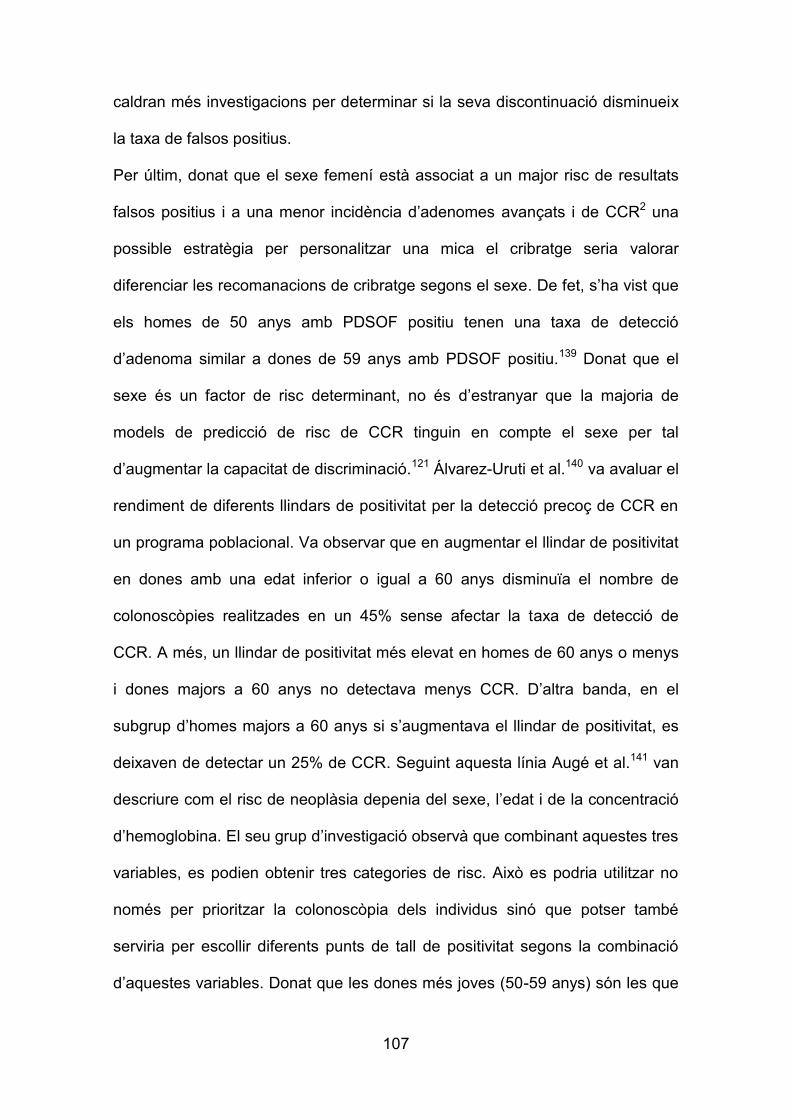
107
caldran més investigacions per determinar si la seva discontinuació disminueix
la taxa de falsos positius.
Per últim, donat que el sexe femení està associat a un major risc de resultats
falsos positius i a una menor incidència d’adenomes avançats i de CCR2 una
possible estratègia per personalitzar una mica el cribratge seria valorar
diferenciar les recomanacions de cribratge segons el sexe. De fet, s’ha vist que
els homes de 50 anys amb PDSOF positiu tenen una taxa de detecció
d’adenoma similar a dones de 59 anys amb PDSOF positiu.139 Donat que el
sexe és un factor de risc determinant, no és d’estranyar que la majoria de
models de predicció de risc de CCR tinguin en compte el sexe per tal
d’augmentar la capacitat de discriminació.121 Álvarez-Uruti et al.140 va avaluar el
rendiment de diferents llindars de positivitat per la detecció precoç de CCR en
un programa poblacional. Va observar que en augmentar el llindar de positivitat
en dones amb una edat inferior o igual a 60 anys disminuïa el nombre de
colonoscòpies realitzades en un 45% sense afectar la taxa de detecció de
CCR. A més, un llindar de positivitat més elevat en homes de 60 anys o menys
i dones majors a 60 anys no detectava menys CCR. D’altra banda, en el
subgrup d’homes majors a 60 anys si s’augmentava el llindar de positivitat, es
deixaven de detectar un 25% de CCR. Seguint aquesta línia Augé et al.141 van
descriure com el risc de neoplàsia depenia del sexe, l’edat i de la concentració
d’hemoglobina. El seu grup d’investigació observà que combinant aquestes tres
variables, es podien obtenir tres categories de risc. Això es podria utilitzar no
només per prioritzar la colonoscòpia dels individus sinó que potser també
serviria per escollir diferents punts de tall de positivitat segons la combinació
d’aquestes variables. Donat que les dones més joves (50-59 anys) són les que

108
tenen més risc de neoplàsia i més risc de falsos positius, podria valorar-se si la
concentració d’hemoglobina a partir de la qual es recomana colonoscòpia
hauria de ser superior als 20g Hb/g establerts actualment en algun subgrup de
pacients. De fet, la United States Multi-Society Task Force ja esmenta la
possibilitat de fer una estratègia ajustada al risc de CCR. Suggereix valorar
utilitzar la colonoscòpia com a tècnica de cribratge inicial en homes majors de
60 anys i dones majors a 65 anys sense cribratge previ i, en canvi, fer PDSOFi
a pacients amb menor edat o colonoscòpia prèvia normal.120 Així, caldria
valorar de forma prospectiva la millor manera d’individualitzar el cribratge de
manera senzilla i eficient tenint compte dades ja disponibles com edat, edat,
sexe i concentració d’hemoglobina per personalitzar l’edat d’inici de cribratge i
la periodicitat del cribratge.
La limitació més important és derivava del disseny retrospectiu de l’estudi. El
biaix de memòria inherent en aquest tipus d’estudis va fer que possiblement
alguns fàrmacs com els AINEs estiguessin reportats a la baixa, sobretot en el
cas d’ús esporàdic. A més, aquest mateix biaix va fer que no poguéssim
disposar de la dosi i posologia dels IBP per avaluar millor l’ús d’aquests
fàrmacs en relació a la proporció de falsos positius. D’altra banda, cal destacar
que aquest és el primer estudi que ha avaluat la relació entre IBP i inhibidors de
la recaptació de la serotonina i un resultat fals positiu en la PDSOFi.
El segon estudi d’aquesta Tesi Doctoral va avaluar el risc de resultats falsos
negatius en la PDSOFi. La proporció de falsos negatius observada va ser del
15,6% (n=33). D’aquests, un 14,7% d’individus tenien una colonoscòpia amb
lesions de risc intermedi, només un 1% de participants tenien lesions d’alt risc i

109
no es va trobar cap pacient amb CCR. El sexe femení i la localització proximal
s’associà a un major percentatge de falsos negatius. Això, podria estar
relacionat amb el fet que el trànsit de còlon fos més prolongat en el sexe
femení i en les lesions proximals, permetent la degradació de l’hemoglobina
fecal.96, 142 A més, les lesions no detectades per la PDSOFi eren de menor
mida, la qual cosa podria explicar-se perquè l’hemoglobina fecal es
correlaciona amb la mida de les lesions.97 I també es va observar que disminuir
el llindar de positivitat de la PDSOFi no detectava més neoplàsia avançada. De
fet, en un 48,5% de pacients l’hemoglobina fecal era indetectable i en el 94%
era inferior a 8g Hb/g.
Una implicació que es deriva de l’estudi és que cal tenir present que tot i que la
PDSOFi és molt útil en la pràctica diària per reduir la indicació de
colonoscòpies innecessàries, no és una prova perfecta i, per tant, en pacients
amb simptomatologia el metge ha de valorar realment si tot i una PDSOFi
negativa cal fer una colonoscòpia. A més, tenint en compte que alguns països
tenen menors recursos sanitaris i, per tant, una capacitat limitada de fer
colonoscòpies caldria comparar els resultats d’un cribratge que utilitzi un llindar
de positivitat més elevat.142
Tot i que nosaltres hem vist que si baixéssim el llindar de positivitat no
detectaríem més pacients amb lesions d’alt o intermedi risc, s’ha descrit que el
grau de positivitat es relaciona amb la severitat de les lesions i el risc de
desenvolupar CCR.143-145
Una altra implicació es deriva del fet que pacients amb resultat fals negatiu
tenien una concentració d’hemoglobina molt baixa o, fins i tot indetectable. van
der Vlugt et al.105 també va observar que un 44% de pacients amb un CCR

110
d’interval havien estat després d’obtenir una concentració d’hemoglobina
indetectable a una PDSOFi. Això vol dir que les PDSOF no poden detectar
algunes lesions perquè probablement no sagnen o ho fan de manera
intermitent. Per aquesta raó cal pensar en buscar algun nou biomarcador que
complementi o millori la sensibilitat de les PDSOF.146, 147 Així, s’està investigant
si detectar també mutacions, alteracions epigenètiques o del microbioma
podrien millorar la precisió de la PDSOFi. De fet, Baxter et al.148 ha demostrat
que es podria utilitzar la mateixa quantitat de femta que es recull per fer la
PDSOFi no només per analitzar la concentració d’hemoglobina sinó també la
microbiota. Aquesta troballa és molt important donat que permet amb l’obtenció
d’una única mostra analitzar dues estratègies per detectar CCR i adenomes
avançats. De totes maneres, calen estudis per determinar la possibilitat
d’utilitzar la microbiota pel cribratge poblacional i en aquesta línia d’investigació
està treballant el nostre grup de treball de l’ICO.
En aquest estudi la limitació més important fou que la mida de la mostra va ser
calculada per estimar la proporció de falsos negatius amb una precisió de ±4%,
i no per identificar factors determinants. Amb aquesta mida de mostra, no hi
havia prou potència per detectar diferències entre ambdós grups i no es van
poder analitzar determinants de falsos negatius que s’havien recollit com el
tabac, el restrenyiment o l’ús de fàrmacs.
Per altra banda, cal destacar que la implementació d’aquest estudi és difícil i
cara donat que és un estudi que avalua la precisió de la PDSOFi en un
programa poblacional de detecció precoç on l’estratègia de cribratge està
clarament definida. Doncs, l’estudi implica realitzar una colonoscòpia, prova
amb possibles efectes adversos, a pacients que no caldria cap estudi

111
complementari donat que han obtingut un resultat negatiu en la PDSOFi. El
reclutament a l’estudi es va fer per invitació telefònica i per carta, amb una taxa
de participació molt baixa, el que no exclou la possibilitat de que s’hagi obtingut
una població esbiaixada respecte al conjunt de persones amb resultat negatiu.
La taxa de resultats falsos negatius podria estar sobreestimada si van participar
amb major probabilitat persones amb símptomes menors que van tenir un
resultat negatiu a la PDSOFi, però van quedar intranquil·les i van veure la
possibilitat de participar a l’estudi com una opció per descartar patologia.
En el tercer estudi d’aquesta Tesi Doctoral es va avaluar la utilitat potencial
que podria tenir un model de risc de CCR que combinés factors de risc
modificables, antecedents familiars de CCR i una predisposició genètica
basada en 21 polimorfismes de nucleòtid simple. El nostre estudi confirmà
factors de risc de CCR establerts com els antecedents familiars de CCR,
l’obesitat, la manca d’activitat física, la ingesta elevada de carn vermella i la
baixa ingesta vegetals i el no consum d’antiinflamatoris no esteroïdals. Es va
observar una associació entre la puntuació (score) de risc genètic (SRG) i els
antecedents familiars, la qual cosa destaca la importància de la predisposició
genètica en el CCR, encara que també en una família podria tenir un paper
important el fet de compartir també uns estils de vida i factors ambientals
comuns. L’anàlisi també va demostrar que l’estil de vida determinava més el
risc de CCR que no pas el SRG. Cada factor ambiental augmentava el risc de
CCR un 35% de mitjana, mentre que cada al·lel augmentava el risc en un 7%.
Això implica que el fet de modificar un hàbit per aconseguir un estil de vida més
saludable aconseguia compensar l’efecte de 4 al·lels de risc. Aquest fet és

112
d’enorme transcendència, doncs els estils de vida els podem millorar i la
genètica no és modificable. Per això, creiem que és important incorporar dades
clíniques per millorar el cribratge i animar als pacients a aconseguir uns hàbits
saludables. De fet, tot i que cada al·lel determina només un 7%, vam observar
que els individus del cinquè quintil (>25 al·lels de risc) tenien un 82% més de
risc que els individus del primer quintil (<19 al·lels de risc, sobre un màxim de
42).
Fins ara ja s’han publicat diversos models de predicció de risc de neoplàsia
avançada o CCR amb una àrea sota la corba ROC d’entre 0,65 i 0,76.121 La
nostra estimació de la precisió predictiva és lleugerament inferior (corba ROC:
0,63, IC del 95%: 0,60-0,66), probablement perquè el nostre model no va
incloure l'edat i el sexe perquè aquests factors s'utilitzaren per emparellar amb
els controls. El risc estimat per al·lel (OR de 1,07, IC del 95%: 1,04-1,10) va ser
similar al reportat per estudis previs.125-127, 149 Dunlop et al.125 utilitzà l'efecte
combinat amb edat, sexe, antecedents familiars i 10 SNPs per avaluar el risc
de CCR i va obtenir una àrea sota la corba ROC de 0,59 i un increment mitjà
per al·lel de risc del 9%. Hsu et al.126 va desenvolupar un model de
determinació del risc basat en els antecedents familiars i 27 SNPs amb una
àrea sota la corba ROC de 0,56 i un risc per al·lel de 1,02-1,12. Finalment,
Jung et al.127 reportà una àrea sota la corba ROC de 0,74 amb un model que va
incloure l'edat, el sexe, el tabac, la glucosa, antecedents familiars de CCR, i 23
SNP.
El nostre estudi, que utilitzà no només 21 SNP sinó, a més, un qüestionari amb
dades clíniques i de dieta, també tenia l’objectiu de crear un model de risc útil
per personalitzar el programa de cribratge de CCR i calcular l’impacte potencial

113
de determinar el risc d’un individu que participi al cribratge. El model de risc
(tenint en compte el risc de CCR acumulat segon els registres de càncer
d’Espanya),2 mostrà que tenir 3 factors ambientals modificables o 10 al·lels de
risc feia que la incidència de càncer s’avancés 5 anys en homes de 50 anys
d’edat (2,5 anys a dones). L’efecte absolut sobre la incidència encara era major
en edat més avançada, doncs l’efecte és multiplicatiu. Això implica que en
pacients amb risc de CCR de risc mig probablement caldria valorar d’edat
d’inici de cribratge, començant als 45 anys en pacients amb més factors de risc
i als 55 (o 60) anys en pacients amb menys factors de risc. A més, segons els
nostres càlculs vam veure que també seria útil ampliar l’edat del cribratge de
CCR més enllà dels 69 anys en població d’alt risc. El valor predictiu del model
augmentava significativament amb l’edat, donada la major probabilitat de CCR.
Donat que l’esperança de vida d’un pacient de 70 anys encara és llarga,
ampliar el cribratge fins als 79 anys en pacients d’alt risc podria tenir un gran
impacte en la reducció del nombre de càncers.
A més, es podria utilitzar el model de risc per seleccionar pacients d’alt risc en
els quals la colonoscòpia podria ser la millor tècnica de cribratge inicial enlloc
d’indicar una PDSOF. Un altre punt important a ressaltar és que l’ús de models
de predicció, acompanyats d’una informació adequada, podria augmentar el
risc percebut, i conseqüentment la participació i adherència al cribratge en
pacients d’alt risc. Aquesta percepció de risc probablement també contribuiria a
millorar l’estil de vida dels individus i, amb això, reduir-se el nombre de casos
incidents de CCR.
Calen més estudis per determinar la possibilitat de generalitzar, veure la utilitat
de la informació i la cost-efectivitat de l'aplicació de la realització d’un genotipat

114
en un programa de cribratge de CCR. No obstant això, cal tenir en compte que
el cost de realitzar un estudi de tot el genoma està disminuint i la seva
determinació només necessita ser realitzat una vegada en la vida. A més, el fet
de fer un genotipat implicaria conèixer no només la susceptibilitat genètica al
CCR sinó que les dades obtingudes probablement serien útils per predir el risc
d'altres malalties a part del càncer.
El model de risc obtingut per predir CCR es va basar en informació obtinguda
de casos i controls retrospectiu i, per això, en aquest cas cal destacar les
limitacions inherents a un estudi de casos i controls retrospectiu basat en dades
autoreportades. Així, l’error de mesura i el biaix de record pot haver donat lloc a
una subestimació de l’exactitud de predicció. A més, en l’anàlisi es va observar
que els casos i controls no eren comparables pel que fa a edat, sexe i
educació. Per reduir la limitació que això comportava, vam realitzar totes les
anàlisis ajustades per una puntuació (propensity score) que incloïa edat, sexe,
nivell educatiu, comunitat autònoma i polimorfismes genètics associats a ètnia.
Una altre punt a destacar, més que no pas una limitació, és que el model creat
només és aplicable a individus asimptomàtics de la població general (risc
poblacional). D’aquesta manera, individus amb símptomes o diversos familiars
afectats se’ls ha d’indicar la realització d’una colonoscòpia independentment de
la puntuació de risc.
D’altra banda, cal destacar que aquest és el primer estudi realitzat en el nostre
país que ha avaluat un model de predicció de risc de CCR basat en estils de
vida, antecedents familiars i predisposició genètica. A més, per estimar el
potencial impacte en la salut pública de la puntuació de les variables
ambientals i genètiques, es va utilitzar la incidència de càncer segons els
115
registres de càncer espanyols publicades a l'Agència Internacional per a la
Investigació sobre el Càncer (IARC).2 D’aquesta manera, vam estimar el
nombre d’individus que podrien ser inclosos dins la categoria d’alt risc i que
potser mereixerien una estratègia de cribratge més individualitzat.
En conclusió, tot i que la PDSOF ha demostrat ser una estratègia de cribratge
que disminueix la mortalitat per CCR i, que per aquesta raó s’ha implementat
arreu del món, encara dista de ser una prova de detecció precoç perfecte.
Creiem que cal millorar aquesta prova de detecció precoç o trobar-ne una millor
per aconseguir centrar l’esforç en pacients amb major risc de CCR, evitar el
sobretractament de pacients sans, disminuir els efectes adversos del cribratge i
optimitzar els recursos de la sanitat pública.


7. CONCLUSIONS


119
Els resultats obtinguts en els estudis que componen aquesta Tesi Doctoral
permeten extreure les següents conclusions:
1. La proporció de falsos positius en la PDSOFi observada va ser del
53,8%.
2. El sexe femení, el cribratge successiu, tenir hemorroides o fissura anal i
l’ús d’inhibidors de la bomba de protons incrementen la probabilitat d’un
resultat fals positiu en la PDSOFi.
3. La proporció de falsos negatius en la PDSOFi observada va ser del
15,6%.
4. Disminuir el llindar de positivitat de la PDSOFi no detectaria més
neoplàsia avançada i augmentaria els costos i els riscos innecessaris
pels pacients.
5. Les lesions localitzades al còlon proximal augmenten la probabilitat d’un
resultat fals negatiu a la PDSOFi.
6. Les variables que es van associar de forma independent a un augment
de risc de CCR van ser el nombre d'al·lels de risc, antecedents familiars
de CCR, l’obesitat, no realitzar activitat física, menjar molta carn
vermella, menjar pocs vegetals, i el no consum d’antiinflamatoris no
esteroïdals.
7. Els individus del cinquè quintil (>25 al·lels de risc) tenien un 82% més de
risc que els individus del primer quintil (<19 al·lels de risc, sobre un
màxim de 42 al·lels).

120
8. L’estil de vida determina més el risc de CCR que no pas la genètica, per
la qual cosa s’ha d’animar els pacients a aconseguir uns hàbits
saludables.
9. El model de risc podria permetre estratificar la població en grups de risc
de CCR i així ajustar la periodicitat del cribratge o edat final de cribratge
segons el risc individual.

8. REFERÈNCIES BIBLIOGRÀFIQUES


123
1. Galceran J, Ameijide A, Carulla M, et al. Cancer incidence in Spain, 2015. Clin Transl Oncol 2017;19:799-825.
2. Ferlay J SI, Ervik M, Dikshit R, Eser S, Mathers C, Rebelo M, Parkin DM, Forman D, Bray, F. GLOBOCAN 2012 v1.0, Cancer Incidence and Mortality Worldwide: IARC CancerBase No. 11 [Internet]. Lyon, France: International Agency for Research on Cancer, 2013.
3. Arnold M, Sierra MS, Laversanne M, et al. Global patterns and trends in colorectal cancer incidence and mortality. Gut 2016;66:683-691.
4. Taylor DP, Burt RW, Williams MS, et al. Population-based family history-specific risks for colorectal cancer: a constellation approach. Gastroenterology 2010;138:877-85.
5. Vogelstein B, Fearon ER, Hamilton SR, et al. Genetic alterations during colorectal-tumor development. N Engl J Med 1988;319:525-32.
6. Leggett B, Whitehall V. Role of the serrated pathway in colorectal cancer pathogenesis. Gastroenterology 2010;138:2088-100.
7. Risio M. The natural history of adenomas. Best Pract Res Clin Gastroenterol 2010;24:271-80.
8. Group ECR. Update on the paris classification of superficial neoplastic lesions in the digestive tract. Endoscopy 2005;37:570-8.
9. O'Brien MJ, Winawer SJ, Zauber AG, et al. The National Polyp Study. Patient and polyp characteristics associated with high-grade dysplasia in colorectal adenomas. Gastroenterology 1990;98:371-9.
10. Saini SD, Kim HM, Schoenfeld P. Incidence of advanced adenomas at surveillance colonoscopy in patients with a personal history of colon adenomas: a meta-analysis and systematic review. Gastrointest Endosc 2006;64:614-26.
11. Martinez ME, Baron JA, Lieberman DA, et al. A pooled analysis of advanced colorectal neoplasia diagnoses after colonoscopic polypectomy. Gastroenterology 2009;136:832-41.
12. von Karsa L, Patnick J, Segnan N, et al. European guidelines for quality assurance in colorectal cancer screening and diagnosis: overview and introduction to the full supplement publication. Endoscopy 2013;45:51-9.
13. Song M, Garrett WS, Chan AT. Nutrients, foods, and colorectal cancer prevention. Gastroenterology 2015;148:1244-60 e16.
14. Johnson CM, Wei C, Ensor JE, et al. Meta-analyses of colorectal cancer risk factors. Cancer Causes Control 2013;24:1207-22.
15. Aune D, Lau R, Chan DS, et al. Nonlinear reduction in risk for colorectal cancer by fruit and vegetable intake based on meta-analysis of prospective studies. Gastroenterology 2011;141:106-18.
16. Carr PR, Walter V, Brenner H, et al. Meat subtypes and their association with colorectal cancer: Systematic review and meta-analysis. Int J Cancer 2016;138:293-302.
17. Heine-Broring RC, Winkels RM, Renkema JM, et al. Dietary supplement use and colorectal cancer risk: a systematic review and meta-analyses of prospective cohort studies. Int J Cancer 2015;136:2388-401.
18. Feng YL, Shu L, Zheng PF, et al. Dietary patterns and colorectal cancer risk: a meta-analysis. Eur J Cancer Prev 2016;26:201-211.
19. Ma Y, Yang Y, Wang F, et al. Obesity and risk of colorectal cancer: a systematic review of prospective studies. PLoS One 2013;8:e53916.
20. Liu L, Shi Y, Li T, et al. Leisure time physical activity and cancer risk: evaluation of the WHO's recommendation based on 126 high-quality epidemiological studies. Br J Sports Med 2016;50:372-8.
21. Cheng J, Chen Y, Wang X, et al. Meta-analysis of prospective cohort studies of cigarette smoking and the incidence of colon and rectal cancers. Eur J Cancer Prev 2015;24:6-15.
22. Fedirko V, Tramacere I, Bagnardi V, et al. Alcohol drinking and colorectal cancer risk: an overall and dose-response meta-analysis of published studies. Ann Oncol 2011;22:1958-72.
23. Esposito K, Chiodini P, Capuano A, et al. Colorectal cancer association with metabolic syndrome and its components: a systematic review with meta-analysis. Endocrine 2013;44:634-47.

124
24. Hursting SD, Hursting MJ. Growth signals, inflammation, and vascular perturbations:mechanistic links between obesity, metabolic syndrome, and cancer. ArteriosclerThromb Vasc Biol 2012;32:1766-70.
25. Aleksandrova K, Pischon T, Jenab M, et al. Combined impact of healthy lifestyle factorson colorectal cancer: a large European cohort study. BMC Med 2014;12:168.
26. Schuz J, Espina C, Villain P, et al. European Code against Cancer 4th Edition: 12 waysto reduce your cancer risk. Cancer Epidemiol 2015;39 Suppl 1:S1-10.
27. Romaguera D, Gracia-Lavedan E, Molinuevo A, et al. Adherence to nutrition-basedcancer prevention guidelines and breast, prostate and colorectal cancer risk in theMCC-Spain case-control study. Int J Cancer 2017;141:83-93.
28. Gann PH, Manson JE, Glynn RJ, et al. Low-dose aspirin and incidence of colorectaltumors in a randomized trial. J Natl Cancer Inst 1993;85:1220-4.
29. Flossmann E, Rothwell PM, British Doctors Aspirin T, et al. Effect of aspirin on long-term risk of colorectal cancer: consistent evidence from randomised and observationalstudies. Lancet 2007;369:1603-13.
30. Baron JA, Cole BF, Sandler RS, et al. A randomized trial of aspirin to prevent colorectaladenomas. N Engl J Med 2003;348:891-9.
31. Sandler RS, Halabi S, Baron JA, et al. A randomized trial of aspirin to prevent colorectaladenomas in patients with previous colorectal cancer. N Engl J Med 2003;348:883-90.
32. Wang Y, Zhang FC, Wang YJ. The efficacy and safety of non-steroidal anti-inflammatory drugs in preventing the recurrence of colorectal adenoma: a meta-analysisand systematic review of randomized trials. Colorectal Dis 2015;17:188-96.
33. Bertagnolli MM, Eagle CJ, Zauber AG, et al. Celecoxib for the prevention of sporadiccolorectal adenomas. N Engl J Med 2006;355:873-84.
34. Arber N, Eagle CJ, Spicak J, et al. Celecoxib for the prevention of colorectaladenomatous polyps. N Engl J Med 2006;355:885-95.
35. Force UPST. Draft Recommendation Statement: Aspirin Use to Prevent CardiovascularDisease and Colorectal Cancer: Preventive Medication: U.S. Preventive Services TaskForce, 2015.
36. Lytras T, Nikolopoulos G, Bonovas S. Statins and the risk of colorectal cancer: anupdated systematic review and meta-analysis of 40 studies. World J Gastroenterol2014;20:1858-70.
37. Algra AM, Rothwell PM. Effects of regular aspirin on long-term cancer incidence andmetastasis: a systematic comparison of evidence from observational studies versusrandomised trials. Lancet Oncol 2012;13:518-27.
38. Alberts DS, Martinez ME, Roe DJ, et al. Lack of effect of a high-fiber cereal supplementon the recurrence of colorectal adenomas. Phoenix Colon Cancer PreventionPhysicians' Network. N Engl J Med 2000;342:1156-62.
39. Schatzkin A, Lanza E, Corle D, et al. Lack of effect of a low-fat, high-fiber diet on therecurrence of colorectal adenomas. Polyp Prevention Trial Study Group. N Engl J Med2000;342:1149-55.
40. Prentice RL, Aragaki AK, Van Horn L, et al. Low-fat dietary pattern and cardiovasculardisease: results from the Women's Health Initiative randomized controlled trial. Am JClin Nutr 2017;106:35-43.
41. Joshu CE, Parmigiani G, Colditz GA, et al. Opportunities for the primary prevention ofcolorectal cancer in the United States. Cancer Prev Res (Phila) 2012;5:138-45.
42. Winkels RM, van Lee L, Beijer S, et al. Adherence to the World Cancer ResearchFund/American Institute for Cancer Research lifestyle recommendations in colorectalcancer survivors: results of the PROFILES registry. Cancer Med 2016;5:2587-95.
43. Kirkegaard H, Johnsen NF, Christensen J, et al. Association of adherence to lifestylerecommendations and risk of colorectal cancer: a prospective Danish cohort study. BMJ2010;341:c5504.
44. Wilson JMG, Junger G. Principles and practice of screening for disease. Geneva: WorldHealth Organisation., 1968.
45. Andermann A, Blancquaert I, Beauchamp S, et al. Revisiting Wilson and Jungner in thegenomic age: a review of screening criteria over the past 40 years. Bull World HealthOrgan 2008;86:317-9.
46. López Bastida J. Análisis coste-efectividad del cribado del cáncer colorrectal en lapoblación general. Santa Cruz de Tenerife: Ministerio de Sanidad y Consumo, 2010.

125
47. Senore C, Inadomi J, Segnan N, et al. Optimising colorectal cancer screeningacceptance: a review. Gut 2015;64:1158-77.
48. Lönnberg S, Šekerija M, Malila N, et al. European Guide on Quality Improvement inComprehensive Cancer Control. Cancer screening: policy recommendations ongovernance, organization and evaluation of cancer screening. Ljubljana: NationalInstitute of Public Health, 2017.
49. Ponti A, Anttila A, Ronco G, et al. Report on the implementation of the CouncilRecommendation on cancer screening. Cancer Screening in the European Union. Lyon:International Agency for Research on Cancer, 2017.
50. Lynge E, Tornberg S, von Karsa L, et al. Determinants of successful implementation ofpopulation-based cancer screening programmes. Eur J Cancer 2012;48:743-8.
51. Lin JS, Piper MA, Perdue LA, et al. Screening for Colorectal Cancer: A SystematicReview for the U.S. Preventive Services Task Force. Rockville (MD), 2016.
52. Bibbins-Domingo K, Grossman DC, Curry SJ, et al. Screening for Colorectal Cancer:US Preventive Services Task Force Recommendation Statement. JAMA2016;315:2564-75.
53. Inadomi JM. Screening for Colorectal Neoplasia. N Engl J Med 2017;376:149-156.54. Brenner H, Stock C, Hoffmeister M. Effect of screening sigmoidoscopy and screening
colonoscopy on colorectal cancer incidence and mortality: systematic review and meta-analysis of randomised controlled trials and observational studies. BMJ2014;348:g2467.
55. Zauber AG, Winawer SJ, O'Brien MJ, et al. Colonoscopic polypectomy and long-termprevention of colorectal-cancer deaths. N Engl J Med 2012;366:687-96.
56. Hewitson P, Glasziou P, Watson E, et al. Cochrane systematic review of colorectalcancer screening using the fecal occult blood test (hemoccult): an update. Am JGastroenterol 2008;103:1541-9.
57. Zorzi M, Fedeli U, Schievano E, et al. Impact on colorectal cancer mortality of screeningprogrammes based on the faecal immunochemical test. Gut 2015;64:784-90.
58. Chiu HM, Chen SL, Yen AM, et al. Effectiveness of fecal immunochemical testing inreducing colorectal cancer mortality from the One Million Taiwanese ScreeningProgram. Cancer 2015;121:3221-9.
59. Chiang TH, Chuang SL, Chen SL, et al. Difference in performance of fecalimmunochemical tests with the same hemoglobin cutoff concentration in a nationwidecolorectal cancer screening program. Gastroenterology 2014;147:1317-26.
60. Robertson DJ, Lee JK, Boland CR, et al. Recommendations on Fecal ImmunochemicalTesting to Screen for Colorectal Neoplasia: A Consensus Statement by the US Multi-Society Task Force on Colorectal Cancer. Gastroenterology 2017;152:1217-1237 e3.
61. Lee JK, Liles EG, Bent S, et al. Accuracy of fecal immunochemical tests for colorectalcancer: systematic review and meta-analysis. Ann Intern Med 2014;160:171.
62. de Wijkerslooth TR, Stoop EM, Bossuyt PM, et al. Immunochemical fecal occult bloodtesting is equally sensitive for proximal and distal advanced neoplasia. Am JGastroenterol 2012;107:1570-8.
63. Lin JS, Piper MA, Perdue LA, et al. Screening for Colorectal Cancer: Updated EvidenceReport and Systematic Review for the US Preventive Services Task Force. JAMA2016;315:2576-94.
64. Lewis JD, Ng K, Hung KE, et al. Detection of proximal adenomatous polyps withscreening sigmoidoscopy: a systematic review and meta-analysis of screeningcolonoscopy. Arch Intern Med 2003;163:413-20.
65. Segnan N, Senore C, Andreoni B, et al. Comparing attendance and detection rate ofcolonoscopy with sigmoidoscopy and FIT for colorectal cancer screening.Gastroenterology 2007;132:2304-12.
66. Denis B, Gendre I, Sauleau EA, et al. Harms of colonoscopy in a colorectal cancerscreening programme with faecal occult blood test: a population-based cohort study.Dig Liver Dis 2013;45:474-80.
67. Knudsen AB, Zauber AG, Rutter CM, et al. Estimation of Benefits, Burden, and Harmsof Colorectal Cancer Screening Strategies: Modeling Study for the US PreventiveServices Task Force. JAMA 2016;315:2595-609.
68. Winawer SJ, Zauber AG, Ho MN, et al. Prevention of colorectal cancer by colonoscopicpolypectomy. The National Polyp Study Workgroup. N Engl J Med 1993;329:1977-81.

126
69. Singh H, Nugent Z, Demers AA, et al. The reduction in colorectal cancer mortality after colonoscopy varies by site of the cancer. Gastroenterology 2010;139:1128-37.
70. Kahi CJ, Imperiale TF, Juliar BE, et al. Effect of screening colonoscopy on colorectal cancer incidence and mortality. Clin Gastroenterol Hepatol 2009;7:770-5.
71. Quintero E, Castells A, Bujanda L, et al. Colonoscopy versus fecal immunochemical testing in colorectal-cancer screening. N Engl J Med 2012;366:697-706.
72. Dominitz JA, Robertson DJ. Colonoscopy vs Fecal Immunochemical Test in Reducing Mortality From Colorectal Cancer (CONFIRM) [NCT01239082], Accessed May 25, 2017. http://www.clinicaltrials.gov/ct2/show/NCT01239082.
73. Hultcrantz R. Colonoscopy and FIT as Colorectal Cancer Screening Test in the Average Risk Population [NCT02078804], Accessed May 25, 2017. http://www.clinicaltrials.gov/ct2/show/NCT02078804.
74. Kaminski MF, Bretthauer M, Zauber AG, et al. The NordICC Study: rationale and design of a randomized trial on colonoscopy screening for colorectal cancer. Endoscopy 2012;44:695-702.
75. Spada C, Pasha SF, Gross SA, et al. Accuracy of First- and Second-Generation Colon Capsules in Endoscopic Detection of Colorectal Polyps: A Systematic Review and Meta-analysis. Clin Gastroenterol Hepatol 2016;14:1533-1543 e8.
76. Dickinson BT, Kisiel J, Ahlquist DA, et al. Molecular markers for colorectal cancer screening. Gut 2015;64:1485-94.
77. Imperiale TF, Ransohoff DF, Itzkowitz SH, et al. Multitarget stool DNA testing for colorectal-cancer screening. N Engl J Med 2014;370:1287-97.
78. Ladabaum U, Mannalithara A. Comparative Effectiveness and Cost Effectiveness of a Multitarget Stool DNA Test to Screen for Colorectal Neoplasia. Gastroenterology 2016;151:427-439 e6.
79. Church TR, Wandell M, Lofton-Day C, et al. Prospective evaluation of methylated SEPT9 in plasma for detection of asymptomatic colorectal cancer. Gut 2014;63:317-25.
80. Gray JA, Austoker J. Quality assurance in screening programmes. Br Med Bull 1998;54:983-92.
81. Bobridge A, Bampton P, Cole S, et al. The psychological impact of participating in colorectal cancer screening by faecal immuno-chemical testing--the Australian experience. Br J Cancer 2014;111:970-5.
82. Parker MA, Robinson MH, Scholefield JH, et al. Psychiatric morbidity and screening for colorectal cancer. J Med Screen 2002;9:7-10.
83. Kapidzic A, Korfage IJ, van Dam L, et al. Quality of life in participants of a CRC screening program. Br J Cancer 2012;107:1295-301.
84. Lafata JE, Simpkins J, Lamerato L, et al. The economic impact of false-positive cancer screens. Cancer Epidemiol Biomarkers Prev 2004;13:2126-32.
85. Wong MC, Ching JY, Chan VC, et al. Factors associated with false-positive and false-negative fecal immunochemical test results for colorectal cancer screening. Gastrointest Endosc 2015;81:596-607.
86. Stegeman I, de Wijkerslooth TR, Stoop EM, et al. Risk factors for false positive and for false negative test results in screening with fecal occult blood testing. Int J Cancer 2013;133:2408-14.
87. van Turenhout ST, Oort FA, Terhaar sive Droste JS, et al. Hemorrhoids detected at colonoscopy: an infrequent cause of false-positive fecal immunochemical test results. Gastrointest Endosc 2012;76:136-43.
88. Chiang TH, Lee YC, Tu CH, et al. Performance of the immunochemical fecal occult blood test in predicting lesions in the lower gastrointestinal tract. CMAJ 2011;183:1474-81.
89. Kim NH, Park JH, Park DI, et al. Risk Factors for False Fecal Immunochemical Test Results in Colorectal Cancer Screening. J Clin Gastroenterol 2017;51:151-159.
90. Gandhi S, Narula N, Gandhi S, et al. Does acetylsalicylic acid or warfarin affect the accuracy of fecal occult blood tests? J Gastroenterol Hepatol 2013;28:931-6.
91. Garcia M, Mila N, Binefa G, et al. False-positive results from colorectal cancer screening in Catalonia (Spain), 2000-2010. J Med Screen 2012;19:77-82.
92. AEG-SEED. Guía de práctica clínica de calidad de la colonoscopia de cribado del cáncer colorectal: EDIMSA, 2011.

127
93. Levi Z, Vilkin A, Niv Y. Esophago-gastro-duodenoscopy is not indicated in patients with positive immunochemical test and nonexplanatory colonoscopy. Eur J Gastroenterol Hepatol 2010;22:1431-4.
94. Sanduleanu S, le Clercq CM, Dekker E, et al. Definition and taxonomy of interval colorectal cancers: a proposal for standardising nomenclature. Gut 2015;64:1257-67.
95. Brenner H, Tao S. Superior diagnostic performance of faecal immunochemical tests for haemoglobin in a head-to-head comparison with guaiac based faecal occult blood test among 2235 participants of screening colonoscopy. Eur J Cancer 2013;49:3049-54.
96. Haug U, Knudsen AB, Brenner H, et al. Is fecal occult blood testing more sensitive for left- versus right-sided colorectal neoplasia? A systematic literature review. Expert Rev Mol Diagn 2011;11:605-16.
97. Digby J, Fraser CG, Carey FA, et al. Faecal haemoglobin concentration is related to severity of colorectal neoplasia. J Clin Pathol 2013;66:415-9.
98. Chiu HM, Lee YC, Tu CH, et al. Association between early stage colon neoplasms and false-negative results from the fecal immunochemical test. Clin Gastroenterol Hepatol 2013;11:832-8 e1-2.
99. Brown LF, Fraser CG. Effect of delay in sampling on haemoglobin determined by faecal immunochemical tests. Ann Clin Biochem 2008;45:604-5.
100. Grazzini G, Ventura L, Zappa M, et al. Influence of seasonal variations in ambient temperatures on performance of immunochemical faecal occult blood test for colorectal cancer screening: observational study from the Florence district. Gut 2010;59:1511-5.
101. Steele RJ, McClements P, Watling C, et al. Interval cancers in a FOBT-based colorectal cancer population screening programme: implications for stage, gender and tumour site. Gut 2012;61:576-81.
102. Denters MJ, Deutekom M, Bossuyt PM, et al. Lower risk of advanced neoplasia among patients with a previous negative result from a fecal test for colorectal cancer. Gastroenterology 2012;142:497-504.
103. van Roon AH, Goede SL, van Ballegooijen M, et al. Random comparison of repeated faecal immunochemical testing at different intervals for population-based colorectal cancer screening. Gut 2013;62:409-15.
104. Gill MD, Bramble MG, Rees CJ, et al. Comparison of screen-detected and interval colorectal cancers in the Bowel Cancer Screening Programme. Br J Cancer 2012;107:417-21.
105. van der Vlugt M, Grobbee EJ, Bossuyt PMM, et al. Interval Colorectal Cancer Incidence Among Subjects Undergoing Multiple Rounds of Fecal Immunochemical Testing. Gastroenterology 2017;153:439-447 e2.
106. Nishida H, Urano S. Effectiveness of repeated screening using the fecal occult blood test and its impact on reducing false-negative cancer cases. Eur J Cancer Prev 2011;20:184-9.
107. Croswell JM, Ransohoff DF, Kramer BS. Principles of cancer screening: lessons from history and study design issues. Semin Oncol 2010;37:202-15.
108. Luo D, Cambon AC, Wu D. Evaluating the long-term effect of FOBT in colorectal cancer screening. Cancer Epidemiol 2012;36:e54-60.
109. Brenner H, Altenhofen L, Stock C, et al. Prevention, early detection, and overdiagnosis of colorectal cancer within 10 years of screening colonoscopy in Germany. Clin Gastroenterol Hepatol 2015;13:717-23.
110. Cottet V, Jooste V, Fournel I, et al. Long-term risk of colorectal cancer after adenoma removal: a population-based cohort study. Gut 2012;61:1180-6.
111. Zorzi M, Senore C, Turrin A, et al. Appropriateness of endoscopic surveillance recommendations in organised colorectal cancer screening programmes based on the faecal immunochemical test. Gut 2015;65:1822-1828.
112. Arguello L, Pertejo V, Ponce M, et al. The appropriateness of colonoscopies at a teaching hospital: magnitude, associated factors, and comparison of EPAGE and EPAGE-II criteria. Gastrointest Endosc 2012;75:138-45.
113. Schoen RE, Pinsky PF, Weissfeld JL, et al. Utilization of surveillance colonoscopy in community practice. Gastroenterology 2010;138:73-81.
114. Murphy CC, Sandler RS, Grubber JM, et al. Underuse and Overuse of Colonoscopy for Repeat Screening and Surveillance in the Veterans Health Administration. Clin Gastroenterol Hepatol 2016;14:436-444 e1.

128
115. Laiyemo AO, Pinsky PF, Marcus PM, et al. Utilization and yield of surveillance colonoscopy in the continued follow-up study of the polyp prevention trial. Clin Gastroenterol Hepatol 2009;7:562-7.
116. Barratt A, Mannes P, Irwig L, et al. Cancer screening. J Epidemiol Community Health 2002;56:899-902.
117. Lansdorp-Vogelaar I, Gulati R, Mariotto AB, et al. Personalizing age of cancer screening cessation based on comorbid conditions: model estimates of harms and benefits. Ann Intern Med 2014;161:104-12.
118. Day LW, Walter LC, Velayos F. Colorectal cancer screening and surveillance in the elderly patient. Am J Gastroenterol 2011;106:1197-206.
119. van Hees F, Saini SD, Lansdorp-Vogelaar I, et al. Personalizing colonoscopy screening for elderly individuals based on screening history, cancer risk, and comorbidity status could increase cost effectiveness. Gastroenterology 2015;149:1425-37.
120. Rex DK, Boland CR, Dominitz JA, et al. Colorectal Cancer Screening: Recommendations for Physicians and Patients from the U.S. Multi-Society Task Force on Colorectal Cancer. Am J Gastroenterol 2017;112:1016-1030.
121. Usher-Smith JA, Walter FM, Emery JD, et al. Risk Prediction Models for Colorectal Cancer: A Systematic Review. Cancer Prev Res (Phila) 2016;9:13-26.
122. Brenner H, Kloor M, Pox CP. Colorectal cancer. Lancet 2014;383:1490-502. 123. Hindorff L, MacArthur J, Morales J, et al. A Catalog of Published Genome-Wide
Association Studies. 124. Peters U, Bien S, Zubair N. Genetic architecture of colorectal cancer. Gut
2015;64:1623-36. 125. Dunlop MG, Tenesa A, Farrington SM, et al. Cumulative impact of common genetic
variants and other risk factors on colorectal cancer risk in 42,103 individuals. Gut 2013;62:871-81.
126. Hsu L, Jeon J, Brenner H, et al. A model to determine colorectal cancer risk using common genetic susceptibility loci. Gastroenterology 2015;148:1330-9 e14.
127. Jung KJ, Won D, Jeon C, et al. A colorectal cancer prediction model using traditional and genetic risk scores in Koreans. BMC Genet 2015;16:49.
128. Frampton MJ, Law P, Litchfield K, et al. Implications of polygenic risk for personalised colorectal cancer screening. Ann Oncol 2016;27:429-34.
129. Tseng YL, Chiang ML, Lane HY, et al. Selective serotonin reuptake inhibitors reduce P2Y12 receptor-mediated amplification of platelet aggregation. Thromb Res 2013;131:325-32.
130. Kim NH, Park JH, Park DI, et al. Are Hemorrhoids Associated with False-Positive Fecal Immunochemical Test Results? Yonsei Med J 2017;58:150-157.
131. Freedberg DE, Lebwohl B, Abrams JA. The impact of proton pump inhibitors on the human gastrointestinal microbiome. Clin Lab Med 2014;34:771-85.
132. Washio E, Esaki M, Maehata Y, et al. Proton Pump Inhibitors Increase Incidence of Nonsteroidal Anti-Inflammatory Drug-Induced Small Bowel Injury: A Randomized, Placebo-Controlled Trial. Clin Gastroenterol Hepatol 2016;14:809-815 e1.
133. Wang J, Barbuskaite D, Tozzi M, et al. Proton Pump Inhibitors Inhibit Pancreatic Secretion: Role of Gastric and Non-Gastric H+/K+-ATPases. PLoS One 2015;10:e0126432.
134. Foltz E, Azad S, Everett ML, et al. An assessment of human gastric fluid composition as a function of PPI usage. Physiol Rep 2015;3.
135. Wallace JL, Syer S, Denou E, et al. Proton pump inhibitors exacerbate NSAID-induced small intestinal injury by inducing dysbiosis. Gastroenterology 2011;141:1314-22, 1322 e1-5.
136. Lanas A, Carrera-Lasfuentes P, Arguedas Y, et al. Risk of upper and lower gastrointestinal bleeding in patients taking nonsteroidal anti-inflammatory drugs, antiplatelet agents, or anticoagulants. Clin Gastroenterol Hepatol 2015;13:906-12 e2.
137. Miyake K, Akimoto T, Hanada Y, et al. Proton pump inhibitors are associated with lower gastrointestinal tract bleeding in low-dose aspirin users with ischaemic heart disease. Dig Liver Dis 2015;47:757-62.
138. Rodriguez Alonso L, Rodríguez Moranta F, Martín Cardona A, et al. Los inhibidores de la bomba de protones reducen la precisión del test de sangre oculta en heces inmunológico. XIX Reunión Anual de la Asociación Española de Gastroenterología. Volume 39. Madrid: Gastroenterología y Hepatología, 2016:75.
129
139. Ferlitsch M, Heinze G, Salzl P, et al. Sex is a stronger predictor of colorectal adenoma and advanced adenoma than fecal occult blood test. Med Oncol 2014;31:151.
140. Alvarez-Urturi C, Andreu M, Hernandez C, et al. Impact of age- and gender-specific cut-off values for the fecal immunochemical test for hemoglobin in colorectal cancer screening. Dig Liver Dis 2016;48:542-51.
141. Auge JM, Pellise M, Escudero JM, et al. Risk stratification for advanced colorectal neoplasia according to fecal hemoglobin concentration in a colorectal cancer screening program. Gastroenterology 2014;147:628-636 e1.
142. Digby J, Fraser CG, Carey FA, et al. Interval cancers using a quantitative faecal immunochemical test (FIT) for haemoglobin when colonoscopy capacity is limited. J Med Screen 2016;23:130-4.
143. Garcia M, Mila N, Binefa G, et al. Fecal hemoglobin concentration as a measure of risk to tailor colorectal cancer screening: are we there yet? Eur J Cancer Prev 2015;24:321-7.
144. Yen AM, Chen SL, Chiu SY, et al. A new insight into fecal hemoglobin concentration-dependent predictor for colorectal neoplasia. Int J Cancer 2014;135:1203-12.
145. Lee YC, Li-Sheng Chen S, Ming-Fang Yen A, et al. Association Between Colorectal Cancer Mortality and Gradient Fecal Hemoglobin Concentration in Colonoscopy Noncompliers. J Natl Cancer Inst 2017;109.
146. Baxter NT, Ruffin MTt, Rogers MA, et al. Microbiota-based model improves the sensitivity of fecal immunochemical test for detecting colonic lesions. Genome Med 2016;8:37.
147. Toth K, Bartak BK, Tulassay Z, et al. Circulating cell-free nucleic acids as biomarkers in colorectal cancer screening and diagnosis. Expert Rev Mol Diagn 2016;16:239-52.
148. Baxter NT, Koumpouras CC, Rogers MA, et al. DNA from fecal immunochemical test can replace stool for detection of colonic lesions using a microbiota-based model. Microbiome 2016;4:59.
149. Jo J, Nam CM, Sull JW, et al. Prediction of Colorectal Cancer Risk Using a Genetic Risk Score: The Korean Cancer Prevention Study-II (KCPS-II). Genomics Inform 2012;10:175-83.


9. ANNEXOS


ANNEX 1: Material suplementari article 1
Prescription drugs associated with false-positive results when using faecal
immunochemical tests for colorectal cancer screening


135
Supplementary Table 1. Distribution of false positive FIT result in men according to subjects’
characteristics
n
False positive Crude OR 95% CI
No % Yes % Age 50-59 years 155 86 56.9 69 55.2 1 60-69 years 121 65 43.1 56 44.8 1.1 0.7-0.8 Screening
Initial 117 74 49.0 43 34.4 1 Successive 159 77 51.0 82 65.6 1.8 1.1-3.0 Anaemiaa
No 24 15 12.6 9 10.6 1 Yes 180 104 87.4 76 89.4 1.2 0.5-2.9 Anal disorders
No 141 94 62.3 47 37.6 1 Haemorrhoids 107 46 30.5 61 48.8 2.7 1.6-4.5 Anal fissure 28 11 7.2 17 13.6 3.1 1.3-7.1 Proton pump inhibitors
No 211 126 83.4 85 68.0 1 Yes 65 25 16.6 40 32.0 2.4 1.3-4.2 NSAIDs
No 259 145 96.1 114 91.2 1 Yes 17 6 3.9 11 8.8 2.3 0.8-6.5 Antiplatelet agent
No 237 129 85.4 108 86.4 1 Yes 39 22 14.6 17 13.6 0.9 0.5-1.8 Oral anticoagulant
No 268 146 96.7 122 97.6 1 Yes 8 5 3.3 3 2.4 0.7 0.8-3.1 SSRIs
No 259 143 94.7 116 92.8 1 Yes 17 8 5.3 9 7.2 1.4 0.5-3.7 Medication
Nonusers 186 109 72.2 77 61.6 1 Usersb 90 42 27.8 48 38.4 1.6 1.0-2.7 aVariables with missing data. bUsers: Proton pump inhibitors and/or NSAIDs and/or antiplatelet agent and/or oral anticoagulants. NSAIDs: non-steroidal anti-inflammatory drugs; SSRIs: selective serotonin reuptake inhibitors.

136
Supplementary Table 2. Distribution of false positive FIT result in women according to
subjects’ characteristics
n
False positive Crude OR 95% CI
No % Yes % Age 50-59 years 90 34 50.8 56 43.4 1 60-69 years 106 33 49.2 73 56.6 1.3 0.7-2.4 Screening
Initial 67 23 34.3 44 34.1 1 Successive 129 44 65.7 85 65.9 1.0 0.5-1.9 Anaemiaa
No 14 4 7.4 10 12.3 1 Yes 121 50 92.6 71 87.7 0.6 0.2-1.9 Anal disorders
No 90 44 65.7 46 35.7 1 Haemorrhoids 89 21 31.3 68 52.7 3.1 1.6-5.9 Anal fissure 17 2 3.0 15 11.6 7.2 1.6-33.2 Proton pump inhibitors
No 145 51 76.1 94 72.9 1 Yes 51 16 23.9 35 27.1 1.2 0.6-2.4 NSAIDs
No 178 60 89.6 118 91.5 1 Yes 18 7 10.4 11 8.5 0.8 0.3-2.2 Antiplatelet agent
No 175 62 92.5 113 87.6 1 Yes 21 5 7.5 16 12.4 1.8 0.6-5.0 Oral anticoagulant
No 192 66 98.5 126 97.7 1 Yes 4 1 1.5 3 2.3 1.6 0.2-15.4 SSRIs
No 166 53 79.1 113 87.6 1 Yes 30 14 20.9 16 12.4 0.5 0.4-1.2 Medication
Nonusers 138 50 74.6 88 68.2 1 Usersb 58 17 25.4 41 31.8 1.4 0.7-2.7 aVariables with missing data. bUsers: Proton pump inhibitors and/or NSAIDs and/or antiplatelet agent and/or oral anticoagulants. NSAIDs: non-steroidal anti-inflammatory drugs; SSRIs: selective serotonin reuptake inhibitors.
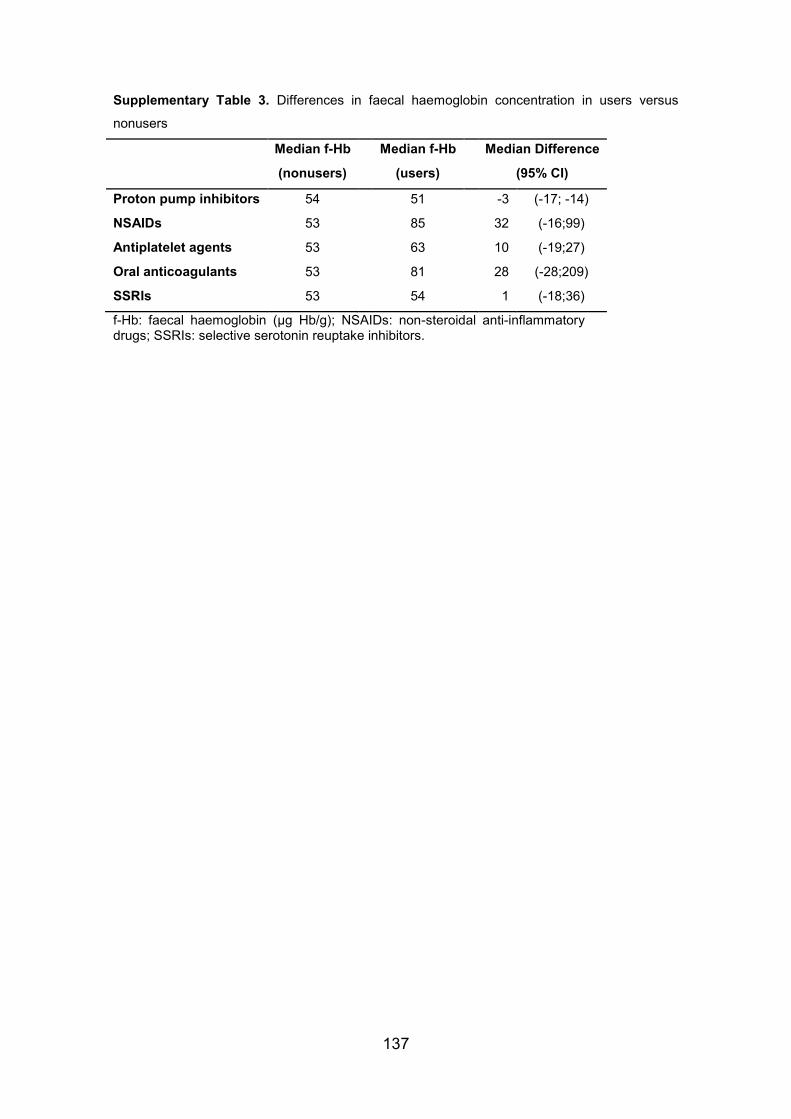
137
Supplementary Table 3. Differences in faecal haemoglobin concentration in users versus
nonusers
Median f-Hb
(nonusers)
Median f-Hb
(users)
Median Difference
(95% CI)
Proton pump inhibitors 54 51 -3 (-17; -14)
NSAIDs 53 85 32 (-16;99)
Antiplatelet agents 53 63 10 (-19;27)
Oral anticoagulants 53 81 28 (-28;209)
SSRIs 53 54 1 (-18;36)
f-Hb: faecal haemoglobin (µg Hb/g); NSAIDs: non-steroidal anti-inflammatory drugs; SSRIs: selective serotonin reuptake inhibitors.


ANNEX 2: Material suplementari article 3
Risk model for colorectal cancer in Spanish population using environmental and
genetic factors: results from the MCC-Spain study


141
Supplementary Table 1. Analyses of predictive factors associated with the risk of colon cancer
and rectal cancer
Risk of Colon Cancer Risk of Rectal Cancer Rectal vs Colon
ORa CI 95% ORa CI 95% ORa CI 95%
Genetic Risk Score 1.06 1.03-1.09 1.10 1.06-1.15 1.04 1.00-1.08
Family History of CRC 2.27 1.85-2.80 2.23 1.68-2.95 1.01 0.76-1.35
Smoking 1.00 0.85-1.18 1.23 0.97-1.56 1.28 1.00-1.65
Alcohol 1.30 1.06-1.59 1.38 1.05-1.81 1.01 0.76-1.36
BMI ≥30kg/m2 1.28 0.97-1.69 1.28 0.88-1.85 1.02 0.70-1.49
No Physical Activity 1.34 1.14-1.57 1.38 1.11-1.73 1.01 0.79-1.28
Vegetables ≤200g/day 1.29 1.09-1.52 1.63 1.28-2.08 1.29 1.00-1.67
Red Meat >65g/day 1.14 0.96-1.36 1.61 1.28-2.02 1.46 1.14-1.87
No NSAID/ASA Regular Use 1.59 1.31-1.92 1.64 1.25-2.15 1.03 0.77-1.38
Associations with p<0.05 are shown in bold. aEach variable is adjusted by the propensity score and the other variables in the table. CRC: colorectal cancer; BMI: body mass index; NSAID: nonsteroidal anti-inflammatory drugs; ASA: acetylsalicylic acid.
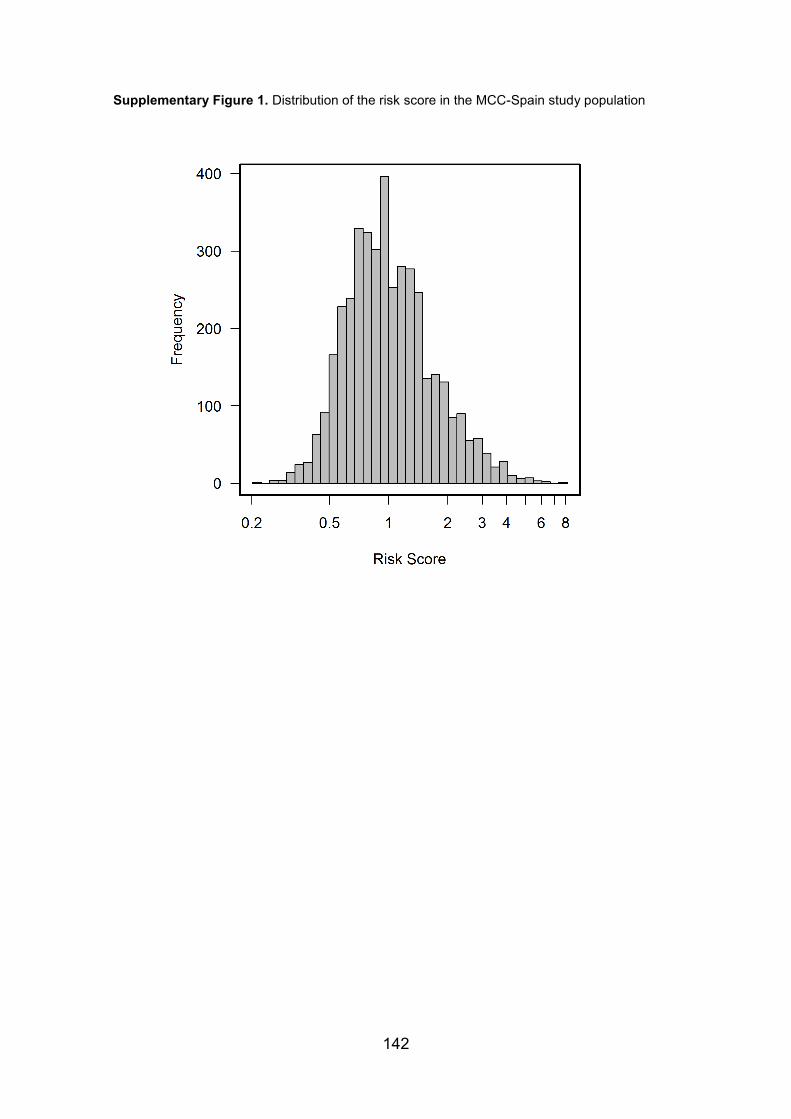
142
Supplementary Figure 1. Distribution of the risk score in the MCC-Spain study population

143
Supplementary Figure 2. Estimation of CRC incidence in Spain by sex, age (years) and
environmental risk score (ERS).

144
Supplementary Figure 3. Estimation of CRC incidence in Spain by sex, age (years) and
genetic risk score (GRS).

145
Supp
lem
enta
ry T
able
2a.
Cum
ulat
ive
risk
of C
RC
acc
ordi
ng to
age
rang
e an
d ge
netic
risk
sco
re (m
ales
). N
umbe
rs fo
r fig
ure
3a.
Age
(y
ears
) N
umbe
r of r
isk
alle
les
≤15
16
17
18
19
20
21
22
23
24
25
26
27
28
≥29
15-1
9.9
0.00
0.
00
0.00
0.
00
0.00
0.
00
0.00
0.
00
0.00
0.
00
0.00
0.
00
0.00
0.
00
0.00
20
-24.
9 0.
00
0.00
0.
00
0.00
0.
00
0.00
0.
00
0.00
0.
00
0.00
0.
00
0.00
0.
00
0.00
0.
00
25-2
9.9
0.00
0.
00
0.00
0.
01
0.01
0.
01
0.01
0.
01
0.01
0.
01
0.01
0.
01
0.01
0.
01
0.01
30
-34.
9 0.
01
0.01
0.
01
0.01
0.
01
0.02
0.
02
0.02
0.
02
0.02
0.
02
0.02
0.
03
0.03
0.
03
35-3
9.9
0.03
0.
03
0.03
0.
03
0.04
0.
04
0.04
0.
05
0.05
0.
05
0.06
0.
06
0.07
0.
07
0.08
40
-44.
9 0.
07
0.07
0.
08
0.08
0.
09
0.10
0.
10
0.11
0.
12
0.13
0.
14
0.15
0.
16
0.18
0.
19
45-4
9.9
0.16
0.
18
0.19
0.
21
0.22
0.
24
0.26
0.
28
0.30
0.
32
0.35
0.
37
0.40
0.
43
0.47
50
-54.
9 0.
37
0.40
0.
43
0.46
0.
50
0.53
0.
57
0.62
0.
67
0.72
0.
77
0.83
0.
90
0.97
1.
04
55-5
9.9
0.72
0.
78
0.84
0.
90
0.97
1.
05
1.13
1.
22
1.31
1.
41
1.52
1.
64
1.77
1.
90
2.05
60
-64.
9 1.
26
1.35
1.
46
1.57
1.
70
1.83
1.
97
2.12
2.
28
2.46
2.
65
2.86
3.
08
3.32
3.
57
65-6
9.9
2.00
2.
16
2.33
2.
50
2.70
2.
91
3.13
3.
38
3.64
3.
92
4.22
4.
55
4.90
5.
28
5.69
70
-74.
9 3.
04
3.27
3.
53
3.80
4.
10
4.41
4.
76
5.12
5.
52
5.95
6.
41
6.91
7.
44
8.01
8.
64
75-7
9.9
4.27
4.
61
4.97
5.
35
5.77
6.
20
6.69
7.
21
7.76
8.
37
9.02
9.
02
10.4
6 11
.27
12.1
5 80
-84.
9 5.
69
6.13
6.
61
7.12
7.
67
8.26
8.
90
9.59
10
.33
11.1
4 12
.00
12.0
0 13
.93
15.0
0 16
.17

146
Supp
lem
enta
ry T
able
2b.
Cum
ulat
ive
risk
of C
RC
acc
ordi
ng to
age
rang
e an
d ge
netic
risk
sco
re (f
emal
es).
Num
bers
for f
igur
e 3b
.
Age
(y
ears
) N
umbe
r of r
isk
alle
les
≤15
16
17
18
19
20
21
22
23
24
25
26
27
28
≥29
15-1
9.9
0.00
0.
00
0.00
0.
00
0.00
0.
00
0.00
0.
00
0.00
0.
00
0.00
0.
00
0.00
0.
00
0.00
20
-24.
9 0.
00
0.00
0.
00
0.00
0.
00
0.00
0.
00
0.00
0.
00
0.00
0.
00
0.00
0.
00
0.00
0.
00
25-2
9.9
0.01
0.
01
0.01
0.
01
0.01
0.
01
0.01
0.
01
0.01
0.
01
0.01
0.
01
0.01
0.
01
0.01
30
-34.
9 0.
01
0.01
0.
02
0.02
0.
02
0.02
0.
02
0.02
0.
02
0.03
0.
03
0.03
0.
03
0.04
0.
04
35-3
9.9
0.03
0.
03
0.04
0.
04
0.04
0.
05
0.04
0.
05
0.05
0.
06
0.04
0.
07
0.08
0.
09
0.09
40
-44.
9 0.
08
0.08
0.
09
0.09
0.
10
0.11
0.
10
0.11
0.
12
0.15
0.
16
0.17
0.
18
0.20
0.
21
45-4
9.9
0.15
0.
16
0.17
0.
17
0.20
0.
22
0.26
0.
28
0.24
0.
29
0.32
0.
34
0.37
0.
40
0.43
50
-54.
9 0.
29
0.31
0.
34
0.34
0.
39
0.42
0.
57
0.62
0.
45
0.57
0.
61
0.66
0.
71
0.76
0.
82
55-5
9.9
0.48
0.
52
0.56
0.
56
0.64
0.
69
1.13
1.
22
0.75
0.
94
1.01
1.
09
1.17
1.
26
1.36
60
-64.
9 0.
74
0.80
0.
86
0.86
1.
00
1.08
1.
97
2.12
1.
16
1.45
1.
57
1.69
1.
82
1.96
2.
11
65-6
9.9
1.10
1.
18
1.27
1.
27
1.48
1.
59
3.13
3.
38
1.72
2.
15
2.31
2.
49
2.69
2.
89
3.12
70
-74.
9 1.
57
1.70
1.
83
1.86
2.
12
2.29
4.
76
5.12
2.
46
3.08
3.
32
3.58
3.
85
4.15
4.
48
75-7
9.9
2.19
2.
36
2.54
2.
54
2.95
3.
18
6.69
7.
21
3.43
4.
29
4.62
4.
98
5.36
5.
78
6.23
80
-84.
9 2.
94
3.16
3.
41
3.41
3.
96
4.26
8.
90
9.59
4.
59
5.75
6.
19
6.67
7.
19
7.74
8.
35

147
Supplementary Table 3. Positive predictive value for CRC according to age range and risk
score. Numbers for Figure 4.
Positive predictive values
Risk score 40-49 years 50-59 years 60-69 years 70-79 years
Females
0.2 0.20 0.77 1.85 3.74 0.3 0.22 0.84 2.00 4.05 0.4 0.24 0.92 2.18 4.41 0.5 0.26 0.99 2.36 4.75 0.6 0.28 1.06 2.51 5.06 0.7 0.30 1.13 2.69 5.40 0.8 0.32 1.21 2.87 5.76 0.9 0.34 1.28 3.04 6.07 1.0 0.36 1.34 3.17 6.34 2.0 0.54 2.01 4.73 9.30 3.0 0.78 2.90 6.72 12.96 4.0 1.26 4.63 10.49 19.49 5.0 1.56 5.67 12.67 23.06 6.0 1.53 5.57 12.46 22.72 7.0 1.68 6.09 13.53 24.43
Males
0.2 0.24 1.20 3.43 7.36 0.3 0.26 1.30 3.70 7.93 0.4 0.28 1.42 4.04 8.61 0.5 0.31 1.54 4.35 9.24 0.6 0.33 1.64 4.63 9.81 0.7 0.35 1.76 4.95 10.45 0.8 0.37 1.88 5.28 11.10 0.9 0.40 1.99 5.57 11.67 1.0 0.41 2.08 5.82 12.15 2.0 0.63 3.11 8.55 17.31 3.0 0.91 4.46 11.96 23.32 4.0 1.47 7.05 18.09 33.09 5.0 1.81 8.59 21.47 37.97 6.0 1.78 8.44 21.15 37.52 7.0 1.95 9.20 22.77 39.77
Positive predictive values derived from the sensitivity and specificity of the risk score applied to the cumulative risk of CRC for the age interval using Bayes theorem.


ANNEX 3: Procés editorial i correspondència dels articles


Correspondència article 1

153
Procés editorial i correspondència de l'article 1 (Digestive and Liver
Disease)
Resposta de l’editor i comentaris dels revisors de Digestive and Liver
Disease així com resposta a aquests comentaris.
RESPONSE POINT BY POINT TO THE REVIEWERS
Reviewer #1:
I have major concerns about the way in which the numerical data are documented. In the Results section, the authors have data in different formats. Since these data are highly unlikely to be normally distributed, I advocate that they are given as mean and range rather than as documented in the manuscript.
Although we strived to satisfy the recommendation of the reviewer, we feel that blood haemoglobin should be measured with mean and standard deviation while faecal haemoglobin as it contains extremely large or small values is better measured with median and range.
Moreover, due to the inherent sources of variation, the authors ought to consider the number of significant figures used for their data: can you really measure faecal haemoglobin concentration to one figure after the decimal point, for example? In addition, values less than zero do require a 0 before the decimal point. Further, if the percentage is a whole number, then 0 must follow after a decimal point.
The Automated analyser (OC-Sensor DIANA) for quantitative faecal occult blood testing measures in Hb/mL buffer without decimals. In the manuscript, we converted Hb/mL buffer to Hb/g faeces dividing by 5 and that’s why there were decimals. Now, we have rounded every number of faecal haemoglobin (in Hb/g) to the nearest unit and eliminated decimals in order to avoid confusion.
We have changed numerical data so that now every number has only one decimal.
Reviewer #2: The work is interesting. In this manuscript were identified factors associated with a false-positive result in a colorectal cancer screening program with FIT.

154
Review the follow-up of patients until March-2016 and included in the work. Include the number of patients that have been made gastroscopy from the FIT positive to march-2016.
We have reviewed the follow-up of patients until March-2016 and this paragraph has been included in the Methods section of the manuscript: All the participants with a FP result were followed until April 2016 to identify if a follow-up colonoscopy, upper gastrointestinal endoscopy or capsule endoscopy explained the FP result by FIT.
This paragraph has been included in the Results section of the manuscript: During the surveillance, 12 patients (0.04%) underwent a colonoscopy. The colonoscopies were normal in 5 patients, but we found a lesion with haemorrhagic risk in 7 patients in whom either colonic angiodysplasia (n = 2) or polyps were detected (n = 5; the polyps were either high-risk lesions [n = 1], intermediate-risk lesions [n = 1], or low-risk lesions [n = 3]). In total, 10 (0.04%) patients had an upper endoscopy performed. We identified upper-gastrointestinal lesions in seven patients: hiatal hernia (n = 3), Barrett’s oesophagus (n = 2), erosive gastritis (n = 1) or a gastric polyp (n = 1). Only one patient underwent capsule endoscopy which detected ileal erosions and a colonic angiodysplasia.
This paragraph has been included in the Discussion section of the manuscript: During the follow-up of subjects with FP results, 9.1% (n = 23) of patients underwent an endoscopic procedure, and only 3.1% (n = 8) patients were diagnosed with a lesion in lower gastrointestinal tract that could explain the FIT result. It is important to highlight that no patient was diagnosed with a CRC, but that one patient was diagnosed with a high-risk lesion (a large flat polyp located behind the colonic haustrum in the right colon), which had been missed by colonoscopy.
Explain: How individuals conducting the questionnaire? What person conducting the questionnaire by telephone?
As suggested by the reviewer#2, in the Methods section it has been specified that the questionnaire was administered by a nurse or medical doctor: We included participants with a positive FIT result who underwent total colonoscopy between January 2014 and July 2014 and who answered a phone questionnaire administered by a nurse or a medical doctor (n = 472).
As suggested by the reviewer#2 and #3 a specific sentence regarding response rate to questionnaire has been included in the Results section of the manuscript: The overall average response rate to the questionnaire was 76.6% (472 of 616 subjects), which corresponded to 74.0% (95%CI, 69.5–78.5) for men and 80.4% (95%CI, 75.5–85.3) for women.
Define best false positive ¿With No CRC risk?

155
In order to improve comprehensibility, the definition has been rewritten: A FP result was defined as a positive FIT result (≥20 µg Hb/g) followed by a colonoscopy result without either intermediate/high-risk lesions or CRC. According to “European guidelines for quality assurance in CRC”,[20] intermediate-risk lesions were defined as 3–4 tubular adenomas measuring <10 mm with low-grade dysplasia or as ≥1 adenoma measuring 10–19 mm, while high-risk lesions were defined as ≥5 adenomas or ≥1 adenoma measuring ≥20 mm.
Include number of patients during colonoscopy had anal fissure or haemorrhoid.
During colonoscopies 2 anal fissures and 303 haemorrhoids were detected while in the questionnaire 196 and 45 patients claimed to have haemorrhoids and fissure anal, respectively. Self-report was considered the best choice to gather anal diseases as they are intermittent pathologies. We believe that identifying haemorrhoids in the colonoscopy depends on the endoscopist subjectivity and not always leads to symptomatic haemorrhoids.
Include an abstract presented at the congress of the Spanish Association of Gastroenterology 2016 on proton pump inhibitors and FIT (page 75 Gastroenterol Hepatol 2016; March.)
After our study, one of the co-authors (F. Rodríguez-Moranta) analysed the FIT accuracy among proton pump inhibitors users in another sample (1,003 symptomatic patients with positive FIT in). His abstract entitled Proton pump inhibitors reduce FIT accuracy was presented at the congress of the Spanish Association of Gastroenterology 2016 [available at Gastroenterología y Hepatología, Volume 39, Issue 2, February 2016, Pages 69–86]. It showed that proton pump inhibitors increase FIT false-positive rate.
Following Reviewer#2 recommendation, we have included a paragraph in the Discussion manuscript citing this abstract: Consistent with this hypothesis, an unpublished investigation [30] has analysed FIT accuracy among PPI users in 1,003 symptomatic patients with positive FIT results. In a multivariate analysis, they found that PPI use was the only risk factor for FP results, and that their use reduced FIT accuracy for detecting CRC. This might explain why upper gastrointestinal bleeding diseases (peptic ulcers and hiatal hernias) were associated with FP results in our univariate analyses, though not after being adjusted for PPI use (p = 0.19), while PPI use adjusted for hiatal hernias and peptic ulcers was significantly associated with FP results (p = 0.03). This is consistent with evidence that FIT is specific for bleeding diseases of the lower gastrointestinal tract.
Reviewer #3: This is a potentially interesting paper, but I found some aspects of the analysis and reporting confusing so I think the paper needs to be resubmitted before a judgment can be made about its suitability for publication.

156
The authors report a relationship between the presence of peptic ulcer or hiatal hernia and a false positive result (Table 1) yet this does not appear in the abstract and the variable is not included in the multivariate analysis (Table 2).
Hiatal hernia or ulcer peptic adjusted for proton pump inhibitors use
True positive False positive OR 95% CI p-value n % n % No pathology 192 88.1 206 81.1 1 Upper pathology 26 11.9 48 18.9 1.4 0.8-2.5 0.19
Proton pump inhibitors adjusted for hiatal hernia or ulcer peptic
True positive False positive OR 95% CI p-value n % n % No PPI use 177 81.2 179 70.5 1 PPI use 41 18.8 75 29.5 1.7 1.0-2.6 0.03
There is strong association between upper gastrointestinal bleeding diseases (peptic ulcer or hiatal hernia) and PPI as these diseases are a frequent indication of PPIs. In fact, 36% of PPI users have hiatal hernia or peptic ulcer in our sample. However, we decided not to include them in the multivariate because they were no significant before incorporating PPI in the model and because they may be confounders.
These two tables show how having an upper gastrointestinal disease adjusted for PPI use is not a risk predictor of FP. In contrast, the second table shows how PPI use adjusted for hiatal hernia and peptic ulcer is a risk factor for FP. This reflects that PPI might cause FP because it might slow down globin’s degradation from upper tract and consequently it is detected in FIT.
Following Reviewer#3 recommendation, we have rewritten the Discussion section of the manuscript regarding upper gastrointestinal lesions: Consistent with this hypothesis, an unpublished investigation[30] has analysed FIT accuracy among PPI users in 1,003 symptomatic patients with positive FIT results. In a multivariate analysis, they found that PPI use was the only risk factor for FP results, and that their use reduced FIT accuracy for detecting CRC. This might explain why upper gastrointestinal bleeding diseases (peptic ulcers and hiatal hernias) were associated with FP results in our univariate analyses, though not after being adjusted for PPI use (p = 0.19), while PPI use adjusted for hiatal hernias and peptic ulcers was significantly associated with FP results (p = 0.03). This is consistent with evidence that FIT is specific for bleeding diseases of the lower gastrointestinal tract. Chiang et al.[31] verified the FIT’s performance for predicting lesions of the lower gastrointestinal tract, and they confirmed that the results were not confounded by the presence of upper gastrointestinal tract lesions. When comparing the prevalence rates of lower and upper gastrointestinal tract lesions between participants with positive and negative faecal test results, they

157
found that such lesions were present in approximately 20% of all subjects. Levi et al.[32] performed upper gastrointestinal endoscopy in 160 patients with positive FIT results not explained by colonoscopy, and concluded that FIT positivity was not correlated with finding lesions likely to bleed on upper gastrointestinal endoscopy, and argued that this procedure was probably unsuitable for patients with positive FIT and negative colonoscopy.
A different set of variables predict FP rates in men vs women and this information does not appear in the abstract.
When we stated “no gender-related were identified” we were thinking in factors that explained why women had more probability of a FP result. The abstract has been corrected.
Also, I think the authors need to test whether there are significant interactions between gender and the relevant variables (e.g. successive screens, PPIs) in prediction of FP rates and not just infer gender differences because of differences in the pattern of significant results in separate analyses for men and women. I'm also not sure that the authors’ investigation of the potential explanations of the relationship between female gender and FP rate has been carried out appropriately. Shouldn't the authors be looking for interactions e.g. gender by SSRI not just main effects e.g. SSRI.
We tested if there were interactions between the different covariates and sex but we did not find any. Now, we have included this information in the Methods manuscript: We also computed models stratified by sex and examined interactions between the different covariates.
We have also added the result of the interaction test in the Results section of the manuscript: To identify the female-related factors associated with FP, we tested if there were interactions between the different covariates and sex, but we did not find any.
Interaction OR 95%CI p-value Sex(women) and age (60-69 years) 1.3 0.6-2.7 0.6 Sex(women) and anal pathology 1.2 0.6-2.7 0.6 Sex(women) and screening rounds (successive) 0.6 0.3-1.2 0.1 Sex(women) and hiatal hernia or ulcer peptic 1.0 0.3-2.9 1.0 Sex(women) and PPIs 0.5 0.2-1.2 0.1 Sex(women) and NSAIDs or APA or OAC 1.2 0.4-3.0 0.8 Sex(women) and SSRI 0.4 0.1-1.4 0.1
The authors need to give some consideration to response rate to the questionnaire and any bias this may have introduced into the results (e.g. men are less likely to complete questionnaires than women).
As suggested by the reviewer#2, in the Methods section it has been specified that the questionnaire was administered by a nurse or medical doctor: We included participants with a positive FIT result who underwent total colonoscopy between January 2014 and July 2014 and who

158
answered a phone questionnaire administered by a nurse or a medical doctor (n = 472).
As suggested by the reviewer#2 and #3 a specific sentence regarding response rate to questionnaire has been included in the Results section: The overall average response rate to the questionnaire was 76.6% (472 of 616 subjects), which corresponded to 74.0% (95%CI, 69.5–78.5) for men and 80.4% (95%CI, 75.5–85.3) for women.
Results from a randomised placebo-controlled trial, published this month, showed that PPI use increased the risk of short-term NSAID-induced small bowel injury 132. For this reason, this reference has been added in the Discussion section.

Correspondència article 2


161
Procés editorial i correspondència de l'article 2 (European Journal of
Cancer Prevention)
Resposta de l’editor i comentaris dels revisors de European Journal of
Cancer Prevention així com resposta a aquests comentaris.
RESPONSE POINT BY POINT TO THE REVIEWERS
Reviewer #1: Gemma Ibañez-Sanz et al. presented a study conducted within the colorectal cancer screening of Catalonia aimed at evaluating the proportion of false negative FIT results. This is a very important issue for monitoring the performance and the quality of a colorectal cancer screening programme and it should be a best practice to apply in any screening programme.
The authors did not specify the dimension and characteristics of the random sample from which they recruited FIT negative people who agreed to undergo colonoscopy.
A better description of the study sample has been added in the manuscript: The CRC Screening Programme in Hospitalet de Llobregat (Catalonia) invited 58,184 men and women aged 50-69 years to participate in the 6th round of screening from 26th November, 2012 to 3rd November, 2014. About 40% of the invited individuals agreed to participate (n=22,970). From those, 21,726 individuals had a negative result in FIT and 1,229 individuals had a positive test (positivity rate: 5.4%). The study participants were individuals with a negative FIT between November 2013 and October 2014. A random sample of them was invited to participate by telephone or by letter, until the sample size was reached. A total of 218 subjects with negative FIT agreed to undergo total colonoscopy.
What is the power of the study? The size of the sample is not designed for detecting lesions with low prevalence like cancers. The authors should clarify this point.
We agree with the reviewer that the sample size was not designed for detecting CRC but advanced neoplasia missed in FIT. We expected to identify mostly intermediate/high risk lesions.
The sample size was calculated to attain a ±4% precision for the estimate of the proportion of FN results. With this sample size, the power to detect differences in comparisons of groups is low. The detectable difference was an OR of 2.5 or larger (80% power) for balanced groups.

162
The sample of 218 subjects presents an excess of women (60%). This fact could affect the reliability of the study due to the lower prevalence of disease in females than males.
The proportion of women in the study reflects the participation rate in screening, which is higher for women. Also, overall, women have more negative FIT results than men. Though the proportion of FN was higher in women, we could not find gender differences regarding to sampling selection.
Additional aims of the study were to evaluate the association of a false-negative FIT result with a lot of variables, but no data and any tables were shown about this evaluation. Maybe such an evaluation is too ambitious for a study with a very small sample size.
We agree with the reviewer that the study was not powered to test for differences. Therefore, we have deleted information regarding the analysis of additional variables and reference to the questionnaire.
In conclusion, I believe that general statements like FIT lower sensitivity for proximal lesions or small adenomas are out of reach of this study.
We have modified the sentence regarding FIT lower sensitivity for proximal lesions. Now, we only suggest an explanation of the result shown in Table 1 but we do not talk about FIT sensitivity. The following sentence has been included in the manuscript, also in response to reviewer 2: There were more lesions in the distal than the proximal colon which can be caused by haemoglobin partial degradation during bowel passage suggesting a differential sensitivity of FIT with respect to left- and right-sided lesions.96.
Reviewer #2: This is an interesting short communication on false negative results found in a well-established FIT-based colorectal cancer screening programme in Catalonia. In general, it is easy to read and to follow. The study results seem cogent and will be of value to readers of the journal.
The major issue that I have with this paper is that the authors state that: No differences were detected when comparing individuals with a FN result and those with a true negative result regarding socio-demographic (age, sex, educational level) and clinical factors. However, they do not discuss the data in Table 1 very well, in my opinion. It is clear that there are a higher percentage of women with false negative results than with true positive results. Why is this so? In fact, the first can be explained by the fact that women have a lower faecal haemoglobin than men, probably due to transit time through the colon (Fraser CG, et al. Faecal haemoglobin concentrations vary with sex and age, but data are not transferable across geography for colorectal cancer screening. Clin Chem Lab Med. 2014;52:1211-6) and this is true for Catalonia (Fraser CG, Auge

163
JM; PROCOLON Group. Faecal haemoglobin concentrations do vary across geography as well as with age and sex: ramifications for colorectal cancer screening. Clin Chem Lab Med. 2015;53:e235-7). Moreover, there are more lesions in the distal than the proximal colon. Why is this so? The second can be explained by degradation of faecal haemoglobin as the faeces passes from the proximal colon. There are fewer large polyps than small polyps. Why is this so? The third can be explained by the fact that faecal haemoglobin is related to the size of the lesion (for example: Digby J, et al. Faecal haemoglobin concentration is related to severity of colorectal neoplasia. J Clin Pathol. 2013 ;66:415-9). I think that the authors should expand the discussion to elaborate on these known facts which explain the findings in Table 1, which the authors do not do.
As suggested by the reviewer#2, the Results section has been modified with the following text in the manuscript: Table 1 shows a higher percentage of women with FN results than with true positive results. However, there were no other differences when comparing individuals with a FN result and those with a true negative result regarding age.
As suggested by reviewer#1 we have deleted any data related with the questionnaire performed (level of education, smoking, body mass index, blood haemoglobin concentration, antiplatelet agents and nonsteroidal anti-inflammatory drugs
Moreover, all the explanations that kindly suggested Reviewer#2 have been added in the Discussion: Table 1 shows that women have more FN and this could be explained by the fact that they have lower faecal haemoglobin probably due their slower colonic transit time.(Fraser et al., 2015) There were more lesions in the distal than the proximal colon which can be caused by haemoglobin partial degradation during bowel passage suggesting a differential sensitivity of FIT with respect to left- and right-sided lesions.(Haug et al., 2011). It is also important to highlight that the three lesions in the rectum were detected in women. This could be related to previous reports regarding a higher occurrence of rectal cancer among women in studies of interval cancers, which often are related to FN results.(Digby et al., 2015) Moreover, lesions detected in the FN group were smaller those detected in screening, which can be explained by the fact that f-Hb is related to the size of the lesions.(Digby et al., 2013
Were there any lesions in the rectum? This is important since women with interval cancers (false negative results) have much rectal cancer.
As suggested by the reviewer, we have analysed if there were lesions in the rectum. Next table shows the distribution of intermediate/high-risk lesions or CRC stratified by sex. As reviewer#2 stated, women had three lesions in the rectum that were false negative and the male had none.

164
True Positive False Negative Female Male Female Male
Proximal 46 85 12 7 Distal 87 189 3 7 Rectum 17 34 3 0
Table 1 has been modified to show lesions in the rectum and the results explained in the discussion (see previous point).
Finally, since there were no cancers, only two high risk lesions and a few intermediate lesions (most of which will not progress to cancer), should the authors not tone down there message somewhat and state that, since these were the lesions, false negative results, at least with the cut-off used, may not really be much of a clinical problem - and compare that to using a higher cut-off faecal haemoglobin concentration (see: Digby J, et al. Interval cancers using a quantitative faecal immunochemical test (FIT) for haemoglobin when colonoscopy capacity is limited. J Med Screen. 2015 Nov 19 [E-pub in press]
The paragraph in the discussion has been rewritten:
A key finding was that most of the FN had an almost undetectable concentration of f-Hb. This illustrates that these FN lesions would had not been identified lowering the threshold of f-Hb and, taking into account that some countries have a limited colonoscopy capacity, future studies should compare these results using a higher cut-off faecal haemoglobin concentration.(Digby et al., 2015)
Also the conclusion has been revised: In conclusion, decreasing the positivity threshold of FIT does not increase the detection rate of advanced neoplasia, but may increase the costs and potential adverse effects. However, we should not ignore gastrointestinal symptoms and better inform our target population that successive screening is required to early detect CRC.
Reviewer #3:
It is not often one has an opportunity to find out if lesions have been missed in the screening population due to limited colonoscopy resources. This paper provides robust evidence that lowering the cut-off does not detect cancers in that group. The principle of the argument is sound and very relevant, however, the results investigated are out-with the linear range of the analyser and so judgment must be used as to whether these are a true representation of the faecal Hb concentration present in the faeces.
Given the fact that many subjects had a zero value in FIT, we investigated if OC-sensor had any high dose “hook” for faecal sample haemoglobin level. The prozone or high-dose hook effect produces false negative results in samples with a very high concentration of analyte.

165
This analytical problem can occur with some immunoassay methods when the amount of antigen present (in this case Hb) is markedly greater than the amount of antibody present. This excess of antigen produces a fall in the turbidity of the solution.
Carroll et al (Evaluation of quantitative faecal immunochemical tests for haemoglobin. Guildford Medical Device Evaluation Centre (GMEC), Guildford, UK, 2013.) reported no evidence of hook/prozone effect with OC-sensor.
The plot below shows the distribution of faecal haemoglobin in FIT (positive and negative).
It looks, from the data, like fewer women received a positive result in the screening cohort, but there were more women in the false negative cohort. Do the authors have any thoughts regarding this?
As suggested also by reviewer#2, in order to answer this question, we have added the following sentence in the discussion section of the manuscript: Table 1 shows that women have more FN and this could be explained by the fact that they have lower faecal haemoglobin probably due to their slower colonic transit time.(Fraser et al., 2015)


Correspondència article 3

169
Procés editorial i correspondència de l'article 3 (Scientific Reports)
Resposta de l’editor i comentaris dels revisors de Scientific Reports així
com resposta a aquests comentaris.
RESPONSE POINT BY POINT TO THE REVIEWERS
Reviewer #1:
Victor Moreno and co-authors try to create a statistical model to stratify the risk of Colorectal cancer (CRC) using both environmental and genetic information. They use a case-control study including 1336 CRC cases and 2744 controls (MCC-Spain). Subjects were interviewed on environmental factors, medical history and genotyped for 21 well-known CRC susceptibility SNPs. Many environmental and genetic SNPs resulted to be associated with CRC risk and the cumulative AUC curve was estimated to be 0.65 thus increasing discrimination, at least marginally. An interesting finding is that genetic factors seems to be less important than environmental aspects, even if contributes significantly to improve the model. The study is well conducted and performed, sample size is adequate and statistics seems correct. Unfortunately, the AUC is not so impressive. Weaknesses are linked to the case-control design with the need of a propensity score to adjust for it and lack of replication in an independent sample. The discussion is fair but could include some more considerations about the fact that simple pieces of information collected by interview can enhance prediction more than genetics. This could have costs in terms of screening strategy.
We have modified the conclusion of the abstract in order to emphasise the importance of environmental risk factors to improve CRC screening.
Moreover, we have added more information in the Discussion section in order to highlight this issue.
I would appreciate also some data about sensibility and specificity of the different models at different cut-offs other than positive and negative predictive values according to differences in the prevalence of CRC in hypothetical populations to screen (i.e. men>45 years old etc.)
We thank the reviewer for this suggestion. We have calculated the sensitivity and specificity values for a selection of risk scores. Positive and negative predictive values have also been calculated for a range of age decades, including 40-49, before current screening and 70-79, after current screening. We have included a new Figure, a new Table and a new Supplementary Table which shows that the positive predictive value of the model increases only in a relevant way at older ages, when the prior probability of CRC is higher.

170
Reviewer #2: The authors propose a new risk model for colorectal cancer including both, environmental and genetic risk factors. The statistical analysis is carried out thoroughly to my impression but the rationale and the discussion of the impact of the newly proposed risk model could be improved.
The rationale of the study is not quite clear to me. There are about 20 risk models for colorectal cancer proposed in the literature and it is not explained, which gaps should be filled by the newly proposed risk score. At least one should discuss the other risk models and compare the predictions.
We agree with the reviewer that we should have informed which gaps we think we have filled by the proposed risk score. For this reason, we have extended the paragraph of the manuscript where this issue is commented. Though there are some risk models that include genetic data, our study has used a larger number of SNPs and combined with life-style risk factors.
Although counting risk factors is appealing for clinical utility, it does not provide an optimal risk prediction. What is the loss in predictive power compared to a weighted risk model?
We have now included the analyses of weighted risk models, both with weighs derived from the literature and fitted to our data. When cross-validation was used to assess the predictive accuracy, all three models performed very similar. These details have been included in the methods and results.
Statistical analysis: I do not understand why the authors adjusted for a propensity score which contains some of the risk factors. How does this interact with the later construction of the risk model?
Controls were frequency-matched to cases, by age, sex and region, ensuring that in each region there was at least one control of the same sex and 5-year interval for each case. This is why we could not include age and sex in our predictive models. Other factors included in the propensity score like region and education was used to adjust for potential confounding.
In order to clarify this, a better description of the study in the Methods section (Study population) of the manuscript has been added.
Statistical analysis: AUROC estimation and CI: Please explain how the bootstrapping was performed and how it provides an unbiased estimate of the AUROC + CI. To my opinion, cross-validation is more appropriate to solve the overfitting issue.
We thank the reviewer for this suggestion and indeed, the cross-validation approach provides a better estimate of the predictive accuracy of the model. Now we show the cross-validation AUROC estimate, which is 0.63, lower than previously reported of 0.65. To calculate the 95% CIs,

171
a bootstrap approach has been used, nested with the cross-validation procedure.
The last two paragraphs of the results consider incidences and possible screening strategies in dependence on the risk score. It is very difficult to follow the authors here. Please improve the presentation. What are the conclusions of these considerations?
As suggested, these paragraphs of the results have been extensively revised in a way we hope is clearer for the reader.


ANNEX 4: Comunicacions a congressos


175
Ibáñez-Sanz G, Garcia M, Gómez-Matas J, Domènech X, Binefa G,
Rodríguez-Moranta F, Vidal C, Milà N, Soriano A, Moreno V. Factores
asociados con un resultado falso positivo en el cribado de Cáncer Colorectal.
Acceptat com a pòster amb menció especial “recomendado por la SEED” al
Congrés de la Societat Espanyola d’Endoscòpia digestiva a Saragossa.
Novembre 2015.
Ibáñez-Sanz G, Garcia M, Rodríguez-Moranta F, Gómez-Matas J,
Binefa G, Padrol I, Benito L, Milà N, Gornals J, Moreno V. Falsos negativos del
cribado de cáncer colorectal mediante test de sangre oculta en heces y
colonoscopia como prueba diagnóstica. Acceptat com a comunicació oral al
Congrés de la Societat Espanyola d’Endoscòpia Digestiva a Saragossa.
Novembre 2015.
Ibáñez-Sanz G, Garcia M, Rodríguez-Moranta F, Gómez-Matas J,
Binefa G, Padrol I, Benito L, Milà N, Gornals J, Moreno V. Falsos negatius del
cribratge de càncer colorectal mitjançant test de sang oculta en femta i
colonoscòpia com a prova diagnòstica. Acceptat com a pòster al XXV Congrés
de la Societat Catalana de Digestologia a Reus. Gener 2016
Ibáñez-Sanz G, Díez-Villanueva A, Rodríguez-Moranta F, Padrol I,
Guinó E, Pollán M, Martín Sánchez V, Llorca J, Altzibar JM, Ardanaz E, Tardón
A, Jiménez Moleón JJ, Peiró R, Aguacil J, Kogevinas M, Moreno V. Modelo de
riesgo para estratificar el riesgo de cáncer colorectal en población española
utilizando loci comunes de susceptibilidad genética. Acceptat com a
comunicació oral a la XIX reunió anual de la Associació Espanyola de
Gastroenterologia a Madrid. Març 2016.