p. persica anÁlisis de la diversidad genÉtica en...
TRANSCRIPT
ANÁLISIS DE LA DIVERSIDAD GENÉTICA EN MELOCOTONERO
[P. persica (L.) Batsch] Y EN PATRONES DEL GÉNERO Prunus
TESIS DOCTORAL
MARIEM BOUHADIDA
Estación Experimental de Aula Dei - ZaragozaConsejo Superior de Investigaciones
Científicas
Universidad de Zaragoza
Anál
isis
de
la d
iver
sida
d ge
nétic
a en
mel
ocot
oner
o [P
. per
sica
(L.)
Bats
ch] y
en
patro
nes
del g
éner
o P
runu
sM
AR
IEM
BO
UH
AD
IDA
2007

Estación Experimental de Aula Dei Consejo Superior de Investigaciones Científicas (CSIC)
Zaragoza Departamento de Pomología
Tesis Doctoral
Análisis de la diversidad genética en melocotonero [P. persica (L.) Batsch] y en patrones del género Prunus
Memoria presentada por Doña. Mariem Bouhadida, Ingeniero Agrónomo especialidad: Producción Vegetal, para optar al grado de Doctor en Ciencias
Zaragoza, Marzo 2007
Dña. Mª YOLANDA GOGORCENA AOIZ y Dña. Mª ÁNGELES MORENO SÁNCHEZ, Científicos Titulares del Consejo Superior de Investigaciones Científicas CERTIFICAN
Que la Tesis Doctoral titulada “Análisis de la diversidad genética en melocotonero
[P. persica (L.) Batsch] y en patrones del género Prunus”, ha sido realizada por
Doña. MARIEM BOUHADIDA, en el Departamento de Pomología de la Estación
Experimental de Aula Dei del Consejo Superior de Investigaciones Científicas bajo su
dirección y reúne, a su juicio, las condiciones requeridas para optar al Grado de Doctor
en Ciencias.
Zaragoza, Marzo de 2007 Fdo. Mª Yolanda Gogorcena Aoiz Fdo. Mª Ángeles Moreno Sánchez

A mi hijo Aymen
A mi marido, por su amor, su paciencia y su apoyo incondicional A mi familia

Agradecimientos En primer lugar, quiero agradecer a mis directoras de tesis, las Dras. Doña María
Yolanda Gogorcena Aoiz y Doña María Ángeles Moreno Sánchez; porque su
dedicación, apoyo y disponibilidad fueron fundamentales para la realización de esta
tesis.
A la Agencia Española de Cooperación Internacional (AECI) por concederme una beca
predoctoral de 3 años, sin la cual nada de esto se hubiera realizado, y quiero agradecer
de forma muy especial al Servicio de Relaciones Internacionales de la Universidad de
Zaragoza que me concedió una beca predoctoral de 8 meses, sin la cual este trabajo no
hubiese finalizado. También he de agradecer a la Estación Experimental de Aula Dei
(CSIC) de Zaragoza, por haberme permitido usar sus instalaciones para realizar este
trabajo.
Quiero agradecer a la Dra. Ana María Casas de la Estación Experimental de Aula Dei
por su ayuda y colaboración en algunos de los trabajos realizados. Al Dr. Juan Pedro
Martín de la Escuela Politécnica de Madrid, por su inestimable orientación y
colaboración. Al Dr. Pere Arús del IRTA de Cabrils, por la valiosa aportación de su
experiencia, conocimientos y sugerencias.
Al Dr. D. Jorge Pinochet y Doña María Luisa Cunill de la empresa Agromillora
Catalana S.A., por su colaboración en la realización de este trabajo y el suministro de
material vegetal.
A la Dra. Pilar Catalán de la Escuela Politécnica de Huesca por su ayuda y su
orientación en una parte del análisis del capítulo 6 de esta tesis.
A las Dras. Elizabeth Dirlewanger y Nathalie Ollat, del INRA de Burdeos por su ayuda
y colaboración.
A las personas que trabajan o trabajaron en Aula Dei, en especial a mis compañeros
del Dpto. de Pomología, por su amistad y su apoyo durante todo este tiempo, y al
personal de la unidad de apoyo de biblioteca, servicio de informática, administración, y
otros departamentos y servicios.
Quiero manifestar mi profunda gratitud a todos los compañeros de Aula Dei y a mis
compañeros de laboratorio y despacho de becarios, por su gran apoyo, por ayudarme y
animarme en todo momento y hacerme sentir como en casa: Sergio, Rosa, Olfa, Samia,
Celia, Sawsen, Laura, Afif, Mari Carmen, Jorge, Lenny, Manu, Javier, Pedro Sánchez,
Pedro Lucía, Julio, Alejandro, Carlos, Mari Carmen Jiménez, Coral, Rosa Giménez,
Ana, Tatiana, Maria José Gonzalo, Julio, Jesús Aparicio, Victoria, Mari Carmen
Rubio, María Clemente, Loreto, María Bernal, Jorge Alvaro, Jorge Loscos, Sofía...
A María Pilar Soteras, por su cariño, su gran corazón y su presencia y apoyo
incondicional, que ha sido para mí como una madre durante todo este tiempo, nunca
olvidaré todo lo que ha hecho por mí.
A mis compañeras de piso, Natalia, Samia y Amaya que siempre me han apoyado y
ayudado en todo.
A los amigos de Túnez, (Ajmi, Aïcha, Najla, Rym, Faiha, Chahine, Islem) que siempre
me han estado apoyando y animando a llevar a cabo este trabajo.
RESUMEN El género Prunus pertenece a la familia de las Rosáceas (subfamilia Prunoideae) e
incluye numerosas especies. Este género incluye diversas especies frutales de hueso de gran importancia económica como albaricoquero, almendro, ciruelo, cerezo, melocotonero, así como especies ornamentales.
El gran número de especies Prunus existentes aumenta significativamente las posibilidades de hibridación ínterespecífica entre ellas, por lo que se dificulta una correcta clasificación botánica. Por otra parte, los programas de mejora en patrones de frutales de hueso se basan en la producción de híbridos ínterespecíficos, con el objetivo de reunir en el mismo individuo características de interés de cada especie. Los programas de mejora genética dependen de la caracterización correcta del material vegetal para el control y la utilización eficiente de los patrones y variedades frutales de Prunus.
El melocotonero (P. persica) es uno de los frutales más tecnificado y más extendido en todo el mundo. El melocotonero es la especie con mayor dinamismo varietal dentro de los frutales del género Prunus. La caracterización y la identificación correcta de los cultivares es importante para la mejora y certificación, así como para la protección de los derechos de los obtentores en el mundo. En España, las variedades cultivadas tradicionalmente han sido reemplazadas por las nuevas selecciones de los programas de mejora, reduciendo drásticamente la diversidad en melocotonero. La caracterización molecular del germoplasma local mediante los marcadores moleculares es necesaria para catalogar los recursos fitogenéticos y conservar así la biodiversidad disponible en esta especie.
En este trabajo, se han caracterizado 30 cultivares de melocotonero procedentes de un mismo área de cultivo en Aragón (19 de los 30 cultivares son supuestos clones de una misma variedad: ‘Miraflores’), utilizando 20 marcadores microsatélites (SSRs) desarrollados en melocotonero. Todos los marcadores amplificaron un valor medio de 2,3 alelos por locus, y permitieron la identificación de 16 genotipos de los 30 estudiados, mientras que 14 clones de ‘Miraflores’ mostraron el mismo perfil genético para todos los loci.
Por otra parte, se ha caracterizado un conjunto de 94 cultivares de melocotonero pertenecientes al banco de germoplasma español, de referencia nacional de melocotonero, que incluye 64 cultivares locales españoles y 30 cultivares procedentes de programas de mejora internacionales. Se eligieron 15 marcadores SSRs, seleccionados por su alto nivel de polimorfismo en melocotonero. Se obtuvo un valor medio de 6,7 alelos por locus con todos los marcadores, mostrando así una alta diversidad genética entre los 94 cultivares estudiados. Se ha observado una mayor distancia genética entre los melocotones de carne dura y los melocotones de carne blanda, y principalmente entre los melocotones españoles de carne dura y el resto de los cultivares. Con sólo 8 de los 15 SSRs utilizados en este trabajo, se pueden distinguir correctamente todos los cultivares estudiados.

En este estudio, se han caracterizado mediante los marcadores SSRs y la PCR-RFLP, especies y patrones (híbridos ínterespecíficos) de Prunus, basándose en el análisis del ADN nuclear y cloroplástico, respectivamente.
Se llevó a cabo, con veinte SSRs, la caracterización de 44 patrones de Prunus clasificados en tres grupos: híbridos de melocotonero y almendro x melocotonero; ciruelos de crecimiento rápido; y ciruelos de crecimiento lento. Los SSRs utilizados, han mostrado un alto nivel de polimorfismo y amplificaron 16 alelos por locus, permitiendo la identificación total de todos los patrones estudiados.
Finalmente, la técnica de PCR-RFLP se ha utilizado para el análisis del ADN cloroplástico de 84 accesiones de Prunus (híbridos ínterespecíficos y especies de Prunus). Esta técnica se ha basado, en este estudio, en la combinación de amplificaciones mediante cebadores universales (DT, HK, K1K2) y digestiones con enzimas de restricción (AluI, HinfI, y TaqI). El polimorfismo generado en el tamaño de los fragmentos de restricción, ha permitido la detección de 33 haplotipos para las 84 accesiones estudiadas. Las accesiones que comparten el mismo haplotípo tienen relaciones maternas entre sí, lo que ha permitido en algunos casos, comprobar la identidad de los progenitores maternos de los híbridos ínterespecíficos. En este trabajo, se discuten las relaciones filogenéticas entre las especies de Prunus estudiadas, basándose en el análisis de los 33 haplotipos encontrados, permitiendo confirmar algunas hipótesis botánicas anteriores.
SUMMARY Prunus (subfamily Prunoideae of the family Rosaceae) is a large and diverse genus
comprised of a large species of trees and shrubs. Prunus is economically important because of its diversified use, as fruit (e.g., almonds, apricots, cherries, peaches, and plums), ornamentals, and forestry or industrial purposes. The presence of large number of Prunus species increase the possibilities of interspecific hybridisation, and make the establishment of botanical classification quite complicated. On the other hand, current trends in breeding stone fruit rootstocks are based on the production of interspecific hybrids, aiming at putting together favourable traits which appear in different species. Effective control and utilisation of Prunus rootstocks in breeding programs and Prunus management depends upon accurate and unambiguous characterisation of the plant material.
Peach is one of the most deciduous fruit tree species of the Prunus genus. It has a dynamic process of development and selection of new varieties. Therefore, precise cultivar identification and characterisation is essential for improving and securing peach culture in the world. On the other hand, the diversity of peach germplasm has been drastically reduced in Spain and in the world by the wide adoption of improved varieties reducing genetic resources. A detailed characterization of the Spanish peach germplasm using microsatellite markers is necessary to conserve these important genetic resources and to establish an efficient collection.
In this study, we characterised 30 peach cultivars originated from a local area in Aragón (Spain) (19 are described as clones of the ‘Miraflores’ peach variety) using 20 SSR primer pairs developed in peach. All markers amplified an average of 2.3 alleles per locus, and identified 16 genotypes from the 30 studied, while 14 (clones of ‘Miraflores) showed the same genetic profile.
Moreover, we characterised a sample of 94 peach cultivars from the national collection composed of 64 local Spanish peach and 30 cultivars from modern breeding programs. For this aim, we used a set of 15 microsatellite markers selected for their high polymorphism from published sequences. An average of 6.7 alleles per locus was amplified with all SSRs, expressing a high genetic diversity within the 94 cultivars studied. High genetic distances were observed when comparing non-melting peach cultivars with melting ones, and especially between Spanish non-melting peaches and the rest of cultivars. Only eight SSRs from the 15 used in this study, were able to distinguish unambiguously all the cultivars studied.
In this study, a characterisation of Prunus species and rootstocks (interspecific hybrids) was also carried out, on the basis of nuclear and chloroplast DNA analyses using SSRs and the PCR-RFLP, respectively.
A set of 20 SSRs was used to characterize 44 Prunus rootstocks belonging to three groups: Peach-based rootstocks; Myrobalan-Marianna plums; and Slow growing plums. SSRs in this case showed a high level of polymorphism and amplified an average of 16 alleles per locus, allowing the total identification of all rootstocks.

The PCR-RFLP technique was used for the cpDNA screening of 84 Prunus accessions (interspecific hybrids and Prunus species) and basing on the combination of amplifications with 3 universal primers (DT, HK, and K1K2) and digestions with 3 restriction enzymes (AluI, HinfI, and TaqI). The restriction fragment size polymorphisms detected in this case revealed a total of 33 haplotypes for all the 84 accessions studied. Accessions sharing the same haplotype had maternal relationships among them, which allowed the identification of some maternal progenitors of the Prunus interspecific hybrids. The 33 haplotypes found in this study, enabled the reconstruction and the discussion of the phylogenetic relationships among the Prunus species studied.

Índice de Figuras Pág. Figura 1-1. Superficie cultivada y producción en 2005 de los principales
cultivos de frutales de hueso en España (FAOSTAT, 2006) ................................10 Figura 1-2. Etapas de un ciclo de PCR (polymerase chain reaction) ............................19 Figura 1-3. Esquema del procedimiento de amplificación de los
microsatélites en plantas y revelación del polimorfismo en SSRs mediante la PCR ....................................................................................................22
Figura 1-4. Esquema representativo de los marcadores tipo PCR-RFLP o
CAPS. Las muestras A, B y C a la izquierda producen bandas del mismo tamaño, éstas representan las amplificaciones de PCR en tres individuos, antes de digerir con el enzima de restricción. A la derecha, después de digerir, se observa un lugar de corte en la muestra A, ninguno en la muestra B, y la muestra C presenta los dos alelos por tratarse de un híbrido entre A y B..........................................................................24
Figura 1-5. Este dibujo esquemático del polimorfismo de un solo nucleótido
muestra dos fragmentos de ADN (uno en la parte superior y otro en la inferior) que comparten la misma secuencia de 34 pares de bases y difieren sólo en el par de la posición 31 de los fragmentos. En esa posición, un A-T (parte superior) ha cambiado a un C-G (parte inferior)..................................................................................................................26
Figure 3-1. Dendrogram of the 30 peach accessions obtained from the
Neighbor Joining analysis (NJ) using Nei’s genetic distance (1972) after amplification with 20 SSR primer pairs .......................................................56
Figure 3-2. Plot of the first two components (PC1 and PC2) of the principal
coordinate analysis on the similarity matrix for 30 peach accessions (varieties and related clones) using 20 SSRs ........................................................57
Figure 4-1. Identification key for the 64 Spanish native peach cultivars
based on six microsatellite markers: BPPCT001, BPPCT006, BPPCT008, PS9f8, UDP98-022 and UDP98-412.................................................78
Figure 4-2. UPGMA dendrogram of 94 peach cultivars based on their
variation at 15 SSR loci .........................................................................................81
Figure 5-1. Dendrogram of the 44 Prunus rootstocks obtained from the
UPGMA cluster analysis using the Dice coefficient (Nei and Li, 1979), after amplification with 13 SSR primer pairs......................................................103
Figure 5-2. Plot of the two first components (PC1 and PC2) of principal
coordinate analysis on the similarity matrix for 44 Prunus rootstocks after amplification with 13 SSR primer pairs. Names of some relevant clones are shown in the figure .............................................................................105
Figure 5-3. Dendrogram of the 16 peach-based rootstocks obtained from the
UPGMA cluster analysis, using the Dice coefficient (Nei and Li, 1979) after amplification with 18 SSR primer pairs......................................................112
Figure 6-1. Restriction patterns obtained on agarose gel with the primer
pair-restriction enzyme combination K1K2-HinfI in 11 interspecific hybrids of Prunus. M: molecular size marker (50 base pair ladder, Amersham, Piscataway, N.J.)..............................................................................130
Figure 6-2. Dendrogram of 33 Prunus cpDNA haplotypes (H1 to H33)
generated by UPGMA clustering analysis using the simple matching coefficient. Classification into subgenera and sections is according to Rehder (1940) ......................................................................................................133
Figure 6-3. Strict consensus of 56 most parsimonious trees of 33 Prunus
cpDNA haplotypes (L = 139, CI = 0.51, RI = 0.65). Bootstrap percentages, when greater than 50%, are shown above the branches. Classification into subgenera and sections is according to Rehder (1940) ..................................................................................................................135
Figure 6-4. The minimum-length spanning tree of 33 cpDNA haplotypes
from the 84 Prunus accessions studied ...............................................................137
Índice de Tablas
Pág. Table 1-1. Clasificación taxonómica según Rehder (1940).............................................8 Table 3-1. List of the 20 SSR primers used in this study, size range,
annealing temperature, number of alleles and variability parameters ...................55 Table 4-1. Cultivars studied and their collections, origin, and main fruit
characteristics ........................................................................................................70 Table 4-2. Characteristics of the 15 SSR markers studied ............................................73 Table 4-3. Allele size (AS) in base pairs and allele frequency (AF) observed
for the 94 peach cultivars analysed with 15 SSR markers ....................................75 Table 4-4. Parameters of variability calculated for the 15 SSR markers in 94
peach cultivars .......................................................................................................76 Table 5-1. Characteristics of rootstocks used in the study.............................................98 Table 5-2. List of the 20 SSR primers used in this study, size range,
annealing temperature, and level of amplification for all the groups studied....................................................................................................................99
Table 5-3. Number of loci and alleles observed for each rootstock group
with the 13 SSR polymorphic among all the clones studied. These SSRs were used for the analysis of the diversity among groups .........................107
Table 5-4. Allele number and parameters of variability in the Peach-based
rootstocks group with the 18 polymorphic SSRs ................................................109 Table 6-1. List of 84 accessions (interspecific hybrids and species) of
Prunus studied. Classification into sections and subgenera is according to Rehder (1940). Haplotypes found in accessions are also included. ................125
Table 6-2. Chloroplast DNA universal primer pairs used in this study. PCR
conditions, size of amplified fragments and quality of amplification .................128

Table 6-3. Major pattern and variant (in bp) of fragments revealed in each polymorphic site detected with different primer pair-restriction enzyme combinations in 84 accessions of hybrids and parents of Prunus studied .....................................................................................................129
Table 6-4. Description of 33 cpDNA haplotypes showing mutational
differences in each polymorphic site, revealed by the eight combinations primer-restriction enzyme used in this study ................................131
ÍNDICE GENERAL
CAPÍTULO 1. Introducción general __________________________ 5
1-1. EL GÉNERO Prunus ____________________________________________ 7
1-2. ESPECIES FRUTALES DE HUESO DEL GÉNERO Prunus. EL
MELOCOTONERO_________________________________________________ 9
1-3. PATRONES PARA FRUTALES DE HUESO DEL GÉNERO Prunus __ 11
1-4. INTERÉS DE LA IDENTIFICACIÓN VARIETAL EN ESPECIES
FRUTALES Y PATRONES DE Prunus _______________________________ 13
1-5. CARACTERIZACIÓN E IDENTIFICACIÓN VARIETAL DE ESPECIES
FRUTALES Y PATRONES Prunus___________________________________ 13
1-5-1. Caracterización morfológica _________________________________________________13 1-5-2. Caracterización molecular___________________________________________________14
1-6. MÉTODOS DE ANÁLISIS DE LOS DATOS MOLECULARES _______ 27
CAPÍTULO 2. Objetivos ___________________________________ 43
CAPÍTULO 3. Molecular characterization of Miraflores peach
variety and relatives using SSRs_____________________________ 47
3-1. INTRODUCTION______________________________________________ 50
3-2. MATERIALS AND METHODS __________________________________ 51
3-2-1. Plant material ____________________________________________________________51 3-2-2. Genomic DNA extraction ___________________________________________________52 3-2-3. DNA amplification ________________________________________________________52 3-2-4. Data analysis _____________________________________________________________53
3-3. RESULTS_____________________________________________________ 53
3-3-1. Microsatellite diversity _____________________________________________________53 3-3-2. Cluster and principal coordinate analysis _______________________________________55
3-4. DISCUSSION _________________________________________________ 58
3-4-1. Genetic diversity __________________________________________________________58 3-4-2. Cultivar relationships from cluster and principal coordinate analysis__________________59
1
CAPÍTULO 4. Genetic analysis of introduced and local Spanish
peach cultivars determined by SSR markers___________________ 65
4-1. INTRODUCTION______________________________________________ 68
4-2. MATERIALS AND METHODS __________________________________ 69
4-2-1. Plant material ____________________________________________________________69 4-2-2. DNA extraction and microsatellite amplification _________________________________72 4-2-3. Data analysis _____________________________________________________________72
4-3. RESULTS_____________________________________________________ 74
4-3-1. Genetic diversity of SSRs markers and cultivars identification ______________________74 4-3-2. Genetic relationships among peach cultivars based on SSR variation _________________79
4-4. DISCUSSION _________________________________________________ 82
4-4-1. Microsatellite polymorphism ________________________________________________82 4-4-2. Genetic relationships among cultivars__________________________________________83 4-4-3. Cultivar identification ______________________________________________________85
4-5. CONCLUSION ________________________________________________ 85
CAPÍTULO 5. Molecular characterization of Prunus rootstocks using
microsatellite markers _____________________________________ 91
5-1. INTRODUCTION______________________________________________ 94
5-2. MATERIALS AND METHODS __________________________________ 96
5-2-1. Plant material ____________________________________________________________96 5-2-2. Genomic DNA extraction and amplification_____________________________________96 5-2-3. Data analysis _____________________________________________________________97
5-3. RESULTS AND DISCUSSION __________________________________ 100
5-3-1. Genetic diversity among groups _____________________________________________100 5-3-2. Genetic diversity within groups _____________________________________________106
CAPÍTULO 6. Chloroplast DNA diversity in Prunus and its
implication on phylogenetic relationships ____________________ 119
6-1. INTRODUCTION_____________________________________________ 122
6-2. MATERIALS AND METHODS _________________________________ 124
6-2-1. Plant material ___________________________________________________________124
2
6-2-2. DNA extraction, amplification, and digestion___________________________________124 6-2-3. Data analysis ____________________________________________________________127
6-3. RESULTS____________________________________________________ 128
6-3-1. Chloroplast DNA restriction patterns _________________________________________128 6-3-2. Chloroplast DNA haplotypes _______________________________________________130 6-3-3. Chloroplast DNA diversity and phylogenetic relationship in Prunus _________________132
6-4. DISCUSSION ________________________________________________ 137
6-4-1. Chloroplast DNA haplotypes: inheritance and relationships________________________137 6-4-2. Chloroplast DNA diversity and phylogenetic relationships in Prunus ________________139
CAPÍTULO 7. Discusión general ___________________________ 147
7-1. ESTUDIO GENÉTICO CON SSRs EN CULTIVARES DE
GERMOPLASMA LOCAL DE MELOCOTONERO ___________________ 149
7-2. ESTUDIO GENÉTICO DE PATRONES DE Prunus CON SSRs ______ 153
7-3. ESTUDIO FILOGENÉTICO EN ESPECIES DE Prunus MEDIANTE LA
TÉCNICA PCR-RFLP_____________________________________________ 154
CAPÍTULO 8. Conclusiones _______________________________ 159
ANEXOS _______________________________________________ 163
3


CAPÍTULO 1
Introducción general


Capítulo 1
1-1. EL GÉNERO Prunus
El género Prunus pertenece a la familia Rosaceae (subfamilia Prunoideae) e incluye
especies de gran importancia económica como el almendro (P. dulcis D.A. Webb), el
melocotonero [P. persica (L.) Batsch], el albaricoquero (P. armeniaca L.), y el cerezo
(P. avium L.), etc. Estas especies son diploides, con un número básico de cromosomas
x=8 y 2n=16. El ciruelo incluye diferentes especies Prunus, tanto diploides (P.
cerasifera Ehrh.) como tetraploides (P. spinosa L.) y hexaploides (P. domestica L. y P.
insititia L.), todas ellas incluidas dentro del subgénero Prunophora.
Existe una gran variabilidad genética y morfológica entre las distintas especies del
género Prunus. La mayoría de ellas tienen su origen en las zonas con clima templado
del hemisferio norte (Dosba et al., 1994) y fueron trasladadas de un continente a otro, a
través de las rutas comerciales. El gran número de especies existentes aumenta
significativamente las posibilidades de hibridación ínterespecífica entre ellas, lo que
complica el establecimiento de una correcta clasificación botánica. Dentro de la familia
Rosaceae, los botánicos han propuesto numerosas clasificaciones, basándose en las
características morfológicas, proponiendo desde 70 (Krüssman, 1976) a 400 (Rehder,
1940) especies distintas dentro del género Prunus. La taxonomía del género Prunus se
ha basado sobre todo en el fenotipo, estimando las diferencias genéticas entre especies.
Sin embargo, la clasificación filogenética en Prunus es todavía controvertida. De
Tournefort (1700) identificó seis géneros distintos dentro del Prunus s.l. (sensu lato)
basándose en la morfología: Amygdalus L., Armeniaca Miller, Cerasus Miller,
Laurocerasus Duhamel, Persica Miller, y Prunus s.s. (sensu stricto). Posteriormente,
Bentham y Hooker (1865) unificaron los seis géneros en un único género Prunus, que
se dividió en siete secciones: Amygdalopsis, Amygdalus, Armeniaca, Cerasoides,
Cerasus, Laurocerasus y Prunus. Posteriormente, Koehne (1893) dividió el género
Prunus en siete subgéneros, reduciéndolos posteriormente (Koehne, 1911) a cuatro:
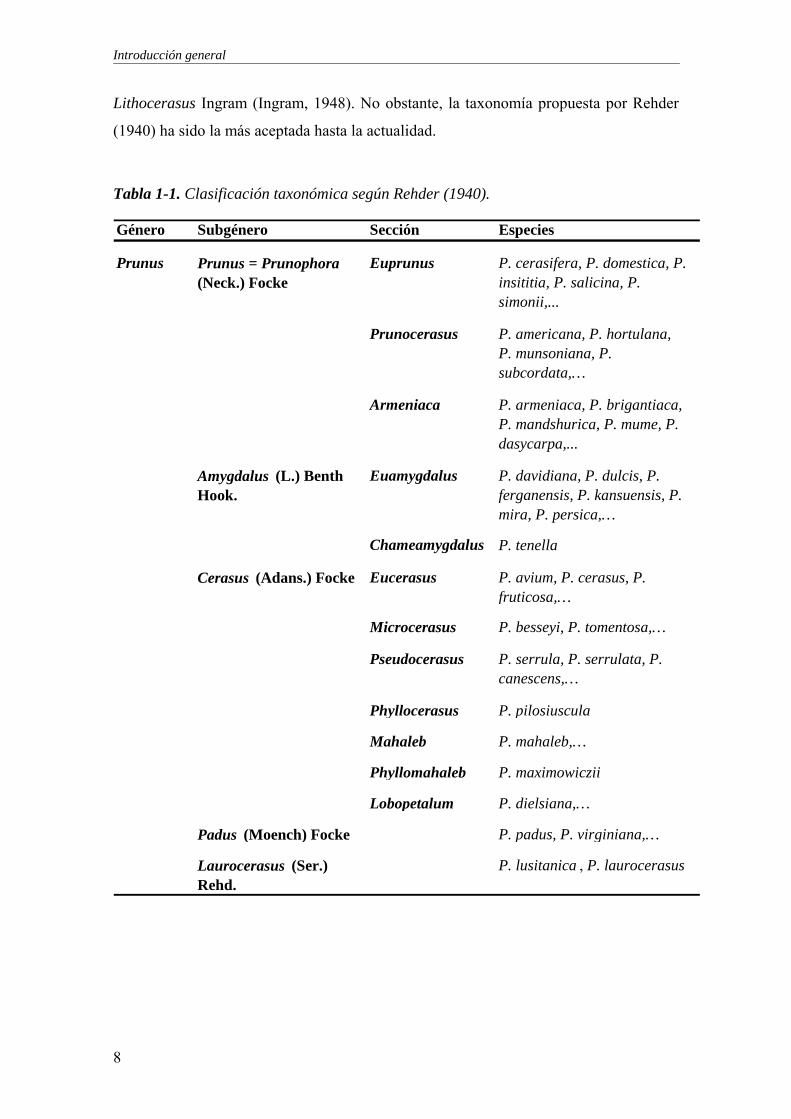
Amygdalus, Cerasus, Padus y Prunophora (=Prunus). Rehder (1940) revisó la
clasificación propuesta por Koehne y dividió el género en los cinco subgéneros
descritos en la Tabla 1-1: Prunus [= Prunophora (Neck.) Focke]; Amygdalus (L.)
Benth. Hook., Cerasus (Adans.) Focke; Padus (Moench) Focke; y Laurocerasus (Ser.)
Rehd. El subgénero Cerasus, definido por Rehder, está compuesto de una amplia y
diversa gama de especies, y por ello se dividió en dos subgéneros: Cerasus y
7
Introducción general
Lithocerasus Ingram (Ingram, 1948). No obstante, la taxonomía propuesta por Rehder
(1940) ha sido la más aceptada hasta la actualidad.
Tabla 1-1. Clasificación taxonómica según Rehder (1940).
Género Subgénero Sección Especies
Prunus Prunus = Prunophora (Neck.) Focke
Euprunus P. cerasifera, P. domestica, P. insititia, P. salicina, P. simonii,...
Prunocerasus P. americana, P. hortulana, P. munsoniana, P. subcordata,…
Armeniaca P. armeniaca, P. brigantiaca, P. mandshurica, P. mume, P. dasycarpa,...
Amygdalus (L.) Benth Hook.
Euamygdalus P. davidiana, P. dulcis, P. ferganensis, P. kansuensis, P. mira, P. persica,…
Chameamygdalus P. tenella
Cerasus (Adans.) Focke Eucerasus P. avium, P. cerasus, P. fruticosa,…
Microcerasus P. besseyi, P. tomentosa,…
Pseudocerasus P. serrula, P. serrulata, P. canescens,…
Phyllocerasus P. pilosiuscula
Mahaleb P. mahaleb,…
Phyllomahaleb P. maximowiczii
Lobopetalum P. dielsiana,…
Padus (Moench) Focke P. padus, P. virginiana,…
Laurocerasus (Ser.) Rehd.
P. lusitanica , P. laurocerasus
8

Capítulo 1
1-2. ESPECIES FRUTALES DE HUESO DEL GÉNERO Prunus. EL
MELOCOTONERO
Dentro del género Prunus, subgénero Amygdalus, existen especies frutales de gran
importancia socio-económica, como el melocotonero (P. persica) y el almendro (P.
dulcis). Estas dos especies representan la mayor superficie cultivada de frutales de
hueso en España, con una superficie de 611.920 ha para el almendro y de 89.454 ha
para el melocotonero (Figura 1-1). El cerezo (P. avium), perteneciente al subgénero
Cerasus, ocupa una menor superficie (49.112 ha), comparada con el melocotonero y el
almendro, seguido por el ciruelo (19.236 ha) y el albaricoquero (19.098 ha). En cuanto a
la producción anual en España, la mayor producción corresponde al melocotonero
(1.130.800 t), seguida de la de ciruelo, almendro, albaricoquero y, por último, cerezo
(Figura 1-1).
El melocotonero [Prunus persica (L.) Batsch] es una especie que pertenece a la
familia Rosaceae, subfamilia Prunoïdeae, género Prunus, subgénero Amygdalus (L.)
Focke, sección Euamygdalus Schneid. Es uno de los frutales más tecnificado y más
difundido en todo el mundo. España es la segunda productora a nivel europeo, con más
de un millón de toneladas, y la cuarta a nivel mundial. El 70% de la producción se
destina al consumo en fresco, generalmente para mercado interior; en torno al 20% a su
procesado industrial, y sólo el 10% se destina a la exportación. Se trata de un frutal de
zona templada no muy tolerante al frío, y su área de cultivo se extiende entre los 30 y
45º de latitud norte y sur.
A principios del siglo XX, algunos programas de mejora seleccionaron, a partir de
poblaciones procedentes de semilla, genotipos de melocotonero por su buena
productividad y comportamiento (Hesse, 1975; Scorza y Okie, 1990) que se propagaron
clonalmente por medio del injerto. Además, algunas variedades procedentes de China,
de frutos grandes y con buena calidad, se introdujeron en los programas de mejora
norteamericanos y se utilizaron extensivamente como parentales para la obtención de
nuevas variedades de melocotonero. Las variedades tradicionales, cultivadas hasta
entonces, fueron reemplazadas por las nuevas selecciones procedentes de dichos los
programas de mejora, reduciéndose drásticamente la diversidad del melocotonero en
USA (Scorza et al., 1985; Werner y Okie, 1998).
9

Introducción general
Ciruelo(19.236 ha)
Albaricoquero (19.098 ha)
Almendro (611.920 ha)
Melocotonero(89.454 ha)
Cerezo(49.112 ha)
Superficie cultivada
Cerezo(89.300 t)
Melocotonero (1.130.800 t)
Almendro (204.500 t)
Ciruelo(217.500 t)
Albaricoquero(132.800 t)
Producción
Figura 1-1. Superficie cultivada y producción en 2005 de los principales cultivos de frutales de hueso en España (FAOSTAT, 2006).
10
Capítulo 1
Los descendientes de esas variedades chinas y sus cruzamientos fueron
introduciéndose también en Europa, sustituyendo a los cultivares locales, lo que llevó a
la pérdida de la biodiversidad que existía en el continente europeo (Scorza et al., 1985;
Badenes et al., 1998).
El melocotonero es la especie frutal con un mayor dinamismo varietal ya que cada
año aparecen numerosas novedades en el mercado, y la renovación varietal es una de las
más intensas. Debido a las características climáticas y de producción, la distribución
varietal no sólo varía con la fecha de maduración sino también con las zonas de cultivo.
La mayoría de los programas de mejora van dirigidos a conseguir características
específicas, mejorando la calidad del fruto en cuanto al aspecto y las características
organolépticas. Entre otras, la firmeza del fruto es una característica de gran
importancia, ya que condiciona su manejo y transporte. Esta característica divide las
variedades en dos tipos: de carne blanda (“melting”) y de carne dura (“non-melting”).
Los frutos de carne dura tienen una mejor aptitud para el manejo y el transporte, y
suelen utilizarse en la industria conservera, aunque en España también tienen valor
comercial para su consumo en fresco.
Los principales criterios de selección empleados en las variedades de melocotonero
son: requerimientos edafoclimáticos (necesidades en horas frío), destino del fruto
(consumo en fresco o procesado industrial), demanda del mercado, época de producción
o maduración, área de producción y calidad del fruto.
1-3. PATRONES PARA FRUTALES DE HUESO DEL GÉNERO Prunus
Un árbol frutal está generalmente compuesto por dos partes genéticamente
diferentes, que pueden pertenecer a la misma o distinta especie: la parte aérea o
variedad y la raíz o patrón (Felipe, 1989).
El uso de patrones frutales permite la adaptación de la variedad a condiciones
edáficas que, en algunos casos, son desfavorables para la especie, además de conferir
resistencia y/o tolerancia a enfermedades y patógenos del suelo (Garner, 2003).
Además, el patrón es el principal responsable de la nutrición mineral de la planta.
La importancia del patrón sobre el comportamiento vegetativo y productivo de la
variedad injertada es bien conocido (Guerriero et al., 1984; Byrne, 1988). Entre los
principales factores en los que influyen los patrones sobre la variedad cabe destacar: el
vigor o desarrollo del árbol (Wertheim y Webster, 2005); la fecha de floración y
11
Introducción general
productividad (Tabuenca y Gracia, 1971; Durner y Goffreda, 1992); la rapidez de
entrada en fructificación, época de maduración y calidad de los frutos (tamaño, color,
firmeza, composición mineral, contenido en azúcares y en ácidos orgánicos, etc.)
(Caruso et al., 1996; Castle, 1995; Jiménez et al., 2004); la composición mineral en
flores y hojas (Sanz y Montañés, 1995, Betrán et al., 1997; García et al., 2005); la
sensibilidad a determinados factores bióticos limitantes en determinados suelos (plagas
de insectos, nematodos, virus, hongos, y bacterias) (Howell, 1987; Pinochet et al., 1999;
Lang y Howell, 2001; Thomidis et al., 2005). Existen además otros factores abióticos
que afectan a la adaptación de las especies frutales, como la clorosis en suelos calizos y
pesados (Moreno et al., 2001; Giorgi et al., 2005), asfixia o sequía (Okie, 1987; Moreno
et al., 2001), temperaturas extremas (Lang et al., 1997) y suelos pobres en nutrientes
(De Salvador et al., 2005).
Existen dos tipos de patrones para frutales de hueso que pueden clasificarse en
patrones francos y patrones clonales (Agustí, 2004). Los patrones francos provienen de
semillas de la misma especie que la variedad injertada (Howard, 1987), y se usan para
algunos frutales de hueso. Sin embargo, en la actualidad, la propagación de los patrones
frutales se hace de forma clonal (vegetativa), lo que asegura una uniformidad en el
desarrollo vegetativo y en la producción del material utilizado (Felipe, 1989). Los
patrones francos se mantienen en zonas donde no existe un patrón clonal adecuado.
Entre los patrones más utilizados actualmente para melocotonero se encuentran los
híbridos almendro x melocotonero (P. dulcis x P. persica: GF 677, GF 557, GxN,
Adafuel, etc.) (Cambra, 1990; Moreno y Cambra, 1994; Felipe, 1997) y los híbridos
ínterespecíficos de melocotonero (P. persica x P. davidiana: Cadaman, Barrier, etc.),
(Edin y Garcin, 1994). En cuanto al cerezo, los patrones más utilizados están
representados por las especies P. avium, P. mahaleb (Santa Lucia) y P. cerasus, y son
utilizados tanto para cerezo (P. avium) como para guindo (P. cerasus). Los patrones de
ciruelo pertenecen, en general, a las especies P. insititia (ciruelo San Julián, Pollizo de
Murcia, etc.), P. domestica, P. cerasifera (Mirobolán) y P. cerasifera x P. munsoniana
(Mariana).
12

Capítulo 1
1-4. INTERÉS DE LA IDENTIFICACIÓN VARIETAL EN ESPECIES
FRUTALES Y PATRONES DE Prunus
Los programas de selección y mejora de variedades y patrones frutales, deben ir
acompañados de una correcta caracterización del material vegetal. La caracterización
morfológica y fenológica de dichos patrones y variedades es imprescindible para que
éstos puedan figurar como nuevas obtenciones vegetales en el registro de variedades
protegidas de la Oficina Española de Variedades Vegetales (OEVV) del Instituto
Nacional de Semillas y Plantas de Vivero (INSPV) y de la Oficina Europea (Community
Plant Variety Office, CPVO). Por otro lado, la existencia de un número elevado de
variedades crea la necesidad de encontrar métodos de caracterización e identificación
más rápidos y eficaces, para facilitar el control de identidad del material propagado,
tanto en una colección de plantas madres como en el proceso de su comercialización por
las empresas viveristas al agricultor. Además, la identificación facilita la gestión de las
colecciones de germoplasma, al determinar la presencia de homonimias y sinonimias, y
proteger los derechos de los mejoradores, al comparar las nuevas variedades con las ya
existentes. Finalmente, la caracterización permite detectar relaciones genéticas y
filogenéticas entre especies y variedades, dando una información de gran utilidad en los
programas de mejora genética (para el diseño de los cruzamientos), y en estudios
filogeográficos.
1-5. CARACTERIZACIÓN E IDENTIFICACIÓN VARIETAL DE ESPECIES
FRUTALES Y PATRONES Prunus
1-5-1. Caracterización morfológica
Tradicionalmente las distintas variedades de frutales se han identificado por sus
características fenotípicas y, generalmente, con la priorización de aquellas que interesan
más desde el punto de vista agronómico y las que la experiencia demuestra que son más
estables. Dichas características hacen referencia a aspectos del: porte y vigor;
morfología de ramas, flores, hojas, frutos y semillas; época de floración y maduración;
calidad del fruto; resistencia/sensibilidad a plagas o enfermedades, etc. Sin embargo, los
pomólogos no han utilizado idénticos criterios a la hora de valorar los diferentes
caracteres, y por ello, la comparación de resultados ha dado lugar a muchas confusiones.
13

Introducción general
La Unión para la Protección de las Obtenciones Vegetales (UPOV), es un organismo
internacional que tiene por objeto poner a punto la protección de las novedades
varietales, y ha establecido modelos descriptivos para las distintas especies de frutales,
determinando las directrices para la conducción y examen de caracteres distintivos de la
homogeneidad y estabilidad.
Hasta ahora, los caracteres morfológicos han sido los únicos reconocidos por el
Reglamento Técnico de Control y Certificación de plantas de vivero de frutales (Royo
et al., 1994). Sin embargo, su exclusiva utilización presenta una serie de limitaciones
que se refieren a continuación.
- Exigencia de disponer de un campo de variedades de referencia bastante amplio, a fin
de poder comparar en condiciones ambientales similares.
- Exigencia de observar necesariamente flores y frutos, lo cual retrasa el proceso de
identificación debido al periodo de juvenilidad de la especie y, por tanto, el proceso de
registro.
- Los caracteres fenotípicos en los que se basa son, a veces, excesivamente dependientes
del medio o de las circunstancias en las que se desarrolla la planta.
- En algunas ocasiones, diferencias agronómicas de gran interés no se corresponden con
diferencias fenotípicas suficientes como para poder distinguir el material con total
seguridad.
1-5-2. Caracterización molecular
Para evitar los problemas descritos anteriormente en la identificación en especies
leñosas , los investigadores han buscado otros métodos alternativos a los morfológicos,
más independientes del medio, y de análisis rápido en plantas jóvenes. La
caracterización molecular con el desarrollo de los marcadores bioquímicos y
moleculares ha permitido solventar estos problemas.
El descubrimiento y la utilización de los marcadores isoenzimáticos a finales de los
años 70, marcaron una revolución en este sentido. Con los isoenzimas, se amplió el
conocimiento de la estructura y heterogeneidad genética entre diferentes especies,
variedades, y poblaciones de distinto origen geográfico. En la genética frutal han sido
utilizados ampliamente, con resultados significativos en diversos aspectos de mejora
(Messeguer et al., 1987). Estos marcadores tienen la ventaja de caracterizar el genotipo
de un individuo a partir de muestras de células o de tejidos.
14

Capítulo 1
Los avances de la tecnología del ADN recombinante han permitido el desarrollo de
los marcadores moleculares basados en el ADN, consiguiendo estabilidad en la
identificación de especies y variedades. Inicialmente, la utilización de enzimas de
restricción del ADN (RFLP- Restriction Fragment Length Polymorphism) (Grodzicker
et al., 1974) y posteriormente el desarrollo del proceso de amplificación en cadena
mediante reacción en cadena de la polimerasa (PCR) (Mullis and Faloona, 1987; Saiki
et al., 1988) llevó a la descripción de otras clases de marcadores moleculares. El uso
intensivo de esta nueva tecnología contribuyó al descubrimiento y al estudio de diversas
clases de secuencias repetitivas de ADN, llamadas mini y microsatélites, otra fuente rica
en polimorfismo genético. Actualmente, se puede obtener un número ilimitado de
marcadores moleculares altamente polimórficos, en cualquier organismo vivo a través
de diversas técnicas.
1-5-2-1. Tipos de marcadores moleculares
1-5-2-1-1. Los marcadores isoenzimáticos
El principio básico de la técnica reside en el uso de electroforesis en gel de almidón
(Smithies, 1955) y en la visualización del producto enzimático por métodos
histoquímicos (Hunter y Market, 1957). En mejora de plantas, las isoenzimas han sido
utilizadas para la detección de ligamiento genético con caracteres mono y poligenéticos,
identificación de variedades, selección indirecta de caracteres agronómicos, introgresión
génica y evaluación de germoplasma (Tanksley and Orton, 1983). Los marcadores
isoenzimáticos se aplicaron en especies leñosas para la identificación de melocotonero
(Arulsekar et al., 1986), almendro (Arulsekar et al., 1986; Cerezo et al., 1989),
albaricoquero (Battistini y Sansavini, 1991; Manganaris et al., 1999), vid (Royo et al.,
1997) y cítricos (Leitao et al., 2000). La detección de las isoenzimas incluye
básicamente tres pasos: 1) extracción de proteínas del tejido vegetal, 2) separación de
estas proteínas a través de electroforesis y 3) coloración histoquímica del gel, lo que
permite la visualización del producto de la reacción enzimática en forma de una banda.
Los alelos isoenzimáticos son codominantes, es decir, los genotipos heterocigotos y
homocigotos de un determinado locus son fácilmente identificados. Esto permite
estimar directamente parámetros tales como frecuencias genotípicas, frecuencias
alélicas así como coeficientes de diversidad genética y heterocigosidad (Weir, 1990).
15
Introducción general
Sin embargo, las isoenzimas presentan tres limitaciones básicas: 1) el número total de
loci que pueden ser detectados en el genoma es limitado, 2) el número de alelos por
locus, es decir, el nivel de polimorfismo genético detectable en cada locus es
generalmente bajo, entre 10 y 20 por especie (Murphy et al., 1990), y 3) varía la
expresión en tejidos. Este nivel de resolución no permite la cobertura completa del
genoma y por consiguiente, limita ciertas áreas de estudio como, por ejemplo, la
construcción de mapas genéticos saturados.
1-5-2-1-2. RFLPs (Restriction Fragment Length Polimorphism / Polimorfismo en el
tamaño de los fragmentos de restricción)
El análisis del polimorfismo de longitud de fragmentos de restricción (RFLP) fue una
de las primeras técnicas que se utilizó para detectar variaciones a nivel de la secuencia
del ADN. Esta tecnología se desarrolló en los años 70 (Grodzicker, 1974) y se aplicó
inicialmente en el estudio del genoma humano (Botstein et al., 1980). El principio de la
técnica RFLP se basa en la detección de fragmentos de DNA de distinto peso molecular,
a partir de moléculas de DNA, de diferentes individuos, que han sido sometidas a
digestión con enzimas de restricción. Las diversas mutaciones que afectan a las
moléculas de DNA modifican los lugares de restricción y producen fragmentos de
longitud variable. Estas diferencias de longitud de los fragmentos, se observan por
electroforesis en geles de agarosa. El patrón de bandas es tan complejo que es necesario
utilizar sondas específicas para visualizar sólo algunos fragmentos que se transfieren a
membranas mediante la técnica de Southern blot. Las sondas de DNA que hibridan en
zonas específicas suelen corresponder a genes conocidos. Los RFLPs han sido una
herramienta muy útil en el mapeo genético de frutales como en manzano (Hemmat et
al., 1994), en melocotonero (Rajapakse et al., 1995; Dirlewanger et al., 1998) y para el
estudio de la diversidad genética en las colecciones de germoplasma en vid (Gogorcena
et al., 1993), albaricoquero (De Vicente et al., 1998), y melocotonero (Quarta et al.,
2000).
La ventaja de los RFLPs frente a las isoenzimas, es que pueden cubrir todo el
genoma del organismo estudiado. El uso de RFLP aumenta, por lo tanto, la probabilidad
de encontrar asociaciones estadísticamente significativas entre estos marcadores y genes
que controlan un carácter de interés y además, son codominantes. El número de
marcadores RFLP es prácticamente ilimitado, y el nivel de polimorfismo alélico en cada
16
Capítulo 1
locus es muy superior al obtenido con los izoenzimas. Los RFLPs presentan entre sus
ventajas la repetibilidad de los resultados, permitiendo la comparación de trabajos. Los
RFLPs una vez situados en el mapa genético de una población pueden ser utilizados
para estudios de ligamientos en otras poblaciones. Sin embargo, la técnica RFLP
presenta ciertos inconvenientes, como su lentitud y complejidad. Además, su elevado
coste limita su uso en un número elevado de individuos. Estos inconvenientes hacen que
el uso de esta técnica haya diminuido en los últimos años, y con la llegada de la técnica
de la PCR (Reacción en Cadena de la Polimerasa o Polymerase Chain Reaction) se han
desarrollado nuevos marcadores moleculares que han sustituido casi totalmente el uso
de los RFLPs.
1-5-2-1-3. Marcadores basados en la reacción PCR
La tecnología de la reacción en cadena de la polimerasa (PCR) fue concebida a
mediados de la década de los 80 (Saiki et al., 1985; Mullis and Faloona, 1987) y desde
entonces, causó una verdadera revolución en la biología molecular. La facilidad, la
rapidez, la versatilidad y la sensibilidad de la PCR, hace que sea una técnica poderosa
para estudios genéticos y moleculares que incluyen gran número de individuos de
cualquier organismo vivo. La PCR consiste en la síntesis enzimática in vitro de millones
de copias de un segmento específico de ADN, en presencia de la enzima polimerasa. La
reacción de PCR se basa en el apareamiento y la polimerización enzimática de un par de
oligonucleótidos utilizados como cebadores (primers) que delimitan una secuencia
determinada de ADN de doble cadena. Los cebadores son sintetizados artificialmente,
de manera que sus secuencias de nucleótidos sean complementarias a las secuencias
específicas que flanquean la región del ADN que deseamos amplificar. Un ciclo de PCR
está compuesto de tres etapas: desnaturalización, hibridación y extensión (Figura 1-2).
En primer lugar, se desnaturaliza el ADN (se separan las dos hebras de las cuales está
constituido). Este paso puede realizarse de diferentes modos, siendo el calentamiento
(95ºC) de la muestra la más habitual. A continuación, se producirá la hibridación, es
decir, el cebador se unirá a su secuencia complementaria en el ADN molde. Para esto es
necesario que la temperatura descienda (generalmente a 55ºC, aunque se puede variar
según sea el caso). Por último, se aumenta la temperatura hasta 72ºC, temperatura a la
cual la polimerasa presenta su máximo de actividad, produciéndose una copia del
fragmento que se desea amplificar mediante la adición de nucleótidos. Este ciclo
17

Introducción general
(desnaturalización-hibridación-extensión) se repetirá de acuerdo a los fragmentos
amplificados que se desee. Generalmente son 30 ciclos, ya que un número mucho
mayor no implica un mayor rendimiento. Esta escala de amplificación permite, por lo
tanto, iniciar la PCR con cantidades mínimas de ADN (del orden de picogramos o
nanogramos) y terminar la reacción con grandes cantidades de ADN de la secuencia
específica de interés.
1-5-2-1-3-1. RAPDs (Random Amplified Polymorphic DNA / DNA polimórfico
amplificado al azar)
Los marcadores del tipo RAPDs fueron desarrollados por Williams et al. (1990), y
fueron los primeros marcadores basados en la PCR. Los RAPDs son secuencias de
ADN del genoma, amplificadas al azar, utilizando cebadores cortos y con unas
condiciones de PCR que favorecen la amplificación inespecífica de varias bandas. Esta
técnica detecta polimorfismo entre individuos cuando uno o los dos cebadores no se
hibrida porque existen diferencias en la secuencia complementaria a los cebadores
(Cushwa y Medrano, 1996). Las inserciones, deleciones o inversiones en el ADN
también generan polimorfismo por presencia/ausencia de bandas o variaciones en el
tamaño de éstas (Williams et al., 1990). La facilidad de realización, mediante
amplificación por PCR y análisis por electroforesis en gel de agarosa, la convierten en
una técnica fácil, rápida y de bajo coste.
Son muchos los trabajos en los que se ha utilizado este tipo de marcadores, y con
aplicaciones muy diversas, como su uso en análisis de variabilidad e identificación
varietal de diversas especies (Gogorcena et al., 1994; Howell et al., 1994; Warburton y
Bliss, 1996; Badenes et al., 1998; Quarta et al., 2000), y en construcción de mapas de
ligamiento en Prunus (Chaparro et al., 1994; Rajapakse et al., 1995; Dirlewanger et al.,
1996). Los RAPDs se han usado también para identificar marcadores ligados a
caracteres de interés, como los que determinan el color de la carne, la adherencia de ésta
al hueso y la textura del fruto en melocotonero (Warburton et al., 1996).
Los RAPDs, a diferencia de las isoenzimas y los RFLPs, son marcadores dominantes
en su mayoría, es decir, no se puede distinguir entre individuos homocigotos y
heterocigotos. Sólo se detecta un alelo, mientras que las demás variaciones alélicas son
clasificadas conjuntamente como un alelo nulo. El bajo contenido de la información
genética por locus constituye la principal desventaja de estos marcadores moleculares,
18

Capítulo 1
junto con los problemas de baja repetibilidad en los análisis (Benter et al., 1995;
Cushwa y Medrano, 1996).
3’5’
5’3’
5’ 3’3’ 5’
1
5’ 3’
3’ 5’
3’ 5’ 5’ 3’
5’ 3’3’ 5’
3’ 5’
+
2
3
5’ 3’
3’ 5’
5’
5’PP
3’
3’
5’ 3’ 5’ 3’3’ 5’
4
5’ 3’3’ 5’ +
3’5’5’3’
3’5’5’3’
3’5’ 3’5’5’3’ 5’3’
5’ 3’5’3’
3’5’5’3’
3’5’5’3’
3’5’5’3’
5’ 3’5’3’
3’5’5’3’
3’5’5’3’
3’5’5’3’
3’5’
5’3’
3’5’
5’3’
5’ 3’3’ 5’
1
5’ 3’
3’ 5’
3’ 5’ 5’ 3’
5’ 3’3’ 5’
3’ 5’
+
2
3
5’ 3’
3’ 5’
5’
5’PP
3’
3’
5’ 3’ 5’ 3’3’ 5’
4
5’ 3’3’ 5’ +
3’5’5’3’
3’5’5’3’
3’5’ 3’5’5’3’ 5’3’
5’ 3’5’3’
3’5’5’3’
3’5’5’3’
3’5’5’3’
5’ 3’5’3’
3’5’5’3’
3’5’5’3’
3’5’5’3’
5’ 3’3’ 5’5’ 3’3’ 5’
1
5’ 3’
3’ 5’
3’ 5’ 5’ 3’
5’ 3’3’ 5’
3’ 5’
+
2
3
5’ 3’
3’ 5’
5’
5’PP
3’
3’
5’ 3’ 5’ 3’3’ 5’
4
5’ 3’3’ 5’ +
5’ 3’
3’ 5’
3’ 5’ 5’ 3’
5’ 3’3’ 5’
3’ 5’
+
2
3
5’ 3’
3’ 5’
5’
5’PP
3’
3’
5’ 3’ 5’ 3’3’ 5’3’ 5’
44
5’ 3’5’ 3’3’ 5’3’ 5’3’ 5’ +
3’5’5’3’
3’5’5’3’
3’5’5’3’ 5’3’
3’5’5’3’ 5’3’
3’5’ 3’5’5’3’ 5’5’3’ 5’3’
5’ 3’5’3’
3’5’5’3’ 5’3’
3’5’5’3’ 5’3’
3’5’5’3’ 5’3’
5’ 3’5’3’ 5’3’
3’5’5’3’3’5’5’3’ 5’3’
3’5’5’3’ 5’3’
3’5’5’3’3’5’5’3’ 5’3’
Figura 1-2. Etapas de un ciclo de PCR (polymerase chain reaction)
1- Desnaturalización a 95°C.
2- Hibridación a 55°C.
3- Extensión a 72°C (P=Polimerasa).
4- El primer ciclo está completo. Las dos hebras de ADN obtenidas sirven para el
próximo ciclo para duplicar la cantidad de ADN.
19

Introducción general
1-5-2-1-3-2. AFLPs (Amplified Fragment Length Polymorphism / Polimorfismo de la
longitud de los fragmentos amplificados)
La técnica AFLP fue desarrollada por Vos et al. (1995). Esta técnica se basa en la
amplificación selectiva de fragmentos de DNA obtenidos tras la digestión con enzimas
de restricción. Este método combina por lo tanto, la especificidad proporcionada por la
digestión con enzimas, que reconocen secuencias específicas del genoma, con la rapidez
y facilidad de detección de polimorfismos mediante la amplificación por PCR.
Modificando los nucleótidos de selección en la zona de restricción, se amplifican grupos
de fragmentos específicos, por lo que el empleo de la técnica AFLP permite la
identificación de un número ilimitado de marcadores.
La aplicación de AFLPs en vid, ha permitido distinguir clones y variedades, por lo
que es una herramienta muy útil para la selección clonal (Ribaut et al., 1997; Cervera et
al., 1998; Scott et al., 2000). Se ha utilizado además para la elaboración de mapas
genéticos en melocotonero (Dirlewanger et al., 1998; Lu et al., 1998; Wang et al., 2000)
y para la obtención de marcadores asociados a caracteres de interés, como la resistencia
a nematodos en melocotonero (Lu et al., 1998). Numerosos estudios genéticos,
filogenéticos y de caracterización se han basado en AFLPs, como es el caso de estudios
en germoplasma de vid y de melocotonero (Fossati et al., 2001; Blenda et al., 2005) y
estudios de relaciones genéticas en albaricoquero japonés (Prunus mume Sieb. et Zucc.)
(Fang et al., 2006).
La ventaja más destacada de la técnica es el gran número de marcadores analizados
de forma simultánea en un único gel, y por tanto con un gran poder de detección de
variabilidad genética. La principal limitación de los marcadores AFLPs es el bajo
contenido de información genética por locus. Estos marcadores son dominantes y los
datos tienen naturaleza binaria (presencia/ausencia de un alelo), lo que limita su
utilización en campos donde se necesita identificar los loci a los que pertenecen las
bandas.
1-5-2-1-3-3. Microsatélites o SSRs (Sequence Simple Repeat / Secuencias simples
repetidas)
Los microsatélites son unas regiones del genoma de animales y plantas que consisten
en una serie de repeticiones de secuencias cortas (motivos) de nucleótidos, por ejemplo,
20

Capítulo 1
(CAC)n, (GACA) n, (TA) n, (GT) n, (GATA) n, etc. Estas regiones no son codificantes y
su origen y su función no están claros. Presentan la particularidad de que el número de
repeticiones de los motivos básicos que las constituyen es muy variable, y puede diferir
de un individuo a otro (Morgante y Olivieri, 1993). Por tanto, analizando estas regiones
es posible identificar individuos en poblaciones animales o vegetales. La forma más
sencilla de analizar la variación de las regiones de microsatélites es mediante la reacción
de PCR. Se sintetizan cebadores que son complementarios a las regiones flanqueantes
del microsatélite, y las diferencias en el número de repeticiones del motivo básico del
microsatélite se amplificarán y visualizarán como fragmentos de ADN de diferente
longitud (Figura 1-3). Cada una de las regiones microsatélites constituye un locus
genético y los diferentes tamaños de bandas que se pueden amplificar constituyen los
diversos alelos de ese locus (Ferreira y Grattapaglia, 1998).
Los SSR son muy frecuentes en el genoma y están distribuidos al azar, permitiendo
la más completa cobertura de cualquier genoma eucariota. Teniendo en cuenta la
expresión codominante y el multialelismo, los marcadores SSR son los que poseen el
más elevado contenido de información de polimorfismo, o PIC (Polymorphism
Information Content) en la terminología de marcadores moleculares. La técnica es muy
adecuada para estudios de paternidad, tanto en aplicaciones forenses humanas como en
mejora genética animal y vegetal, dado que los dos alelos que aparecen en un individuo
deben aparecer también en los dos presuntos parentales (Ferreira y Grattapaglia, 1998).
La reproducibilidad de los resultados entre laboratorios ha llevado, en el caso de la vid,
al desarrollo de bases de datos de referencia para todas las variedades (Sefc et al., 2000).
Esta comparación de datos se ve facilitada por el hecho de que los resultados de
microsatélites se expresan numéricamente, mediante el tamaño en pares de nucleótidos
de los dos alelos de cada locus. La complejidad técnica de los microsatélites es de nivel
medio. Dado que algunos alelos difieren únicamente en un nucleótido, hay que recurrir
a una separación electroforética de los mismos en gel de acrilamida y tinción mediante
nitrato de plata o mediante el secuenciador automático. El mayor inconveniente de los
microsatélites es que no están disponibles para todas las especies cultivadas. Requieren
un proceso laborioso de clonaje y secuenciación para determinar las secuencias
flanqueantes de las regiones microsatélites para cada especie, con el fin de diseñar los
cebadores adecuados. Muchos SSRs se han desarrollado en melocotonero y han dado
amplificaciones también en otras especies Prunus (Downey e Iezzoni, 2000; Serrano et
al., 2002; Romero et al., 2003; Zhebentyayeva et al., 2003). Los marcadores
21

Introducción general
desarrollados en melocotonero se han empleado para el estudio genético de esta especie,
así como en otras especies del género Prunus, principalmente para el análisis de la
diversidad genética, la identificación varietal y la construcción de mapas de ligamiento,
localizando caracteres de interés (Wünsch y Hormaza, 2002; Aranzana et al., 2003;
Vilanova et al., 2003).
A T A T A T A T A T A TA T A T A T A T A T A TA T A T A T A T A T A T
A T A T A T A T A TA T A T A T A T A TA T A T A T A T A TA T A T A T A T A T
A T A T A T A T
A T A T A T A TA T A T A T A TA T A T A T A T
Individuo I Individuo II
Alelo 1
Alelo 2
Alelo 1
Alelo 2
Locus I Locus I
Cebadores específicos para el locus I
AT es el motivo de nucleótidos repetido
Individuo I: Homocigoto en el locus IIndividuo II: Heterocigoto en el locus I
-
+
Revelación de las bandas en gel de agarosa
Individuo I Individuo II
Locus I
Individuo I: Homocigoto en el locus IIndividuo II: Heterocigoto en el locus I
-
+
Revelación de las bandas en gel de agarosa
Individuo I Individuo II
Locus I
-
+
Revelación de las bandas en gel de agarosa
Individuo I Individuo II
Locus I
Cebadores
Extracción de ADN
ADNMgCl2
dNTP
Agua
ADN polimerasa
Tampón
Preparación de la mezcla para PCR
Tejido joven de plantas en crecimiento
Cebadores
Extracción de ADN
ADNMgCl2
dNTP
Agua
ADN polimerasa
Tampón
Preparación de la mezcla para PCR
Reacción de amplificación de los microsatélites mediante la PCR
(AT)4
(AT)4
(AT)6
(AT)5
A T A T A T A T A T A TA T A T A T A T A T A TA T A T A T A T A T A T
A T A T A T A T A TA T A T A T A T A T
A T A T A T A T A T A TA T A T A T A T A T A TA T A T A T A T A T A T
A T A T A T A T A TA T A T A T A T A TA T A T A T A T A TA T A T A T A T A T
A T A T A T A T
A T A T A T A TA T A T A T A TA T A T A T A T A T A T A T A T A TA T A T A T A T A T
A T A T A T A T
A T A T A T A TA T A T A T A TA T A T A T A T
Individuo I Individuo II
Alelo 1
Alelo 2
Alelo 1
Alelo 2
Locus I Locus I
Cebadores específicos para el locus I
AT es el motivo de nucleótidos repetido
Individuo I: Homocigoto en el locus IIndividuo II: Heterocigoto en el locus I
-
+
Revelación de las bandas en gel de agarosa
Individuo I Individuo II
Locus I
Individuo I: Homocigoto en el locus IIndividuo II: Heterocigoto en el locus I
-
+
Revelación de las bandas en gel de agarosa
Individuo I Individuo II
Locus I
-
+
Revelación de las bandas en gel de agarosa
Individuo I Individuo II
Locus I
Cebadores
Extracción de ADN
ADNMgCl2
dNTP
Agua
ADN polimerasa
Tampón
Preparación de la mezcla para PCR
Tejido joven de plantas en crecimiento
Cebadores
Extracción de ADN
ADNMgCl2
dNTP
Agua
ADN polimerasa
Tampón
Preparación de la mezcla para PCR
Reacción de amplificación de los microsatélites mediante la PCR
(AT)4
(AT)4
(AT)6
(AT)5
Figura 1-3. Esquema del procedimiento de amplificación de los microsatélites en plantas y revelación del polimorfismo en SSRs mediante la PCR.
22
Capítulo 1
1-5-2-1-3-4. PCR-RFLP (Polymerase Chain Reaction-Restriction Fragment Length
Polymorphism / Reacción en cadena de la polimerasa – Polimorfismo en el tamaño
de los fragmentos de restricción)
Estos marcadores son codominantes y están generados por la combinación de
amplificaciones mediante la técnica de PCR y digestiones con enzimas de restricción.
Existen varios métodos para detectar polimorfismo después de una amplificación de
PCR. Uno de ellos, consiste en digerir los fragmentos amplificados con diversos
enzimas de restricción hasta encontrar un enzima que produzca un polimorfismo de
digestión. El polimorfismo así obtenido se conoce como PCR-RFLP o CAPS (Cleaved
Amplified Polymorphic Sequence) (Konieczny y Ausbel, 1993). Los productos
amplificados y digeridos con enzimas de restricción, son posteriormente separados en
geles de agarosa y visualizados con bromuro de etidio (Figura 1-4).
Esta técnica (PCR-RFLP) se ha utilizado para estudios filogenéticos en Prunus
(Badenes y Parfitt, 1995; Panda et al., 2003). Mohanty et al. (2001; 2002) utilizaron
también este método para determinar la filogeografía y la diversidad entre poblaciones
de ciruelo endrino (P. spinosa L.) y cerezo (P. avium L.).
23
Introducción general
A AB BC C
Sin digerir Digerido
A AB BC C
Sin digerir Digerido
A AB BC C
Sin digerir Digerido
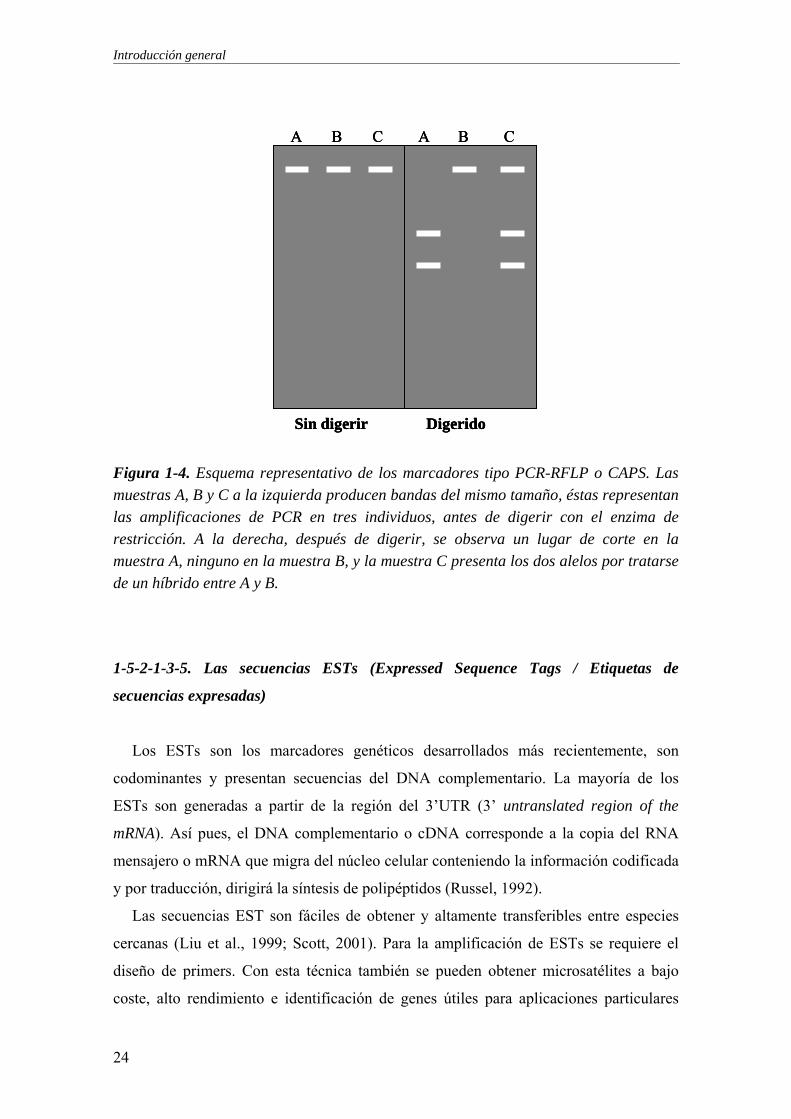
Figura 1-4. Esquema representativo de los marcadores tipo PCR-RFLP o CAPS. Las muestras A, B y C a la izquierda producen bandas del mismo tamaño, éstas representan las amplificaciones de PCR en tres individuos, antes de digerir con el enzima de restricción. A la derecha, después de digerir, se observa un lugar de corte en la muestra A, ninguno en la muestra B, y la muestra C presenta los dos alelos por tratarse de un híbrido entre A y B.
1-5-2-1-3-5. Las secuencias ESTs (Expressed Sequence Tags / Etiquetas de
secuencias expresadas)
Los ESTs son los marcadores genéticos desarrollados más recientemente, son
codominantes y presentan secuencias del DNA complementario. La mayoría de los
ESTs son generadas a partir de la región del 3’UTR (3’ untranslated region of the
mRNA). Así pues, el DNA complementario o cDNA corresponde a la copia del RNA
mensajero o mRNA que migra del núcleo celular conteniendo la información codificada
y por traducción, dirigirá la síntesis de polipéptidos (Russel, 1992).
Las secuencias EST son fáciles de obtener y altamente transferibles entre especies
cercanas (Liu et al., 1999; Scott, 2001). Para la amplificación de ESTs se requiere el
diseño de primers. Con esta técnica también se pueden obtener microsatélites a bajo
coste, alto rendimiento e identificación de genes útiles para aplicaciones particulares
24

Capítulo 1
(Liu, 2003). La desventaja de las EST es que el aislamiento del RNAm es más
complicado. Por otro lado, los intrones que pueden contener información genética no
expresada, no forman parte del cDNA.
Las aplicaciones de los EST se basan en el hecho de que se originan a partir de
segmentos de secuencias génicas y permiten, por consiguiente, la comparación de la
diversidad génica en diferentes organismos, el estudio de la evolución génica, la
búsqueda de supuestos ortólogos en bases de datos, la concepción de sondas para
estudios de expresión génica, y la detección de SNPs (Single Nucleotide
Polymorphisms).
1-5-2-1-3-6. SNPs (Single Nucleotide Polymorphism / Polimorfismo en un solo
nucleótido)
Los SNPs son el reflejo de los cambios que pueden presentarse en el material
hereditario a lo largo de la historia evolutiva de una especie. Estos cambios pueden
identificarse en las secuencias del DNA y proveen información acerca de la historia
evolutiva de las poblaciones humanas (Wang et al., 1998). Un SNP se presenta cuando
existe la sustitución de un solo nucleótido por otro en una región específica del material
genético, que puede pertenecer a un gen, el cual codificará una cadena polipeptídica con
características diferentes a la cadena original y, a su vez, presentará un posible cambio
en el fenotipo (Vignal et al., 2002). Este tipo de variaciones puede formar parte de la
región no codificante del gen, como podría ser un intrón o un espacio intergénico, pero
cuya presencia puede asociarse con una característica específica. Cabe mencionar
también que los SNPs tienen una gran importancia en la identificación y etiología de
diversas enfermedades.
El material genético puede presentar cambios en sus constituyentes, los nucleótidos
de adenina (A), guanina (G), citosina (C) y timina (T), presentes en una secuencia
cualquiera, pueden variar constituyendo esencialmente una mutación. En la secuencia
ATTCAGGAC puede presentarse la variante ATTCAGGCC, en la cual el nucleótido
resaltado muestra ese cambio (Figura 1-5). Si al comparar varias muestras con la misma
secuencia general, se encuentra que este cambio es frecuente, es posible utilizarlo como
un marcador genético. Ésta es la forma más común en que se presentan los SNPs. La
frecuencia de distribución de los SNPs varía en cada genoma. En maíz, por ejemplo, se
ha detectado 1 SNP por cada 60-120 pb (Ching et al., 2002), mientras que en el genoma
25
Introducción general
humano, se ha detectado 1 SNP por cada 1000 pb (Sachidanandam et al., 2001). El
desarrollo de los marcadores de tipo SNP es extremadamente caro porque se basa en la
secuenciación extensiva del genoma. Además de la secuenciación, otros métodos de
detección de SNPs incluyen otras técnicas, como la PCR alelo-específica (Newton et al.,
1989). La utilización de estos marcadores en plantas está todavía limitado a algunas
especies, como Arabidopsis (Drenkard et al., 2000), tomate (Fridman et al., 2000), maíz
(Tenaillon et al., 2001), albaricoquero japonés (Prunus. mume Sieb. et Zucc.) (Fang et
al., 2006). Los SNPs se detectaron por primera vez en especies forestales (Le Dantec et
al., 2004), y fueron utilizados para el análisis de las relaciones filogenéticas en Citrus
por Novelli et al. (2004).
Interpretación de los SNPs
GTCATAGCATTATTATT ATTATT ATTCAGGACTA
CAGTATCGTAATAATAATAATAATAAGTCCTGAT
3’
3’ 5’
5’
GTCATAGCATTATTATT ATTATT ATTCAGGCCTA
CAGTATCGTAATAATAATAATAATAAGTCCGGAT
3’ 3’ 5’
5’
34 bp 15 bp 1 bp
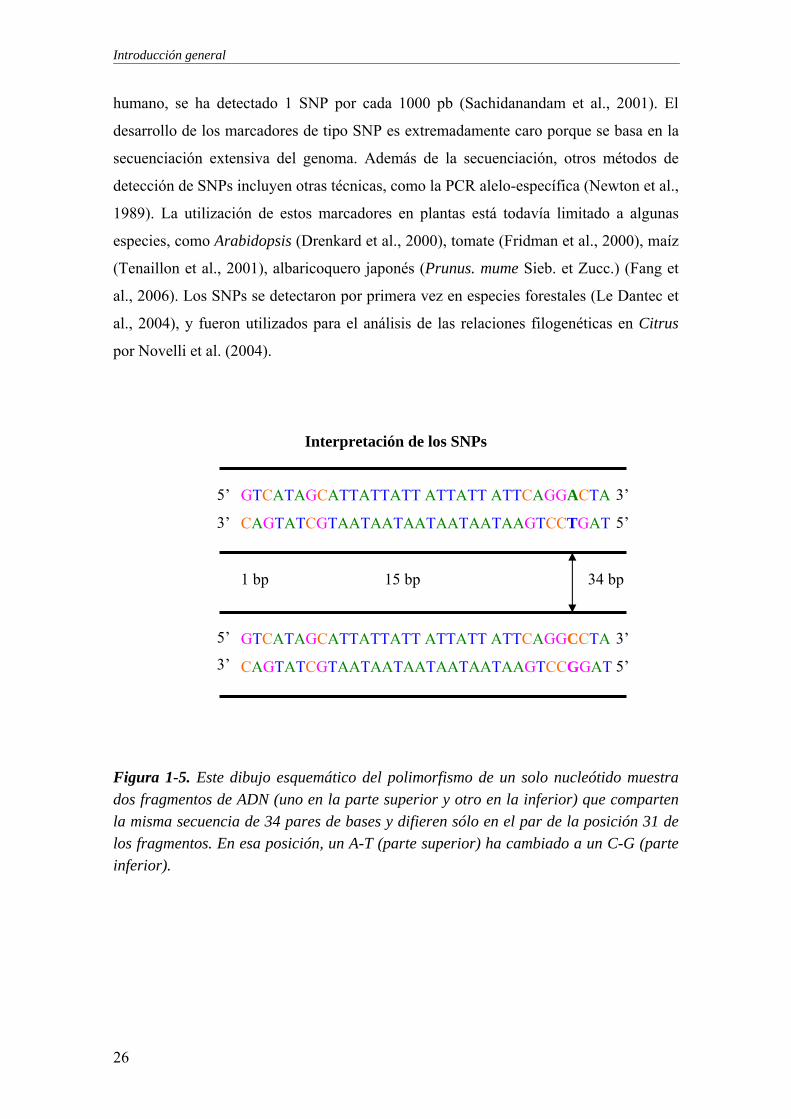
Figura 1-5. Este dibujo esquemático del polimorfismo de un solo nucleótido muestra dos fragmentos de ADN (uno en la parte superior y otro en la inferior) que comparten la misma secuencia de 34 pares de bases y difieren sólo en el par de la posición 31 de los fragmentos. En esa posición, un A-T (parte superior) ha cambiado a un C-G (parte inferior).
26
Capítulo 1
1-6. MÉTODOS DE ANÁLISIS DE LOS DATOS MOLECULARES
Los perfiles electroforéticos se pueden estudiar desde dos puntos de vista, cualitativo
o cuantitativo. El estudio cualitativo (presencia o ausencia de bandas) se utiliza para
determinar la similitud genética entre individuos. El estudio cuantitativo (intensidad de
banda) permite revelar diferencias en actividad enzimática o en expresión génica. La
similitud genética, obtenida tras la aplicación de técnicas de taxonomía numérica a los
datos obtenidos (Crisci y López-Armengol, 1983; Romesburg, 1984), nos va a permitir
conocer una estimación de la distancia genética entre los individuos bajo estudio. Los
marcadores moleculares, tras la separación electroforética, son detectados como bandas.
A partir de la información presentada por los perfiles electroforéticos, se obtienen unos
datos binarios o de doble estado para cada carácter (banda) por genotipo, donde la
presencia de una banda concreta se codifica como “1” y la ausencia de esta banda se
codifica como “0”. Este tipo de datos se obtiene, en general, con el uso de marcadores
dominantes. En el caso del uso de marcadores codominantes, en especies diploides, los
datos tomados de los perfiles electroforéticos son de triple estado, presencia de una
banda (individuo homocigoto) y se codifica como “1”, presencia de dos bandas
(individuo heterocigoto) se codifica como ”0,5”, o ausencia de bandas se codifica como
“0”. A este último tipo de codificación de las bandas se denomina datos de frecuencia
génica.
Con los datos obtenidos se construye una matriz básica de datos binarios (0/1) o
matriz de frecuencias alélicas (0/0,5/1). Una matriz de distancias genéticas se obtiene a
partir de la matriz básica, aplicando coeficientes de similitud que cuantifiquen la
similitud genética.
Cuando disponemos de datos binarios de doble estado (presencia o ausencia), se
calcula la similitud genética utilizando varios coeficientes de asociación, cuyos valores
oscilan entre 1 (máxima similitud) y 0 (mínima similitud). Como ejemplos, se pueden
citar:
- El coeficiente Simple “Simple Matching Coefficient” (Gower, 1985)
- El coeficiente de Jaccard (Jaccard, 1908)
- El coeficiente de Rogers y Tanimoto (1960)
- El coeficiente de Dice o Nei y Li (1979)
27

Introducción general
El coeficiente más adecuado para realizar estudios genéticos es el de Nei y Li
(1979), por presentar ventajas sobre los otros (Lamboy et al., 1994). Este coeficiente
tiene un significado biológico claro, es una estimación de la similitud entre dos
muestras que son heredadas de un ancestro común. Además, es el coeficiente que
presenta menos sesgo entre el valor real y el valor estimado cuando hay falsos positivos
o falsos negativos en los datos.
Cuando se dispone de datos de triple estado (0/0,5/1), se calcula la similitud genética
utilizando varios coeficientes de asociación, cuyos valores oscilan también entre 1
(máxima similitud) y 0 (mínima similitud). Se pueden citar:
- El coeficiente de Nei (1972)
- El coeficiente de Swofford-Olsens (1990)
- El coeficiente de Rogers (1972)
- El coeficiente de Prevosti (Wright, 1978)
El coeficiente más utilizado por los genetistas, en el caso de datos en frecuencias
alélicas, es el coeficiente de Nei 1972 (Swofford y Olsen, 1990).
La matriz de similitud o de distancias genéticas expresa las relaciones entre la
totalidad de los individuos estudiados, de par en par. Para observar las relaciones se
necesita sintetizar la información de la matriz de similitud o de distancias genéticas,
aplicando las técnicas del “análisis de agrupamiento” o del “método de ordenación”. De
esta forma se pueden observar gráficamente mediante un diagrama arborescente
denominado “dendrograma”, las relaciones genéticas entre los individuos con el grado
de similitud entre sí.
Existen diferentes métodos de ordenación y se pueden citar como ejemplos:
Métodos ultramétricos: UPGMA
El método de reconstrucción filogenética UPGMA (Unweight Pair Group Arithmetic
Average) se basa en las medias aritméticas y produce un árbol ultramétrico. A partir de
la matriz de distancias entre los taxones en estudio, éstos se van a ir uniendo unos a
otros por pares, comenzando por los que están a la mínima distancia (Sneath y Sokal,
1973).
28

Capítulo 1
Métodos aditivos: NJ (Neighbor Joining)
El método de Neighbor-Joining (NJ) fue desarrollado por Saitou y Nei (1987). Para
aplicar este método, se parte de una matriz de distancias genéticas original que se
transforma en una matriz de distancias modificadas, en la cual la separación entre cada
par de taxones es reajustada en base a su divergencia media con todos los demás
taxones. Se unen los dos taxones más próximos (mínima distancia), que forman un
nudo, y se construye una nueva matriz de distancias con ese nudo sustituyendo a los dos
taxones y reajustando nuevamente todos los valores. Se prosigue de forma sucesiva,
creando sucesivos nudos, hasta incorporar todos los taxones.
Existen numerosos programas informáticos para evaluar la diversidad genética y
representar árboles o dendrogramas. Como ejemplos: se pueden citar el programa
PHYLIP (Felsenstein, 1993) aplicado en trabajos de análisis de diversidad en olivo
(Angiolillo et al., 1999); el programa Arlequín (Schneider et al., 2000) utilizado para el
análisis de variabilidad en especies de Prunus (Schueler et al., 2006), el programa
MEGA (Kumar et al., 1993) utilizado por Aranzana et al. (2003) en estudios de
variabilidad en melocotonero; GENEPOP (Raymond y Rousset, 1995) aplicado por
Sefc et al. (2000) para cálculos de los parámetros de variabilidad en los microsatelites
de vid. El programa NTSYS (Rohlf, 2000) es el programa más comúnmente utilizado
por distintos grupos de trabajo en estudios de caracterización y diversidad genética en
plantas (Mekuria et al., 1999; Lerceteau y Szmidt, 1999; Warburton et al., 2002;
Aranzana et al., 2003), y es el programa que se utilizó para los análisis en esta tesis.
Para estudios de las relaciones filogenéticas entre organismos o especies se utiliza la
cladística que es una rama de la biología que define las relaciones evolutivas entre los
organismos basándose en similitudes derivadas. Es la más importante de las
sistemáticas filogenéticas, que estudian las relaciones evolutivas entre los organismos.
La cladística es un método de análisis riguroso que utiliza las "propiedades derivadas
compartidas" de los organismos que se están estudiando. El análisis cladístico forma la
base de la mayoría de los sistemas modernos de clasificación biológica, que buscan
agrupar a los organismos por sus relaciones evolutivas. En contraste, la fenética agrupa
los organismos basándose en su similitud global.
29

Introducción general
Como resultado final del análisis cladístico, se obtienen diagramas de relación en
árbol llamados "cladogramas", para mostrar las distintas hipótesis sobre las relaciones.
Un análisis cladístico puede basarse en tanta información como el investigador
seleccione. La investigación sistemática moderna suele basarse en una gran variedad de
información, incluyendo secuencias de ADN (datos moleculares), datos bioquímicos y
datos morfológicos.
Para este tipo de análisis y representaciones de árboles genealógicos se utiliza
principalmente el programa PAUP de Swofford (2002) que se aplicó en estudios
filogenéticos en Prunus (Bortiri et al., 2001; Katayama y Uematsu, 2005).
REFERENCIAS
Agustí, M. 2004. Fruticultura. Mundi-prensa, Madrid, Spain, pp. 493.
Angiolillo, A., Mencuccini, M. and Baldón, L. 1999. Olive genetic diversity assessed
using amplified fragment length polymorphisms. Theor. Appl. Genet. 98: 411-421.
Arulsekar, S., Parfitt, D.E. and Kester, D.E. 1986. Comparison of isozyme variability
in peach and almonds cultivars. J. Hered. 77: 272-274.
Aranzana, M., Carbó, J. and Arús, P. 2003. Microsatellite variability in peach [Prunus
persica (L.) Batsch]: cultivar identification, marker mutation, pedigree inferences
and population structure. Theor. Appl. Genet. 106: 1341-1352.
Badenes, M.L. and Parfitt, D.E. 1995. Phylogenetic relationships of cultivated Prunus
species from an analysis of chloroplast DNA variation. Theor. Appl. Genet. 90:
1035-1041.
Badenes, M.L., Werner, D.J., Martinez-Calvo, J. and Llácer, G. 1998. A description of
peach native populations from Spain. Fruit Varieties Journal, 52: 80-86.
Battistini, S. and Sansavini, S. 1991. Electrophoretic analysis of isozyme variability in
apricot cultivars. J. Genet. Breed. 45: 117-122.
Benter, T., Papadopoulos, S., Pape, M., Manns, M. and Poliwoda, H. 1995.
Optimization and reproducibility of random amplified polymorphic DNA in human.
Anal. Biochem. 230: 92-100.
Bentham, G. and Hooker, J.D. 1865. Genera Plantarum, vol. 1. Reeve & Co., London,
UK.
Betrán, J.A., Val, J., Montañés Millán, L., Montañés, L., Monge, E. and Moreno, M.A.
30
Capítulo 1
1997. Influence of rootstock on the mineral concentrations of flowers and leaves
from sweet cherry. Acta Horticulturae, 448: 163-167.
Blenda, A.V., Wechter, W.P., Reighard, G.L., Baird, W.V. and Abbott, A.G. 2006.
Development and characterization of diagnostic AFLP markers in Prunus persica for
its response to peach tree short life syndrome. J. Hort. Sci. Biotech. 81:281-288.
Botstein, D., White, R.L., Skolnick, M. and Davis R.W. 1980. Construction of a genetic
linkage map in man using restriction fragment length polymorphisms. Am. J. Hum.
Genet. 32: 314-331.
Bortiri, E., Oh, S.H., Jiang, J., Baggett, S., Granger, A., Weeks, C., Buckingham, M.,
Potter, D. and Parfitt, D. 2001. Phylogeny and systematics of Prunus (Rosaceae) as
determined by sequence analysis of ITS and the chloroplast trnL-trnF spacer DNA.
Syst. Bot. 26: 797–807.
Byrne, D.H. 1988. Comparative growth of two peach seedling rootstocks under alkaline
soil conditions. J. Plant Nutr. 11: 1663-1669.
Cambra, R. 1990. Adafuel, an almond x peach hybrid rootstock. HortScience. 25: 584.
Caruso, T., Giovannini, D. and Liverani, A. 1996. Rootstock influences the fruit
mineral, sugar and organic acid content of a very early ripening peach cultivar. J.
Hort. Sci. 72: 931-937.
Castle, W.S. 1995. Rootstock as a fruit quality factor in Citrus and deciduous tree
crops. New Zealand J. Crop Hort. Sci. 23: 383-394.
Cerezo, M., Socias, R. and Arús, P. 1989. Identification of almond cultivars by pollen
isozymes. J. Amer. Soc. Hort. Sci. 114: 164-169.
Cervera, M.T., Cabezas, J.A., Sancha, J.C., Martínez-de-Toda, F. and Martínez-
Zapater, J.M. 1998. Application of AFLPs to the characterization of grapevine Vitis
vinifera L. genetic resources. A case study with accessions from Rioja (Spain).
Theor. Appl. Genet. 97: 51-59.
Chaparro, J.X., Werner, D.J., O’Malley, D.O. and Sederoff, R.R. 1994. Targeted
mapping and linkage analysis of morphological isozyme, and RAPD markers in
peach. Theor. Appl. Genet. 87: 805-815.
Ching, A., Caldwell, K.S., Jung, M., Dolan, M., Smith, O.S., Tingey, S., Morgante, M.
and Rafalski, A.J. 2002. SNP frequency, haplotype structure and linkage
disequilibrium in elite maize inbred lines. BMC Genet. 3: 1-19.
Crisci, J.V. and López, M.F. 1983. Introducción a la teoría y práctica de la taxonomía
numérica. Washington, D.C., O. E. A. Secretaría General, pp. 133.
31
Introducción general
Cushwa, W. and Medrano, J.F. 1996. Applications of the random amplified polymorphic
DNA (RAPD) assay for genetic analysis of livestock species. Animal Biotechnology, 7:
11-31.
De Salvador, F.R., Di Tommaso, G. and Piccioni, C. 2005. Performance of new and
standard cherry rootstocks in different soils and climatic conditions. Acta
Horticulturae, 667: 191-199.
De Tournefort, J.P. 1700. Institutiones Rei Herbariae, 1st ed. Paris, France.
De Vicente, M.C., Truco, M.J., Egea, J., Burgos, L. and Arús, P. 1998. RFLP
variability in apricot (Prunus armeniaca L.). Plant Breed. 117: 153-158.
Dirlewanger, E., Pascal, T., Zuger, C. and Kervella, J. 1996. Analysis of molecular
markers associated with powdery mildew resistance genes in each (Prunus persica
(L.) Batsch) x Prunus davidiana hybrids. Theor. Appl. Genet. 93: 909-919.
Dirlewanger, E., Pronier, V., Parvey, C., Rothan, C., Guye, A. and Monet, R. 1998.
Genetic linkage map of peach [Prunus persica (L.)] Batsch using morphological and
molecular markers. Theor. Appl. Genet. 97: 888-895.
Dosba, F., Bernhard, R. and Zanetto, A. 1994. Importance des ressources génétiques
des Prunus. CR Acad. Agri. Fr. 80: 45-57.
Downey, S.L. and Iezzoni, A.F. 2000. Polymorphic DNA markers in black cherry
(Prunus serotina) are identified using sequences from sweet cherry, peach and sour
cherry. J. Amer. Soc. Hort. Sci. 125: 76-80.
Drenkard, E., Richter, B.G., Rozen, S. L., Stutius, M., Angell, N.A., Mindrinos, M.,
Cho, R.J., Oefner, P.J., Davis R.W. and Ausubel, F.M. 2000. A simple procedure for
the analysis of single nucleotide polymorphisms facilitates map-based cloning in
Arabidopsis. Plant Physiol. 124: 1483-1492.
Durner, E.F. and Goffreda, J.C. 1992. Rootstock-induced differences in flower bud
phenology in peach. J. Amer. Soc. Hort. Sci.., 117: 690-697.
Edin, M. and Garcin, A. 1994. Un nouveau porte-greffe du pêcher Cadaman® Avimag.
L'Arboriculture Fruitière, 475: 20-23.
Fang, J., Twito, T., Zhang, Z. and Chao, C.T. 2006. Genetic relationships among
fruiting-mei (Prunus mume Sieb. et Zucc.) cultivars evaluated with AFLP and SNP
markers. Genome, 49: 1256-1264
FAOSTAT (2006). www.fao.org.
Felipe, A. 1989. Patrones para Frutales de Pepita y Hueso. Ediciones Técnicas
Europeas, Barcelona, Spain, pp. 181.
32
Capítulo 1
Felsenstein, J. 1993. Phylip (phylogeny inference package) version 3.5c. Technical
report, Department of Genetics, University of Washington, Seattle.
Ferreira, M.E. and Grattapaglia, D. 1998. Introducción al Uso de Marcadores
Moleculares en el Análisis Genético. 1 ed. Brasília: EMBRAPA-CENARGEN, 1998.
pp. 220.
Fossati, T., Labra, M., Castiglione, S., Faila, O., Scienza, A. and Sala, F. 2001. The use
of AFLP and SSR molecular markers to decipher homonyms and synonims in
grapevine cultivars: the case of the varietal group known as « Schiave ». Theor.
Appl. Genet. 102: 200-205.
Fridman, E., Pleban and T., Zamir, D.2000. A recombination hotspot delimits a wild-
species quantitative trait locus for tomato sugar content to 484 bp within an invertase
gene. Proc Natl Acad Sci USA 97(9): 4718-4723.
García, A.L., Gallego, J., Fuentes, V., Nicolas, N., Madrid, R. 2005. Mineral nutrition
of Prunus rootstocks: Leaf concentration and diagnosis by vector analysis.
HortScience, 40: 1670-1674.
Garner, R.J. 2003. The Grafter's Handbook. The royal Horticultural Society and
Sterling Publishing Co., Inc., New York, USA (6th edition), pp. 323.
Giorgi, M., Capocasa, F., Scalzo, J., Murri, G., Battino, M. and Mezzetti, B. 2005. The
rootstock effects on plant adaptability, production, fruit quality, and nutrition in
peach (cv. 'Suncrest'). Scientia Horticulturae, 107: 36-42.
Gogorcena, Y., Arulsekar, S., Dandekar, A.M. and Parfitt, D.E. 1993. Molecular
markers for grape characterization. Vitis, 32: 183-185.
Gogorcena, Y. and Parfitt, D.E. 1994. Evaluation of RAPD marker consistency for
detection of polymorphism in apricot. Scientia Horticulturae, 59: 163-167.
Gower, J.C. 1985. Measures of similarity, dissimilarity and distance.. In: N.L. Johnson,
S. Kotz, and C.B. Read, editors. Encyclopedia of Statistics, volume 5. John Wiley &
Sons, New York, New York, USA. pp 397-405
Grodzicker, T., Williams, J., Sharp, P. and Sambrook, J. 1974. Physical mapping of
temperature-sensitive mutations of adenoviruses. Cold Spring Harbor Symp. Quant.
Biol. 1974. 39: 439-446.
Guerriero, R., Loreti, F., Massai, R. and Morini, S. 1984. Comparative trials of several
clonal plums peach seedlings and hybrids tested as peach rootstocks. Acta
Horticulturae, 173: 211-222.
33

Introducción general
Hemmat, M., Weeden, N.F., Manganaris, A.G. and Lawson, D.M. 1994. Molecular
marker linkage map for apple. J. Hered. 85: 4-11.
Hesse, C. D. 1975. Peaches. In: Janick, J. and Moore, J.N. (Eds). Advances in Fruit
Breeding. West Lafayette: Purdue University Press, pp. 282-355.
Howard, 1987. Propagation. In: Rom R.C. and R.F. Carlson (Eds). Rootstocks for Fruit
Crop. John Wiley & Sons. New York, USA.pp. 29-77.
Howell, G.S. 1987. Vitis rootstocks. In: Rom R.C. and R.F. Carlson (Eds). Rootstocks
for Fruit Crop. John Wiley & Sons, New York, USA, pp. 451-472.
Howell, E.C., Newbury, H.J., Swennen, R.L., Withers, L.A. and Ford-Lloyd B.V. 1994.
The use of RAPD for identifying and classifying Musa germplasm. Genome, 37:
328-332.
Hunter, R.L. and Market, C.L. 1957. Histochemical demonstration of enzymes
separated by zone electrophoresis in starch gels. Science, 125: 1294-1295.
Ingram, C. 1948. Ornamental cherries. Country Life Limited. London. UK.
Jaccard, P. 1908. Nouvelles recherches sur la distribution florale. Bull. Soc. Vaud. Sci.
Natl. 44: 223-270.
Jiménez, S., Garín, A., Albás, E.S., Betrán, J.A., Gogorcena, Y. and Moreno, M.A.
2004. Effect of several rootstocks on the fruit quality of 'Sunburst' sweet cherry. Acta
Horticulturae, 658: 353-358.
Katayama, H. and Uematsu, C. 2005. Structural analysis of chloroplast DNA in Prunus
(Rosaceae): evolution, genetic diversity and unequal mutations. Theor. Appl. Genet.
111: 1430-1439.
Koehne, E. 1893. Deutsche dendrology, Stuttgart: Verlag von Ferdinand Enke.
Koehne, E. 1911. Die Gliederung von Prunus subgen. Padus. Verhandhunben des
botanischen Vereins der Provinz Brandenburg. Berlin, 52: 101-108.
Konieczny, A. and Ausubel, F.M. 1993. A procedure for mapping Arabidopsis
mutations using codominant ecotype-specific PCR-based markers. Plant J. 4: 403-
410.
Krüssman, G. 1976. Manual of cultivated broad-leaved Trees and Shrubs. Timber
press, Beaverton, OR.
Kumar, S., Tamura, K. and Nei, M. 1993. MEGA: molecular evolutionary genetics
analysis software, version 1.0. The Pennsylvania State University, University Park,
Pennsylvania.
34

Capítulo 1
Lamboy, W.F. 1994. Computing genetic similarity coefficients from RAPD data: The
effects of PCR artefacts. PCR Methods and Applications, 4: 31-37.
Lang, G., Howell, W., Ophardt, D. and Mink, G. 1997. Biotic and abiotic responses of
interespecific hybrid cherry rootstocks. Acta Horticulturae, 451: 217-224.
Lang, G. and Howell, W. 2001. Lethal sensitivity of some new cherry rootstocks to
pollen-borne viruses. Acta Horticulturae, 557: 151-154.
Le Dantec, L., Chagné, D., Pot, D., Cantin, O., Garnier-Géré, P., Bedon, F., Frigerio,
J.M., Chaumeil, P., Léger, P., Garcia, V., Laigret, F., de Daruvar, A. and Plomion,
C. 2004. Automated SNP detection in expressed sequence tags: Statistical
considerations and application to maritime pine sequences. Plant Mol. Biol. 54: 461-
470.
Leitao, J.M., Elisiario, P.J., Cabrita, L.F., Justo, E.M., Pereira, G.M., Carlier, J.D.,
Farinho, M.J., Van der Plas, L.H.W., Vanderleyden, J. and de Loose, M. 2000.
Molecular markers in genetic variability assessment, cultivar fingerprinting and
hybrid identification in fruit and vegetables. Acta Horticulturae, 521: 185-192.
Lerceteau, E. and Szmidt, A.E. 1999. Properties of AFLP markers in inheritance and
genetic diversity studies of Pinus sylvestris L. Heredity, 82: 252-260.
Liu, Z. 2003. Research project: Channel catfish Molecular Markers: project 640231000-
005-065. Aurbun University.
Liu, Z., Karsi, A. and Dunham, R.1999. Development of Polymorphic EST markers
suitable for genetic linkage map of catfish. Marine Biotechnology, 1: 465-476.
Lu, Z.X., Sosinski, B., Reighard, G.L., Baird, W.V. and Abbot, A.G. 1998.
Construction of a genetic linkage map and identification of AFLP markers for
resistance to root-knot nematodes in peach rootstocks. Genome, 41: 199-207.
Manganaris, A.G., Karayiannis, I. and Nianiou, E. 1999. Polymorphism and genetic
studies of isozymes in apricots. Acta Horticulturae, 488: 303-307.
Mekuria, G.T., Collins, G.G. and Sedgley, M. 1999. Genetic variability between
different accessions of some common commercial olive cultivars. J. Hort. Sci.
Biotech. 74: 309-314.
Messeguer, R., Arús, P. and Carrera, M. 1987. Identification of peach cultivars with
pollen isozymes. Scientia Horticulturae, 31: 107-117.
Mohanty, A., Martín, J.P. and Aguinagalde, I. 2001. A population genetic analysis of
chloroplast DNA in wild populations of Prunus avium L. in Europe. Heredity, 87:
421-427.
35

Introducción general
Mohanty, A., Martín, J.P. and Aguinagalde, I. 2002. Population genetic analysis of
European Prunus spinosa (Rosaceae) using chloroplast DNA markers. Am. J. Bot.
89: 1223-1228.
Moreno, M.A. and Cambra, R. 1994. Adarcias, an almond x peach hybrid rootstock.
HortScience. 29: 925.
Moreno, M.A., Adrada, R., Aparicio, J. and Betrán, J.A. 2001. Performance of
'Sunburst' sweet cherry grafted on different rootstocks. J. Hort. Sci. Biotech. 76: 167-
173.
Morgante, M. and Olivieri, A.M., 1993. PCR-amplified microsatellites as markers in
plant genetics. Plant J. 3: 175-182.
Mullis, K. and Faloona, F. 1987. Specific synthesis of DNA in vitro via a polymerase
catalysed chain reaction. Methods Enzymol. 55: 335-350.
Murphy, R.W., Sites, J.W.Jr., Buth, D.G. and Haufler, C.H. 1990. Proteins I: isozyme
electrophoresis. In: Molecular Systematics. Hillis, D.M & Moritz, C. (Eds). Sinauer
Associates, Sunderland MA.pp.45-126.
Nei, M. 1972. Genetic distance between populations. Amer. Natl. 106: 283-292.
Nei, M. and Li, W.H. 1979. Mathematical model for studying genetic variation in terms
of restriction endonucleases. Proc. Natl. Acad. Sci. USA, 76: 5269-5273.
Novelli, V.M., Takita, M.A. and Machado, M.A. 2004. Identification and analysis of
single nucleotide polymorphisms (SNPs) in citrus. Euphytica, 138: 227-237.
Newton, C.R., Graham, A., Heptinstall, L.E., Powell, S.J., Summers, C., Kalsheker, N.,
Smith, J.C. and Markham, A.F. 1989. Analysis of any point mutation in DNA. The
amplification refractory mutation system (ARMS). Nucl. Acids Res. 17: 2503-2516.
Okie, W.R. 1987. Plum rootstocks. In: Rom R.C. and R.F. Carlson (Eds). Rootstocks
for Fruit Crop. John Wiley and Sons, New York, USA, pp. 321-360.
Panda, S., Martín, J.P. and Aguinagalde, I. 2003. Chloroplast DNA study in sweet
cherry cultivars (Prunus avium L.) using PCR-RFLP method. Plant Breed. 122: 92-
94.
Pinochet, J., Calvet, C., Hernández-Dorrego, A., Bonet, A., Felipe, A. and Moreno,
M.A. 1999. Resistance of peach and plum rootstocks from Spain, France, and Italy to
rootknot nematode Meloidogyne javanica. HortScience, 34: 1259-1262.
Quarta, R., Dettori, M.T., Verde, I., Marchesi, U. and Palombi, A. 2000.
Characterization and evaluation of genetic diversity in peach germplasm using
RAPD and RFLP. Acta Horticulturae, 546: 489-496.
36
Capítulo 1
Rajapakse, S., Belthoff, L.E., He, G., Estager, A.E., Scorza, R., Verde, I., Ballard,
R.E., Baird, W.V., Callahan, A., Monet, R. and Abbott, A.G. 1995. Genetic linkage
mapping in peach using morphology, RFLP and RAPD markers. Theor. Appl. Genet.
90: 503-510.
Raymond, M. and Rousset, F. 1995. GENEPOP (Version 1.2): population genetics
software for exact tests and ecumenicism. J. Hered. 86: 248-249.
Rehder, A. 1940. A manual of cultivated trees and shrubs hardy in North American
exclusive of the subtropical and warmer temperate regions, 2nd edn. Macmillan,
New York, USA.
Ribaut, J.M., Thome, J., This, P., Gaitan, E., Clot, B., Perotti, E., Kupfer, P. 1997.
AFLP: A powerful tool to identify polymorphisms in grapevine among both cultivars
and clones, Plant & Animal Genome Conference V 1997, San Diego, California,
Estados Unidos.
Rogers, J.S. 1972. Measures of genetic similarity and genetic distance. Studies in
Genetics VII. Univ Texas Publ. 7213: 145-153.
Rogers, D.G. and Tanimoto, T.T. 1960. A computer program for classifying plants.
Science, 132: 1115-1118.
Rohlf, F.J. 2000. NTSYS-pc Numerical Taxonomy and Multivariate Analysis System.
Version 2.1. Exeter Software, Setauket, NY.
Romero, C., Pedryc, A., Muñoz, V., Llácer, G. and Badenes, M.L. 2003. Genetic
diversity of different apricot geographical groups determined by SSR markers.
Genome, 46: 244-252.
Romesburg, H.C. 1984. Cluster analysis for researchers. Wadswoth Inc. California.
Royo, R., Miranda, S., Chocarro, A. and González, J. 1994. Identificación varietal en
árboles frutales. Métodos aplicables. Fruticultura Profesional, 65: 30-37.
Royo, R., Cabello, F., Miranda, S., Gogorcena, Y., González, J., Moreno, S. Itoiz, R.
and Ortiz J.M. 1997. The use of isoenzymes in characterization of grapevines (Vitis
vinifera, L.). Influence of the environment and time of sampling. Scientia
Horticulturae, 69: 145-155.
Russel, P. 1992. Genetics, 3rd edition. Harper Collins Publishers.
Sachidanandam, R., Weissman, D., Schmidt, S.C., Kakol, J.M., Stein, L.D., Marth, G.,
Sherry, S., Mullikin, J.C., Mortimore, B.J., Willey, D.L., Hunt, S.E., Cole, C.G.,
Coggill, P.C., Rice, C.M., Ning, Z., Rogers, J., Bentley, D.R., Kwok, P.Y., Mardis,
E.R., Yeh, R.T., Schultz, B., Cook, L., Davenport, R., Dante, M., Fulton, L. Hillier,
37
Introducción general
L., Waterston, R.H., McPherson, J.D., Gilman, B., Schaffner, S., Van Etten, W.J.,
Reich, D., Higgins, J., Daly, M.J., Blumenstiel, B., Baldwin, J., Stange-Thomann, N.,
Zody, M.C., Linton, L., Lander, E.S. and Atshuler, D. 2001. A map of human
genome sequence variation containing 1.42 million single nucleotide
polymorphisms. Nature, 409: 928- 933.
Saiki, R.K., Shcarf, S.J., Faloona, F., Mullis, K.B., Horn, G.T., Erlich, H.A. and
Arnheim, N. 1985. Enzymatic amplification of beta-globin genomic sequences and
restriction site analysis for diagnosis of sickle cell anemia. Science, 230: 1350-1354.
Saiki, R.K., Gelfand, D.H., Stoeffel, S., Shcarf, S.J., Higuchi, G., Horn, G.T., Mullis,
K.B. and Erlich, H.A. 1988. Primer directed enzymatic amplification of DNA with a
thermostable DNA polymerase. Science, 239: 487-491.
Saitou, N. and Nei, M. 1987. The neighbor-joining method: a new method for
reconstructing phylogenetic trees. Mol. Biol. Evol. 4: 477-491.
Sanz, M. and Montañés, L. 1995. Flower analysis as a new approach to diagnosing the
nutritional status of the peach tree. J. Plant Nutr. 18: 1667-1675.
Schneider, S., Roessli, D. and Excoffier, L. 2000. ARLEQUIN ver 2.0: A software for
population genetics data analysis. Genetics and biometry laboratory, University of
Geneva, Geneva.
Schueler, S., Tusch, A. and Scholz, F. 2006. Comparative analysis of the within-
population genetic structure in wild cherry (Prunus avium L.) at the self-
incompatibility locus and nuclear microsatellites. Mol. Ecol. 15: 3231-3243.
Scorza, R. and Okie, W.R. 1990. Peaches (Prunus). In: Moore J.N.M. & Ballington Jr.
J.R. (Eds). Genetic Resources of Temperate Fruit and Nut Crops. International
Society for Horticultural Science, Wageningen, The Netherlands. pp. 175-231.
Scorza, R., Mehlenbacher, S.A. and Lightner, G.W. 1985. Inbreeding and coancestry of
freestone peach cultivars of the Eastern United States and implications for peach
germplasm improvement. J. Amer. Soc. Hort. Sci. 110: 547-552.
Scott, K.D., Ablett, E.M., Lee, L.S. and Henry, R.J. 2000. AFLP markers distinguishing
an early mutant of Flame Seedless grape. Euphytica, 113: 245-249.
Scott, D. 2001. Microsatellites Derived from ESTs, and their comparison with those
derived by other methods CAB International. Plant Genotyping: The DNA
Fingerprinting 225-237.
Sefc, K.M., Lopes, M. S., Lefort, F., Botta, R., Roubelakis-Angelakis, K. A., Ibáñez, J.,
Pejić, I., Wagner, H. W., Glössl, J. and Steinkellner, H. 2000. Microsatellite
38

Capítulo 1
variability in grapevine cultivars from different European regions and evaluation of
assignment testing to assess the geographic origin of cultivars. Theor. Appl. Genet.
100: 498-505.
Serrano, B., Gómez-Aparisi, J. and Hormaza, J.I. 2002. Molecular fingerprinting of
Prunus rootstocks using SSRs. J. Hort. Sci. Biotech. 77: 368-372.
Smithies, O. 1955. Zone electrophoresis in starch gels: group variation in the serum
proteins of normal human adults. Biochemical J. 61: 629-641.
Sneath, P.H.A. and Sokal, R.R. 1973. Numerical Taxonomy. Freeman. San Francisco.
pp. 573
Swofford, D.L. 2002. PAUP*. Phylogenetic analysis using parsimony (*and other
methods), version 4.0b10 (Alvitec). Sunderland, Massachusetts: Sinauer Associates.
Swofford, D.L. and Olsen, G.J. 1990. Phylogeny reconstruction. In: Hillis, D.M and C.
Moritz (Eds) Molecular Systematics. Sinauer Assoc. Sunderland, Mass. pp. 411-501.
Tanksley, S.D, Orton, T.J. 1983. Isozymes in plant genetics and breeding (Part A & B).
Elsevier Science Publishers, Amsterdam.
Tabuenca, M.C. and Gracia, M. 1971. Influencia del patrón en la época de salida del
reposo invernal de la variedad. Anales de la Estación Experimental de Aula Dei, 11:
51-57.
Tenaillon, M.I., Sawkins, M.C., Long, A.D., Gaut, R.L., Doebley J.F. and Gaut, B.S.
2001. Patterns of DNA sequence polymorphism along chromosome 1 of maize (Zea
mays ssp. mays L.). Proc. Natl. Acad. Sci. USA, 98: 9161-9166.
Thomidis, T., Exadaktylou, E. and Tsipouridis, C. 2005. Susceptibility of five Prunus
rootstocks to Agrobacterium tumefaciens. New Zealand J. Crop Hort. Sci. 33: 343-
345.
Vignal, A., Milan, D., San Cristobal, M. and Eggen, A. 2002. A review on SNP and
other types of molecular markers and their use in animal genetics. Genet. Sel. Evol.
34: 275-305.
Vilanova, S., Romero, C., Abbott, A.G., Llácer, G. and Badenes, M. L. 2003. An
apricot (Prunus armeniaca L.) F2 progeny linkage map based on SSR and AFLP
markers, mapping plum pox virus resistance and self-incompatibility traits. Theor.
Appl. Genet. 107: 239-247.
Vos, P., Hogers, R., Bleeker, M., Reijans, M., Lee, T., Van, d., Hornes, M., Frijters, A.,
Pot, J., Peleman, J., Kuiper, M. and Zabeau, M.1995. AFLP: a new technique for
DNA fingerprinting. Nucleic Acids Res., 23: 4407-4414.
39

Introducción general
Wang, D.G., Fan, J.B., Siao, C.J., Berno, A., Young, P., Sapolsky, R., Ghandour, G.,
Perkins, N., Winchester, E., Spencer, J., Kruglyak, L., Stein, L., Hsie, L.,
Topaloglou, T., Hubbell, E., Robinson, E., Mittmann, M., Morris, M.S., Shen, N.,
Kilburn, D., Rioux, J., Nusbaum, C., Rozen, S., Hudson, T.J. and Lander, E.S. 1998.
Large-scale identification, mapping, and genotyping of single-nucleotide
polymorphisms in the human genome. Science, 280: 1077-1082.
Wang, Y., Reighard, G.L., Scorza, R. and Abbott, A.G. 2000. Identification of
molecular markers linked to the evergreen gene peach [Prunus persica (L.)] Batsch.
En Plant and Animal Genome XIII Conference. San Diego, California. pp. 34.
Warburton, M.L. and Bliss, F.A. 1996. Genetic diversity in peach (Prunus persica
L.Batsch) revealed by randomly amplified polymorphic DNA (RAPD) markers and
compared to inbreeding coefficients. J. Amer. Soc. Hort. Sci. 121: 1012-1019.
Warburton, M. L., Becerra-Velásquez, V. L, Goffreda, J. C. and Bliss, F. A. 1996.
Utility of RAPD markers in identifying genetic linkages to genes of economic
interest in peach. Theor. Appl. Genet. 93: 920-925.
Warburton, M. L., Xianchun, X., Crossa, J., Franco, J., Melchinger, A. E., Frisch, M.,
Bohn, M. and Hoisington, D. 2002. Genetic Characterization of CIMMYT Inbred
Maize Lines and Open Pollinated Populations Using Large Scale Fingerprinting
Methods. Crop Science 42: 1832-1840.
Weir, B. 1990. Genetic data analysis. Sinauer Associates, Sunderland, MA.
Werner, D.J. and Okie, W.R. 1998. A history and description of the Prunus persica
plant introduction collection. HortScience, 33: 787-793.
Wertheim, S.J. and Webster, A.D. 2005. Rootstocks and interstems. In: Tromp J.,
Webster A.D. and Wertheim S.J. (Eds). Fundamentals of Temperate Zone Tree Fruit
Production. pp. 156-175.
Williams, J.G., Kubelik, A.R., Livak, K.J., Rafalski, L.A. and Tingey, S.V. 1990. DNA
polymorphism amplified by arbitrary primers are useful as genetic markers. Nucleic
Acids Res. 18: 6531-6535.
Wright, S. 1978. Evolution and the genetics of populations, vol. 4. Variability within
and among natural populations. U. Chicago Press. Chicago.
Wünsch, A., Hormaza, J.I. 2002. Molecular characterisation of sweet cherry (Prunus
avium L.) genotypes using peach [Prunus persica (L.) Batsch] SSR sequences.
Heredity, 89: 56-63.
40
Capítulo 1
Zhebentyayeva, T.N., Reighard, G.L., Gorina, V.M. and Abbot, A.G. 2003. Simple
sequence repeat (SSR) analysis for assessment of genetic variability in apricot
germplasm. Theor. Appl. Genet. 106: 435-444.
41


CAPÍTULO 2
Objetivos


Capítulo 2
El objetivo principal de esta tesis es evaluar la biodiversidad en frutales de hueso, en
variedades de melocotonero y en patrones de Prunus de distintas colecciones.
Basándose en la eficiencia de los marcadores moleculares, especialmente los
microsatélites (SSRs) para la caracterización, y la técnica PCR-RFLP en estudios
filogenéticos, se han planteado los siguientes objetivos específicos:
1- La caracterización molecular de la variedad de melocotonero “Miraflores” [P.
persica (L.) Batsch] y de otras variedades tradicionales cultivadas en el Valle
Medio del Ebro, así como la búsqueda de relaciones genéticas entre ellas,
utilizando los marcadores microsatélites (SSRs) (Capítulo 3).
2- El análisis de la variabilidad y el estudio de las relaciones genéticas existentes
entre las variedades de melocotonero del banco de germoplasma nacional de
referencia, incluyendo germoplasma local español y algunas variedades
comerciales de interés, utilizando los marcadores SSRs (Capítulo 4).
3- La caracterización molecular de patrones seleccionados o en fase de selección
del programa de mejora de la Estación Experimental de Aula Dei, y el análisis
de la diversidad genética entre patrones de distintas especies e híbridos inter-
específicos (Capítulo 5).
4- La identificación de los parentales maternos en cruzamientos inter-específicos
de Prunus y la búsqueda de relaciones genéticas y filogenéticas mediante la
aplicación de la técnica PCR-RFLP (Polymerase Chain Reaction-Restriction
Fragment Length Polymorphism) en el ADN cloroplástico (Capítulo 6).
45


CAPÍTULO 3
Molecular characterization of
Miraflores peach variety and
relatives using SSRs

Capítulo 3
ABSTRACT Some traditional peach varieties, originated from the region of Aragón (Spain), were
analysed by SSRs (Simple Sequence Repeats). The aim of this research was to
characterize 19 clones related to ‘Miraflores’ variety, with unknown pedigrees, to assess
their genetic diversity and to elucidate their possible relationships with 10 traditional
peach varieties. Twenty SSR primer pairs with high levels of polymorphism, which
have been previously developed for peach, were used in this study. A total of 46 alleles
were obtained for all the microsatellites studied, ranging from one to six alleles per
locus, with a mean value of 2.3 alleles per locus. Fourteen SSRs were polymorphic in
the set of varieties studied and permitted to distinguish 16 different genotypes out of the
30 initially studied, although fourteen ‘Miraflores’ clones showed identical gel profiles.
The genetic distance matrix was used to construct Neighbor joining cluster and to
perform principal coordinate analysis which allowed the arrangement of all the
genotypes according to their genetic relationships. The genetic relationships among
these traditional peach varieties, and in particular among ‘Miraflores’ clones are
discussed. The obtained results confirm that microsatellite markers are very useful for
these purposes.
Keywords: Clones, Genetic diversity, Genetic relationships, Microsatellites, ‘Miraflores’ peach variety, Traditional peach varieties
49
Molecular characterization of Miraflores peach variety and relatives using SSRs
3-1. INTRODUCTION
Peach [Prunus persica (L.) Batsch] is a member of the Rosaceae, and it is a diploid
species with a basic chromosome number of x=8 and 2n=16. The Prunus persica is
thought to be originated in China and spread to the rest of the world by means of seeds
(Layne, 1987). It is a species well adapted to temperate and subtropical regions,
between latitudes of 30º and 45º North and South (Westwood, 1978). The EU
(European Union) is one of the main cultivation regions, with approximately 4.5 million
metric tons annual production of peaches and nectarines (28% of the world production).
The four countries: Italy, Spain, Greece, and France, ensure 92.7% of this production
(FAOSTAT, 2005), Italy being the greatest peach producer of them (1,750,000 metric
tons) followed by Spain (1,130,800 metric tons). Peach is one of the most economically
and socially important deciduous fruit tree species. Therefore, precise cultivar
identification and characterisation is essential for improving and securing peach culture
in the world.
The official methods used to characterize and identify varieties in fruit tree species
are based on morphological characterization and phenological observations according to
UPOV (Unité pour la Protection des Obtentions Végétales) and IPGRI (International
Plant Genetic Resources Institute) descriptors. This approach requires time, and the
morphological characters can be subject to environmental influences. New molecular
methods have been incorporated to characterize the varieties at the DNA level (see for a
review: Martínez-Gómez et al., 2003). Molecular markers such as restriction fragment
length polymorphism (RFLP), random amplified polymorphic DNA (RAPD) and
amplified fragment length polymorphism (AFLP) have been used for genetic analysis
and the construction of genetic linkage maps (Gogorcena et al., 1993; Warburton and
Bliss, 1996; Ortiz et al., 1997; Bartolozzi et al., 1998; De Vicente et al., 1998; Casas et
al., 1999). On the downside, these DNA markers either present low reproducibility
(RAPDs), or are time consuming and expensive (RFLPs, AFLPs). In the last years,
microsatellite markers (SSR) are becoming the appropriate marker for molecular
characterization and genetic diversity studies (Fang and Roose, 1997; Alvarez et al.,
2001; Huang et al., 2002; Rallo et al., 2003; Moussaoui, 2005). Consisting of tandem
repeats of mono-, bi-, tri- or tetra-nucleotides in the eukaryotic genome, these molecular
markers present a very high polymorphism based on the number of the nucleotide motif
repeats (Morgante and Olivieri, 1993). Besides polymorphism, they have a codominant
50

Capítulo 3
inheritance, they are reproducible and easily detected by PCR. Microsatellite marker
primer pairs have been developed in peach (Sosinski et al., 2000; Testolin et al., 2000;
Aranzana et al., 2002; Dirlewanger et al., 2002), and then used in genetic diversity
analyses for sweet cherry (Dirlewanger et al., 2002), peach (Aranzana et al., 2003), and
apricot (Romero et al., 2003; Zhebentyayeva et al., 2003).
‘Miraflores’ is a Spanish native peach variety, with attractive characteristics,
especially high yields and good quality of fruits (Moreno, 2005). This nonmelting and
clingstone variety is widely used for the fresh market as well as for processing. This
variety appeared in 1970’s at the Jalón valley (Aragón), one of the most important
deciduous fruit tree growing areas in Spain. ‘Miraflores’ has unknown parents, although
it is believed that it could originate from ‘Campiel’ seedlings, a traditional variety
locally cultivated in this area (De Asso, 1798). The correct molecular characterization of
this variety should prevent all confusion with other varieties with similar morphological
characteristics, and enhance its use in peach breeding programs. On the other hand, this
will be useful to warrant this variety as a specific typical product with a designation of
origin.
Therefore, the aim of this study was to characterize nineteen clones of ‘Miraflores’
peach variety with unknown pedigree, using 20 SSR primer pairs. Ten old Spanish
peach varieties originated from the same region were also included in this investigation,
to check genetic similarities and possible genetic relationships with ‘Miraflores’.
3-2. MATERIALS AND METHODS
3-2-1. Plant material
Thirty peach accessions, being either clones of ‘Miraflores’ or closely related
varieties with other traditional peach varieties were collected throughout Aragón, and
were analysed in this study. Nineteen accessions (clones and/or closely related varieties)
were provided from a recent survey of ‘Miraflores’ variety (‘Miraflores’ 1 to 19). The
other eleven accessions are old Spanish peach varieties originated from the same region
of Aragón (Spain); two clones of ‘Tipo Campiel’ variety (‘Tipo Campiel 1’ and ‘Tipo
Campiel 2’) and nine traditional cultivars (‘Amarillo de Calanda’, ‘Zaragozano
Amarillo’, ‘Amarillo de Gallur’, ‘Tardío del Pilar’, ‘Oropel’, ‘Zaragozano Rojo’,
51

Molecular characterization of Miraflores peach variety and relatives using SSRs
‘Maluenda’, ‘Bonet IV’, ‘Amarillo de Septiembre’). From all accessions, young leaves
were collected for DNA extraction.
3-2-2. Genomic DNA extraction
Fresh young leaves were ground to powder with liquid N2 using a mortar and pestle.
Genomic DNA was isolated from leaf samples using a CTAB (cethyltrimethyl
ammonium bromide) extraction method (Cheng et al., 1997). The extraction buffer
contained 2% CTAB, 1.5 M NaCl, 20 mM EDTA, 100 mM Tris pH 8.0, and 0.4% 2-
mercaptoethanol. Samples were incubated at 65ºC for approximately 30-60 min, mixed
with an equal volume of chloroform-isoamyl alcohol (24:1), and centrifuged at 13,000
rpm for 10 min at room temperature. The supernatant was transferred to a clean
microcentrifuge tube and treated with RNAse A (10 mg/ml, 60 min, 37ºC), then mixed
with an equal volume of cold isopropanol. The DNA was pelleted by centrifugation at
13,000 rpm for 3-5 min. The supernatant was removed and the DNA pellet washed with
500 µl of 70 % ethanol and 50 µl of wash buffer (3 M sodium acetate, 0.1 M
magnesium acetate, pH 8.0), to remove residual CTAB, salt, and other contaminants.
The pellet was dried for 1 h and then dissolved in 100 µl of TE buffer (10 mM Tris–
HCl, 0.1 mM EDTA, pH 8.0). DNA quality was examined by electrophoresis in 0.8%
agarose and DNA concentration was quantified spectrophotometrically (Gene Quant,
Amersham Pharmacia Biotech). The extracted DNA was diluted to 5 ng /µl with TE
buffer and stored at -20ºC for PCR amplifications.
3-2-3. DNA amplification
Twenty SSR markers were studied (Table 3-1) using primer pairs previously
developed for peach. Amplification reactions were carried out in a final volume of 15 µl
containing 10 ng of template DNA, 1X reaction buffer (20 mM (NH4)2SO4, 75 mM
Tris-HCl pH 8.8), 2 mM MgCl2, 0.2 mM of dNTPs (50 µM of each) (Amersham
Pharmacia Biotech), 0.15 µM of forward and reverse primers each, and 0.5 U of Tth
DNA Polymerase (Biotools B and M Labs, S.A., Spain), overlaid with a drop of mineral
oil (Sigma, St Louis, MO). The PCR amplifications were carried out on a Gene Amp
2700 thermocycler (Applied Biosystems) using the following temperature cycles: 1
cycle of 3 min at 95ºC, 35 cycles of 1 min at 94ºC, 45 s at the corresponding annealing
52

Capítulo 3
temperature (Table 3-1) and 1 min at 72ºC. The last cycle was followed by a final
incubation for 7 min at 72ºC and the PCR products were stored at 4ºC before analysis.
Two independent SSR reactions were performed for each DNA sample. The DNA
amplification products were loaded on 5% polyacrilamide sequencing gels. Gels were
run for 2h at 65 W. The gels were silver-stained according to the protocol described by
Bassam et al. (1983). Fragment sizes were estimated with the 30-330 bp AFLP ladder
(Invitrogen, Carlsbad, Calif.) DNA sizing markers, and analysed by the Quantity One
program (Bio Rad, Hercules, CA).
3-2-4. Data analysis
The number of alleles per locus was counted from the gel profile analysis. The
observed heterozygosity (Ho) was calculated for each locus as the number of
heterozygous individuals over the total number of individuals analysed. The expected
heterozygosity was calculated as He = 1 – Σpi2, where pi is the frequency of ith allele
(Nei, 1973). The power of discrimination was calculated as PD = 1- Σgi2, where gi is the
frequency of ith genotype (Kloosterman et al., 1993). Those parameters served to
evaluate the information given by the microsatellite markers (Table 3-1).
Data were analyzed using the NTSYS-pc, version 2.1 program (Rohlf, 2000). A
0/0.5/1 (absence/allele in heterozygosity/allele in homozygosity) matrix was
constructed. The genetic distances between pairs of varieties were estimated from the
matrix with the SIMGEND module using the Nei coefficient (Nei, 1972). Cluster
analyses were carried out using Neighbor Joining (NJ) algorithm (Saitou and Nei,
1987). The resulting cluster was represented as a dendrogram. A principal coordinate
analysis based on the similarity matrix was also performed.
3-3. RESULTS
3-3-1. Microsatellite diversity
Spanish peach varieties were analysed with 20 SSRs. All the SSRs studied were
single-locus and produced alleles that could be scored, with a total of 46 ranging from
one to six per locus, with a mean value of 2.3 alleles per locus. Fourteen out of the 20
53
Molecular characterization of Miraflores peach variety and relatives using SSRs
SSRs employed, were polymorphic and it was possible to distinguish unambiguously 16
peach genotypes from the 30 accessions studied. However, six SSR loci (CPPCT002,
CPPCT005, CPPCT017, CPPCT030, UDP98-408 and BPPCT007) were monomorphic
for the peach plant material evaluated (Table 3-1). Observed heterozygosity (Ho) ranged
from 0 to 0.70 in CPPCT006, with a mean value of 0.18. The expected heterozygosity
(He) ranged from 0, for the monomorphic SSRs, to 0.67 in BPPCT008, with a mean
value of 0.29. The power of discrimination (PD) varied from 0, for the monomorphic
loci, to 0.67 in BPPCT008, with an average value of 0.31. Differences were found in the
number of genotypes identified per locus. This number varied between one unique
genotype in the monomorphic loci, to 8 genotypes using BPPCT008 with a mean value
of 2.75 (Table 3-1).
The five most polymorphic microsatellites were CPPCT028, UDP98-022,
BPPCT001, BPPCT008, and BPPCT015 (Table 3-1), most of them showed the highest
He and PD. These SSRs allowed the unambiguous discrimination of the same 16
accessions separated using all the SSRs studied. These five SSR primer pairs detected a
total of 21 alleles, ranging from 3 to 6 alleles per locus and with a mean value of 4.2
alleles per locus. The expected heterozygosity mean value for these microsatellites was
He = 0.53, and the power of discrimination mean value was PD = 0.54.
54

Capítulo 3
Table 3-1. List of the 20 SSR primers used in this study, size range, annealing temperature, number of alleles and variability parameters. Locus code References Size range
(bp)Ta (ºC) N Ho He #Genotypes PD
CPPCT002 Aranzana et al. 2002 102 58ºC 1 0.00 0.00 1 0.00CPPCT004 Aranzana et al. 2002 262-277 56ºC 2 0.03 0.10 2 0.13CPPCT005 Aranzana et al. 2002 154 58ºC 1 0.00 0.00 1 0.00CPPCT006 Aranzana et al. 2002 182-192 60ºC 2 0.70 0.52 3 0.46CPPCT017 Aranzana et al. 2002 183 60ºC 1 0.00 0.00 1 0.00CPPCT022 Aranzana et al. 2002 248-292 58ºC 3 0.00 0.13 3 0.13CPPCT028 Aranzana et al. 2002 134-138 58ºC 3 0.00 0.35 3 0.35CPPCT029 Aranzana et al. 2002 192-196 58ºC 2 0.00 0.43 2 0.43CPPCT030 Aranzana et al. 2002 186 56ºC 1 0.00 0.00 1 0.00CPPCT033 Aranzana et al. 2002 151-153 58ºC 2 0.10 0.09 2 0.18BPPCT001 Dirlewanger et al. 2002 152-166 60ºC 6 0.03 0.62 7 0.63BPPCT007 Dirlewanger et al. 2002 146 58ºC 1 0.00 0.00 1 0.00BPPCT008 Dirlewanger et al. 2002 100-156 59ºC 4 0.67 0.67 8 0.67BPPCT015 Dirlewanger et al. 2002 168-222 62ºC 5 0.03 0.50 6 0.52BPPCT017 Dirlewanger et al. 2002 162-174 60ºC 2 0.57 0.54 2 0.57BPPCT038 Dirlewanger et al. 2002 127-129 62ºC 2 0.67 0.45 2 0.45UDP98-022 Testolin et al. 2000 124-138 64ºC 3 0.00 0.52 3 0.52UDP98-025 Testolin et al. 2000 134-142 65ºC 2 0.13 0.44 3 0.54UDP98-407 Testolin et al. 2000 174-198 60ºC 2 0.57 0.40 3 0.59UDP98-408 Testolin et al. 2000 102 56ºC 1 0.00 0.00 1 0.00
Mean 2.3 0,18 0.29 2.75 0.31
Ta: annealing temperature; N: number of alleles; Ho: observed heterozygosity; He: expected heterozygosity; # Genotypes: different genotypes per locus; and PD: power of discrimination.
3-3-2. Cluster and principal coordinate analysis
The genetic distance (D) among the different genotypes studied using the 20 SSRs
was reproduced in the Neighbor Joining (NJ) dendrogram (Figure 3-1), according to the
original data obtained in the similarity matrix, and based on the additive genetic
distances among the genotypes (Saitou and Nei, 1987).
The dendrogram generated from the NJ cluster analysis showed two main groups.
The first group was composed of the two ‘Tipo Campiel’ clones, ‘Tardío del Pilar’,
‘Amarillo de Septiembre’ and all the ‘Miraflores’ clones but ‘Miraflores 3’, which was
clustered out of the two main groups. The second group included the rest of the studied
varieties. In the first group, fourteen ‘Miraflores’ clones (‘Miraflores’ 5 to 11 and
‘Miraflores’ 13 to 19) were clustered together with a null genetic distance among them.
The ‘Miraflores 1’ and ‘Miraflores 2’ were closely related to the fourteen
55
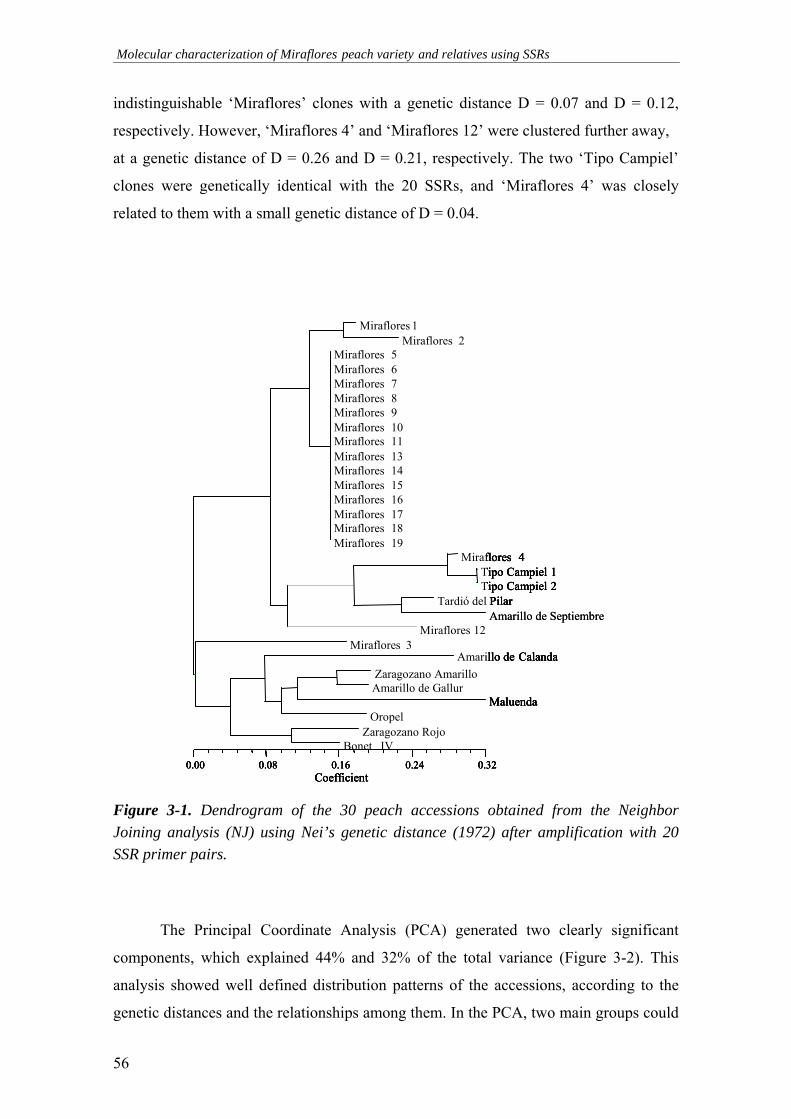
Molecular characterization of Miraflores peach variety and relatives using SSRs
indistinguishable ‘Miraflores’ clones with a genetic distance D = 0.07 and D = 0.12,
respectively. However, ‘Miraflores 4’ and ‘Miraflores 12’ were clustered further away,
at a genetic distance of D = 0.26 and D = 0.21, respectively. The two ‘Tipo Campiel’
clones were genetically identical with the 20 SSRs, and ‘Miraflores 4’ was closely
related to them with a small genetic distance of D = 0.04.
Coefficient0.00 0.08 0.16 0.24 0.32
Miraflores 1 Miraflores 2
Miraflores 5 Miraflores 6 Miraflores 7 Miraflores 8 Miraflores 9 Miraflores 10 Miraflores 11 Miraflores 13 Miraflores 14 Miraflores 15 Miraflores 16 Miraflores 17 Miraflores 18 Miraflores 19
Miraflores 4 Tipo Campiel 1 Tipo Campiel 2
Tardió del Pilar Amarillo de Septiembre
Miraflores 12 Miraflores 3
Amarillo de CalandaZaragozano AmarilloAmarillo de Gallur
MaluendaOropel
Zaragozano Rojo Bonet IV
Coefficient0.00 0.08 0.16 0.24 0.32
Miraflores 1 Miraflores 2
Miraflores 5 Miraflores 6 Miraflores 7 Miraflores 8 Miraflores 9 Miraflores 10 Miraflores 11 Miraflores 13 Miraflores 14 Miraflores 15 Miraflores 16 Miraflores 17 Miraflores 18 Miraflores 19
Miraflores 4 Tipo Campiel 1 Tipo Campiel 2
Tardió del Pilar
Miraflores 12 Miraflores 3
Amarillo de CalandaZaragozano AmarilloAmarillo de Gallur
MaluendaOropel
Zaragozano Rojo Bonet IV
Coefficient0.00 0.08 0.16 0.24 0.32
Miraflores 1 Miraflores 2
Miraflores 5 Miraflores 6 Miraflores 7 Miraflores 8 Miraflores 9 Miraflores 10 Miraflores 11 Miraflores 13 Miraflores 14 Miraflores 15 Miraflores 16 Miraflores 17 Miraflores 18 Miraflores 19
Miraflores 4 Tipo Campiel 1 Tipo Campiel 2
Tardió del Pilar Amarillo de Septiembre
Miraflores 12 Miraflores 3
Amarillo de CalandaZaragozano AmarilloAmarillo de Gallur
MaluendaOropel
Zaragozano Rojo Bonet IV
Coefficient0.00 0.08 0.16 0.24 0.32
Miraflores 1 Miraflores 2
Miraflores 5 Miraflores 6 Miraflores 7 Miraflores 8 Miraflores 9 Miraflores 10 Miraflores 11 Miraflores 13 Miraflores 14 Miraflores 15 Miraflores 16 Miraflores 17 Miraflores 18 Miraflores 19
Miraflores 4 Tipo Campiel 1 Tipo Campiel 2
Tardió del Pilar
Miraflores 12 Miraflores 3
Amarillo de CalandaZaragozano AmarilloAmarillo de Gallur
MaluendaOropel
Zaragozano Rojo Bonet IV
Figure 3-1. Dendrogram of the 30 peach accessions obtained from the Neighbor Joining analysis (NJ) using Nei’s genetic distance (1972) after amplification with 20 SSR primer pairs.
The Principal Coordinate Analysis (PCA) generated two clearly significant
components, which explained 44% and 32% of the total variance (Figure 3-2). This
analysis showed well defined distribution patterns of the accessions, according to the
genetic distances and the relationships among them. In the PCA, two main groups could
56
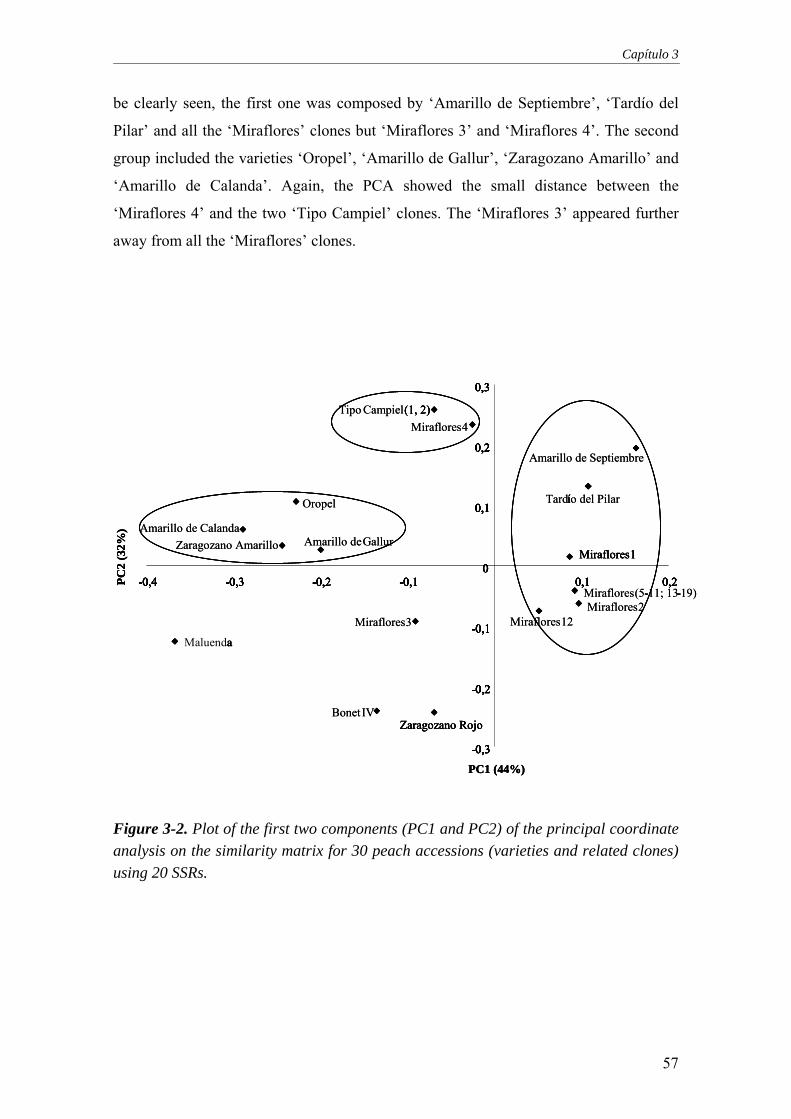
Capítulo 3
be clearly seen, the first one was composed by ‘Amarillo de Septiembre’, ‘Tardío del
Pilar’ and all the ‘Miraflores’ clones but ‘Miraflores 3’ and ‘Miraflores 4’. The second
group included the varieties ‘Oropel’, ‘Amarillo de Gallur’, ‘Zaragozano Amarillo’ and
‘Amarillo de Calanda’. Again, the PCA showed the small distance between the
‘Miraflores 4’ and the two ‘Tipo Campiel’ clones. The ‘Miraflores 3’ appeared further
away from all the ‘Miraflores’ clones.
Zaragozano RojoBonet IV
Miraflores3
Maluenda
-0,3
-0,2
-0,1
0
0,1
0,2
0,3
-0,4 -0,3 -0,2 -0,1 0,1 0,2
PC1 (44%)
PC2
(32%
)
Miraflores(5-11; 13-19)
Amarillo de Septiembre
Tardío del Pilar
Miraflores1
Miraflores12Miraflores2
Tipo Campiel(1, 2)Miraflores4
Amarillo de Gallur
Oropel
Zaragozano Amarillo
Zaragozano Rojo
Maluenda
-0,3
-0,2
-0,1
0
0,1
0,2
0,3
-0,4 -0,3 -0,2 -0,1 0,1 0,2
-0,3
-0,2
-0,1
0
0,1
0,2
0,3
-0,4 -0,3 -0,2 -0,1 0,1 0,2- -
í
Miraflores1
(1, 2)
Amarillo de Calanda
Zaragozano RojoBonet IV
Miraflores3
Maluenda
-0,3
-0,2
-0,1
0
0,1
0,2
0,3
-0,4 -0,3 -0,2 -0,1 0,1 0,2
PC1 (44%)
PC2
(32%
)
-0,3
-0,2
-0,1
0
0,1
0,2
0,3
-0,4 -0,3 -0,2 -0,1 0,1 0,2
PC1 (44%)
PC2
(32%
)
Miraflores(5-11; 13-19)
Amarillo de Septiembre
Tardío del Pilar
Miraflores1
Miraflores12Miraflores2
Tipo Campiel(1, 2)Miraflores4
Amarillo de Gallur
Oropel
Zaragozano Amarillo
Zaragozano Rojo
Maluenda
-0,3
-0,2
-0,1
0
0,1
0,2
0,3
-0,4 -0,3 -0,2 -0,1 0,1 0,2
-0,3
-0,2
-0,1
0
0,1
0,2
0,3
-0,4 -0,3 -0,2 -0,1 0,1 0,2- -
í
Miraflores1
(1, 2)
Amarillo de Calanda
Figure 3-2. Plot of the first two components (PC1 and PC2) of the principal coordinate analysis on the similarity matrix for 30 peach accessions (varieties and related clones) using 20 SSRs.
57

Molecular characterization of Miraflores peach variety and relatives using SSRs
3-4. DISCUSSION
3-4-1. Genetic diversity
The 20 SSR loci produced between 1 to 6 alleles with a mean value of 2.3 alleles per
locus. This mean value calculated with 30 peach accessions, was lower than the mean
values obtained by other authors in this species. Testolin et al. (2000) mentioned a value
of 4.5 for a set of 50 varieties analysed with 26 microsatellites. Aranzana et al. (2002)
cited 3.2 for a set of 25 varieties with 24 SSRs, and Dirlewanger et al. (2002) observed
4.2 for a set of 27 varieties with 41 SSR primer pairs. Mean values for the expected
heterozygosity (He) and for the power of discrimination (PD) were also lower than the
values recorded by these authors. In the present study, the He and PD were 0.29 and
0.31, respectively. Testolin et al. (2000) mentioned He = 0.47 and PD = 0.60; Aranzana
et al. (2002) found value of 0.41 for He, and 0.60 for PD, and Dirlewanger et al. (2002)
reported values of 0.41 for He, and 0.54 for PD. These results indicate a low variability
in our plant material that can be explained by the close genetic relationship among the
peach accessions studied and in particular, among the ‘Miraflores’ clones. However,
using only the five most polymorphic primer pairs (BPPCT001, BPPCT008,
BPPCT015, UDP98-022, and CPPCT028), the mean value of alleles per locus increased
to 4.2. An increase in the mean values of the expected heterozygosity (He = 0.53) and
the power of discrimination (PD = 0.54) has also been shown. These new values are
closer to the ones mentioned by Testolin et al. (2000), Aranzana et al. (2002) and
Dirlewanger et al. (2002). The high levels of polymorphism in the selected five SSRs,
permitted to distinguish unambiguously 16 genotypes within the thirty studied
accessions, the same genotypes that were discriminated using all the twenty SSR
primers pairs. Thus, those five polymorphic SSRs are interesting markers for studies
aimed at distinguishing highly related peach varieties. The fourteen clones of
‘Miraflores’ showed identical patterns for all the SSRs used in this study. These clones
either belong to the same clone or represent different clones that differ by a single or
few gene mutations, which could not be detected by SSR analysis (Testolin et al.,
2000).
58

Capítulo 3
3-4-2. Cultivar relationships from cluster and principal coordinate analysis
The fourteen ‘Miraflores’ clones showed identical SSR profiles and were clustered
together in the NJ tree. These clones have also similar pomological characteristics
(M.A. Moreno, unpublished observation). The genetic similarity among some
‘Miraflores’ clones was also shown in a preliminary study reported by Moreno and
Casas (2002) using 10 SSRs and 7 RAPDs. In terms of genetic distance, the ‘Miraflores
1’ and ‘Miraflores 2’ were closely related with the group of the fourteen identical
‘Miraflores’ clones with a genetic distance of 0.07 and 0.12, respectively. These two
clones differed from the ‘Miraflores’ main group in only two SSR loci. The ‘Miraflores
1’ had a new allele with + 2 bp in the locus UDP98-022 (138 bp) and the lack of the
allele 174 bp in the locus BPPCT017. The ‘Miraflores 2’ had a new allele with + 2 bp in
the locus UDP98-022 (138 bp) and a new allele with + 2 bp in the locus CPPCT028
(136 bp). These two clones presented also similar Rosaceae flower shape, the same
flowering and ripening date, and similar yield and fruit characteristics with the group of
identical ‘Miraflores’ clones. The small molecular discrepancies of these two clones
from the main group of ‘Miraflores’ may have been caused by SSR mutations as it was
also suggested by Aranzana et al. (2003).
The ‘Miraflores 12’ is closer to the ’Miraflores’ group (‘Miraflores’ 5-11 and 13-19)
than to the old Spanish varieties at a genetic distance of D = 0.21. Moreover, this clone
shared at least one allele in 17 SSR loci (34 alleles out of the 40 studied) with the group
of identical ‘Miraflores’ clones. These results point out the existence of a close parental
relationships between these clones and we can suggest that ‘Miraflores 12’ could be one
of the ‘Miraflores’ progenitors. ‘Miraflores 4’ was clustered to the identical ‘Miraflores’
group at a genetic distance of D = 0.26. This clone is closely related to the two identical
‘Tipo Campiel’ clones at a genetic distance of D = 0.04. ‘Miraflores 4’ had at least one
common allele in all SSR loci with the ‘Tipo Campiel’ clones and shared 37 alleles of
the total alleles studied. According to the morphological data (data not shown),
‘Miraflores 4’ presents similar fruit characteristics to ‘Tipo Campiel’ cultivar (high
percentage of redness in the skin), and similar flower morphology (bell flower shape).
Moreover, the pulp close to the stone of the fruit is red as in the ‘Tipo Campiel’ fruits.
Our findings confirm the hypothesis reported previously by Moreno and Casas (2002)
that ‘Miraflores 4’ could be a seedling of ‘Tipo Campiel’ cultivar.
59
Molecular characterization of Miraflores peach variety and relatives using SSRs
Finally, ‘Miraflores 3’ was clustered out of the two main groups shown in the NJ
tree, at a genetic distance of D = 0.40. Furthermore, ‘Miraflores 3’ showed chemical
and physical characteristics different from the rest of ‘Miraflores’ clones (fruit shape,
yellow-red skin appearance, early ripening, sugar and acids content, etc.). This clone
probably belongs to another variety which has morphological and phenological
characteristics similar to those of ‘Miraflores’ variety. Previous work pointed out that
this clone could be the ‘Godina 58GC76’ variety, based on similarities in fruit
characteristics (fruit color, fruit shape, sugar and acid level etc.) (M.A. Moreno,
unpublished observation).
The ‘Miraflores’ clones studied in this work have unknown parents and pedigrees.
Old spanish varieties were included in the study to check an eventual relationship with
‘Miraflores’ clones. As it is shown in the dendrogram (Figure 3-1), and the PCA (Figure
3-2), the varieties ‘Tardío del Pilar’, ‘Amarillo de Septiembre’, ‘Tipo Campiel’ and all
of the ‘Miraflores’ clones, but ‘Miraflores 3’, belong to the same group. The varieties
‘Tardío del Pilar’, ‘Amarillo de Septiembre’, and ‘Tipo Campiel’ were related to the
‘Miraflores’ clones at the genetic distances of 0.24, 0.30 and 0.31, respectively. In fact,
these varieties, showed similar physical fruit characteristics (properties of the pulp and
skin appearance) to those found in ‘Miraflores’ clones. Thus, we hypothesise that they
could be close relatives of ‘Miraflores’ cultivar. However, the rest of the old Spanish
varieties (‘Amarillo de Calanda’, ‘Zaragozano Amarillo’, ‘Amarillo de Gallur’,
‘Oropel’, ‘Zaragozano Rojo’, ‘Maluenda’ and ‘Bonet IV’), were clustered in another
main group far away from the ‘Miraflores’ clones.
In this work, the absence of SSR differences among fourteen clones of ‘Miraflores’
could be explained by the usual clonal propagation of ‘Miraflores’ carried out by
nurseries and fruit growers. Another possibility could be that these clones may represent
the original genotype of ‘Miraflores’ with few genetic variations such as sport
mutations. However by using SSRs, it is highly improbable to distinguish mutants that
differ from the original genotype in one or few genes (Botta et al., 1995; Moreno et al.,
1998; Aranzana et al., 2003).
In conclusion, we regard the clones (1, 2, 5-11 and 13-19) of ‘Miraflores’ as true
clones of the ‘Miraflores’ variety, and they will be included in future programs of
selection. While ‘Miraflores 12’ was considered as one of the ‘Miraflores’ progenitors
and ‘Miraflores 4’ could be considered as a new cultivar, closely related to ‘Tipo
Campiel’. ‘Miraflores 3’ is considered unrelated to the main group of ‘Miraflores’.
60

Capítulo 3
These studies make possible the adequate choice of clones and varieties in new crosses
for selection purposes.
REFERENCES
Alvarez, A.E., Van de Wiel, C.C.M., Smulders, M.J.M. and Vosman, B. 2001. Use of
microsatellites to evaluate genetic diversity and species relationships in the genus
Lycopersicon. Theor. Appl. Genet. 103: 1283-1292.
Aranzana, M.J., García-Mas, J., Carbó, J. and Arús, P. 2002. Development and
variability analysis of microsatellite markers in peach. Plant Breed.121: 87-92.
Aranzana, M.J., Carbó, J. and Arús, P. 2003. Microsatellite variability in peach
[Prunus persica (L.) Batsch]: cultivar identification, marker mutation, pedigree
inferences and population structure. Theor. Appl. Genet. 106: 1341-1352.
Bartolozzi, F., Warburton, M.L., Arulsekar, S. and Gradziel, T.M. 1998. Genetic
characterization and relatedness among California almond cultivars and breeding
lines detected by randomly amplified polymorphic DNA (RAPD) analysis. J. Amer.
Soc. Hort. Sci. 123: 381-387.
Bassam, B.J., Caetano-Anoelles, G. and Gresshoff, P.M. 1983. Fast and sensitive silver
staining of DNA in polyacrylamide gels. Anal. Biochem. 196: 80-83.
Botta, R., Scott, N.S., Eynard, I. and Thomas, M.R. 1995. Evaluation of microsatellite
sequence-tagged site markers for characterizing Vitis vinifera cultivars. Vitis 2: 99-
102.
Casas, A.M., Igartua, E., Balaguer, G. and Moreno, MA. 1999. Genetic diversity of
Prunus rootstocks analysed by RAPD markers. Euphytica 110: 139-149.
Cheng, F.S., Brown, S.K. and Weeden, N.F. 1997. A DNA extraction protocol from
various tissues in woody species. Hort. Sci. 32: 921-922.
De Asso, D.I. 1798. Historia de la economía política de Aragón. Francisco Magallón,
Zaragoza, 487 pp.
De Vicente, M.C., Truco, M.J., Egea, J., Burgos, L. and Arús, P. 1998. RFLP
variability in apricot (Prunus armeniaca L.). Plant Breeding 117: 153-158.
Dirlewanger, E., Cosson, P., Tavaud, M., Aranzana, M.J., Poizat, C., Zanetto, A., Arús,
P. and Laigret, F. 2002. Development of microsatellite markers in peach [Prunus
61

Molecular characterization of Miraflores peach variety and relatives using SSRs
persica (L.) Batsch] and their use in genetic diversity analysis in peach and sweet
cherry (Prunus avium L.). Theor. Appl. Genet. 105: 127-138.
Fang, D.Q. and Roose, M.L. 1997. Identification of closely related citrus cultivars with
inter-simple sequence repeat markers. Theor. Appl. Genet. 95: 408-417.
Faostat. 2005. Agricultural data.http://faostat.fao.org/faostat/
Gogorcena, Y., Arulsekar, S., Dandekar, A.M. and Parfitt, D.E. 1993. Molecular
markers for grape characterization. Vitis 32: 183-185.
Huang, X., Börner, A., Röder, M. and Ganal, M. 2002. Assessing genetic diversity of
wheat (Triticum aestivum L.) germplasm using microsatellite markers. Theor. Appl.
Genet. 105: 699-707.
Kloosterman, A.D., Budowle, B. and Daselaar, P. 1993. PCR-amplification and
detection of the human DIS80 VNTR locus. Amplification conditions, population
genetics and application in forensic analysis. Int. J. Leg. Med. 105: 257-264.
Layne, R.E.C. 1987. Peach rootstocks. In: R.C. Rom and R.F. Carlson (Eds),
Rootstocks for Fruit Crops, John Wiley and Sons, NY, pp. 185-216.
Martínez-Gómez, P., Sozzi, G.O., Sánchez-Pérez, R., Rubio, M. and Gradziel, T.M.
2003. New approaches to Prunus tree crop breeding. Food, Agriculture and
Environment 1: 52-63.
Moreno, M.A. 2005. Selección de patrones y variedades de melocotonero adaptados a
condiciones del área mediterránea. Vida Rural 206: 28-31.
Moreno, M.A. and Casas, A.M. 2002. Selección de variedades autóctonas de
melocotonero. Actas de Horticultura 34: 741-746.
Moreno, S., Martín, J.P. and Ortiz, J.M. 1998. Inter-simple sequence repeats PCR for
characterization of closely related grapevine germplasm. Euphytica 101: 117-125.
Morgante, M. and Olivieri, A.M. 1993. PCR-amplified microsatellites as markers in
plant genetics. Plant J. 3: 175-182.
Moussaoui, S. 2005. Molecular Characterization of Grapevine Cultivars from Aragón
Gene Bank Using Sequence-Tagged Microsatellite Site Markers. Master of Science
Thesis, IAMZ, Spain.
Nei, M. 1972. Genetic distance between populations. Am. Nat. 106: 283-292.
Nei, M. 1973. Analysis of gene diversity in subdivided populations. Proc. Natl. Acad.
Soc. USA 70: 3321-3323.
Ortiz, A., Renaud, R., Calzada, I. and Ritter, E. 1997. Analysis of plum cultivars with
RAPD markers. J. Hort. Sci.72: 1-9.
62
Capítulo 3
Rallo, P., Tenzer, I., Gessler, C., Baldón, L., Dorado, G. and Martín, A. 2003.
Transferability of olive microsatellite loci across the genus Olea. Theor. Appl. Genet.
107: 940-946.
Rohlf, F.J. 2000. NTSYS-pc Numerical Taxonomy and Multivariate Analysis System.
Version 2.1. Exeter Software, Setauket, NY.
Romero, C., Pedryc, A., Muñoz, V., Llácer, G. and Badenes, M.L. 2003. Genetic
diversity of different apricot geographical groups determined by SSR markers.
Genome 46: 244-252.
Saitou, N. and Nei, M. 1987. The neighbor-joining method: a new method for
reconstructing phylogenetic trees. Mol. Biol. Evol. 4: 477-491.
Sosinski, B., Gannavarapu, M., Hager, L.D., Beck, L.E., King, G.J., Ryder, C.D.,
Rajapakse, S., Baird, W.V., Ballard, R.E. and Abbot A.G. 2000. Characterization of
microsatellite in peach [Prunus persica (L.) Batsch]. Theor. Appl. Genet. 97: 1034-
1041.
Testolin, R., Marrazo, T., Cipriani, G., Quarta, R., Verde, I., Dettori, M.T., Pancaldi,
M. and Sansavini, S. 2000. Microsatellite DNA in peach (Prunus persica L. Batsch)
and its use in fingerprinting and testing the genetic origin of cultivars. Genome 43:
512-520.
Warburton, M.L. and Bliss, F.A. 1996. Genetic diversity in peach (Prunus persica L.
Batsch) revealed by randomly amplified polymorphic DNA (RAPD) markers and
compared to inbreeding coefficients. J. Amer. Soc. Hort. Sci. 121: 1012-1019.
Westwood, M.N. 1978. Temperature Zone Pomology. Freeman, San Francisco, 428 pp.
Zhebentyayeva, T.N., Reighard, G.L., Gorina, V.M. and Abbot, A.G. 2003. Simple
sequence repeat (SSR) analysis for assessment of genetic variability in apricot
germplasm. Theor. Appl. Genet. 106: 435-444.
63


CAPÍTULO 4
Genetic analysis of introduced and
local Spanish peach cultivars
determined by SSR markers


Capítulo 4
ABSTRACT
A set of 94 peach cultivars including Spanish native peach and foreign commercial
cultivars were analysed using 15 SSR markers, selected for their high level of
polymorphism. The number of alleles obtained varied from two in the loci Pchgms1,
pchgms2 and PceGA34, to eleven in UDP98-412 with an average of 6.73. The observed
genotypes were ranged from two in pchgms2 to 24 in PS9f8 with a total of 185
genotypes in all loci studied and an average of 12 genotypes. All the cultivars studied
showed a unique genetic profile, each one using the genotypic combination of all loci.
The BPPCT001 was the most informative locus and also showed the highest
discrimination power. Only six loci from the 15 SSRs used allowed the unambiguous
separation of all the Spanish native cultivars included in this study, and the genotypic
combination of only eight loci permitted the total differentiation of the 94 peach
cultivars analysed. The six selected loci (BPPCT001, BPPCT006, BPPCT008, PS9f8,
UDP98-022, and UDP98-412) seem to be very useful for future Spanish peach
identification works, and will help to establish a molecular data base for native peach
cultivars.
UPGMA analysis was performed from the genetic distance matrix, and allowed the
arrangement of all genotypes according to their genetic relationships. The genetic
diversity among cultivars, observed in this work, led to their separation according to
their regional origin, their morphological characteristics and especially according to
their fruit traits. The group of non-melting fruit flesh cultivars appeared more
genetically variable than the rest of the cultivars tested. SSR markers have proved to be
an efficient tool for fingerprinting peach cultivars and conducting genetic-diversity
studies in peach.
Key words: Spanish native peach, Genetic relationship, Genetic diversity, SSR markers
67

Genetic analysis of introduced and local Spanish peach cultivars determined by SSR markers
4-1. INTRODUCTION
Today, the plant diversity is under threat as never before. In agriculture, the
widespread adoption of a few improved varieties has narrowed the genetic base of most
important food crops and led to the disappearance of hundreds of landraces (Gepts,
1995). Peach is one of the most economically important cultivated species of the Prunus
genus subjected to intense breeding activity. Almost 500 new cultivars were released
around the world during 1990-1996 (Fideghelli et al., 1998). The diversity of peach
germplasm around the world has been drastically reduced, by the wide adoption of
improved varieties which reduces genetic resources by displacing more diverse types. In
Spain, the genetic diversity within peaches is also decreasing very rapidly, because of
replacement of traditional varieties by introduced ones, mostly from North America
(Badenes et al., 1998). In fact, United States cultivars are planted widely in many
foreign countries and are being used in their breeding programs. On the other hand,
genetic diversity in the United States peach cultivars is considered to be especially
limited, because improved cultivars continue to be released from parents belonging to
the same gene pool (Scorza et al., 1985).
The replacement of traditional varieties by American new cultivars is being
stimulated by the exigency of the European market for melting-flesh cultivars that
exhibit similar characteristics throughout the marketing season. In Spain, the peach
industry is based on non melting flesh peaches, primarily derived from native
populations which are genetically diverse and are an excellent source of traits for
breeding. Characteristics such as medium and high chilling requirements, late
flowering, extended harvest season from July to November, and very high flesh quality
can be found in these populations (Badenes et al., 1998).
Managing peach biodiversity on farms and conserving it in collections of genetic
resources are complementary approaches. Together they address the need for the
continued future availability and use of peach biodiversity to improve productivity, both
by breeding improved varieties and by improving farm ecosystems (Gepts, 1995). A
detailed characterization of peach germplasm from Spain is necessary to save these
important genetic resources and to obtain efficient collection. Genetic diversity, in
particular, provides species with the ability to adapt to changing stresses, such as pests
and diseases or drought.
68

Capítulo 4
Genetic markers reveal patterns and levels of genetic diversity that reflect the
evolutionary relationships of individual accessions and can thus assist in identifying
groups of accessions that are related by common ancestry (Gepts, 1995). The number of
loci assessed should be as high as possible and preferably should be distributed at
random in the genome to ensure adequate genome coverage (Aranzana et al., 2003a;
2003b).
Molecular and biochemical markers such as isozymes, seed proteins, RFLPs,
RAPDs, AFLPs, SSRs, etc. have been used to characterise genetic diversity in Prunus
germplasm collections (Messeguer et al., 1987; Gašíc et al., 2000; Hurtado et al., 2001;
Quarta et al., 2001; Decroocq et al., 2004). In turn, this information can help in the
selection of a core collection that is more representative of the main collection.
Microsatellite markers, or simple sequence repeats (SSRs), which are codominant, and
highly polymorphic markers easily detected with PCR procedure, appear as the best
available choice of markers for peach assessment (Testolin et al., 2000; Dirlewanger et
al., 2002; Aranzana et al., 2003a).
The principal aims of this study are the conservation and molecular characterization
of the Spanish peach germplasm. For this purpose, several local germplasm prospecting
were carried out in all the Spanish territory to start up collections of peach varieties
(Cambra, 1988). These peach germplasm were morphologically characterised and now
they are under molecular characterisation, to be efficiently conserved and used as source
of traits for breeding programs.
In this work, 15 SSRs were used from published sequences for the screening of 94
peach accessions composed of Spanish peach cultivars, and some commercial varieties
included as references, in order to: (1) examine SSR polymorphism among cultivars; (2)
estimate the genetic relationships among native cultivated peaches; and (3) examine the
genetic diversity among native and new commercial varieties.
4-2. MATERIALS AND METHODS
4-2-1. Plant material
A set of 94 peach [Prunus persica (L.) Batsch] cultivars including 64 Spanish native
cultivars and 30 commercial cultivars, 26 from USA (Table 4-1), were studied.
69
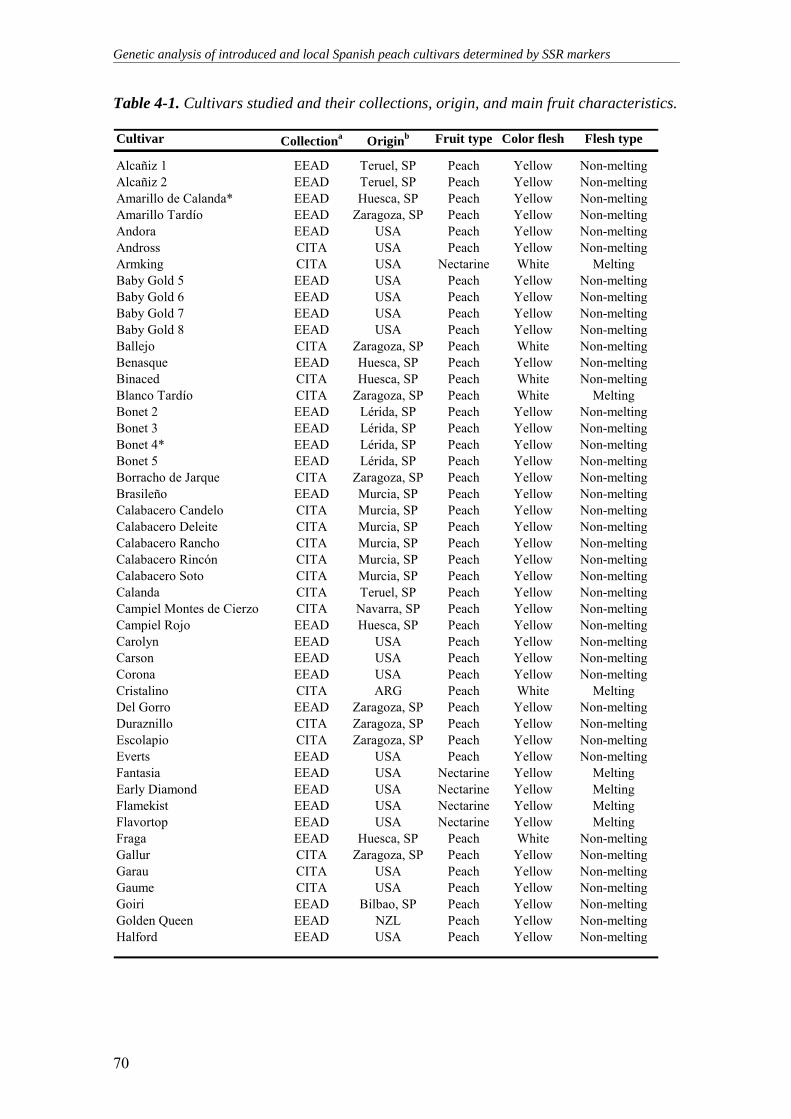
Genetic analysis of introduced and local Spanish peach cultivars determined by SSR markers
Table 4-1. Cultivars studied and their collections, origin, and main fruit characteristics.
Cultivar Collectiona Originb Fruit type Color flesh Flesh type
Alcañiz 1 EEAD Teruel, SP Peach Yellow Non-meltingAlcañiz 2 EEAD Teruel, SP Peach Yellow Non-meltingAmarillo de Calanda* EEAD Huesca, SP Peach Yellow Non-meltingAmarillo Tardío EEAD Zaragoza, SP Peach Yellow Non-meltingAndora EEAD USA Peach Yellow Non-meltingAndross CITA USA Peach Yellow Non-meltingArmking CITA USA Nectarine White MeltingBaby Gold 5 EEAD USA Peach Yellow Non-meltingBaby Gold 6 EEAD USA Peach Yellow Non-meltingBaby Gold 7 EEAD USA Peach Yellow Non-meltingBaby Gold 8 EEAD USA Peach Yellow Non-meltingBallejo CITA Zaragoza, SP Peach White Non-meltingBenasque EEAD Huesca, SP Peach Yellow Non-meltingBinaced CITA Huesca, SP Peach White Non-meltingBlanco Tardío CITA Zaragoza, SP Peach White MeltingBonet 2 EEAD Lérida, SP Peach Yellow Non-meltingBonet 3 EEAD Lérida, SP Peach Yellow Non-meltingBonet 4* EEAD Lérida, SP Peach Yellow Non-meltingBonet 5 EEAD Lérida, SP Peach Yellow Non-meltingBorracho de Jarque CITA Zaragoza, SP Peach Yellow Non-meltingBrasileño EEAD Murcia, SP Peach Yellow Non-meltingCalabacero Candelo CITA Murcia, SP Peach Yellow Non-meltingCalabacero Deleite CITA Murcia, SP Peach Yellow Non-meltingCalabacero Rancho CITA Murcia, SP Peach Yellow Non-meltingCalabacero Rincón CITA Murcia, SP Peach Yellow Non-meltingCalabacero Soto CITA Murcia, SP Peach Yellow Non-meltingCalanda CITA Teruel, SP Peach Yellow Non-meltingCampiel Montes de Cierzo CITA Navarra, SP Peach Yellow Non-meltingCampiel Rojo EEAD Huesca, SP Peach Yellow Non-meltingCarolyn EEAD USA Peach Yellow Non-meltingCarson EEAD USA Peach Yellow Non-meltingCorona EEAD USA Peach Yellow Non-meltingCristalino CITA ARG Peach White MeltingDel Gorro EEAD Zaragoza, SP Peach Yellow Non-meltingDuraznillo CITA Zaragoza, SP Peach Yellow Non-meltingEscolapio CITA Zaragoza, SP Peach Yellow Non-meltingEverts EEAD USA Peach Yellow Non-meltingFantasia EEAD USA Nectarine Yellow MeltingEarly Diamond EEAD USA Nectarine Yellow MeltingFlamekist EEAD USA Nectarine Yellow MeltingFlavortop EEAD USA Nectarine Yellow MeltingFraga EEAD Huesca, SP Peach White Non-meltingGallur CITA Zaragoza, SP Peach Yellow Non-meltingGarau CITA USA Peach Yellow Non-meltingGaume CITA USA Peach Yellow Non-meltingGoiri EEAD Bilbao, SP Peach Yellow Non-meltingGolden Queen EEAD NZL Peach Yellow Non-meltingHalford EEAD USA Peach Yellow Non-melting
70

Capítulo 4
Table 4-1 (continued)
Cultivar Collectiona Originb Fruit type Color flesh Flesh type
Infanta Isabel EEAD Valencia, SP Peach Yellow Non-meltingJerónimo CITA Murcia, SP Peach Yellow Non-meltingJerónimo de Alfaro EEAD Murcia, SP Peach Yellow Non-meltingJerónimo Ortiz CITA Murcia, SP Peach Yellow Non-meltingJerónimo Torres CITA Murcia, SP Peach Yellow Non-meltingJesca CITA Teruel, SP Peach Yellow Non-meltingJungerman EEAD USA Peach Yellow Non-meltingKlamt EEAD USA Peach Yellow Non-meltingLoadel EEAD USA Peach Yellow Non-meltingMaluenda* EEAD Zaragoza, SP Peach Yellow Non-meltingManolito CITA Lérida, SP Peach Yellow Non-meltingMaruja Perfección CITA Murcia, SP Peach Yellow Non-meltingMay Grand CITA USA Nectarine Yellow MeltingMiraflores Serapio CITA Zaragoza, SP Peach Yellow Non-meltingMontamar CITA Zaragoza, SP Peach Yellow Non-meltingNuevo 2803 EEAD FRA Peach Yellow Non-meltingOrtiz CITA Zaragoza, SP Peach Yellow Non-meltingPaloro A EEAD Badajoz, SP Peach Yellow Non-meltingPaloro B EEAD Badajoz, SP Peach Yellow Non-meltingParaguayo Amarillo CITA Zaragoza, SP Flat White MeltingParaguayo Caspe CITA Zaragoza, SP Flat White MeltingParaguayo San Mateo CITA Zaragoza, SP Flat White MeltingParaguayo Sweet cap CITA FRA Flat White MeltingParaguayo Villamayor CITA Zaragoza, SP Flat White MeltingPepita CITA Huesca, SP Peach Yellow Non-meltingPigat CITA Huesca, SP Peach Yellow Non-meltingPigat Susagna CITA Huesca, SP Peach White Non-meltingPomar 1 CITA Lérida, SP Peach White Non-meltingRedhaven CITA USA Peach Yellow MeltingRojo Amarillo de Septiembre CITA Zaragoza, SP Peach Yellow Non-meltingRojo del Rito CITA Lérida, SP Peach Yellow Non-meltingRojo del Rito 5233 CITA Lérida, SP Peach Yellow Non-meltingSan Jaime CITA Lérida, SP Peach Yellow Non-meltingSan Lorenzo CITA Huesca, SP Peach Yellow Non-meltingSelma EEAD USA Peach Yellow Non-meltingSeptember Red CITA USA Nectarine Yellow MeltingStarn EEAD USA Peach Yellow Non-meltingSudanell 1 CITA Lérida, SP Peach Yellow Non-meltingSudanell 2 CITA Lérida, SP Peach Yellow Non-meltingSudanell 3 CITA Lérida, SP Peach Yellow Non-meltingSudanell Blanco EEAD Zaragoza, SP Peach White Non-meltingTambarria CITA Navarra, SP Peach White Non-meltingTardío del Pilar* EEAD Teruel, SP Peach Yellow Non-meltingValentín CITA Navarra, SP Peach White Non-meltingZaragozano Amarillo* EEAD Zaragoza, SP Peach Yellow Non-meltingZaragozano Rojo* EEAD Zaragoza, SP Peach Yellow Non-melting
a EEAD: Estación Experimental de Aula Dei (CSIC); CITA: Centro de Investigación y Tecnología Agroalimentaria (DGA). b SP: Spain; USA: United States of America; FR: France; ARG: Argentine; NZL: New Zealand * Cultivars studied in Bouhadida et al., 2007.
71

Genetic analysis of introduced and local Spanish peach cultivars determined by SSR markers
All cultivars are clingstone but one (‘Flavortop’) which is freestone. Cultivars were
obtained from the peach germplasm collections of the “Centro de Investigación y
Tecnología Agroalimentaria” (CITA) and the “Estación Experimental de Aula Dei”
(CSIC) both of them located at Zaragoza (Spain).
4-2-2. DNA extraction and microsatellite amplification
Total genomic DNA was extracted using the modified CTAB procedure described by
Cheng et al. (1997). The DNA was quantified using a spectrophotometer (Gene Quant,
Amersham Pharmacia Biotech), and diluted to 5 ng/µl to carry out PCR amplification
reactions.
The 94 peach genotypes were analysed using 15 SSRs primer pairs previously
developed in peach by different research groups (Table 4-2). These 15 SSRs were
selected according to their high polymorphism and their clear and repeatable
amplification patterns. Amplification reactions were carried out according to the
protocol cited by Bouhadida et al. (2007). The PCR amplifications were carried out on a
Gene Amp 2700 thermocycler (Applied Biosystems) using the following temperature
cycles: 1 cycle of 3 min at 95ºC, 35 cycles of 1 min at 94ºC, 45 s at the corresponding
annealing temperature (Table 4-2) and 1 min at 72ºC. The last cycle was followed by a
final incubation for 7 min at 72ºC and the PCR products were stored at 4ºC before
electrophoresis analysis. At least two independent SSR reactions were performed for
each DNA sample until two data points were available for each SSR per cultivar
combination. The DNA amplification products were loaded on denaturing 5%
polyacrilamide gels. The gels were silver-stained according to the protocol described by
Bassam et al. (1983). Fragment sizes were estimated with the 30-330 bp AFLP ladder
(Invitrogen, Carlsbad, Calif.) DNA sizing markers, and analysed by the Quantity One
program (Bio Rad, Hercules, CA).
4-2-3. Data analysis
To evaluate the information obtained with the 15 SSRs studied, we calculated the
next parameters: the number of alleles (N), the effective number of alleles (Ne) per locus
(Ne= 1/Σpi2, were pi is the frequency of the ith allele), the observed heterozygosity (Ho =
number of heterozygous individuals/number of individuals scored), the expected
72
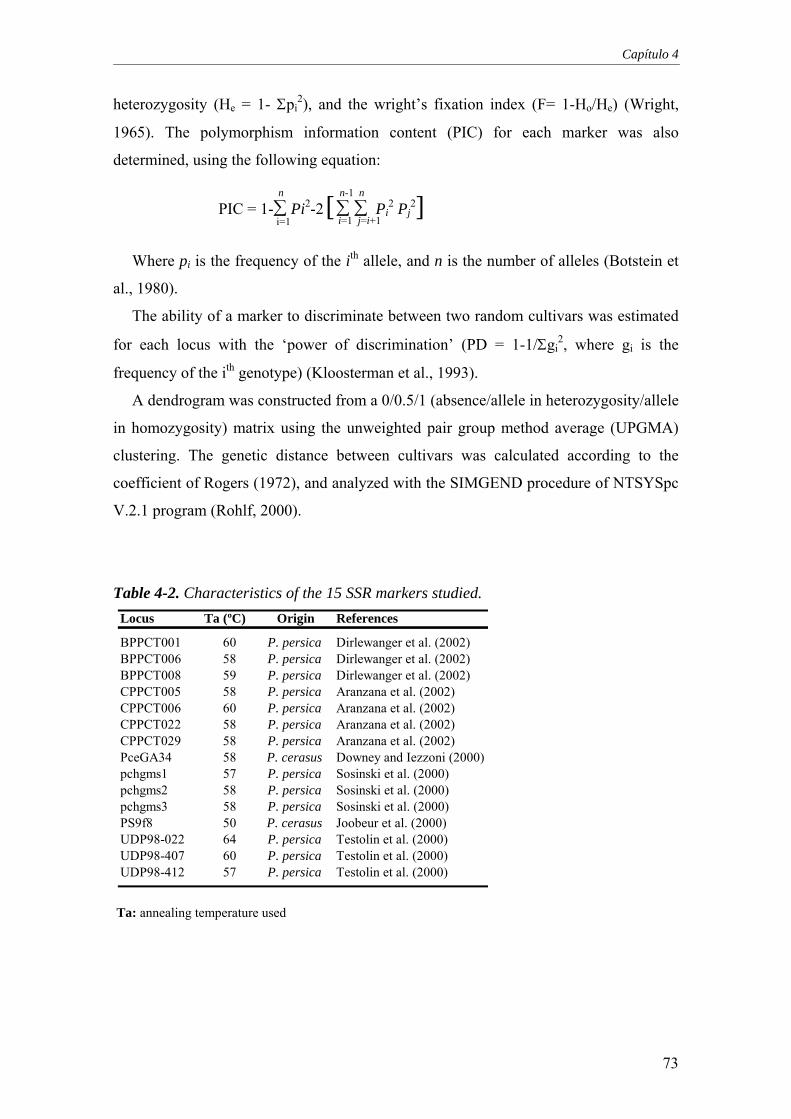
Capítulo 4
heterozygosity (He = 1- Σpi2), and the wright’s fixation index (F= 1-Ho/He) (Wright,
1965). The polymorphism information content (PIC) for each marker was also
determined, using the following equation:
PIC = 1-∑ Pi2-2 [∑ ∑ Pi
2 Pj2]
n n-1 n
i=1 j=i+1 i=1
Where pi is the frequency of the ith allele, and n is the number of alleles (Botstein et
al., 1980).
The ability of a marker to discriminate between two random cultivars was estimated
for each locus with the ‘power of discrimination’ (PD = 1-1/Σgi2, where gi is the
frequency of the ith genotype) (Kloosterman et al., 1993).
A dendrogram was constructed from a 0/0.5/1 (absence/allele in heterozygosity/allele
in homozygosity) matrix using the unweighted pair group method average (UPGMA)
clustering. The genetic distance between cultivars was calculated according to the
coefficient of Rogers (1972), and analyzed with the SIMGEND procedure of NTSYSpc
V.2.1 program (Rohlf, 2000).
Table 4-2. Characteristics of the 15 SSR markers studied.
Locus Ta (ºC) Origin References
BPPCT001 60 P. persica Dirlewanger et al. (2002)BPPCT006 58 P. persica Dirlewanger et al. (2002)BPPCT008 59 P. persica Dirlewanger et al. (2002)CPPCT005 58 P. persica Aranzana et al. (2002)CPPCT006 60 P. persica Aranzana et al. (2002)CPPCT022 58 P. persica Aranzana et al. (2002)CPPCT029 58 P. persica Aranzana et al. (2002)PceGA34 58 P. cerasus Downey and Iezzoni (2000)pchgms1 57 P. persica Sosinski et al. (2000)pchgms2 58 P. persica Sosinski et al. (2000)pchgms3 58 P. persica Sosinski et al. (2000)PS9f8 50 P. cerasus Joobeur et al. (2000)UDP98-022 64 P. persica Testolin et al. (2000)UDP98-407 60 P. persica Testolin et al. (2000)UDP98-412 57 P. persica Testolin et al. (2000)
Ta: annealing temperature used
73
Genetic analysis of introduced and local Spanish peach cultivars determined by SSR markers
74
4-3. RESULTS
4-3-1. Genetic diversity of SSRs markers and cultivars identification
Ninety four peach cultivars were analysed with 15 polymorphic SSRs. All loci
analysed in this study were multiallelic. The number of alleles detected for each locus
was ranged from 2 (PceGA34, pchgms1, pchgms 2) to 11 (UDP98-412), with a total of
101 alleles for all loci and an average of 6.73 alleles per locus (Table 4-3). Allele sizes
differed by two or more nucleotides. Size differences detected between alleles at the
same locus, ranged from 2 to 68 bp and differences between consecutives alleles ranged
from 2 to 32 bp, being 2 bp in 47% of the cases. The alleles obtained in different loci
and their respective frequencies are shown in the Table 4-3.
The most frequent alleles of this study were detected for the loci pchgms1 (194 bp)
and pchgms2 (157 bp), which showed frequencies higher than 90%. Seven alleles
(6.93%) showed frequencies between 0.40 and 0.90, and 16 alleles (15.84%) showed
frequencies between 0.20 and 0.40. However, 45 alleles (44.5%) showed low
frequencies (less than 5%) (Table 4-3).
Thirteen loci, from the 15 analysed, showed one to six rare alleles (frequency less
than 5%) each one, with a total of 45 (Table 4-3). Thirty three from the 45 rare alleles
were observed for the non-melting peach cultivars. Moreover, 14 from the 45 rare
alleles were unique (unique allele, with frequency = 0.005) and most of them (10) were
also detected in the non-melting peach group.
Among all the polymorphic alleles (101) observed in this study, 92 were found in the
79 non-melting peaches (forty one were specific for this group), 59 in the eight melting
peaches and 44 alleles in the seven nectarines. The nectarine and the melting peach
groups showed only one specific allele each one. On the other hand, 36 alleles were
shared by the three groups, 15 were common to the non-melting and melting peach
groups, and seven were found in both nectarine and melting peach groups.
Samples in which only a single allele per locus was detected, were considered
homozygous genotypes instead of heterozygous with a null allele (that did not amplify)
for the purpose of computing genetic diversity parameters. Assuming homozygosity, the
result will be an overestimation of the allele frequency and an underestimation of
heterozygosity values.

Table 4-3. Allele size (AS) in base pairs and allele frequency (AF) observed for the 94 peach cultivars analysed with 15 SSR markers.
Letter code AS AF AS AF AS AF AS AF AS AF AS AF AS AF AS AF AS AFA 134 0.059 119 0.601 103 0.106 153 0.867 182 0.005 232 0.027 178 0.005 144 0.362 194 0.947B 148 0.011 121 0.053 135 0.080 155 0.005 184 0.144 252 0.053 184 0.005 148 0.617 196 0.053C 154 0.149 127 0.043 137 0.250 157 0.032 194 0.761 254 0.011 192 0.484D 156 0.117 129 0.027 139 0.074 161 0.005 196 0.011 282 0.043 194 0.154E 158 0.176 131 0.154 149 0.005 176 0.005 198 0.005 284 0.011 196 0.293F 160 0.122 133 0.005 155 0.053 178 0.064 288 0.138 198 0.021G 162 0.202 135 0.053 157 0.287 180 0.021 294 0.011H 164 0.011 137 0.043 159 0.096 296 0.394I 166 0.154 141 0.021 161 0.037 298 0.229J 300 0.064K
PceGA34CPPCT006 CPPCT022 CPPCT029 pchgms1BPPCT001 BPPCT006 BPPCT008 CPPCT005
Table 4-3 (continued)
Letter code AS AF AS AF AS AF AS AF AS AF AS AFA 157 0.984 173 0.005 152 0.011 127 0.346 184 0.261 102 0.005B 165 0.005 175 0.043 154 0.021 133 0.011 186 0.011 116 0.005C 181 0.633 156 0.181 135 0.096 206 0.059 118 0.016D 204 0.069 160 0.048 137 0.223 208 0.410 124 0.016E 206 0.229 162 0.032 139 0.150 210 0.213 126 0.117F 164 0.059 141 0.138 218 0.021 128 0.059G 166 0.261 143 0.011 236 0.016 130 0.293H 168 0.271 132 0.388I 170 0.027 134 0.069J 172 0.005 136 0.011K 138 0.011
pchgms2 pchgms3 PS9f8 UDP98-407 UDP98-412UDP98-022

Genetic analysis of introduced and local Spanish peach cultivars determined by SSR markers
The observed heterozygosity varied between 1% (pchgms2) and 43% (BPPCT006),
with an average value of 23%. The expected heterozygosity ranged from 3% in
pchgms2 to 85% in BPPCT001, with an average value of 57% (Table 4-4). The wright’s
fixation index (F) compares He with Ho, estimating the degree of allelic fixation, and
ranged from 0.30 in BPPCT006 to 0.76 in CPPCT029, with an average value of 0.58.
The PIC values are equal or slightly lower than the expected heterozygosity, and are
correlated with the corresponding Ne (effective number of alleles) values (Table 4-4).
The most informative locus of this study was BPPCT001, with a PIC value of 0.84 and
a Ne of 6.67, while the less informative one was pchgms2 with a PIC and Ne values of
0.03 and 1.03, respectively (Table 4-4).
Table 4-4. Parameters of variability calculated for the 15 SSR markers in 94 peach cultivars.
Locus N Ne Ho He F PIC # Genotypes PDBPPCT001 9 6.67 0.41 0.85 0.51 0.84 22 0.93BPPCT006 9 2.53 0.43 0.60 0.30 0.59 15 0.79BPPCT008 9 5.51 0.27 0.82 0.68 0.81 21 0.87CPPCT005 7 1.32 0.14 0.24 0.43 0.24 11 0.31CPPCT006 5 1.67 0.15 0.40 0.63 0.40 5 0.50CPPCT022 10 4.23 0.19 0.76 0.75 0.75 16 0.81CPPCT029 6 2.91 0.16 0.66 0.76 0.63 9 0.74PceGA34 2 1.95 0.19 0.49 0.61 0.44 3 0.62pchgms1 2 1.11 0.06 0.10 0.37 0.10 3 0.16pchgms2 2 1.03 0.01 0.03 0.66 0.03 2 0.04pchgms3 5 2.18 0.27 0.54 0.51 0.51 8 0.70PS9f8 10 5.49 0.31 0.82 0.62 0.80 24 0.89UDP98-022 7 4.93 0.35 0.78 0.55 0.77 17 0.89UDP98-407 7 3.51 0.30 0.71 0.58 0.69 11 0.81UDP98-412 11 3.86 0.21 0.74 0.71 0.72 18 0.81
Mean 6.73 3.24 0.23 0.57 0.58 0.55 12.33 0.66All loci 101 48.89 185 1
N: Number of alleles; Ne: Effective number of alleles; Ho: Observed heterozygosity; He: Expected heterozygosity; F: wright’s fixation index; PIC: Polymorphism information content; PD: Discrimination power.
Table 4-4 also shows the discrimination power (PD) for each SSR locus. The
highest discrimination power was observed in BPPCT001 (0.93), whereas pchgms2
showed the lowest one (0.04) with a mean value of 0.66. According to this last result, it
was observed that all loci distinguished up 185 different genotypes. The selection of the
five most polymorphic loci which revealed the highest number of different genotypes:
76
Capítulo 4
PS9f8 (24); BPPCT001 (22); BPPCT008 (21); UDP98-412 (18); and UDP98-022 (17),
allowed us to distinguished unambiguously all the 64 Spanish native peach cultivars,
with the exception of “Paraguayo Villamayor” and “Paraguayo San Mateo”. To identify
separately these two cultivars, an additional BPPCT006 marker was selected, which
revealed distinct alleles between them.
An identification key was established to distinguish among the 64 Spanish native
peach cultivars (Figure 4-1). The procedure consist at joining together the cultivars
presenting the same genotype for one locus. Cultivars which showed different
genotypes were separated. This process was repeated for the six selected loci until the
separation of all the cultivars, as it is shown in Figure 4-1.
The six selected loci also allowed the identification of 92 genotypes from the 94
studied. Whereas, the cultivars “Halford” and “Gaume”, as well as “Valentín” and
“Garau”, showed the same genetic profile each pair with the six SSRs. The loci
CPPCT022 and CPPCT029 were also selected to separate between the first and the
second pair of cultivars, respectively. Consequently, only eight from the 15 SSRs
initially used, allowed the total identification of all (94) peach cultivars included in the
study.
77

Genetic analysis of introduced and local Spanish peach cultivars determined by SSR markers
ii BPPCT008
ah
ai
ci
di
ffgg
gh
aa PS9f8 cc UDP98-412 gg UDP98-022 cdad
dd
hh
ahgi BPPCT008ac
ai
hh PS9f8ddgg UDP98-412 ff
hh
ccdh
gg BPPCT008 aaccgg PS9f8 ah UDP98-412 ee UDP98-022
eg BPPCT008 agch
bb PS9f8 ce UDP98-412gh
hh
fg
ff
ei BPPCT008
cc
aabbci
ee BPPCT008
bb
dibc
gg
aa
adcc PS9f8 hh UDP98-022hhUDP98-412
cfci
dg
di
afff
aa PS9f8 ccee
dd BPPCT008
ahgg PS9f8
gg UDP98-412 ef UDP98-022aaaf
BPPCT008cc
di
cciigiUDP98-022 ffdh gg UDP98-412 iiPS9f8 BPPCT006
bb PS9f8 cc
gg gh
bbPS9f8
cc PS9f8cdce
cgci
bb
dg
cg BPPCT008
gghh
cd BPPCT008
BPPCT001
Ballejo
Bonet 4
Tardío del Pilar
Alcañiz 2
Miraflores Serapio
San Jaime
Ortiz
Bonet 3
Benasque
Bonet 5
Escolapio
Jerónimo
Amarillo Tardío
Tambarria
Pomar 1
Borracho de Jarque
Jesca
Rojo Amarillo de Septiembre
Rojo del Rito 5233
Sudanell Blanco
Rojo del Rito
Alcañiz 1
Goiri
Jerónimo Ortiz
Sudanell 1
Maruja Perfección
Sudanell 3
Jerónimo Torres
Paloro A
Paloro B
Pepita
Maluenda
Bonet 2
Zaragozano Rojo
Pigat
Sudanell 2
Montaced
Amarillo de Calanda
Infanta IsabelDuraznilloParaguayo Villamayor
Paraguayo Caspe
Paraguayo Amarillo
Pigat Susagna
Calabacero Rincón
Calabacero Rancho
Blanco Tardío
FragaCampiel Montes de Cierzo
Zaragozano Amarillo
Brasileño
Calabacer o Candelo
Campiel Rojo
Paraguayo San Mateo
Montamar
Gallur
Calabacero Soto
San Lorenzo
Calabacero Deleite
Manolito
Calanda
Del GorroJerónimo de Alfaro
Figure 4-1. Identification key for the 64 Spanish native peach cultivars based on six microsatellite markers: BPPCT001, BPPCT006, BPPCT008, PS9f8, UDP98-022 and UDP98-412.
78
Capítulo 4
4-3-2. Genetic relationships among peach cultivars based on SSR variation
To elucidate genetic relationships among the peach cultivars studied, a dendrogram
was produced using UPGMA cluster analysis and the Rogers distance over the 15 SSR
loci (Figure 4-2).
The cultivars were clustered in two different groups. The first one constituted a main
group which was subdivided into different subgroups. On the contrary, the second
group of the dendrogram was composed of only five cultivars, representing four flat
white melting peach and the white non-melting peach cultivar ‘Binaced’.
At the similarity coefficient value of 0.38, the first main group, generated from the
UPGMA cluster analysis, showed four subgroups. The first subgroup was composed of
most clingstone non-melting peaches of this study, and this subgroup was also divided
into different clusters. The second and third subgroups were composed of three
clingstone non-melting peach cultivars each one, while all the nectarines and melting
peaches (except Spanish flat melting peach cultivars) were clustered together in the
fourth subgroup. This last one is divided into two clusters, the first one comprising all
the nectarine cultivars, while the second one was composed of four melting peach
cultivars and some non-melting peaches (‘Ortiz’, ‘Sudanell 3’, ‘Montamar’, ‘Babygold
7’, ‘Babygold 6’, and ‘Babygold 8’).
The first subgroup of the first main group appeared as the most diversified one,
showing a large genetic variability among the peach cultivars. It is relevant to notice
that inside of this subgroup, most of the peach cultivars are local Spanish one. We can
also observe (Figure 4-2), that all peach cultivars from the Murcia region (South-West
of Spain) were clustered together but one (‘Brasileño’). Inside of this cluster, there are
also peach cultivars from other regions of Spain (Valencia, Badajoz, Lérida, Bilbao) and
some foreign ones. Inside of the first subgroup, it was also observed other clusters
grouping Spanish native peach cultivars, mostly from the Ebro Valley area (Lérida,
Zaragoza, Teruel, Huesca, Navarra) in the North-West of Spain.
Considering genetic distance values, non-melting peaches were the most diverse with
an average distance between cultivars of 0.40, compared with 0.25 for nectarines and
0.32 for melting peaches. The non-melting peaches were also the most separated from
the others, with average distances of 0.43 and 0.40 from the melting peaches and
79

Genetic analysis of introduced and local Spanish peach cultivars determined by SSR markers
nectarines, respectively. A lower average distance was detected between melting
peaches and nectarines with a value of 0.35.
Some cultivars of this study were closely related, for example ‘San Jaime’ and
‘Maruja Perfección’; ‘Selma’ and ‘Calabacero Rancho’; ‘Amarillo de Calanda’ and
‘Tardío del Pilar’, with distance coefficient values of 0.020, 0.025, and 0.025,
respectively. The highest distance between cultivars was found between ‘Paraguayo
Villamayor’ and ‘Campiel Montes de Cierzo’ with a genetic distance of 0.58.
80
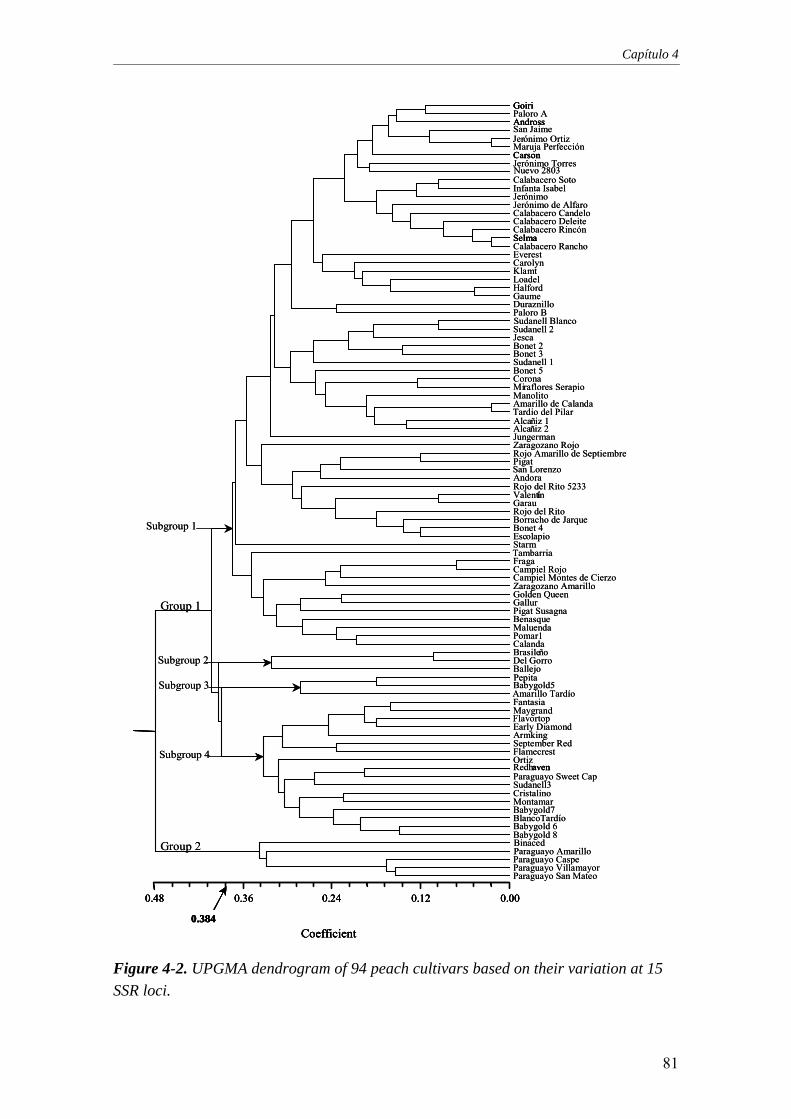
Capítulo 4
Pepita
Fantasia
Flamecrest
Sudanell3
Montamar
Babygold 6
Paraguayo Caspe
Early Diamond
Babygold5
Maygrand
Armking
Ortiz
Babygold7
Babygold 8
Paraguayo San Mateo
GoiriPaloro AAndross
Jerónimo OrtizSan Jaime
Maruja PerfecciónCarsonJerónimo TorresNuevo 2803Calabacero SotoInfanta IsabelJerónimoJerónimo de AlfaroCalabacero CandeloCalabacero DeleiteCalabacero RincónSelmaCalabacero RanchoEverestCarolynKlamtLoadelHalfordGaumeDuraznilloPaloro BSudanell BlancoSudanell 2JescaBonet 2Bonet 3Sudanell 1Bonet 5CoronaMiraflores SerapioManolitoAmarillo de CalandaTardio del PilarAlcañiz 1Alcañiz 2JungermanZaragozano RojoRojo Amarillo de SeptiembrePigatSan LorenzoAndoraRojo del Rito 5233ValentínGarauRojo del RitoBorracho de JarqueBonet 4EscolapioStarmTambarriaFragaCampiel RojoCampiel Montes de CierzoZaragozano AmarilloGolden QueenGallurPigat SusagnaBenasqueMaluendaPomar1CalandaBrasileñoDel GorroBallejo
Amarillo Tardío
Flavortop
September Red
RedhavenParaguayo Sweet Cap
Cristalino
BlancoTardío
Paraguayo Amarillo
Paraguayo Villamayor
Coefficient
0.000.120.240.360.48
Group 1
Group 2
Subgroup 1
Subgroup 2
Subgroup 3
Subgroup 4
0.384
Goiri
Andross
Carson
Selma
í
aven
Binaced
Coefficient
0.000.120.240.360.48
0.384
Figure 4-2. UPGMA dendrogram of 94 peach cultivars based on their variation at 15 SSR loci.
81

Genetic analysis of introduced and local Spanish peach cultivars determined by SSR markers
4-4. DISCUSSION
4-4-1. Microsatellite polymorphism
In this study, we obtained an average number of alleles per locus of 6.7. This average
was higher than averages observed by others authors [(4.2) Dirlewanger et al., 2002;
(4.5) Testolin et al., 2000; (2.3) Bouhadida et al., (2007)]. This can be explained by the
use of a large number of cultivars and a set of high polymorphic microsatellites.
The level of polymorphism and the range of amplified band sizes (Tables 4-3 and 4-
4) are similar to those reported by Aranzana et al. (2003a) for peach, using 11 common
SSR markers to that used in this study. Results are also consistent with Testolin et al.
(2000) using UDP markers in other peach cultivars.
Thirty three from the 45 rare alleles found in this study were observed for the non-
melting peaches, 10 of them being unique alleles. This result can be explained by the
high number of non-melting cultivars studied (79 out of 94), and can also give
information about the genetic diversity inside of this peach group, especially inside of
the Spanish non-melting peach group which represent 59 from the 79 non-melting
peach cultivars of this study. Moreover, the non-melting peach cultivars presented 41
specific alleles out of the 92 detected for this group, which confirm its high variability
with respect to nectarine (one specific allele) and melting peach (one specific allele)
groups. Aranzana et al. (2003a) analysed peach cultivars, using 16 SSRs, and also
observed that the non-melting peach group, was the most diverse one with 76 alleles,
and showing the highest number (18) of specific alleles with respect to melting peach
(8) and nectarine (16) groups. High average genetic distances detected first, within non-
melting cultivars, and second, between non-melting and melting (0.43) as well as
between non-melting and nectarine (0.40) groups, also give information about the high
diversity of the non-melting peach cultivars of this study. These results well agree with
results found by Aranzana et al. (2003a).
Values of the observed heterozygosity were lower than the corresponding expected
heterozygosity for all loci. In the present study, observed heterozygosity averaged over
the 15 SSR loci was 0.23, lower than the 0.35 mean value reported by Aranzana et al.
(2003a) for a set of 212 peach cultivars analysed with 16 SSRs. This can be explained
by the presence of null alleles that affected the heterozygosity level. The mean value of
the expected heterozygosity was 0.57, slightly higher than the 0.50 obtained by
82
Capítulo 4
Aranzana et al. (2003a). The high allele number observed in this study (mean
value=6.7) and the expected heterozygosity reflect the ability of SSR markers to provide
unique molecular profiles for individual plant genotypes.
The highest PIC value and the highest Ne were observed for BPPCT001 (PIC=0.84
and Ne=6.67). Our results indicate that these two parameters, PIC and Ne, are very
useful for the evaluation of adequate SSR markers to distinguish unambiguously related
peach cultivars. In fact, it is important to select the most informative SSR loci to reduce
the number of loci necessary to characterize a peach collection.
Moreover, the mean value of the discrimination power (PD) obtained in this study
(0.66), agrees well with the mean value (0.64) obtained by Aranzana et al. (2003a),
which also indicates that SSR markers can be used to identify a high level of variation
in peach.
The fixation index average (F=0.58) indicated very great genetic differentiation
(Hartl and Clark, 1997) among the peach accessions studied. At the same time, this
average showed an excess of homozygotes (Murray, 1996). This may be due to two
factors: First, 'null alleles' may be present which are leading to a false observation of
excess homozygotes. Second, inbreeding may be common in the population.
Peach is, in fact, a self-fertile and naturally self-pollinates. It is considered tolerant of
inbreeding, and open pollination usually results in less than 5% outcrossing (Fogle,
1977), which can explain this deviation from the Hardy-Weinberg equilibrium. On the
other hand, the high level of genetic differentiation detected among the peach
accessions could be explained by the peach mating system and by a low level of gene
flow in this species. These findings could be attributing either to the different
geographical region of accessions or to human impact. Maghuly et al. (2005) also
reported similar observations for apricot.
4-4-2. Genetic relationships among cultivars
The dendrogram generated from the UPGMA cluster analysis (Figure 4-2) produced
several significant groups, related to the morphological characteristics and the
geographical origin of the genotypes. The dendrogram obtained shows two main
groups, the first one constituted the most important group, which is divided in four
subgroups subdivided in turn in clusters. The first subgroup is the largest one and was
composed mostly of Spanish yellow and non-melting peach cultivars. Close
83
Genetic analysis of introduced and local Spanish peach cultivars determined by SSR markers
relationships among genotypes mostly coming from Murcia region (peaches of types
‘Jerónimos’, ‘Maruja Perfección’, and ‘Calabaceros’) were observed and were grouped
under the same cluster, inside of the subgroup 1. The genetic relatedness among these
cultivars can be explained by their same geographical origin. Inside of this cluster, there
is also peach cultivars from different Spanish areas (Valencia, Badajoz, Lérida, Bilbao)
and three foreign ones (‘Andross’, ‘Carson’, and ‘Selma’) coming from American
breeding programs. The close relationships observed in this case can be explained by
the similar morphological characteristics shared by these peach accessions and may be
they come from the same genetic pool.
The subgroup 1 was composed of other clusters grouping Spanish native peach
cultivars, mostly from the Ebro Valley (Lérida, Zaragoza, Teruel, Huesca, Navarra).
The low genetic variability observed in each cluster of the subgroup 1 can be explained
by the narrow genetic base explained by the common development of these varieties for
the more narrowly defined environments of the Ebro Valley. Bouhadida et al. (2007)
also mentioned a close relationship among some cultivars included in this study and
originated from the Ebro valley area. Nevertheless, the genetic distances inter-clusters
which grouped peach cultivars from narrow geographical origin (Ebro Valley) are
relatively high, which explain a genetic diversity among clusters. This can be due to the
mating system in peach which reduce the gene flow and consequently increase the
genetic differentiation. The higher diversity observed in the group of non-melting peach
cultivars, was also reported by Aranzana et al. (2003a).
All the nectarine and melting peach cultivars but four flat melting peach were
clustered together in the fourth subgroup. Aranzana et al. (2003a) also observed a
narrow genetic base among melting peach and nectarine with respect to non-melting
peach cultivars. However, some non-melting peach cultivars (‘Ortiz’, ‘Sudanell 3’,
‘Montamar’, ‘Babygold 7’, ‘Babygold 6’, and ‘Babygold 8’) were also clustered in the
fourth subgroup. This can be explained by the existence of a common genetic base
within the cultivars of this subgroup. Aranzana et al. (2003a) also observed one non-
melting peach cultivar (‘Babygold 7’) clustered with the melting peach group, which
can agree with our findings.
The second main group of the dendrogram was composed of only five cultivars
representing four flat melting peach and the white non-melting peach cultivar ‘Binaced’.
This group was clustered at a genetic distance of 0.48 from the first one. The
relationship observed among ‘Binaced’ and Spanish flat peaches of the types
84
Capítulo 4
‘Paraguayos’ was also observed by Aranzana et al. (2003a) and Wünsch et al. (2005).
These authors also showed the genetic separation of the Spanish flat peach group types
‘Paraguayos’ from the other peach cultivars.
4-4-3. Cultivar identification
Wünsch et al. (2005) examined 34 of the Spanish peach cultivars included in this
study with 10 SSR markers. They observed various synonyms among them. In fact, they
mentioned that the followed group of cultivars: ‘Paraguayo Villamayor’ and ‘Paraguayo
San Mateo’; ‘Sudanell 2’ and ‘San Lorenzo’; ‘Pomar 1’ and ‘Calanda’; ‘Rojo del Rito
(5233)’, ’Escolapio’ and ‘Borracho de Jarque’; finally, ‘San Jaime’, ‘Calabacero
Candelo’, ‘Calabacero Rincón’, ‘Calabacero Soto’, ‘Calabacero Deleite’, ‘Calabacero
Rancho’ and ‘Maruja Perfección’ showed the same SSR profile patterns for each group.
It is relevant to notice that only six SSRs of the present study permit to distinguish
unambiguously among these accessions, and no synonyms were detected in this work.
This can be explained by the high level of polymorphism of the SSRs selected and the
use of polyacrilamide electrophoresis methods, which present a higher and better
resolution and permit to detect more alleles present in the collection.
An identification key has been elaborated for the 64 Spanish native peach cultivars
basing on the selected six SSRs (Figure 4-1). This method seems to be very useful for
detection of homonyms and synonyms in the Spanish peach germplasm and aid to
establish a molecular data base for Spanish native peach cultivars. Moreover, the most
polymorphic microsatellites selected for the elaboration of this identification key can be
used for future Spanish peach identification works.
Similar identification keys have been obtained for 49 date palm cultivars (Phoenix
dactylifera L.) using three SSRs, which revealed 25 alleles and 57 genotypes (Zehdi et
al., 2004), and for 54 Tunisian apricot cultivars based on five microsatellite primer
pairs, revealing 28 alleles and 54 genotypes (Krichen et al., 2006).
4-5. CONCLUSION
Native non-melting peach population from Spain are genetically more diverse than
North American melting peaches, which used a limited number of parents from the
same gene pool inducing the drastically reduction of the genetic variability of the
85

Genetic analysis of introduced and local Spanish peach cultivars determined by SSR markers
commercial cultivars. Thus, Spanish non-melting peach cultivars can be an excellent
source of traits for breeding.
To achieve certain breeding goals in peach, particularly for wider ecological
adaptation, disease resistance and novel fruit quality traits, the use of germplasm from
different groups and eco-geographical regions will be necessary.
The use of molecular markers appears very important for genotyping of the
accessions, the classification and management of peach collections. Results from this
study indicate that SSRs are excellent co-dominant markers for cultivars
characterization in peach collections that can be used in plant breeding programmes.
REFERENCES Aranzana, M.J., García-Mas J., Carbó, J. and Arús, P. 2002. Development and
variability analysis of microsatellite markers in peach. Plant Breed. 121: 87-92.
Aranzana, M.J., Carbó, J. and Arús, P. 2003a. Microsatellite variability in peach
[Prunus persica (L.) Batsch]: cultivar identification, marker mutation, pedigree
inferences and population structure. Theor. Appl. Genet. 106: 1341-1352.
Aranzana, M., Pineda, A., Cosson, P., Dirlewanger, E., Ascasibar, J., Cipriani, G.,
Ryder, C.D., Testolin, R., Abbott, A., King, G.J., Iezzoni, A.F. and Arús, P. 2003b.
A set of simple-sequence repeat (SSR) markers covering the Prunus genome. Theor.
Appl. Genet. 106: 819-825.
Badenes, M.L., Werner, D.J., Martinez-Calvo, J., and Llácer, G. 1998. A description of
peach native populations from Spain. Fruit Var. J. 52: 80-86.
Bassam, B.J., Caetano-Anoelles, G. and Gresshoff, P.M. 1983. Fast and sensitive silver
staining of DNA in polyacrylamide gels. Anal. Biochem. 196: 80-83.
Botstein, D., White, R.L., Skolnick, M., and Davis, R.W. 1980. Construction of a
genetic linkage map in man using restriction fragment length polymorphisms. Am. J.
Hum. Genet. 32: 314-331.
Bouhadida, M., Casas, A.M., Moreno, M.A., and Gogorcena, Y. 2007. Molecular
characterization of Miraflores peach variety and relatives using SSRs. Scientia
Hortic. 111: 140-145.
Cambra, R. 1988. The peach. Culture, cultivars, breedings, propagation, nutrition,
training and puring, disease and insects, harvesting, storage and marketing. In: N.F.
86
Capítulo 4
Childers and W.B. Sherman (eds). Horticultural publications, 3906 NW 31 Pl.,
Gainesville, FL 32606, USA, pp: 186-189.
Cheng, F.S., Brown, S.K. and Weeden, N.F. 1997. A DNA extraction protocol from
various tissues in woody species. Hort. Sci. 32:921-922.
Decroocq, V., Hagen, L.S., Favé, M.G., Eyquard, J.P., and Pierronnet, A. 2004.
Microsatellite markers in the hexaploid Prunus domestica species and parentage
lineage of three European plum cultivars using nuclear and chloroplast simple-
sequence repeats. Mol. Breed. 13: 135-142.
Dirlewanger, E., Cosson, P., Tavaud, M., Aranzana, M.J., Poizat, C., Zanetto, A, Arús,
P. and Laigret, F. 2002. Development of microsatellite markers in peach [Prunus
persica (L.) Batsch] and their use in genetic diversity analysis in peach and sweet
cherry (Prunus avium L.). Theor. Appl. Genet. 105: 127-138.
Downey, S.L. and Iezzoni, A.F. 2000. Polymorphic DNA markers in black cherry
(Prunus serotina) are identified using sequences from sweet cherry, peach and sour
cherry. J. Am. Soc. Hort. Sci. 125: 76-80.
Fideghelli, C., Della Strada, G., Grassi, F., Morico, G. and Monet, R. 1998. The peach
industry in the world: present situation and trend. Acta Hort. 465: 29-40.
Fogle, H.W. 1977. Self-pollination and its implication in peach improvement. Fruit Var.
J. 31: 74-75.
Gašíc, K., Ognjanov, V., BoŠkovi´c, R. and Tobutt, K.R. 2000. Isoenzyme
polymorphism in peach cultivars. Acta Hort. 538: 517-523.
Gepts, P. 1995. Genetic markers and core collections. In: Core Collections of Plant
Genetic Resources. International Plant Genetic Resources Institute (IPGRI), pp: 127-
146.
Hartl, D.L. and Clark, A.G. 1997. Principles of population genetics, 2nd edn. Sinauer,
Sunderland.
Hurtado, M.A., Badenes, M.L., Llácer, G., Westman, A., Beck, E. and Abbott, G.A.
2001. Contribution to apricot genetic analysis with RFLP, RAPD and AFLP markers.
Acta Hort. 546: 417-420.
Joobeur, T., Periam, N., De Vicente, M.C., King, G.J. and Arús, P. 2000. Development
of a second generation linkage map for almond using RAPD and SSR markers.
Genome 43: 649-655.
87
Genetic analysis of introduced and local Spanish peach cultivars determined by SSR markers
Kloosterman, A.D., Budowle, B. and Daselaar, P. 1993. PCR-amplification and
detection of the human DIS80 VNTR locus. Amplification conditions, population
genetics and application in forensic analysis. Int. J. Leg. Med. 105: 257-264.
Krichen, L., Mnejja, M., Arùs, P., Marrakchi, M. and Trifi-Farah, N. 2006. Use of
microsatellite polymorphisms to develop an identification key for Tunisian apricots.
Genetic Resources and Crop Evolution. 00: 1-8.
Maghuly, F., Fernández, E.B., Ruthner, S., Pedryc, A. and Laimer, M. 2005.
Microsatellite variability in apricots (Prunus armeniaca L.) reflects their geographic
origin and breeding history. Tree Genetics & Genomes 1: 151-165.
Messeguer, R., Arús, P. and Carrera, M. 1987. Identification of peach cultivars with
pollen isozymes. Scientia Hortic. 31: 107-117.
Murray, B.W. 1996. The estimation of genetic distance and population substructure
from microsatellite allele frequency data. Course notes. Department of Biology, Mc
Master University, Hamilton, Ont. Available from:
http://helix.biology.mcmaster.ca/brent/brent.html.
Quarta, R., Dettori, M.T., Verde, I., Marchesi, U., Palombi, M. A., Doré, C., Dosba, F.
and Baril C. 2001. Characterization and evaluation of genetic diversity in peach
germplasm using RAPD and RFLP markers. Acta Hort. 546: 489-496.
Rogers, J.S. 1972. Measures of genetic similarity and genetic distance. Studies in
Genetics VII. Univ. Texas Publ. 7213: 145-153.
Rohlf, F.J. 2000. NTSYS-pc Numerical Taxonomy and Multivariate Analysis System.
Version 2.1. Exeter Software, Setauket, NY.
Scorza, R., Mehlenbacher, S.A. and Lightner, G.W. 1985. Inbreeding and coancestry of
freestone peach cultivars of the Eastern United States and implications for peach
germplasm improvement. J. Am. Soc. Hort. Sci. 110: 547-552.
Sosinski, B., Gannavarapu, M., Hager, L.D., Beck, L.E., King, G.J., Ryder, C.D.,
Rajapakse, S., Baird, W.V., Ballard, R.E. and Abbot, A.G. 2000. Characterization of
microsatellite in peach [Prunus persica (L.) Batsch]. Theor. Appl. Genet. 97: 1034-
1041.
Testolin, R., Marrazo, T., Cipriani, G., Quarta, R., Verde, I., Dettori, M.T., Pancaldi,
M. and Sansavini, S. 2000. Microsatellite DNA in peach (Prunus persica L. Batsch)
and its use in fingerprinting and testing the genetic origin of cultivars. Genome 43:
512-520.
88

Capítulo 4
Wright, S. 1965. The interpretation of population structure by F-statistics with special
regard to systems of mating. Evolution 19: 395-420.
Wünsch, A., Carrera, M. and Hormaza, J.I. 2005. Molecular characterization of local
Spanish peach [Prunus persica (L.) Batsch] germplasm. Genetic Resources and Crop
Evolution 53: 925-932.
Zehdi, S., Trifi, M., Billotte, N., Marrakchi, M. and Pintaud, J.C. 2004. Genetic
diversity of Tunisian date palm (Phoenix dactylifera L.) revealed by nuclear
microsatellite polymorphism. Hereditas 141: 278-287.
89


CAPÍTULO 5
Molecular characterization of Prunus
rootstocks using microsatellite markers

Capítulo 5
ABSTRACT
Twenty microsatellite primer pairs, previously developed in peach, were used to
explore genetic relationships among 44 clones, representing three groups of rootstocks
which are defined as: (1) Peach-based rootstocks (Prunus dulcis-persica, P. persica x P.
davidiana); (2) Myrobalan - Marianna plums (P. cerasifera, and interspecific hybrids
having P. cerasifera as a parent); and (3) Slow growing plums (P. insititia, P.
domestica, and P. domestica x P. spinosa). Eighteen SSR markers, from the 20 initially
used, were able to amplify polymorphic products for the Peach-based rootstocks and 13
common markers gave also polymorphism for the Myrobalan-Marianna and Slow
growing plums groups. The Dice coefficient of similarity was calculated between all
pairs of accessions and their genetic similarity represented by an UPGMA dendrogram
and a principal coordinate analysis. The genetic diversity detected among the 44 clones
studied divided them in three groups, which are in agreement with their current
taxonomic classification and their morphological characteristics. A more detailed
analysis was carried out within the peach-based group using 18 SSRs. The results of this
work suggest that SSR markers are transferable between species, and are valuable tools
for identification of cultivars and analysis of diversity in Prunus species.
Key words: Genetic diversity, Molecular characterisation, Prunus rootstocks, SSR markers.
93

Molecular characterization of Prunus rootstocks using microsatellite markers
5-1. INTRODUCTION
Prunus is a large diverse genus of woody plants which belongs to the subfamily
Prunoideae of the Rosaceae, and it is composed of approximately 400 species of trees
and shrubs (Rehder, 1940). Prunus is economically important because many species are
sources of edible fruits (e.g., apricots, cherries, nuts (almonds), peaches, and plums), oil,
timber and ornamentals (Lee and Wen, 2001). In addition, several species of Prunus (P.
dulcis D.A. Webb; P. persica (L.) Batsch; P. cerasifera Ehrh.; P. domestica L.; P.
insititia L.; etc.) are used as rootstocks.
There are many different types of rootstocks being used for Prunus on a worldwide
basis (Rom, 1982; 1984). Each one has a particular set of advantages and limitations for
the soils and climates where they are used. Some of them have wide areas of adaptation
and are used in more than one country and geographic region, while others appear to be
more narrowly adapted.
Rootstocks, the below-ground portions of fruit or ornamental trees, are critically
important because they are responsible for water and nutrient uptake, resistance to soil-
borne pathogens, tolerance to environmental stresses, etc. (Cummins and Aldwinckle,
1983; Layne, 1987). Many of the most important agricultural attributes of the trees as a
biotic unit, such as vigour, blossom initiation, fruit set, fruit size, and fruit flavour, etc.,
may be substantially influenced by the rootstock (Dozier et al., 1984). Therefore, a good
rootstock should be compatible with a broad range of scion cultivars, should be disease
free, especially virus free, and adapted to a wide range of soil types, soil reaction, soil
fertility, and soil moisture, etc. (Layne, 1987). It is unlikely that any single rootstock for
Prunus will have all of these attributes. Nevertheless, it is highly desirable to
incorporate as many of these traits as possible to increase usefulness and broaden areas
of adaptation of the new Prunus rootstocks.
Studies to improve Prunus rootstocks are underway at Aula Dei Experimental
Station for obtaining new stone fruit rootstocks, with specific adaptation to
Mediterranean environments (Moreno, 2004). Effective control and utilisation of
Prunus rootstocks in breeding programs, and Prunus management, depends upon
accurate and unambiguous characterisation. Classical methods of identification and
characterisation of cultivars in fruit trees were based on morphological, cytological or
phytochemical traits, which presented some disadvantages like high susceptibility to
environmental factors and low degree of polymorphism. Molecular markers based on
94
Capítulo 5
DNA are stable, detectable in all tissues and independent of environmental or seasonal
conditions. Molecular analyses have been previously performed within genus Prunus,
using isozyme (Mowrey and Werner, 1990), RFLP (Kaneko et al., 1986; Uematsu et al.,
1991), RAPD (Gogorcena and Parfitt, 1994; Lu et al., 1996; Casas et al., 1999) and
PCR-RFLP (Badenes and Parfitt, 1995), some aimed at the differentiation and
characterization of commercial cultivars, and other at elucidating the relationship
between taxa within the genus.
Microsatellite markers are becoming a useful tool for genotyping, germplasm
characterization and fingerprinting, because of their high level of polymorphism, co-
dominant inheritance, abundance in the genome and high reproducibility. Moreover,
they are often transferable, i.e. microsatellite primers developed for one species can be
used to detect polymorphism at homologous loci in others. In fact, SSR markers
developed in peach were used to analyse the genetic diversity of apricot (P. armeniaca
L.) (Romero et al., 2003), sour cherry (P. cerasus L.) (Sosinski et al., 2000), and sweet
cherry (P. avium L.) (Dirlewanger et al., 2002). Likewise, SSR markers identified in
sweet cherry, peach and sour cherry were used to study genetic diversity in black cherry
(P. serotina Ehrh.) (Downey and Iezzoni, 2000).
The objectives of this work were (1) to characterize commercial and selected
rootstocks from the breeding program at Aula Dei Experimental Station, and (2) to
analyse the genetic diversity among the different interspecific hybrids and species of
Prunus included in this work.
95

Molecular characterization of Prunus rootstocks using microsatellite markers
5-2. MATERIALS AND METHODS
5-2-1. Plant material
The forty-four genotypes used in this study were obtained from the stone fruit
rootstock collection maintained at Aula Dei Experimental Station (Zaragoza, Spain).
For practical purposes, the clones were divided into three groups, as shown in Table 5-
1. This classification was based on previous knowledge of taxonomic and morphologic
similarity among the clones. The groups were defined as: 1) Peach-based rootstocks,
including twelve peach [P. persica (L.) Batsch.] x almonds [P. dulcis D.A. Webb], three
P. persica (L.) Batsch. x P. davidiana (Carr.) Franch hybrids, and one P. persica (L.)
Batsch. x P. davidiana (Carr.) Franch x P. dulcis D.A. Webb]; 2) Myrobalan-Marianna
plums which included six P. cerasifera Ehrh. rootstocks, and five interspecific hybrids
having P. cerasifera as a parent; and 3) Slow growing plums (after the denomination
proposed by Bernhard and Renaud (1990), which included ten P. insititia L., five P.
domestica L. rootstocks and one interspecific P. domestica L. x P. spinosa L. hybrid. In
this group are included the “Pollizo” plums, apparently P. insititia, traditionally utilized
in Murcia (Spain) as rootstock of peach, almond and apricot (Kester and Graselly,
1987). With the criteria stated above, it was not possible to assign ‘Fereley-Jaspi’ (P.
japonica Thunb. x P. spinosa L.) to any of the mentioned groups. It was included in the
second group since it shared some morphological characteristics similar with this group.
5-2-2. Genomic DNA extraction and amplification
Fresh young leaves were ground to powder with liquid N2 using a mortar and pestle.
Genomic DNA was extracted from leaf samples according to the protocol described in
Casas et al. (1999).
Twenty SSR markers were studied, using primer pairs previously developed in peach
(Table 5-2). Amplification reactions were carried out according to the protocol cited by
Bouhadida et al. (2007). The PCR amplifications were carried out on a Gene Amp 2700
thermocycler (Applied Biosystems) using the following temperature cycles: 1 cycle of 3
min at 95ºC, 35 cycles of 1 min at 94ºC, 45 s at the corresponding annealing
temperature (Table 5-2) and 1 min at 72ºC. The last cycle was followed by a final
incubation for 7 min at 72ºC and the PCR products were stored at 4ºC before analysis.
96

Capítulo 5
Two independent SSR reactions were performed for each DNA sample. The DNA
amplification products were loaded on denaturing 5% polyacrilamide gels. Gels were
run for 2h at 65 W. The gels were silver-stained according to the protocol described by
Bassam et al. (1983). Fragment sizes were estimated with the 30-330 bp AFLP ladder
DNA sizing markers (Invitrogen, Carlsbad, Calif.), and analysed by the Quantity One
software (Bio Rad, Hercules, CA).
5-2-3. Data analysis
The following parameters were calculated: number of alleles per locus, observed
heterozygosity (Ho calculated as the number of heterozygous genotypes divided by the
total number of genotypes) and expected heterozygosity (He =1 – Σpi2), where pi is the
frequency of ith allele (Nei, 1973). The power of discrimination was calculated as PD =
1- Σgi2, where gi is the frequency of ith genotype (Kloosterman et al., 1993). The Ho, He
and the PD were calculated only for the Peach-based rootstocks group, which
represented diploid genotypes. The ploidy level of the second group is diploid for all but
the two Marianna clones which are triploids. The third group was composed by
hexaploid Prunus species.
The presence (1) or absence (0) of amplified fragments was recorded for each
cultivar. A similarity matrix was generated using the Dice coefficient (Nei and Li,
1979). Similarity data were processed through the unweighted pair group method
(UPGMA) cluster analysis using the NTSYS program (Rohlf, 2000) and finally
depicted in two dendrograms, one for all rootstocks studied and one for the Peach-based
rootstocks group. The goodness of fit, measured by the cophenetic correlation of both
cluster analyses, was estimated using Mantel test (Mantel, 1967). A principal coordinate
analysis (Gower, 1966) on the similarity matrix was also performed.
97
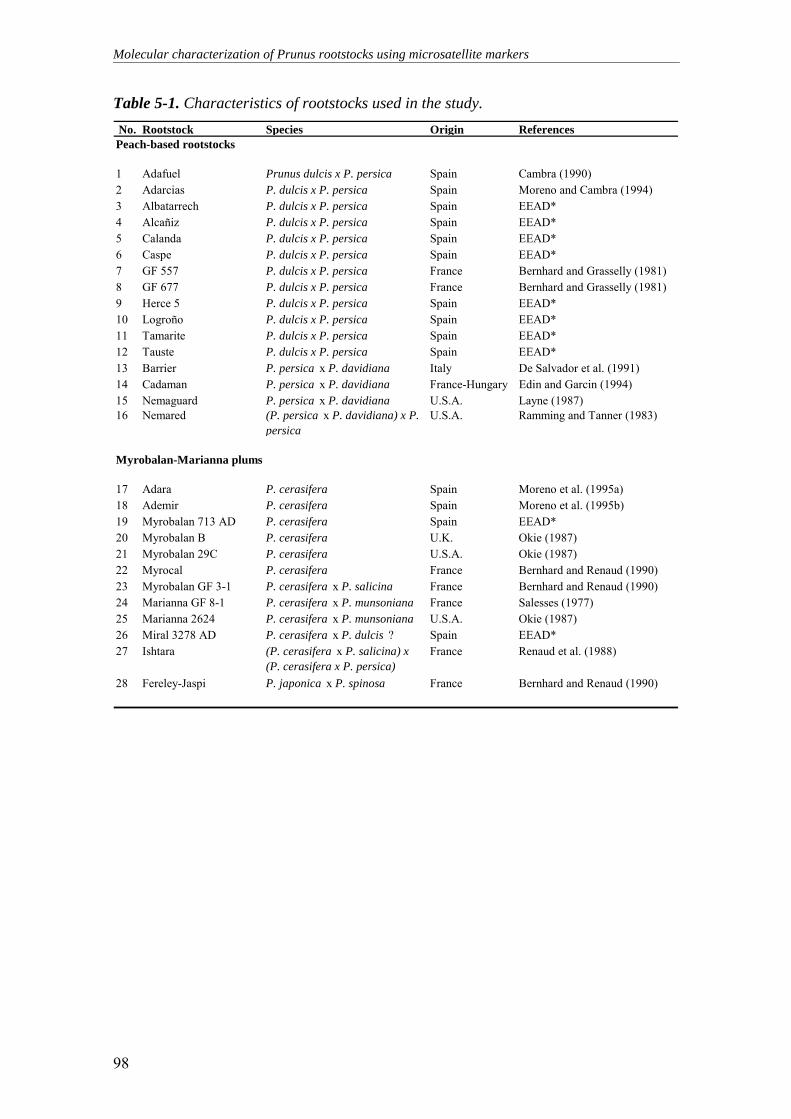
Molecular characterization of Prunus rootstocks using microsatellite markers
Table 5-1. Characteristics of rootstocks used in the study. No. Rootstock Species Origin References
1 Adafuel Prunus dulcis x P. persica Spain Cambra (1990)2 Adarcias P. dulcis x P. persica Spain Moreno and Cambra (1994)3 Albatarrech P. dulcis x P. persica Spain EEAD*4 Alcañiz P. dulcis x P. persica Spain EEAD*5 Calanda P. dulcis x P. persica Spain EEAD*6 Caspe P. dulcis x P. persica Spain EEAD*7 GF 557 P. dulcis x P. persica France Bernhard and Grasselly (1981)8 GF 677 P. dulcis x P. persica France Bernhard and Grasselly (1981)9 Herce 5 P. dulcis x P. persica Spain EEAD*10 Logroño P. dulcis x P. persica Spain EEAD*11 Tamarite P. dulcis x P. persica Spain EEAD*12 Tauste P. dulcis x P. persica Spain EEAD*13 Barrier P. persica x P. davidiana Italy De Salvador et al. (1991)14 Cadaman P. persica x P. davidiana France-Hungary Edin and Garcin (1994)15 Nemaguard P. persica x P. davidiana U.S.A. Layne (1987)16 Nemared (P. persica x P. davidiana) x P.
persicaU.S.A. Ramming and Tanner (1983)
17 Adara P. cerasifera Spain Moreno et al. (1995a)18 Ademir P. cerasifera Spain Moreno et al. (1995b)19 Myrobalan 713 AD P. cerasifera Spain EEAD*20 Myrobalan B P. cerasifera U.K. Okie (1987)21 Myrobalan 29C P. cerasifera U.S.A. Okie (1987)22 Myrocal P. cerasifera France Bernhard and Renaud (1990)23 Myrobalan GF 3-1 P. cerasifera x P. salicina France Bernhard and Renaud (1990)24 Marianna GF 8-1 P. cerasifera x P. munsoniana France Salesses (1977)25 Marianna 2624 P. cerasifera x P. munsoniana U.S.A. Okie (1987)26 Miral 3278 AD P. cerasifera x P. dulcis ? Spain EEAD*27 Ishtara (P. cerasifera x P. salicina) x
(P. cerasifera x P. persica)France Renaud et al. (1988)
28 Fereley-Jaspi P. japonica x P. spinosa France Bernhard and Renaud (1990)
Peach-based rootstocks
Myrobalan-Marianna plums
98

Capítulo 5
Table 5-1 (continued) No. Rootstock Species Origin References
29 Adesoto 101 P. insititia Spain Moreno et al. (1995c)30 Alguazas P. insititia Spain Cambra (1970)31 GF 655/2 P. insititia France Bernhard and Grasselly (1981)32 Montizo P. insititia Spain Felipe (1989)33 Monpol P. insititia Spain Felipe (1989)34 PM 105 AD P. insititia Spain Moreno (1990)35 PM 137 AD P. insititia Spain Moreno (1990)36 PM 150 AD P. insititia Spain Moreno (1990)37 Puebla de Soto 67 P. insititia Spain Cambra (1970)38 St. Julien A P. insititia France Okie (1987)39 Brompton P. domestica U.K. Okie (1987)40 Constantí P. domestica Spain Cambra et al. (1989)41 Penta P. domestica Italy Nicotra and Moser (1997)42 Tetra P. domestica Italy Nicotra and Moser (1997)43 Torinel P. domestica France Anonymous (1992)44 Damas GF 1869 P. domestica x P. spinosa France Salesses et al. (1988)
Slow growing plums
* Non-released clones from the Aula Dei breeding program
Table 5-2. List of the 20 SSR primers used in this study, size range, annealing temperature, and level of amplification for all the groups studied.
Locus code ReferencesSize range
(bp) Ta (ºC)Peach-based rootstocks
Myrobalan-Marianna plums
Slow growing plums
CPPCT002* Aranzana et al. 2002 92-108 58ºC ++ ++ ++CPPCT004 Aranzana et al. 2002 254-266 56ºC ++ - -CPPCT005 Aranzana et al. 2002 122-158 58ºC ++ ++ ++CPPCT006 Aranzana et al. 2002 166-220 60ºC ++ ++ ++CPPCT017* Aranzana et al. 2002 180-202 60ºC ++ ++ ++CPPCT022* Aranzana et al. 2002 214-306 58ºC ++ ++ ++CPPCT028 Aranzana et al. 2002 120-148 58ºC ++ ++ ++CPPCT029 Aranzana et al. 2002 - 58ºC dr - -CPPCT030 Aranzana et al. 2002 160-190 56ºC ++ ++ ++CPPCT033* Aranzana et al. 2002 135-167 58ºC ++ ++ ++BPPCT001 Dirlewanger et al. 2002 124-195 60ºC ++ ++ ++BPPCT007* Dirlewanger et al. 2002 123-167 58ºC ++ ++ ++BPPCT008* Dirlewanger et al. 2002 - 59ºC dr - -BPPCT015* Dirlewanger et al. 2002 164-258 62ºC ++ - -BPPCT017* Dirlewanger et al. 2002 139-181 60ºC ++ - -BPPCT038 Dirlewanger et al. 2002 103-139 62ºC ++ - -UDP98-022 Testolin et al. 2000 113-139 64ºC ++ - -UDP98-025* Testolin et al. 2000 101-159 65ºC ++ ++ ++UDP98-407 Testolin et al. 2000 166-240 60ºC ++ ++ ++UDP98-408 Testolin et al. 2000 100-106 56ºC ++ ++ ++
Ta: annealing temperature;
++ good amplification; - no amplification; dr: Bands difficult to resolve
* SSR markers from the ‘genotyping set’ proposed by Aranzana et al. (2003b) for Prunus genome
99

Molecular characterization of Prunus rootstocks using microsatellite markers
5-3. RESULTS AND DISCUSSION
Twenty SSR markers have been tested on 44 genotypes of Prunus, belonging to three
taxonomic groups. The SSR primer pairs used were previously developed for peach by
other authors (Table 5-2). Of the 20 primer pairs investigated, 18 generated good
amplifications in the first group of rootstocks (Peach-based rootstocks), while 13
detected amplification products for the second and the third group (Table 5-2). The
remaining primer pairs gave bands which are difficult to resolve, or did not give PCR
products for the rootstocks studied in each group and were consequently not included in
the analysis. According to our results, relatedness among Prunus species allowed the
successful use of some SSR primers, developed previously in peach. Cross-species
amplification of SSR markers among Prunus species was already pointed out by
Dirlewanger et al. (2002). Zhebentyayeva et al. (2003) and Wünsch and Hormaza
(2002) also used SSR primers developed for peach to evaluate genetic diversity in
apricot and in sweet cherry, respectively. All these studies confirm the transportability
of SSR markers across Prunus species though at different degree of amplification and
level of polymorphism for each species. Nevertheless, Aranzana et al. (2003b) proposed
a 24 SSR marker ‘genotyping set’ for Prunus. Nine of those markers were included in
our study, but only six of them amplified the three sets of materials included (Table 5-
2). Markers BPPCT015 and BPPCT017 amplified only the group of Peach-based
rootstocks. The marker BPPCT008 gave very limited resolution and was excluded from
the analysis, although this SSR had been reported by Dirlewanger et al. (2002) as a
good marker to amplify different species of Prunus (almond, apricot, peach, European
plum, Myrobalan plum, and sour cherry).
Two types of comparisons were carried out to assess the genetic diversity for the
three groups of rootstocks studied: (1) comparison among groups, and (2) comparison
within groups of rootstocks.
5-3-1. Genetic diversity among groups
Thirteen SSR primer pairs gave polymorphic bands for all the 44 clones studied, and
were used for the analysis of diversity among rootstocks groups, while the remaining
SSR primers were discarded.
100
Capítulo 5
The 13 selected primer pairs generated distinctive products in the range of 92-306 bp
(Table 5-2). It is relevant to notice that three of the most informative markers across
groups (BPPCT001, CPPCT022 and UDP98-407) (Table 5-3) allowed the unambiguous
differentiation of all the clones studied. Previously, seven RAPD markers were selected
by Casas et al. (1999) to separate among the same three rootstock groups, but they did
not allow the separation between ‘Alguazas’ and ‘Adesoto 101’ clones. These results
reveal the power of SSR markers with respect to RAPDs, and we can consequently
propose the use of the three selected SSRs of this study in future programs of
identification of Prunus rootstocks.
The similarity among the 44 genotypes included in this study is graphically
represented by an UPGMA dendrogram (Figure 5-1). The dendrogram was used to
estimate relationships among clones based on shared alleles across all rootstocks.
At the similarity coefficient of 0.16, two main groups were distinguished, the first
one representing the Peach-based rootstocks and the second one composed of the
Myrobalan-Marianna and the Slow growing plums. The distribution of the rootstocks in
the dendrogram can be explained by the botanical classification of the genus Prunus. In
fact, Peach-based rootstocks belong to the subgenus Amygdalus, while both the
Myrobalan-Marianna and the Slow growing plum rootstocks belong to the subgenus
Prunophora. Consequently, the molecular distribution and the botanical classification of
the 44 rootstocks studied are in good agreement. At the similarity coefficient of 0.19,
the group of Prunophora rootstocks was divided into two clear sub-groups, the
Myrobalan-Marianna plums and the Slow growing plums. The molecular data agree in
this case with the rootstock classification based on morphological characteristics.
According to the dendrogram (Figure 5-1), we are able to distinguish unambiguously
all the 44 clones studied. Genetic similarities (GS) between pairs of rootstocks had an
average of 0.35. The cophenetic correlation coefficient was 0.86 suggesting a good fit of
the dendrogram with the similarity matrix.
The average genetic similarity within clusters was 0.41, while average values
between clusters were smaller. The most distinct group was that of the Peach-based
rootstocks, which presented average similarities of 0.16 and 0.15 with Myrobalan-
Marianna plums, and Slow growing plums, respectively. The average similarity
between the two Prunophora groups was also low (0.19) but slightly higher than the
average similarities with the first group of Peach-based rootstocks. Casas et al. (1999)
reported higher average similarities among the same group of rootstocks and especially
101
Molecular characterization of Prunus rootstocks using microsatellite markers
between Myrobalan-Marianna group and the Slow growing plums, using seven RAPD
primers. This can be explained by the higher level of polymorphism of the SSR markers
which allowed a more accurate genetic diversity estimate among rootstocks.
102

Capítulo 5
Coefficient0.16 0.37 0.58 0.79 1.00
AdafuelAdarciasGF677 GF557 TausteCadamanNemaredNemaguardBarrierCalandaHerce5 AlbatarrechAlcañizCaspe TamariteLogroño Adara AdemirMyrocalMyrobalan713ADMyrobalanBMyrobalanGF3-1 Miral3278ADIshtaraMyrobalan29CMariannaGF8-1 Marianna2624 Fereley-JaspiAdesoto101 PueblaSoto67Alguazas PM105AD PM137AD PM150AD MontizoBromptonConstantiMonpolTetraPentaSt.JulienAGF655/2 TorinelDamasGF1869
Amygdalus
Prunophora
Subgenus
Peach-based rootstocks
Myrobalan-Marianna
plums
Slow growing plums
Groups
Figure 5-1. Dendrogram of the 44 Prunus rootstocks obtained from the UPGMA cluster analysis using the Dice coefficient (Nei and Li, 1979), after amplification with 13 SSR primer pairs.
103
Molecular characterization of Prunus rootstocks using microsatellite markers
The principal coordinate analysis (PCA) performed from the similarity matrix
showed two significant axes, which explain 15% and 11% of the total variance
respectively (Figure 5-2). The PCA agrees with cluster analysis and clearly establishes
the distribution of rootstocks in three groups, which coincide with the Peach-based,
Myrobalan-Marianna and Slow growing group rootstocks.
For the 44 rootstocks studied, it was possible to detect specific alleles for each group.
In fact, 21 alleles distributed through 10 loci were specific to Peach-based rootstocks;
13 alleles, distributed through 6 loci, were private to Myrobalan-Marianna plums; and
26 alleles, distributed through 9 loci, were specific to Slow growing plums. These
specific alleles can be used for future characterisation and identification of Prunus
rootstocks or Prunus species. Myrobalan-Marianna and Slow growing plums shared 17
alleles distributed through eight loci. Eleven alleles distributed through six loci were
common to Peach-based rootstocks and Slow growing plums. Finally, six alleles
distributed through four loci were common to Peach-based rootstocks and Myrobalan-
Marianna plums. The higher number of common alleles was observed between
Myrobolan-Marianna and Slow growing plums, which can be explained by the close
relationship among clones of these two groups. In fact, P. domestica and P. insititia
(both hexaploids) were thought to be derived from a cross between a diploid
(2n=2x=16) cherry plum or myrobalan, P. cerasifera, and a tetraploid (2n=4x=32) sloe
or blackthorn, P. spinosa (Crane and Lawrence, 1952). This hypothesis has been widely
accepted by horticulturists and crop plant evolutionists and agrees with our findings.
The most distinct clones of this study were ‘Miral 3278 AD’, ‘Ishtara’, and ‘Fereley-
Jaspi’. These clones are interspecific hybrids showing different agronomic
characteristics and botanical descriptions with respect to the rest of clones (Table 5-1).
‘Miral 3278 AD’ is a natural hybrid of unknown parentage, whose morphology
resembles Myrobalans, but it has some almond-like characteristics. Thus, a P.
cerasifera x P. dulcis origin was postulated for this clone (Casas et al., 1999). In the
present study, this clone showed common alleles with the Peach-based rootstocks that
are also present in the Myrobalan-Marianna plums, but no specific alleles to Peach-
based rootstocks were present in this clone. Our results obscure the hypothesis proposed
above and support the hypothesis that the pedigree of ‘Miral 3278 AD’ includes other
species besides P. cerasifera, but does not provide further clarification on their identity.
104

Capítulo 5
-1
0
1
-1 0 1
PC 1 (15%)
PC
2 (1
1%)
Myrobalan-Mariannaplums
Fereley-Jaspi
Ishtara
Miral3278AD
MariannaGF8-1 Myrobalan 29C
Adara
Peach based rootstocks
Albatarrech Alcañiz
NemaguardGF557
GF677
Barrier
Adafuel
Slow growing plums
Puebla de Soto 67 PM 137AD
Montizo
Alguazas
Adesoto 101
Figure 5-2. Plot of the two first components (PC1 and PC2) of principal coordinate analysis on the similarity matrix for 44 Prunus rootstocks after amplification with 13 SSR primer pairs. Names of some relevant clones are shown in the figure.
‘Ishtara’ is a complex interspecific hybrid, whose male parent was proposed to be a
natural P. cerasifera x P. persica hybrid (Renaud et al., 1988). This rootstock shared
two specific alleles (CPPCT033, 153 and UDP98-025, 143) with all hybrids of P.
persica parentage, which were absent from all other plum rootstocks. Casas et al. (1999)
also mentioned a band shared (AB9-18-1500) with all (but one) hybrids of P. persica
parentage, which was absent from all other plum rootstocks using RAPD markers.
These results confirm the possible presence of P. persica in the ‘Ishtara’ pedigree. Its
position in the PCA (Figure 5-2), between the two groups of Peach-based rootstocks
and Myrobalan-Marianna plums, but nearest to the second group, agrees with the
double dose of P. cerasifera and the single dose of P. persica in the pedigree of
‘Ishtara’.
105

Molecular characterization of Prunus rootstocks using microsatellite markers
‘Fereley-Jaspi’ (P. japonica x P. spinosa), was clustered with the Myrobalan-
Marianna plums but at a lower level of aggregation (Figure 5-1). This clone presented
an intermediate position between the two groups of plums with a genetic similarity of
0.35 and 0.21 with the Myrobalan-Marianna and Slow growing plums, respectively. The
PCA (Figure 5-2) also showed the position of ‘Fereley-Jaspi’ between the two groups of
plums. According to its pedigree, ‘Fereley-Jaspi’ is a hybrid between plum species
belonging to the Prunophora subgenus, which could explain its relationship with other
plum species of this study.
5-3-2. Genetic diversity within groups
Genetic diversity was detected among clones of each group of rootstocks. As
mentioned before, 13 SSR markers gave polymorphic bands in all rootstocks studied.
Moreover, other five SSRs were polymorphic for only the Peach-based rootstocks
group.
We will describe first the diversity found within the two plum groups, amplified with
13 SSR markers, followed by the analysis of genetic diversity within Peach-based
rootstocks, analysed with 18 SSRs.
5-3-2-1. Myrobalan-Marianna plum variation
The group of Myrobalan-Marianna plums included 12 clones of different species
(Table 5-1). Thirteen SSR primers were used for the screening of this group and
produced a total of 82 alleles, ranging from 2 (CPPCT017) to 10 (CPPCT005 and
CPPCT006), with a mean value of 6.3 per locus (Table 5-3). The selection of the two
most polymorphic loci which revealed the highest number of alleles for this group,
CPPCT005 (10) and CPPCT006 (10), allowed us to distinguish unambiguously all the
12 clones of rootstocks group with the exception of ‘Myrobalan 29C’ and ‘Marianna GF
8-1’ which gave the same genetic profile. To identify these two cultivars, an additional
CPPCT028 marker was selected which revealed distinct alleles between them.
In the dendrogram (Figure 5-1), it can be seen the clear separation of the two
Marianna clones [P. cerasifera x P. munsoniana (Wight & Hedrick)] together with
‘Myrobalan 29C’ from the rest of the Myrobalan-Marianna clones. These three clones,
106
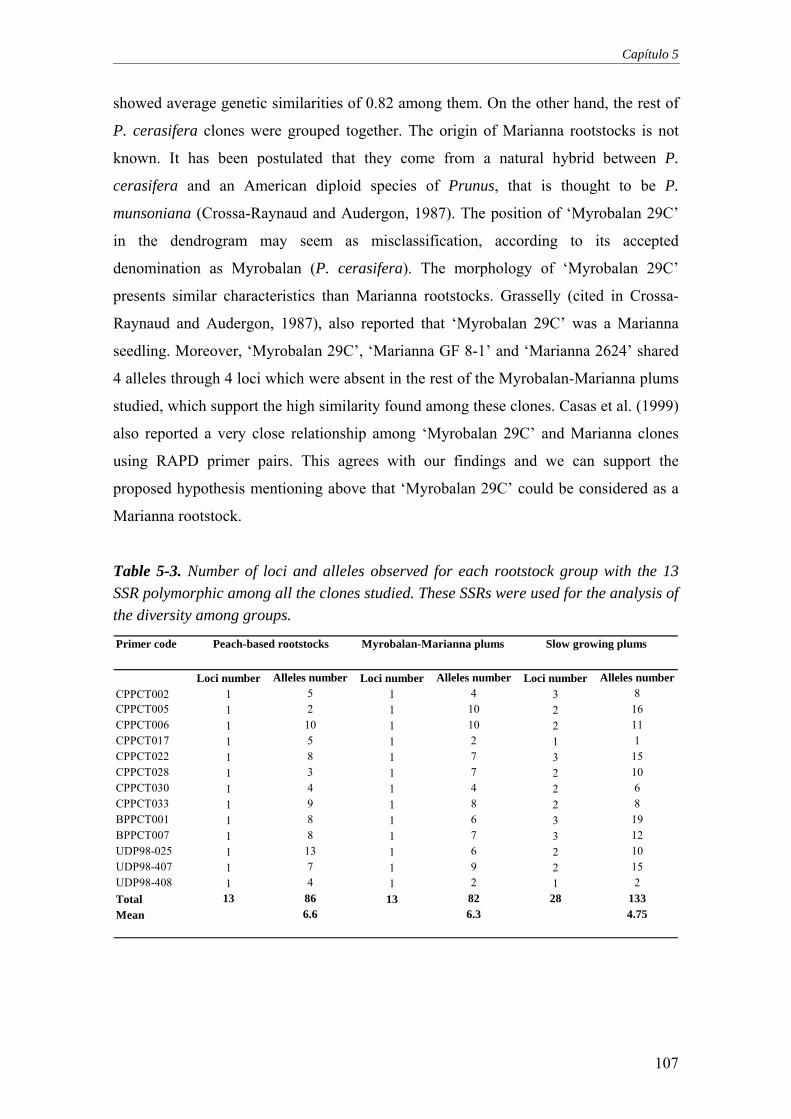
Capítulo 5
showed average genetic similarities of 0.82 among them. On the other hand, the rest of
P. cerasifera clones were grouped together. The origin of Marianna rootstocks is not
known. It has been postulated that they come from a natural hybrid between P.
cerasifera and an American diploid species of Prunus, that is thought to be P.
munsoniana (Crossa-Raynaud and Audergon, 1987). The position of ‘Myrobalan 29C’
in the dendrogram may seem as misclassification, according to its accepted
denomination as Myrobalan (P. cerasifera). The morphology of ‘Myrobalan 29C’
presents similar characteristics than Marianna rootstocks. Grasselly (cited in Crossa-
Raynaud and Audergon, 1987), also reported that ‘Myrobalan 29C’ was a Marianna
seedling. Moreover, ‘Myrobalan 29C’, ‘Marianna GF 8-1’ and ‘Marianna 2624’ shared
4 alleles through 4 loci which were absent in the rest of the Myrobalan-Marianna plums
studied, which support the high similarity found among these clones. Casas et al. (1999)
also reported a very close relationship among ‘Myrobalan 29C’ and Marianna clones
using RAPD primer pairs. This agrees with our findings and we can support the
proposed hypothesis mentioning above that ‘Myrobalan 29C’ could be considered as a
Marianna rootstock.
Table 5-3. Number of loci and alleles observed for each rootstock group with the 13 SSR polymorphic among all the clones studied. These SSRs were used for the analysis of the diversity among groups.
Primer code
Loci number Alleles number Loci number Alleles number Loci number Alleles numberCPPCT002 1 5 1 4 3 8CPPCT005 1 2 1 10 2 16CPPCT006 1 10 1 10 2 11CPPCT017 1 5 1 2 1 1CPPCT022 1 8 1 7 3 15CPPCT028 1 3 1 7 2 10CPPCT030 1 4 1 4 2 6CPPCT033 1 9 1 8 2 8BPPCT001 1 8 1 6 3 19BPPCT007 1 8 1 7 3 12UDP98-025 1 13 1 6 2 10UDP98-407 1 7 1 9 2 15UDP98-408 1 4 1 2 1 2Total 13 86 13 82 28 133Mean 6.6 6.3 4.75
Peach-based rootstocks Myrobalan-Marianna plums Slow growing plums
107

Molecular characterization of Prunus rootstocks using microsatellite markers
5-3-2-2. Slow growing plums variation
This group included 16 hexaploid Prunus (P. insititia, P. domestica, and P.
domestica x P. spinosa) clones (Table 5-1) and each primer used was able to detect
from one to three loci (Table 5-3). Thirteen SSR primer pairs, from the 20 initially used,
amplified a total of 133 polymorphic alleles through 28 loci detected in this group
(Table 5-3) with a mean value of 4.75 alleles per locus. The primer BPPCT001
amplified a total of 19 alleles through the three loci detected in this case and allowed the
unambiguous separation of all the 16 clones.
According to the dendrogram (Figure 5-1), P. insititia and P. domestica rootstocks
did not form different clusters. This is not surprising, because both species have evolved
in the same geographical area (Ramming and Cociu, 1990), and are inter-fertile (Crane
and Lawrence, 1952). Natural hybridisation between P. domestica and P. insititia may
have been favoured by the pollen self-incompatibility in both species (Bernhard et al.,
1951).
‘Adesoto 101’, ‘Puebla de Soto 67’, and ‘Alguazas’ are very closely related, which is
explained by the fact that they are ‘Pollizo’ collected in the same geographic area
(South of Spain). On the other hand, the close genetic similarity (GS = 0.55) found
between ‘PM105AD’ and ‘PM137AD’ can be explained by the fact that they are
selected rootstocks coming from open pollinated pre-selected clones of ‘Pollizo’ and
though they have been described as P. insititia, their male parent is not known. The
clones ‘PM 150 AD’ and ‘Montizo’ also showed a close relationship (GS = 0.54) and
both are selected rootstocks from open pollinated populations of ‘Pollizo’. According to
the Figure 5-1, we also observed a close relationships between two pairs of clones:
‘Tetra’ and ‘Penta’ (GS = 0.60), and ‘St Julien A’ and ‘GF 655/2’ (GS = 0.47). This
result can be explained by the common geographic origin of each pair of clones (Table
5-1).
5-3-2-3. Peach-based rootstocks
Microsatellite diversity
In our set of Peach-based rootstocks, peach-derived SSR markers detected
considerable polymorphism. Eighteen of the 20 SSR markers used in this study
108

Capítulo 5
produced a total of 124 polymorphic bands over the 16 screened clones of the Peach-
based rootstocks group (Table 5-4).
Table 5-4. Allele number and parameters of variability in the Peach-based rootstocks group with the 18 polymorphic SSRs.
Locus code Peach-based rootstocks
alleles
Ho He #Genotypes PD
CPPCT002 5 0.50 0.61 8 0.CPPCT004 5 0.00 0.73 4 0.73CPPCT005 2 0.06 0.06 2 0.12CPPCT006 10 0.88 0.76 7 0.88CPPCT017 5 0.63 0.67 6 0.63CPPCT022 7 0.69 0.76 9 0.87CPPCT028 3 0.00 0.53 3 0.53CPPCT030 4 0.38 0.32 4 0.55CPPCT033 9 0.69 0.78 10 0.86BPPCT001 8 0.50 0.55 8 0.71BPPCT007 8 0.44 0.77 10 0.84BPPCT015 11 0.00 0.87 10 0.87BPPCT017 11 0.81 0.82 11 0.89BPPCT038 8 0.69 0.64 9 0.84UDP98-022 5 0.19 0.72 7 0.79UDP98-025 12 0.62 0.79 12 0.92UDP98-407 7 0.69 0.77 10 0.87UDP98-408 4 0.50 0.67 6 0.82
Total 124 136Mean 6.90 0.46 0.66 7.56 0.75
84
Ho: observed heterozygosity; He: expected heterozygosity; # Genotypes: different genotypes per locus; and PD: power of discrimination.
The number of alleles observed at each locus ranged from 2 (CPPCT005) to 12
(UDP98-025), with an average of 6.9 (Table 5-4). This value obtained for only 16
clones is relatively high when compare it with values reported for other Prunus species
considering the number of accessions studied. Aranzana et al. (2003a) observed a mean
value of 7.3 for a set of 212 peach varieties analysed with 16 microsatellites. In our
study, observed and expected heterozygosities averaged over the 18 SSR loci were 0.46
and 0.66, respectively (Table 5-4). These parameters are higher than the mean values
reported for SSRs in peach (Aranzana et al., 2003a; Bouhadida et al., 2007). High allele
number and high heterozygosity obtained in the present study reflect the ability of SSR
markers to provide unique genetic profile for individual plant genotypes. This
109
Molecular characterization of Prunus rootstocks using microsatellite markers
discriminating ability is much greater with hybrid cultivars than with mutant or clonal
cultivars, which cannot be distinguished unless mutations are located within SSR loci or
flanking regions (Aranzana et al., 2003a). Observed heterozygousity was zero for three
of the SSR (CPPCT004, CPPCT028 and BPPCT015). A simple explanation of these
values is that the almond alleles didn’t amplify due we are working with peach SSR.
Similar cases were reported by Howad et al. (2005), where 13% of the primers used
were monomorphic and dominant for the peach alleles. On the other hand, genetic
diversity is higher in Prunus hybrids than in simple peach cultivars because the last
ones are predominantly self-pollinating. Moreover, almonds (P. dulcis) is known to be
self-incompatible and consequently more polymorphic than peach (Tamura et al., 2000,
Xie et al. 2006 ). Higher values were reported for outcrossing species. Zhebentyayeva et
al. (2003) and Maghuly et al. (2005) mentioned in apricot average values for Ho and He
higher than in peach which well agree with our results. The highest number of different
genotypes was registered for the locus UDP98-025 (12), and the lowest for CPPCT005
(2) (Table 5-4).
A total of 136 genotypes were observed for all loci, with an average of 7.5 genotypes
per locus. The selection of the two most polymorphic loci, UDP98-025 and BPPCT017,
allowed to distinguish unambiguously all the 16 clones of Peach-based rootstocks
group, with the exception of ‘Albatarrech’ and ‘Alcañiz’ which gave the same genetic
profile. To differentiate these two cultivars, an additional marker (BPPCT007) was
selected, which revealed distinct alleles between them.
The average power of discrimination (PD=0.75) observed for Peach-based rootstocks
is high and is comparable with the 0.64 mean value reported for peach by Aranzana et
al. (2003a). Our findings indicate that peach SSR markers are very efficient to identify
genetic variability among Peach based-rootstocks.
To elucidate genetic relationships among Peach-based rootstock clones, a
dendrogram was produced using UPGMA cluster analysis and the Dice coefficient over
18 SSR loci (Figure 5-3). The dendrogram in Figure 5-3 showed a different distribution
of clones with respect to the one shown in Figure 5-1. According to the new one, the
genotypes studied can be divided into two main groups. The first group contained the
four genotypes presenting the pedigree P. persica x P. davidiana, whereas the second
group included the peach hybrids of the type P. persica x P. dulcis. All non-released
rootstocks of EEAD collection (but ‘Herce 5’) were clustered together in a subgroup
110
Capítulo 5
(Figure 5-3). This separation of all the Peach-based rootstocks was in good agreement
with their botanical classification. This suggests that a larger number of markers was
necessary to lead to a more accurate genetic relationships among clones which respond
truly to the morphological characteristics and the botanical descriptions. The cophenetic
correlation coefficient was 0.8 suggesting a good fit of the dendrogram of the Figure 5-3
with the similarity matrix.
‘Albatarrech’ and ‘Alcañíz’ showed a very close relationship, as Casas et al. (1999)
reported using RAPD markers. This is not surprising because these two clones come
from the same region and present similar morphological characteristics. A high genetic
similarity was also detected between ‘Nemared’ and ‘Nemaguard’ with a similarity
value of 0.71. A close relationship was also mentioned by Lu et al. (1996) and Casas et
al. (1999) between these two cultivars. This was expected, as ‘Nemaguard’ is one of the
parents of ‘Nemared’ (Ramming and Tanner, 1983).
111
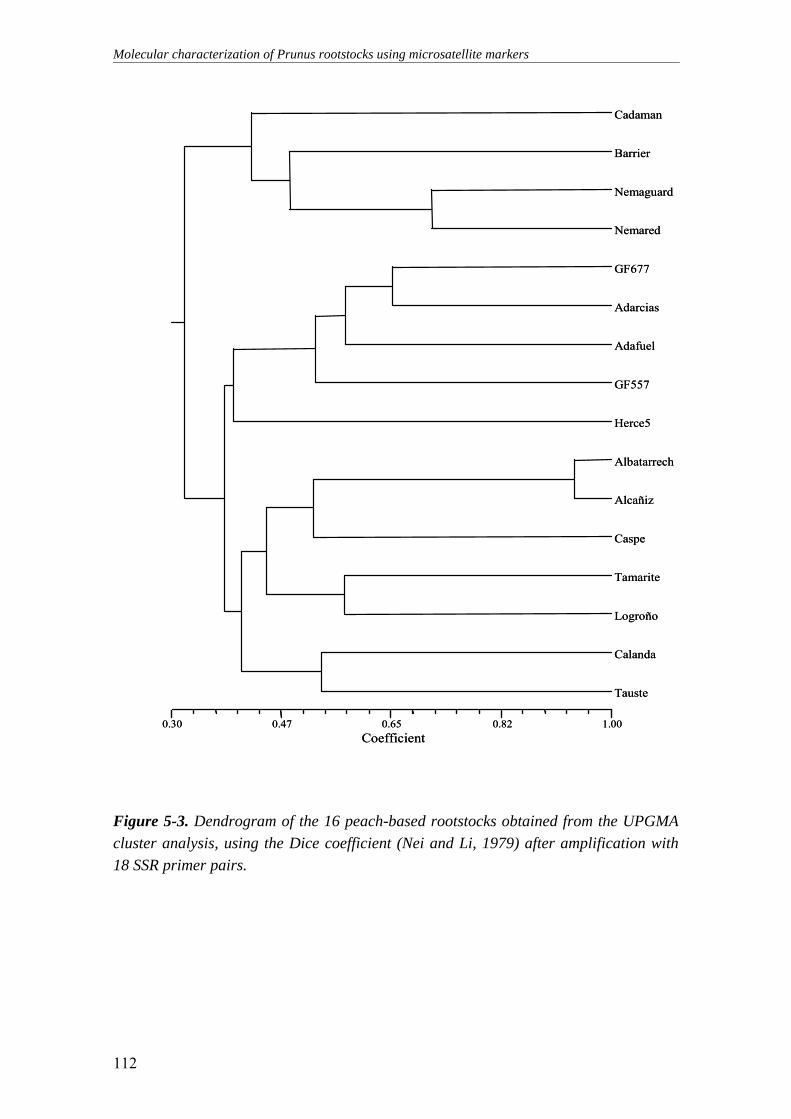
Molecular characterization of Prunus rootstocks using microsatellite markers
Coefficient0.30 0.47 0.65 0.82 1.00
Albatarrech
Cadaman
Barrier
Nemaguard
Nemared
GF677
Adarcias
Adafuel
GF557
Herce5
Albatarrech
Alcañiz
Caspe
Tamarite
Logroño
Calanda
Tauste
Coefficient0.30 0.47 0.65 0.82 1.00
Albatarrech
Cadaman
Barrier
Nemaguard
Nemared
GF677
Adarcias
Adafuel
GF557
Herce5
Albatarrech
Alcañiz
Caspe
Tamarite
Logroño
Calanda
Tauste
Figure 5-3. Dendrogram of the 16 peach-based rootstocks obtained from the UPGMA cluster analysis, using the Dice coefficient (Nei and Li, 1979) after amplification with 18 SSR primer pairs.
112
Capítulo 5
In summary, the analysis of genetic diversity among groups of Prunus rootstocks
using peach-derived SSR markers, allowed us to cluster successfully the clones
according to their morphological characteristics, and their botanical classification. In the
present study, polymorphism observed among the rootstocks is large, since we have
been able to distinguish them unambiguously using only three SSR markers from the 20
initially used. Moreover, transportability of microsatellite seems to be very efficient,
this means that the microsatellite primers developed for one species (in this case for
peach) can be used to detect polymorphism at homologous loci in other related species
of the genus Prunus.
Molecular characterisation of Prunus rootstocks is of great interest for breeding
programs. This will guaranty a correct identification of the rootstocks during the
propagation process, without influence of environmental factors that may limit or
influence phenotypic characterization. Moreover, the study of genetic diversity among
different genotypes and populations is very useful to choose parental genotypes for
crosses, to optimise germplasm management and to maximize diversity.
REFERENCES Anonymous, 1992. Porte-greffe Avifel-Torinel. L'Arboriculture Fruitière 450: fiche
variètale.
Aranzana, M.J., García-Mas, J., Carbó J. and Arús, P. 2002. Development and
variability analysis of microsatellite markers in peach. Plant Breed. 121: 87-92.
Aranzana, M.J., Carbó, J. and Arús, P. 2003a. Microsatellite variability in peach
[Prunus persica (L.) Batsch]: cultivar identification, marker mutation, pedigree
inferences and population structure. Theor. Appl. Genet. 106: 1341-1352.
Aranzana, M., Pineda, A., Cosson, P., Dirlewanger, E., Ascasibar, J., Cipriani, G.,
Ryder, C.D., Testolin, R., Abbott, A., King, G.J., Iezzoni, A.F. and Arús, P. 2003b.
A set of simple-sequence repeat (SSR) markers covering the Prunus genome. Theor.
Appl. Genet. 106: 819-825.
Badenes, M.L. and Parfitt, D.E. 1995. Phylogenetic relationships of cultivated Prunus
species from an analysis of chloroplast DNA variation. Theor. Appl. Genet. 90:
1035-1041.
113
Molecular characterization of Prunus rootstocks using microsatellite markers
Bassam, B.J., Caetano-Anoelles, G. and Gresshoff, P.M. 1983. Fast and sensitive silver
staining of DNA in polyacrylamide gels. Anal. Biochem. 196: 80-83.
Bernhard, R. and Grasselly, C. 1981. Les pêchers × amandiers. L'Arboriculture
Fruitière, 328: 37-42.
Bernhard, R. and Renaud, R. 1990. Le point sur les porte-greffes du prunier.
L'Arboriculture Fruitière, 432: 28-36.
Bernhard, R., Delmas, H.G. and Sanfourche, G. 1951. Recherches sur la pollinisation
de quelques variétés de pruniers. Ann. Amèlior Plantes, 2: 179-209.
Bouhadida, M., Casas, A.M., Moreno, M.A. and Gogorcena, Y. 2007. Molecular
characterization of Miraflores peach variety and relatives using SSRs. Scientia
Hortic. 111: 140-145.
Cambra, R. 1970. Selección de Pollizos de Murcia y otros ciruelos locales españoles.
ITEA, 1: 115-126.
Cambra, R. 1990. Adafuel, an almond x peach hybrid rootstock. HortScience, 25: 584.
Cambra, R., Gella, R. and Moreno, M.A. 1989. Comportamiento del ciruelo
‘Constantí’ como patrón de melocotonero. ITEA, 83: 33-41.
Casas, A.M., Igartua, E., Balaguer, G. and Moreno, M.A. 1999. Genetic diversity of
Prunus rootstocks analysed by RAPD markers. Euphytica, 110: 139-149.
Crane, M.B., and Lawrence, W.J.C. 1952. The genetics of garden plants. 4th ed.
MacMillan, London, UK.
Crossa-Raynaud, P. and Audergon, J.M. 1987. Apricot rootstocks. - In: R.C. Rom &
R.F. Carlson (Eds), Rootstocks for Fruit Crops. John Wiley & Sons, NY, pp: 295-
320.
Cummins, J.N. and Aldwinckle, H.S. 1983. Rootstocks breeding. In Methods in fruit
breeding. Moore, J.N. and Janick, J. (Eds), Purdue University Press, West Lafayette,
pp: 294-327.
De Salvador, F.R., Liberan, A. and Fideghelli, C. 1991. La scelta dei portinnesti delle
piante arboree da frutto: Pesco. L'Informatore Agrario, supplemento, 36: 43-50.
Dirlewanger, E., Cosson, P., Tavaud, M., Aranzana, J., Poizat, C., Zanetto, A., Arús, P.
and Laigret, F. 2002. Development of microsatellite markers in peach [Prunus
persica (L.) Batsch] and their use in genetic diversity analysis in peach and sweet
cherry (Prunus avium L.). Theor. Appl. Genet. 105: 127-138.
114
Capítulo 5
Downey, S.L. and Iezzoni, A.F. 2000. Polymorphic DNA markers in black cherry
(Prunus serotina) are identified using sequences from sweet cherry, peach and sour
cherry. J. Am.. Soc. Hort. Sci. 125: 76-80.
Dozier, W.A. Knowles, J.W. and Carlton, C.C. 1984. Survival, growth, and yield of
peach trees as affected by rootstocks. HortScience, 19: 26-30.
Edin, M. and Garcin, A. 1994. Un nouveau porte-greffe du pêcher Cadaman® Avimag.
L'Arboriculture Fruitière, 475: 20-23.
Felipe, A.J. 1989. Patrones para frutales de pepita y hueso. Ediciones Tècnicas
Europeas, S.A., Barcelona, p. 181.
Howad, W., Yamamoto, T., Dirlewanger, E., Testolin, R., Cosson, P., Cipriani, G.,
Monforte, A.J., Georgi, L., Abbott, A.G. and Arús, P. 2005. Mapping with a few
plants: using selective mapping for microsatellite saturation of the Prunus reference
map. Genetics, 171: 1305-1309.
Kester, D.E. and Graselly, C. 1987. Peach rootstocks. In: R C Rom and R F Carlson
(Eds), Rootstocks for fruit Crops, John Wiley and Sons, NY, pp: 265-293.
Gogorcena, Y. and Parfitt, D.E. 1994. Evaluation of RAPD marker consistency for
detection of polymorphism in apricot. Sci. Hortic. 59: 163-167.
Gower, J.C. 1966. Some distance properties of latent root and vector methods used in
multivariate analysis. Biometrika, 53: 325-338.
Kaneko, T., Terachi, T., and Tsunewaki, K. 1986. Studies on the origin of crop species
by restriction endonuclease analysis of organellar DNA. II. Restriction analysis of
ctDNA of 11 Prunus species. Jpn. J. Genet. 61: 157-168.
Kloosterman, A.D., Budowle, B. and Daselaar, P. 1993. PCR-amplification and
detection of the human DIS80 VNTR locus. Amplification conditions, population
genetics and application in forensic analysis. Int. J. Leg. Med. 105: 257-264.
Layne, R.E.C. 1987. Peach rootstocks. In: R.C. Rom and R.F. Carlson (Eds),
Rootstocks for Fruit Crops, John Wiley and Sons, NY, pp: 185-216.
Lee, S. and Wen, J. 2001. A phylogenetic analysis of Prunus and the Amygdaloideae
(Rosaceae) using ITS sequences of nuclear ribosomal DNA. Amer. J. Bot. 88: 150-
160.
Lu, Z-X., Reighard, G.L., Baird, W.V., Abbott, A.G. and Rajapakse, S. 1996.
Identification of peach rootstock cultivars by RAPD markers. HortScience, 31: 127–
129.
115
Molecular characterization of Prunus rootstocks using microsatellite markers
Maghuly, F., Fernández, E.B., Ruthner, S., Pedryc, A. and Laimer, M. 2005.
Microsatellite variability in apricots (Prunus armeniaca L.) reflects their geographic
origin and breeding history. Tree Genetics & Genomes, 1: 151-165.
Mantel, N.A. 1967. The detection of disease clustering and a generalized regression
approach. Cancer Res. 27: 209-220.
Moreno, M.A. 2004. Breeding and selection of Prunus rootstocks at the Aula Dei
experimental station, Zaragoza, Spain. Acta Hort. 658: 519-528.
Moreno, M.A. 1990. Selección del Pollizo de Murcia (Prunus domestica/insititia)
como patrón de melocotonero (P. persica L. Batsch.). Tesis doctoral (PhD),
Universitat Politécnica de Catalunya, España.
Moreno, M.A. and Cambra, R. 1994. Adarcias, an almond x peach hybrid rootstock.
HortScience, 29: 925.
Moreno, M.A., Tabuenca, M.C. and Cambra, R. 1995a. Adara, a plum rootstock for
cherries and other stone fruit species. HortScience, 30: 1316-1317.
Moreno, M.A., Tabuenca, M.C and Cambra, R. 1995b. Ademir, a myrobalan rootstock
for plums. HortScience, 30: 1475-1476.
Moreno, M.A., Tabuenca, M.C and Cambra, R. 1995c. Adesoto 101, a plum rootstock
for peaches and other stone fruit. HortScience, 30: 1314-1315.
Mowrey, B.D. and Werner, D.J. 1990. Phylogenetic relationships among species of
Prunus as inferred by isozyme markers. Theor. Appl. Genet. 80: 129-133.
Nei, M. 1973. Analysis of gene diversity in subdivided populations. Proc. Natl. Acad.
Soc. USA 70: 3321-3323.
Nei, M. and Li, W.H. 1979. Mathematical model for studying genetic variation in terms
of restriction endonucleases. Proc. Natl. Acad. Sci. USA 76: 5269-5273.
Nicotra, A. and Moser, L. 1997. Two new plum rootstocks for peach and nectarines:
penta and tetra. Acta Hort. 451:269-272.
Okie, W.R. 1987. Plum rootstocks. In: R.C. Rom & R.F. Carlson (Eds), Rootstocks for
Fruit Crops, John Wiley & Sons, NY. p. 321-360.
Ramming, D.W. and Tanner, O. 1983. ‘Nemared’ peach rootstock. HortSci. 18: 376.
Ramming, D.W. and Cociu, V. 1990. Plums (Prunus). In: J.N. Moore & J.R.
Ballington Jr. (Eds), Genetic Resources of Temperate Fruit and Nut Crops,
International Society for Horticultural Science, Wageningen, pp. 235-287.
Renaud, R., Bernhard, R. Grasselly, C. and Dosba, F. 1988. Diploid plum × peach
hybrid rootstocks for stone fruit trees. HortScience. 23: 115-116.
116

Capítulo 5
Rehder, A. 1940. A manual of cultivated trees and shrubs hardy in North American
exclusive of the subtropical and warmer temperate regions. 2nd edn. Macmillan,
New York, USA.
Rohlf, F.J. 2000. NTSYS-pc Numerical Taxonomy and Multivariate Analysis System.
Version 2.1. Exeter Software, Setauket, NY.
Rom, R.C. 1982. A new philosophy for peach rootstock development. Fruit Var. J. 36:
34-37.
Rom, R. 1984. A new generation of peach rootstocks. Proc. 43rd Nat. Peach Council
Annual Convention, pp. 59-68.
Romero, C., Pedryc, A., Muñoz, V., Llácer, G. and Badenes, M.L. 2003. Genetic
diversity of different apricot geographical groups determined by SSR markers.
Genome, 46: 244-252.
Salesses, G. 1977. Recherches sur l'origine de deux pruniers portegreffe hybrides
interspècifiques naturels: Un example d'ètude cytologique dèveloppèe pour la
crèation de porte-greffe nouveaux cher les pruniers. Ann Amèlior Plantes, 27: 235-
243.
Salesses, G., Renaud, R. and Bonnet, A. 1988. Creation of Plum rootstocks for peach
and plum by interspecific hybridization. Acta Hort. 224: 339-344.
Sosinski, B., Gannavarapu, M., Hager, L.D., Beck, L.E., King, G.J., Ryder, C.D.,
Rajapakse, S., Baird, W.V., Ballard, R.E. and Abbot, A.G. 2000. Characterization of
microsatellite in peach [Prunus persica (L.) Batsch]. Theor. Appl. Genet. 97: 1034-
1041.
Tamura, M., Ushijima, K., Sassa, H., Hirano, H., Tao, R., Gradziel, T.M. and
Dandekar, A.M. 2000. Identification of self-incompatibility genotypes of almond by
allele-specific PCR analysis. Theor. Appl. Genet. 101: 344-349.
Testolin, R., Marrazo, T., Cipriani, G., Quarta, R., Verde, I., Dettori, M.T., Pancaldi,
M. and Sansavini, S. 2000. Microsatellite DNA in peach (Prunus persica L. Batsch)
and its use in fingerprinting and testing the genetic origin of cultivars. Genome, 43:
512-520.
Uematsu, C., Sasakuma, T. and Ogihara, Y. 1991. Phylogenetic relationships in the
stone fruit group of Prunus as revealed by restriction fragment analysis of
chloroplast DNA. Jpn. J. Genet. 66: 59-69.
117

Molecular characterization of Prunus rootstocks using microsatellite markers
Wünsch, A. and Hormaza, J.I. 2002. Molecular characterization of sweet cherry
(Prunus avium L.) genotypes using peach [Prunus persica (L.) Batsch] SSR
sequences. Heredity, 89: 56-63.
Xie, H., Sui, Y., Chang, F.Q., Xu, Y. and Ma, R.C. 2006. SSR allelic variation in
almond (Prunus dulcis Mill.). Theor. Appl. Genet. 112: 366-372.
Zhebentyayeva, T.N., Reighard, G.L., Gorina, V.M. and Abbot, A.G. 2003. Simple
sequence repeat (SSR) analysis for assessment of genetic variability in apricot
germplasm. Theor. Appl. Genet. 106: 435-444.
118

CAPÍTULO 6
Chloroplast DNA diversity in Prunus
and its implication on phylogenetic
relationships


Capítulo 6
ABSTRACT
Chloroplast DNA (cpDNA) in 84 Prunus accessions (interspecific hybrids and
Prunus species) were analysed to identify the maternal origin of the interspecific
hybrids of Prunus and to establish phylogenetic relationships among Prunus species.
PCR-RFLP (polymerase chain reaction-restriction fragment lengh polymorphism)
method, which includes amplification of cpDNA regions with three universal primer
pairs (K1K2, HK, DT) and subsequent digestion with three restriction enzymes (AluI,
HinfI, TaqI), revealed 33 haplotypes for the 84 accessions studied. Fourteen from these
cpDNA haplotypes were shared by two or more accessions, and 19 were private. The
accessions sharing the same haplotype had maternal relationships among them, which
allowed to confirm the identity of maternal progenitors of Prunus interspecific hybrids
in these cases. UPGMA and maximum parsimony analyses were performed based on
shared common fragments among the 33 haplotypes. The detected cpDNA
polymorphisms enabled to reconstruct the phylogenetic relationships among the studied
Prunus accessions. Most of the recovered relationships are in agreement with current
taxonomic hypotheses and artificial crosses.
Key words: Prunus, PCR-RFLP, cpDNA haplotypes, phylogenetic analysis.
121

Chloroplast DNA diversity in Prunus and its implication on phylogenetic relationships
6-1. INTRODUCTION
Prunus (subfamily Prunoideae of the family Rosaceae) is a large and diverse genus
comprised of approximately 400 species of trees and shrubs. This genus chiefly
originated in the Northern hemisphere, is widely represented in Europe (Dosba et al.,
1994). The basic chromosome number of Prunus is x=8. Almond (P. dulcis D.A. Webb,
formerly P. amygdalus Batsch.), peach [P. persica L. (Batsch)], apricot (P. armeniaca
L.), and sweet cherry (P. avium L.) are diploids with 2n=2x=16. Tetraploid species
includes P. spinosa L. (2n=4x=32) and hexaploid species are represented by P.
domestica and P. insititia (2n=6x=48). Prunus is economically important because of its
diversified use and can be used as fruit (e.g., plums, peaches, apricots, cherries, and
almonds), ornamentals, forestry or industrial purposes. The presence of large number of
Prunus species increase the possibilities of interspecific hybridisation, and make the
establishment of botanical classification quite complicated. Traditional taxonomy of
Prunus has used morphology to estimate relationships among the species in question
and to provide a taxonomy for such genus. Systematic classification in Prunus is still
controversial. De Tournefort (1700) recognized six distinct genera within Prunus s.l.
(sensu lato) based on fruit morphology: Amygdalus L., Armeniaca Miller, Cerasus
Miller, Laurocerasus Duhamel, Persica Miller, and Prunus s.s. (sensu stricto). Bentham
and Hooker (1865) were the first to unite the six genera of De Tournefort (1700) into a
single genus Prunus, which was subdivided into seven sections: sects. Amygdalopsis,
Amygdalus, Armeniaca, Cerasoides, Cerasus, Laurocerasus, and Prunus. Koehne
(1893) initially divided the genus Prunus into seven subgenera, but later (Koehne,
1911) recognized four: Amygdalus, Cerasus, Padus, and Prunophora (= Prunus).
Rehder (1940) reviewed the previous treatments and divided the genus into five
subgenera: Prunus [= Prunophora (Neck.)] Focke, Amygdalus (L.) Benth. Hook.,
Cerasus (Adans.) Focke, Padus (Moench) Focke, and Laurocerasus (Ser.) Rehd. The
subgenus Cerasus, as defined by Rehder, was composed of a large and diverse group of
species and was later divided by Ingram (1948) into subgenera Cerasus and
Lithocerasus Ingram. Nowadays, biochemical (isoenzyme) and molecular (DNA
analysis) approaches allow more accurate estimate of genetic affinities and evolutionary
relatedness among Prunus taxa that would permit to compare traditional classifications
established by taxonomists. Several investigations were carried out to assess genetic
variation among Prunus species using isozyme markers (Arulsekar et al., 1986; Mowrey
122

Capítulo 6
and Werner, 1990). Molecular markers as RFLPs, RAPDs and SSRs were also used for
phylogenetic and genetic diversity studies among Prunus species (Kaneko et al., 1986;
Casas et al., 1999; Rohrer et al., 2004).
Noncoding regions of the chloroplast DNA (cpDNA) have been explored under the
assumption that these regions should be under less functional constraint than coding
regions and should hence provide greater levels of variation for phylogenetic analyses
(Gielly and Taberlet, 1994). Universal primers (Taberlet et al., 1991; Demesure et al.,
1995; Dumolin-Lapegue et al., 1997) have been used to amplify fragments of
noncoding regions of cpDNA followed by digestion with restriction enzymes. Fragment
length polymorphism was consequently revealed within the amplified fragment
(Demesure et al., 1996; El Mousadek and Petit, 1996; King and Ferris, 1998). This
PCR-RFLP (polymerase chain reaction-restriction fragment length polymorphism)
method, also named CAPS (Cleaved Amplified Polymorphic Sequences) (Konieczny
and Ausubel, 1993), is a readily accessible laboratory technique which can evaluate
large portions of chloroplast genome in numerous individuals in a short time and lower
cost. This method has been used to analyse phylogenetic relationships of cultivated
Prunus species (Badenes and Parfitt, 1995; Panda et al., 2003) and to determine the
phylogeography and the population diversity in P. spinosa and P. avium (Mohanty et
al., 2000; 2001; 2002).
Current trends in breeding stone fruit rootstocks are based on the production of
interspecific hybrids, aiming at putting together favourable traits which appear in
different species (Moreno, 2004). There are commercial Prunus rootstocks available on
the market which are a result of uncontrolled interspecific pollinations. Moreover, the
pedigree of most of the clones is unknown due to the lack of parental control and which
is a major constraint for their use in breeding programmes. It is subsequently desirable
to appropriately characterise the parentage of the rootstock material as a means to
evaluate the success of the crossing.
In this study, a characterisation of Prunus species and rootstocks (interspecific
hybrids) on the basis of cpDNA screening was carried out with the following objectives:
(1) to analyse the genetic diversity of interspecific hybrids and species belonging to the
Prunus genus; (2) to test the usefulness of the method to confirm the maternal origin of
Prunus interspecific hybrids; (3) to investigate genetic relationships among Prunus
species.
123

Chloroplast DNA diversity in Prunus and its implication on phylogenetic relationships
6-2. MATERIALS AND METHODS
6-2-1. Plant material
Sixty two accessions of various interspecific hybrids of the genus Prunus were
obtained from the Krymsk Experimental Breeding Station of Russia (KEBS, Russia)
including pedigree data (see Table 1). These accessions are representative of the genetic
variability in the KEBS collection. Twenty two Prunus species were sampled from three
important collections of Prunus in Europe: KEBS, Russia; Estación Experimental de
Aula Dei-CSIC, Zaragoza, Spain; INRA (Institut Nationale de Recherche
Agronomique) of Bordeaux and INRA of Avignon, France (Table 1). Fresh leaves were
collected from plants, then frozen and stored at –80 ºC.
6-2-2. DNA extraction, amplification, and digestion
DNA was extracted from frozen leaves following the CTAB (cethyltrimethyl
ammonium bromide) extraction method described by Cheng et al. (1997). DNA quality
was examined by electrophoresis in 0.8% w/v agarose gels and DNA concentration was
quantified by spectrophotometer. Extracted DNA was diluted to 5 ng/µL (working
solution) and stored at -20 ºC until PCR reactions.
Initially, amplifications of cpDNA were done using five universal primer pairs
(Table 6-2) described by Dumolin-Lapegue et al. (1997). PCR reactions were performed
in a final volume of 40 µL containing 20 ng of template DNA, 0.2 mM of each of the
four dNTPs, 0.2 µM of forward and reverse primers each, 2 mM MgCl2, and 1 U of Pfu-
DNA polymerase in the buffer provided by the manufacturers of the enzyme (Biotools
B and M Labs S.A., Spain). Amplifications were carried out in a Gene Amp 2700
thermocycler (Applied Biosystems, Foster, CA) using the following temperature cycles:
1 cycle of 3 min at 95 ºC, 40 cycles of 1 min at 94 ºC, 45 s at 52 ºC to 62 ºC, and 2 min
to 5 min 30 s at 72 ºC (annealing temperature and extension time for each primer pair
are in Table 6-2). The last cycle was followed by a final incubation for 10 min at 72 ºC,
and then the PCR products were stored at 4 ºC before analysis. Amplification of cpDNA
products were checked by electrophoresis on 1% w/v agarose gels, stained with
ethidium bromide, and visualised under UV light. Approximate amplified fragment
sizes were estimated with a 1-kb ladder DNA marker (Invitrogen, Carlsbad, Calif.).
124

Capítulo 6
Table 6-1. List of 84 accessions (interspecific hybrids and species) of Prunus studied. Classification into sections and subgenera is according to Rehder (1940). Haplotypes found in accessions are also included.
AccessionNumber Origina Genotype (♀ x ♂) Sectionb Subgenusb Haplotype
PACE00-03 KEBS [(P. pumila x P. armeniaca ) x P. domestica ] Microcerasus Cerasus H1PACE00-08 KEBS [(P. pumila x P. armeniaca ) x P. domestica ] (4x) Microcerasus Cerasus H1PACE01-26 KEBS (P. besseyi x P. salicina ) x (P. cerasifera x P. persica ) Microcerasus Cerasus H1PACE01-34 KEBS [(P. besseyi x P. armeniaca ) x P. domestica ] Microcerasus Cerasus H1PACE01-46 KEBS (P. pumila x P. armeniaca x P. domestica ) Microcerasus Cerasus H1PACE02-14 KEBS [(P. pumila x P. salicina ) x (P. cerasifera x P. persica )] Microcerasus Cerasus H1PADAC01-47 KEBS (P. pumila x P. armeniaca x P. domestica ) Microcerasus Cerasus H1Drujba KEBS P. pumila x P. armeniaca Microcerasus Cerasus H1EVRICA KEBS [(P. besseyi x P. salicina ) x (P. cerasifera (Otletchniza))] Microcerasus Cerasus H1Krasnaia- lenta
KEBS (P. besseyi x P. salicina ) x P. cerasifera ) = Hiawatha x P. cerasifera
Microcerasus Cerasus H1
Krasni bordur KEBS [(P. besseyi x P. salicina ) x P. cerasifera (Pissardi)] Microcerasus Cerasus H1ST-N1 KEBS P. besseyi x P. cerasifera Microcerasus Cerasus H1ST-N2 KEBS P. bessey i x P. cerasifera Microcerasus Cerasus H1AD-3 EEAD P. besseyi L.H. Bailey Microcerasus Cerasus H1
PACE01-35 KEBS (P. salicina x P. besseyi ) x (P. cerasifera x P. armeniaca ) Euprunus Prunus H2PACE02-05 KEBS (P. salicina x P. cerasifera ) x (P. cerasifera x P. persica ) Euprunus Prunus H2PACE02-06 KEBS (P. salicina x P. cerasifera ) x (P. armeniaca x P. persica ) Euprunus Prunus H2PACE02-07 KEBS [P. salicina x P. cerasifera (4x)] x [P. cerasifera x P.
persica (4x)]Euprunus Prunus H2
PACE02-08 KEBS [(P. salicina x P. cerasifera ) x (P. armeniaca x P. persica )] Euprunus Prunus H2PACE02-21 KEBS (P. salicina (Santa Rosa) x P. cerasifera)(4x) x (P. cerasifera
x P. persica (Kuban-86) (4x))]Euprunus Prunus H2
AD-11 EEAD P. salicina Lindl. Euprunus Prunus H2
PACE00-09 KEBS P. cerasifera x P. persica (4x) Euprunus Prunus H3PACE01-38 KEBS P. dasycarpa x P. domestica Armeniaca Prunus H3PACE01-39 KEBS P. dasycarpa x P. spinosa , F2 Armeniaca Prunus H3PACE01-40 KEBS P. dasycarpa x P. spinosa , F2 Armeniaca Prunus H3PACE01-41 KEBS P. dasycarpa x P. spinosa , F2 Armeniaca Prunus H3PACE02-17 KEBS P. cerasifera x P. persica (nectarine) Euprunus Prunus H3PACE02-18 KEBS P. cerasifera x P. persica (Krymsk-86 (4x)) Euprunus Prunus H3Krasnaia- Kubani
KEBS P. cerasifera x P. persica (Red leaf) Euprunus Prunus H3
Kuban-87 KEBS P. cerasifera x P. persica Euprunus Prunus H3
PACE01-13 KEBS P. fruticosa x P. mahaleb Eucerasus Cerasus H4PACG00-01 KEBS P. fruticosa x P. pensilvanica Eucerasus Cerasus H4LC-52 KEBS P. cerasus x P. maackii Eucerasus Cerasus H4VSL-1 KEBS P. fruticosa x P. lannesiana Eucerasus Cerasus H4VSL-2 KEBS P. fruticosa x P. lannesiana Eucerasus Cerasus H4AD-16 INRA-B P. fruticosa Pall. Eucerasus Cerasus H4
AP-2 KEBS P. cerasifera x P. persica (nectarine) Euprunus Prunus H5Krymsk-1 KEBS P. cerasifera x P. tomentosa Euprunus Prunus H5PACE02-15 KEBS P. cerasifera x (P. communis x P. bucharica ) Euprunus Prunus H5
PACE01-42 KEBS P. kansuensis x P. davidiana x P. persica Euamygdalus Amygdalus H6PACE01-43 KEBS P. kansuensis x P. davidiana x P. persica Euamygdalus Amygdalus H6AD-19 INRA-A P. kansuensis Rehd. Euamygdalus Amygdalus H6
125

Chloroplast DNA diversity in Prunus and its implication on phylogenetic relationships
Table 6-1 (continued) AccessionNumber Origina Genotype (♀ x ♂) Sectionb Subgenusb Haplotype
PACE02-10 KEBS P. brigantiaca x P. persica Armeniaca Prunus H7PACE02-11 KEBS P. brigantiaca x P. persica Armeniaca Prunus H7AD-20 INRA-A P. brigantiaca Vill. Armeniaca Prunus H7
PACE01-24 KEBS P. americana x P. persica Prunocerasus Prunus H8PACE02-09 KEBS P. americana x P. persica Prunocerasus Prunus H8PACE02-12 KEBS P. americana x P. persica Prunocerasus Prunus H8
PACE00-02 KEBS P. tenella x P. dulcis Chameamygdalus Amygdalus H9PACG00-02 KEBS P. nana x P. dulcis Chameamygdalus Amygdalus H9AD-13 EEAD P. tenella Batsh Chameamygdalus Amygdalus H9
PACE01-30 KEBS P. cerasifera x P. bucharica Euprunus Prunus H10PACE01-31 KEBS P. cerasifera x P. bucharica Euprunus Prunus H10PACE01-33 KEBS P. cerasifera x P. kalmycovii Euprunus Prunus H10PACE00-12 KEBS [P. spinosa x (P. cerasifera x P. persica ) (Kuban-1)] Euprunus Prunus H11PACE01-27 KEBS [P. spinosa x (P. cerasifera x P. persica )] Euprunus Prunus H11PACE00-07 KEBS P. spinosa x P. persica (4x) Euprunus Prunus H11AD-2 EEAD P. armeniaca L. Armeniaca Prunus H12AD-9 EEAD P. persica (L.) Batsch Euamygdalus Amygdalus H13PACEOR-03 KEBS [(P. americana x P. simonii ) x P. spinosa ] x (P. cerasifera x
P. persica )Prunocerasus Prunus H14
Vesenia- plamiya
KEBS [(P. americana x P. simonii ) x P. cerasifera (Pissardii)] Prunocerasus Prunus H14
AD-18 INRA-B P. americana Marshall Prunocerasus Prunus H14PACE01-32 KEBS P. cerasifera x P. bucharica Euprunus Prunus H15PACE01-28 KEBS [P. cerasifera x (P. amygdalus x P. bucharica )] Euprunus Prunus H16PACE02-04 KEBS P. kansuensis x P. persica (Red leaf) Euamygdalus Amygdalus H17PACE01-37 KEBS P. cerasifera x P. prostrata , F2 Euprunus Prunus H18PACE01-45 KEBS P. prostrata x P. cerasifera x P. domestica Microcerasus Cerasus H18PACE00-10 KEBS P. cerasifera x P. bucharica Euprunus Prunus H19AD-14 EEAD (P. besseyi x P. salicina ) (Sapa) Microcerasus Cerasus H20PACE00-06 KEBS [(P. besseyi x P. salicina ) (Sapa) x (P. cerasifera x P.
tomentosa ) (Krymsk-1)]Microcerasus Cerasus H20
VSV-1 KEBS P. incana x P. tomentosa Microcerasus Cerasus H20AD-21 EEAD P. prostrata Labill. Microcerasus Cerasus H21AD-17 EEAD P. mahaleb (Dougl.) L. Mahaleb Cerasus H22AD-4 EEAD P. cerasifera Ehrh. Euprunus Prunus H23AD-8 EEAD P. insititia L. Euprunus Prunus H24L-2 KEBS P. lannesiana (Carr.) E.H. Wilson Pseudocerasus Cerasus H25AD-22 EEAD P. bucharica (Korsch.) Hand-Mazz. Euamygdalus Amygdalus H26AD-12 EEAD P. spinosa L. Euprunus Prunus H27AD-10 EEAD P. pumila L. Microcerasus Cerasus H28AD-7 EEAD P. incana (Pall.) Basch. Microcerasus Cerasus H29AD-15 INRA-B P. davidiana (Carriere) Franch. Euamygdalus Amygdalus H30AD-5 EEAD P. dasycarpa Ehrh. Armeniaca Prunus H31AD-6 EEAD P. domestica L. Euprunus Prunus H32AD-1 EEAD P. dulcis (Mill.) D.A. Webb. Euamygdalus Amygdalus H33
a Collection origins: KEBS = Krymsk Experimental Breeding Station of Russia; EEAD = Estación Experimental de Aula Dei-CSIC, Zaragoza, Spain; INRA-A = Institut Nationale de Recherche Agronomique of Avignon, France; INRA-B = Institut Nationale de Recherche Agronomique of Bordeaux, France. b Section and subgenus given here correspond to species in bold type, representing female parent or maternal progenitor for the interspecific hybrid accessions.
126

Capítulo 6
Amplified fragments were digested with three restriction enzymes: AluI, HinfI, and
TaqI (Invitrogen, Carlsbad, Calif.). The reaction mixture was incubated overnight at 37
ºC with three units of AluI or HinfI, or 1 h at 65 ºC with five units of TaqI. Restriction
products were separated on 2.5% w/v agarose gels, run in a Tris-borate-EDTA buffer
(1x) for 5 h at 3V/cm, then stained with ethidium bromide and visualized under UV
light. Restriction fragment sizes were estimated with a 50-bp ladder marker (Amersham,
Piscataway, N.J.).
6-2-3. Data analysis
The presence or absence of each restriction fragments in each polymorphic site was
scored as binary data and used to identify chloroplast haplotypes. Similarity between
pairs of haplotypes was estimated from the binary matrix using the simple matching
coefficient. The similarity matrix was employed to construct a dendrogram by the
unweighted pair-group method with arithmetic averages (UPGMA). All the analyses
were computed using the programs from the NTSYS-pc package, version 2.1 (Rohlf,
2000).
Phylogenetic relationships were recovered using a maximum parsimony approach
based on the binary data matrix performed for the UPGMA cluster analysis. Searches
for the most parsimonious trees were executed with PAUP* version 4.0 (Swofford,
1999). Parsimony analysis was carried out through an heuristic search with CLOSEST
addition of samples, tree bisection reconnection (TBR) branch swapping algorithm, and
the MULPARS option on Bootstrap support (Felsenstein, 1985) was estimated through
10000 replicates imposing the same conditions as for the heuristic search. The
consistency index (CI) and the retention index (RI) were used to assess the amount of
homoplasy and the synapomorphic value present in the data set, respectively.
Additionally, a minimum-length spanning tree between haplotypes of interspecific
hybrids and Prunus parents was performed using the programs from the NTSYS-pc,
version 2.1 (Rohlf, 2000). The procedure consists in calculating the number of
mutational differences between haplotypes, and then connect them by direct links
having the smallest possible length (Prim, 1957).
127
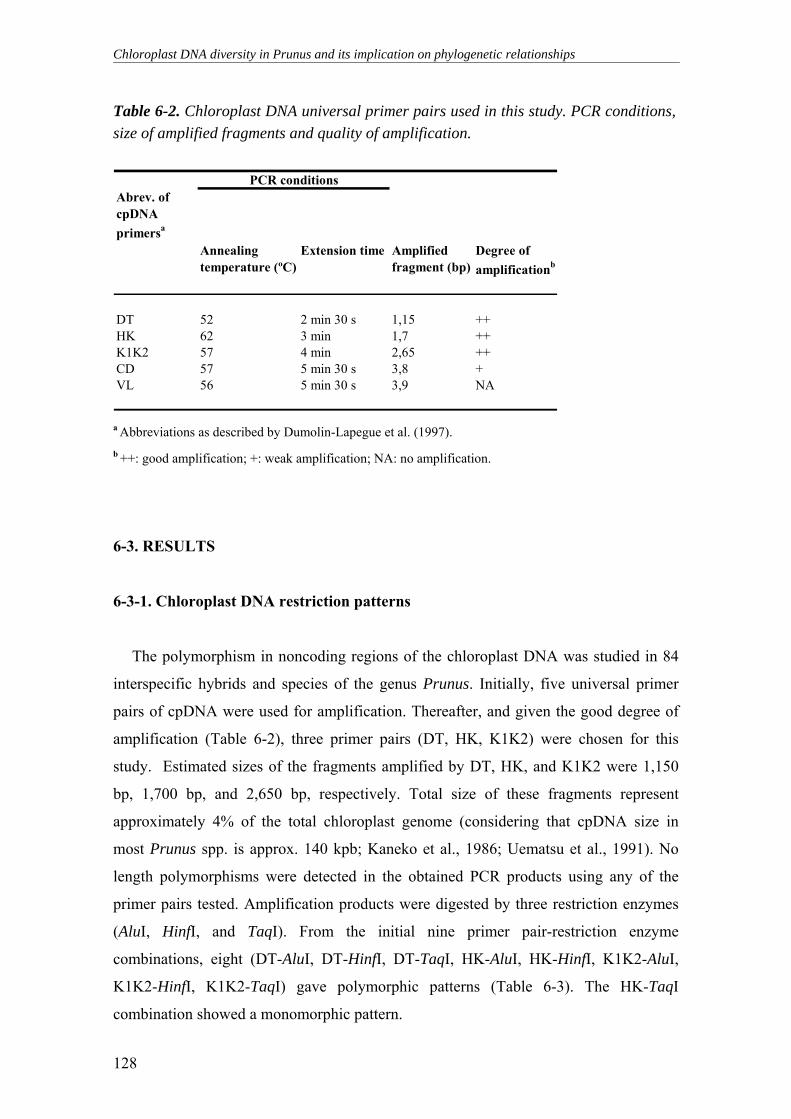
Chloroplast DNA diversity in Prunus and its implication on phylogenetic relationships
Table 6-2. Chloroplast DNA universal primer pairs used in this study. PCR conditions, size of amplified fragments and quality of amplification.
Abrev. of cpDNA primersa
Annealing temperature (ºC)
Extension time Amplified fragment (bp)
Degree of amplificationb
DT 52 2 min 30 s 1,15 ++HK 62 3 min 1,7 ++K1K2 57 4 min 2,65 ++CD 57 5 min 30 s 3,8 +VL 56 5 min 30 s 3,9 NA
PCR conditions
a Abbreviations as described by Dumolin-Lapegue et al. (1997). b ++: good amplification; +: weak amplification; NA: no amplification.
6-3. RESULTS
6-3-1. Chloroplast DNA restriction patterns
The polymorphism in noncoding regions of the chloroplast DNA was studied in 84
interspecific hybrids and species of the genus Prunus. Initially, five universal primer
pairs of cpDNA were used for amplification. Thereafter, and given the good degree of
amplification (Table 6-2), three primer pairs (DT, HK, K1K2) were chosen for this
study. Estimated sizes of the fragments amplified by DT, HK, and K1K2 were 1,150
bp, 1,700 bp, and 2,650 bp, respectively. Total size of these fragments represent
approximately 4% of the total chloroplast genome (considering that cpDNA size in
most Prunus spp. is approx. 140 kpb; Kaneko et al., 1986; Uematsu et al., 1991). No
length polymorphisms were detected in the obtained PCR products using any of the
primer pairs tested. Amplification products were digested by three restriction enzymes
(AluI, HinfI, and TaqI). From the initial nine primer pair-restriction enzyme
combinations, eight (DT-AluI, DT-HinfI, DT-TaqI, HK-AluI, HK-HinfI, K1K2-AluI,
K1K2-HinfI, K1K2-TaqI) gave polymorphic patterns (Table 6-3). The HK-TaqI
combination showed a monomorphic pattern.
128

Capítulo 6
Table 6-3. Major pattern and variant (in bp) of fragments revealed in each polymorphic site detected with different primer pair-restriction enzyme combinations in 84 accessions of hybrids and parents of Prunus studied.
Length or point mutationsMajor pattern → Varianta (bp)
DT-(Alu1 )1 675 (B) → 720 (A)
DT-(Alu1 )2 475 (B) → 490 (A), 460 (C), 250 + 225 (D)
DT-(Hin f1 )1 305 (B) → 315 (A), 175 + 140 (C)
DT-(Hin f1 )2 260 (C) → 275 (B), 305 (A)
DT-(Hin f1 )3 255 (A) → 250 (B)
DT-(Taq1 )1 550 (B) → 555 (A), 540 (C)
DT-(Taq1 )2 395 (C) → 400 (B), 375 (D), 430 (A)
DT-(Taq1 )3 140 (B) → 150 (A)
HK-(Alu1 )1 560 (B) → 570 (A)
HK-(Alu1 )2 385 (D) → 405 (B), 375 (E), 350 (F), 415 (A), 400 (C), 310 (G)
HK-(Alu1 )3 65 + 45 (B) → 110 (A)
HK-(Hin f1 )1 690 (C) → 680 (D), 660 (E), 640 (F), 710 (A), 700 (B)
HK-(Hin f1 )2 240 (C) → 245 (B), 250 (A)
K1K2-(Alu1 )1 425 (A) → 420 (B)
K1K2-(Alu1 )2 330 + 130 (B) → 320 + 130 (D), 460 (A), 325 + 130 (C)
K1K2-(Hin f1 )1 230 + 255 (B) → 485(A)
K1K2-(Hin f1 )2 380 (A) → 370 (B)
K1K2-(Hin f1 )3 340 (C) → 450 (A), 360 (B)
K1K2-(Hin f1 )4 190 (B) → 200 (A)
K1K2-(Taq1 )1 700 (A) → 670 (B)
K1K2-(Taq1 )2 650 (C) → 700 (A), 655 (B), 600 (D)
K1K2-(Taq1 )3 340 (A) → 335 (B), 270 (C)
K1K2-(Taq1 )4 265 (A) → 250 (D), 260 (B), 255 (C)
Polymorphic sites
a A, B, C, D, E, F, and G represent different polymorphisms in each polymorphic site.
These eight primer-enzyme combinations generated 23 polymorphic sites with 41
length mutations (indel mutations) and seven point mutations. Three primer-enzyme
combinations (DT-AluI, HK-HinfI, and K1K2-AluI) showed two polymorphic sites,
while DT-HinfI, DT-TaqI, and HK-AluI presented three, and K1K2-HinfI and K1K2-
TaqI showed four polymorphic sites (Table 6-3).
Of the 23 polymorphic sites, 13 showed three or more patterns and the most
polymorphic were HK-(AluI)2 and HK-(HinfI)1 with 7 and 6 different patterns,
129

Chloroplast DNA diversity in Prunus and its implication on phylogenetic relationships
130
The combination of all the mutations resulted in 33 cpDNA haplotypes (described in
Table 6-4), which represent the 84 accessions studied as are shown in Table 6-1.
Fourteen from the total cpDNA haplotypes were shared by two or more accessions, and
19 were unique haplotypes to their respective accessions. Twenty seven haplotypes
were specific to only one Prunus specie, while the remaining six (H1, H3, H4, H9, H18
and H20) were shared by two different species (Table 6-1). On the other hand, fifteen
from the 24 species analysed (directly or through their interspecific hybrids) presented
only one haplotype, while eight species (P. americana, P. besseyi, P. dasycarpa,
6-3-2. Chloroplast DNA haplotypes
Figure 6-1. Restriction patterns obtained on agarose gel with the primer pair-restriction enzyme combination K1K2-HinfI in 11 interspecific hybrids of Prunus. M: molecular size marker (50 base pair ladder, Amersham, Piscataway, N.J.)
The restriction patterns obtained in the combination K1K2-HinfI in 11 interspecific
hybrids are shown in Figure 6-1. The first interspecific hybrid shows a different
restriction pattern from the rest with the presence of a fragment of approx. 485 bp,
which is substituted by two fragments of 230 bp and 255 bp in the rest of the samples,
caused by a point mutation (Table 6-3). Also, most of the interspecific hybrids show a
fragment of approx. 340 bp except the fourth and the fifth ones which show a fragment
of 450 bp and the seventh one which shows a 360 bp fragment. This kind of
polymorphism was probably due to indel mutations.
respectively. The rest of the polymorphic sites presented only two different restriction
patterns (Table 6-3).
MMMM 1 2 3 4 5 6 7 8 9 10 11
250 bp →
500 bp →
M 1 2 3 4 5 6 7 8 9 10 11
250 bp →
500 bp →
M 1 2 3 4 5 6 7 8 9 10 11
250 bp →
500 bp →
MMMM 1 2 3 4 5 6 7 8 9 10 11
250 bp →
500 bp →
M 1 2 3 4 5 6 7 8 9 10 11
250 bp →
500 bp →
M 1 2 3 4 5 6 7 8 9 10 11
250 bp →
500 bp →
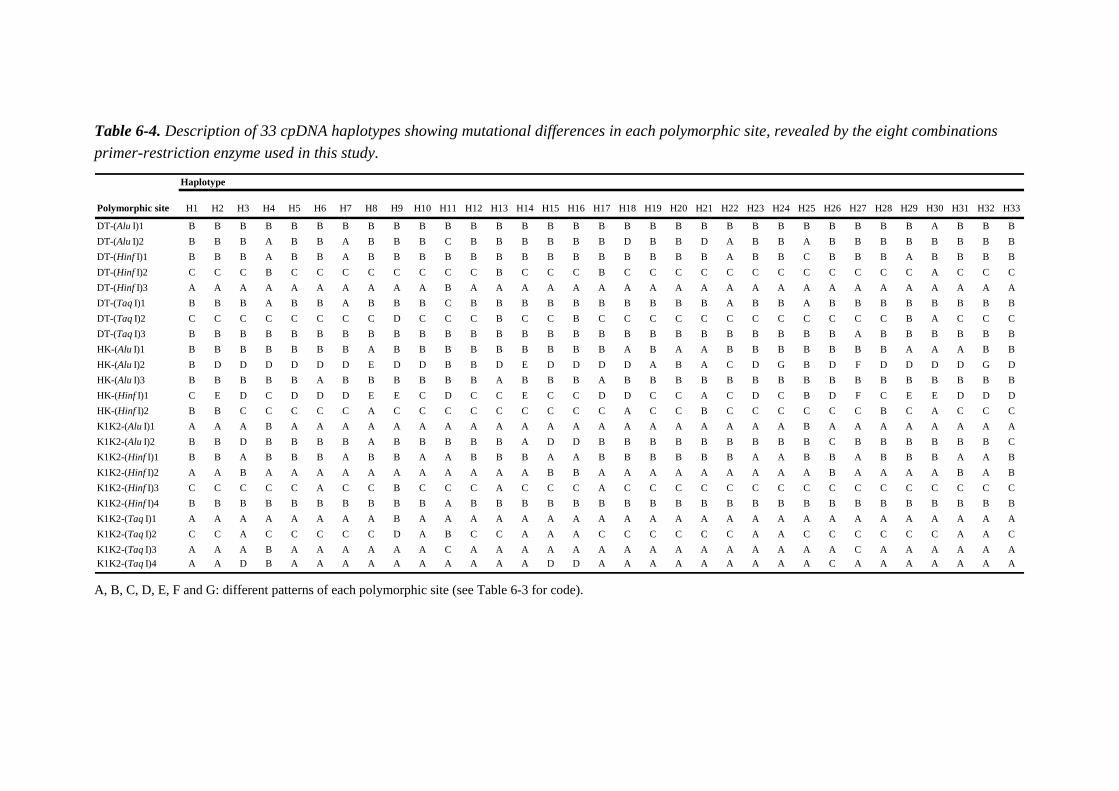
Table 6-4. Description of 33 cpDNA haplotypes showing mutational differences in each polymorphic site, revealed by the eight combinations primer-restriction enzyme used in this study.
Haplotype
Polymorphic site H1 H2 H3 H4 H5 H6 H7 H8 H9 H10 H11 H12 H13 H14 H15 H16 H17 H18 H19 H20 H21 H22 H23 H24 H25 H26 H27 H28 H29 H30 H31 H32 H33
DT-(Alu I)1 B B B B B B B B B B B B B B B B B B B B B B B B B B B B B A B B BDT-(Alu I)2 B B B A B B A B B B C B B B B B B D B B D A B B A B B B B B B B BDT-(Hinf I)1 B B B A B B A B B B B B B B B B B B B B B A B B C B B B A B B B BDT-(Hinf I)2 C C C B C C C C C C C C B C C C B C C C C C C C C C C C C A C C CDT-(Hinf I)3 A A A A A A A A A A B A A A A A A A A A A A A A A A A A A A A A ADT-(Taq I)1 B B B A B B A B B B C B B B B B B B B B B A B B A B B B B B B B BDT-(Taq I)2 C C C C C C C C D C C C B C C B C C C C C C C C C C C C B A C C CDT-(Taq I)3 B B B B B B B B B B B B B B B B B B B B B B B B B B A B B B B B BHK-(Alu I)1 B B B B B B B A B B B B B B B B B A B A A B B B B B B B A A A B BHK-(Alu I)2 B D D D D D D E D D B B D E D D D D A B A C D G B D F D D D D G DHK-(Alu I)3 B B B B B A B B B B B B A B B B A B B B B B B B B B B B B B B B BHK-(Hinf I)1 C E D C D D D E E C D C C E C C D D C C A C D C B D F C E E D D DHK-(Hinf I)2 B B C C C C C A C C C C C C C C C A C C B C C C C C C B C A C C CK1K2-(Alu I)1 A A A B A A A A A A A A A A A A A A A A A A A A B A A A A A A A AK1K2-(Alu I)2 B B D B B B B A B B B B B A D D B B B B B B B B B C B B B B B B CK1K2-(Hinf I)1 B B A B B B A B B A A B B B A A B B B B B B A A B B A B B B A A BK1K2-(Hinf I)2 A A B A A A A A A A A A A A B B A A A A A A A A A B A A A A B A BK1K2-(Hinf I)3 C C C C C A C C B C C C A C C C A C C C C C C C C C C C C C C C CK1K2-(Hinf I)4 B B B B B B B B B B A B B B B B B B B B B B B B B B B B B B B B BK1K2-(Taq I)1 A A A A A A A A B A A A A A A A A A A A A A A A A A A A A A A A AK1K2-(Taq I)2 C C A C C C C C D A B C C A A A C C C C C C A A C C C C C C A A CK1K2-(Taq I)3 A A A B A A A A A A C A A A A A A A A A A A A A A A C A A A A A AK1K2-(Taq I)4 A A D B A A A A A A A A A A D D A A A A A A A A A C A A A A A A A A, B, C, D, E, F and G: different patterns of each polymorphic site (see Table 6-3 for code).

Chloroplast DNA diversity in Prunus and its implication on phylogenetic relationships
P. kansuensis, P. incana, P. prostrata, P. pumila, and P. spinosa) presented two
different haplotypes. P. cerasifera is the unique species of this study which showed
eight different haplotypes (Table 6-1).
Haplotype H1 was the most abundant and was shared by 14 accessions (16,1%), 13
were interspecific hybrids with P. pumila or P. besseyi as female parents and the
fourteenth one was a parent representing the P. besseyi species (Table 6-1). Other
hybrid accessions with P. besseyi as female parent shared the haplotype H20 with an
interspecific hybrid with P. incana as maternal progenitor (Table 6-1).
The haplotype H2 was only shared by seven accessions, six were interspecific
hybrids showing P. salicina as female parent and the last one represented the species P.
salicina itself. Similar results were found in haplotype H7, which were only detected in
two interspecific hybrids with P. brigantiaca as female parent and the species P.
brigantiaca itself. Moreover, haplotypes H6 was detected in two interspecific hybrids
with P. kansuensis as female parent and the species P. kansuensis itself, but this species
was also represented by another haplotype H17 (Table 6-1). The P. americana
accession and two interspecific hybrid with P. americana as female parent shared the
same haplotype H14. This species also showed haplotype H8 (Table 6-1).
All interspecific hybrid accessions with P. dasycarpa as female parent shared the
same haplotype H3 with some hybrid accessions presenting P. cerasifera as female
parent. The P. dasycarpa species also showed the haplotype H31. Moreover, P.
cerasifera presented other six haplotypes (H5, H10, H15, H16, H19 and H23) and
shared the haplotype H18 with P. prostrata (Table 6-1). The haplotype H4 was common
to all the accessions presenting P. fruticosa or P. cerasus as female parent, and to the
species P. fruticosa itself. Prunus tenella accession and two interspecific hybrids with
P. tenella or P. nana as female parent were included under the same haplotype H9.
6-3-3. Chloroplast DNA diversity and phylogenetic relationship in Prunus
UPGMA analysis
The genetic diversity among the different cpDNA haplotypes was shown in the
UPGMA cluster analysis. At a similarity coefficient value of 0.82 the phenogram
showed two main groups and three haplotypes (H9, H11, and H27) appeared out of the
groups (Figure 6-2).
132
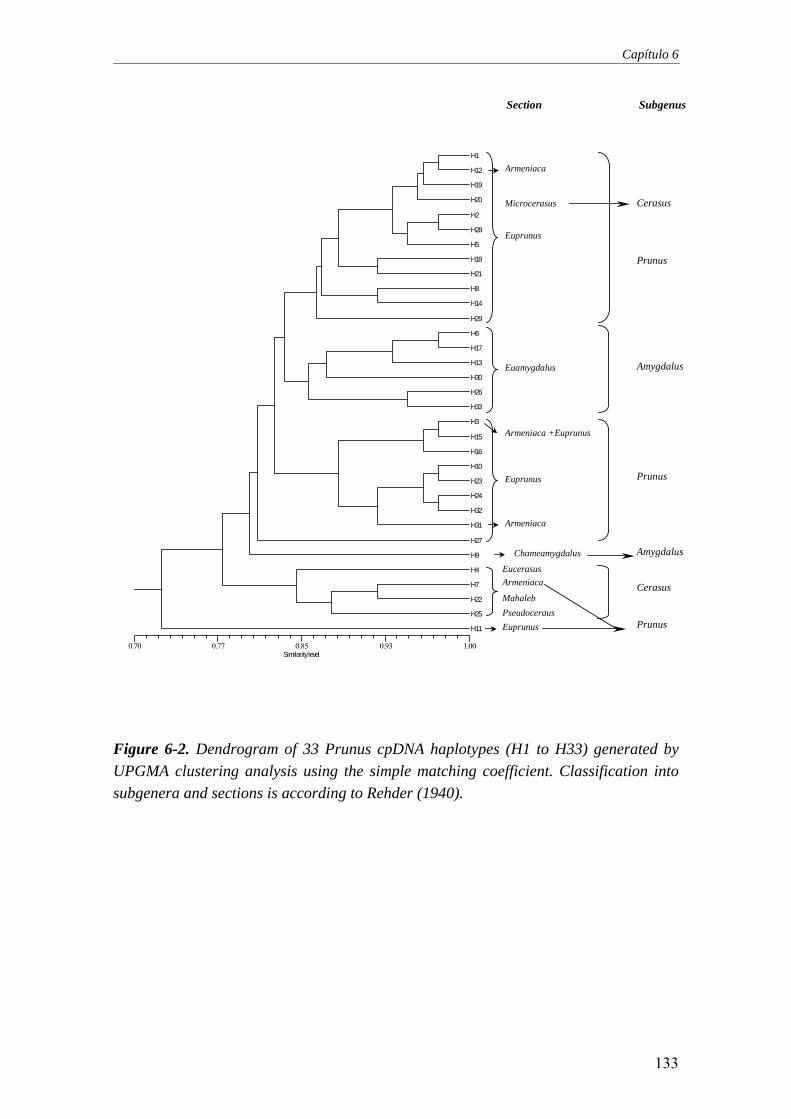
Capítulo 6
Similarity level0.70 0.77 0.85 0.93 1.00
H10
H1
H12
H19
H20
H2
H28
H5
H18
H21
H8
H14
H29
H6
H17
H13
H30
H26
H33
H3
H15
H16
H10
H23
H24
H32
H31
H27
H9
H4
H7
H22
H25
H11
Chameamygdalus Amygdalus
Subgenus Section
Prunus
Armeniaca
Microcerasus
Euprunus
Cerasus
Mahaleb
Armeniaca
Pseudoceraus
Cerasus
Eucerasus
Euamygdalus Amygdalus
Armeniaca +Euprunus
Euprunus Prunus
Armeniaca
Euprunus Prunus
Figure 6-2. Dendrogram of 33 Prunus cpDNA haplotypes (H1 to H33) generated by UPGMA clustering analysis using the simple matching coefficient. Classification into subgenera and sections is according to Rehder (1940).
133
Chloroplast DNA diversity in Prunus and its implication on phylogenetic relationships
The first main group comprised haplotypes of Prunus species belonging to the
subgenus Prunus (= Prunophora), Amygdalus and Cerasus sect. Microcerasus. The
second main group was clustered to the first one at a similarity value of 0.77 and was
composed of four haplotypes, three representing species of the subgenus Cerasus sect.
Eucerasus (H4), sect. Mahaleb (H22), and sect. Pseudocerasus (H25), and the fourth
haplotype (H7) was present in P. brigantiaca species, member of subgenus Prunus sect.
Armeniaca. Two of the three haplotypes clustered out of groups was represented by P.
spinosa species (H27 and H11), while the third one (H9) represented the cpDNA type of
P. tenella and P. nana species.
In the first main group three sub-groups were observed (Figure 6-2). A close
relationship was detected among haplotypes included in the first sub-group,
representing species of the subgenus Prunus sections Armeniaca, Euprunus, and
Prunocerasus, and species of the subgenus Cerasus sect. Microcerasus (H1, H20, H21,
H28, and H29; see Table 6-1). Haplotypes representing species of the subgenus
Amygdalus sect. Euamygdalus were clustered together under the second sub-group
(Figure 6-2). The third sub-group, clustered at a similarity value of 0.82 from the
previous two, contained haplotypes which mostly represented species of subgenus
Prunus sect. Euprunus. Haplotypes representing species of sect. Armeniaca (H3 and
H31) were also included in this sub-group.
Maximum parsimony analysis
Maximum parsimony analysis of cpDNA haplotypes generated 56 most
parsimonious trees (MPT) [Length (L) = 139 steps, Consistency index (CI) = 0.51,
Retention index (RI) = 0.65]. The strict consensus tree showed two main clades (Figure
6-3). The first one included haplotypes representing species of subgenera Amygdalus,
Cerasus, and Prunus; though interspecific relationships were unresolved. Haplotypes
representing species of the subgenus Amygdalus sect. Euamygdalus emerged as
monophyletic group. Within this Amygdalus group, the sister taxa P. bucharica (H26)
and P. dulcis (H33) showed moderate bootstrap support (76%). Four haplotypes of
subgenus Cerasus (H4, H25, H22, H29) plus an haplotype (H7) of P. brigantiaca, a
species traditionally classified in Prunus sect. Armeniaca, joined into the same group.
Other haplotypes of subgenus Cerasus (H1, H20, H28) were related to this group but
joined in a polytomy with other haplotypes representing species of the subgenus Prunus
134

Capítulo 6
76
Euprunus
Euprunus + Armeniaca Armeniaca
Prunus
Prunocerasus chameamygdalus
Prunus Amygdalus
Microcerasus Euprunus
Cerasus Prunus
Armeniaca
Euprunus Prunus
Pseudocerasus
Mahaleb
Cerasus
Microcerasus
Eucerasus
(Armeniaca)
(Prunus)
Euamygdalus Amygdalus
H18
H21
H1
H2
H12
H19
H20
H28
55
H13
H30
H17
H6
H26
H33
H5
H4
H25
H7
H22 H29
60
H27
H11
52
H3
H31
H23
H10
H24
H32
H16
H8
H14
H9
52
82
H15
Figure 6-3. Strict consensus of 56 most parsimonious trees of 33 Prunus cpDNA haplotypes (L = 139, CI = 0.51, RI = 0.65). Bootstrap percentages, when greater than 50%, are shown above the branches. Classification into subgenera and sections is according to Rehder (1940).
135
Chloroplast DNA diversity in Prunus and its implication on phylogenetic relationships
(H21, H2, H12 and H19). The haplotypes H18 (P. prostrata and P. cerasifera) and H21
(P. prostrata) were resolved as sister haplotypes although with low support (55%)
(Figure 6-3).
The second main clade included haplotypes representing Prunus species of subgenus
Prunus sect. Euprunus, except those of P. dasycarpa (H3 and H31) that belong to sect.
Armeniaca (Figure 6-3). Haplotypes H15, H16 and H3, representing P. cerasifera and
P. dasycarpa species, joined into a strong supported group with high support (82%).
Similarly to the UPGMA phenogram, haplotypes H27 and H11 (from P. spinosa
species) were also clustered out of clades in the consensus tree (Figure 6-3).
Minimum-length spanning tree analysis
The relationships among the 33 cpDNA haplotypes were also presented in a
minimum-length spanning tree (MST) showed in Figure 6-4. The MST offers a good
representation of linked haplotype groups based on the mutational differences among
them. Two main clusters of haplotypes could be observed with H23 and H5 as the
internal nodes. The cluster linked to H23 contained haplotypes representing species of
subgenus Prunus sect. Euprunus, and sect. Armeniaca for P. dasycarpa (H3, H31)
species. The cluster linked to H5 was composed of haplotypes representing species of
subgenus Amygdalus, Cerasus and Prunus.
136
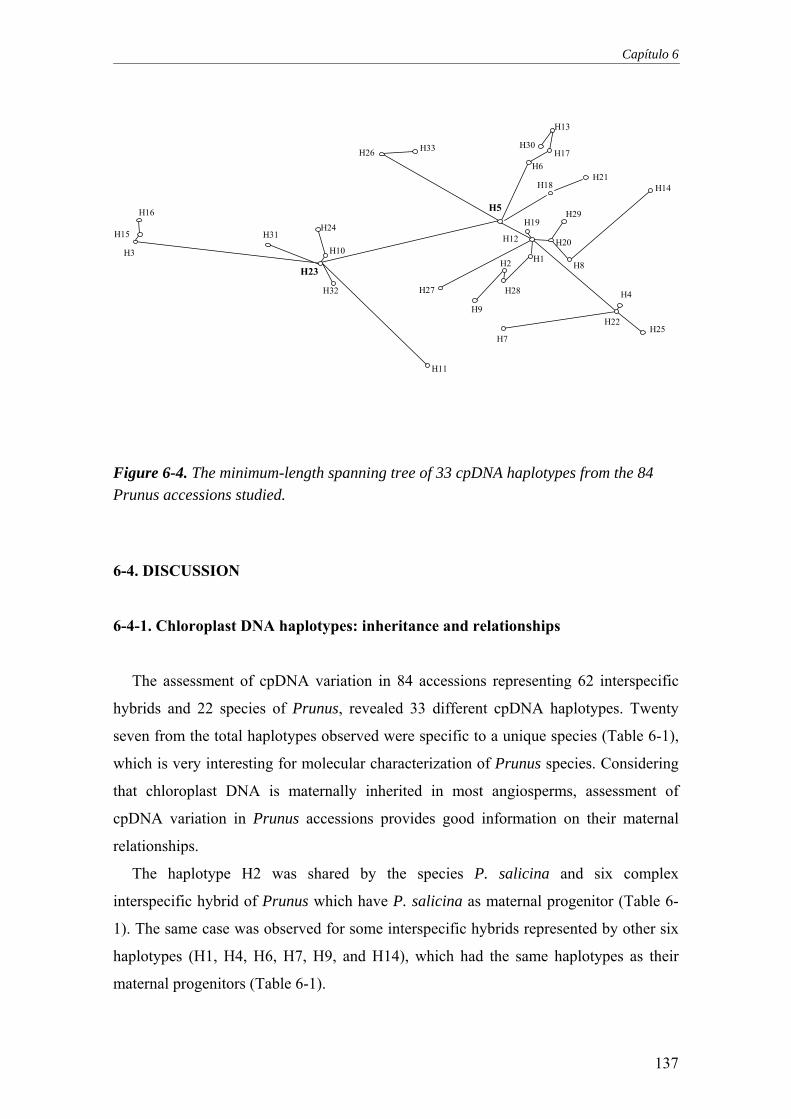
Capítulo 6
H1H2H3
H4
H5
H6
H7
H8 H9
H10
H11
H12
H13
H14
H15 H16
H17 H18
H19
H20
H21
H22
H23
H24
H25
H26
H27 H28
H29
H30
H31
H32
H33
Figure 6-4. The minimum-length spanning tree of 33 cpDNA haplotypes from the 84 Prunus accessions studied.
6-4. DISCUSSION
6-4-1. Chloroplast DNA haplotypes: inheritance and relationships
The assessment of cpDNA variation in 84 accessions representing 62 interspecific
hybrids and 22 species of Prunus, revealed 33 different cpDNA haplotypes. Twenty
seven from the total haplotypes observed were specific to a unique species (Table 6-1),
which is very interesting for molecular characterization of Prunus species. Considering
that chloroplast DNA is maternally inherited in most angiosperms, assessment of
cpDNA variation in Prunus accessions provides good information on their maternal
relationships.
The haplotype H2 was shared by the species P. salicina and six complex
interspecific hybrid of Prunus which have P. salicina as maternal progenitor (Table 6-
1). The same case was observed for some interspecific hybrids represented by other six
haplotypes (H1, H4, H6, H7, H9, and H14), which had the same haplotypes as their
maternal progenitors (Table 6-1).
137

Chloroplast DNA diversity in Prunus and its implication on phylogenetic relationships
These results seem to agree with the maternal inheritance of cpDNA in Prunus and,
in some cases, permit to confirm the identity of the maternal progenitor. However, some
interspecific hybrids showed different haplotypes from the obtained maternal ones.
This fact was observed when the Prunus species analysed directly or through their
interspecific hybrids presented two or plus different haplotypes, as P. americana, P.
besseyi, P. dasycarpa, P. kansuensis, P. incana, P. prostrata, P. pumila, P. spinosa and
P. cerasifera. This last species is the only one of this study which showed eight
different haplotypes, probably due to the large number of P. cerasifera accessions (16)
analysed (directly or through their interspecific hybrids) (Table 6-1). The mentioned
discordances could be due to the existence of intraspecific cpDNA variation, which has
been previously reported in Prunus species as P. spinosa and P. avium (Mohanty et al.
2000; 2001; 2002). Therefore, to confirm the maternal origin of interspecific hybrids
based on their cpDNA haplotypes, it will be need to analyse more accessions of these
Prunus species to know better their intraspecific cpDNA diversity.
Several pairs of Prunus species shared the same cpDNA haplotypes (H1, H3, H4,
H9, H18, and H20; Table 6-1). The predominant haplotype H1 was presented in P.
besseyi species accession and 13 hybrids of Prunus having P. pumila or P. besseyi as
female parent (Table 6-1). Assuming that cpDNA is maternally inherited in Prunus, the
obtained result provided information about the existence of a maternal relationship
between P. pumila and P. besseyi. In fact, these two species are members of the same
subgenus Cerasus sect. Microcerasus as defined by Rehder (1940). Close relationships
between P. pumila and P. besseyi were also reported by Mowrey and Werner (1990)
using isozyme markers.
On the other hand, nine interspecific hybrid accessions presented in common the
haplotype H3, these hybrids have P. cerasifera or P. dasycarpa as female parents. This
result could indicate that exist a close maternal relationship between these two species.
Prunus dasycarpa is, indeed, a naturally occurring hybrid of P. cerasifera and P.
armeniaca (Mehlenbacher et al., 1990). Moreover, these authors reported that P.
cerasifera x P. armeniaca produces hybrids resembling the natural interspecific hybrid
species P. dasycarpa when plum is used as the female parent. According to these
findings and the results obtained in this study, we can suggest that P. cerasifera could
be the maternal progenitor of P. dasycarpa.
The haplotype H4 was shared by six accessions, five are hybrids which have P.
fruticosa or P. cerasus as female parents, and one represents the P. fruticosa itself. The
138

Capítulo 6
grouping of these six accessions under the same haplotype H4 could be due to the
existence of close maternal relationships between P. fruticosa and P. cerasus. In fact,
these two species belong to the same subgenus Cerasus sect. Eucerasus. In addition,
sour cherry (P. cerasus) is considered to be the product of interspecific hybridisation of
sweet cherry (P. avium) and ground cherry (P. fruticosa) (Olden and Nymbom, 1968).
According to Mehlenbacher et al. (1990) crossings between ground cherry and diploid
or tetraploid sweet cherry selections gave progenies resembling sour cherry. Moreover,
the study of Panda et al. (2003) confirms that P. avium is not the maternal parent of P.
cerasus. Our findings are in agreement with these reports, suggesting that P. fruticosa
may be the female parent of P. cerasus.
The haplotype H9 was shared by three accessions, two are hybrids having P. tenella
or P. nana as female parent and one represent the species P. tenella (Table 6-1).
According to Rehder (1940), P. tenella and P. nana are synonyms, which can explain
their cpDNA pattern similarity.
6-4-2. Chloroplast DNA diversity and phylogenetic relationships in Prunus
The cpDNA data obtained from the PCR-RFLP analysis of the 84 Prunus accessions
were used to produce a dendrogram by the UPGMA cluster method, a strict consensus
tree and a minimum-length spanning tree. Comparison of the cpDNA phenogram and
cladogram with the taxonomic classification of Prunus based on morphological data
(Rehder, 1940) shows similarities but also several apparent discrepancies.
In the UPGMA phenogram (Figure 6-2), the first main group contained all
haplotypes representing species of subgenus Cerasus sect. Microcerasus, which
clustered with haplotypes representing species of subgenera Prunus and Amygdalus.
The remaining haplotypes representing species of subgenus Cerasus, sections
Eucerasus (H4), Mahaleb (H22) and Pseudocerasus (H25), were clustered in the second
main group. Therefore, the traditional classification of Microcerasus included within
subgenus Cerasus (Rehder, 1940) was not supported by this UPGMA analysis.
Moreover, Bortiri et al. (2001) and Lee and Wen (2001), noted that sect. Microcerasus
does not show any relationship to the rest of the subgenus Cerasus. Likewise, Katayama
and Uematsu (2005), also found that Amygdalus, Prunus, and Cerasus sect.
Microcerasus formed a major group in the UPGMA tree performed using RFLP data
from chloroplast DNA. Moreover, the parsimony-based strict consensus tree (Figure 6-
139
Chloroplast DNA diversity in Prunus and its implication on phylogenetic relationships
3) showed most sect. Microcerasus haplotypes (H1, H18, H20, and H28) joined into a
polytomic clade and separated from the Cerasus group (H4, H22, H25, H29), although
all of them belonged to the first main clade. Similar relation among haplotypes
representing Microcerasus species and haplotypes representing the rest of species of the
subgenus Cerasus was also showed in the MST analysis (Figure 6-4).
The first main group in the UPGMA phenogram was composed of 3 sub-groups
(Figure 6-2). The first sub-group included species of sect. Microcerasus and species of
subgenus Prunus. This sub-group showed the close relatedness of P. pumila and P.
besseyi (H1, H20, and H28) to plums, P. salicina and P. cerasifera (H2, H5, and H19),
and apricot, P. armeniaca (H12). Ramming and Cociu (1990) reported that the cherry
species P. besseyi and P. pumila appeared more closely related to plums than to
cherries. Bortiri et al. (2001) mentioned that sect. Microcerasus was not monophyletic
and most of its species might be more closely related to subgen. Prunus than to subgen.
Cerasus. More research is required to find the closest relatives belonging to
Microcerasus species.
Haplotypes representing species of the subgenus Amygdalus sect. Euamygdalus were
grouped together in the second sub-group (Figure 6-2). The P. kansuensis, P. persica,
and P. davidiana peach species examined in this study, and represented by haplotypes
H6, H17, H13 and H30 (Table 6-1), clustered together at a high similarity value (0.86).
The P. bucharica (H26) and P. dulcis (H33) almond species were closely related at a
similarity value of 0.94, and they were also joined to peach species. In fact, members of
sect. Euamygdalus were often classified as either almond-like or peach-like plants
(Scorza and Okie, 1990), which is well supported by our findings. The parsimony-based
strict consensus tree (Figure 6-3) and the MST (Figure 6-4) also showed close
relationships among Amygdalus haplotypes (sect. Euamygdalus) and were in agreement
with the UPGMA clustering. Nevertheless, P. tenella member of subgenus Amygdalus
sect. Chamaeamygdalus, represented by haplotype H9, appears out of the Amygdalus
group (Figures 6-2, 6-3, and 6-4). This result indicates that the cpDNA of P. tenella can
be highly divergent from the other Amygdalus species. Kester et al. (1990) reported that
sect. Chameamygdalus includes species genetically divergent from species of other
almond sections and that it rarely crosses with cultivated almond.
The close relationships showed between H24 (P. insititia) and H32 (P. domestica)
(Figure 6-2), was also reported by Casas et al. (1999) and Bouhadida et al. (2005)
analysing the genetic diversity of Prunus rootstocks with RAPD and SSR markers,
140

Capítulo 6
respectively. These two species were closely related to P. cerasifera, represented by
H10 and H23 (Figures 6-2, 6-3, and 6-4). P. domestica was thought to be derived from a
crossing between a diploid (2n=2x=16) cherry plum or myrobalan, P. cerasifera, and a
tetraploid (2n=4x=32) sloe or blackthorn, P. spinosa (Crane and Lawrence 1952). This
hypothesis has been widely accepted by horticulturists and crop plant evolutionists.
However, Zohary (1992) reported that probably P. domestica evolved directly from the
variable P. cerasifera, because of the close morphological similarities between them,
and the wide morphological divergence between these two plums and P. spinosa.
According to the UPGMA dendrogram, the strict consensus tree and the MST (Figures
6-2, 6-3, and 6-4), haplotypes H11 and H27 representing the P. spinosa plum specie,
appear separated of haplotypes representing other plum species. These results agree
with studies that showed the high cpDNA diversity in P. spinosa (Mohanty et al. 2000;
2002).
Prunus fruticosa and P. cerasus species (haplotype H4) were grouped together with
P. brigantiaca (H7), P. mahaleb (H22), and P. lannesiana (H25) (Figures 6-2, 6-3, and
6-4). An apparent common maternal inheritance may exist among these species. This
result can be explained by the fact that all species of this group belong to the subgenus
Cerasus with the exception of P. brigantiaca, which belong to subgenus Prunus sect.
Armeniaca. According to the phylogenetic studies of Mowrey and Werner (1990) based
on isozymes, P. mahaleb a member of the section Mahaleb was clustered together with
P. cerasus and P. fruticosa, which were classified within section Eucerasus. Bortiri et
al. (2001) reported in their nuclear ITS and chloroplast DNA study that P. lannesiana
was a synonym of P. serrulata, and that these species was closely related to P. fruticosa
and P. cerasus. Our results are in agreement with these findings. The placement of
European native apricot species P. brigantiaca (H7) within this group obscured its
relationship with respect to other apricots. Bortiri et al. (2001) also reported that P.
brigantiaca was not included in the Armeniaca clade, and that the ITS sequence of this
species had many ambiguities, some of them in regions of high variability. Additional
studies including more accessions of Prunus species and using more molecular data
(e.g. more combinations of primers and restriction enzymes) would be required to
understand the true position of P. brigantiaca within the genus Prunus and to reach at a
more accurate phylogeny of Prunus.
In summary, the results of this work demonstrate the usefulness of cpDNA diversity
detected using PCR-RFLP methods to analyse the phylogenetic relationships among
141
Chloroplast DNA diversity in Prunus and its implication on phylogenetic relationships
species and cultivars of Prunus. This study contributes to understand the maternal
inheritance of cpDNA in Prunus, and permits to confirm the maternal progenitors of
different hybrids of this genus. The maternal inheritance of cpDNA and the
phylogenetic relationships revealed by the cpDNA variation will be a useful tool in
designing crosses for future breeding programs. The cpDNA analysis will also provide a
starting point for a more detailed phylogenetic analysis of the genus Prunus.
REFERENCES
Arulsekar, S., Parfitt, D.E. and Kester, D.E. 1986. Comparison of isozyme variability
in peach and almonds cultivars. J. Hered. 77: 272-274.
Badenes, M.L. and Parfitt, D.E. 1995. Phylogenetic relationships of cultivated Prunus
species from an analysis of chloroplast DNA variation. Theor. Appl. Genet. 90:
1035-1041.
Bentham, G. and Hooker, J.D. 1865. Genera plantarum, vol. 1. Reeve & Co., London,
UK.
Bortiri, E., Oh, S.H., Jiang, J., Baggett, S., Granger, A., Weeks, C., Buckingham, M.,
Potter, D. and Parfitt, D. 2001. Phylogeny and systematics of Prunus (Rosaceae) as
determined by sequence analysis of ITS and the chloroplast trnL-trnF spacer DNA.
Syst. Bot. 26: 797–807.
Bouhadida, M., Casas, A.M., Moreno, M.A. and Gogorcena, Y. 2005. Genetic diversity
of Prunus rootstocks using microsatellite markers. Acta Hort. 663: 625-627.
Casas, A.M., Igartua, E., Balaguer, G. and Moreno, M.A. 1999. Genetic diversity of
Prunus rootstocks analysed by RAPD markers. Euphytica 110: 139-149.
Cheng, F.S., Brown, S.K. and Weeden, N.F., 1997. A DNA extraction protocol from
various tissues in woody species. Hort. Sci. 32: 921-922.
Crane, M.B., and Lawrence, W.J.C. 1952. The genetics of garden plants. 4th ed.
MacMillan, London, UK.
Demesure, B., Sodzi, N. and Petit, R.J. 1995. A set of universal primers for
amplification of polymorphic non-coding regions of mitochondrial and chloroplast
DNA in plants. Mol. Ecol. 4: 129-131.
Demesure, B., Comps, B. and Petit, R.J. 1996. Chloroplast DNA phylogeography of the
common beech (Fagus sylvatica L.) in Europe. Evolution, 50: 2515-2520.
142

Capítulo 6
De Tournefort, J.P. 1700. Institutiones rei herbariae, 1st ed. Paris, France.
Dosba, F., Bernhard, R. and Zanetto, A. 1994. Importance des ressources génétiques
des Prunus. CR Acad. Agri. Fr. 80: 45-57.
Dumolin-Lapegue, S., Pemonge, M.H. and Petit, R.J. 1997. An enlarged set of
consensus primers for the study of organelle DNA in plants. Mol. Ecol. 6: 393-397.
Duval, M.F., Buso, G.S., Ferreira, F.R., Noyer, J.L., Coppens d’Eeckenbrugge, G.,
Hamon, P. and Ferreira, M.E. 2003. Relationships in Ananas and other related genera
using chloroplast DNA restriction site variation. Genome 46: 990-1004.
El Mousadek, A. and Petit, R.J. 1996. Chloroplast DNA phylogeography of the argan
tree of Morocco. Mol. Ecol. 5: 547-555.
Felsenstein, J. 1985. Confidence limits on phylogenies: An approach using the
bootstrap. Evolution 39: 783-791.
Gielly, L. and Taberlet, P. 1994. The use of chloroplast DNA to resolve plant
phylogenies: non-coding vs RbcL sequences. Mol. Biol. Evol. 11: 769-777.
Ingram, C., 1948. Ornamental cherries. Country Life Limited. London. UK.
Kaneko, T., Terachi, T. and Tsunewaki, K. 1986. Studies on the origin of crop species
by restriction endonuclease analysis of organellar DNA. II. Restriction analysis of
ctDNA of 11 Prunus species. Jpn. J. Genet. 61: 157-168.
Katayama, H. and Uematsu, C. 2005. Structural analysis of chloroplast DNA in Prunus
(Rosaceae): evolution, genetic diversity and unequal mutations. Theor. Appl. Genet.
111: 1430-1439.
Kester, D.E., Gradziel, T.M. and Grasselly, C. 1990. Almonds (Prunus). In Genetic
resources of temperate fruit and nut crops. Edited by J.N.M. Moore & J.R. Ballington
Jr. International Society for Horticultural Science, Wageningen, The Netherlands. pp.
699-758.
King, R.A. and Ferris, C. 1998. Chloroplast DNA phylogeography of Alnus glutinosa
(L.) Gaertn. Mol Ecol. 7: 1151-1161.
Koehne, E. 1893. Deutsche dendrology, Stuttgart: Verlag von Ferdinand Enke.
Koehne, E. 1911. Die Gliederung von Prunus subgen. Padus. Verhandhunben des
botanischen Vereins der Provinz Brandenburg. Berlin. 52: 101-108.
Konieczny, A. and Ausubel, F.M. 1993. A procedure for mapping Arabidopsis
mutations using codominant ecotype-specific PCR-based markers. Plant J. 4: 403-
410.
143
Chloroplast DNA diversity in Prunus and its implication on phylogenetic relationships
Lee, S. and Wen, J. 2001. A phylogenetic analysis of Prunus and the Amygdaloideae
(Rosaceae) using ITS sequences of nuclear ribosomal DNA. Am. J. Bot. 88: 150-
160.
Mehlenbacher, S.A., Cociu, V. and Hough, F. 1990. Apricots (Prunus). In Genetic
resources of temperate fruit and nut crops. Edited by J.N.M. Moore & J.R. Ballington
Jr. International Society for Horticultural Science, Wageningen, The Netherlands. pp.
63-173.
Mohanty, A., Martín, J.P. and Aguinagalde, I. 2000. Chloroplast DNA diversity within
and among populations of the allotetraploid Prunus spinosa L. Theor. Appl. Genet.
100: 1304-1310.
Mohanty, A., Martín, J.P., and Aguinagalde, I. 2001. A population genetic analysis of
chloroplast DNA in wild populations of Prunus avium L. in Europe. Heredity 87:
421-427.
Mohanty, A., Martín, J.P. and Aguinagalde, I. 2002. Population genetic analysis of
European Prunus spinosa (Rosaceae) using chloroplast DNA markers. Am. J. Bot.
89: 1223-1228.
Moreno, M.A. 2004. Breeding and selection of Prunus rootstocks at the Aula Dei
experimental station, Zaragoza, Spain. Acta Hort. 658: 519-528.
Mowrey, B.D. and Werner, D.J. 1990. Phylogenetic relationships among species of
Prunus as inferred by isozyme markers. Theor. Appl. Genet. 80: 129-133.
Olden, E.J. and Nybom, N. 1968. On the origin of Prunus cerasus L. Hereditas 59:
327-345.
Panda, S., Martín, J.P., and Aguinagalde, I. 2003. Chloroplast DNA study in sweet
cherry cultivars (Prunus avium L.) using PCR-RFLP method. Plant Breed. 122: 92-
94.
Prim, R.C. 1957. Shortest connection networks and some generalizations. Bell. Labs.
Tech. J. 36: 1389-1401.
Ramming, D.W. and Cociu, V. 1990. Plums (Prunus). In Genetic resources of
temperate fruit and nut crops. Edited by J.N.M. Moore & J.R. Ballington Jr.
International Society for Horticultural Science, Wageningen, The Netherlands. pp.
233-287.
Rehder, A. 1940. A manual of cultivated trees and shrubs hardy in North American
exclusive of the subtropical and warmer temperate regions, 2nd edn. Macmillan,
New York, USA.
144
Capítulo 6
Rohlf, F.J. 2000. NTSYS-pc Numerical Taxonomy and Multivariate Analysis System.
Version 2.1. Exeter Software, Setauket, NY.
Rohrer, J.R., Ahmad, R., Southwick, S.M. and Potter, D. 2004. Microsatellite analysis
of relationships among North American plums (Prunus sect. Prunocerasus,
Rosaceae). Plant. Syst. Evol. 244: 69-75.
Scorza, R., and Okie, W.R. 1990. Peaches (Prunus). In Genetic resources of temperate
fruit and nut crops. Edited by J.N.M. Moore & J.R. Ballington Jr. International
Society for Horticultural Science, Wageningen, The Netherlands. pp. 175-231.
Swofford, D.L. 1999. PAUP*: phylogenetic analysis using parsimony, version 4.0.
Sinauer, Sunderland, Massachesetts, USA.
Taberlet, P., Gielly, L., Pautou, G. and Bouvet, J. 1991. Universal primers for
amplification of three non-coding regions of chloroplast DNA. Plant. Mol. Biol. 17:
1105-1109.
Uematsu, C., Sasakuma, T. and Ogihara, Y. 1991. Phylogenetic relationships in the
stone fruit group of Prunus as revealed by restriction fragment analysis of
chloroplast DNA. Jpn. J. Genet. 66: 59-69.
Zohary, D. 1992. Is the European plum, Prunus domestica L., a P. cerasifera EHRH. X
P. spinosa L. allo-polyploid?. Euphytica 60: 75-77.
145


CAPÍTULO 7
Discusión general


Capítulo 7
Los marcadores moleculares de tipo microsatélites (SSRs) juegan un papel muy
importante en la caracterización, identificación y análisis de la diversidad genética en
melocotonero. Los marcadores SSRs tienen un elevado nivel de polimorfismo, son codominantes, y
fáciles de detectar mediante la PCR. Por otro lado, una vez diseñados los cebadores, la
amplificación de los microsatélites es sencilla, reproducible y de fácil automatización.
La validez de los SSRs en estudios genéticos de melocotonero se ha demostrado por
muchos equipos de trabajo (Cipriani et al., 1999; Testolin et al., 2000; Sosinski et al.,
2000; Dirlewanguer et al., 2002; Aranzana et al., 2002; 2003). Estos marcadores tienen
mayor eficiencia en comparación con otros marcadores moleculares como los
isoenzímas (Messeguer et al., 1987), los RFLPs (Rajapakse et al., 1995) o los RAPDs
(Warburton y Bliss, 1996).
En esta tesis se han utilizado un conjunto de microsatellites desarrollados en su
mayoría en melocotonero (Testolin et al., 2000; Sosinski et al., 2000; Dirlewanguer et
al., 2002; Aranzana et al., 2002) y en cerezo (Downey e Iezzoni, 2000; Joobeur et al.,
2000), para la caracterización y el análisis de la diversidad genética: en 30 variedades
locales de melocotonero procedentes de Aragón (Capítulo 3); 94 variedades locales de
distintas regiones españolas y variedades comerciales de melocotonero (Capítulo 4); y
en 44 patrones de distintas especies e híbridos interespecíficos de Prunus (Capítulo 5).
Por otro lado, se analizó el DNA cloroplástico de 84 accesiones (híbridos inter-
específicos y especies Prunus) mediante la técnica de PCR-RFLP, con el objetivo de
confirmar el progenitor materno en el pedigrí de los híbridos ínterespecíficos y detectar
las relaciones genéticas y filogenéticas entre las especies Prunus estudiadas (Capítulo
6).
7.1. ESTUDIO GENÉTICO CON SSRs EN CULTIVARES DE GERMOPLASMA
LOCAL DE MELOCOTONERO
Se estudiaron 30 cultivares tradicionales de melocotonero originarios de Aragón, con
el fin de caracterizar la variedad ‘Miraflores’ que tiene un gran interés económico
(Moreno y Casas, 2002). Esta variedad tiene un pedigrí desconocido y se comparó con
otras variedades locales para buscar sus supuestos parentales. Estos cultivares se
estudiaron con 20 SSRs previamente seleccionados por ser polimórficos en
melocotonero.
149
Discusión general
Las 20 parejas de cebadores amplificaron un total de 46 alelos con una media de 2,3
alelos por locus. Otros trabajos en melocotonero detectaron un mayor número medio de
alelos por locus [(4,5) Testolin et al. (2000); (3,2) Aranzana et al. (2002); (4,2)
Dirlewanger et al. (2002)]. El valor medio de la heterocigosidad esperada (He) y el
valor medio del poder de discriminación (PD) fueron también más bajos que los valores
observados por los mismos autores. El bajo nivel mostrado en los parámetros de
variabilidad de los SSRs puede ser debido, en este caso, a la baja variabilidad genética
entre los 30 cultivares estudiados, ya que 19 de ellos son posibles clones de la misma
variedad ‘Miraflores’ y 14 de ellos mostraron el mismo perfil molecular con todos los
SSRs utilizados. Por otro lado, el resto de los cultivares incluidos en este estudio son
variedades tradicionales cultivadas en la misma región que los ‘Miraflores’. Tres de
ellas (‘Tardío del Pilar’, ‘Amarillo de Septiembre’ y ‘Tipo Campiel’) muestran
características del fruto similares a los clones de ‘Miraflores’ y se encuentran a unas
distancias genéticas muy cercanas, lo que sugiere que podrían tener la misma base
genética e incluso formar parte de su pedigrí. El resto de los cultivares tradicionales se
encuentran más alejados.
En esta tesis, se estudiaron también 94 cultivares de melocotonero, nectarina y
paraguayo, con características morfológicas y fenológicas diferentes. La mayoría de los
cultivares (64) pertenecen al germoplasma local español de la colección nacional de
referencia, en su mayoría con carne amarilla dura y adherente al hueso. El resto son
variedades comerciales que provienen en su mayoría de programas de mejora modernos.
Los 94 cultivares se analizaron mediante 15 parejas de cebadores seleccionados por su
mayor nivel de polimorfismo. Los 15 SSRs permitieron la identificación de todas las
variedades estudiadas, es decir, cada variedad mostró un genotipo único. Las 15 parejas
de cebadores detectaron un total de 101 alelos con un valor medio de 6,73 alelos por
locus. Este valor medio es mayor que el observado en los 30 cultivares locales
aragoneses caracterizados con 20 SSRs (Capítulo 3) y es también mayor que los valores
medios encontrados por otros autores (Testolin et al., 2000; Aranzana et al., 2002; y
Dirlewanger et al., 2002). El alto número de alelos observados en este trabajo puede ser
explicado por el elevado número de variedades y por la utilización de otros
microsatélites que son más polimórficos.
Del total de alelos amplificados, 92 están presentes en los 79 cultivares de
melocotonero de carne dura, 59 en los ocho cultivares de carne blanda, y 44 en los siete
de nectarina. Cuarenta y un alelos fueron específicos de los cultivares de melocotonero
150

Capítulo 7
de carne dura, mientras que las nectarinas y los melocotones de carne blanda mostraron
un sólo alelo específico para cada grupo. El elevado número de alelos (41) específicos
del grupo de melocotón de carne dura demuestra la alta diversidad genética encontrada
en este grupo, con respecto a las nectarinas y los melocotones de carne blanda. Las
distancias genéticas fueron mayores al comparar cultivares pertenecientes a diferentes
grupos que entre los cultivares de un mismo grupo. Las mayores distancias se
observaron al comparar cultivares de carne dura con cultivares de carne blanda, y
principalmente entre cultivares españoles y el resto. Asimismo, Aranzana et al. (2003)
observaron que el grupo de los melocotoneros de carne dura era el más diverso con 18
alelos específicos, en comparación con el grupo de las nectarinas y el de los
melocotones de carne blanda, que mostraron 16 y 8 alelos específicos, respectivamente.
Messeguer et al. (1987) y Aranzana et al. (2002) observaron también una mayor
diversidad genética en los cultivares de carne dura españoles.
En el presente trabajo, el valor medio de la heterocigosidad esperada (0,57) y el valor
medio del poder de discriminación (0,66), están de acuerdo con los valores encontrados
por Aranzana et al. (2003). Estos resultados soportan la validez de los marcadores
microsatélites para mostrar la variabilidad genética existente en melocotonero.
El valor medio del índice de fijación (F = 0.58) demuestra, según Hartl y Clark
(1997), una gran diferencia genética dentro de los cultivares de melocotonero
estudiados. Al mismo tiempo, este valor muestra un exceso de homozigosidad (Murray,
1996). Esto puede ser debido a dos factores principales: primero, la presencia de alelos
nulos que llevan a una falsa observación del exceso de homocigosidad; segundo, las
variedades estudiadas de origen español son selecciones a partir de poblaciones
reproducidas por semilla durante generaciones, lo que dada la naturaleza esencialmente
autógama del melocotonero, conduciría a un aumento de la homocigosidad, tal y como
se ha observado en nuestros resultados. El melocotonero es efectivamente una especie
autocompatible y se autopoliniza en condiciones naturales. La polinización cruzada en
esta especie podría ser menor del 5% de los casos (Fogle, 1977), lo que podría explicar
la desviación del equilibrio de Hardy-Weinberg.
Por otro lado, la gran diferencia genética detectada entre los cultivares estudiados de
melocotonero puede ser explicada por el bajo nivel de intercambio de genes (gene flow)
dentro de esta especie y en las diferentes áreas geográficas de cultivo de las variedades
estudiadas. Observaciones similares se han mencionado para albaricoquero por
Maghuly et al. (2005).
151
Discusión general
Los resultados obtenidos indican que dentro de los cultivares de carne dura existe
una fuente importante de variación, con caracteres de interés para los programas de
mejora en melocotonero, ya que los cultivares comerciales, sobre todo los de carne
blanda, presentan una base genética muy estrecha, debida al uso de un reducido número
de parentales en los cruzamientos (Scorza et al., 1985).
Los mejoradores genéticos son conscientes de la necesidad de utilizar nuevas fuentes
de germoplasma para poder alcanzar nuevos retos en el desarrollo de variedades de
melocotonero (Werner y Okie, 1998). Por ello, la caracterización del germoplasma local
en España constituye una etapa muy importante para la conservación y el eficiente
manejo de su riqueza genética. La utilización sobre todo de cultivares de carne dura
españoles, en los programas de mejora, podría aportar una mayor variabilidad a las
nuevas variedades en selección.
La identificación total de los 94 cultivares de melocotonero, nectarina y paraguayo se
pudo realizar con sólo 8 de los 15 SSRs utilizados. Es, por tanto, muy conveniente la
elección de los marcadores más polimórficos y que, a su vez, se encuentren
suficientemente distantes entre sí en los cromosomas del melocotonero (Aranzana et al.,
2003).
El uso de geles de poliacrilamida para la separación electroforética de los fragmentos
amplificados mediante la PCR resultó muy eficiente en este trabajo, dada la mayor
resolución de los mismos al comparar con los geles de agarosa. Wünsch et al. (2005)
examinaron 34 de los cultivares españoles de melocotonero incluidos en este trabajo con
10 SSRs, en geles de agarosa, no llegando a diferenciar algunos de ellos. Por el
contrario, en este trabajo, hemos encontrado perfiles genotípicos únicos para cada uno
de dichos cultivares. Estos resultados se explican por el uso, en nuestro caso, de
marcadores más polimórficos, y por la utilización de una técnica de electroforesis más
resolutiva.
152
Capítulo 7
7.2. ESTUDIO GENÉTICO DE PATRONES DE Prunus CON SSRs
El control y la utilización eficiente de los patrones Prunus en los programas de
mejora requieren una caracterización previa del material. El Capítulo 5 de esta tesis
describe la utilización de 20 marcadores microsatélites, desarrollados en melocotonero
(Aranzana et al., 2002; Dirlewanger et al., 2002; Testolin et al., 2000), para la
caracterización molecular de 44 patrones de Prunus, clasificados en tres grupos: los
híbridos de melocotonero (P. persica x P. davidiana) y los híbridos almendro x
melocotonero (P. dulcis x P. persica); los ciruelos de crecimiento rápido (patrones
Mirobolán y Mariana) y los ciruelos de crecimiento lento (patrones P. insititia y P.
domestica). Los marcadores SSRs se utilizaron, en este caso, por sus buenas
características de polimorfismo, y por ser marcadores transferibles entre especies
cercanas, como han demostrado distintos autores (Cipriani et al., 1999; Downey e
Iezzoni, 2000; Sosinski et al., 2000).
De los 20 cebadores utilizados, 13 generaron buenas amplificaciones en todos los
patrones Prunus estudiados, confirmando la transferibilidad de los SSRs entre especies
cercanas. Solo tres cebadores (BPPCT001, CPPCT022 y UDP98-407) de los 13
utilizados permitieron la identificación total de los 44 patrones. Los marcadores
seleccionados en este trabajo pueden ser utilizados en trabajos futuros de identificación
de patrones Prunus.
En el primer grupo de patrones (híbridos con base genética de melocotonero y
almendro), amplificaron 5 SSRs además de los 13 ya mencionados. Este hecho puede
ser explicado porque los 20 marcadores SSR fueron previamente desarrollados en
melocotonero, como se ha mencionado anteriormente.
Los dos grupos de ciruelos (ciruelos de crecimiento rápido y de crecimiento lento)
mostraron el número más alto de alelos en común, lo que se explica por la estrecha
relación genética entre los clones de cada grupo y por el hecho de que estos dos grupos
pertenecen al mismo subgénero Prunophora. Por otro lado, las especies P. domestica y
P. insititia (grupo de los ciruelos de crecimiento lento) podrían proceder del
cruzamiento entre la especie diploide Mirobolán (P. cerasifera con 2n=2x=16) y la
tetraploide P. spinosa (2n=4x=32) (Crane y Lawrence, 1952). Esta hipótesis puede
explicar la estrecha relación genética encontrada entre los dos grupos de ciruelos.
El polimorfismo detectado en cada grupo de los patrones de Prunus es más alto que
el polimorfismo observado en melocotonero (Testolin et al., 2000; Aranzana et al., 2002
153
Discusión general
y Dirlewanger et al., 2002). Estos resultados no son sorprendentes, ya que las especies
P. cerasifera, P. insititia y P. domestica son auto-incompatibles (Bernhard et al., 1951)
lo que aumenta la heterocigosidad en la especie y, por consiguiente, su variabilidad
genética. Además, los híbridos interespecíficos provienen de polinizaciones cruzadas, y
son evidentemente más diversos genéticamente que los cultivares de melocotonero, con
naturaleza auto-polinizadora.
7.3. ESTUDIO FILOGENÉTICO EN ESPECIES DE Prunus MEDIANTE LA
TÉCNICA PCR-RFLP
En el Capítulo 6, se ha estudiado el DNA cloroplástico de 62 híbridos ínter-
específicos y 22 especies de Prunus mediante la técnica de PCR-RFLP, con el fin de
detectar relaciones genéticas y filogenéticas entre especies y confirmar la identidad de
los parentales maternos de los híbridos ínter-específicos. La técnica de PCR-RFLP es
una de las técnicas más fáciles de manejar y permite la evaluación de grandes porciones
del genoma cloroplástico de numerosos individuos, en poco tiempo y a bajo coste. Este
método ha sido utilizado también en la interpretación de las relaciones filogenéticas en
Prunus (Badenes y Parfitt, 1995; Panda et al., 2003), y para determinar la filogeografía
y la diversidad en poblaciones de P. spinosa y P. avium (Mohanty et al., 2000; 2001;
2002). En el presente estudio, el análisis del genoma cloroplástico se ha realizado a
partir de amplificaciones con tres cebadores universales (DT, HK, K1K2), seguidas de
digestiones de los productos de amplificación con tres enzimas de restricción (AluI,
HinfI, y TaqI), lo que dió lugar a un polimorfismo del tamaño de los fragmentos de
restricción. Este tipo de polimorfismo es el resultado de una serie de mutaciones que
ocurren a nivel de los lugares de restricción. Las mutaciones son, en general, de tipo
inserción o deleción de unas pocas bases. La combinación de todas las mutaciones a
nivel de los sitios de restricción, dió lugar a un total de 33 haplotipos para las 84
accesiones estudiadas.
De los 33 haplotipos encontrados, 27 se mostraron específicos para una única
especie, lo que demuestra que la técnica puede ser muy interesante para la
caracterización molecular en especies Prunus. Por otra parte, se pudo confirmar la
identidad de los parentales maternos de una parte de los híbridos inter-específicos,
gracias a la conservación y la herencia materna del DNA cloroplástico. En el caso de la
154
Capítulo 7
especie P. salicina, su haplotipo se encontró en seis híbridos inter-específicos
complejos, teniendo P. salicina como progenitor materno.
Algunos híbridos inter-específicos mostraron haplotipos diferentes de los supuestos
maternos. Estas diferencias sugieren la presencia de variabilidad intra-específica en el
DNA cloroplástico. El ejemplo más relevante fue el caso de la especie P. cerasifera que
mostró 8 haplotipos diferentes, lo que sugiere una gran variabilidad genética dentro de
esta especie. Trabajos anteriores ya mencionaron la gran diversidad de P. cerasifera
(Zohary, 1992). Este tipo de variabilidad se mencionó también para otras especies
Prunus, como en el caso de P. spinosa y P. avium (Mohanty et al., 2000; 2001; 2002).
Varios parejas de especies Prunus compartieron el mismo haplotipo cloroplástico.
Teniendo en cuenta la herencia materna del DNA cloroplástico, este resultado informa
sobre la existencia de relaciones maternas entre especies Prunus con haplotipos
comunes. En este estudio, las especies P. pumila y P. besseyi mostraron un haplotipo en
común que podría explicarse por la estrecha relación filogenética que las une. En efecto,
Rehder (1940) define estas dos especies como miembros del subgénero Cerasus,
sección Microcerasus. Una estrecha relación fue también mencionada por Mowrey y
Werner (1990) entre dichas especies utilizando los marcadores isoenzimas. En este
trabajo se mostró igualmente la existencia de una estrecha relación materna entre P.
dasycarpa y P. cerasifera; P. fruticosa y P. cerasus; y P. tenella y P. nana.
El polimorfismo detectado a nivel del DNA cloroplástico permitió la reconstrucción
de las relaciones filogenéticas entre las especies Prunus estudiadas, mediante los
análisis del UPGMA y de parsimonia. Algunas de las relaciones filogenéticas
encontradas entre especies, responden bien a filogenias ya establecidas previamente por
los taxonomistas. Sin embargo, varias discrepancias también fueron detectadas. El
ejemplo más relevante fue el caso de los haplotipos que representan especies del
subgénero Cerasus sección Microcerasus, que se encuentran en el análisis del UPGMA
agrupados en el mismo cluster que los haplotipos correspondientes a especies del
subgénero Amygdalus y Prunus. Por el contrario, los demás haplotipos que representan
especies del subgénero Cerasus, secciones Eucerasus, Mahaleb y Pseudocerasus, están
situados en otro grupo distinto. De este modo, la clasificación taxonómica de la sección
Microcerasus, dentro del subgénero Cerasus, establecida por Rehder (1940), no
concuerda con el análisis genético. Este tipo de discrepancias han sido mencionadas
también por Bortiri et al. (2001) y Lee y Wen (2001), que apuntaron que la sección
Microcerasus no muestra ninguna relación con el resto del subgénero Cerasus. Por otra
155

Discusión general
parte, Katayama y Uematsu (2005) encontraron que los subgeneros Amygdalus, Prunus
y Cerasus, sección Microcerasus, forman un grupo compacto con el análisis del
UPGMA derivado de los marcadores RFLP y el DNA cloroplástico. Estos resultados
concuerdan con los obtenidos en este trabajo.
REFERENCIAS Aranzana, M.J., García-Mas, J., Carbó J. y Arús, P. 2002. Development and variability
analysis of microsatellite markers in peach. Plant Breeding 121: 87-92.
Aranzana, M.J., Carbó, J. y Arús, P. 2003. Microsatellite variability in peach [Prunus
persica (L.) Batsch]: cultivar identification, marker mutation, pedigree inferences
and population structure. Theor. Appl. Genet. 106: 1341-1352.
Badenes, M.L. y Parfitt, D.E. 1995. Phylogenetic relationships of cultivated Prunus
species from an analysis of chloroplast DNA variation. Theor. Appl. Genet. 90:
1035-1041.
Bernhard, R., Delmas, H.G. y Sanfourche, G. 1951. Recherches sur la pollinisation de
quelques variètès de pruniers. Ann. Amèlior. Plantes, 2: 179-209.
Bortiri, E., Oh, S.H., Jiang, J., Baggett, S., Granger, A., Weeks, C., Buckingham, M.,
Potter, D. y Parfitt, D. 2001. Phylogeny and systematics of Prunus (Rosaceae) as
determined by sequence analysis of ITS and the chloroplast trnL-trnF spacer DNA.
Syst. Bot. 26: 797–807.
Cipriani, G., Lot, G., Huang, W-G., Marrazo, M.T., Peterlunger, E. y Testolin, R. 1999.
AC/GT and AG/CT microsatellite repeats in peach [Prunus persica (L.) Batsch]:
isolation, characterization and cross-species amplification in Prunus. Theor. Appl.
Genet. 99: 65-72.
Crane, M.B., y Lawrence, W.J.C. 1952. The genetics of garden plants. 4th ed.
MacMillan, London, UK.
Dirlewanger, E., Cosson, P., Tavaud, M., Aranzana, M.J., Poizat, C., Zanetto, A, Arús,
P. y Laigret, F. 2002. Development of microsatellite markers in peach [Prunus
persica (L.) Batsch] and their use in genetic diversity analysis in peach and sweet
cherry (Prunus avium L.). Theor. Appl. Genet. 105: 127-138.
Downey, S.L. e Iezzoni, A.F. 2000. Polymorphic DNA markers in black cherry (Prunus
serotina) are identified using sequences from sweet cherry, peach and sour cherry. J.
Amer. Soc. Hort. Sci. 125: 76-80.
156

Capítulo 7
Fogle, H.W. 1977. Self-pollination and its implication in peach improvement. Fruit Var.
J. 31: 74-75.
Hartl, D.L. y Clark, A.G. 1997. Principles of population genetics, 2nd edn. Sinauer,
Sunderland.
Joobeur, T., Periam, N., De Vicente, M.C., King, G.J. y Arús, P. 2000. Development of
a second generation linkage map for almond using RAPD and SSR markers. Genome
43: 649-655.
Katayama, H. y Uematsu, C. 2005. Structural analysis of chloroplast DNA in Prunus
(Rosaceae): evolution, genetic diversity and unequal mutations. Theor. Appl. Genet.
111: 1430-1439.
Lee, S. y Wen, J. 2001. A phylogenetic analysis of Prunus and the Amygdaloideae
(Rosaceae) using ITS sequences of nuclear ribosomal DNA. Amer. J. Bot. 88:150-
160.
Maghuly, F., Fernández, E.B., Ruthner, S., Pedryc, A. y Laimer, M. 2005.
Microsatellite variability in apricots (Prunus armeniaca L.) reflects their geographic
origin and breeding history. Tree Genetics & Genomes 1: 151-165.
Messeguer, R., Arús, P. y Carrera, M. 1987. Identification of peach cultivars with
pollen isozymes. Scientia Horticulturae 31: 107-117.
Mohanty, A., Martín, J.P. y Aguinagalde, I. 2000. Chloroplast DNA diversity within
and among populations of the allotetraploid Prunus spinosa L. Theor. Appl. Genet.
100: 1304-1310.
Mohanty, A., Martín, J.P. y Aguinagalde, I. 2001. A population genetic analysis of
chloroplast DNA in wild populations of Prunus avium L. in Europe. Heredity 87:
421-427.
Mohanty, A., Martín, J.P. y Aguinagalde, I. 2002. Population genetic analysis of
European Prunus spinosa (Rosaceae) using chloroplast DNA markers. Amer. J. Bot.
89: 1223-1228.
Moreno, M.A. y Casas, A.M. 2002. Selección de variedades autóctonas de
melocotonero. Actas de Horticultura 34: 741-746.
Mowrey, B.D. y Werner, D.J. 1990. Phylogenetic relationships among species of
Prunus as inferred by isozyme markers. Theor. Appl. Genet. 80: 129-133.
Murray, B.W. 1996. The estimation of genetic distance and population substructure
from microsatellite allele frequency data. Course notes. Department of Biology, Mc
Master University, Hamilton, Ont. Available
157
Discusión general
Panda, S., Martín, J.P. y Aguinagalde, I. 2003. Chloroplast DNA study in sweet cherry
cultivars (Prunus avium L.) using PCR-RFLP method. Plant Breed. 122: 92-94.
Rajapakse, S., Belthoff, L.E., He, G., Estager, A.E., Scorza, R., Verde, I., Ballard,
R.E., Baird, W.V., Callahan, A., Monet, R. y Abbott, A.G. 1995. Genetic linkage
mapping in peach using morphology, RFLP and RAPD markers. Theor. Appl. Genet.
90: 503-510.
Rehder, A. 1940. A manual of cultivated trees and shrubs hardy in North American
exclusive of the subtropical and warmer temperate regions, 2nd edn. Macmillan,
New York, USA.
Scorza, R., Mehlenbacher, S.A. y Lightner, G.W. 1985. Inbreeding and coancestry of
freestone peach cultivars of the Eastern United States and implications for peach
germplasm improvement. J. Am. Soc. Hort. Sci. 110: 547-552.
Sosinski, B., Gannavarapu, M., Hager, L.D., Beck, L.E., King, G.J., Ryder, C.D.,
Rajapakse, S., Baird, W.V., Ballard, R.E. y Abbot, A.G. 2000. Characterization of
microsatellite in peach [Prunus persica (L.) Batsch]. Theor. Appl. Genet. 97: 1034-
1041.
Testolin, R., Marrazo, T., Cipriani, G., Quarta, R., Verde, I., Dettori, M.T., Pancaldi,
M. y Sansavini, S. 2000. Microsatellite DNA in peach (Prunus persica L. Batsch)
and its use in fingerprinting and testing the genetic origin of cultivars. Genome 43:
512-520.
Warburton, M.L. y Bliss, F.A. 1996. Genetic diversity in peach (Prunus persica
L.Batsch) revealed by randomly amplified polymorphic DNA (RAPD) markers and
compared to inbreeding coefficients. J. Am. Soc. Hort. Sci. 121: 1012-1019.
Werner, D.J. y Okie, W.R. 1998. A history and description of the Prunus persica plant
introduction collection. HortScience, 33: 787-793.
Wünsch, A., Carrera, M. y Hormaza, J.I. 2005. Molecular characterization of local
Spanish peach [Prunus persica (L.) Batsch] germplasm. Genetic Resources and Crop
Evolution. 53: 925-932.
Zohary, D. 1992. Is the European plum, Prunus domestica L., a P. cerasifera EHRH. X
P. spinosa L. allo-polyploid?. Euphytica 60: 75-77.
158

CAPÍTULO 8
Conclusiones

Capítulo 8
1. Se estudiaron 20 SSRs en un conjunto de 30 cultivares de melocotonero,
procedentes en su mayoría de la misma región en el Valle Medio del Ebro. Los
marcadores SSR identificaron 16 genotipos. La baja heterocigosidad observada
y esperada reflejan una estrecha base genética dentro del conjunto de los 30
cultivares estudiados. Esta baja variabilidad genética fue debida a que 14 de los
19 supuestos clones de la misma variedad ‘Miraflores’ resultaron idénticos para
todos los loci. Por otra parte, tres variedades (‘Tardío del Pilar’, ‘Amarillo de
Septiembre’ y ‘Tipo Campiel’) se encuentran a una distancia genética pequeña
de los ‘Miraflores’.
2. Se analizaron 15 SSRs en un conjunto de 94 cultivares de melocotonero, de ellos
64 eran representativos de variedades tradicionales del germoplasma local
español y 30 de variedades comerciales procedentes de programas de mejora. De
los 15 SSRs utilizados, 8 permitieron la identificación inequívoca de los 94
cultivares estudiados, mostrando un genotipo único para cada cultivar.
3. De los 94 cultivares de melocotonero estudiados, se observó una mayor
diversidad genética dentro del grupo del melocotón de carne dura, con respecto a
las nectarinas y a las variedades de melocotón de carne blanda, y principalmente
entre los cultivares de carne dura españoles y los extranjeros. Los cultivares de
melocotón españoles de carne amarilla dura, constituyen una fuente interesante
de diversidad genética para su utilización en programas de mejora.
4. La transferibilidad de los marcadores SSR entre especies cercanas permitió, en
este caso, el uso de los marcadores desarrollados en melocotonero para la
identificación y el análisis de la diversidad genética en patrones de especies
frutales de hueso (Prunus sp.). Se analizaron 20 SSRs y mostraron una gran
variabilidad en los 44 patrones de Prunus, clasificados previamente en tres
grupos: híbridos de melocotonero x melocotonero y almendro x melocotonero,
ciruelos de crecimiento rápido y ciruelos de crecimiento lento. Se observó una
mayor diversidad genética entre grupos que dentro de cada grupo de patrones,
debido a la variabilidad de los mismos, ya que pertenecen a diferentes clases
botánicas, y a varias especies de Prunus. Tres de los SSRs (BPPCT001,
161
Conclusiones
CPPCT022 y UDP98-407) analizados permitieron la identificación de todos los
patrones estudiados.
5. El análisis del genoma cloroplástico mediante la técnica de PCR-RFLP, dió
lugar a un polimorfismo en el tamaño de los fragmentos de restricción. Se
obtuvieron un total de 33 haplotipos en las 84 accesiones de Prunus estudiadas
en todas las combinaciones cebador-enzima de restricción. Además, la técnica
permitió la detección de relaciones genéticas y filogenéticas entre especies. Por
otra parte, la herencia materna del DNA cloroplástico permitió confirmar la
identidad de algunos parentales maternos en los híbridos ínter-específicos
estudiados.
6. En este trabajo se detectó una estrecha relación materna entre Prunus. dasycarpa
y P. cerasifera; P. fruticosa y P. cerasus; y P. tenella y P. nana. Por otra parte,
la clasificación taxonómica de la sección Microcerasus, dentro del subgénero
Cerasus, establecida por Rehder (1940), no resulta congruente con el análisis
genético de este estudio.
7. El estudio genético del DNA cloroplástico en especies Prunus, mediante la
técnica de PCR-RFLP, ayudará a establecer la correcta filogenia dentro del
género, hasta ahora basada en las características morfológicas de cada especie.
Se sugiere el establecimiento de una nueva filogenia para el género Prunus,
basándose tanto en los estudios morfológicos como en los moleculares obtenidos
recientemente.
162

ANEXOS

www.elsevier.com/locate/scihorti
Scientia Horticulturae 111 (2007) 140–145
Molecular characterization of Miraflores peach variety and
relatives using SSRs
M. Bouhadida a,*, A.M. Casas b, M.A. Moreno a, Y. Gogorcena a
a Department of Pomology, Aula Dei Experimental Station, CSIC, P.O. Box 202, E-50080 Zaragoza, Spainb Department of Genetics and Plant Production, Aula Dei Experimental Station, CSIC, P.O. Box 202, E-50080 Zaragoza, Spain
Received 8 September 2005; received in revised form 23 May 2006; accepted 23 October 2006
Abstract
Some traditional peach varieties, originated from the region of Aragon (Spain), were analysed by SSRs (simple sequence repeats). The aim of
this research was to characterize 19 clones related to Miraflores variety, with unknown pedigrees, to assess their genetic diversity and to elucidate
their possible relationships with 10 traditional peach varieties. Twenty SSR primer pairs with high levels of polymorphism, which have been
previously developed for peach, were used in this study. A total of 46 alleles were obtained for all the microsatellites studied, ranging from one to
six alleles per locus, with a mean value of 2.3 alleles per locus. Fourteen SSRs were polymorphic in the set of varieties studied and permitted to
distinguish 16 different genotypes out of the 30 initially studied, although fourteen ‘Miraflores’ clones showed identical gel profiles. The genetic
distance matrix was used to construct neighbor joining cluster and to perform principal coordinate analysis which allowed the arrangement of all
the genotypes according to their genetic relationships. The genetic relationships among these traditional peach varieties, and in particular among
‘Miraflores’ clones are discussed. The obtained results confirm that microsatellite markers are very useful for these purpose.
# 2006 Elsevier B.V. All rights reserved.
Keywords: Clones; Genetic diversity; Genetic relationships; Microsatellites; ‘Miraflores’ peach variety; Traditional peach varieties
1. Introduction
Peach (Prunus persica (L.) Batsch) is a member of the
Rosaceae, and it is a diploid specie with a basic chromosome
number of x = 8 and 2n = 16. The Prunus persica is thought to
be originated in China and spread to the rest of the world by
means of seeds (Layne, 1987). It is a specie well adapted to
temperate and subtropical regions, between latitudes of 308and 458 North and South (Westwood, 1978). The EU
(European Union) is one of the main cultivation regions
with approximately 4.5 million metric tonnes annual
production of peaches and nectarines (28% of the world
production). The four countries: Italy, Spain, Greece, and
France, ensure 92.7% of this production (Faostat, 2005), Italy
being the greatest peach producer of them (1,750,000 metric
tonnes) followed by Spain (1,130,800 metric tonnes). Peach is
one of the most economically and socially important
deciduous fruit tree species. Therefore, precise cultivar
* Corresponding author. Tel.: +34 976 71 61 33; fax: +34 976 71 61 45.
E-mail addresses: [email protected] (M. Bouhadida),
[email protected] (Y. Gogorcena).
0304-4238/$ – see front matter # 2006 Elsevier B.V. All rights reserved.
doi:10.1016/j.scienta.2006.10.018
identification and characterisation is essential for improving
and securing peach culture in the world.
The official methods used to characterize and identify
varieties in fruit tree species are based on morphological
characterization and phenological observations according to
UPOV (Unite pour la Protection des Obtentions Vegetales) and
IPGRI (International Plant Genetic Resources Institute)
descriptors. This approach requires time, and the morpholo-
gical characters can be subject to environmental influences.
New molecular methods have been incorporated to characterize
the varieties at the DNA level (see for a review: Martınez-
Gomez et al., 2003). Molecular markers such as restriction
fragment length polymorphism (RFLP), random amplified
polymorphic DNA (RAPD) and amplified fragment length
polymorphism (AFLP) have been used for genetic analysis and
the construction of genetic linkage maps (Gogorcena et al.,
1993; Warburton and Bliss, 1996; Ortiz et al., 1997; Bartolozzi
et al., 1998; De Vicente et al., 1998; Casas et al., 1999). On the
downside, these DNA markers either present low reproduci-
bility (RAPDs), or are time consuming and expensive (RFLPs,
AFLPs). In the last years, microsatellite markers (SSR) are
becoming the appropriate marker for molecular characteriza-
tion and genetic diversity studies (Fang and Roose, 1997;

M. Bouhadida et al. / Scientia Horticulturae 111 (2007) 140–145 141
Alvarez et al., 2001; Huang et al., 2002; Rallo et al., 2003;
Moussaoui, 2005). Consisting of tandem repeats of mono-, bi-,
tri- or tetra-nucleotides in the eukaryotic genome, these
molecular markers present a very high polymorphism based on
the number of the nucleotide motif repeats (Morgante and
Olivieri, 1993). Besides polymorphism, they have a codomi-
nant inheritance, they are reproducible and easily detected by
PCR. Microsatellite marker primer pairs have been developed
in peach (Sosinski et al., 2000; Testolin et al., 2000; Aranzana
et al., 2002; Dirlewanger et al., 2002), and then used in genetic
diversity analyses for sweet cherry (Dirlewanger et al., 2002),
peach (Aranzana et al., 2003), and apricot (Romero et al., 2003;
Zhebentyayeva et al., 2003).
‘Miraflores’ is a Spanish native peach variety, with attractive
characteristics, especially high yields and good quality of fruits
(Moreno, 2005). This nonmelting and clingstone variety is
widely used for the fresh market as well as for processing. This
variety appeared in 1970s at the Jalon valley (Aragon), one of the
most important deciduous fruit tree growing areas in Spain.
‘Miraflores’ has unknown parents, although it is believed that it
could originate from ‘Campiel’ seedlings, a traditional variety
locally cultivated in this area (De Asso, 1798). The correct
molecular characterization of this variety should prevent all
confusion with other varieties with similar morphological
characteristics, and enhance its use in peach breeding programs.
On the other hand, this will be useful to warrant this variety as a
specific typical product with a designation of origin.
Therefore, the aim of this study was to characterize 19
clones of ‘Miraflores’ peach variety with unknown pedigree,
using 20 SSR primer pairs. Ten old Spanish peach varieties
originated from the same region were also included in this
investigation, to check genetic similarities and possible genetic
relationships with ‘Miraflores’.
2. Materials and methods
2.1. Plant material
Thirty peach accessions, being either clones of ‘Miraflores’
or closely related varieties with other traditional peach varieties
were collected throughout Aragon, and were analysed in this
study. Nineteen accessions (clones and/or closely related
varieties) were provided from a recent survey of ‘Miraflores’
variety (‘Miraflores’ 1–19). The other eleven accessions are old
Spanish peach varieties originated from the same region of
Aragon (Spain); two clones of ‘Tipo Campiel’ variety (‘Tipo
Campiel 1’ and ‘Tipo Campiel 2’) and nine traditional cultivars
(‘Amarillo de Calanda’, ‘Zaragozano Amarillo’, ‘Amarillo de
Gallur’, ‘Tardıo del Pilar’, ‘Oropel’, ‘Zaragozano Rojo’,
‘Maluenda’, ‘Bonet IV’, ‘Amarillo de Septiembre’). From all
accessions, young leaves were collected for DNA extraction.
2.2. Genomic DNA extraction
Fresh young leaves were ground to powder with liquid N2
using a mortar and pestle. Genomic DNAwas isolated from leaf
samples using a CTAB (cethyltrimethyl ammonium bromide)
extraction method (Cheng et al., 1997). The extraction buffer
contained 2% CTAB, 1.5 M NaCl, 20 mM EDTA, 100 mM Tris
pH 8.0, and 0.4% 2-mercaptoethanol. Samples were incubated
at 65 8C for approximately 30–60 min, mixed with an equal
volume of chloroform–isoamyl alcohol (24:1), and centrifuged
at 13,000 rpm for 10 min at room temperature. The supernatant
was transferred to a clean microcentrifuge tube and treated with
RNAse A (10 mg/ml, 60 min, 37 8C), then mixed with an equal
volume of cold isopropanol. The DNA was pelleted by
centrifugation at 13,000 rpm for 3–5 min. The supernatant was
removed and the DNA pellet washed with 500 ml of 70%
ethanol and 50 ml of wash buffer (3 M sodium acetate, 0.1 M
magnesium acetate pH 8.0), to remove residual CTAB, salt, and
other contaminants. The pellet was dried for 1 h and then
dissolved in 100 ml of TE buffer (10 mM Tris–HCl, 100 mM
EDTA, pH 8.0). DNA quality was examined by electrophoresis
in 0.8% agarose and DNA concentration was quantified
spectrophotometrically (Gene Quant, Amersham Pharmacia
Biotech). The extracted DNA was diluted to 5 ng/ml with TE
buffer and stored at �20 8C for PCR amplifications.
2.3. DNA amplification
Twenty SSR markers were studied (Table 1) using primer
pairs previously developed for peach. Amplification reactions
were carried out in a final volume of 15 ml containing 10 ng of
template DNA, 1� reaction buffer (20 mM (NH4)2SO4, 75 mM
Tris–HCl pH 8.8), 2 mM MgCl2, 0.2 mM of dNTPs (50 mM of
each) (Amersham Pharmacia Biotech), 0.15 mM of forward and
reverse primers each, and 0.5 U of Tth DNA Polymerase
(Biotools Band M Labs, S.A., Spain), overlaid with a drop of
mineral oil (Sigma, St. Louis, MO). The PCR amplifications
were carried out on a Gene Amp 2700 thermocycler (Applied
Biosystems) using the following temperature cycles: 1 cycle of
3 min at 95 8C; 35 cycles of 1 min at 94 8C, 45 s at the
corresponding annealing temperature (Table 1) and 1 min at
72 8C. The last cycle was followed by a final incubation for
7 min at 72 8C and the PCR products were stored at 4 8C before
analysis. Two independent SSR reactions were performed for
each DNA sample. The DNA amplification products were
loaded on 5% polyacrilamide sequencing gels. Gels were run
for 2 h at 65 W. The gels were silver-stained according to the
protocol described by Bassam et al. (1983). Fragment sizes
were estimated with the 30–330 bp AFLP ladder (Invitrogen,
Carlsbad, CA) DNA sizing markers, and analysed by the
Quantity One program (Bio Rad, Hercules, CA).
2.4. Data analysis
The number of alleles per locus was counted from the gel
profile analysis. The observed heterozygosity (Ho) was
calculated for each locus as the number of heterozygous
individuals over the total number of individuals analysed. The
expected heterozygosity was calculated as He ¼ 1�P
p2i ,
where pi is the frequency of ith allele (Nei, 1973). The power of
discrimination was calculated as PD ¼ 1�P
g2i , where gi is
the frequency of ith genotype (Kloosterman et al., 1993). Those

Table 1
List of the 20 SSR primers used in this study, size range, annealing temperature, number of alleles and variability parameters
Locus code References Size range (bp) Ta (8C) N Ho He #Genotypes PD
CPPCT002 Aranzana et al. (2002) 102 58 1 0 0 1 0
CPPCT004 Aranzana et al. (2002) 262–277 56 2 0.03 0.10 2 0.13
CPPCT005 Aranzana et al. (2002) 154 58 1 0 0 1 0
CPPCT006 Aranzana et al. (2002) 182–192 60 2 0.70 0.52 3 0.46
CPPCT017 Aranzana et al. (2002) 183 60 1 0 0 1 0
CPPCT022 Aranzana et al. (2002) 248–292 58 3 0 0.13 3 0.13
CPPCT028 Aranzana et al. (2002) 134–138 58 3 0 0.35 3 0.35
CPPCT029 Aranzana et al. (2002) 192–196 58 2 0 0.43 2 0.43
CPPCT030 Aranzana et al. (2002) 186 56 1 0 0 1 0
CPPCT033 Aranzana et al. (2002) 151–153 58 2 0.10 0.09 2 0.18
UDP98022 Testolin et al. (2000) 124–138 64 3 0 0.52 3 0.52
UDP98025 Testolin et al. (2000) 134–142 65 2 0.13 0.44 3 0.54
UDP98407 Testolin et al. (2000) 174–198 60 2 0.57 0.40 3 0.59
UDP98408 Testolin et al. (2000) 102 56 1 0 0 1 0
BPPCT001 Dirlewanger et al. (2002) 152–166 60 6 0.03 0.62 7 0.63
BPPCT007 Dirlewanger et al., 2002 146 58 1 0 0 1 0
BPPCT008 Dirlewanger et al. (2002) 100–156 59 4 0.67 0.67 8 0.67
BPPCT015 Dirlewanger et al. (2002) 168–222 62 5 0.03 0.50 6 0.52
BPPCT017 Dirlewanger et al. (2002) 162–174 60 2 0.57 0.54 2 0.57
BPPCT038 Dirlewanger et al. (2002) 127–129 62 2 0.67 0.45 2 0.45
Mean 2.3 0.18 0.29 2.75 0.31
Note: N, number of alleles; Ta, annealing temperature; Ho, observed heterozygosity; He, expected heterozygosity; #Genotypes; different genotypes per locus; PD,
power of discrimination.
M. Bouhadida et al. / Scientia Horticulturae 111 (2007) 140–145142
parameters served to evaluate the information given by the
microsatellite markers (Table 1).
Data were analyzed using the NTSYS-pc, version 2.1
program (Rohlf, 2000). A 0/0.5/1 (absence/allele in hetero-
zygosity/allele in homozygosity) matrix was constructed. The
genetic distances between pairs of varieties were estimated
from the matrix with the SIMGEND module using the Nei
coefficient (Nei, 1972). Cluster analyses were carried out using
neighbor joining (NJ) algorithm (Saitou and Nei, 1987). The
resulting cluster was represented as a dendrogram. A principal
coordinate analysis based on the similarity matrix was also
performed.
3. Results
3.1. Microsatellites diversity
Spanish peach varieties were analysed with 20 SSRs. All the
SSRs studiedwere single-locus andproducedalleles that couldbe
scored, with a total of 46 ranging from one to six per locus, with a
mean value of 2.3 alleles per locus. Fourteen out of the 20 SSRs
employed, were polymorphic and it was possible to distinguish
unambiguously 16 peach genotypes from the 30 accessions
studied. However, six SSR loci (CPPCT002, CPPCT005,
CPPCT017, CPPCT30, UDP98408 and BPPCT007) were
monomorphic for the peach plant material evaluated (Table 1).
Observed heterozygosity (Ho) ranged from 0 to 0.70, with a
mean value of 0.18. The expected heterozygosity (He) ranged
from 0, for the monomorphic SSRs, to 0.67 in CPPCT006, with
a mean value of 0.29. The power of discrimination (PD) varied
from 0, for the monomorphic loci, to 0.67 in BPPCT008, with
an average value of 0.31. Differences were found in the number
of genotypes identified per locus. This number varied between
one unique genotype in the monomorphic loci, to eight
genotypes using BPPCT008 with a mean value of 2.75
(Table 1).
The five most polymorphic microsatellites with the highest
He and PD were BPPCT001, BPPCT015, BPPCT008,
UDP98022, and CPPCT028 (Table 1). They allowed the
unambiguous discrimination of the same 16 accessions
separated using the 20 SSRs. These five SSR primer pairs
detected a total of 21 alleles, ranging from 3 to 6 alleles per
locus and with a mean value of 4.2 alleles per locus. The
expected heterozygosity mean value for these microsatellites
was He = 0.53, and the power of discrimination mean value was
PD = 0.54.
3.2. Cluster and principal coordinate analysis
The genetic distance (D) among the different genotypes
studied using the 20 SSRs was reproduced in the neighbor
joining (NJ) dendrogram (Fig. 1), according to the original data
obtained in the similarity matrix, and based on the additive
genetic distances among the genotypes (Saitou and Nei, 1987).
The dendrogram generated from the NJ cluster analysis
showed two main groups. The first group was composed of the
two ‘Tipo Campiel’ clones, ‘Tardıo del Pilar’, ‘Amarillo de
Septiembre’ and all the ‘Miraflores’ clones but ‘Miraflores 3’,
which was clustered out of the two main groups. The second
group included the rest of the studied varieties. In the first
group, fourteen ‘Miraflores’ clones (‘Miraflores’ 5 to 11 and
‘Miraflores’ 13 to 19) were clustered together with a null
genetic distance among them. The ‘Miraflores 1’ and
‘Miraflores 2’ were closely related to the 14 indistinguishable
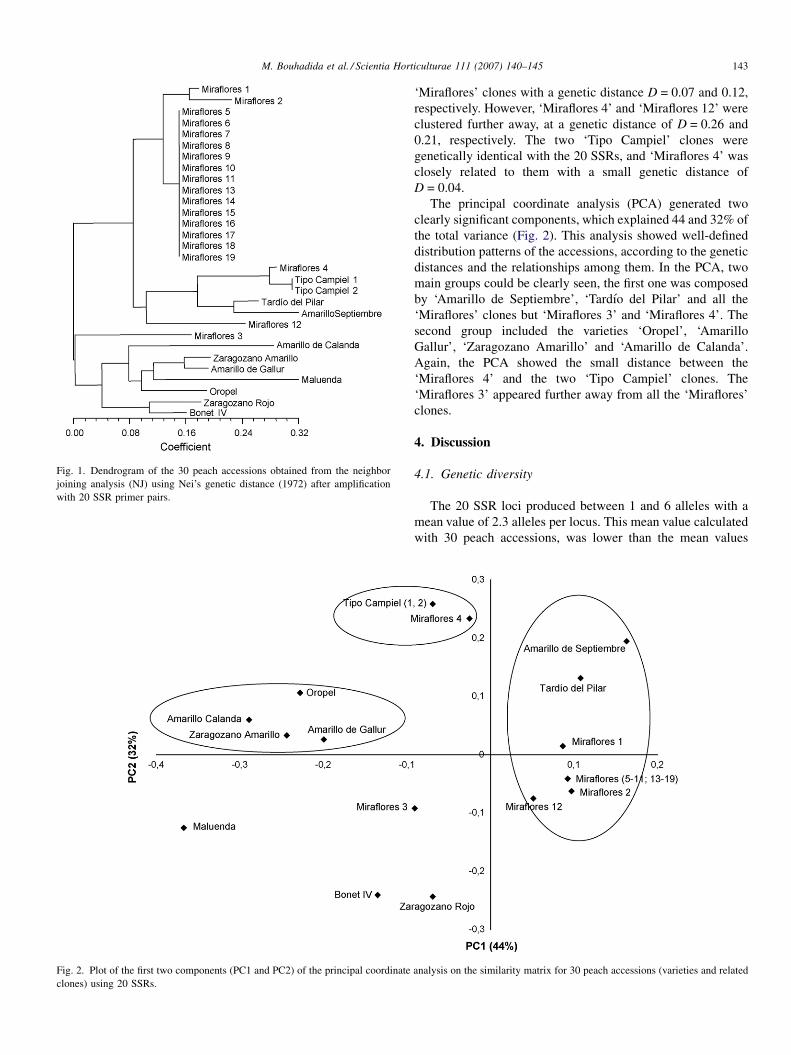
Fig. 1. Dendrogram of the 30 peach accessions obtained from the neighbor
joining analysis (NJ) using Nei’s genetic distance (1972) after amplification
with 20 SSR primer pairs.
Fig. 2. Plot of the first two components (PC1 and PC2) of the principal coordinate
clones) using 20 SSRs.
M. Bouhadida et al. / Scientia Horticulturae 111 (2007) 140–145 143
‘Miraflores’ clones with a genetic distance D = 0.07 and 0.12,
respectively. However, ‘Miraflores 4’ and ‘Miraflores 12’ were
clustered further away, at a genetic distance of D = 0.26 and
0.21, respectively. The two ‘Tipo Campiel’ clones were
genetically identical with the 20 SSRs, and ‘Miraflores 4’ was
closely related to them with a small genetic distance of
D = 0.04.
The principal coordinate analysis (PCA) generated two
clearly significant components, which explained 44 and 32% of
the total variance (Fig. 2). This analysis showed well-defined
distribution patterns of the accessions, according to the genetic
distances and the relationships among them. In the PCA, two
main groups could be clearly seen, the first one was composed
by ‘Amarillo de Septiembre’, ‘Tardıo del Pilar’ and all the
‘Miraflores’ clones but ‘Miraflores 3’ and ‘Miraflores 4’. The
second group included the varieties ‘Oropel’, ‘Amarillo
Gallur’, ‘Zaragozano Amarillo’ and ‘Amarillo de Calanda’.
Again, the PCA showed the small distance between the
‘Miraflores 4’ and the two ‘Tipo Campiel’ clones. The
‘Miraflores 3’ appeared further away from all the ‘Miraflores’
clones.
4. Discussion
4.1. Genetic diversity
The 20 SSR loci produced between 1 and 6 alleles with a
mean value of 2.3 alleles per locus. This mean value calculated
with 30 peach accessions, was lower than the mean values
analysis on the similarity matrix for 30 peach accessions (varieties and related

M. Bouhadida et al. / Scientia Horticulturae 111 (2007) 140–145144
obtained by other authors in this species. Testolin et al. (2000)
mentioned a value of 4.5 for a set of 50 varieties analysed with
26 microsatellites. Aranzana et al. (2002) cited 3.2 for a set of
25 varieties with 24 SSRs, and Dirlewanger et al. (2002)
observed 4.2 for a set of 27 varieties with 41 SSR primer pairs.
Mean values for the expected heterozygosity (He) and for the
power of discrimination (PD) were also lower than the values
recorded by these authors. In the present study, the He and PD
were 0.29 and 0.31, respectively. Testolin et al. (2000)
mentioned He = 0.47 and PD = 0.60; Aranzana et al. (2002)
found value of 0.41 for He, and 0.60 for PD, and Dirlewanger
et al. (2002) reported values of 0.41 for He, and 0.54 for PD.
These results indicate a low variability in our plant material that
can be explained by the close genetic relationship among the
peach accessions studied and in particular, among the
‘Miraflores’ clones. However, using only the five most
polymorphic primer pairs (BPPCT001, BPPCT008,
BPPCT015, UDP98022, and CPPCT028), the mean value of
alleles per locus increased to 4.2. An increase in the mean
values of the expected heterozygosity (He = 0.52) and the
power of discrimination (PD = 0.53) has also been shown.
These new values are closer to the ones mentioned by Testolin
et al. (2000), Aranzana et al. (2002) and Dirlewanger et al.
(2002). The high levels of polymorphism in the selected five
SSRs, permitted to distinguish unambiguously 16 genotypes
within the thirty studied accessions, the same genotypes that
were discriminated using all the twenty SSR primers pairs.
Thus, those five polymorphic SSRs are interesting markers for
studies aimed at distinguishing highly related peach varieties.
The fourteen clones of ‘Miraflores’ showed identical patterns
for all the SSRs used in this study. These clones either belong to
the same clone or represent different clones that differ by a
single or few gene mutations, which could not be detected by
SSR analysis (Testolin et al., 2000).
4.2. Cultivar relationships from cluster and principal
coordinate analysis
The fourteen ‘Miraflores’ clones showed identical SSR
profiles and were clustered together in the NJ tree. These clones
have also similar pomological characteristics (M.A. Moreno,
unpublished observation). The genetic similarity among some
‘Miraflores’ clones was also shown in a preliminary study
reported by Moreno and Casas (2002) using 10 SSRs and 7
RAPDs. In terms of genetic distance, the ‘Miraflores 1’ and
‘Miraflores 2’ were closely related with the group of the
fourteen identical ‘Miraflores’ clones with a genetic distance of
0.07 and 0.12, respectively. These two clones differed from the
‘Miraflores’ main group in only two SSR loci. The ‘Miraflores
1’ had a new allele with +2 bp in the locus UDP98022 (138 bp)
and the lack of the allele 174 bp in the locus BPPCT017. The
‘Miraflores 2’ had a new allele with +2 bp in the locus
UDP98022 (138 bp) and a new allele with +2 bp in the locus
CPPCT028 (136 bp). These two clones presented also similar
Rosaceae flower shape, the same flowering and ripening date,
and similar yield and fruit characteristics with the group of
identical ‘Miraflores’ clones. The small molecular discrepancies
of these two clones from the main group of ‘Miraflores’ may have
been caused by SSR mutations as it was also suggested by
Aranzana et al. (2003).
The ‘Miraflores 12’ is closer to the ‘Miraflores’ group
(‘Miraflores’ 5–11 and 13–19) than to the old Spanish varieties
at a genetic distance of D = 0.21. Moreover, this clone shared at
least one allele in 17 SSR loci (34 alleles out of the 40 studied)
with the group of identical ‘Miraflores’ clones. These results
point out the existence of a close parental relationships between
these clones and we can suggest that ‘Miraflores 12’ could be
one of the ‘Miraflores’ progenitors. ‘Miraflores 4’ was clustered
to the identical ‘Miraflores’ group at a genetic distance of
D = 0.26. This clone is closely related to the two identical ‘Tipo
Campiel’ clones at a genetic distance of D = 0.04. ‘Miraflores
4’ had at least one common allele in all SSR loci with the ‘Tipo
Campiel’ clones and shared 37 alleles of the total alleles
studied. According to the morphological data (data not shown),
‘Miraflores 4’ presents similar fruit characteristics to ‘Tipo
Campiel’ cultivar (high percentage of redness in the skin), and
similar flower morphology (bell flower shape). Moreover, the
pulp close to the stone of the fruit is red as in the ‘Tipo Campiel’
fruits. Our findings confirm the hypothesis reported previously
by Moreno and Casas (2002) that ‘Miraflores 4’ could be a
seedling of ‘Tipo Campiel’ cultivar.
Finally, ‘Miraflores 3’ was clustered out of the two main
groups shown in the NJ tree, at a genetic distance of D = 0.4.
Furthermore, ‘Miraflores 3’ showed chemical and physical
characteristics different from the rest of ‘Miraflores’ clones
(fruit shape, yellow-red skin appearance, early ripening, sugar
and acids content, etc.). This clone probably belongs to another
variety which has morphological and phenological character-
istics similar to those of ‘Miraflores’ variety. Previous work
pointed out that this clone could be the ‘Godina 58GC76’
variety, based on similarities in fruit characteristics (fruit color,
fruit shape, sugar and acid level etc.) (M.A. Moreno,
unpublished observation).
The ‘Miraflores’ clones studied in this work have unknown
parents and pedigrees. Old spanish varieties were included in
the study to check an eventual relationship with ‘Miraflores’
clones. As it is shown in the dendrogram (Fig. 1), and the PCA
(Fig. 2), the varieties ‘Tardıo del Pilar’, ‘Amarillo de
Septiembre’, ‘Tipo Campiel’ and all of the ‘Miraflores’ clones,
but ‘Miraflores 3’, belong to the same group. The varieties
‘Tardıo del Pilar’, ‘Amarillo de Septiembre’, and ‘Tipo
Campiel’ were related to the ‘Miraflores’ clones at the genetic
distances of 0.24, 0.30 and 0.31, respectively. In fact, these
varieties, showed similar physical fruit characteristics (proper-
ties of the pulp and skin appearance) to those found in
‘Miraflores’ clones. Thus, we hypothesise that they could be
close relatives of ‘Miraflores’ cultivar. However, the rest of the
old Spanish varieties (‘Amarillo de Calanda’, ‘Zaragozano
Amarillo’, ‘Amarillo Gallur’, ‘Oropel’, ‘Zaragozano Rojo’,
‘Maluenda’ and ‘Bonet IV’), were clustered in another main
group far away from the ‘Miraflores’ clones.
In this work, the absence of SSR differences among fourteen
clones of ‘Miraflores’ could be explained by the usual clonal
propagation of ‘Miraflores’ carried out by nurseries and fruit
M. Bouhadida et al. / Scientia Horticulturae 111 (2007) 140–145 145
growers. Another possibility could be that these clones may
represent the original genotype of ‘Miraflores’ with few genetic
variations such as sport mutations. However by using SSRs, it is
highly improbable to distinguish mutants that differ from the
original genotype in one or few genes (Botta et al., 1995;
Moreno et al., 1998; Aranzana et al., 2003).
In conclusion, we regard the clones (1, 2, 5–11 and 13–19) of
‘Miraflores’ as true clones of the ‘Miraflores’ variety, and they
will be included in future programs of selection. While
‘Miraflores 12’ was considered as one of the ‘Miraflores’
progenitors and ‘Miraflores 4’ could be considered as a new
cultivar, closely related to ‘Tipo Campiel’. ‘Miraflores 3’ is
considered unrelated to the main group of ‘Miraflores’. These
studies make possible the adequate choice of clones and
varieties in new crosses for selection purposes.
Acknowledgments
We are thankful to T.N. Zhebentyayeva and G.L. Reighard
for helpful comments on the manuscript. This research was
funded by CICYT (Comision Interministerial de Ciencia y
Tecnologıa, AGL2002-04219 and AGL 2005-05533), INIA
(Instituto Nacional de Investigacion y Tecnologıa Agraria y
Alimentacion, RF03-014-C2), Bilateral Spain-France (HF03-
273) and DGA (A28, A44) projects and co-funded by the
European Regional Development Fund. M. Bouhadida was
supported by a fellowship from the AECI (Agencia Espanola de
Cooperacion Internacional) of the Spanish Ministry of Foreign
Affairs.
References
Alvarez, A.E., Van de Wiel, C.C.M., Smulders, M.J.M., Vosman, B., 2001. Use
of microsatellites to evaluate genetic diversity and species relationships in
the genus Lycopersicon. Theor. Appl. Genet. 103, 1283–1292.
Aranzana, M.J., Garcıa-Mas, J., Carbo, J., Arus, P., 2002. Development and
variability analysis of microsatellite markers in peach. Plant Breed. 121,
87–92.
Aranzana, M.J., Carbo, J., Arus, P., 2003. Microsatellite variability in peach
[Prunus persica (L.) Batsch]: cultivar identification, marker mutation,
pedigree inferences and population structure. Theor. Appl. Genet. 106,
1341–1352.
Bartolozzi, F., Warburton, M.L., Arulsekar, S., Gradziel, T.M., 1998. Genetic
characterization and relatedness among California almond cultivars and
breeding lines detected by randomly amplified polymorphic DNA (RAPD)
analysis. J. Am. Soc. Hort. Sci. 123, 381–387.
Bassam, B.J., Caetano-Anoelles, G., Gresshoff, P.M., 1983. Fast and sensitive
silver staining of DNA in polyacrylamide gels. Anal. Biochem. 196, 80–83.
Botta, R., Scott, N.S., Eynard, I., Thomas, M.R., 1995. Evaluation of micro-
satellite sequence-tagged site markers for characterizing Vitis vinifera
cultivars. Vitis 2, 99–102.
Casas, A.M., Igartua, E., Balaguer, G., Moreno, M.A., 1999. Genetic diversity
of Prunus rootstocks analysed by RAPD markers. Euphytica 110, 139–149.
Cheng, F.S., Brown, S.K., Weeden, N.F., 1997. A DNA extraction protocol from
various tissues in woody species. Hort. Sci. 32, 921–922.
De Asso, D.I., 1798. Historia de la economıa polıtica de Aragon. Francisco
Magallon, Zaragoza, 487 pp.
De Vicente, M.C., Truco, M.J., Egea, J., Burgos, L., Arus, P., 1998. RFLP
variability in apricot (Prunus armeniaca L.). Plant Breed. 117, 153–158.
Dirlewanger, E., Cosson, P., Tavaud, M., Aranzana, M.J., Poizat, C., Zanetto,
A., Arus, P., Laigret, F., 2002. Development of microsatellite markers in
peach [Prunus persica (L.) Batsch] and their use in genetic diversity
analysis in peach and sweet cherry (Prunus avium L.). Theor. Appl. Genet.
105, 127–138.
Fang, D.Q., Roose, M.L., 1997. Identification of closely related citrus cultivars
with inter-simple sequence repeat markers. Theor. Appl. Genet. 95, 408–417.
Faostat, 2005. Agricultural data. http://faostat.fao.org/faostat/.
Gogorcena, Y., Arulsekar, S., Dandekar, A.M., Parfitt, D.E., 1993. Molecular
markers for grape characterization. Vitis 32, 183–185.
Huang, X., Borner, A., Roder, M., Ganal, M., 2002. Assessing genetic diversity
of wheat (Triticum aestivum L.) germplasm using microsatellite markers.
Theor. Appl. Genet. 105, 699–707.
Kloosterman, A.D., Budowle, B., Daselaar, P., 1993. PCR-amplification and
detection of the human DIS80 VNTR locus. Amplification conditions,
population genetics and application in forensic analysis. Int. J. Leg.
Med. 105, 257–264.
Layne, R.E.C., 1987. Peach rootstocks. In: Rom, R.C., Carlson, R.F. (Eds.),
Rootstocks for Fruit Crops. John Wiley and Sons, NY, pp. 185–216.
Martınez-Gomez, P., Sozzi, G.O., Sanchez-Perez, R., Rubio, M., Gradziel,
T.M., 2003. New approaches to Prunus tree crop breeding. Food Agric.
Environ. 1 (1), 52–63.
Moreno, M.A., 2005. Seleccion de patrones y variedades de melocotonero
adaptados a condiciones del area mediterranea. Vida Rural 206, 28–31.
Moreno, M.A., Casas, A.M., 2002. Seleccion de variedades autoctonas de
melocotonero. Actas Hortic. 34, 741–746.
Moreno, S., Martın, J.P., Ortiz, J.M., 1998. Inter-simple sequence repeats PCR
for characterization of closely related grapevine germplasm. Euphytica 101,
117–125.
Morgante, M., Olivieri, A.M., 1993. PCR-amplified microsatellites as markers
in plant genetics. Plant J. 3, 175–182.
Moussaoui, S., 2005. Molecular Characterization of Grapevine Cultivars from
Aragon Gene Bank Using Sequence-Tagged Microsatellite Site Markers.
Master of Science Thesis. IAMZ, Spain.
Nei, M., 1972. Genetic distance between populations. Am. Nat. 106, 283–292.
Nei, M., 1973. Analysis of gene diversity in subdivided populations. Proc. Natl.
Acad. Soc. U.S.A. 70, 3321–3323.
Ortiz, A., Renaud, R., Calzada, I., Ritter, E., 1997. Analysis of plum cultivars
with RAPD markers. J. Hortic. Sci. 72 (1), 1–9.
Rallo, P., Tenzer, I., Gessler, C., Baldon, L., Dorado, G., Martın, A., 2003.
Transferability of olive microsatellite loci across the genus Olea. Theor.
Appl. Genet. 107, 940–946.
Rohlf, F.J., 2000. NTSYS-pc Numerical Taxonomy and Multivariate Analysis
System. Version 2.1. Exeter Software, Setauket, NY.
Romero, C., Pedryc, A., Munoz, V., Llacer, G., Badenes, M.L., 2003. Genetic
diversity of different apricot geographical groups determined by SSR
markers. Genome 46, 244–252.
Saitou, N., Nei, M., 1987. The neighbor-joining method: a new method for
reconstructing phylogenetic trees. Mol. Biol. Evol. 4, 477–491.
Sosinski, B., Gannavarapu, M., Hager, L.D., Beck, L.E., King, G.J., Ryder,
C.D., Rajapakse, S., Baird, W.V., Ballard, R.E., Abbot, A.G., 2000. Char-
acterization of microsatellite in peach [Prunus persica (L.) Batsch] Theor.
Appl. Genet. 97, 1034–1041.
Testolin, R., Marrazo, T., Cipriani, G., Quarta, R., Verde, I., Dettori, M.T.,
Pancaldi, M., Sansavini, S., 2000. Microsatellite DNA in peach (Prunus
persica L. Batsch) and its use in fingerprinting and testing the genetic origin
of cultivars. Genome 43, 512–520.
Warburton, M.L., Bliss, F.A., 1996. Genetic diversity in peach (Prunus persica
L. Batsch) revealed by randomly amplified polymorphic DNA (RAPD)
markers and compared to inbreeding coefficients. J. Am. Soc. Hort. Sci. 121
(6), 1012–1019.
Westwood, M.N., 1978. Temperature Zone Pomology. Freeman, San Francisco,
428 pp.
Zhebentyayeva, T.N., Reighard, G.L., Gorina, V.M., Abbot, A.G., 2003. Simple
sequence repeat (SSR) analysis for assessment of genetic variability in
apricot germplasm. Theor. Appl. Genet. 106, 435–444.