open access original research prediction models for
TRANSCRIPT

1Van Grootven B, et al. BMJ Open 2021;11:e047576. doi:10.1136/bmjopen-2020-047576
Open access
Prediction models for hospital readmissions in patients with heart disease: a systematic review and meta- analysis
Bastiaan Van Grootven ,1,2 Patricia Jepma ,3 Corinne Rijpkema,4 Lotte Verweij,3 Mariska Leeflang,5 Joost Daams,6 Mieke Deschodt,7,8 Koen Milisen,7,9 Johan Flamaing,10,11 Bianca Buurman3,5
To cite: Van Grootven B, Jepma P, Rijpkema C, et al. Prediction models for hospital readmissions in patients with heart disease: a systematic review and meta- analysis. BMJ Open 2021;11:e047576. doi:10.1136/bmjopen-2020-047576
► Prepublication history and additional supplemental material for this paper are available online. To view these files, please visit the journal online. (http:// dx. doi. org/ 10. 1136/ bmjopen- 2020- 047576).
BVG and PJ are joint first authors.
Received 02 December 2020Accepted 30 July 2021
For numbered affiliations see end of article.
Correspondence toDr Bastiaan Van Grootven; bastiaan. vangrootven@ kuleuven. be
Original research
© Author(s) (or their employer(s)) 2021. Re- use permitted under CC BY- NC. No commercial re- use. See rights and permissions. Published by BMJ.
ABSTRACTObjective To describe the discrimination and calibration of clinical prediction models, identify characteristics that contribute to better predictions and investigate predictors that are associated with unplanned hospital readmissions.Design Systematic review and meta- analysis.Data source Medline, EMBASE, ICTPR (for study protocols) and Web of Science (for conference proceedings) were searched up to 25 August 2020.Eligibility criteria for selecting studies Studies were eligible if they reported on (1) hospitalised adult patients with acute heart disease; (2) a clinical presentation of prediction models with c- statistic; (3) unplanned hospital readmission within 6 months.Primary and secondary outcome measures Model discrimination for unplanned hospital readmission within 6 months measured using concordance (c) statistics and model calibration. Meta- regression and subgroup analyses were performed to investigate predefined sources of heterogeneity. Outcome measures from models reported in multiple independent cohorts and similarly defined risk predictors were pooled.Results Sixty studies describing 81 models were included: 43 models were newly developed, and 38 were externally validated. Included populations were mainly patients with heart failure (HF) (n=29). The average age ranged between 56.5 and 84 years. The incidence of readmission ranged from 3% to 43%. Risk of bias (RoB) was high in almost all studies. The c- statistic was <0.7 in 72 models, between 0.7 and 0.8 in 16 models and >0.8 in 5 models. The study population, data source and number of predictors were significant moderators for the discrimination. Calibration was reported for 27 models. Only the GRACE (Global Registration of Acute Coronary Events) score had adequate discrimination in independent cohorts (0.78, 95% CI 0.63 to 0.86). Eighteen predictors were pooled.Conclusion Some promising models require updating and validation before use in clinical practice. The lack of independent validation studies, high RoB and low consistency in measured predictors limit their applicability.PROSPERO registration number CRD42020159839.
INTRODUCTIONHospital readmissions in patients with acute heart disease are associated with a high burden on patients, healthcare and costs.1 The identification of high- risk hospitalised patients is important to provide timely inter-ventions. Prediction models guide healthcare providers in daily practice to assess patients’ probability of readmission within a certain time frame and include candidate variables identified by clinical perspectives, literature or data- driven approaches, for example, using machine learning techniques.2 Data are often collected from observational cohorts of intervention studies and subsequently anal-ysed to examine what set of predictors best predict the risk of readmission. The clinical applicability of risk prediction models in daily practice is currently limited. Statistical models are often not presented in a clinically useful way or models based on administrative data are considered.3 These models therefore cannot be readily used in daily practice. In addition, prediction models are often devel-oped for a very specific population, which asks from clinicians to be familiar with several models. Furthermore, patients may belong to multiple populations because of cardiac
Strengths and limitations of this study
► Largest investigation of unplanned hospital read-mission risk to date, including 81 unique prediction models in the systematic review.
► Independent and standardised procedures for study selection, data collection and risk of bias (RoB) assessment.
► High RoB in current prediction models and unex-plained heterogeneity between models limit rec-ommendations for using prediction model in clinical practice.
on October 20, 2021 by guest. P
rotected by copyright.http://bm
jopen.bmj.com
/B
MJ O
pen: first published as 10.1136/bmjopen-2020-047576 on 17 A
ugust 2021. Dow
nloaded from

2 Van Grootven B, et al. BMJ Open 2021;11:e047576. doi:10.1136/bmjopen-2020-047576
Open access
comorbidities. Numerous systematic reviews have previ-ously investigated the prediction of unplanned hospital readmissions in several populations.3–12 While some have included hospitalised patients in general,11 12 others have focused specifically on patients with heart failure (HF)4–8 10 or acute myocardial infarction (AMI).3 9 The conclusion is generally the same, the discrimination is poor to adequate, and there is little consistency in the type of predictors included in the models.
We believe that the state of the art on risk prediction can be improved if more knowledge is available on the performance of clinical risk prediction models and risk predictors across different populations of patients with heart disease. Although heterogeneity in models and predictors is often considered as a limitation, it can inform effect moderators on how predictions can be improved.13 For example, perhaps we can identify predictors who demonstrate a consistent association with hospital read-mission regardless of the underlying disease. If this can be identified, a more general prediction model could be developed that is relevant for the heterogeneous group of patients on cardiac care units. This might contribute to the early recognition and onset of preventive interven-tions in patients with heart disease at risk of readmission.
We therefore performed a systematic review and meta- analysis on clinical risk prediction models for the outcome unplanned hospital readmission in patients hospital-ised for acute heart disease. Our aims were to describe the discrimination and calibration of clinical prediction models, to identify characteristics that contribute to better predictions, and to investigate predictors that are consistently associated with hospital readmissions.
METHODSA protocol was registered in PROSPERO (registration number: CRD42020159839). The results are reported following the PRISMA (Preferred Reporting Items for Systematic Reviews and Meta- Analyses) statement.14
Eligibility criteriaStudies were eligible if (1) the study population included hospitalised adult patients with (symptoms of) heart disease; (2) a prediction model with c- statistic was reported; (3) a clinically useful presentation of the model with risk factors was reported; (4) the outcome was unplanned hospital readmissions within 6 months; (5) the study design was appropriate, that is, (nested) case–control study (prospective and retrospective) cohort study, database and registry study, or secondary analysis of a trial; (6) they were reported in English.
Information sourcesA search strategy was designed with an information specialist (PROSPERO protocol and online supplemental text 1). We searched the Medline, EMBASE, WHO ICTPR search portal (for study protocols) and Web of Science (for conference proceedings) databases up to 25 August
2020 without any restrictions for eligible studies. We searched for full- text manuscripts of the identified proto-cols. After selecting the full- text manuscripts, we screened references lists and prospective citations (using Google Scholar) for additional eligible studies.
Study selectionThree reviewers were involved in the study selection process. Each reviewer independently screened two- thirds of the titles, abstracts and full- text articles of potentially relevant references identified in the literature search. Disagreements were resolved through consensus. Sixteen authors were contacted and six delivered data for readmission when a composite outcome was used. Two authors were also contacted when data were reported combining multiple patient populations. However, no additional data were provided for the population with heart disease and these studies were excluded.
Data extractionData extraction was performed based on the ‘Critical Appraisal and Data Extraction for Systematic Reviews’ of prediction modelling studies checklist using stan-dardised forms in the Distiller Systematic Review Software (see online supplemental text 2 for the data items).15 The checklist includes items on 11 relevant domains, including source of data, participants, outcomes, candi-date predictors, sample size, missing data, model devel-opment, model performance, model evaluation, results and interpretation. One reviewer collected the data and the second reviewer verified the extracted data. Disagree-ments were resolved through consensus. Eight authors were contacted and two delivered data to resolve uncer-tainties or missing data.
Risk of biasThe Prediction model Risk Of Bias ASsessment Tool (PROBAST) tool16 was used to assess the risk of bias (RoB) for four ‘quality’ domains, that is, the participants, predic-tors, outcome and analysis for each model. One author assessed the RoB as low, high or unclear, and the second author verified the extracted data and RoB conclusion. Disagreements were resolved through consensus. In addi-tion, the applicability of the included studies based on our research question was assessed for three domains, that is, participants, predictors and outcome domains and rated as low concerns, high concerns or uncertain concerns regarding applicability.
Summary measuresThe discrimination of the prediction models was described using the concordance (c)- statistic. Missing SEs were derived from the sample data.17 The calibration was described using the number of observed and expected events, the calibration slope, calibration in large or the Hosmer- Lemeshow test. A definition of the commonly used measures is described in box 1.
The association between risk predictors and hospital readmission was described using regression coefficients.
on October 20, 2021 by guest. P
rotected by copyright.http://bm
jopen.bmj.com
/B
MJ O
pen: first published as 10.1136/bmjopen-2020-047576 on 17 A
ugust 2021. Dow
nloaded from

3Van Grootven B, et al. BMJ Open 2021;11:e047576. doi:10.1136/bmjopen-2020-047576
Open access
Missing SEs for the coefficients were considered missing completely at random and were not imputed. A complete case analysis was performed.
Synthesis of results and analysesMeta- analyses using random- effects models, with the Hartung- Knapp modification, were performed to describe the distribution of the between- study variance of the different prediction models and their predictors. Because we considered that there would be substantial heterogeneity, conclusions were not based on the preci-sion of the pooled estimates.
The c- statistic from each model was pooled and a meta- regression was performed to investigate the modera-tion effect of age and the number of predictors on the discrimination. A subgroup analysis was performed to investigate the moderation effect of the different patient populations, design, outcome definition and endpoint.
The c- statistic of the validated model was used if available; otherwise, the c- statistic from the development phase was used.
The c- statistics of specific prediction models that were evaluated in multiple studies were pooled for the endpoint 30- day follow- up.
Coefficients of predictors that were similarly defined in at least five studies were pooled for the endpoint 30- day follow- up. The patient populations were defined as subgroups to explore consistency and heterogeneity (I2, tau) in the effect estimates.
Analyses were performed using the ‘metan’ package in STATA V.15 IC and the ‘metamisc package’ in Rstudio.
Public and patient involvementBecause of the design of the study and because we did not collect primary date, we did not involve patients or the public in the design, conduct or reporting of our research.
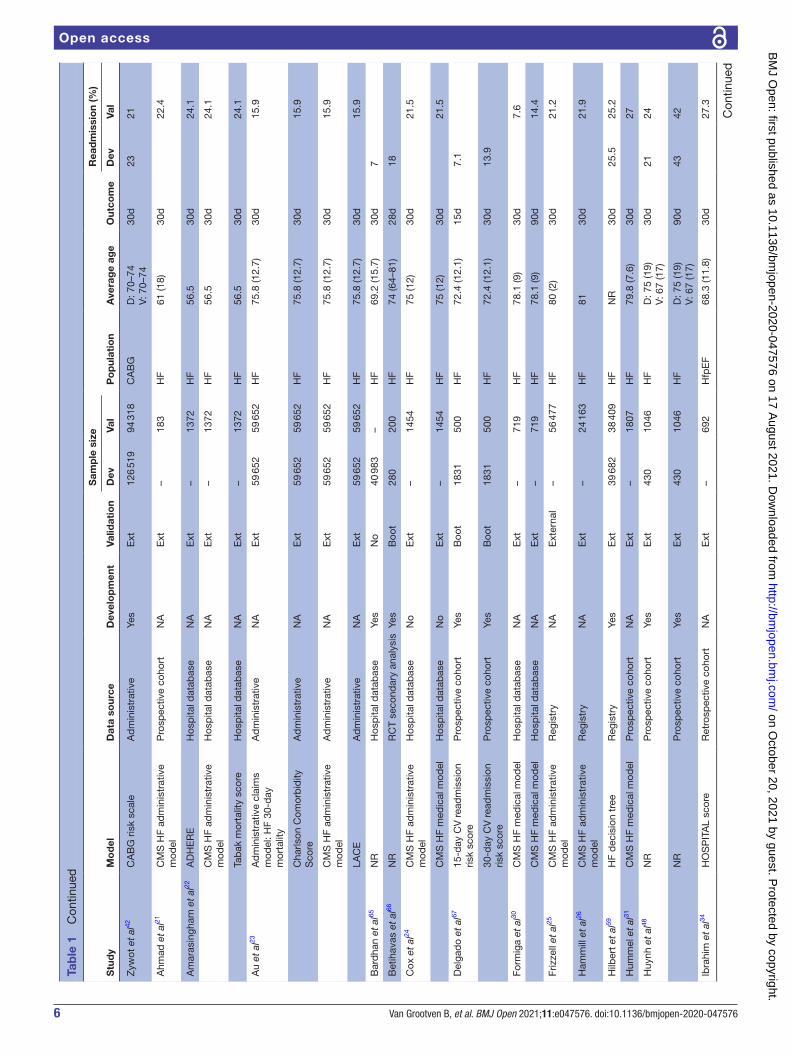
RESULTSA total of 8588 abstracts were reviewed and 60 studies describing 81 separate models were included (figure 1). Table 1 provides an overview of the included studies and models, which were published between 2001 and 2020. The majority of the studies (n=40) was performed in the USA. The data sources used were mostly retrospec-tive cohort studies (n=15), hospital databases (n=13) and registries (n=13). Included populations were mainly patients with HF(n=29), surgical patients (n=14) and patients with an AMI or acute coronary syndrome (n=10). The average age was between 56.5 and 84 years. The sample size of development cohorts ranged from 182 to 193 899 patients and of the validation cohorts between 104 and 321 088 patients. The outcome of interest was mostly all- cause readmission (n=41) and measured on 30 days (n=55). The incidence of readmission per study ranged from 3% to 43%.
Risk of biasFigure 2 summarises the RoB and applicability assessment (online supplemental table 1A). The overall RoB was high in 98.9% of the models and only one study18 showed low RoB in all four domains.
For the domain participants, 82.4% of studies was assessed as high RoB because most studies performed retrospective data analyses or used data from existing sources with large number of candidate predictors that were originally developed for other purposes, for example, administrative databases or registries. The domain predictors were assessed as high RoB in 27.5% of the models, 24.2% as low RoB and 48.4% as unclear RoB. For the domain outcome, 41.8%, 34.1% and 24.2% were assessed as high, low and unclear RoB, respectively.
The domain analysis was assessed as high RoB in 97.8%. Most studies did not use appropriate statistics for the devel-opment or validation of prediction models. For example, a
Box 1 Definitions of commonly used measures
Discrimination:Refers to the ability of a prediction model to discriminate between a patient with and without the outcome, for example, readmission.C- statistic:Is a measure of discrimination. For binary outcomes, the c- statistic is equivalent to the area under the curve: 1 indicates perfect discrimina-tion, and 0.5 indicates that the models does not perform better than chance. Harrell’s c- statistic is often used in survival models.Calibration:Refers to the agreement between the predicted and the observed prob-ability (or the outcome value for linear models). Calibration is expressed using different measures, for example, calibration slope, calibration in large, Hosmer- Lemeshow test.Calibration slope:The slope should be 1, a value <1 indicates extreme predictions, and a value of >1 indicates to moderate predictions.Calibration in large:The value should be 0, a negative value indicates overestimation of the prediction, and a positive value indicates underestimation of the prediction.Hosmer- Lemeshow test:This is a goodness- of- fit test for binary outcomes. A significant p value, usually <0.05, indicates poor goodness- of- fit.Derivation/development cohort:A cohort of patients that is used to estimate the predictor values that are used in a prediction model to estimate a patient’s probability for an outcome.Validation cohort:A cohort of patients that is used to evaluate how well the developed model performs (in terms of discrimination and calibration).Internal validation:Estimates how well the performance of a model will be reproduced in the target population. Several techniques can be used, for example, random- split sample, cross- validation and bootstrapping techniques.External validation:Evaluates how well a model performs in a new sample and can consist of temporal validation (sample contains more recently treated patients), geographical validation (sample is from a different centre) of a fully in-dependent validation (validation by an independent team).
on October 20, 2021 by guest. P
rotected by copyright.http://bm
jopen.bmj.com
/B
MJ O
pen: first published as 10.1136/bmjopen-2020-047576 on 17 A
ugust 2021. Dow
nloaded from

4 Van Grootven B, et al. BMJ Open 2021;11:e047576. doi:10.1136/bmjopen-2020-047576
Open access
description on how complexities in data were handled (eg, competing risk of death) was often missing and relevant performance measures were incomplete (eg, calibration).
The domain participants and predictors were assessed as low concerns regarding applicability in all studies. For the domain outcome, 70.3% of studies used all- cause readmission as the outcome of interest and were there-fore assessed as low concerns regarding applicability.
Prediction modelsA total of 43 new models were developed for patients with HF (n=15), undergoing surgical procedures (n=12), AMI (n=9), transcatheter aortic valve replacement (TAVR) (n=2), a mixed sample with HF and coronary syndromes (n=2), arrhythmias (n=1), valvular disease (n=1), while one study did not specify the sample (table 1). The c- statistic was lower than 0.6 in 5 models, between 0.6 and 0.7 in 24 models, between 0.7 and 0.8 in 6 models, and between 0.8 and 0.9 in 2 models. In six models, the c- statistic was only reported for a validation cohort (table 2).
A total of 38 separate models were externally validated for patients with HF (n=26), AMI (n=4), surgical patients (n=3), acute coronary syndrome (n=2), arrhythmias (n=2), mixed sample with HF and coronary syndromes (n=1). The discrimination was lower than 0.6 in 16 models, between 0.6 and 0.7 in 15 models, between 0.7
and 0.8 in 5 models, and between 0.8 and 0.9 in 2 models (table 2).
The discrimination of six models was evaluated in multiple independent cohorts and was pooled in meta- analyses (figure 3, online supplemental figures 1–6): the CMS AMI (Centers for Medicare and Medicaid Services Acute Myocardial Infarction) administrative model19 20 (0.65, 95% CI 0.56 to 0.73); the CMS HF (Heart Failure) administrative model21–29 (0.60, 95% CI 0.58 to 0.62); the CMS HF medical model24 27 30–32 (0.60, 95% CI 0.58 to 0.62); the HOSPITAL (Hemoglobin level, discharged from Oncology, Sodium level, Procedure during admis-sion, Index admission Type, Admission, Length of stay) score33–35 (0.64, 95% CI 0.58 to 0.70); the GRACE (Global Registration of Acute Coronary Events) score36 37 (0.78, 95% CI 0.63 to 0.86); and the LACE (Length of stay, acuity of the Admission, Comorbidity of the patient and Emergency department use in the duration of 6 months before admission) score23 28 29 34 38 (0.62, 95% CI 0.53 to 0.70).
On average, models for patients with AMI had the best discrimination (0.67, n=16), followed by patients with TAVR (0.65, n=2), patients with HF (0.64, n=45) and surgical patients (0.63, n=17). The discrimination was highest in studies using secondary analysis (0.70, n=2) and retrospective cohort studies (0.69, n=23), and was lowest
Figure 1 Flowchart. In total, 8592 records were screened and 60 studies with 81 prediction models were included.
on October 20, 2021 by guest. P
rotected by copyright.http://bm
jopen.bmj.com
/B
MJ O
pen: first published as 10.1136/bmjopen-2020-047576 on 17 A
ugust 2021. Dow
nloaded from

5Van Grootven B, et al. BMJ Open 2021;11:e047576. doi:10.1136/bmjopen-2020-047576
Open access
Tab
le 1
S
tud
y ch
arac
teris
tics
Stu
dy
Mo
del
Dat
a so
urce
Dev
elo
pm
ent
Valid
atio
n
Sam
ple
siz
e
Po
pul
atio
nA
vera
ge
age
Out
com
e
Rea
dm
issi
on
(%)
Dev
Val
Dev
Val
Mor
etti
et a
l57E
uroH
eart
PC
I sco
reH
osp
ital d
atab
ase
NA
Ext
–11
92A
CS
71 (7
)30
d4.
7
Asc
he e
t al
46N
RR
etro
spec
tive
coho
rtYe
sS
plit
2446
612
AM
I65
(15)
30d
8.9
Ced
iel e
t al
58TA
RR
AC
O R
isk
scor
eR
etro
spec
tive
coho
rtYe
sN
o61
140
1A
MI t
ype
2,
isch
aem
iaD
: 78
(17)
V: 6
0 (2
1)30
d2.
6
Ret
rosp
ectiv
e co
hort
Yes
No
611
401
AM
I typ
e 2,
is
chae
mia
D: 7
8 (1
7)V:
60
(21)
180d
7.9
Cho
tech
uang
et
al36
GR
AC
ER
etro
spec
tive
coho
rtN
AE
xt–
152
AM
I60
.5 (6
.3)
30d
5.3
GR
AC
ER
etro
spec
tive
coho
rtN
AE
xt–
152
AM
I60
.5 (6
.3)
180d
9.2
Hilb
ert
et a
l59A
MI d
ecis
ion
tree
Reg
istr
yYe
sE
xt10
848
10 7
01A
MI
NR
30d
20.6
19.7
Dod
son
et a
l18S
ILV
ER
- AM
I 30-
day
re
adm
issi
on c
alcu
lato
rP
rosp
ectiv
e co
hort
Yes
Sp
lit20
0410
02A
MI
81.5
(5.0
)30
d18
.2
Kin
i et
al60
NR
Reg
istr
yYe
sS
plit
60 7
4226
107
AM
I76
.5 (8
.0)
90d
27.5
Ngu
yen
et a
l19A
MI R
EA
DM
ITS
sco
reR
etro
spec
tive
coho
rtYe
sS
plit
661
165
AM
I65
.5 (1
2.8)
30d
13
Full-
stay
AM
I mod
elR
etro
spec
tive
coho
rtYe
sS
plit
661
165
AM
I65
.5 (1
2.8)
30d
13
CM
S A
MI a
dm
inis
trat
ive
mod
elR
etro
spec
tive
coho
rtN
AE
xt–
826
AM
I65
.5 (1
2.8)
30d
13
Kru
mho
lz e
t al
20C
MS
AM
I ad
min
istr
ativ
e m
odel
Reg
istr
yYe
sS
plit
, Ext
100
465
321
088
AM
I78
.7 (8
.0)
30d
18.9
20.0
(Ext
) N
R (s
plit
)
CM
S A
MI m
edic
al m
odel
Reg
istr
yYe
sS
plit
130
944
130
944
AM
I76
.2 (7
.3)
30d
20
Ran
a et
al33
Elix
haus
er in
dex
Hos
pita
l dat
abas
eN
AE
xt–
1660
AM
I67
.930
d6.
3
HO
SP
ITA
L sc
ore
Hos
pita
l dat
abas
eN
AE
xt–
1660
AM
I67
.930
d6.
3
Atz
ema
et a
l47A
FTE
R P
art
2 sc
orin
g sy
stem
Ret
rosp
ectiv
e co
hort
Yes
Sp
lit23
4311
67A
rrhy
thm
ia, A
FD
: 68.
6 (1
4.7)
V: 6
8.3
(15.
1)30
d7
7.6
Lahe
wal
a et
al40
CH
AD
S2
Ad
min
istr
ativ
eN
AE
xt–
116
450
Arr
hyth
mia
, AF
<75
30d
15.8
CH
AD
S2
Ad
min
istr
ativ
eN
AE
xt–
116
450
Arr
hyth
mia
, AF
<75
90d
25.1
CH
A2D
S- V
AS
cA
dm
inis
trat
ive
NA
Ext
–11
6 45
0A
rrhy
thm
ia, A
F65
–74
30d
15.8
CH
A2D
S- V
AS
cA
dm
inis
trat
ive
NA
Ext
–11
6 45
0A
rrhy
thm
ia, A
F65
–74
90d
25.1
Ben
uzill
o et
al61
CR
SS
Hos
pita
l dat
abas
eYe
sB
oot,
Ext
2589
896
(Ext
)50
0 (B
oot)
CA
BG
66.7
(9.9
)30
d9.
18.
2 (E
xt)
9.1
(Boo
t)
Deo
et
al62
30- d
ay C
AB
G r
ead
mis
sion
ca
lcul
ator
Ad
min
istr
ativ
eYe
sB
oot
155
054
1000
CA
BG
65.4
(10.
4)30
d12
.5
Eng
oren
et
al55
NR
Hos
pita
l dat
abas
eYe
sS
plit
2644
2711
CA
BG
NR
30d
7.6
8
Lanc
ey e
t al
63N
RR
egis
try
Yes
Sp
lit23
4125
20C
AB
G64
.5 (1
0.5)
30d
8.8
9.5
Ros
enb
lum
et
al41
The
STS
PR
OM
sco
reH
osp
ital d
atab
ase
NA
Ext
–21
719
CA
BG
63.5
(10.
7)30
d9.
3
Zits
er- G
urev
ich
et a
l64N
RP
rosp
ectiv
e co
hort
Yes
Sp
lit22
66.5
2266
.5C
AB
G65
–74
30d
13.3
NR
Pro
spec
tive
coho
rtYe
sS
plit
2266
.522
66.5
CA
BG
65–7
410
0d24
.1
Con
tinue
d
on October 20, 2021 by guest. P
rotected by copyright.http://bm
jopen.bmj.com
/B
MJ O
pen: first published as 10.1136/bmjopen-2020-047576 on 17 A
ugust 2021. Dow
nloaded from
6 Van Grootven B, et al. BMJ Open 2021;11:e047576. doi:10.1136/bmjopen-2020-047576
Open access
Stu
dy
Mo
del
Dat
a so
urce
Dev
elo
pm
ent
Valid
atio
n
Sam
ple
siz
e
Po
pul
atio
nA
vera
ge
age
Out
com
e
Rea
dm
issi
on
(%)
Dev
Val
Dev
Val
Zyw
ot e
t al
42C
AB
G r
isk
scal
eA
dm
inis
trat
ive
Yes
Ext
126
519
94 3
18C
AB
GD
: 70–
74V:
70–
7430
d23
21
Ahm
ad e
t al
21C
MS
HF
adm
inis
trat
ive
mod
elP
rosp
ectiv
e co
hort
NA
Ext
–18
3H
F61
(18)
30d
22.4
Am
aras
ingh
am e
t al
22A
DH
ER
EH
osp
ital d
atab
ase
NA
Ext
–13
72H
F56
.530
d24
.1
CM
S H
F ad
min
istr
ativ
e m
odel
Hos
pita
l dat
abas
eN
AE
xt–
1372
HF
56.5
30d
24.1
Tab
ak m
orta
lity
scor
eH
osp
ital d
atab
ase
NA
Ext
–13
72H
F56
.530
d24
.1
Au
et a
l23A
dm
inis
trat
ive
clai
ms
mod
el: H
F 30
- day
m
orta
lity
Ad
min
istr
ativ
eN
AE
xt59
652
59 6
52H
F75
.8 (1
2.7)
30d
15.9
Cha
rlson
Com
orb
idity
S
core
Ad
min
istr
ativ
eN
AE
xt59
652
59 6
52H
F75
.8 (1
2.7)
30d
15.9
CM
S H
F ad
min
istr
ativ
e m
odel
Ad
min
istr
ativ
eN
AE
xt59
652
59 6
52H
F75
.8 (1
2.7)
30d
15.9
LAC
EA
dm
inis
trat
ive
NA
Ext
59 6
5259
652
HF
75.8
(12.
7)30
d15
.9
Bar
dha
n et
al65
NR
Hos
pita
l dat
abas
eYe
sN
o40
983
–H
F69
.2 (1
5.7)
30d
7
Bet
ihav
as e
t al
66N
RR
CT
seco
ndar
y an
alys
isYe
sB
oot
280
200
HF
74 (6
4–81
)28
d18
Cox
et
al24
CM
S H
F ad
min
istr
ativ
e m
odel
Hos
pita
l dat
abas
eN
oE
xt–
1454
HF
75 (1
2)30
d21
.5
CM
S H
F m
edic
al m
odel
Hos
pita
l dat
abas
eN
oE
xt–
1454
HF
75 (1
2)30
d21
.5
Del
gad
o et
al67
15- d
ay C
V r
ead
mis
sion
ris
k sc
ore
Pro
spec
tive
coho
rtYe
sB
oot
1831
500
HF
72.4
(12.
1)15
d7.
1
30- d
ay C
V r
ead
mis
sion
ris
k sc
ore
Pro
spec
tive
coho
rtYe
sB
oot
1831
500
HF
72.4
(12.
1)30
d13
.9
Form
iga
et a
l30C
MS
HF
med
ical
mod
elH
osp
ital d
atab
ase
NA
Ext
–71
9H
F78
.1 (9
)30
d7.
6
CM
S H
F m
edic
al m
odel
Hos
pita
l dat
abas
eN
AE
xt–
719
HF
78.1
(9)
90d
14.4
Friz
zell
et a
l25C
MS
HF
adm
inis
trat
ive
mod
elR
egis
try
NA
Ext
erna
l–
56 4
77H
F80
(2)
30d
21.2
Ham
mill
et
al26
CM
S H
F ad
min
istr
ativ
e m
odel
Reg
istr
yN
AE
xt–
24 1
63H
F81
30d
21.9
Hilb
ert
et a
l59H
F d
ecis
ion
tree
Reg
istr
yYe
sE
xt39
682
38 4
09H
FN
R30
d25
.525
.2
Hum
mel
et
al31
CM
S H
F m
edic
al m
odel
Pro
spec
tive
coho
rtN
AE
xt–
1807
HF
79.8
(7.6
)30
d27
Huy
nh e
t al
48N
RP
rosp
ectiv
e co
hort
Yes
Ext
430
1046
HF
D: 7
5 (1
9)V:
67
(17)
30d
2124
NR
Pro
spec
tive
coho
rtYe
sE
xt43
010
46H
FD
: 75
(19)
V: 6
7 (1
7)90
d43
42
Ibra
him
et
al34
HO
SP
ITA
L sc
ore
Ret
rosp
ectiv
e co
hort
NA
Ext
–69
2H
fpE
F68
.3 (1
1.8)
30d
27.3
Tab
le 1
C
ontin
ued
Con
tinue
d
on October 20, 2021 by guest. P
rotected by copyright.http://bm
jopen.bmj.com
/B
MJ O
pen: first published as 10.1136/bmjopen-2020-047576 on 17 A
ugust 2021. Dow
nloaded from

7Van Grootven B, et al. BMJ Open 2021;11:e047576. doi:10.1136/bmjopen-2020-047576
Open access
Stu
dy
Mo
del
Dat
a so
urce
Dev
elo
pm
ent
Valid
atio
n
Sam
ple
siz
e
Po
pul
atio
nA
vera
ge
age
Out
com
e
Rea
dm
issi
on
(%)
Dev
Val
Dev
Val
LAC
E/L
AC
E +
ind
exR
etro
spec
tive
coho
rtN
AE
xt–
692
Hfp
EF
68.3
(11.
8)30
d27
.3
Kee
nan
et a
l27C
MS
HF
adm
inis
trat
ive
mod
elR
egis
try
Yes
Sp
lit, E
xt.
28 3
1984
5 29
1H
F79
.9 (7
.8)
30d
23.6
23.7
(Ext
) N
R (S
plit
)
CM
S H
F m
edic
al m
odel
Reg
istr
yYe
sS
plit
, Ext
.64
329
64 3
29H
F75
–84
30d
23.7
Kita
mur
a et
al53
FIM
Ret
rosp
ectiv
e co
hort
NA
Ext
–11
3H
F80
.5 (6
.7)
90d
20.4
Leon
g et
al68
30- d
ay H
F re
adm
issi
on
risk
scor
eR
etro
spec
tive
coho
rtYe
sS
plit
888
587
HF
D: 7
0.0
(12.
7)V:
69.
1 (1
2.8)
30d
9.9
Li e
t al
49N
RR
etro
spec
tive
coho
rtYe
sS
plit
51 7
8325
887
HF
D: 8
4 (1
2)V:
84
(11)
30d
24.2
Lim
et
al69
NR
Reg
istr
yYe
sN
o45
66–
HF
70.5
(12.
0)30
d6.
6 (c
ar)
13 (a
ll)
Ree
d e
t al
28A
H m
odel
Ad
min
istr
ativ
eYe
sS
plit
NR
NR
HF
NR
30d
NR
CM
S H
F ad
min
istr
ativ
e m
odel
Ad
min
istr
ativ
eN
AS
plit
–N
RH
FN
R30
dN
R
Has
anA
dm
inis
trat
ive
NA
Sp
lit–
NR
HF
NR
30d
NR
LAC
EA
dm
inis
trat
ive
NA
Sp
lit–
NR
HF
NR
30d
NR
PAR
R-3
0A
dm
inis
trat
ive
NA
Sp
lit–
NR
HF
NR
30d
NR
Sal
ah e
t al
70E
LAN
- HF
scor
eP
rosp
ectiv
e co
hort
se
cond
ary
anal
ysis
Yes
No
1301
–H
F74
(16)
180d
36.1
Sud
haka
r et
al32
CM
S H
F m
edic
al m
odel
Hos
pita
l dat
abas
eN
AE
xt–
1046
HF
65.2
(16.
6)30
d35
.3
Tan
et a
l71N
RH
osp
ital d
atab
ase
Yes
Sp
lit24
610
4H
FD
: 67.
7 (1
2.3)
V: 6
9.0
(12.
9)90
d24
.511
.7
Wan
g et
al72
NR
Hos
pita
l dat
abas
eYe
sN
o45
48–
HF
68.5
(27.
6)30
d25
.1
Wan
g et
al38
LAC
ER
etro
spec
tive
coho
rtN
AE
xt–
253
HF
56.6
(11.
5)30
d24
.5
Yazd
an- A
shoo
ri et
al29
CM
S H
F ad
min
istr
ativ
e m
odel
Pro
spec
tive
coho
rtN
AE
xt–
378
HF
73.1
(13.
1)30
d26
LAC
EP
rosp
ectiv
e co
hort
NA
Ext
–37
8H
F73
.1 (1
3.1)
30d
26
Dis
die
r M
ould
er e
t al
73N
RP
rosp
ectiv
e co
hort
Yes
No
258
HF,
AC
S, N
R70
.5 (2
3)30
d17
NR
Pro
spec
tive
coho
rtYe
sN
o25
8H
F, A
CS
, NR
70.5
(23)
180d
38
Rap
osei
ras-
Rou
bín
et
al37
GR
AC
ER
etro
spec
tive
coho
rtN
AE
xt–
4229
HF,
AC
S68
.2 (1
8.7)
30d
2.6
Bur
ke e
t al
35H
OS
PIT
AL
scor
eR
etro
spec
tive
coho
rtN
AE
xt–
HF:
318
9A
MI:
767
HF,
AM
I65
.8 (1
6.8)
30d
HF:
18.
2 A
MI:
17.4
Min
ges
et a
l74N
RR
egis
try
Yes
Sp
lit19
3 89
919
4 17
9H
F, P
CI
65+
30d
11.4
Pac
k et
al75
NR
Ad
min
istr
ativ
eYe
sS
plit
30 8
2677
06H
VD
64.9
(12.
2)90
d12
.8
Oliv
er- M
cNei
l et
al76
ICD
rea
dm
issi
on- r
isk
scor
eR
egis
try
Up
dat
eE
xt18
2–
ICD
69 (1
1)30
d17
.6
Was
fy e
t al
52P
re- P
CI m
odel
Reg
istr
yYe
sS
plit
24 0
5212
008
NR
64.8
(12.
5)30
d10
.4
Tab
le 1
C
ontin
ued
Con
tinue
d
on October 20, 2021 by guest. P
rotected by copyright.http://bm
jopen.bmj.com
/B
MJ O
pen: first published as 10.1136/bmjopen-2020-047576 on 17 A
ugust 2021. Dow
nloaded from

8 Van Grootven B, et al. BMJ Open 2021;11:e047576. doi:10.1136/bmjopen-2020-047576
Open access
Stu
dy
Mo
del
Dat
a so
urce
Dev
elo
pm
ent
Valid
atio
n
Sam
ple
siz
e
Po
pul
atio
nA
vera
ge
age
Out
com
e
Rea
dm
issi
on
(%)
Dev
Val
Dev
Val
Bar
nett
et
al77
NR
Reg
istr
yU
pd
ate
Ext
19 9
6419
964
Sur
gica
l65
.3 (1
2.4)
30d
11.4
Bro
wn
et a
l43S
TS a
ugm
ente
d c
linic
al
mod
elP
rosp
ectiv
e co
hort
Up
dat
eB
oot
1046
NR
Sur
gica
l65
.4 (9
.8)
30d
NR
STS
30-
day
rea
dm
issi
on
mod
elP
rosp
ectiv
e co
hort
NA
Ext
–11
94S
urgi
cal
73.3
(10.
1)30
dN
R
Esp
inoz
a et
al78
30- d
ay r
ead
mis
sion
sco
re
afte
r ca
rdia
c su
rger
yR
etro
spec
tive
coho
rtYe
sS
plit
2529
2567
Sur
gica
l65
.1 (1
1.5)
30d
11.9
Ferr
aris
et
al54
RE
AD
MIT
Pro
spec
tive
coho
rtYe
s25
74S
urgi
cal
63 (1
1)30
d9.
8
Kili
c et
al79
NR
Ret
rosp
ectiv
e co
hort
Yes
Sp
lit38
9812
95S
urgi
cal
D:6
1.9
(14.
7)V:
61.
6 (1
5.1)
30d
1011
Stu
ebe
et a
l80N
RH
osp
ital d
atab
ase
Yes
No
4800
Sur
gica
l60
–69
30d
12
Tam
et
al44
NR
Ret
rosp
ectiv
e co
hort
Yes
Boo
t63
336
NR
Sur
gica
l66
.2 (1
0.7)
30d
11.3
Khe
ra e
t al
45TA
VR
30-
Day
rea
dm
issi
on
risk
mod
elA
dm
inis
trat
ive
Yes
Boo
ts, E
xt39
305
40 (B
oot)
885
(Ext
)TA
VR
D: 8
1.3
V: 8
1.7
30d
16.2
16.2
(Boo
t) 18
.9 (E
xt)
San
chez
et
al50
NR
Reg
istr
yYe
sS
plit
6903
3442
TAV
RD
: 81.
1 (7
.9)
V: 8
1.3
(7.9
)30
d9.
810
.7
Age
is r
epor
ted
as
mea
n (S
D);
med
ian
(IQR
) or
aver
age
age
as r
epor
ted
in t
he s
tud
y.A
CS
, acu
te c
oron
ary
synd
rom
e; A
DH
ER
E, A
cute
Dec
omp
ensa
ted
Hea
rt F
ailu
re R
egis
try;
AF,
atr
ial fi
bril
latio
n; A
H, A
dve
ntis
t H
ealth
Off-
the-
shel
f mod
el; A
MI,
acut
e m
yoca
rdia
l inf
arct
ion;
Boo
t, b
oots
trap
pin
g; C
AB
G,
coro
nary
art
ery
byp
ass
graf
ting;
Car
, car
dia
c- re
late
d; C
HA
2DS
2- VA
Sc,
con
gest
ive
hear
t fa
ilure
, hyp
erte
nsio
n, a
ge ≥
75
year
s, d
iab
etes
mel
litus
, str
oke
or t
rans
ient
isch
emic
att
ack
(TIA
), va
scul
ar d
isea
se, a
ge 6
5 to
74
year
s, s
ex c
ateg
ory;
CM
S, C
ente
rs fo
r M
edic
are
and
Med
icai
d S
ervi
ces;
CR
SS
, CA
BG
Rea
dm
issi
on R
isk
Sco
re; d
, day
s; D
ev, d
evel
opm
ent;
ELA
N- H
F, E
urop
ean
Col
lab
orat
ion
on A
cute
Dec
omp
ensa
ted
Hea
rt F
ailu
re; E
xt,
exte
rnal
val
idat
ion;
FIM
, mot
or a
nd c
ogni
tive
Func
tiona
l Ind
epen
den
ce M
easu
re; G
RA
CE
, Glo
bal
Reg
istr
atio
n of
Acu
te C
oron
ary
Eve
nts;
HF,
hea
rt fa
ilure
; HFp
EF,
hea
rt fa
ilure
with
pre
serv
ed e
ject
ion
frac
tion;
HV
D, h
eart
va
lve
dis
ease
; IC
D, i
mp
lant
able
car
dio
vert
er d
efib
rilla
tor;
LA
CE
, Len
gth
of s
tay,
acu
ity o
f the
Ad
mis
sion
, Com
orb
idity
of t
he p
atie
nt a
nd E
mer
genc
y d
epar
tmen
t us
e in
the
dur
atio
n of
6 m
onth
s b
efor
e ad
mis
sion
; NA
, not
ap
plic
able
; NR
, not
rep
orte
d; P
AR
R-3
0, P
atie
nts
at R
isk
of R
e- ad
mis
sion
with
in 3
0 d
ays;
PC
I, p
ercu
tane
ous
coro
nary
inte
rven
tion;
RE
AD
MIT
S, R
enal
Fun
ctio
n, E
leva
ted
Bra
in N
atriu
retic
Pep
tide,
Age
, Dia
bet
es M
ellit
us,
Non
mal
e S
ex, I
nter
vent
ion
with
Tim
ely
Per
cuta
neou
s C
oron
ary
Inte
rven
tion,
and
Low
Sys
tolic
Blo
od P
ress
ure;
SIL
VE
R- A
MI,
Com
pre
hens
ive
Eva
luat
ion
of R
isk
Fact
ors
in O
lder
Pat
ient
s w
ith A
MI;
Sp
lit, r
and
om s
plit
; STS
P
RO
M, S
ocie
ty o
f Tho
raci
c S
urge
ons
Pre
dic
ted
Ris
k of
Mor
talit
y; T
AR
RA
CO
, Tro
pon
in A
sses
smen
t fo
r R
isk
stR
atifi
catio
n of
pat
ient
s w
ithou
t A
cute
CO
rona
ry a
ther
othr
omb
osis
; TA
VR
, tra
nsca
thet
er a
ortic
val
ve r
epla
cem
ent;
Va
l, va
lidat
ion.
Tab
le 1
C
ontin
ued
on October 20, 2021 by guest. P
rotected by copyright.http://bm
jopen.bmj.com
/B
MJ O
pen: first published as 10.1136/bmjopen-2020-047576 on 17 A
ugust 2021. Dow
nloaded from

9Van Grootven B, et al. BMJ Open 2021;11:e047576. doi:10.1136/bmjopen-2020-047576
Open access
in studies using registries (0.61, n=17) and hospital data-bases (0.61, n=18). The discrimination decreased when the number of predictors increased (beta −0.002, n=90). There were no moderation effects based on the average age of the sample, outcome definition and endpoint of the prediction (online supplemental figures 7–8 and online supplemental table 1B).
The calibration was reported for 27 models using multiple measures and could not be pooled (table 2).
PredictorsA total of 766 predictor values were estimated in the included models. The median number of predictors per model was 15 (IQR=9–28). The predictors were mostly situated in the domains medical comorbidities (n=211),
Figure 2 PROBAST (Prediction model Risk Of Bias ASsessment Tool) risk of bias and applicability. The PROBAST tool16 was used to assess the risk of bias for the participants, predictors, outcome and analysis for each model. Only one study demonstrated low risk of bias on all domains.
on October 20, 2021 by guest. P
rotected by copyright.http://bm
jopen.bmj.com
/B
MJ O
pen: first published as 10.1136/bmjopen-2020-047576 on 17 A
ugust 2021. Dow
nloaded from

10 Van Grootven B, et al. BMJ Open 2021;11:e047576. doi:10.1136/bmjopen-2020-047576
Open access
Tab
le 2
M
odel
dis
crim
inat
ion
and
cal
ibra
tion
Stu
dy
Mo
del
Set
ting
Pre
dic
tors
; nC
oho
rtD
iscr
imin
atio
nTy
pe
calib
rati
on
Cal
ibra
tio
n
Mor
etti
et a
l57E
uroH
eart
PC
I sco
reA
CS
16E
xter
nal
0.59
(0.4
8–0.
71)
NA
Asc
he e
t al
46N
RA
MI
19D
evel
opm
ent;
ran
dom
sp
lit0.
74; N
RN
A
Ced
iel e
t al
58TA
RR
AC
O r
isk
scor
eA
MI t
ype
2;
isch
aem
ia7
Dev
elop
men
t (3
0d)
0.71
(0.6
1–0.
82)
NA
AM
I typ
e 2;
is
chae
mia
7D
evel
opm
ent
(180
d)
0.71
(0.6
4–0.
78)
NA
Bur
ke e
t al
35H
OS
PIT
AL
scor
eA
MI
7E
xter
nal
0.66
(0.6
1–0.
71)
HLT
p=
0.49
Cho
tech
uang
et
al36
GR
AC
EA
MI
9E
xter
nal (
30d
)0.
77 (0
.65–
0.88
)N
A
GR
AC
EA
MI
9E
xter
nal (
180d
)0.
63 (0
.49–
0.77
)N
A
Hilb
ert
et a
l59A
MI d
ecis
ion
tree
AM
I44
Dev
elop
men
t; E
xter
nal
0.65
(0.6
4–0.
66)
0.61
(0.6
1–0.
62)
NA
Dod
son
et a
l18S
ILV
ER
- AM
I 30-
day
re
adm
issi
on c
alcu
lato
rA
MI
10D
evel
opm
ent;
ran
dom
sp
lit0.
65; 0
.63
HLT
p>
0.05
; p=
0.05
Kin
i et
al60
NR
AM
I12
Dev
elop
men
t; r
and
om
split
NR
; 0.6
6S
lop
e; in
larg
e; p
lot
0.97
3 (p
=0.
330)
; −
0.03
8 (p
=0.
221)
Ngu
yen
et a
l19A
MI R
EA
DM
ITS
sco
reA
MI
7D
evel
opm
ent;
ran
dom
sp
lit0.
75 (0
.70–
0.80
)0.
73 (0
.71–
0.74
)P
lot;
plo
t
Full-
stay
AM
I mod
elA
MI
10D
evel
opm
ent;
ran
dom
sp
lit0.
78 (0
.74–
0.83
)0.
75 (0
.74–
0.76
)P
lot
CM
S A
MI a
dm
inis
trat
ive
mod
elA
MI
32E
xter
nal
0.74
(0.6
9–0.
74)
Plo
t
Kru
mho
lz e
t al
20C
MS
AM
I ad
min
istr
ativ
e m
odel
A
MI
32D
evel
opm
ent;
ext
erna
l; ra
ndom
sp
lit0.
63; 0
.63;
0.6
2In
larg
e; s
lop
e
CM
S A
MI m
edic
al m
odel
AM
I45
Dev
elop
men
t; r
and
om
split
0.58
; 0.5
9N
A0,
1/0
.015
; 0.
997/
0.01
5; 0
.983
Ran
a et
al33
Elix
haus
er in
dex
AM
I30
Ext
erna
l0.
53 (0
.42–
0.65
)N
A
HO
SP
ITA
L co
reA
MI
7E
xter
nal
0.60
(0.4
7–0.
73)
NA
Atz
ema
et a
l47A
FTE
R P
art
2 sc
orin
g sy
stem
Arr
hyth
mia
; AF
12D
evel
opm
ent
0.69
; NR
NA
Lahe
wal
a et
al40
CH
AD
S2
Arr
hyth
mia
; AF
5E
xter
nal (
30d
)0.
64N
A
CH
AD
S2
Arr
hyth
mia
; AF
5E
xter
nal (
90d
)0.
63N
A
CH
A2D
S- V
AS
cA
rrhy
thm
ia; A
F9
Ext
erna
l (30
d)
0.65
NA
CH
A2D
S- V
AS
cA
rrhy
thm
ia; A
F9
Ext
erna
l (90
d)
0.63
NA
Ben
uzill
o et
al61
CR
SS
CA
BG
5D
evel
opm
ent;
b
oots
trap
pin
g0.
63; 0
.63
HLT
7.13
(p=
0.52
);9.
31 (p
=0.
32)
Deo
et
al62
30- d
ays
CA
BG
re
adm
issi
on c
alcu
lato
rC
AB
G20
Dev
elop
men
t0.
65N
A
Eng
oren
et
al55
NR
CA
BG
6D
evel
opm
ent;
ran
dom
sp
lit0.
68 (0
.64–
0.72
) 0.6
8 (0
.64–
0.68
)N
A
Con
tinue
d
on October 20, 2021 by guest. P
rotected by copyright.http://bm
jopen.bmj.com
/B
MJ O
pen: first published as 10.1136/bmjopen-2020-047576 on 17 A
ugust 2021. Dow
nloaded from

11Van Grootven B, et al. BMJ Open 2021;11:e047576. doi:10.1136/bmjopen-2020-047576
Open access
Stu
dy
Mo
del
Set
ting
Pre
dic
tors
; nC
oho
rtD
iscr
imin
atio
nTy
pe
calib
rati
on
Cal
ibra
tio
n
Lanc
ey e
t al
63N
RC
AB
G8
Dev
elop
men
t; r
and
om
split
0.64
; 0.5
7N
A
R
osen
blu
m e
t al
41Th
e S
TS P
RO
M s
core
CA
BG
40E
xter
nal
0.59
(0.5
7–0.
60)
NA
Zits
er- G
urev
ich
et a
l64N
RC
AB
G17
Dev
elop
men
t; e
xter
nal
(30d
)0.
63; 0
.66/
0.63
HLT
7.91
(p=
0.44
)
NR
CA
BG
13D
evel
opm
ent
(100
d)
0.65
HLT
6.76
(p=
0.56
)
Zyw
ot e
t al
42C
AB
G r
isk
scal
eC
AB
G27
Dev
elop
men
t; e
xter
nal
NR
; 0.7
0P
lot
Ahm
ad e
t al
21C
MS
HF
adm
inis
trat
ive
mod
elH
F37
Ext
erna
l0.
66 (0
.57–
0.76
)H
LTp
=0.
19
Am
aras
ingh
am e
t al
22A
DH
ER
EH
F3
Ext
erna
l0.
56 (0
.54–
0.59
)N
A
CM
S H
F ad
min
istr
ativ
e m
odel
HF
37E
xter
nal
0.66
(0.6
3–0.
68)
NA
Tab
ak m
orta
lity
scor
eH
F18
Ext
erna
l0.
61 (0
.59–
0.64
)N
A
Au
et a
l23A
dm
inis
trat
ive
clai
ms
mod
el, H
F 30
- day
m
orta
lity
HF
17E
xter
nal
0.58
(0.5
8–0.
59)
NA
Cha
rlson
Com
orb
idity
S
core
HF
32E
xter
nal
0.55
(0.5
5–0
56)
NA
CM
S H
F ad
min
istr
ativ
e m
odel
HF
37E
xter
nal
0.59
(0.5
9–0.
60)
NA
LAC
EH
F18
Ext
erna
l0.
58 (0
.58–
0.59
)N
A
Bar
dha
n et
al65
NR
HF
30D
evel
opm
ent
0.56
NA
Bet
ihav
as e
t al
66N
RH
F7
Dev
elop
men
t;
boo
tstr
app
ing
NR
; 0.8
0N
A
Bur
ke e
t al
35H
OS
PIT
AL
scor
eH
F7
Ext
erna
l0.
67 (0
.65–
0.70
)H
LTp
=0.
10
Cox
et
al24
CM
S H
F ad
min
istr
ativ
e m
odel
HF
37E
xter
nal
0.61
NA
CM
S H
F m
edic
al m
odel
HF
20E
xter
nal
0.60
NA
Del
gad
o et
al67
15- d
ay C
V r
ead
mis
sion
ris
k sc
ore
HF
5D
evel
opm
ent;
b
oots
trap
pin
g0.
65; 0
.63
Plo
t
30- d
ay C
V r
ead
mis
sion
ris
k sc
ore
HF
11D
evel
opm
ent;
b
oots
trap
pin
g0.
66; 0
.64
Plo
t
Form
iga
et a
l30C
MS
HF
med
ical
mod
elH
F19
Ext
erna
l (30
d)
0.65
(0.5
7–0.
72)
NA
CM
S H
F m
edic
al m
odel
HF
19E
xter
nal (
90d
)0.
62 (0
.56–
0.68
)N
A
Friz
zell
et a
l25C
MS
HF
adm
inis
trat
ive
mod
elH
F37
Ext
erna
l0.
60N
A
Ham
mill
et
al26
CM
S H
F ad
min
istr
ativ
e m
odel
HF
37E
xter
nal
0.59
Plo
t
Hilb
ert
et a
l59H
F d
ecis
ion
tree
HF
44D
evel
opm
ent;
Ext
erna
l0.
59 (0
.58–
0.60
)0.
58 (0
.58–
0.59
)N
A
Tab
le 2
C
ontin
ued
Con
tinue
d
on October 20, 2021 by guest. P
rotected by copyright.http://bm
jopen.bmj.com
/B
MJ O
pen: first published as 10.1136/bmjopen-2020-047576 on 17 A
ugust 2021. Dow
nloaded from

12 Van Grootven B, et al. BMJ Open 2021;11:e047576. doi:10.1136/bmjopen-2020-047576
Open access
Stu
dy
Mo
del
Set
ting
Pre
dic
tors
; nC
oho
rtD
iscr
imin
atio
nTy
pe
calib
rati
on
Cal
ibra
tio
n
Hum
mel
et
al31
CM
S H
F m
edic
al m
odel
HF
28E
xter
nal
0.61
NA
Huy
nh e
t al
48N
RH
F12
Dev
elop
men
t; e
xter
nal
(30d
)0.
82 (0
.76–
0.87
)0.
73 (0
.69–
0.77
)N
A
NR
HF
12D
evel
opm
ent;
ext
erna
l (9
0d)
NR
; 0.6
5N
A
Ibra
him
et
al34
HO
SP
ITA
L sc
ore
Hfp
EF
7E
xter
nal
0.60
(0.5
5–0.
64)
NA
LAC
EH
fpE
F18
Ext
erna
l0.
55 (0
.50–
0.60
)N
A
LAC
E +
ind
exH
fpE
F24
Ext
erna
l0.
57 (0
.52–
0.62
)N
A
Kee
nan
et a
l27C
MS
HF
adm
inis
trat
ive
mod
elH
F37
Dev
elop
men
t; e
xter
nal;
rand
om s
plit
0.60
; 0.6
0; 0
.61
In la
rge;
slo
pe
0, 1
/0.0
2; 1
.01/
0.09
; 1.0
5
CM
S H
F m
edic
al m
odel
HF
30D
evel
opm
ent;
ran
dom
sp
lit0.
58; 0
.61
In la
rge;
slo
pe
0, 1
/0, 1
Kita
mur
a et
al53
FIM
HF
13E
xter
nal
0.78
NA
Leon
g et
al68
30- d
ay H
F re
adm
issi
on
risk
scor
eH
F7
Dev
elop
men
t; r
and
om
split
0.76
; 0.7
6N
A
Li e
t al
49N
RH
F10
Dev
elop
men
t; r
and
om
split
0.63
(0.6
2–0.
63)
0.63
(0.6
2–0.
63)
HLT
; plo
t0.
15 (p
>0.
005)
Lim
et
al69
NR
HF
13D
evel
opm
ent
0.68
(car
); 0.
62 (a
ll)H
LT27
.5 (p
=0.
001)
(car
) 8.0
(p
=0.
429)
(all)
Ree
d e
t al
28A
H m
odel
HF
14D
evel
opm
ent;
ran
dom
sp
lit0.
86 (0
.85–
0.86
) 0.8
5 (0
.84–
0.86
)N
A
CM
S H
F ad
min
istr
ativ
e m
odel
HF
37R
and
om s
plit
0.55
(0.5
4–0.
56)
0.55
(0.5
4–0.
57)
NA
Has
anH
F9
Ran
dom
sp
lit0.
80 (0
.79–
0.81
)0.
80 (0
.80–
0.82
)N
A
LAC
EH
F18
Ran
dom
sp
lit0.
75 (0
.74–
0.81
)0.
74 (0
.73–
0.76
)N
A
Ree
d e
t al
(con
tinue
d)28
PAR
R-3
0H
F10
Ran
dom
sp
lit0.
82 (0
.81–
0.83
)0.
81 (0
.80–
0.82
)N
A
Sal
ah e
t al
70E
LAN
- HF
Sco
reH
F10
Dev
elop
men
t0.
60 (0
.56–
0.64
)N
A
Sud
haka
r et
al32
CM
S H
F m
edic
al m
odel
HF
20E
xter
nal
0.61
(0.5
7–0.
64)
≥65
y, 0
.59
(0.5
3–0.
64)
Ran
dom
pat
ient
- lev
el, 0
.58
(0.5
0–0.
65)
NA
Tan
et a
l71N
RH
F3
Ran
dom
sp
lit0.
73H
LT; p
lot
p=
0.62
Wan
g et
al72
NR
HF
12D
evel
opm
ent
0.65
NA
Wan
g et
al38
LAC
EH
F18
Ext
erna
l0.
56 (0
.48–
0.64
)N
A
Yazd
an- A
shoo
ri et
al29
CM
S H
F ad
min
istr
ativ
e m
odel
HF
37E
xter
nal
0.61
(0.5
5–0.
67)
NA
LAC
EH
F18
Ext
erna
l0.
59 (0
.52–
0.65
)H
LTp
=0.
73
Tab
le 2
C
ontin
ued
Con
tinue
d
on October 20, 2021 by guest. P
rotected by copyright.http://bm
jopen.bmj.com
/B
MJ O
pen: first published as 10.1136/bmjopen-2020-047576 on 17 A
ugust 2021. Dow
nloaded from

13Van Grootven B, et al. BMJ Open 2021;11:e047576. doi:10.1136/bmjopen-2020-047576
Open access
Stu
dy
Mo
del
Set
ting
Pre
dic
tors
; nC
oho
rtD
iscr
imin
atio
nTy
pe
calib
rati
on
Cal
ibra
tio
n
Dis
die
r M
ould
er e
t al
73N
RH
F; A
CS
; NR
4D
evel
opm
ent
(30d
)0.
68N
A
NR
HF;
AC
S; N
R5
Dev
elop
men
t (1
80d
)0.
69N
A
Rap
osei
ras-
Rou
bín
et
al37
GR
AC
EH
F; A
CS
9E
xter
nal
0.74
(0.7
3–0.
80)
HLT
p=
0.14
Min
ges
et a
l74N
RH
F; P
CI
35D
evel
opm
ent;
ran
dom
sp
lit0.
67; 0
.66
NA
Pac
k et
al75
NR
HV
D28
Dev
elop
men
t; r
and
om
split
0.67
(ful
l dev
)/0.
65 (n
omog
ram
); 0.
67 (f
ull v
al)
Har
rell’
s E
; O,E
; H
arre
ll’s
E; p
lot
0.1%
; 1.9
%; 1
.6%
Oliv
er- M
cNei
l et
al76
ICD
rea
dm
issi
on- r
isk
scor
eIC
D4
Up
dat
e; E
xter
nal
0.69
(0.5
8–0.
79)
HLT
; plo
t3.
44 (p
=0.
49)
Was
fy e
t al
52P
re- P
CI m
odel
NR
23D
evel
opm
ent;
ran
dom
sp
lit0.
68; 0
.67
HLT
; plo
tp
=0.
59
Bar
nett
et
al77
NR
val
idat
ion
Sur
gica
l15
Ext
erna
l0.
59N
A
NR
up
dat
eS
urgi
cal
18U
pd
ate
0.60
(0.5
9–0.
62)
NA
Bro
wn
et a
l43S
TS a
ugm
ente
d c
linic
al
mod
elS
urgi
cal
27U
pd
ate
(boo
tstr
ap);
rand
om s
plit
; ext
erna
l (b
oots
trap
)
0.66
(0.6
1–0.
72);
0.56
;0.
47 (0
.42–
0.53
)H
LTp
=1.
0
STS
30-
day
rea
dm
issi
on
mod
elS
urgi
cal
21U
pd
ate
(boo
tstr
ap);
rand
om s
plit
; ext
erna
l (b
oots
trap
)
0.66
(0.6
2–0.
71),
0.58
,0.
47 (0
.41–
0.52
)H
LTp
=0.
492
Esp
inoz
a et
al78
30- d
ay r
ead
mis
sion
sc
ore
afte
r ca
rdia
c su
rger
y
Sur
gica
l5
Dev
elop
men
t; r
and
om
split
0.66
(0.6
3–0.
70)
0.64
(0.6
1–0.
67)
NA
Ferr
aris
et
al54
RE
AD
MIT
Sur
gica
l9
Dev
elop
men
t0.
70H
LT5.
966
(p=
0.65
1)
Kili
c et
al79
NR
Sur
gica
l15
Dev
elop
men
t; r
and
om
split
NR
; 0.6
4H
LT; p
lot
p=
0.45
; p=
0.57
Stu
ebe
et a
l80N
RS
urgi
cal
7D
evel
opm
ent
0.63
NA
Tam
et
al44
NR
Sur
gica
l29
Dev
elop
men
t;
boo
tstr
app
ing
0.63
; 0.6
5P
lot
Khe
ra e
t al
45TA
VR
30-
Day
re
adm
issi
on r
isk
mod
elTA
VR
11D
evel
opm
ent;
ran
dom
sp
lit; e
xter
nal
NR
; 0.6
3; 0
.69
HLT
; RM
SE
; RM
SE
; p
lot
p=
0.33
; 0.9
78; 0
.928
San
chez
et
al50
NR
TAV
R10
Dev
elop
men
t; r
and
om
split
0.61
; 0.6
0H
LTp
=0.
749;
p=
0.40
3
AC
S, a
cute
cor
onar
y sy
ndro
me;
AD
HE
RE
, Acu
te D
ecom
pen
sate
d H
eart
Fai
lure
Reg
istr
y; A
F, a
tria
l fib
rilla
tion;
AH
, Ad
vent
ist
Hea
lth O
ff- th
e- sh
elf m
odel
; AM
I, ac
ute
myo
card
ial i
nfar
ctio
n; C
AB
G, c
oron
ary
arte
ry b
ypas
s gr
aftin
g; C
ar, c
ard
iac-
rela
ted
; CH
AD
S2,
Con
gest
ive
hear
t fa
ilure
, Hyp
erte
nsio
n, A
ge, D
iab
etes
, pre
viou
s S
trok
e/tr
ansi
ent
isch
emic
att
ack;
CH
AD
S2-
VAS
c, c
onge
stiv
e he
art
failu
re, h
yper
tens
ion,
age
≥ 7
5 ye
ars,
dia
bet
es
mel
litus
, str
oke
or t
rans
ient
isch
emic
att
ack
(TIA
), va
scul
ar d
isea
se, a
ge 6
5 to
74
year
s, s
ex c
ateg
ory;
CM
S, C
ente
rs fo
r M
edic
are
and
Med
icai
d S
ervi
ces;
CR
SS
, CA
BG
Rea
dm
issi
on R
isk
Sco
re; d
, day
s; d
ev, d
evel
opm
ent;
FI
M, m
otor
and
cog
nitiv
e Fu
nctio
nal I
ndep
end
ence
Mea
sure
; GR
AC
E, G
lob
al R
egis
try
of A
cute
Cor
onar
y E
vent
s; H
F, h
eart
failu
re; H
FpE
F, h
eart
failu
re w
ith p
rese
rved
eje
ctio
n fr
actio
n; H
LT, H
osm
er- L
emes
how
tes
t;
HO
SP
ITA
L, H
emog
lob
in le
vel,
dis
char
ged
from
Onc
olog
y, S
odiu
m le
vel,
Pro
ced
ure
dur
ing
adm
issi
on, I
ndex
ad
mis
sion
Typ
e, A
dm
issi
on, L
engt
h of
sta
y; H
VD
, hea
rt v
alve
dis
ease
; IC
D, i
mp
lant
able
car
dio
vert
er d
efib
rilla
tor;
LA
CE
, Len
gth
of s
tay,
acu
ity o
f the
Ad
mis
sion
, Com
orb
idity
of t
he p
atie
nt a
nd E
mer
genc
y d
epar
tmen
t us
e in
the
dur
atio
n of
6 m
onth
s b
efor
e ad
mis
sion
; NA
, not
ap
plic
able
; NR
, not
rep
orte
d; O
, E, o
bse
rved
, exp
ecte
d;
PAR
R-3
0, P
atie
nts
at R
isk
of R
e- ad
mis
sion
with
in 3
0 d
ays;
PC
I, p
ercu
tane
ous
coro
nary
inte
rven
tion;
plo
t, c
alib
ratio
n p
lot;
RE
AD
MIT
S, R
enal
Fun
ctio
n, E
leva
ted
Bra
in N
atriu
retic
Pep
tide,
Age
, Dia
bet
es M
ellit
us, N
onm
ale
Sex
, Int
erve
ntio
n w
ith T
imel
y P
ercu
tane
ous
Cor
onar
y In
terv
entio
n, a
nd L
ow S
ysto
lic B
lood
Pre
ssur
e; S
ILV
ER
- AM
I, C
omp
r ehe
nsiv
e E
valu
atio
n of
Ris
k Fa
ctor
s in
Old
er P
atie
nts
with
AM
I; S
TS, S
ocie
ty o
f Tho
raci
c; S
TS,
Soc
iety
of T
hora
cic;
STS
PR
OM
, Soc
iety
of T
hora
cic
Sur
geon
s P
red
icte
d R
isk
of M
orta
lity;
TA
VR
, tra
nsca
thet
er a
ortic
val
ve r
epla
cem
ent;
val
, val
idat
ion.
Tab
le 2
C
ontin
ued
on October 20, 2021 by guest. P
rotected by copyright.http://bm
jopen.bmj.com
/B
MJ O
pen: first published as 10.1136/bmjopen-2020-047576 on 17 A
ugust 2021. Dow
nloaded from

14 Van Grootven B, et al. BMJ Open 2021;11:e047576. doi:10.1136/bmjopen-2020-047576
Open access
disease and hospital characteristics (n=128), demo-graphic data (n=128), laboratory values (n=97) and medical history characteristics (n=51). Age (n=47), pres-ence of diabetes (n=26), insurance status (n=24), length of stay (n=28) and gender (n=23) were the most preva-lent predictors. There was little consistency in the defini-tion of predictors, and most studies did not report how they were measured.
Only 18 predictors were similarly defined in multiple studies and could be pooled for the outcome readmis-sion at 30 days (figure 4, online supplemental table 2A and online supplemental figures 9–26). The coefficients of four predictors demonstrated a consistent and signif-icant association across the different samples: chronic obstructive pulmonary disease (COPD), HF or history of HF, and valvular disease. The coefficients of 11 predic-tors demonstrated an overall significant association, that is, age, female gender, arrhythmias, chronic lung disease, diabetes mellitus, cerebrovascular disease, cardiovascular accident, anaemia, peripheral vascular disease, urgent
admission and infection, but this was not consistent across the samples and the prediction intervals were not signifi-cant. The effect of these predictors was mostly smaller in the HF samples.
The coefficients for most predictors could not be pooled because they had different definitions, cut- off values or reference categories. However, renal disease, including dialysis, a longer length of stay, creatinine, NT- proBNP (N- Terminal- PRO hormone Brain Natriuretic Peptide) and previous hospital admissions demonstrated a consis-tent association with readmissions.
DISCUSSIONIn this systematic review, we included 60 studies that reported the results from 81 separate clinical risk predic-tion models and 766 risk predictors for unplanned read-mission in patients with acute heart disease. We found some promising prediction models, however, no clin-ical model demonstrated good discrimination (ie, c- sta-tistic >0.8) in independently externally validated cohorts, regardless of the underlying patient populations. GRACE was the only model that demonstrated adequate discrimi-nation in multiple cohorts in patients with acute coronary syndromes36 37 and HF.37 There was little consistency in the measurement of risk predictors.
The results of our review are in line with previous systematic reviews which have mainly focused on samples of patients with HF, AMI or focused on generic predic-tion models. All reviews confirm that the discrimination is generally low. Our review confirms the importance of previous HF5 6 and previous hospital admissions6 8 as consistent predictors of the risk of readmission. In addi-tion, two prevalent comorbidities, COPD and valve disease, were also consistent predictors across the different popu-lations. Other reviews also identified the importance of age, gender, comorbidities and certain laboratory values. These were also significant in our review but the associa-tion was not always consistent across the different popula-tions or heterogeneously measured making comparisons difficult. As a result, no clinical risk prediction model or set of predictors that is relevant for different populations of heart disease could be identified.
Our review focused specifically on prediction models with a clinical presentation that can be used in daily prac-tice, for example, risk scores or nomograms. These simple models do not consider interactions between predictor values or non- linear link functions in their predictions. This may partially explain the poor discrimination.39 Using web applications or electronic patient records to run more complex prediction algorithms can likely offer a solution for future models. A recent systematic review observed an average c- statistic of 0.74 for models using electronic patient records and machine learning algo-rithms.11 Our review included 11 studies18 29 32 36 37 40–45 that developed or validated electronic tools for risk prediction and their discrimination ranged between 0.59 and 0.77.
Figure 3 Meta- analysis of prediction models. Random- effect models were used to pool similar models reported in independent cohorts. For the HOSPITAL score, the discriminations for the HF and AMI samples were similar (0.65 and 0.64). For GRACE, the discriminations for the AMI and reinfarction samples were similar (0.77 and 0.74), and was higher for the HF sample (0.83). Only GRACE demonstrated adequate discrimination in external cohorts. AMI, acute myocardial infarction; CMS, Centers for Medicare and Medicaid Services; CF, heart failure.Abbreviations: CMS = Centers for Medicare and Medicaid Services; AMI = Acute Myocardial Infarction; HF = Heart Failure; HOSPITAL = Hemoglobin level, discharged from Oncology, Sodium level, Procedure during admission, Index admission Type, Admission, Length of stay; GRACE = Global Registry of Acute Coronary Events; LACE = length of stay (L), acuity of the admission (A), comorbidity of the patient (C) and emergency department use in the duration of 6 months before admission.
on October 20, 2021 by guest. P
rotected by copyright.http://bm
jopen.bmj.com
/B
MJ O
pen: first published as 10.1136/bmjopen-2020-047576 on 17 A
ugust 2021. Dow
nloaded from

15Van Grootven B, et al. BMJ Open 2021;11:e047576. doi:10.1136/bmjopen-2020-047576
Open access
However, these electronic tools were mostly derived from score charts and nomograms.
There are also concerns about the generalisability of the prediction models. The median age of patients included in the samples was 68 years (IQR=65–75). However, older and frail patients suffer more multimorbidity and geri-atric syndromes, and the distribution of predictor and outcome values will also be different than in younger samples. It is therefore unlikely that the majority of the current models will hold their value in daily clinical prac-tice where there is a high prevalence of older patients. Only eight studies18 20 27 46–50 included one or more geri-atric risk factors (eg, physical performance, dementia) as predictors for readmission. The performance of models including geriatric conditions was similar to models without these conditions. This might be explained by the relative young mean age of the samples in our review. Mahmoudi et al11 reported that functional and frailty status are important predictors, but were only included in a small number of studies. Frailty was not identified in any of the models in our review. It might be valuable to examine the additive value of these predictors in predic-tion models for patients with heart disease.
We observed high RoB in almost all clinical risk predic-tion models (98.8%). This was mainly because the cali-bration was lacking or not fully reported (eg, only p value of Hosmer- Lemeshow test). Furthermore, most studies performed retrospective data analyses or used data from
existing sources. However, our results demonstrate that studies using these data sources had the lowest c- statistic, and that the c- statistic decreased when more predictors were tested. Databases often have missing data, misclas-sification bias and random measurement error, which likely explains their average poor performance.51 Only the SILVER- AMI (Comprehensive Evaluation of Risk Factors in Older Patients with AMI) study18 demonstrated low RoB on all domains. However, their readmission risk calculator for older patients with AMI only discriminated modestly (c- statistic=0.65).
Our review shows the current state- of- the art of risk prediction in patients with acute heart disease. The timely identification of patients with acute heart disease at risk of readmission remains challenging with the prediction models identified in this systematic review. Therefore, further research in risk prediction remains important and some recommendations for further research can be derived from this review. First, consis-tency is needed in the definition and measurement of predictors. More homogeneity might improve the identification of important predictors and their effect on readmission. Based on our insights, we believe that models could be improved by incorporating some key predictors, that is, age, gender, comorbidity scores (or at least heart failure, COPD, cardiovascular disease, diabetes mellitus), admission status, readmission history and the geriatric profile (eg, functional status, cognitive
Figure 4 Predictors of unplanned hospital readmission. The plot provides an overview of the random- effects meta- analyses that were performed for predictors who were similarly defined for the outcome unplanned hospital readmission at 30- day follow- up. See online supplemental table 2A and online supplemental figures 9–26 for more details. CABG, coronary artery bypass grafting; COPD, chronic obstructive pulmonary disease; PCI, percutaneous coronary intervention.
on October 20, 2021 by guest. P
rotected by copyright.http://bm
jopen.bmj.com
/B
MJ O
pen: first published as 10.1136/bmjopen-2020-047576 on 17 A
ugust 2021. Dow
nloaded from

16 Van Grootven B, et al. BMJ Open 2021;11:e047576. doi:10.1136/bmjopen-2020-047576
Open access
status). Because there are a still a large number of potential predictors, a large sample size is needed to estimate the coefficients with sufficient precision, and to prevent against overfitting the models. Some selec-tion of predictors may still be warranted, and penalised techniques (eg, lasso regression) should be preferred over traditional selection based on p values. Second, the results suggest that multiple predictors are associ-ated with readmissions regardless of the underlying population. Therefore, attention might be shifted from developing new risk prediction models to updating and externally validating existing prediction models in different populations with heart disease. For example, the Adventist Health Off- the- shelf model28 showed high discrimination rates in both the development (0.86) and the validation cohorts (0.85). External vali-dation is recommended to examine the generalisability of this model in other settings. In addition, the AMI READMITS (Acute Myocardial Infarction Renal Func-tion, Elevated Brain Natriuretic Peptide, Age, Diabetes Mellitus, Nonmale Sex, Intervention with Timely Percu-taneous Coronary Intervention, and Low Systolic Blood Pressure) score,19 full- stay AMI readmission model,19 pre- PCI model,52 motor and cognitive Functional Independence Measure (FIM),53 READMIT,54 30- day readmission model of Huynh et al,48 and the model of Engoren et al55 were examined in one study and showed reasonable c- statistics in the development (0.68–0.82) and validation cohorts (0.64–0.78). For these studies, model updating recalibration and external validation is recommended to improve the predictive performance and generalisability of these prediction models. Third, the applicability of current prediction models in daily practice is an important concern as most models had poor performance, were not replicated and had high RoB. More high- quality studies are needed that evaluate the discrimination, calibration and clinical usefulness. To limit the RoB as much as possible, future studies should adhere to the relevant reporting guidelines56 and could use PROBAST16 as a guidance to plan their study. Fourth, more complex models integrated in elec-tronic patient records may results in better predictions.
LimitationsAlthough we performed an extensive literature search, we might have missed some eligible studies, particularly those published in non- English languages. We were able to perform meta- analysis for predictors that were often (≥5 models) reported. However, it might be possible that some less frequently mentioned predictors (eg, geriatric predictors) are a valuable addition in clinical practice. The review included a large number of results and statis-tical tests which may result in an inflated alpha error. The meta- regression identified that models with less predictors had a better discrimination, but this could also be explained by overfitting models; this could not be tested.
CONCLUSIONA large number of clinical models have recently been developed. Although some models are promising as they demonstrated adequate to good discrimination, no model can currently be recommended for clinical prac-tice. The lack of independently validated studies, high RoB and low consistency in measured predictors limit their applicability. Model updating and external valida-tion is urgently needed.
Author affiliations1Department of Public Health and Primary Care, Katholieke Universiteit Leuven, Leuven, Belgium2Research Foundation Flanders, Brussel, Belgium3Center of Expertise Urban Vitality, Faculty of Health, Amsterdam University of Applied Sciences, Amsterdam, Netherlands4Faculty of Science, Vrije Universiteit Amsterdam, Amsterdam, Noord- Holland, Netherlands5Faculty of Science, Amsterdam UMC Locatie AMC, Amsterdam, Netherlands6Medical Library, Amsterdam UMC Location AMC, Amsterdam, North Holland, Netherlands7Department of Public Health and Primary Care, KU Leuven – University of Leuven, Leuven, Belgium8Department of Public Health, University of Basel, Basel, Switzerland9Department of Geriatric Medicine, University Hospitals Leuven, Leuven, Belgium10Department of Public Health and Primary Care, University Hospitals Leuven, Leuven, Belgium11Department of Geriatric Medicine, KU Leuven – University of Leuven, Leuven, Belgium
Twitter Patricia Jepma @Patricia_Jepma and Mieke Deschodt @mieke_deschodt
Contributors BVG and PJ had full access to all the data in the study and take responsibility for the integrity of the data and the accuracy of the data analysis. BVG and PJ contributed equally as first authors. Concept and design: All authors. Acquisition, analysis or interpretation of data: BVG, PJ, CR, ML, JD. Drafting the manuscript: BVG, PJ. Critical revision of the manuscript: All authors. Analysis: BVG, PJ. Supervision: BB.
Funding This work was partly supported by the Research Foundation Flanders (FWO) fellowship grant (grant number 1165518N (BVG)), and by the Dutch Research Council (NWO) (grant number 023.009.036 (PJ)). The funders had no role in the design and conduct of the study; collection, management, analysis and interpretation of the data; preparation, review or approval of the manuscript; and decision to submit the manuscript for publication.
Competing interests None declared.
Patient consent for publication Not required.
Provenance and peer review Not commissioned; externally peer reviewed.
Data availability statement All data relevant to the study are included in the article or uploaded as supplementary information.
Supplemental material This content has been supplied by the author(s). It has not been vetted by BMJ Publishing Group Limited (BMJ) and may not have been peer- reviewed. Any opinions or recommendations discussed are solely those of the author(s) and are not endorsed by BMJ. BMJ disclaims all liability and responsibility arising from any reliance placed on the content. Where the content includes any translated material, BMJ does not warrant the accuracy and reliability of the translations (including but not limited to local regulations, clinical guidelines, terminology, drug names and drug dosages), and is not responsible for any error and/or omissions arising from translation and adaptation or otherwise.
Open access This is an open access article distributed in accordance with the Creative Commons Attribution Non Commercial (CC BY- NC 4.0) license, which permits others to distribute, remix, adapt, build upon this work non- commercially, and license their derivative works on different terms, provided the original work is properly cited, appropriate credit is given, any changes made indicated, and the use is non- commercial. See: http:// creativecommons. org/ licenses/ by- nc/ 4. 0/.
on October 20, 2021 by guest. P
rotected by copyright.http://bm
jopen.bmj.com
/B
MJ O
pen: first published as 10.1136/bmjopen-2020-047576 on 17 A
ugust 2021. Dow
nloaded from

17Van Grootven B, et al. BMJ Open 2021;11:e047576. doi:10.1136/bmjopen-2020-047576
Open access
ORCID iDsBastiaan Van Grootven http:// orcid. org/ 0000- 0002- 3182- 573XPatricia Jepma http:// orcid. org/ 0000- 0003- 1271- 6869
REFERENCES 1 Virani SS, Alonso A, Benjamin EJ, et al. Heart disease and stroke
statistics-2020 update: a report from the American heart association. Circulation 2020;141:e139–596.
2 Shipe ME, Deppen SA, Farjah F, et al. Developing prediction models for clinical use using logistic regression: an overview. J Thorac Dis 2019;11:S574–84.
3 Smith LN, Makam AN, Darden D, et al. Acute myocardial infarction readmission risk prediction models: a systematic review of model performance. Circ Cardiovasc Qual Outcomes 2018;11:e003885.
4 Di Tanna GL, Wirtz H, Burrows KL, et al. Evaluating risk prediction models for adults with heart failure: a systematic literature review. PLoS One 2020;15:e0224135.
5 Mahajan SM, Heidenreich P, Abbott B, et al. Predictive models for identifying risk of readmission after index hospitalization for heart failure: a systematic review. Eur J Cardiovasc Nurs 2018;17:675–89.
6 O'Connor M, Murtaugh CM, Shah S, et al. Patient characteristics predicting readmission among individuals hospitalized for heart failure. Med Care Res Rev 2016;73:3–40.
7 Rahimi K, Bennett D, Conrad N, et al. Risk prediction in patients with heart failure: a systematic review and analysis. JACC Heart Fail 2014;2:440–6.
8 Betihavas V, Davidson PM, Newton PJ, et al. What are the factors in risk prediction models for rehospitalisation for adults with chronic heart failure? Aust Crit Care 2012;25:31–40.
9 Desai MM, Stauffer BD, Feringa HHH, et al. Statistical models and patient predictors of readmission for acute myocardial infarction: a systematic review. Circ Cardiovasc Qual Outcomes 2009;2:500–7.
10 Ross JS, Mulvey GK, Stauffer B, et al. Statistical models and patient predictors of readmission for heart failure: a systematic review. Arch Intern Med 2008;168:1371–86.
11 Mahmoudi E, Kamdar N, Kim N, et al. Use of electronic medical records in development and validation of risk prediction models of hospital readmission: systematic review. BMJ 2020;369:m958.
12 Zhou H, Della PR, Roberts P, et al. Utility of models to predict 28- day or 30- day unplanned spital readmissions: an updated systematic review. BMJ Open 2016;6:e011060.
13 Song F, Sheldon TA, Sutton AJ, et al. Methods for exploring heterogeneity in meta- analysis. Eval Health Prof 2001;24:126–51.
14 Moher D, Liberati A, Tetzlaff J, et al. Preferred reporting items for systematic reviews and meta- analyses: the PRISMA statement. PLoS Med 2009;6:e1000097.
15 Distiller. Distiller systematic review software. Available: https://www. evidencepartners. com/ products/ distillersr- systematic- review- software/ [Accessed 25 Aug 2020].
16 Wolff RF, Moons KGM, Riley RD, et al. PROBAST: a tool to assess the risk of bias and applicability of prediction model studies. Ann Intern Med 2019;170:51–8.
17 Newcombe RG. Confidence intervals for an effect size measure based on the mann- whitney statistic. part 2: asymptotic methods and evaluation. Stat Med 2006;25:559–73.
18 Dodson JA, Hajduk AM, Murphy TE, et al. Thirty- day readmission risk model for older adults hospitalized with acute myocardial infarction. Circ Cardiovasc Qual Outcomes 2019;12:e005320.
19 Nguyen OK, Makam AN, Clark C, et al. Predicting 30- Day Myocardial Infarction: The AMI "READMITS" (Renal Function, elevated brain natriuretic peptide, age, diabetes mellitus, nonmale sex, intervention with timely percutaneous coronary intervention, and low systolic blood pressure) score. J Am Heart Assoc 2018;7:e008882.
20 Krumholz HM, Lin Z, Drye EE, et al. An administrative claims measure suitable for profiling hospital performance based on 30- day all- cause readmission rates among patients with acute myocardial infarction. Circ Cardiovasc Qual Outcomes 2011;4:243–52.
21 Ahmad FS, French B, Bowles KH, et al. Incorporating patient- centered factors into heart failure readmission risk prediction: a mixed- methods study. Am Heart J 2018;200:75–82.
22 Amarasingham R, Moore BJ, Tabak YP, et al. An automated model to identify heart failure patients at risk for 30- day readmission or death using electronic medical record data. Med Care 2010;48:981–8.
23 Au AG, McAlister FA, Bakal JA, et al. Predicting the risk of unplanned readmission or death within 30 days of discharge after a heart failure hospitalization. Am Heart J 2012;164:365–72.
24 Cox ZL, Lai P, Lewis CM, et al. Customizing national models for a medical center's population to rapidly identify patients at high risk
of 30- day all- cause Hospital readmission following a heart failure hospitalization. Heart Lung 2018;47:290–6.
25 Frizzell JD, Liang L, Schulte PJ, et al. Prediction of 30- day all- cause readmissions in patients hospitalized for heart failure: comparison of machine learning and other statistical approaches. JAMA Cardiol 2017;2:204–9.
26 Hammill BG, Curtis LH, Fonarow GC, et al. Incremental value of clinical data beyond claims data in predicting 30- day outcomes after heart failure hospitalization. Circ Cardiovasc Qual Outcomes 2011;4:60–7.
27 Keenan PS, Normand S- LT, Lin Z, et al. An administrative claims measure suitable for profiling hospital performance on the basis of 30- day all- cause readmission rates among patients with heart failure. Circ Cardiovasc Qual Outcomes 2008;1:29–37.
28 Reed J, Bokovoy J, Doram K. Unplanned readmissions after hospital discharge among heart failure patients at risk for 30- day readmission using an administrative dataset and “off the shelf” readmission models. Internet J Cardiovasc Res 2014;9:07–15.
29 Yazdan- Ashoori P, Lee SF, Ibrahim Q, et al. Utility of the lace index at the bedside in predicting 30- day readmission or death in patients hospitalized with heart failure. Am Heart J 2016;179:51–8.
30 Formiga F, Masip J, Chivite D, et al. Applicability of the heart failure readmission risk score: a first European study. Int J Cardiol 2017;236:304–9.
31 Hummel SL, Katrapati P, Gillespie BW, et al. Impact of prior admissions on 30- day readmissions in medicare heart failure inpatients. Mayo Clin Proc 2014;89:623–30.
32 Sudhakar S, Zhang W, Kuo Y- F, et al. Validation of the readmission risk score in heart failure patients at a tertiary hospital. J Card Fail 2015;21:885–91.
33 Rana S, Tran T, Luo W, et al. Predicting unplanned readmission after myocardial infarction from routinely collected administrative hospital data. Aust Health Rev 2014;38:377–82.
34 Ibrahim AM, Koester C, Al- Akchar M, et al. Hospital score, lace index and lace+ index as predictors of 30- day readmission in patients with heart failure. BMJ Evid Based Med 2020;25:166-167.
35 Burke RE, Schnipper JL, Williams MV, et al. The hospital score predicts potentially preventable 30- day readmissions in conditions targeted by the hospital readmissions reduction program. Med Care 2017;55:285–90.
36 Chotechuang Y, Phrommintikul A, Muenpa R, et al. The prognostic utility of grace risk score in predictive cardiovascular event rate in STEMI patients with successful fibrinolysis and delay intervention in non PCI- capable Hospital: a retrospective cohort study. BMC Cardiovasc Disord 2016;16:212.
37 Raposeiras- Roubín S, Abu- Assi E, Cambeiro- González C, et al. Mortality and cardiovascular morbidity within 30 days of discharge following acute coronary syndrome in a contemporary European cohort of patients: how can early risk prediction be improved? the six- month grace risk score. Rev Port Cardiol 2015;34:383–91.
38 Wang H, Robinson RD, Johnson C, et al. Using the lace index to predict hospital readmissions in congestive heart failure patients. BMC Cardiovasc Disord 2014;14:97.
39 Kerr KF, Pepe MS. Joint modeling, covariate adjustment, and interaction: contrasting notions in risk prediction models and risk prediction performance. Epidemiology 2011;22:805–12.
40 Lahewala S, Arora S, Patel P, et al. Atrial fibrillation: Utility of CHADS2
and CHA2DS2- VASc scores as predictors of readmission, mortality and resource utilization. Int J Cardiol 2017;245:162–7.
41 Rosenblum JM, Lovasik BP, Hunting JC, et al. Predicted risk of mortality score predicts 30- day readmission after coronary artery bypass grafting. Gen Thorac Cardiovasc Surg 2019;67:661–8.
42 Zywot A, Lau CSM, Glass N, et al. Preoperative scale to determine all- cause readmission after coronary artery bypass operations. Ann Thorac Surg 2018;105:1086–93.
43 Brown JR, Jacobs JP, Alam SS, et al. Utility of biomarkers to improve prediction of readmission or mortality after cardiac surgery. Ann Thorac Surg 2018;106:1294–301.
44 Tam DY, Fang J, Tran A, et al. A clinical risk scoring tool to predict readmission after cardiac surgery: an Ontario administrative and clinical population database study. Can J Cardiol 2018;34:1655–64.
45 Khera S, Kolte D, Deo S, et al. Derivation and external validation of a simple risk tool to predict 30- day hospital readmissions after transcatheter aortic valve replacement. EuroIntervention 2019;15:155–63.
46 Asche CV, Ren J, Kirkness CS. A prediction model to identify acute myocardial infarction (AMI) patients at risk for 30- day readmission. SCSC 2016;1:1–8 https:// dl. acm. org/ doi/
47 Atzema CL, Dorian P, Fang J, et al. A clinical decision instrument to predict 30- day death and cardiovascular hospitalizations after an emergency department visit for atrial fibrillation: the atrial
on October 20, 2021 by guest. P
rotected by copyright.http://bm
jopen.bmj.com
/B
MJ O
pen: first published as 10.1136/bmjopen-2020-047576 on 17 A
ugust 2021. Dow
nloaded from

18 Van Grootven B, et al. BMJ Open 2021;11:e047576. doi:10.1136/bmjopen-2020-047576
Open access
fibrillation in the emergency room, part 2 (AFTER2) study. Am Heart J 2018;203:85–92.
48 Huynh Q, Negishi K, De Pasquale CG, et al. Validation of predictive score of 30- day hospital readmission or death in patients with heart failure. Am J Cardiol 2018;121:322–9.
49 Li L, Baek J, Jesdale BM, et al. Predicting 30- day mortality and 30- day re- hospitalization risks in Medicare patients with heart failure discharged to skilled nursing facilities: development and validation of models using administrative data. J Nurs Home Res Sci 2019;5:60–7.
50 Sanchez CE, Hermiller JB, Pinto DS, Jr PDS, et al. Predictors and risk calculator of early unplanned hospital readmission following contemporary self- expanding transcatheter aortic valve replacement from the STS/ACC TVT registry. Cardiovasc Revasc Med 2020;21:263–70.
51 Jordan K, Moons K. Electronic healthcare records and prognosis research. In: Prognosis research in healthcare. concepts, methods and impact. Oxford: Oxford University press, 2019.
52 Wasfy JH, Rosenfield K, Zelevinsky K, et al. A prediction model to identify patients at high risk for 30- day readmission after percutaneous coronary intervention. Circ Cardiovasc Qual Outcomes 2013;6:429–35.
53 Kitamura M, Izawa KP, Taniue H, et al. Relationship between activities of daily living and readmission within 90 days in hospitalized elderly patients with heart failure. Biomed Res Int 2017;2017:7420738.
54 Ferraris VA, Ferraris SP, Harmon RC, et al. Risk factors for early Hospital readmission after cardiac operations. J Thorac Cardiovasc Surg 2001;122:278–86.
55 Engoren M, Habib RH, Dooner JJ, et al. Use of genetic programming, logistic regression, and artificial neural nets to predict readmission after coronary artery bypass surgery. J Clin Monit Comput 2013;27:455–64.
56 et alCollins G, Reitsma J, Altman D. Transparent reporting of a multivariable prediction model for individual prognosis or diagnosis (TRIPOD): the TRIPOD statement, 2020. Available: https://www. equator- network. org/ reporting- guidelines/ tripod- statement/ [Accessed 20 Aug 2020].
57 Moretti C, D'Ascenzo F, Omedè P, et al. Thirty- day readmission rates after PCI in a metropolitan center in Europe: incidence and impact on prognosis. J Cardiovasc Med 2015;16:238–45.
58 Cediel G, Sandoval Y, Sexter A, et al. Risk estimation in type 2 myocardial infarction and myocardial injury: the tarraco risk score. Am J Med 2019;132:217–26.
59 Hilbert JP, Zasadil S, Keyser DJ, et al. Using decision trees to manage Hospital readmission risk for acute myocardial infarction, heart failure, and pneumonia. Appl Health Econ Health Policy 2014;12:573–85.
60 Kini V, Peterson PN, Spertus JA, et al. Clinical model to predict 90- day risk of readmission after acute myocardial infarction. Circ Cardiovasc Qual Outcomes 2018;11:e004788.
61 Benuzillo J, Caine W, Evans RS, et al. Predicting readmission risk shortly after admission for CABG surgery. J Card Surg 2018;33:163–70.
62 Deo SV, Raza S, Altarabsheh SE, et al. Risk calculator to predict 30- day readmission after coronary artery bypass: a strategic decision support tool. Heart Lung Circ 2019;28:1896–903.
63 Lancey R, Kurlansky P, Argenziano M, et al. Uniform standards do not apply to readmission following coronary artery bypass surgery: a multi- institutional study. J Thorac Cardiovasc Surg 2015;149:e1:850–7.
64 Zitser- Gurevich Y, Simchen E, Galai N, et al. Prediction of readmissions after CABG using detailed follow- up data: the Israeli CABG study (ISCAB). Med Care 1999;37:625–36.
65 Bardhan I, Oh J, Zhiqiang Z, et al. Predictive analytics for readmission of patients with congestive heart failure. Information Systems Research 2015;26:19–39.
66 Betihavas V, Frost SA, Newton PJ, et al. An absolute risk prediction model to determine unplanned cardiovascular readmissions for adults with chronic heart failure. Heart Lung Circ 2015;24:1068–73.
67 Delgado JF, Ferrero Gregori A, Fernández LM, et al. Patient- associated predictors of 15- and 30- day readmission after hospitalization for acute heart failure. Curr Heart Fail Rep 2019;16:304–14.
68 Leong KTG, Wong LY, Aung KCY, et al. Risk stratification model for 30- day heart failure readmission in a multiethnic South East Asian community. Am J Cardiol 2017;119:1428–32.
69 Lim N- K, Lee SE, Lee H- Y, et al. Risk prediction for 30- day heart failure- specific readmission or death after discharge: data from the Korean acute heart failure (KorAHF) registry. J Cardiol 2019;73:108–13.
70 Salah K, Kok WE, Eurlings LW, et al. A novel discharge risk model for patients hospitalised for acute decompeNsated heart failure incorporating N- terminal pro- B- type natriuretic peptide levels: a European coLlaboration on acute decompensated heart failure: ELAN- HF score. Heart 2014;100:115–25.
71 Tan B- Y, Gu J- Y, Wei H- Y, et al. Electronic medical record- based model to predict the risk of 90- day readmission for patients with heart failure. BMC Med Inform Decis Mak 2019;19:193.
72 Wang LE, Shaw PA, Mathelier HM, et al. Evaluating risk- prediction models using data from electronic health records. Ann Appl Stat 2016;10:286–304.
73 Disdier Moulder MP, Larock JM, Garofoli A, et al. Family help with medication management: a predictive marker for early readmission. Mayo Clin Proc Innov Qual Outcomes 2017;1:211–8.
74 Minges KE, Herrin J, Fiorilli PN, et al. Development and validation of a simple risk score to predict 30- day readmission after percutaneous coronary intervention in a cohort of medicare patients. Catheter Cardiovasc Interv 2017;89:955–63.
75 Pack QR, Priya A, Lagu T, et al. Development and validation of a predictive model for short- and medium- term hospital readmission following heart valve surgery. J Am Heart Assoc 2016;5:e003544.
76 Oliver- McNeil S, Templin TN, Haines DE. Preoperative ICD risk score variables predict 30- day readmission after implantable cardioverter defibrillator implantation in patients with heart failure. Heart Lung 2016;45:29–33.
77 Barnett SD, Sarin E, Kiser AC, et al. Examination of a proposed 30- day readmission risk score on discharge location and cost. Ann Thorac Surg 2020;109:1797–803.
78 Espinoza J, Camporrontondo M, Vrancic M, et al. 30- day readmission score after cardiac surgery. Clin Trials Regul Sci Cardiol 2016;20:1–5.
79 Kilic A, Magruder JT, Grimm JC, et al. Development and validation of a score to predict the risk of readmission after adult cardiac operations. Ann Thorac Surg 2017;103:66–73.
80 Stuebe J, Rydingsward J, Lander H, et al. A pragmatic preoperative prediction score for nonhome discharge after cardiac operations. Ann Thorac Surg 2018;105:1384–91.
on October 20, 2021 by guest. P
rotected by copyright.http://bm
jopen.bmj.com
/B
MJ O
pen: first published as 10.1136/bmjopen-2020-047576 on 17 A
ugust 2021. Dow
nloaded from