impact of front- and rear-stage high pressure compressor
TRANSCRIPT

Article
Impact of Front- and Rear-Stage High PressureCompressor Deterioration on Jet Engine Performance †
Gerald Reitz ∗ ID and Jens Friedrichs
Institute of Jet Propulsion and Turbomachinery, Technische Universität Braunschweig,38108 Braunschweig, Germany; [email protected]* Correspondence: [email protected]; Tel.: +49-531-391-94200† This paper is an extended version of our paper published in Proceedings of the 17th International Symposium
on Transport Phenomena and Dynamics of Rotating Machinery (ISROMAC 2017).
Received: 22 January 2018; Accepted: 16 May 2018; Published: 23 May 2018�����������������
Abstract: Current civil aviation is characterized by rising cost and competitive pressure, whichis partly passed to the MRO (Maintenance, Repair and Overhaul) companies. To improve themaintenance, condition-based maintenance is established, which is characterized by tailoredmaintenance actions for each part of the jet engine, depending on the individual engine historyand operating conditions. Thereby, prediction models help engineers to authorize maintenanceactions as effectively as possible. This paper will help to improve these prediction models. Therefore,the influence of specific deterioration of a high pressure compressor (HPC) to jet engine performanceparameters such as exhaust gas temperature (EGT) and specific fuel consumption (SFC) will beinvestigated. For this purpose, computational fluid dynamic (CFD) calculations of deteriorated HPCgeometries are carried out and serve as a basis to scale the reference HPC performance characteristicsto deteriorated ones. To evaluate the changes in performance parameters, a modular performancesynthesis model is set up. In this model, the HPC map is exchanged with deteriorated ones. As aresult, the influence of geometric deviations to the design intent can be determined, and the MROcompanies are able to focus on the most relevant sections of the compressor blading.
Keywords: compressor deterioration; engine performance; condition-based maintenance
1. Introduction
During operation of a jet engine, deterioration occurs and continually reduces the engineperformance. As a result, the specific fuel consumption (SFC)and exhaust gas temperature (EGT)are increasing with on-wing time of the engine, which also leads to an increase in direct operatingcosts (DOCs). When the EGT reaches a given limit, the engine has to be removed from the airplaneand to be overhauled by an MRO (Maintenance, Repair and Overhaul) company. For a long time thetime-based maintenance was standard procedure of repairing an engine. Thereby, no special attentionto the operational and maintenance history is given, and the engine components receive more or lessstandard repairs. Time-based maintenance is now being replaced by condition-based maintenance.The condition-based maintenance is characterized by the requirement of a detailed prediction and anexamination of the engine components and its piece parts at the incoming inspection of the overhauland tailored maintenance actions, depending on the engine history and condition.
For further improvement of the condition-based maintenance, the influence of each enginecomponent and its piece parts to the engine performance needs to be known. Using the example of thehigh pressure compressor (HPC) , the aerodynamics of its individual blading has to be determinedto predict the changes of the resulting compressor map. Thus, the MRO companies would be able to
Int. J. Turbomach. Propuls. Power 2018, 3, 15; doi:10.3390/ijtpp3020015 www.mdpi.com/journal/ijtpp

Int. J. Turbomach. Propuls. Power 2018, 3, 15 2 of 13
repair and rearrange the blading in such that the customer demands for the next planned operationare met as cost-effectively as possible, while respecting the given limits of the Engine Manual (EM).
In order to determine the geometric variances of deteriorated HPC airfoils, a multitude of HPCairfoils has been digitized. This paper focuses on modified front and rear stages of the HPC. Therefore,more than two complete rotor bladings of operated jet engines [1] and additionally 40 stator vanes foreach of the analyzed HPC stages have been digitized by a structured light 3D-scanner in conjunction witha photogrammetric system. To determine manufacturing tolerances, 30 new airfoils of each analyzedcompressor row have been digitized. Afterward, the airfoils were analyzed with respect to their geometricparameters by an in-house programmed algorithm [2]. Subsequently, aerodynamic sensitivities of thegeometric properties were investigated using computational fluid dynamic (CFD)-methods. Therefore,extensive Design of Experiments (DoE) for the front and rear stages have been carried out [3,4].To reduce the number of independent geometric properties, the geometric parameters have previouslybeen scanned for possible correlations [5].
This paper takes the next step of this field of research and focuses on the changes of the jet engineperformance due to compressor deterioration. Therefore, a modular performance synthesis modelof a popular two-shaft bypass jet engine was set up and validated by test cell data. To analyze theimpact of deteriorated HPC bladings, the geometric parameters of front and rear stages of the HPCare modified and implemented in a full HPC model. Thereby, results of the previous DoEs [3,4] wereused to change the geometric parameters of the corresponding compressor stages to achieve stagesetups with low- and high-stage efficiency. Therefore, the leading edge geometry, the stagger angle,and the profile camber were modified. The aerodynamics of the HPC is simulated using methods ofCFD. With the deteriorated throttle lines, the reference HPC map is scaled and implemented in theperformance model of the jet engine. Thus, it is possible to identify the more relevant HPC stage inorder to predict the possible performance range (by repairing the stage) and to analyze the interactionsbetween the engine components.
2. Generation of Deteriorated Stage Setups
To determine the aerodynamic sensitivities to the geometric parameters of the regardedcompressor stages, two extensive DoEs were created [3,4]. The geometric properties of the rotorblades and stator vanes were modified in a range of ±1.5σ (standard deviation of the deterioratedairfoils) around the new part mean value. The used standard deviation of the geometric propertieswas calculated by analyzing more than two HPC bladings [1]. Thereby, the geometric properties wereanalyzed on 19 profile sections of the airfoils. Afterward, for each profile section, the mean value andthe corresponding standard deviation were calculated. Generating the modified geometries, eachgeometric property was changed in a range of ±1.5σ homogeneously over the blade height.
The throttle lines of the modified stage geometries were simulated by methods of CFD. Afterward,these throttle lines were analyzed at a reference mass flow. The aerodynamic results such as efficiencyand pressure rise were used in conjunction with the corresponding geometric values to train ameta-model using the Kriging-Method [6]. After validating the prediction quality of the meta-model,the user is able to predict the aerodynamic performance of unknown geometric variations withoutusing further CFD calculations.
2.1. Front Stage Sensitivities
Using the trained meta-models, Pareto charts were used to identify the aerodynamic sensitivitiesto the geometric parameters. Therefore, all geometric properties were changed independentlyby about ±σ, and the aerodynamic performance parameters were calculated by the meta-model.The aerodynamic changes for one performance parameter, influenced independently by all geometricproperties successively, were summed and plotted in a Pareto chart. Figure 1a shows the Pareto chartfor the isentropic efficiency ηis of the front stage, analyzed at the reference mass flow. As can be seen,the most relevant geometric parameters are the leading edge thickness of the stator vane V tLE as well

Int. J. Turbomach. Propuls. Power 2018, 3, 15 3 of 13
asthe maximum profile camber of the rotor blade B Cmax and the leading edge thickness of the rotorblade B tLE. The accumulated impact of the three most important parameters is almost half of theoverall changes caused by 22 geometric properties.
(a) (b)
Figure 1. Front stage sensitivities of isentropic efficiency ηis. (a) Pareto chart of isentropic efficiency ηis
at the front stage. (b) Sensitivies of ηis to geometric changes at the front stage.
A closer look at the three dominating geometric properties is given in Figure 1a. Here, thedirection of the aerodynamic performance parameter changes caused by the geometric variations isshown. Black bars indicate an increased geometric property by σ and orange bars indicate decreasedvalues of the same amount. Thus, the geometric parameters vary symmetrically around the referencevalue, and an equal change of the isentropic efficiency ηis is expected. Thereby, bars above zeroindicate an increased value for the isentropic efficiency ηis and vice versa. This illustration is onlyvisualizing the directional dependency and its sensitivity of the isentropic efficiency ηis toward thegeometric property and not the magnitude of change. For the front stage, the isentropic efficiency ηisis increasing as leading edge thicknesses of the rotor blade B tLE and stator vane V tLE decrease and asthe maximum profile camber of the rotor blade B Cmax decreases.
2.2. Rear-Stage Sensitivities
A similar analysis was conducted for the rear stage. Figure 2a illustrates the Pareto chart for theisentropic efficiency ηis of the rear stage, analyzed at the reference mass flow. The three dominatinggeometric values are the maximum camber of the rotor blade B Cmax, the leading edge thickness ofthe stator vane V tLE, and the stagger angle of the rotor blade B λ. Comparable to the front stage, thefirst three parameters have an accumulated impact of about half of the overall changes caused by 24geometric properties (the number of geometric properties is higher because, at front stage, the rearstage has fewer correlations between the properties [3,4]).

Int. J. Turbomach. Propuls. Power 2018, 3, 15 4 of 13
(a) (b)
Figure 2. Rear-stage sensitivities of isentropic efficiency ηis. (a) Pareto chart of isentropic efficiency ηis
at the rear stage. (b) Sensitivies of ηis to geometric changes at the rear stage.
A detailed look at the three dominating geometric properties is given in Figure 2b. In contrast tothe sensitivities of the front stage, the isentropic efficiency ηis is decreasing as the maximum profilecamber of the rotor blade B Cmax decreases. The changes caused by changing the leading edgethicknesses of the stator vane V tLE are similar to the front stage: decreasing the thickness results in anincreased efficiency. Nevertheless, a strong dependency on the direction of the geometric change canbe noticed. Increasing the leading edge thickness results in a decrease in efficiency that is stronger thanthe decrease in thickness of about the same amount. Such a dependency can be seen for the staggerangle of the rotor blade B λ as well. Decreasing the stagger angle results in a steeper drop in efficiencycompared to the efficiency gain of increased stagger angles (cf. [4]).
Although there is no experimental validation for this studies, the results are in a good agreementwith publications of other researchers. Lange et al. [7] analyzed manufacturing variability of HPC rotorblades and ranked the geometric properties for their aerodynamic impact. Although manufacturingtolerances instead of deterioration were investigated, the thickness-related parameters have a dominantimpact—especially the leading edge thickness, which is similar to this study.
2.3. Stage Setups for Full HPC Calculations
In this section, geometries that show maximally high aerodynamic deviations from the referenceairfoils are determined. Thereby, the geometric properties of the airfoils shall lay in between the rangeof the analyzed deteriorated ones. In doing so, the results of the previous DoEs were used. Becausethere is no physical airfoil that satisfies the desired requirements, the airfoils have to be generated byan in-house programmed algorithm [2]. As a result, artificially deteriorated front and rear stages weregenerated and implemented into the full HPC model. To compare the aerodynamics of deteriorated frontand rear stages to the reference geometry, all geometric properties were set to the mean values of thedeteriorated airfoils [1]. Thereby, the leading edges of the front stage become thinner, while the rear stagetends toward thicker leading edges. Furthermore, the airfoils open, and the stagger angles decrease.
Moreover, to achieve aerodynamic deviations that are as wide as possible, stage setups forminimum and maximum isentropic efficiency were generated. Therefore, the previously shownaerodynamic sensitivities to geometric changes were used. Thus, the geometric properties thatare mainly influencing the isentropic efficiency—in addition to the mean value of the deterioratedairfoils—were changed by ±σ in the direction for minimum and maximum efficiency. Table 1 showsthe direction of chosen geometric properties for maximum isentropic efficiency. As can be seen, thefront stage setup for maximum efficiency is characterized by decreased values of B tLE, V tLE, B λ,and B Cmax, whereas the values for V λ and V Cmax are increased. The rear stage is characterized by

Int. J. Turbomach. Propuls. Power 2018, 3, 15 5 of 13
decreased values of V tLE and V λ. The values for B tLE, B λ, B Cmax, and V Cmax are increased toachieve a rise in efficiency. The behavior for minimum efficiency is vice versa.
Table 1. Direction of geometric properties for maximum ηis.
Geometric Property Front Stage Rear Stage
B tLE ⇓ ⇑V tLE ⇓ ⇓B λ ⇓ ⇑V λ ⇑ ⇓
B Cmax ⇓ ⇑V Cmax ⇑ ⇑
After defining the values of the geometric airfoil properties, the airfoils are generated and meshedwith an in-house programmed algorithm [2] and integrated into the full HPC CFD-model. In doingso, all compressor rows were meshed with uniform blade sets across the circumference, which isnot a realistic condition. Nevertheless, the impact of a completely changed compressor row can beanalyzed by this method. Lange et al. carried out CFD calculations for non axis-symmetric compressorbladings [8]. Thereby, Lange et al. simulated passages with 1, 2, 4, and 8 individual changed blades.As a result, they showed the high spreading of the stage efficiency for the single passage, caused bythe high spreading of geometries. Furthermore, two passage blade pairs can negatively influenceeach other, which results in lower stage efficiencies, compared to the single passage. If the number ofpassages is increasing, the efficiencies show a narrowed distribution around a mean value.
3. CFD Setup
The full HPC CFD-model contains all 21 compressor rows, bleed-ports, and cavities. Adjustingthe integrated VSV system, it is possible to simulate the compressor behavior to generate a compressormap. Nevertheless, for this study, only the throttle line for the operating condition cruise was simulatedwith the deteriorated front and rear stage. The behavior of the remaining parts of the compressor mapwas generated by scaling the reference map.
The CFD simulations have been carried out with the RANS (Reynolds Averaged Navier Stokes)solver TRACE [9–12] from DLR (German Aerospace Center). As has already been mentioned, theoperation point cruise was chosen for the generation of the deteriorated full HPC CFD-calculations.As inlet boundary condition the total pressure pt25, total temperature Tt25, flow angle in circumferentialdirection α25, the radial distribution of the flow angle in radial direction β25(h/H), Mach NumberMa25, turbulent intensity Tu25 and turbulent length scale TLM25 are chosen. As an exit boundarycondition, the averaged static pressure was chosen and varied to simulate the throttle line. Because thethrottle lines are calculated as a steady-state condition, the last converged point only represents akind of numerical point of stall and does not represent the physical one. Further solver settings aresummarized in Table 2.

Int. J. Turbomach. Propuls. Power 2018, 3, 15 6 of 13
Table 2. Boundary conditions and solver settings.
Setting Comment
pt25, Tt25, α25, β25(h/H), Ma25, Tu25, TLM25 Extracted from streamline curvature calculationsRotational speed n = nRe f erence,CruiseWalls No slip walls (hydraulically smooth)Blade to vane interface Mixing planeTurbulence model Wilcox k-ωWall treatment Wall functionsStagnation point anomally fix Kato LaunderRotational effects BardinaAnalysis type Steady stateBlade/vane mesh One pitch periodicDimensionless wall distance y+Hub/Shroud = 10; y+Air f oil = 3
Subsequently to the simulations, the CFD results are analyzed for the isentropic efficiency ηis andthe total pressure ratio πtt. The isentropic efficiency is calculated by the total pressure ratio,
πtt =pt3
pt25, (1)
and the total temperature ratio τtt,
τtt =Tt3
Tt25, (2)
with the following equation:
ηis =π
κ−1κ
tt − 1τtt − 1
. (3)
The results of the deteriorated full HPC CFD-calculations are visualized in Figure 3. Here, thereference throttle line for cruise condition is shown as well as different deterioration combinations ofthe front and rear stage. The lower part of the figure illustrates the normalized pressure ratio, andthe upper part illustrates the normalized isentropic efficiency. For the normalization, the operatingpoint of the cruise was chosen. The throttle line of the front and rear stage setups with all geometricproperties set to the mean value of the statistical analysis of the deteriorated airfoils is shown as linewith circle symbols. As can be seen, the throttle line is shifted toward higher massflows, which resultsfor the reference mass flow in higher efficiency. Thereby, the shifting toward higher massflows ismainly caused by decreased stagger angles of the deteriorated front blades. For the deteriorationcombination of maximum ηis in the front and rear stage, this effect is even strengthened (see Table 1)and the shifting toward lower loadings is increasing. For the deterioration combination of minimumηis, this effect is weakened.
Another effect which is strengthening the increase in efficiency of the changed stage geometries isthe influence of the leading edges. Because the modified airfoils have thinner leading edges, comparedto the reference airfoils, the efficiency is increased (see Figures 1b and 2b). Nevertheless, it has to bementioned that effects such as increased gaps or roughness have not been taken into account.
Another observation is that the aerodynamic changes of the deteriorated HPC are mainly causedby the front stage. As can be seen, the throttle lines with the combination of the maximum ηis in thefront and rear stages and the throttle line with maximum ηis in the front stage and minimum ηis in therear stage are overlapping. The same behavior can be observed for the combinations of minimum ηisin the front and rear stages and the throttle line with minimum ηis in the front stage and maximum ηisin the rear stage.

Int. J. Turbomach. Propuls. Power 2018, 3, 15 7 of 13
Figure 3. Computational fluid dynamic (CFD) calculations of different deterioration combinations inthe high pressure compressor (HPC).
4. Compressor Map Scaling
Because it is not feasible to simulate a complete compressor map for each deteriorationcombination in the front and aft stage, a scaling of the reference compressor map was chosen. Therefore,scaling factors at the cruise condition point were generated by referencing the deteriorated operatingpoint to the reference one [13]. Using this method, scaling factors for the massflow m,
SFm =mADP
mRe f erence,ADP, (4)
the total pressure ratio πtt,
SFπtt =πtt,ADP
πtt,Re f erence,ADP, (5)
and the isentropic efficiency ηis,
SFηis =ηis,ADP
ηis,Re f erence,ADP, (6)
were generated. Afterward, the reference compressor map parameters were multiplied with thesescaling factors. As an example, Table 3 states the scaling factor values for the deterioration combinationof maximum ηis as well as the minimum ηis in the front and rear stages. Because of the shifting ofthe throttle lines toward higher mass flows (see Figure 3), the scaling factor for the massflow SFm isnoticeably increased. In addition, the scaling factors for efficiency SFηis and the pressure ratio SFπtt areslightly higher than 1.
Int. J. Turbomach. Propuls. Power 2018, 3, 15 8 of 13
Table 3. Values of scaling factors used.
Deterioration SFm [ - ] SFπtt [ - ] SFηis [ - ]Combination
FS & RS max ηis 1.00360 1.00026 1.00114FS & RS min ηis 1.00166 1.00017 1.00049
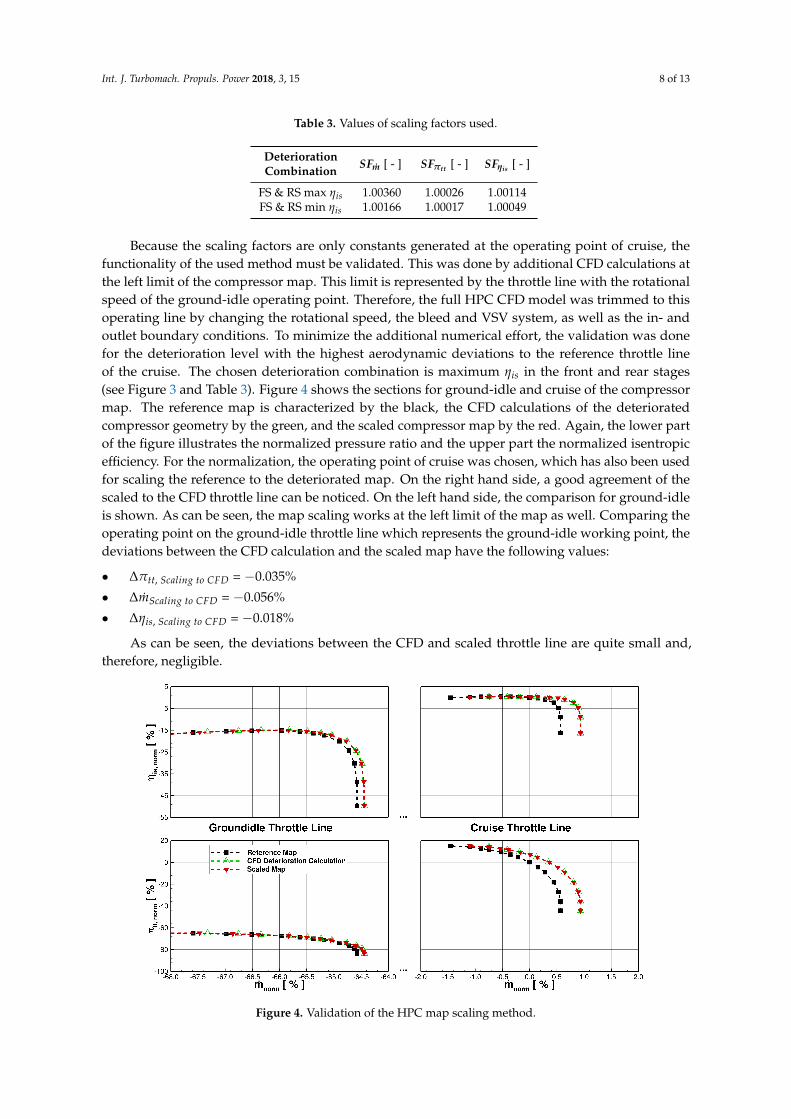
Because the scaling factors are only constants generated at the operating point of cruise, thefunctionality of the used method must be validated. This was done by additional CFD calculations atthe left limit of the compressor map. This limit is represented by the throttle line with the rotationalspeed of the ground-idle operating point. Therefore, the full HPC CFD model was trimmed to thisoperating line by changing the rotational speed, the bleed and VSV system, as well as the in- andoutlet boundary conditions. To minimize the additional numerical effort, the validation was donefor the deterioration level with the highest aerodynamic deviations to the reference throttle lineof the cruise. The chosen deterioration combination is maximum ηis in the front and rear stages(see Figure 3 and Table 3). Figure 4 shows the sections for ground-idle and cruise of the compressormap. The reference map is characterized by the black, the CFD calculations of the deterioratedcompressor geometry by the green, and the scaled compressor map by the red. Again, the lower partof the figure illustrates the normalized pressure ratio and the upper part the normalized isentropicefficiency. For the normalization, the operating point of cruise was chosen, which has also been usedfor scaling the reference to the deteriorated map. On the right hand side, a good agreement of thescaled to the CFD throttle line can be noticed. On the left hand side, the comparison for ground-idleis shown. As can be seen, the map scaling works at the left limit of the map as well. Comparing theoperating point on the ground-idle throttle line which represents the ground-idle working point, thedeviations between the CFD calculation and the scaled map have the following values:
• ∆πtt, Scaling to CFD = −0.035%
• ∆mScaling to CFD = −0.056%
• ∆ηis, Scaling to CFD = −0.018%
As can be seen, the deviations between the CFD and scaled throttle line are quite small and,therefore, negligible.
Figure 4. Validation of the HPC map scaling method.

Int. J. Turbomach. Propuls. Power 2018, 3, 15 9 of 13
5. Modular Performance Synthesis Model
To determine the changes of the engine performance due to changed HPC aerodynamics,a modular performance synthesis model of the analyzed jet engine was set up and validated bytest cell data. For setting up the model, the software GasTurb [14] was used. The technique of modularperformance synthesis was characterized by splitting up the thermodynamic cycle of a jet engine intoits individual components (see Figure 5 upper part). Thereby, the flow was calculated successivelyin each component independently from the other components. The component behavior can bedescribed by simple equations (i.e. the pressure drop in a tube) or by complex component maps for theturbo-components (see Figure 5 lower part). The modular performance synthesis is characterized by a1D-calculation method, which averages the flow parameters such as total pressure and temperatureover the cross section. As a result, the modular performance synthesis is able to predict performanceparameters such as EGT or SFC.
In the modular performance synthesis model, the reference HPC map was replaced by thedeteriorated ones (see Figure 5 lower part), while leaving the rest of the model in its originalconfiguration. To prepare the scaled CFD maps, the software Smooth C was used [15]. With thissoftware, it is possible to inter- and extrapolate further throttle lines inside the compressor map and totransfer the data in a consistent input format for GasTurb.
Figure 5. Scheme of a modular performance synthesis model with modified HPC maps.
6. Jet Engine Performance Calculations
For evaluating the impact of modified stage geometries to the engine performance parameters, theHPC map of the modular performance synthesis model was replaced by the scaled ones. To guaranteean adjustment of the same engine operating condition despite the changed HPC maps, the model wasregulated by the engine pressure ratio (EPR). This is the same engine control philosophy as for the realone. Afterward, typical performance parameters are analyzed at the operating condition cruise. Table 4summarizes chosen parameters, defining the compressor performance and the jet engine efficiency.As can be seen, the pressure ratio and efficiency of the HPC are increasing. This behavior can beexplained by the scaling factors presented in Table 3. Again, it has to be mentioned that, because of the

Int. J. Turbomach. Propuls. Power 2018, 3, 15 10 of 13
thinner leading edges in conjunction with an opening of the rows, the chosen geometric deteriorationcombinations result in a higher efficiency at the regarded massflow. Thereby, the higher scaling factorsof the deterioration combination of maximum ηis in the front and rear stages result in higher changes ofπHPC and ηHPC, compared to the deterioration combination of minimum ηis in these stages. Althoughonly two compressor stages have been modified for the CFD-calculations, a noticeable effect on enginefuel economy can be observed: The given deterioration combinations result in a decrease in SFC by0.1% and 0.04%. Consequently, the EGT is decreased as well, and the gain in EGT is about 1.12 and0.52 K.
Table 4. Changes in engine performance parameters for the cruise condition.
Deterioration ∆πHPC [ % ] ∆ηHPC [ % ] ∆ SFC [ % ] ∆ EGT [ K ] ∆ BPR [ % ] ∆FN [ % ]Combination to Reference to Reference to Reference to Reference to Reference to Reference
FS & RS max ηis +0.25 +0.18 −0.10 −1.12 −0.10 −0.02FS & RS min ηis +0.12 +0.08 −0.04 −0.52 −0.04 −0.01Generic min ηis −1.91 −1.42 +0.88 +9.71 +0.85 +0.10
Due to the small geometric changes in only two of the compressor stages, the deviations causedby the scaled HPC maps are quite small and do not represent the reality. As already mentioned, theairfoil gaps and roughness did not change during these investigations. Specifically, these effects wouldresult in decreased compressor performance. Nevertheless, the process is able to reflect even thesesmall changes in engine performance parameters such as EGT and SFC, caused by small geometricchanges inside only a few HPC rows.
To evaluate the impact of a strongly deteriorated HPC, a third HPC map modification was made.Therefore, all scaling factors were set to 0.98, which is a realistic range of deteriorated HPCs coming toa shop visit. Thereby, geometric variations of all HPC stages in conjunction with increased airfoil gapsand surface roughness reduce the HPC performance. For such an HPC, the increase in SFC is about0.88% and in EGT about 9.71 K.
To give the reader a feeling for the provoked changes by the strongly deteriorated HPC, itsimpact to the fuel consumption of a typical civil flight mission is calculated. Thereby, the missionis characterized by taxiing on the ground followed by the take-off and the succeeding cruise flight.Afterwards, the airplane approaches and lands. With four hours, the operating condition of cruise isthe longest flight period. For this magnitude of deterioration, the integrated fuel consumption of oneengine is increased by about 88.95 kg, which is an increase of 1.12%.
7. Conclusions
In this paper, changes in jet engine performance caused by deteriorated HPCs were evaluated.The front and rear stages of an HPC were modified, and the performance was simulated by methodsof CFD. The results of two previous DoEs were used to change the stage geometry in a mannerfor maximum and minimum efficiency. To lower the number of required numerical simulations,a compressor map scaling method was introduced and validated by an exemplary deteriorationcondition of the HPC. Using this scaling method, the calculation of only one deteriorated pointon the throttle line would be sufficient to scale the complete reference map to a deteriorated one.Nevertheless, the complete deteriorated throttle line was calculated to evaluate its possible shapechanges. Afterward, the changed compressor maps were embedded in the modular performancesynthesis model of the analyzed jet engine to evaluate its performance changes. The main results ofthe paper can be summarized as follows:
• Because deterioration leads to thinner airfoils, the efficiency shows a trend toward higher values.Additionally, the decreased stagger angle inside the front stage results in a throttle line shiftingtoward higher massflows. Nevertheless, it has to be mentioned that effects such as increased gapsor roughness have not been taken into account.

Int. J. Turbomach. Propuls. Power 2018, 3, 15 11 of 13
• The investigated compressor behavior is mainly driven by the front stage. An HPC setup with installedfront and rear stages with maximum efficiency shows nearly the same performance as an HPC setupwith an installed front stage for maximum efficiency and a rear stage with minimum efficiency.
• The presented compressor map scaling method—which works with constant multipliers formassflow, efficiency, and pressure ratio, respectively—works well for the complete area of the map.
• By modifying only two stages of the HPC, a significant influence on jet engine performance wasproven. Because of the already explained higher efficiency, the impact is positive. For the examplemaximum efficiency in the front and rear stages, the SFC decreases by about 0.1% and the EGT isapproximately 1.1 K colder.
• To show the impact of an overall deteriorated HPC, the scaling factors were all set to valuesrepresenting an engine coming to the shop. For this example, a massive increase in the SFC wasobserved. Its value rises up to about 0.9%, and the EGT is 9.7 K hotter. The increased SFC resultsin an increase of integrated mission fuel consumption (with a duration in cruise condition of 4 h)about 89 kg per engine which is 1.1% more than the reference value.
All in all, the presented process is able to reflect changes in engine performance parameters, suchas EGT and SFC, caused by small geometric changes inside the HPC. Thus, with this process, the MROcompanies would be able to evaluate the compressor performance at incoming inspections and toidentify sensitive compressor areas, which can lead to an increase in its performance.
In the future, MRO companies will be able to classify serviceable airfoils with respect to theiraerodynamics and impact on the HPC and jet engine performance. With detailed knowledge ofthe varying airfoil aerodynamics, HPC repair could be adjusted to given HPC efficiencies to meetcustomers requirements as cost-effectively as possible. Furthermore, expensive troubleshooting due toa poor contracted engine performance can be avoided.
Nevertheless, further work must be undertaken. Additional compressor stages should be adjustedin their geometry to generate a fully changed HPC. Furthermore, the airfoils gaps and roughness couldbe increased to meet the true deteriorated compressor appearance.
Author Contributions: G.R., and J.F. designed this study. G.R. provided the tools, analyzed the data and wrotethe paper.
Acknowledgments: The authors would like to thank MTU Maintenance Hannover GmbH for funding and forallowing the publication of this work.
Conflicts of Interest: The authors declare no conflict of interest.
Abbreviations
The following abbreviations are used in this manuscript:
3D Three-DimensionalADP Aerodynamic Design PointB BladeCFD Computational Fluid DynamicsDLR German Aerospace CenterDOC Direct Operating CostsDoE Design of ExperimentEGT Exhaust Gas TemperatureEM Engine ManualFS Front StageHPC High Pressure CompressorLE Leading Edge

Int. J. Turbomach. Propuls. Power 2018, 3, 15 12 of 13
MRO Maintenance, Repair, and OverhaulRANS Reynolds Averaged Navier StokesRS Rear StageSF Scaling FactorTE Trailing EdgeTKE Turbulence Kinetic EnergyTu Turbulent IntensityTLM Turbulent Length ScaleTRACE Turbomachinery Research Aerodynamics Computational EnvironmentSFC Specific Fuel ConsumptionV VaneNomenclatureLatin Characters:H Absolute Duct Heighth Heightk Turbulence Kinetic EnergyMa Mach Numbern Rotational Speed of N2p Pressurept Total PressureTt Total Temperaturey+ Dimensionless Wall DistanceGreek Characters:α Absolute Circumferential Flow Angleβ Absolute Radial Flow Angleηis Isentropic Efficiencyκ Isentropic Exponentσ Standard Deviationτtt Temperature Riseω Dissipation Rate per Unit of TKENumbers:25 HPC Inlet3 HPC OutletGeometric Properties:cmax Max. Profile Camberl Chord LengthLEasy Leading Edge AsymmetrytLE Leading Edge Thicknesstmax Max. Profile ThicknesstTE Trailing Edge ThicknessTEasy Trailing Edge Asymmetryxcmax Position of maximum Profile Camberxtmax Position of maximum Profile Thicknessκ1 Metal Angle at Leading Edgeκ2 Metal Angle at Trailing Edgeλ Stagger Angle
References
1. Marx, J.; Städing, J.; Reitz, G.; Friedrichs, J. Investigation and Analysis of Deterioration in High PressureCompressors. CEAS Aeronaut. J. 2014, 2014, 515–525. [CrossRef]
2. Reitz, G.; Friedrichs, J. Procedure for Analyzing, Manipulating and Meshing of Compressor Blades tosimulate their Flow. Int. J. Gas Turbine Propuls. Power Systems (JGPP) 2016, 8, 1–8.

Int. J. Turbomach. Propuls. Power 2018, 3, 15 13 of 13
3. Reitz, G.; Schlange, S.; Friedrichs, J. Design of Experiments and Numerical Simulation of Deteriorated HighPressure Compressor Airfoils. In Proceedings of the ASME Turbo Expo 2016: Turbomachinery TechnicalConference and Exposition, Seoul, Korea, 13–17 June 2016.
4. Reitz, G.; Kellersmann, A.; Schlange, S.; Friedrichs, J. Comparison of Sensitivities to Geometrical Properties ofFront and Aft High Pressure Compressor Stages. In Proceedings of the Deutscher Luft- und Raumfahrtkongress,Braunschweig, Germany, 13–15 Sepptember 2016.
5. Reitz, G.; Dwinger, K.; Schlange, S.; Friedrichs, J.; Kappei, F. Analysis of jet engine compressor deterioration andcapturing correlations between geometric parameters. In Proceedings of the The International Symposium onTransport Phenomena And Dynamics of Rotating Machinery, Honolulu, HI, USA, 10–15 April 2016.
6. Lophaven, S.N.; Nielsen, H.B.; Sondergaard, J. DACE a Matlab Kriging Toolbox, Version 2, Informatics andMathematical Modelling; Technical Report No. IMM-TR-2002-12; Technical University of Denmark: Copenhagen,Denmark, 2002.
7. Lange, A.; Voigt, M.; Vogeler, K.; Schrapp, H.; Johann, E.; Gümmer, V. Probalistik CFD Simulation of aHigh-Pressure-Compressor Stage Taking Manufacturing Variability into Account. In Proceedings of theASME Turbo Expo 2010: Power for Land, Sea, and Air, Glasgow, UK, 14–18 June 2010.
8. Lange, A.; Voigt, M.; Vogeler, K.; Schrapp, H.; Johann, E.; Gümmer, V. Impact of Manufacturing Variabilityand Non-Axisymmetry on High-Pressure Compressor Stage Performance. In Proceedings of the ASME 2011Turbo Expo: Turbine Technical Conference and Exposition, Vancouver, BC, Canada, 6–10 June 2011.
9. Becker, K.; Heitkamp, K.; Kügeler, E. Recent Progress in a Hybrid-Grid CFD Solver for TurbomachineryFlows. In Proceedings of the V. European Conference on Computational Fluid Dynamics, Lisbon, Portugal,14–17 June 2010.
10. Kügeler, E. Numerisches Verfahren zur Genauen Analyse der Kühleffektivität Filmgekühlter Turbinenschaufeln.Ph.D. Thesis, Ruhr-Universität Bochum, Bochum, Germany, 2004.
11. Marciniak, V.; Kügeler, E.; Franke, M. Predicting Transition on Low-Pressure Turbine Profiles. In Proceedingsof the V. European Conference on Computational Fluid Dynamics, Lisbon, Portugal, 14–17 June 2010.
12. Nürnberger, D. Implizite Zeitintegration für die Simulation von Turbomaschinenströmungen. Ph.D. Thesis,Ruhr-Universität Bochum, Bochum, Germany, 2004.
13. Li, Y.G.; Ghafir, M.F.A.; Wang, L.; Singh, R.; Huang, K.; Feng, X. Nonlinear Multiple Points Gas TurbineOff-Design Performance Adaptation Using a Genetic Algorithm. J. Eng. Gas Turbines Power 2011, 133, 071701.[CrossRef]
14. GasTurb 12: Design and Off-Design Performance of Gas Turbines; GasTurb GmbH: Aachen, Germany, 2015.15. Smooth C 8.3: Preparing Compressor Maps for Gas Turbine Performance Modeling; GasTurb GmbH: Aachen,
Germany, 2015.
c© 2018 by the authors. Licensee MDPI, Basel, Switzerland. This articleis an open access article distributed under the terms and conditions of theCreative Commons Attribution NonCommercial NoDerivatives (CC BY-NC-ND) license(https://creativecommons.org/licenses/by-nc-nd/4.0/).