final tata tea
TRANSCRIPT
8/7/2019 final tata tea
http://slidepdf.com/reader/full/final-tata-tea 1/22
ALKESH DINESH MODY INSTITUTE OF FINACIAL AND
MANAGEMENT STUDIES
FYMFSM
2008-09SUBJECT: Corporate Policy
8/7/2019 final tata tea
http://slidepdf.com/reader/full/final-tata-tea 2/22
TATA TEA
PRESENTED BY:M
EHUL DEKHTAWALAAMOL SHINDE
SAGAR LEDWANI
8/7/2019 final tata tea
http://slidepdf.com/reader/full/final-tata-tea 3/22
Contents
Introduction
Year Happenings
Group Performance Tata Tea Stand Alone
Strategy & Future Outlook
Indian Brands Performance
8/7/2019 final tata tea
http://slidepdf.com/reader/full/final-tata-tea 4/22
Introduction: Tata Tea Limited, also known as Tata-Tetley, is the world's second
largest manufacturer and distributor of tea. Owned by India's TataGroup, the Tata Tea Limited markets tea under the following major
brands Tata Tea, Tetley, Good Earth Teas and JEMA. While Tata Tea is largest tea brand in India, Tetley is the largest tea company in the United Kingdom and Canada
and the second largest in the United States by volume and JEMA is Czech Republic's leading tea company.Tata Tea Limited along
with its subsidiary companies manufactures 70 million kilograms of tea
in India, has 54 tea estates, 10 tea blending and packaging factories, and employs around 59,000 people. The company owns 51 tea estatesin India and Sri Lanka, especially in Assam, West Bengal and Kerala.
8/7/2019 final tata tea
http://slidepdf.com/reader/full/final-tata-tea 5/22
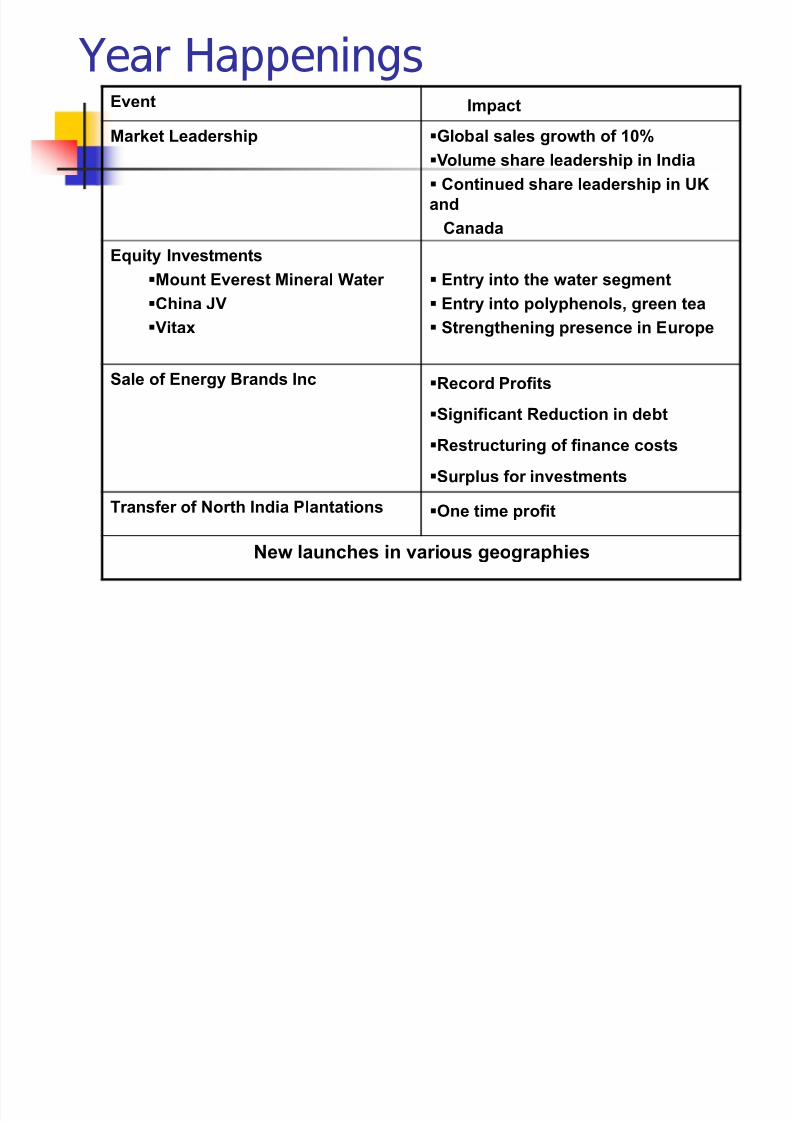
Year HappeningsEvent Impact
Market Leadership Global sales gr owth of 10%Volume share leadership in India
Continued share leadership in UK
and
Canada
Equity Investments
Mount Everest Mineral Water
China JV
Vitax
Entry into the water segment
Entry into polyphenols, green tea
Strengthening presence in Eur ope
Sale of Energy Brands Inc Record Pr of its
Signif icant Reduction in debt
Restr ucturing of f inance costs
Surplus for investments
Transf er of North India Plantations One time pr of it
New launches in various geographies
8/7/2019 final tata tea
http://slidepdf.com/reader/full/final-tata-tea 6/22
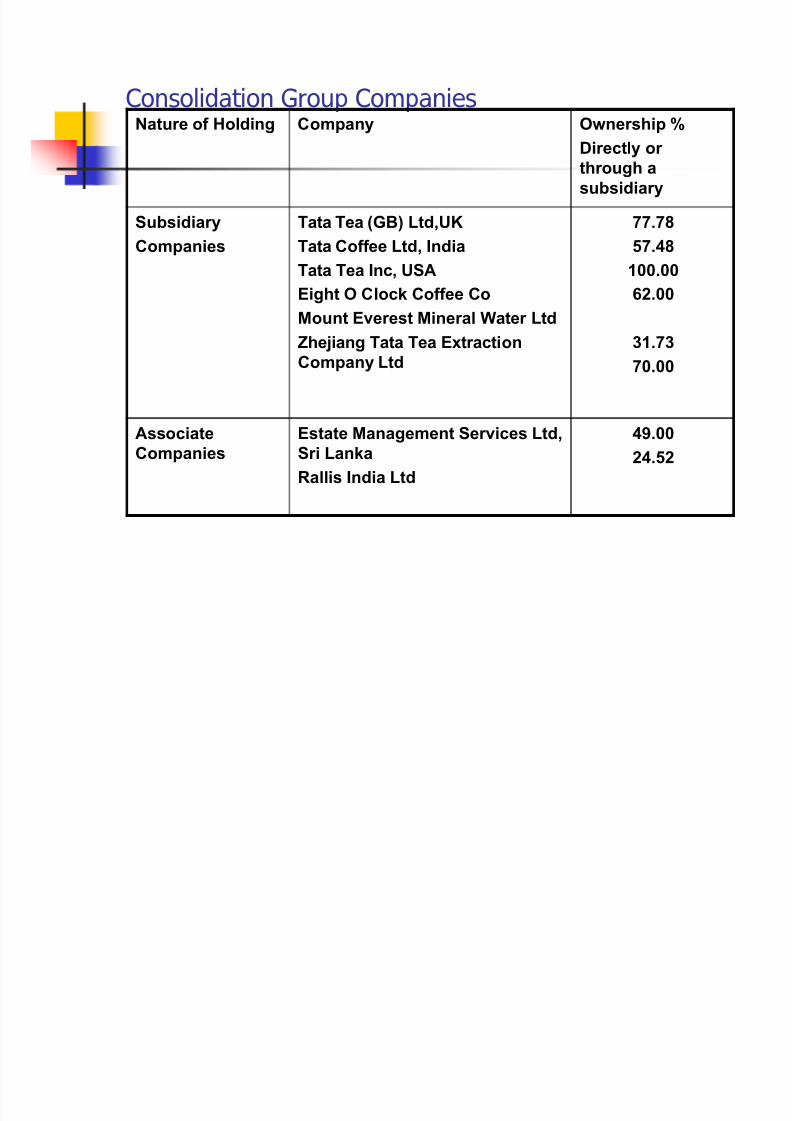
Consolidation Group CompaniesNature of Holding Company Ownership %
Directly or
thr ough a
subsidiary
Subsidiary
Companies
Tata Tea (GB) Ltd,UK
Tata Coff ee Ltd, India
Tata Tea Inc, USAEight O Clock Coff ee Co
Mount Everest Mineral Water Ltd
Zhejiang Tata Tea Extraction
Company Ltd
77.78
57.48
100.0062.00
31.73
70.00
Associate
Companies
Estate Management Services Ltd,
Sri Lanka
Rallis India Ltd
49.00
24.52
8/7/2019 final tata tea
http://slidepdf.com/reader/full/final-tata-tea 7/22
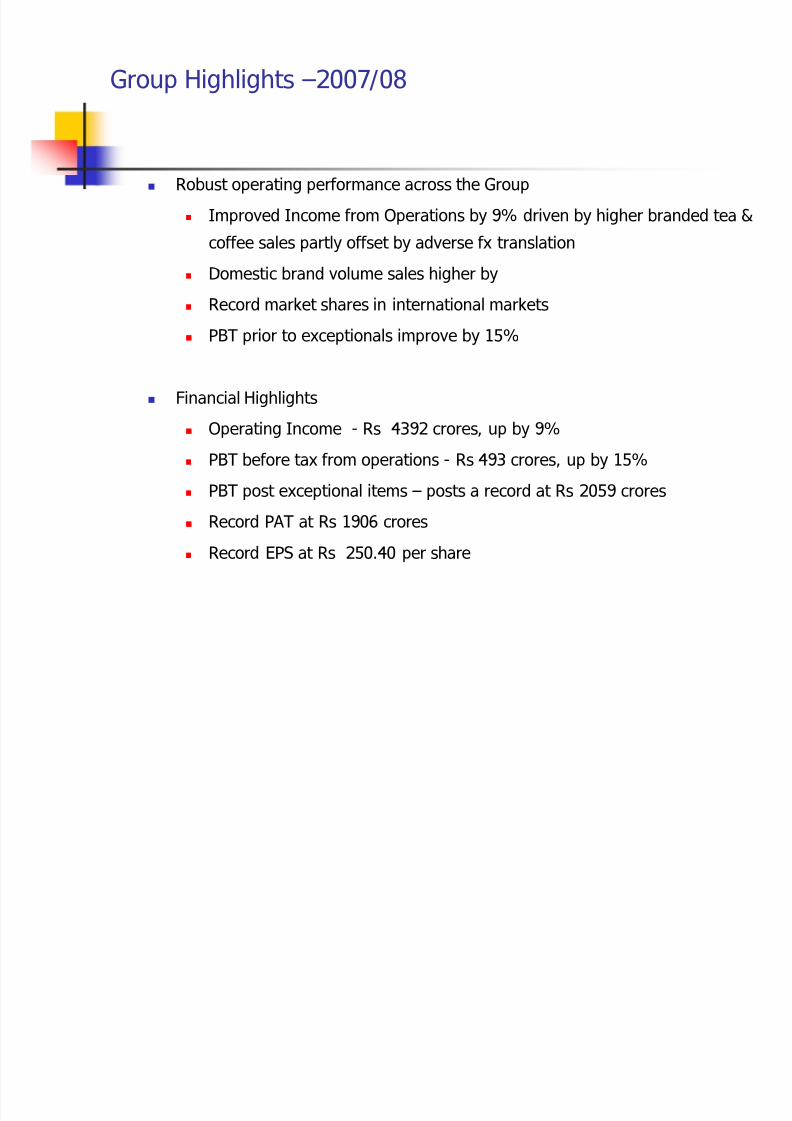
Group Highlights 2007/08
Robust operating performance across the Group
Improved Income from Operations by 9% driven by higher branded tea &
coffee sales partly offset by adverse fx translation
Domestic brand volume sales higher by Record market shares in international markets
PBT prior to exceptionals improve by 15%
Financial Highlights
Operating Income - Rs 4392 crores, up by 9%
PBT before tax from operations - Rs 493 crores, up by 15%
PBT post exceptional items posts a record at Rs 2059 crores
Record PAT at Rs 1906 crores
Record EPS at Rs 250.40 per share
8/7/2019 final tata tea
http://slidepdf.com/reader/full/final-tata-tea 8/22
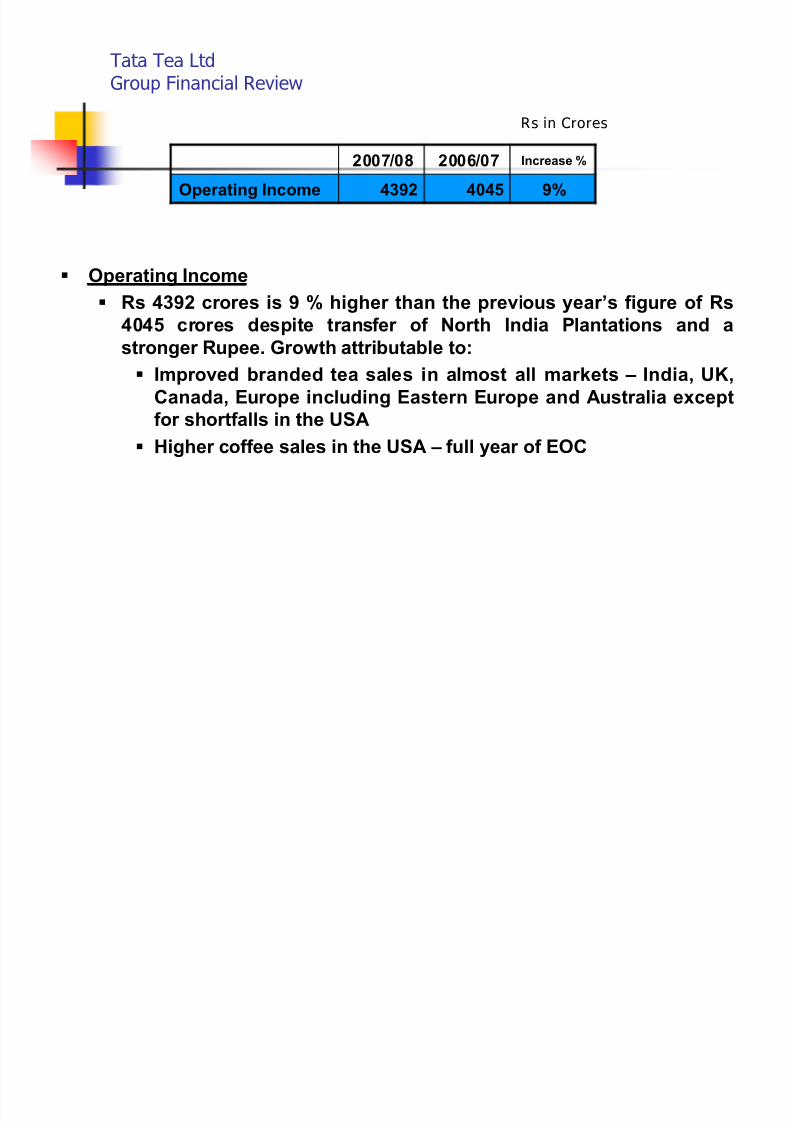
Tata Tea LtdGroup Financial Review
2007/08 2006/07 Increase %
Operating Income 4392 4045 9%
Rs in Crores
Operating Income Rs 4392 cr ores is 9 % higher than the previous year¶s f igure of Rs
4045 cr ores despite transf er of North India Plantations and a
str onger Rupee. Gr owth attributable to:
Impr oved branded tea sales in almost all markets ± India, UK,
Canada, Eur ope including Eastern Eur ope and Australia except
for shortf alls in the USA
Higher coff ee sales in the USA ± full year of EOC
8/7/2019 final tata tea
http://slidepdf.com/reader/full/final-tata-tea 9/22
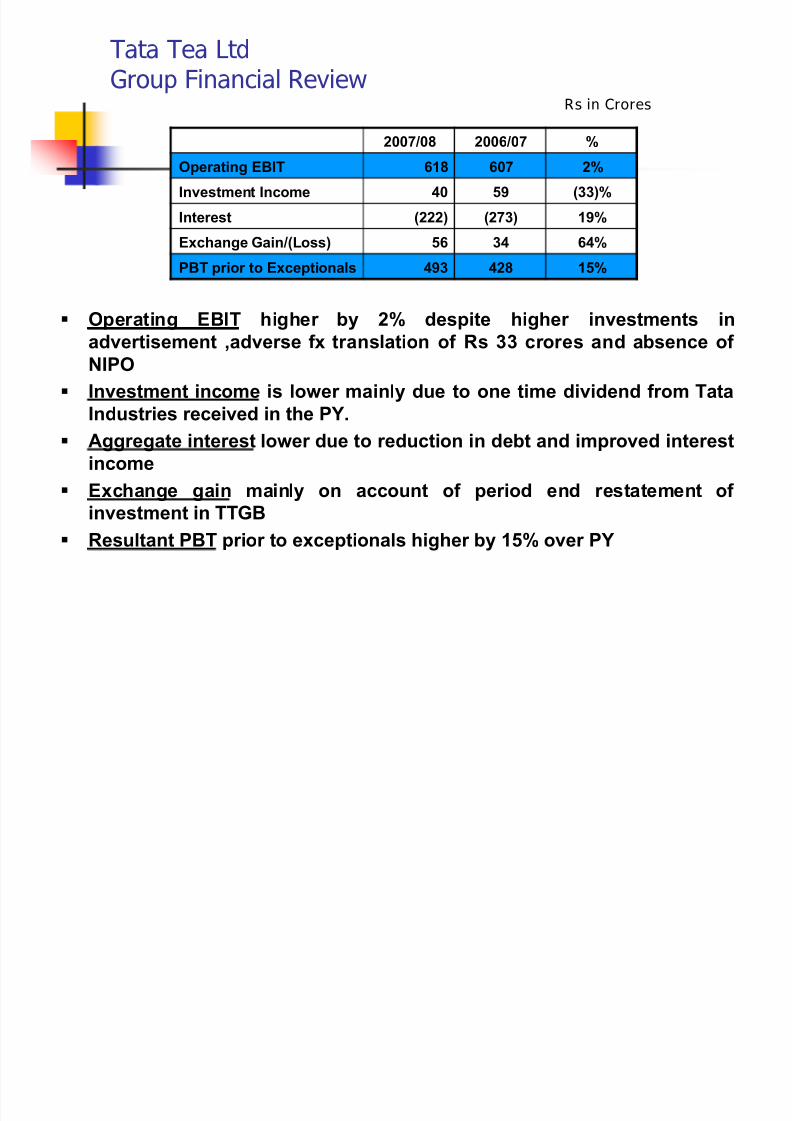
Tata Tea LtdGroup Financial Review
2007/08 2006/07 %
Operating EBIT 618 607 2%
Investment Income 40 59 (33)%
Interest (222) (273) 19%
Exchange Gain/(Loss) 56 34 64%
PBT prior to Exceptionals 493 428 15%
Rs in Crores
Operating EBIT higher by 2% despite higher investments in
advertisement ,adverse f x translation of Rs 33 cr ores and absence of
NIPO
Investment income is lower mainly due to one time dividend f r om Tata
Industries received in the PY. Aggregate interest lower due to reduction in debt and impr oved interest
income
Exchange gain mainly on account of period end restatement of
investment in TTGB
Resultant PBT prior to exceptionals higher by 15% over PY
8/7/2019 final tata tea
http://slidepdf.com/reader/full/final-tata-tea 10/22
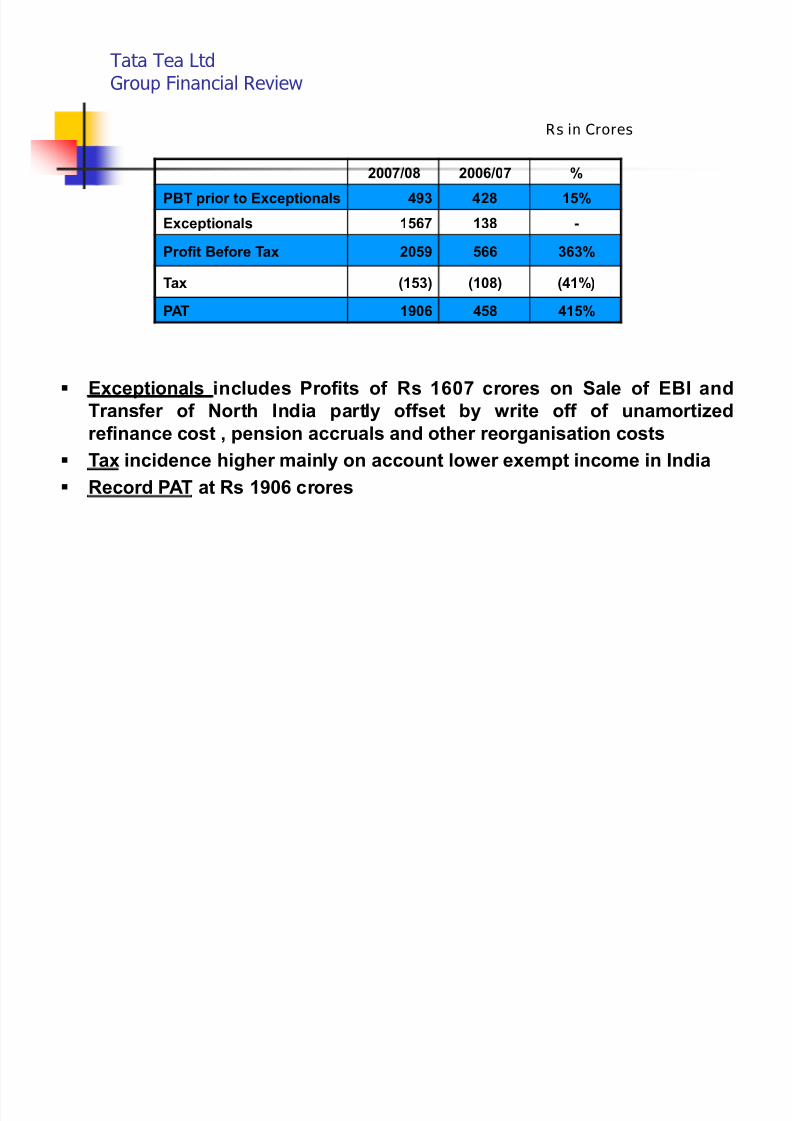
Tata Tea LtdGroup Financial Review
2007/08 2006/07 %
PBT prior to Exceptionals 493 428 15%
Exceptionals 1567 138 -
Pr of it Before Tax 2059 566 363%
Tax (153) (108) (41%)
PAT 1906 458 415%
Rs in Crores
Exceptionals includes Pr of its of Rs 1607 cr ores on Sale of EBI and
Transf er of North India partly off set by write off of unamortizedref inance cost , pension accr uals and other reorganisation costs
Tax incidence higher mainly on account lower exempt income in India
Record PAT at Rs 1906 cr ores
8/7/2019 final tata tea
http://slidepdf.com/reader/full/final-tata-tea 11/22
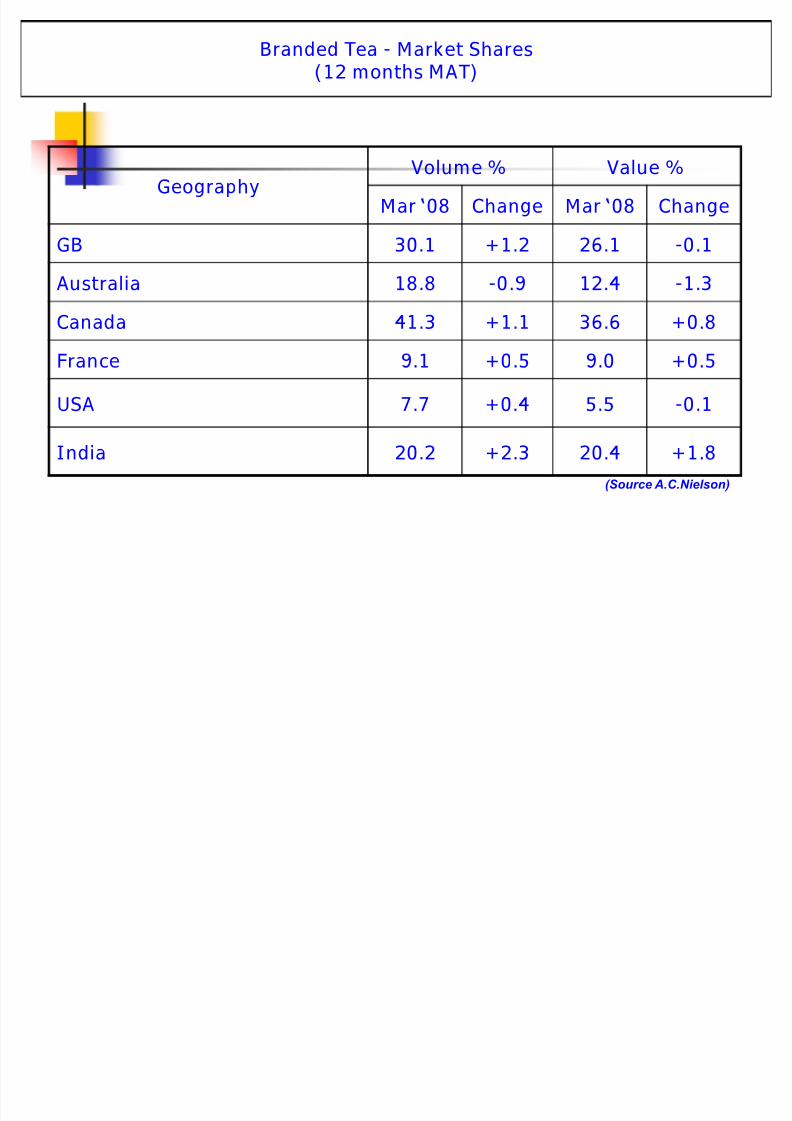
Branded Tea - Market Shares(12 months MAT)
GeographyVolume % Value %
Mar 08 Change Mar 08 Change
GB 30.1 +1.2 26.1 -0.1
Australia 18.8 -0.9 12.4 -1.3
Canada 41.3 +1.1 36.6 +0.8
France 9.1 +0.5 9.0 +0.5
USA 7.7 +0.4 5.5 -0.1
India 20.2 +2.3 20.4 +1.8
(Source A.C.Nielson)
8/7/2019 final tata tea
http://slidepdf.com/reader/full/final-tata-tea 12/22
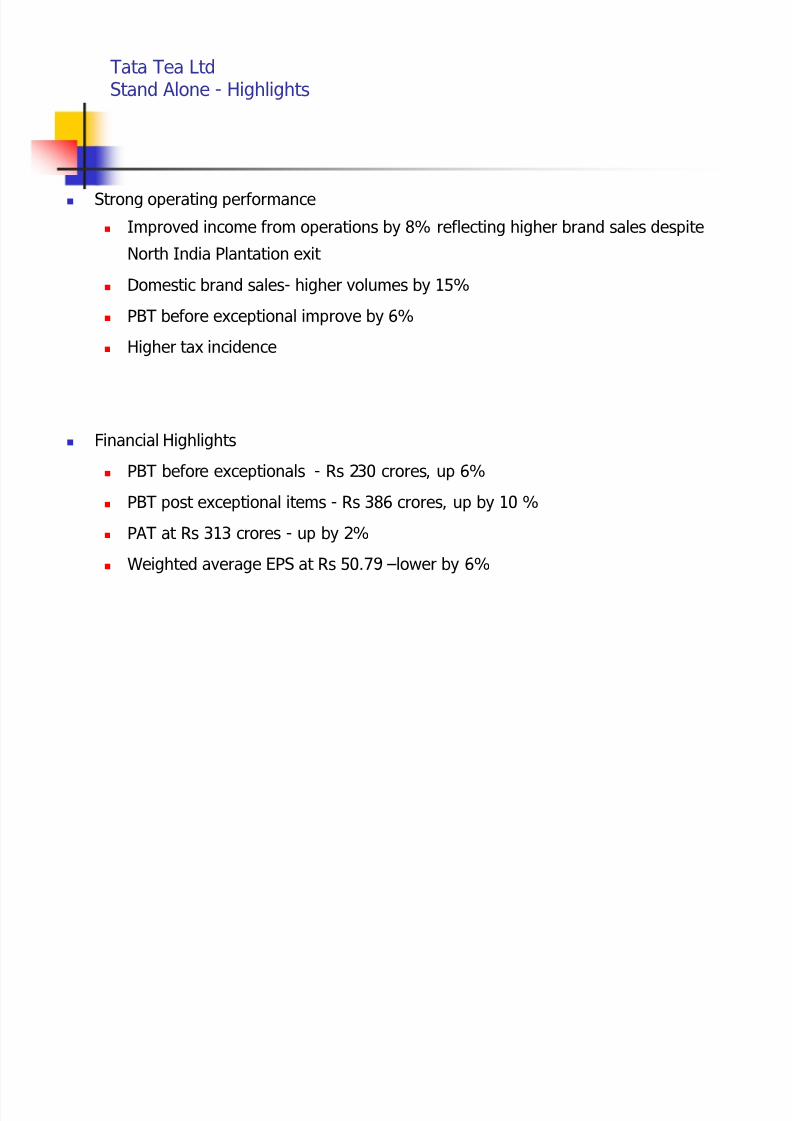
Tata Tea LtdStand Alone - Highlights
Strong operating performance
Improved income from operations by 8% reflecting higher brand sales despite
North India Plantation exit
Domestic brand sales- higher volumes by 15%
PBT before exceptional improve by 6%
Higher tax incidence
Financial Highlights
PBT before exceptionals - Rs 230 crores, up 6%
PBT post exceptional items - Rs 386 crores, up by 10 %
PAT at Rs 313 crores - up by 2%
Weighted average EPS at Rs 50.79 lower by 6%
8/7/2019 final tata tea
http://slidepdf.com/reader/full/final-tata-tea 13/22
Tata Tea LtdCompany Financial Review
2007/08 2006/07 Increase %
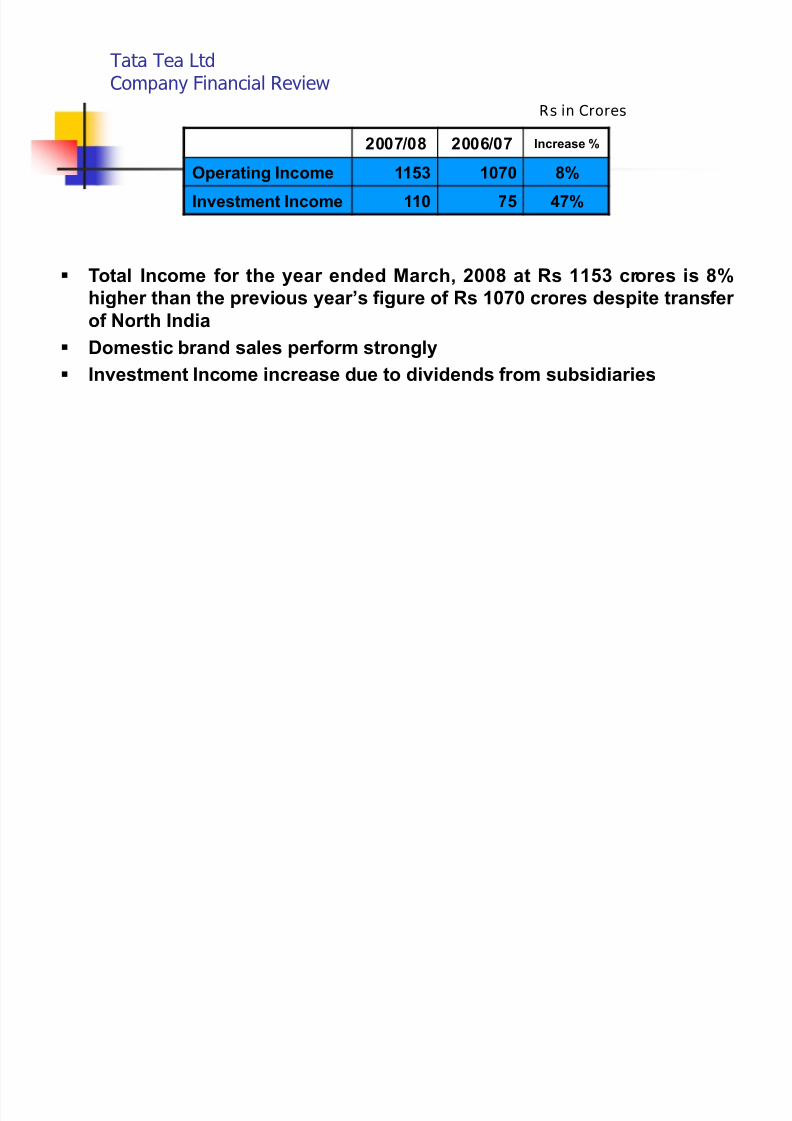
Operating Income 1153 1070 8%
Investment Income 110 75 47%
Rs in Crores
Total Income for the year ended March, 2008 at Rs 1153 cr ores is 8%higher than the previous year¶s f igure of Rs 1070 cr ores despite transf er
of North India
Domestic brand sales per form str ongly
Investment Income increase due to dividends f r om subsidiaries
8/7/2019 final tata tea
http://slidepdf.com/reader/full/final-tata-tea 14/22
Tata Tea LtdCompany Financial Review
2007/08 2006/07 Increase %
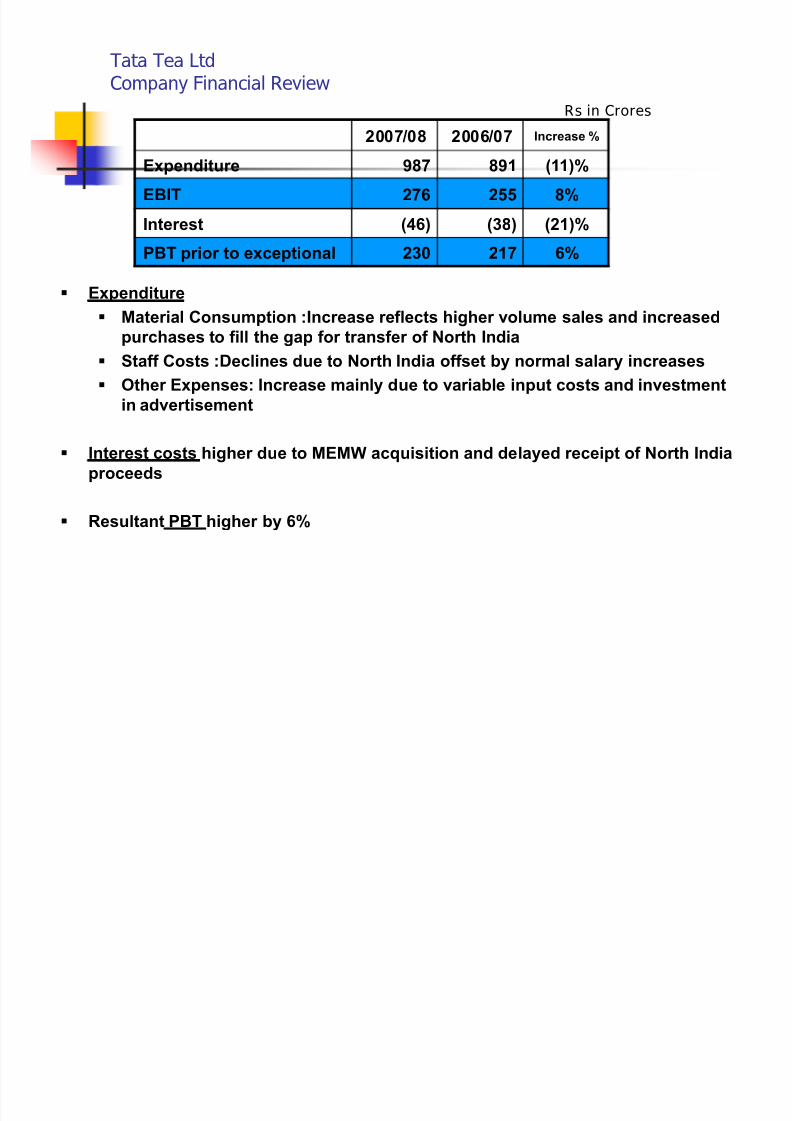
Expenditure 987 891 (11)%
EBIT 276 255 8%
Interest (46) (38) (21)%
PBT prior to exceptional 230 217 6%
Rs in Crores
Expenditure
Material Consumption :Increase reflects higher volume sales and increased
purchases to f ill the gap for transf er of North India
Staff Costs :Declines due to North India off set by normal salary increases
Other Expenses: Increase mainly due to variable input costs and investment
in advertisement
Interest costs higher due to MEMW acquisition and delayed receipt of North India
pr oceeds
Resultant PBT higher by 6%
8/7/2019 final tata tea
http://slidepdf.com/reader/full/final-tata-tea 15/22
Tata Tea LtdCompany Financial Review
2007/08 2006/07 Increase %
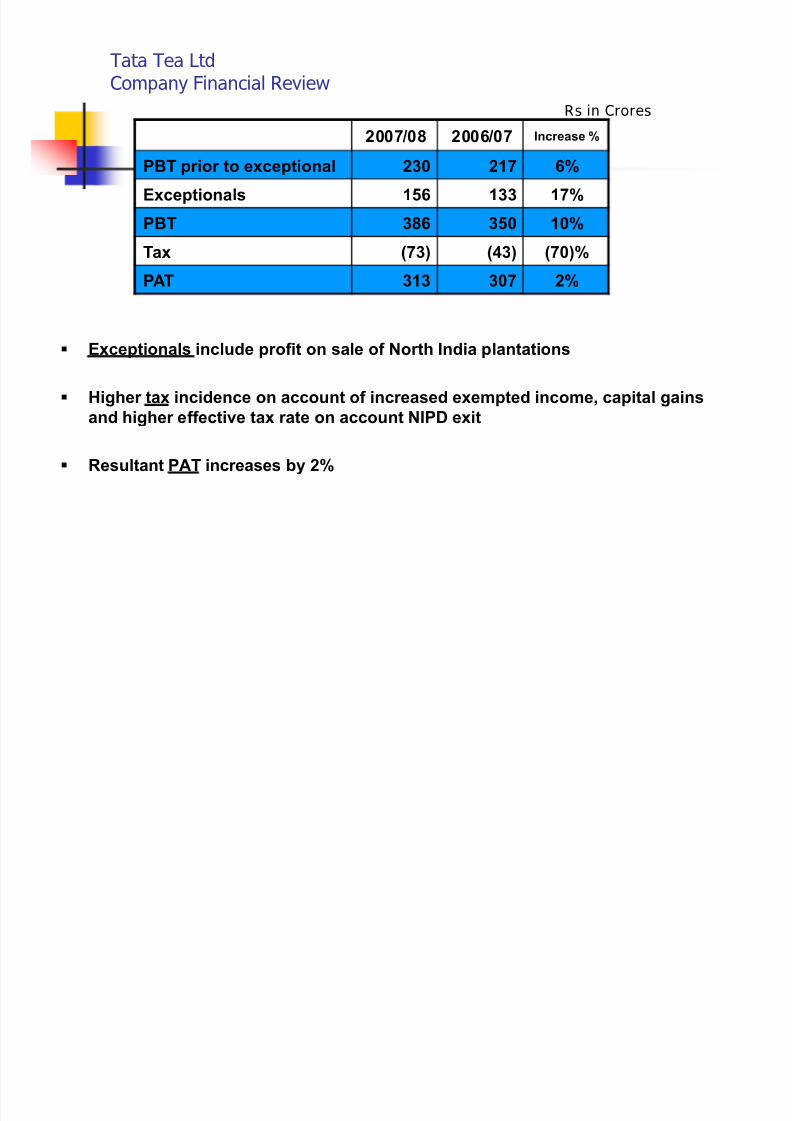
PBT prior to exceptional 230 217 6%
Exceptionals 156 133 17%
PBT 386 350 10%
Tax (73) (43) (70)%
PAT 313 307 2%
Rs in Crores
Exceptionals include pr of it on sale of North India plantations
Higher tax incidence on account of increased exempted income, capital gains
and higher eff ective tax rate on account NIPD exit
Resultant PAT increases by 2%
8/7/2019 final tata tea
http://slidepdf.com/reader/full/final-tata-tea 16/22
Tata Tea GB LtdCompany Financial Review
2007/08 2006/07 Increase %
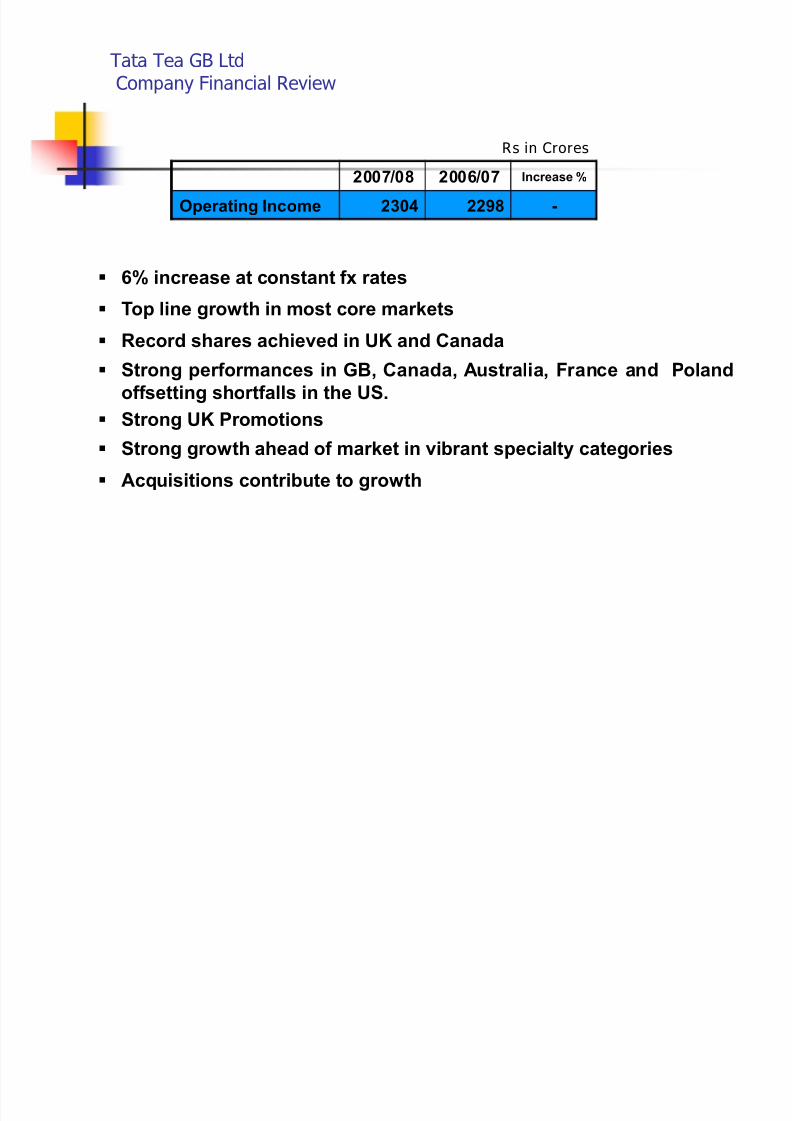
Operating Income 2304 2298 -
Rs in Crores
6% increase at constant f x rates
Top line gr owth in most core markets
Record shares achieved in UK and Canada
Str ong per formances in GB, Canada, Australia, France and Poland
off setting shortf alls in the US.
Str ong UK Pr omotions
Str ong gr owth ahead of market in vibrant specialty categories
Acquisitions contribute to gr owth
8/7/2019 final tata tea
http://slidepdf.com/reader/full/final-tata-tea 17/22
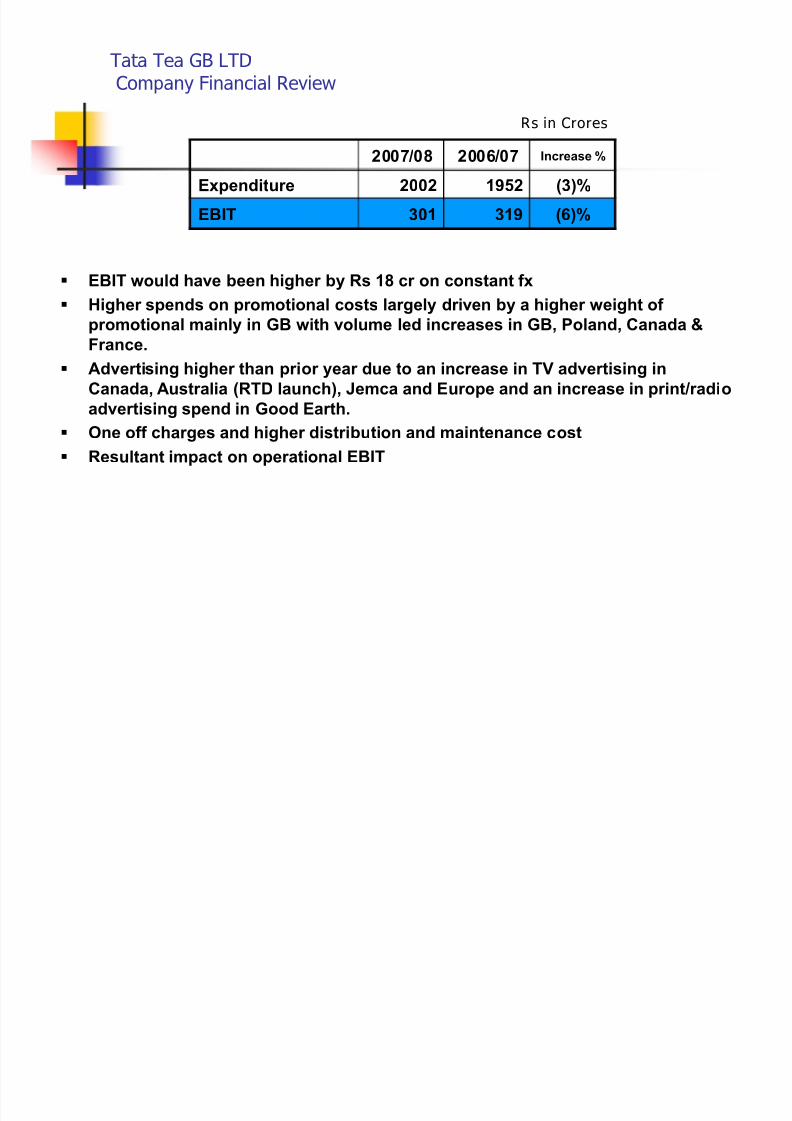
Tata Tea GB LTDCompany Financial Review
2007/08 2006/07 Increase %
Expenditure 2002 1952 (3)%
EBIT 301 319 (6)%
Rs in Crores
EBIT would have been higher by Rs 18 cr on constant f x
Higher spends on pr omotional costs largely driven by a higher weight of
pr omotional mainly in GB with volume led increases in GB, Poland, Canada &
France.
Advertising higher than prior year due to an increase in TV advertising in
Canada, Australia (RTD launch), Jemca and Eur ope and an increase in print/radio
advertising spend inGoo
d Earth. One off charges and higher distribution and maintenance cost
Resultant impact on operational EBIT
8/7/2019 final tata tea
http://slidepdf.com/reader/full/final-tata-tea 18/22
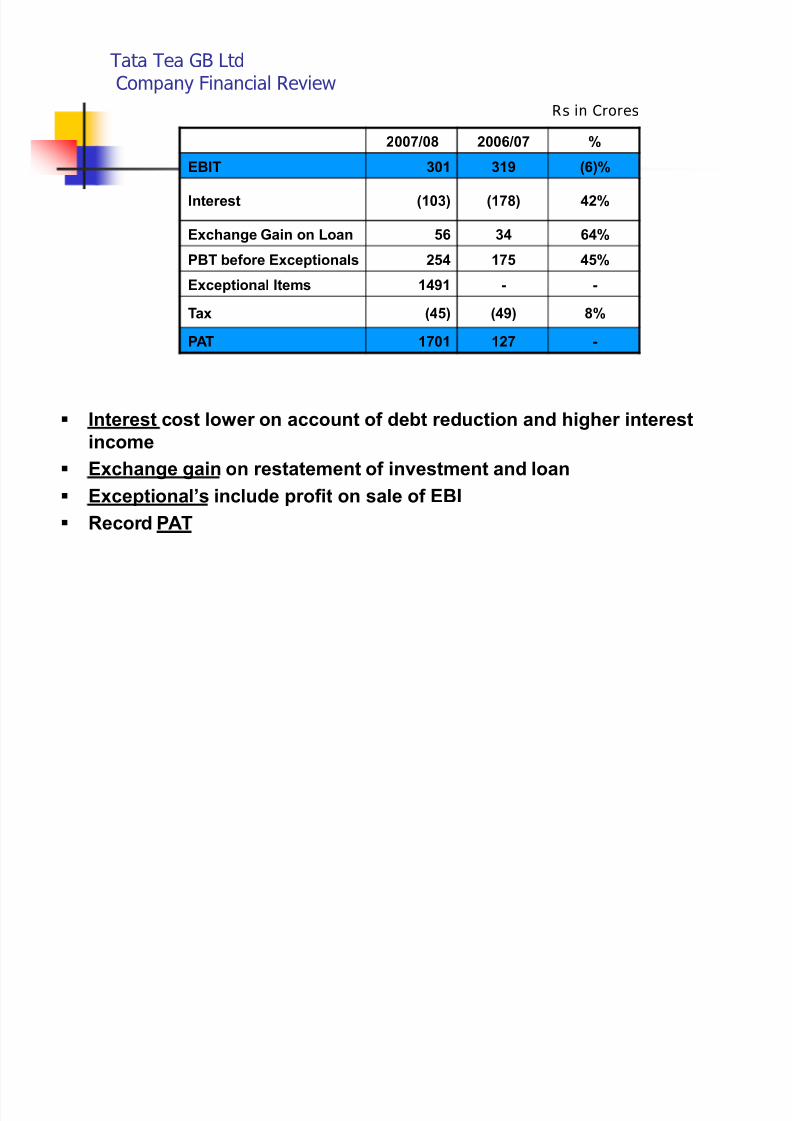
Tata Tea GB LtdCompany Financial Review
2007/08 2006/07 %
EBIT 301 319 (6)%
Interest (103) (178) 42%
Exchange Gain on Loan 56 34 64%
PBT before Exceptionals 254 175 45%
Exceptional Items 1491 - -
Tax (45) (49) 8%
PAT 1701 127 -
Rs in Crores
Interest cost lower on account of debt reduction and higher interestincome
Exchange gain on restatement of investment and loan
Exceptional¶s include pr of it on sale of EBI
Record PAT
8/7/2019 final tata tea
http://slidepdf.com/reader/full/final-tata-tea 19/22
Strategy & Future Outlook
High value specialty and green teas
Beverages
Coffee portfolio
Water
New products
8/7/2019 final tata tea
http://slidepdf.com/reader/full/final-tata-tea 20/22
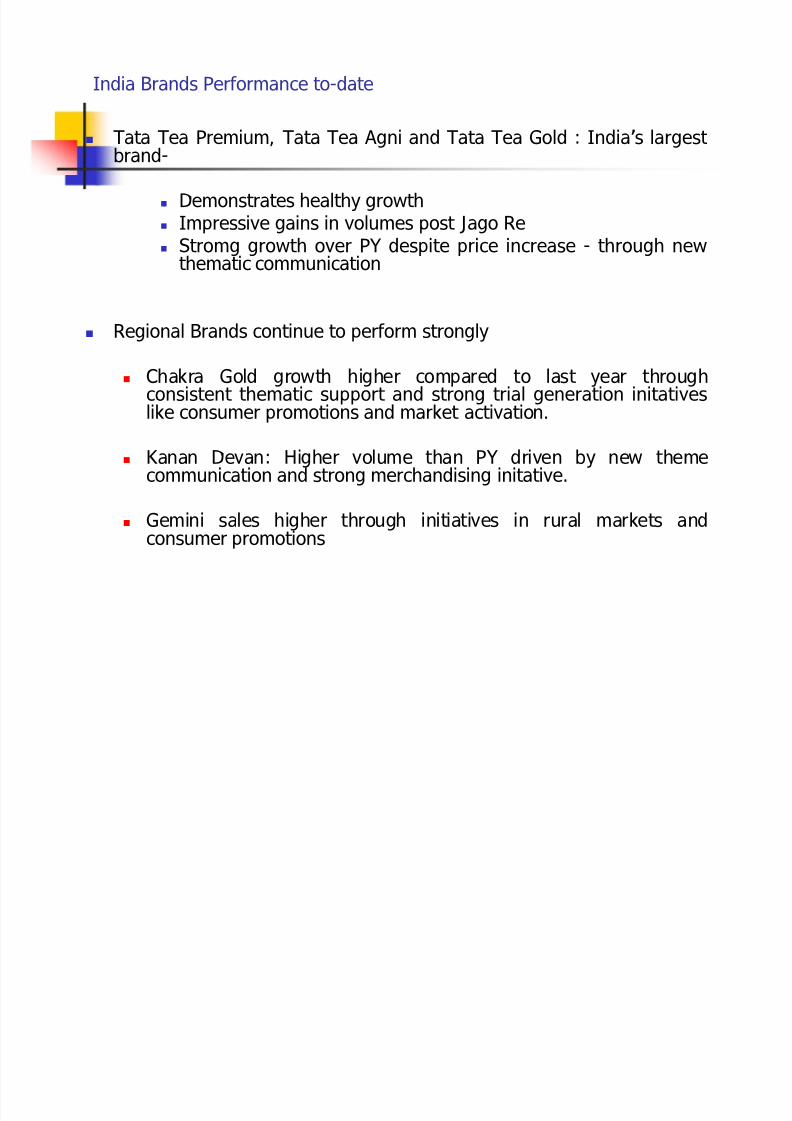
India Brands Performance to-date
Tata Tea Premium, Tata Tea Agni and Tata Tea Gold : Indias largest brand-
Demonstrates healthy growth Impressive gains in volumes post Jago Re Stromg growth over PY despite price increase - through new
thematic communication
Regional Brands continue to perform strongly
Chakra Gold growth higher compared to last year throughconsistent thematic support and strong trial generation initatives
like consumer promotions and market activation. Kanan Devan: Higher volume than PY driven by new theme
communication and strong merchandising initative.
Gemini sales higher through initiatives in rural markets andconsumer promotions
8/7/2019 final tata tea
http://slidepdf.com/reader/full/final-tata-tea 21/22
BIBLIOGRAPHY:Tata Tea Ltd
Analysts Meet Annual Results (2007/08)

8/7/2019 final tata tea
http://slidepdf.com/reader/full/final-tata-tea 22/22
THANK YOU.