environmental knowledge for disaster risk management · gupta, anil k. and nair, sreeja s. (2011)...
TRANSCRIPT


EditorsAnil K GuptaSreeja S. Nair
ekDRM Secretariat
National Institute of Disaster Management
IIPA Campus, New Delhi - 110 002
Copyright
© ekDRM Secretariat, 2011
Citation
Gupta, Anil K. and Nair, Sreeja S. (2011) Environmental
Knowledge for Disaster Risk Management,
ekDRM Secretariat (GIZ-NIDM), P 128
Acknowledgements
Dr. Sandhya Chatterji, Dr. Florian Bemmerlein-Lux,
Dr. Santosh Kumar, Dr. Chandan Ghosh
Conference Organised by
NIDM & GIZ-ASEM
Editors
Anil K Gupta
Sreeja S. Nair
Design & Printed by
CELLULOID
318, Patparganj Industrial Area
Delhi - 110 092
e-mail: [email protected]


Contents
Sustainable Rural Development for Disaster Risk Reduction 1P. C. Kesavan and M.S. Swaminathan
Flood Warning in Bavaria, Germany 12Alfons Vogelbacher
Epidemiological Disasters: Role of Environmental Knowledge 28Jugal Kishore, Tanu Anand
The Role of Land-use Planning in Chemical Disaster Risk Management 42Christian Jochum
Disasters due to Unplanned Urbanisation 50T. V. Ramachandra
Natural Resource Management Policy Implications on Disaster Risk Management Practices: Insights from North-East Cambodia 66Kathlyn Kissy H. Sumaylo
Role of Legislations and Policies in Reducing Disasters and their Impact 82Indrani Chandrasekharan and Anil K. Gupta
Bamboo Green Belts-Innovative Option for Alternative Livelihood & Sustainable Coastal Protection 95K. G. Thara
Invasive Alien Species – A Massive But Slow Way to Catastrophes 101Sas Biswas
Environmental Knowledge for Management of Hydro-meteorological Disasters 106Anil K. Gupta, Sreeja S. Nair and Vinod K. Sharma
Disasters and the Environment: A Review of Opportunities 118Charles Kelly and N. M. Prusty

Prologue
Hydro-meteorological disasters particularly floods, drought, desertification, cyclone,
extreme weather events, pest attack, forest fire, man-animal conflict are inextricably linked
with environmental systems, resources and ecosystems. Environmental challenges and
their complexities have been growing with the advancement in human development and
economic stewardship. Poor understanding of the environment – its structure, function, re-
sources, especially at the level of planners and policy makers, have resulted in increasing
frequency and intensity of hazards in nature.
Understanding of the environment, its processes and resources are important for the
early detection of hydro-meteorological hazards, prediction of disaster risk and scenarios
and in evolving mechanisms for effective mitigation and response strategies. Concerns for
environmental protection have gained momentum due to their importance in livelihood se-
curity, climate-change adaptation, vulnerability reduction, and post-disaster relief, recovery
and reconstruction aspects of disaster management.
The recent cooperation of the National Institute for Disaster management and the
Deutsche Gesellschaft fur Internationale Zusammenarbeit (GIZ) GmbH under the aegis of
the Advisory Services in Environmental Management (ASEM) programme in India, focuses
on three main aspects, viz. climate-change, natural resources and land-use changes as drivers
of hydro-meteorological risks and associated vulnerabilities. The ‘Environmental Knowledge
for Disaster Risk Management (ekDRM)’ project aims at capacity development in disaster risk
management by advancing environmental knowledge, particularly the use of statistics and
space technology including remote sensing & GIS for decision support systems (DSS); spatial
planning for Na-tech disasters within the multi-hazard framework of disaster risk manage-
ment; environmental & natural resource legislation; role of EIA in disaster mitigation and
post-disaster recovery; environmental services especially shelter, water & sanitation, waste
management; and natural resource management for disaster risk reduction.
The ekDRM project methodology includes promotion of training methodologies in-
cluding blended learning (online plus classroom teaching), web-enabled human resource
development platform (training management), research/case studies, publication of refer-
ence/awareness materials, and knowledge dissemination through online journal, newsletter
and discussion forums on ekDRM themes. The international conference ekdrm2011 provides
a forum for academicians, trainers, researchers, policy makers and scholars from a wide range

of disciplines and institutions, to deliberate and discuss various aspects of environmental
knowledge application towards managing climate and water related disasters.
The conceptualization and commissioning of the ekDRM project owes much to Mr. P. G.
Dhar Chakrabarti, former Executive Director, NIDM and Ms. Sreeja S. Nair, Assistant Professor
(NIDM), Mr. Florian Bemmerlein-Lux (Ifanos c&p, Germany), Dr. Sandhya Chatterji (Ifanos c&p
India), and Mr. Raghu Babu (ASEM) for their keen interest and painstaking efforts. ekDRM
project of GIZ-NIDM cooperation shall be an academic furtherance to the objectives of ‘En-
vironment, Climate-change and Disasters Cell’ established at National Institute of Disaster
Management. Cooperation and Support of Mr. Hem Pande, Joint Secretary, Ministry of Envi-
ronment & Forests, and Dr. Neeta Bhushan, Director (Deptt of Economic Affairs) have been
important in facilitating project processing under ASEM.
Guidance from Mr. R. K. Srivastava, Executive Director, NIDM, and Joint Secretary (Disaster
Management) Ministry of Home Affairs, and cooperation of Prof. Santosh Kumar, Prof. Chan-
dan Ghosh, Dr. K. J. Anandha Kumar (NIDM), Dr. S K Das, Director General of Central Statistical
Organization and Dr. P S Roy,, Director, Indian Institute of Remote Sensing has been invalu-
able for organizing this conference. Support of Maj. Gen. (Dr.) J. K. Bansal, Hon’ble Member
of National Disaster Management Authority; AVM (Dr.) Ajit Tyagi, Director General of India
Meteorological Department; Maj. Gen. (Dr.) Siva Kumar, Head of Natural Resource Data Man-
agement Systems at Department of Science & Technology; Dr. Akhilesh Gupta, Advisor to
Minister for Science & Technology; Dr. Anil Kumar Singh, Deputy Director General (NRM), In-
dian Council for Agriculture Research; Prof. N. R. Madav Menon, Director, Dr. S. Radhakrishnan
Chair on Parliamentary Studies; Prof. P. C., Distinguished Fellow, M.S. Swaminathan Research
Foundation; Shri K.C. Gupta, Former Director General of National Safety Council; Dr. K.J. Ra-
mesh, Advisor, Ministry of Earth Sciences; Shri, N.M. Prushty; Chairman SPHERE India; Prof. V.K.
Sharma, Indian Institute of Public Administration; Dr. Luther Rangreji, Sr. Legal Advisor, MEA
are deeply appreciated and acknowledged.
Dr. Dieter Mutz, Director, GIZ-ASEM
Dr. Christina Kamlage Senior Project Manager, GIZ
Dr. Anil Kumar Gupta, Associate Professor, NIDMMay 5, 2011, New Delhi

ekDRM 2011 | 1
Sustainable Rural Development for Disaster Risk Reduction
P. C. Kesavan and M.S. Swaminathan
BackgroundThe word ‘disaster’ is variously defined in the literature and in this paper, it is defined as a
natural or man-made event that negatively affects life, property, livelihood or employment
often resulting in “permanent or almost irreversible changes” to human societies, ecosys-
tems and environment. Our solar system is estimated to have been formed about 4.56 bil-
lion years ago with a violent gravitational collapse of a small part of a giant molecular cloud,
which in turn was the result of an earlier explosion (13 to 20 billion years ago) of a subatomic
unit. The ‘Big Bang Theory’ explains it. Most of the collapsing mass collected in the centre,
forming the sun, while the rest flattened into a protoplanetary disc out of which the plan-
ets, moons, asteroids and other celestial bodies formed. Collisions between galactic bodies
are still going on in a cycle of annihilations and creations. Earth formed from such violent
events is inherently violent. Over the billions of years, after several major cataclysmic events,
Earth has become substantially but not entirely pacific. The geophysical disasters (e.g. earth-
quakes, and volcanoes) and the water and weather-related (hydro-meteorological) disasters
which occur at varying frequencies and intensities establish not only the violent past, but
also the violent present of our planet. Even more rarely, but without doubt, astro-physical di-
sasters (e.g. a meteorite colliding with our space ship Earth) have also occurred. One view is
that dinosaurs became extinct after a meteorite impact on Earth about 60 million years ago.
The astro-physical, geo-physical and hydro-meteorological extreme events are classi-
fied as ‘natural disasters’, whereas major accidents such as Chernobyl nuclear reactor acci-
dent (26th April 1986), and the Bhopal gas (methyl isothiocyanate) disaster (night of 2nd and
early hours of 3rd December 1984) are the man-made disasters. The March 2011 disaster in
Japan is unique in the sense that a major earthquake (M~8.9) induced a powerful tsunami
and the combined impact of these two caused serious structural damage to the nuclear
M. S. Swaminathan Research Foundation, Chennai.
2 | P. C. Kesavan et al
power reactors in Fukushima Daiichi and consequently explosions in the nuclear reactors
have led to release of radionucleides in sea water and atmosphere. As this paper is written
(April 11, 2011), no effective containment of radionucleides and radiation has been achieved.
This has raised serious questions on the safety of nuclear power reactors especially in the
areas known to have seismic activity. Several of Indian’s nuclear power reactors are required
to be set up along its long coastline (~ 7500 km) where the human population density is also
very high. About 30 percent people of India’s population of 1.20 billion live in the coastal
areas and they are highly vulnerable to hydro-meteorological (i.e. cyclones, floods, drought
etc.) disasters. Hence, one of us (MSS) has written on 15 March 2011 to Shri Jairam Ramesh,
Minister of State, Ministry of Environment and Forests, Government of India stating that his
concern about the safety of nuclear power plants located along the coast such as Kalpakkam
and Kudangulam in Tamil Nadu makes him feel that in addition to necessary technological
reinforcements, the bio-shields comprising of mangrove and non-mangrove species in the
coastal areas adjoining nuclear power plants should be effectively developed. There would
be effective second-line defense. Besides, the risk of sea level rise on account of global warm-
ing and the melting of ice and glaciers on high mountain systems and Polar Regions is quite
considerable to India and several small developing island states.
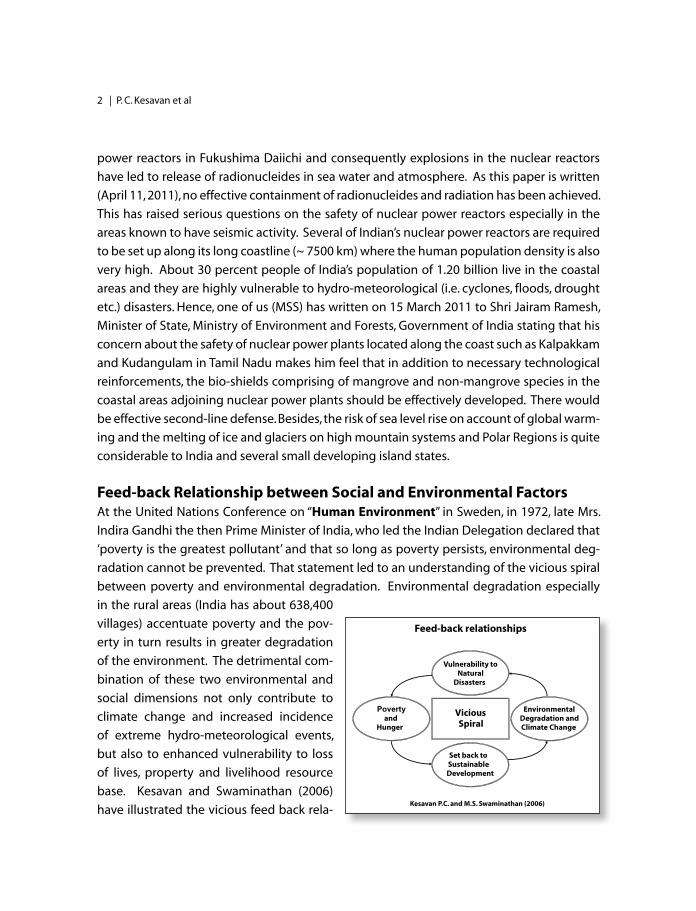
Feed-back Relationship between Social and Environmental FactorsAt the United Nations Conference on “Human Environment” in Sweden, in 1972, late Mrs.
Indira Gandhi the then Prime Minister of India, who led the Indian Delegation declared that
‘poverty is the greatest pollutant’ and that so long as poverty persists, environmental deg-
radation cannot be prevented. That statement led to an understanding of the vicious spiral
between poverty and environmental degradation. Environmental degradation especially
in the rural areas (India has about 638,400
villages) accentuate poverty and the pov-
erty in turn results in greater degradation
of the environment. The detrimental com-
bination of these two environmental and
social dimensions not only contribute to
climate change and increased incidence
of extreme hydro-meteorological events,
but also to enhanced vulnerability to loss
of lives, property and livelihood resource
base. Kesavan and Swaminathan (2006)
have illustrated the vicious feed back rela-

ekDRM 2011 | 3
tionships as follows:
In a subsequent paper, they (Kesavan and
Swaminathan 2008) have elaborated how
environmental degradation leads to social
disintegration through mass exodus of rural
families (i.e.‘environmental refugees’) to eke
out a living in urban areas and the burden of
poverty and responsibility of feeding the
household members fall on the shoulders of
women, often quite young. That is the ‘femi-
nization of poverty’.
The terms ‘environmental refugees’ and ‘feminization of poverty’ bring out not only
the state of abject poverty but also deprivation and helplessness particularly of rural wom-
en. When a disaster strikes they are the first ones to perish without being able to offer any
resistance and the survivors among them are the ones who have little resilience (i.e. coping
capacity) to bounce back to normal or near normal daily life. So, the vulnerability to natural
disasters has a strong social and gender dimension. Among the poor, women and children
bear the brunt of a natural disaster more severely than men. An example is that in Cuddalore
(a coastal town in Tamil Nadu) alone, the December 26, 2004 tsunami resulted in the loss of
lives of 391 women compared with that of 146 men. A large number of children clinging to
their mothers also perished. Aglionby (2005) has estimated that four times as many women
died in tsunami. The rural women, many with frequent pregnancies, high level of malnour-
ishment and lack of benefits of education, skills, economic independence and equal rights
in decision-making are particularly the most vulnerable. So, social, economic and gender
equities are as essential as technological empowerment of rural communities to achieve di-
saster risk reduction. Of course, technological development is very important. For instance,
the Global Environment Outlook 3: Natural Disasters (http://www.grida.no/geo/geo3/eng-
lish/448.htm) notes that the level of development is directly proportional to the severity
of destruction and number of deaths to a given disaster. It is estimated that the average
number of people dying per reported disaster are 22.5, 145.0 and 1052 for countries with
high, medium and low level development respectively. Within India, the urban-rural divide
in terms of availability of technological support, communication, transport, clean drinking
water, sanitation, health care and medical facilities is very wide. Many basic amenities are still
lacking in thousands of villages even after 63 years of independence.
It is therefore necessary to integrate the environmental, social and economic dimen-
sions of rural development with disaster preparedness. After assessing the December 26,

4 | P. C. Kesavan et al
2004 tsunami devastation of the Andaman and Nicobar islands, Kesavan and Swaminathan
(2007) have emphasized on the need to integrate sustainable development with disaster
preparedness for effective risk reduction.
Growing concern over Hydrometeorological DisastersSince poverty and environmental degradation form a vicious spiral, particularly in the rural In-
dia, the primary focus must be on sustainable pathways of development to link livelihood and
food security of the rural poor with ecological security of the region. A common observation
is that degradation of forests directly or indirectly affect the livelihoods of forest-dependent
communities and also increase the human vulnerability to natural disasters. Destruction of
mangrove forests results in lack of nutrient source in the estuaries for fish, prawns, crabs etc.
on the one hand and loss of an effective bio-shield to reduce the velocity of powerful cyclones
and tsunami waves. Restoring degraded mangrove forests provides livelihoods for fishers and
also protect them from severe hydro-meteorological disasters.
At the point, it must be mentioned here that among the natural disasters, the hydro-
meteorological disasters are increasing both in their frequencies of occurrence and also in
their destructive potential. The data published by the UNEP/DEWA/GRID-Europe 2004, sug-
gest that during 1991-2004, the world distribution of disasters by geological, biological and
hydro-meteorological origin were 10 percent, 14 percent and 76 percent respectively. With
a long coastline of about 7,500 km and thick density of human population (~360 million)
India needs to be quite prepared to deal with the risk of cyclones, floods, droughts etc. It is
of interest to note that in the 1990s, more than 90 percent of those killed in natural disasters
lost their lives in hydro-meteorological events (mainly droughts, floods, wind storms etc.,)
while earthquakes accounted for 30 percent of the estimated risk, they caused just 9 per-
cent of all fatalities due to natural disasters. In contrast, hunger caused by famines (due to
drought) worldwide killed 42 percent of people in the affected regions (IFRC 2001).
The hydro-meteorological disasters are not only increasing in their frequencies of oc-
currence but their destructive potential is also increasing (Emmanuel 2005) Global warming
induced climate change is implicated. Alarming scales of melting and recessions of glaciers
in the Himalayas, Poles and Greenland are causing sea level rise. Several small island nations
such as Kiribati, Seychelles, Maldives have more than 80 percent of land area at less than a
metre above the present sea level. Such low-lying islands may have to pay a high price in
terms of loss of human lies and property, if sea level rises to the extent forecast by global
climate models (UNEP/GRID; A rendal 2005). India’s Andaman and Nicobar archipelago and
Laccadives islands also come under the threat of sea level rise.
The Himalayan glaciers are indeed melting and it is reported that there is an overall
ekDRM 2011 | 5
reduction from 2,077 km2 in 1962 to 1,628 km2 in 2007. With an eventual disappearance
of Himalayan glaciers, the great rivers such as Ganges, Indus, Brahmaputra would no lon-
ger be perennial. This initial ‘ecological catastrophe’ would directly result in “agricultural
catastrophe”(Brown, 2008). A similar happening is likely in China for Yangtze and Yellow
rivers fed by the Himalayan glaciers. China and India have world’s largest human population
and are also the two large wheat and rice producing countries (Kesavan and Swaminathan
2011). Further, data show that with even a slight rise in average night temperature of about
0.5°C, the wheat yield in the north Indian plains decreases by about 450kg/ hectare (Sinha
and Swaminathan 1991). Sea level rise in the coastal areas would lead to soil erosion as well
as salinization of the soil and fresh water aquifers. These in turn would have adverse implica-
tions for food production and food security of India.
Paradigm shift in Disaster Risk ReductionFrom the foregoing, it is obvious that resource-poor, poverty-stricken, food insecure, largely
illiterate and unskilled rural women and men cannot reduce their vulnerability unless their
living conditions improve and they are able to stand on their own feet. It has already been
discussed earlier that the famine of rural livelihoods is a major cause of environmental
degradation. Rural livelihoods for hundreds of millions of rural women and men cannot
be solved by establishing factories, promoting mining activities etc., with a major thrust
largely on jobless economic growth. Such activities are invariably akin to “mass production”
and “jobless economic growth”. In order to link the livelihood security of over 500 million
rural people with ecological security of their regions, there is need for development eco-
friendly market oriented rural enterprises by harnessing ecotechnologies. The ecotech-
nologies have pro-nature, pro-poor and pro-women orientation resulting from blending of
frontier technologies with traditional knowledge and ecological prudence of the rural and
tribal communities. The goal is to enable them to manage their local resources in a sustain-
able manner and develop ecoenterprises using ecotechnologies. As has been described
by Kesavan and Swaminathan (2006), knowledge and ecotechnological empowerment of
the rural women and men is the first step in improving the present helpless state of affairs.
Sustainable management of local resources and creation of sustainable livelihoods through
technological and knowledge empowerment provide not only means of income generation
and food security but also dignity and self-confidence. The largely “subsistence agriculture”
should be transformed into dynamic eco-agriculture combining crops, (cereal grains, pulses,
oilseeds, millets, vegetables, fruits etc.), farm animals for milk and meat and biodiversity. In
the coastal villages, culture fisheries, especially ornamental fisheries should be included. In
the coastal areas, conservation and enhancement of mangroves enriches harvest of edible

6 | P. C. Kesavan et al
marine organisms and also protects lives and livelihoods of the coastal communities against
severe cyclonic storms, tsunami etc. Illiteracy or inadequate literacy and lack of skill do
not handicap the rural women and men in mastering various ecotechnologies for ecoen-
terprises and making use of modern ICT for tele-conferencing, tele-commerce and for early
warning and disaster management purposes. Nearly four decades ago, Swaminathan (1972)
had emphasized that rural women and men could master the use of technologies through
a pedagogic method of ‘learning by doing’ and he coined the term ‘techniracy’ to describe
it. So, the experience at the M.S. Swaminathan Research Foundation is that rural people in
the Village Knowledge Centres (VKCs) master computer operations in very short time, say a
week, and take to useful ecotechnologies like fish to water. Eco-agriculture together with
eco-enterprises fight both the famines of food and rural livelihoods. Livelihoods for income
generation, agriculture for food production, technological and knowledge empowerment
for disaster preparedness and sustainable rural development bring about a “paradigm shift”
in the pathway to disaster risk reduction. This ‘paradigm shift’ initiated by the MSSRF in the
1990s revealed its immense usefulness in (a) forewarning the arrival of tsunami in the fisher
village Veerampattinam, in Puducherry on the 26th December 2004 and alterting people
to move away from shoreline to higher and safer grounds and (b) in organizing the relief
and rehabilitation in a disciplined and organized manner to avoid chaos and to ensure that
women, children and old and infirm people received food, water and medical aid.
The two dimensions of “paradigm shift” are the following:
� a shift from “post-disaster management” to “pre-disaster preparedness” through
technological and knowledge empowerment of the vulnerable rural women and men.
Ecotechnological empowerment and knowledge empowerment through establishing
people-owned, people-managed, Village Knowledge Centres (VKCs) with modern ICT
have played a role in the “paradigm shift”. The second aspect of the “paradigm shift” is
that in the VKCs established by the MSSRF, the development of ecoenterprises for liveli-
hood, conservation and enhancement of coastal bio-shield, initiatives for setting up VKCs
and disaster preparedness are “bottom-up” and participatory in approach.
� After the Indian Ocean tsunami of 26th December 2004 by which time MSSRF had set up
several VKCs and also Village Resource Centres (VRCs) with up-and down satellite link
in cooperation with the Indian Space Research Organisation (ISRO), the Government of
India enacted the Disaster Management Act 2005. It has much in common with the MSS-
RF’s model and its focus is on a paradigm shift from ‘post-disaster relief and rehabilita-
tion to improving the pre-disaster preparedness, initiating disaster mitigation proj-
ects and strengthening emergency response capacities. It has also established National
Disaster Management Authority (NDMA) as the apex body for disaster management in

ekDRM 2011 | 7
the country. The State Disaster Management Authorities (SDMAs) Chaired by respective
Chief Ministers at the state level, and District Disaster Management Authorities (DDMAs)
Chaired by the respective District Collectors and Co-Chaired by the elected representa-
tive of the “Zilla Parishad” in the respective districts have also been set up. During the
last five years of its existence, the NDMA has developed a number of disaster manage-
ment guidelines for dealing with extreme natural events such as floods, drought, cyclone,
earthquake, infectitious and other biological disasters, nuclear and radiological emer-
gencies, chemical disasters and disasters caused by terrorist activities, landslides and
snow avalanches. It has also developed guidelines for revamping of civil defence, medi-
cal preparedness and mass casuality management. It also addresses the technological,
social and management dimensions. However, these approaches need to be integrated
with basic elements of sustainable rural development, restoration and conservation of
ecosystems, as well s ecotechnological and knowledge empowerment of resource-poor,
small and marginal farming, fishing and landless rural families. These would usher in the
much-needed “bottom-up” approach necessary for an effective disaster risk reduction in
the rural areas, especially in the remote villages located in disaster-prone regions. Mod-
ern ICT tools, particularly the cell phones can play an important role in reaching the last
mile and last person. These would greatly help in developing a “bottom-up and partic-
ipatory” rather than a ‘top-down” system of preparedness. These will also enhance the
‘resilience’ or the “coping capacity” of the disaster-affected people to restore normalcy
within a short time. It may be recalled that despite best efforts, the civil societies and the
government could not repair extensive damage to boats, fishing nets etc. after Decem-
ber 2004 tsunami and consequently, the fisher families in Tamil Nadu suffered without
livelihood and food security for quite a long time. MSSRF facilitated alternate livelihood
(poultry, oyster mushroom) for the fisher women in one of the worst-affected coastal vil-
lage, ‘Sadraskuppam’, a village near the Kalpakkam nuclear power plants. These equip the
rural communities to stand on their feet to face the disaster whenever it could strike all of
a sudden. Appropriate protective response would be instantly needed. Hence, the vul-
nerable people themselves need to be trained, equipped and psychologically prepared.
Social, Environmental, Economic and Technological Factors at the Grassroot LevelIn as much vulnerability has social, environmental, economic and technological dimensions,
approaches to achieving disaster risk reduction must also address all of these in an integrat-
ed manner. These essentially sum up what one of us (M.S.S) had emphasized in an article,
“Beyond tsunami: An agenda for action”, in ‘The Hindu”, (Monday, January 17, 2005). In that

8 | P. C. Kesavan et al
article three following initiatives are proposed all along the coast viz., (i) strengthening the
ecological foundations of sustainable human security (ii) rehabilitating livelihoods and fos-
tering sustainable livelihood security, and (iii) putting in place knowledge centres in vulner-
able coastal villages. Also, these are implemented necessarily in a ‘bottom-up’, participatory
manner. Operationally, a cluster of ecoenterprises based on appropriate ecotechnologies
(which result when frontier technologies are blended with traditional knowledge and eco-
logical prudence) each with pro-nature, pro-poor, pro-nature and pro-employment is un-
dertaken in a village, it becomes a ‘biovillage’ (bios= living). This is indeed transforming a
village with conventional subsistence farming and sedentary lifestyle to a more vibrant agri-
business unit with a number of ecoenterprises run by enthusiastic self-help groups. Sustain-
able management of environmental resources for sustainable livelihoods links livelihood
security with ecological security. Technological and skill empowerment are through ‘tech-
niracy’ (i.e. a pedagogic method of learning by doing). Knowledge is power today. Locale-
and time-specific, demand-driven information is needed by the resource-poor, rural women
and men to overcome the problems encountered in crop and animal husbandry, fisheries,
marketing, health care, communication, transport, education etc., and also for awareness of
welfare schemes of the state and central governments; when young rural women who have
passed 7th or the 8th standard are trained in computer operations, they become the manag-
ers of the VKCs. With young women as the Heads of Knowledge Centres, many tangible and
intangible benefits occur. Income generation and enhancement of social esteem are clearly
tangible. Women connected with VKCs and VRCs gain self-confidence and participate in
decision-making processes at home and at grassroots’ Panchayat level. Enlightenment of
women leads to family planning and better education and better management of food and
nutrition security at the household level. And in case of any emergency caused by accidents,
or natural disasters, they are no longer helpless and incapable of appropriately dealing with
the situation. They also master the use of cell phones for contacting police, hospitals, fire
service, weather centres etc. These represent preparedness at the grassroot level. Women in
particular are known for conservation of forest trees, water bodies and biodiversity.
In nutshell, the biovillages together VKCs help in integrating sustainable rural develop-
ment with pre-disaster preparedness. The five Es Viz., economics, environment, (ecology
included), equity (gender and social), energy and employment are essential components of
pre-disaster preparedness.
New Dimensions of DisastersIt is a fallacy that technological innovations effectively thwart Malthusian scourge. Every
technology exerts a negative impact too. The green revolution of the 1960s and 1970s de-

ekDRM 2011 | 9
generated into greed revolution and resulted in serious environmental degradation and loss
of biodiversity. The modern satellite and computer linked technologies have created elec-
tronic pollutants in the space and land. So, the real situation is that both humanity and plan-
et Earth are crossroads. The “ecological footprint” has far exceeded the “biocapacity” of
Earth (Wackernagel et al, 2002). The Copenhagen Accord (2009) does not provide a concrete
action plant to contain the emission levels at or below 44 Gt CO2- eq. The national emissions
reduction pledges are insufficient to meet the objective of keeping the global warming to
below 2°C. An analysis by Rogelj et al (2010) suggests that the global warming could exceed
3°C by 2020. This means a catastrophe resulting from crossing over the “tipping point”. The
‘tipping point’ with reference to climate change is a point when global climate changes
from one stable state to another stable state. Transition to a new state occurs. And the tip-
ping event could be irreversible. Rockstrom et al (2009) show that the planetary boundaries
have already been transgressed in a number of parameters viz., concentration of CO2 in the
atmosphere, rate of biodiversity loss, nitrogen cycle, ocean acidification etc. So, tipping point
with regard to hydrological cycle will be highly catastrophic.
Notwithstanding controversies whether climate change is natural or man-made, the
fact of a climate change is well-established (Climate Change Reconsidered, The Heartland In-
stitute, Chicago, 2010). Predominantly agricultural, densely populated, and very long coast-
line countries such as India will need to be well-prepared to avert famine of food, drying up
of rivers and loss of biodiversity.
India’s action plan on climate change is to protect the poor and vulnerable sections of
the society through an inclusive and sustainable development strategy, that is sensitive to
climate change. The Prime Minister’s council on climate change has put emphasis on pro-
moting basic understanding of climate change, adaptation and mitigation, energy efficiency
and natural resource conservation. Eight National Missions Viz., (i) National Solar Mission (ii)
National Mission for Enhanced Energy Efficiency (iii) National Mission on Sustainable Habi-
tat, (iv) National Water Mission (v) National Mission for Sustainable Himalayan Ecosystem (vi)
National Mission for a Green India (vii) National Mission for Sustainable Agriculture and (viii)
National Mission on Strategic Knowledge for Climate Change with major goals of mitigation,
adaptation, and risk management have been identified.
These eight missions have much of their basic tenets and pathways based on the con-
cept of “evergreen revolution” proposed by Swaminathan (1996a;b;1999;2000;2002;2005). It
is particularly suitable to achieve productivity in perpetuity without accompanying ecologi-
cal harm in millions of resource-poor, small and marginal farms with nearly 2/3 of them lo-
cated in the rain-fed regions of farming. The National Commission on Farmers (NCF) under
the Chairmanship of Professor M.S. Swaminathan submitted its final report in October 2006.
10 | P. C. Kesavan et al
It has included a draft National Policy for Farmers incorporating its major recommendations.
These include technological, economic, environmental, social and gender aspects which
would greatly enhance resilience of Indian agriculture in an era of climate change with in-
creased incidence of hydro-meteorological disasters. There is no indication as yet that these
are under implementation now. It would seem that acute and sudden disasters are now
receiving some attention, but not the slow and chronic ones especially in the agricultural
front. We should remember that drought-related famines have killed far more number of
people, than the most serious earthquakes. So, the disaster risk reduction must have appro-
priate strategies to overcome the impact of a bad monsoon, as well as hydro-meteorological
disasters.
References � Aglionby, J. 2005 Four times as many women died in tsunami. Guardian Unlimited http://
www.guardian.co.uk/tsunami/story/0,15671,1445967,00.html.
� Brown, L.R.(2008) Plan B 3.0: Mobilizing to save civilization, W.W. Norton & Company, New
York, London, pp.398
� Climate Change reconsidered: The report of the Nongovernmental International Panel
on Climate Change, The Heartland Institute, Chicago, Illinois 60603, U.S.A, 2010, pp.708.
� Emanuel, K. (2005) Increasing destructiveness of tropical cyclones over the past 30 years.
Nature 436, 686-688 (doi:10.1038/nature03906)
� Global Environment Outlook 3, Past, present and future perspectives. Natural disasters.
See http://www.grida.no/geo/geo3/english/448.htm.
� IFRC 2001. World Disasters Report. See http://www.ifre.org/publicat/wdr 2001/
� Kesavan P.C. and Swaminathan M.S. (2007) The 26 December 2004 tsunami recalled:
Science and technology for enhancing resilience of the Andaman and Nicobar Islands
communities. Current Science 92 743-747.
� Kesavan P.C. and Swaminathan M.S.(2006) Managing extreme natural disasters in coast-
al areas, Phil. Trans.R.Soc.A 364, 2191-2216.
� Kesavan P.C. and Swaminathan M.S. (2008) Strategies and Models for agricultural sus-
tainability in developing Asian countries, Phil. Trans.R.Soc.B, 363, 877-891.
� Rogelj,J., Nabel, J. Chen, C., Hare, W., Markmann, K., Meinshausen,M., Schaeffer,M.,
Macey,K., and Hohne,N., (2010) Opnion: Copenhagen Accord pledges are paltry, Nature
464, 1126-1128.
� Rockstrom, J., Steffen, W., Noone, K., Persson, A., Chapin, F.S., Lambin,EF., Lenton,T.M., Schef-
fer, M., Fokle,C., Schellnhuber, H.J., Nykvist,B., Wit, C.A., Hughes,T., Leeuw,S.V.D., Rodhe,H.,
Sorlin,S., Snyder,P.K. Costanza,R., Svedin,U., Falkenmark, M., Karlberg,L., Corell,R.W.,

ekDRM 2011 | 11
Fabry,V.J., Hansen,J., Walker,B., Liverman,D., Richardson,K., Crutzen,P., Foley,J.A.( 2009), A
safe Operating space for humanity Nature 461, 472-475.
� Swaminathan M.S. (1972) Agricultural evolution, productive employment and rural
prosperity. Mysore, India: The Princess Leelavathi Memorial Lecture, University of Mysore.
� Swaminathan M.S.(1996a) Sustainable agriculture: Towards an evergreen revolution.
Delhi, India: Konark Publishers, Pvt. Ltd.
� Swaminathan,M.S. (1996b) Sustainable agriculture: Towards food security. Delhi, India:
Konark Publishers Pvt. Ltd.
� Swaminathan M.S., (1999) A Century of Hope: Towards an era of harmony with nature
and freedom from hunger. Chennai, India: East West Books (Madras) Pvt. Ltd.
� Swaminathan M.S. (2005) Beyond tsunami: An agenda for action. The Hindu, 17 January.
� Swaminathan M.S. (2002) From Rio de Janeiro to Johannesburg: Action Today and not
just promises for Tomorrow, East-West Books (Madras) Pvt. Ltd, 1-224.
� Sinha, S.K. and Swaminathan, M.S. (1991) Deforestation, Climate Change and Sustain-
able nutrition security: a case study for India. Climate Change 19, 201-209. (doi:10.1007/
BF00142227).
� Swaminathan M.S.( 2000) An evergreen revolution. Biologist 47, 85-89.
� Kesavan P.C. and Swaminathan M.S.(2011) Disaster Management in India, Oxford Com-
panion to Economics in India, Oxford University Press (India), New Delhi (in press).
� Wackernagel, M et al., Schulz,N.B. Deumling, D., Linares,A.C., Jenkins,M., Kapos,V., Mon-
freda, C., Loh, J., Myers,N., Norgaard,R. and Randers,J. (2002) Tracking the ecological over-
shoot of the human economy. Proc.Natl. Acad. Sci. USA, 99, 9266-9271.
� UNEP/GRID A rendal (2005). See http://maps.grida.no/go/graphic/sea_level_rise_due_
to_the_meeting.
12 | Alfons Vogelbacher
Flood Information Centre, Bavarian Environment Agency, Munich, Germany [email protected]
Flood Warning in Bavaria, Germany
Alfons Vogelbacher
IntroductionTimely warning of flood hazard is an essential part of precautious flood protection. Prolon-
gation of the forecast lead time enables more substantial protection measures like the build-
ing up of mobile walls. The effectiveness of the warnings mainly depends on the awareness
and preparedness of the recipients. Today the enhancement in information media i.e. the in-
ternet has lead to a much better reach ability of flood information and warning for everyone.
In Germany, the responsibility for a flood information service is assigned to the federal
states. Until 2000, the flood information service in Bavaria primarily served as a reporting ser-
vice that collected water gauge records and forwarded these – supplied with a trend com-
ment – to those concerned. The amount of quantitative flood forecasts was limited. Simple
methods were used, e.g. regression functions for gauges.
In the last 12 years, Bavaria has suffered under a series of extreme floods. There was a
large flood at the Whitsuntide in the year 1999 in Southern Bavaria and the Alps. The centres
of damage have been located at the Danube River and the southern tributaries Iller, Lech
and Isar. Three years later the heavy rainfalls in August 2002 caused extreme floods of the
Danube River and its northern tributary Regen in East Bavaria. In January 2003, the northern
parts of Bavaria, especially the Basin of the River Fränkische Saale, a tributary to the Main in
the Rhine Basin, suffered a large flood. Recently, the flood in August 2005 hit the same region
as 1999. Partly the flood peaks even surpassed the peaks of 1999.
Because of the increasing damage and the increasing number of floods - in particularly
the Whitsuntide Flood in 1999 - the Bavarian State government established an Action Pro-
gram for sustainable flood protection led by a long term flood prevention and protection
strategy until 2020. The Action Program is part of the Integrated River Basin Management.
Actions have been taken at the same time in the fields of natural retention, structural flood

ekDRM 2011 | 13
measures and flood precaution including new challenges like Climate Change. According to
the resolution of the Bavarian State Government in May 2001 there will be an investment of
2.3 billion Euros until 2020 in the fields of improvement of natural detention, improvement
and construction of structural flood measures and flood precaution.
Part of this program was the development of flood forecast models as well as the imple-
mentation of an automatic online rain gauge network and an optimisation of the existing
river gauge network. The dissemination of flood information based on means of modern
communication and its reliability was improved.
Today, hydrological forecasts have become an important part of the flood information
service in Bavaria, since hydrological models cover almost the total area of Bavaria (70 000
km²). The hydrological forecasts are calculated daily on business days and more frequently
during flooding periods in five regional flood forecast centres. The decision-makers within
the Bavarian Water Management Authority can access the results, i.e. forecasts for around
600 gauge stations over whole of Bavaria. Additionally, the forecasts of about 100 selected
gauging stations are published in the web site (http://www.hnd.bayern.de) for a horizon of
6–24 h depending on the catchment area.
Organisation of Flood Warning in BavariaFlood warning systems in river basins and on lakes are the responsibility of the German fed-
eral states. For this purpose, Bavaria has set up a Flood Warning Service that collects data on
water levels, run-off and precipitation, analyses this information, draws up flood alert plans
and warns people affected. Connected to the Flood Warning Service are the state offices for
water management, the county district offices, towns and communities. The coordinating
unit is the Flood Warning Centre in the Bavarian Environment Agency (Fig. 1). Five regional
Flood Forecast Centres are responsible for calculating and preparing flood predictions for
the basins of the rivers Main, Danube, Isar, Iller/Lech and Inn respectively.
The respective centres are put into action as soon as rivers or lakes rise above defined
threshold values. The water levels at the gauging stations are then read on an hourly basis
and flood predictions are updated continuously. The state offices for water management put
out regional alerts, while the Flood Warning Centre issues a flood status report for all Bavaria.
Alert plans make sure that this information is passed on through the county district
offices to the affected towns and communities. Towns and communities are the last link in
the alert channel and play a particularly important role. The alert plans specify who is to be
warned, when and how, and what measures are to be taken at which gauge levels.
For this case, the local authorities have plans of endangered areas or buildings and plans
for the organisation of flood defence systems.

14 | Alfons Vogelbacher
The flood warnings have to be actively transmitted to the concerned recipients. Once
warned, the recipient has the responsibility to inform himself about the threatening flood.
For this purpose, the state offices for water management, the regional flood forecast centres
and the flood information centre provide updated data, forecasts and flood reports via the
website as well as flood news via a telephone service to the public and authorities. Actual
water levels of all gauging stations are provided via TV-text and telephone service.
Figure. 1 Reporting and information scheme of the Bavarian flood information service
Role and Operation of the Flood Forecast CentresIn Bavaria there are five flood forecast centres corresponding to the main river catch-
ments (Danube, Inn and Main) and Danube tributary catchments where large reservoirs
have to be operated (Iller-Lech and Isar). They are responsible for operational flood fore-
cast. The decentralised and river catchment-related organisation of the flood forecast
allows the use of experiences with local knowledge and the operation of large reservoirs
in-situ. The model-based flood forecast service supports the services of the regional wa-
ter authorities and the flood information centre. In the case of the flood forecast centres
Iller-Lech and Isar, respectively, the flood forecast service additionally assists in the man-
agement of reservoirs.
The state offices for water management are responsible for local flood forecasts and
the dissemination of flood information in the regional flood information service, the ap-

ekDRM 2011 | 15
plication of models for reservoir operation and for the data service (collecting and provid-
ing data of the river gauge network).
The regional flood forecast centre informs the main reporting offices within the forecast
area and the flood information centre, if due to the flood forecast a lasting overrun of the
warning limits has to be expected. After receiving this information, the main reporting of-
fices have to provide the river gauge data on an hourly basis.
In case of a flood event the flood forecasts are calculated three or four times per day at
defined points of time. If necessary, the flood forecasts are updated every hour.
The forecast centres calculate forecasts for all river gauges implemented in the flood
forecast models. The complete flood forecast simulation results are made available for the
regional water authorities, regional governments and ministries by a Java-Client application
within the data network of the Bavarian water management administration. In the intranet
and internet, only forecasts of selected river gauges and for reduced forecast horizons are
published. The regional water authorities have access to the flood forecasts for all river gaug-
es and can use these results for their own forecasts.
Water level and flood riskThe basic Information in flood warning is the water level at the gauge site – measured or
forecasted. For interpretation in respect to the flood risk and to protective measures more
information is needed. First, there are 4 alert levels that deliver plain and simple information
Fig. 2: Flood Alert Levels

16 | Alfons Vogelbacher
on the extent of flooding. At each individual gauging station it is determined which water
levels correspond to the respective flood alert levels (s. Fig. 2). Second, there are tables for
each gauging station connecting water level to a description of the flood extent, protective
measures and flood hazard (Tab. 1). The communities are responsible for the maintenance
of plans linking water level to flood risk and protective response. They keep plans of endan-
gered areas or buildings and plans for the organisation of flood defence systems. Protective
responses in Bavaria are: manageable flood polders, major storage dams in headwater, flood
protection walls, mobile closures, superstructures, sandbags and evacuation.
W cm Place Type of measure or hazard
630 Passau Advance warning to the police by the regulatory agency
720 Passau Flooding of the upper Zollände in Passau and the harbour area Racklau.
720 Passau Flooding of the Fritz-Schäffer-Promenade at the tavern -Tiroler-, removal of the
motor vehicles.
740 Passau Flooding of the Fritz-Schäffer-Promenade, traffic stoppage.
750 Passau Evacuation of the parking lots at Schanzl.
750 Passau Traffic blocking at the upper Donaulände
770 Passau Flooding of the high road ST 2132 at Löwmühle
770 Passau Evacuation of garages and souvenir shops at the lower Donaulände. flooding of
the harbour area Racklau
780 Passau Highest water lever for water navigation (HSW).
790 Passau Flooding of the approach to the Nagelschmied- and Höllgasse
800 Passau Flooding of the posterior Donaulände downstream of the Schanzl bridge.
800 Passau Warning by loudspeaker for the upper Donaulände, Regensburgerstreet,
Rindermarkt and Ort.
810 Passau ‘Ort’ partly flooded.
Table 1 : Flood hazards and protective measures in relation to the water level at gauging Station Passau Donau (cut version)
More information about flood risk, vulnerability and hazard
Online Maps (www.iug.bayern.de)
Via Internet, online maps of the designated flood areas and preliminary assured flood areas
can be reached by the public. The Information Service Flood Affected Areas (IÜG) gives an
overview of the status of the investigation and determination of flood risk in Bavaria. Flood-

ekDRM 2011 | 17
ed areas for frequent, medium and rare flood events and water-sensitive areas are displayed.
Where available, also the water depths in flooded areas and observed floods are shown.
The EU Directive on the assessment and management of flood risks
The EU Floods Directive on the assessment and management of flood risks went into force
in 2007. This Directive now requires Member States to assess if all water courses and coast
lines are at risk from flooding, to map the flood extent and assets and humans at risk in these
areas and to take adequate and coordinated measures to reduce this flood risk. This Direc-
tive also reinforces the rights of the public to access this information and to have a right of
codetermination in the planning process.
The Directive‘s aim is to reduce and manage the risks that floods pose to human health,
the environment, cultural heritage and economic activity. The Directive requires Member
States to first carry out a preliminary assessment by 2011 to identify the river basins and
associated coastal areas at risk of flooding. For such zones they have to draw up flood risk
maps by 2013 and establish flood risk management plans focused on prevention, protection
and preparedness by 2015 (http://ec.europa.eu/environment/water/flood_risk/index.htm).
Website of the Flood Information Service
The website of the Flood Warning Service (Fig. 3) gives access to detailed background infor-
mation and to the latest water level readings and recorded measurements. Maps and Charts
give a quick overview of the current status 24 hours a day. These sites give access to water
level and run-off data from river and lake monitoring stations as well as to measurements
provided by precipitation and snow depth monitoring stations.
Fig. 3: Website of the Flood Information Service

18 | Alfons Vogelbacher
In a flood event the Flood Bulletin (status report) gives an overview of the flood situ-
ation and a forecast of the expected further development. The bulletin is updated several
times a day. In their Warnings the state offices for water management provide a detailed
description of current and predicted flooding for each one of their county districts that are
threatened. In addition reports on past flood Events as well as Links, addresses and phone
numbers of other contact partners can be found on the website (www.hnd.bayern.de).
Real-Time Data CollectionThe flood warning system uses all reachable data of the different measurement networks in
hydrology and meteorology, weather radar products and numerical weather forecasts from
the weather services and data of the hydro power plants.
� Transmission of the data is done by:
� Polled Systems (sampling of data via telephone landline, digital mobile as GSM (GPRS))
� Push Systems (active transmission from station to server via ISDN or GSM)
� NFS file transfer in the computer network
� Ftp transfer and http-request between computer in different networks and from neigh-
bouring countries
Water Level and Discharge DataThe river gauge network in Bavaria consists of about 600 stations, 560 of which are equipped
with telemetric data transmission. 320 river gauges are so-called “report river gauges” for
the flood information service. The extreme flood events in the Danube river catchment in
May 1999 and August 2002 as well as in January 2003 in the Main river catchment revealed
that equipment and data transfer were not sufficient. Failures and breakdowns of the mea-
surement installation and data supply occurred. To ensure the data supply, most of the river
gauges have been equipped with redundant measurement devices and telecommunica-
Gauging Station at the river Isar in flood stage

ekDRM 2011 | 19
tion channels. For telemetric data transfer, the conventional telephone network or mobile
telephone systems GPRS are used. The remaining river gauges in the flood information ser-
vice have at least redundant measurement devices. Furthermore, there were numerous river
gauges where the extreme floodwater stages could not be assessed. Constructional mea-
sures will be taken within the next years.
For the flood forecast models, discharge is the observation, and thus reliable stage-dis-
charge-relationships are needed. However, often discharge is not measured during flood
situations and additionally it is associated with large uncertainties. To check and improve the
rating curves especially in the high-flow extrapolation range, a project has been started at
the Bavarian Environment Agency where hydraulic simulations for about half of the Bavarian
river gauges shall be conducted.
There are also water level data available from the Hydrographical Services of Austria,
from the adjacent Federal States of Baden-Wuerttemberg, Thuringia, Hesse as well as from
the Federal Waterway and Navigation Administration for the national waterways. For the
flood forecast models, discharge data at the power stations are required. These data are ob-
tained in a data exchange with different operators of hydro power stations. The data of most
of the external partners are imported per ftp or http-request via the internet into the main
database of the flood information service.
Hydromet InputsMost of the precipitation data are provided by a joint automatic monitoring network, oper-
ated by the German Weather Service and the Bavarian Environment Agency with about 285
stations. Additionally, data from the monitoring networks of the private company Meteo-
media, the Bavarian Agency of Agriculture and the Bavarian Avalanche Warning Service are
used. Because of transboundary tributaries, also precipitation data of the Central Institute of
Meteorology and Geodynamics, Vienna, and the Austrian hydrographical services as well as
of the federal states of Baden-Wuerttemberg and Hesse are collected. Overall, precipitation
data of 700 stations are available online.
Besides precipitation, snow height, snow water equivalent, air temperature, wind speed
and radiation are the most important meteorological observations for snow melt calcula-
tion. However, these quantities are measured in a lower spatial resolution. The snow mea-
surement network has been considerably increased within the last years. At present, the
snow water equivalent is measured at approx. 120 stations.
The spatial assessment of precipitation can be improved by using weather radar mea-
surements. The adjustment of radar signals to the measurement data of the ground precipi-
tation network allows a spatially high-resolution assessment of rainfall events. The opera-

20 | Alfons Vogelbacher
tional products of the German Weather Service project RADOLAN (radar online-adjustment)
are available since 2005. The composite data of the radar echoes and the products adjusted
to the ground monitoring network are received each hour via FTP from the German Weather
Service. Since 2008, the RADOLAN-data can be used directly as input data for the operational
flood forecasts.
Numerical Weather Prediction (NWP)Several weather forecasts are available for operational flood forecasting in Bavaria. Usually,
the results of the numerical weather forecast models of the German Weather service are used.
COSMO-EU is the main product of the German Weather service for the forecast horizon of 3
days (www.cosmo-model.org). The most recent product is COSMO-DE, which has been used
for operational flood forecasting in Bavaria since 2008. The high horizontal resolution of 2.8
km allows direct simulation of thunderstorm cells of the size of only a few kilometres. Forecast
runs are started every 3 h. Within the model runs, updated radar measurements are integrated.
For Southern Bavaria, the results of the ALADIN-Austria model operated by the Central
Institute of Meteorology and Geodynamics in Vienna are available additionally (Vogelbach-
er 2007). For the purpose of comparison, forecast products such as the American GFS (Global
Forecast System) model or the ECWMF (European Centre for Medium-Range Weather Fore-
casts) model are used at times.
Since December 2007, the model output of COSMO-LEPS (Consortium for Small-Scale
Modelling – Limited-area Ensemble Prediction System) of 16 ensemble members is available
and used in flood forecasts.
To spatially assess the water release from snowmelt and rainfall, simulation results of
the snowmelt model SNOW4 of the German Weather Service are used. Water yield and water
equivalent of the snow cover are given in a spatial resolution of 1 × 1 km in an hourly time step.
Weather and storm warnings of the German Weather Service are sent via FAX, e-mail or
are made available via the internet. Further information can be obtained by telephone con-
tact with the meteorologist in charge at the regional office of the German Weather Service in
Munich. For defined geographical regions in Bavaria, the meteorologist gives an evaluation
for areal precipitation amounts.
On-Line Data BaseAll of the data are continuously fed into a set of MySQL relational data base tables to form
the online master data base. The master data base is replicated continuously on up to 15
other web servers with a Linux-Apache-MySQL system. These servers are located at 3 re-
gional flood forecast centres and in the computing centre of the state of Bavaria for internet

ekDRM 2011 | 21
access. If the master data base fails the other servers can take over the function of a master.
The automated import procedures can be run on each of the servers in the network.
The data base contains the following data (number of stations in parenthesis):
� Metadata for gauging-stations, meteo-stations, precipitation-stations, data transfer, sta-
tistics, level-discharge curves, flood stages, warning levels, flood-risk plans etc.
� Alert and dissemination plan with 3991 addresses and 1425 messages
� reports, like the flood bulletins and warnings,
� water level & Discharge (1077) with Forecasts (184)
� precipitation (919)
� Snowfall level (627)
� Water Equivalent (377)
� Atmospheric pressure (71)
� Global Radiation (191)
� relative Air Humidity(406)
� Sunshine Duration (92)
� Air Temperature (511)
� Dew Point Temperature (148)
� Wind Velocity (365)
� Snowmelt and Rain from SNOW4-model 1kmx1km grid-data
� Water Equivalent of the Snow Cover from SNOW4-model 1km x 1km grid-data
Flood Forecast Model SystemForecast models completely cover the area of Bavaria (Fig. 4). The rainfall–runoff model pre-
dominantly used is LARSIM (Ludwig et al. 2006). Because of its robust and relative simple
components, the model is suitable for operational forecast (Gerlinger et al. 2000). LARSIM
can be applied as an event-based flood model as well as a water balance model for continu-
ous simulations. For the time being, the operational LARSIM flood forecast models are imple-
mented in event-based mode. The water balance model mode is currently being introduced.
For the Iller catchment the water balance mode of LARSIM has been implemented, and is
now in an operational pilot phase.
The rainfall–runoff models used are deterministic models, which calculate discharge
rates as response to precipitation input. In the simplest case, the effective precipitation is
determined with a runoff-coefficient depending on the antecedent moisture content of the
area. According to non-linear relations between precipitation and resulting discharge, the
runoff-producing precipitation is adjusted by superposition calculations.
The catchment parameters can be subdivided either in gridded or irregular sub-catch-

22 | Alfons Vogelbacher
ments. Each sub-catchment is characterised by coordinates, elevation, length of watercours-
es and schematic river cross-section with roughness coefficients. On a grid or sub-catchment
basis, the relevant runoff processes are calculated using specific hydrological methods (Lau-
rent et al. 2010).
Snow accumulation and snowmelt can be considered as well as artificial influences (e.g.
storage basins, diversions, water transfer between different catchments). The model calcula-
tions are based on hourly data of precipitation, discharge, precipitation forecasts, as well as
on snowmelt calculations and forecasts. The forecasts for the tributaries based on rainfall–
runoff models are linked to hydrodynamic models.
The basis for the flood routing model at the Main river is the hydrodynamic model WA-
VOS of the German Federal Institute of Hydrology. The hydrodynamic model FLORIS 2000
(Reichel 2001) is run for the Danube, the Lech and for the Inn River. The standard operating
regulations of the hydropower stations are included in these models.
The operational flood forecast model system works in a so-called served operation. First,
the rainfall–runoff models have to be run to the connecting gauge for the hydrodynamic
model. Besides forecasts of the rainfall–runoff models for the Bavarian region, external flood
forecasts for tributaries are needed and implemented in the system.
Description (No.)*
(1) Danube upstream of Lech
(2) Lech
(3) Altmuehl
(4) Naab
(5) Regen
(6) Danube incl. Paar
(7) Isar
(8) Chiemsee
(9) Traun
(10) Mangfall
(11) Rott
(12) Inn
(13) Danube downstream Regensburg
(14) Upper Main
(15) Regnitz
(16) Fraenk. Saale
Fig. 4: Overview of the hydrodynamic and rainfall-runoff models used for operational flood forecast in Bavaria

ekDRM 2011 | 23
For example, the Danube forecasts upstream of the Iller tributary are produced by the
Federal State of Baden-Wuerttemberg. For the Inn catchment, flood forecasts are needed for
the Inn upstream of Kufstein which are supplied by the federal state of Tyrol (Austria) and
for the Inn tributary Salzach, supplied by the federal state of Salzburg (Austria). The Salzach
River is within the responsibility of the federal government of Salzburg where they use HY-
DRIS (Hydrological information system for flood forecast).
Using rainfall–runoff models, the forecast period is limited by the precipitation forecast.
To adjust to the COSMO-EU model of the German Weather Service, 72 h forecasts are pro-
duced by default. However, forecasts for shorter periods are published on the internet. At
present, the hydrodynamic models are run for 48 h forecasts (Vogelbacher 2007). Since De-
cember 2007, ensemble precipitation forecasts have been used operationally for the catch-
ments of the Rivers Regen, Fraenkische Saale, Upper Main, Regnitz and Mangfall and are
currently being evaluated.
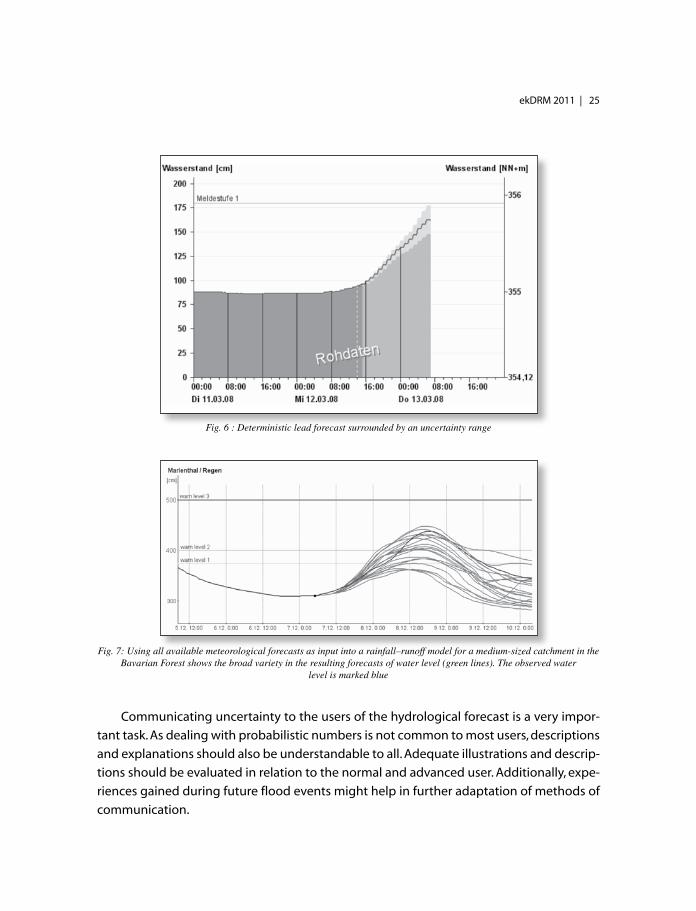
Uncertainty of ForecastExperiences with published forecasts during former flood events have shown the
need for communicating the uncertainty associated with hydrological forecasts to the
public and the responsible persons in civil protection. Expectations on the reliability
of flood forecasts are high. Publishing only one forecast as a quasideterministic fore-
cast with one value at a given time even raises these expectations by pretending to
be exact. Therefore, one aim of computing uncertainty is to publish it along with the
corresponding forecast. The resulting illustration should make the numeric forecast
less absolute for the average user and communicate the probability of a certain water
level to be reached.
The uncertainty in the flood forecast is the result of uncertainties in input data, in
model simplifications, in the estimation of the model parameters and in operational
practice of forecast generation. Each of these components bears a particular uncer-
tainty, which affects the uncertainty of the simulation output. In many cases, especially
in headwaters, meteorological forecasts are the most dominant source of input data
uncertainty. Often there are large differences in rainfall amounts between forecasts
originating from different meteorological models and between the different model
runs of the same model. Not only the amount, but also the spatial and temporal dis-
tribution of precipitation can vary between different forecasts and the measured pre-
cipitation affecting the output of the hydrological model, especially in smaller catch-
ments. Therefore, ensemble forecasts should be included in the calculation of total
output uncertainty to account for the dynamic uncertainty of the meteorological

24 | Alfons Vogelbacher
forecast. If the forecast horizon lies within the travel time of a flood wave observed
upstream, the runoff forecast is expected to be more accurate as it only involves the
single process of flood routing.
The relative influence of the different sources of uncertainty depends on different fac-
tors like forecast horizon, meteorological conditions and up- or downstream location of the
catchment. With increasing forecast horizon, the influence of the uncertainty of the meteo-
rological forecast increases (Fig. 5).
Fig. 5: Uncertainty increases with the lead time
Considering all the sources of uncertainty, the optimal approach would be to do mul-
tiple forecast realisations by randomly varying all of the sources of uncertainty within their
range (Monte Carlo simulation). Because of operational constraints, a relatively straightfor-
ward approach for the calculation of forecast uncertainty has been applied in Bavaria. Long
time series of former, archived flood forecasts have been compared to gauge observations
calculating the relative error for each time step within the forecast horizon. From the er-
ror distribution obtained for each gauge, the relative error on the 10 and 90% exceedance
probability level is used to illustrate the uncertainty on each new forecast (Fig. 6). In addi-
tion to these “static” uncertainties the results of ensemble predictions (Fig. 7) are analysed
and a combination of the “static” uncertainty with the “dynamic” uncertainty is calculated.
Especially in headwaters, where the precipitation forecast is the dominating source of un-
certainty, this is seen as an advisable procedure. The procedure is explained in detail in LAU-
RENT et. al. (2010).
ekDRM 2011 | 25
Communicating uncertainty to the users of the hydrological forecast is a very impor-
tant task. As dealing with probabilistic numbers is not common to most users, descriptions
and explanations should also be understandable to all. Adequate illustrations and descrip-
tions should be evaluated in relation to the normal and advanced user. Additionally, expe-
riences gained during future flood events might help in further adaptation of methods of
communication.
Fig. 6 : Deterministic lead forecast surrounded by an uncertainty range
Fig. 7: Using all available meteorological forecasts as input into a rainfall–runoff model for a medium-sized catchment in the Bavarian Forest shows the broad variety in the resulting forecasts of water level (green lines). The observed water
level is marked blue

26 | Alfons Vogelbacher
For advanced users such as decision-makers in the water management authority, the
published uncertainty should furthermore serve as a tool for better risk assessment. For
example, the person in charge of operating a flood control basin can then base his deci-
sions on probabilistic numbers in addition to the deterministic forecast instead of only
on the latter. By judging, what probability threshold value should be taken into account
the responsibility for operators increases. Therefore, it is very important to teach users
how to interpret the published forecasts, especially the probabilistic part. Understanding
the sources of uncertainty and their meaning also helps improving the correct usage of
published prognostic data. This task is especially important since, compared to the nor-
mal weather forecasts; flood forecasts rarely gain the same every-day importance for the
average user. Therefore, users are mostly lacking personal experience in evaluating the
reliability of hydrological forecasts.
Overall, analysis and experiences with forecasts over the last years show that the ac-
curacy achieved so far could be improved upon in many cases. Hence, calculating and
communicating uncertainty is one goal. A major goal, though, remains reducing the ex-
isting uncertainty in the data, the model and its operation. Appropriate operations and
projects remain a permanent task.
References � Gerlinger K., Demuth N. (2000): Operational flood forecasting for the Moselle River Ba-
sin. In: PIK-Report No. 65 (1/2): Proceedings of the European Conference on Advances in
Flood Research 2000. Potsdam Institute for Climate Impact Research, 546 - 558
� Laurent S., Hangen-Brodersen Ch., Ehret U., Meyer I., Moritz K., Vogelbacher, A.,Holle F.-
K. (2010): Forecast Uncertainties in the Operational Flood Forecasting of the Bavarian
Danube Catchment. In: Brilly M. (Ed.) Hydrological Processes of the Danube River
Basin. Springer Dordrecht Heidelberg London New York, 2010.
� Ludwig K., Bremicker M. (2006):The Water Balance Model LARSIM - Design, Content and
Applications Freiburger Schriften zur Hydrologie, Band 22.
� Reichel G. (2001): FluxDSS und FLORIS2000 - ein leistungsfähiges Paket zur Modellier-
ung der Fließvorgänge in komplexen Systemen. Österreichische Wasserwirtschaft, Jah-
rgang 53, Heft 5/6.
� Vogelbacher A. (2007): Unsicherheiten bei der Abflussvorhersage. (Uncertainties of
runoff forecasts). In “Flutpolder - Hochwasserrückhaltebecken im Nebenschluss”, Beri-
cht Nr. 113 des Lehrstuhls und der Versuchsanstalt für Wasserbau und Wasserwirtschaft
der Technischen Universität München.
� Vogelbacher A., Daamen K., Holle F.-K., Meyer I., Roser S. (2006): Hydrological aspects

ekDRM 2011 | 27
of the flood in August 2005 in the Bavarian Danube Catchment. 23nd Conference of
the Danube Countries on the Hydrological Forecasting and Hydrological Bases of Water
Management. 28 – 30. August 2006. Belgrade, Republic of Serbia.

28 | Jugal Kishore et al
Professor, Resident*, Department of Community Medicine, Maulana Azad Medical College & Associated Hospitals, New Delhi-110002.
Epidemiological Disasters: Role of Environmental Knowledge
Jugal Kishore, Tanu Anand*
Disasters have been as old as the human civilization but their impact on the human lives
and the environment is being on the rise world over for recent times. Population explosion,
rapid urbanization and industrialization across the world has led to people living in habitats
that are hazardous and vulnerable to natural disasters, and on the other hand, they have led
to unsustainable pressures on resources causing the erosion of natural ecological balance,
both of which have intensified the frequency of occurrence as well as damage caused by
natural disasters.1 Considering rampant increase in occurrence of disasters, it has become
a concern of national and international importance. Epidemiological principles would be
useful to undestand the health impact of disasters and usefulness of intervention applied in
a cost effective manner. As the resources are scarce judicious and scientific methods in their
utlization required.
What is a disaster?Disaster is defined as any occurrence that causes damage, ecological disruption, loss of hu-
man life, deterioration of health and health services, on a scale sufficient to warrant extra-
ordinary response from outside the affected community or area (WHO). A ‘Hazard’ is the
dangerous condition or event, that threat or have the potential for causing injury to life or
damage to property or environment and ‘Vulnerability’ is the extent to which a community,
structure, services or a geographic area is likely to be damaged/disrupted by the impact of
a particular hazard on account of their nature, proximity to hazardous terrain, or a disaster
prone area. The probability that a particular population will be affected by the hazards is
known as ‘Risk’. Therefore, Risk=Vulnerability X Hazard.

ekDRM 2011 | 29
Disasters are of two types: Natural Disasters (e.g. Earthquakes, floods, volcanoes etc.) and
manmade disasters (e.g. famine, epidemics, fire, microbial warfare, etc.). Irrespective of the
nature of hazard, all disasters exert “7D effect”:
� Death
� Disability
� Disease
� Distress
� Damage to health services
� Damage to the economy of the country
� Damage to the environment
Epidemiology of disasters in IndiaIndia’s unique geo-climatic conditions together with dense population make for an interesting
mix of vulnerability and resilience. India has a vast coastline, out of which, approximately 5700
km is prone to cyclones and Tsunamis. 59% of the land is prone to seismic hazard, 5% of the
total geographical area is prone to floods, while 70% of the total cultivable area is vulnerable
to droughts.2 The super-cyclone of Orissa (1999), the Gujarat earthquake (2001), the Tsunami
(2004), Bihar Floods (2008) and more recent radiation exposure in Delhi (2010) clearly high-
lights the fact that disasters are not bound by political boundaries or socio-economic consid-
erations. Thus, each part of the country is susceptible to some or the other form of disasters.
The increased susceptibility of Indian landmasses to disasters can be adjudged by the fact that
according to EM-DAT 2005, India was ranked among top ten in the incidence of Natural hazards.
Disasters have the potential to cause mass casualty and loss of property. According to
International Disaster Database: EM-DAT, there have been 431 events in India from 1980-
2010 which have killed 1,43,039 people and affected 1,521,726,127 lives. This has incurred
1,550,446 US$ of damage per year to the country during the same period.3 Further, it has
been estimated that the losses to the Gross National product due to disasters can be twenty
times greater in developing countries than developed countries.4 According to World Bank
estimates, direct losses of public and private infrastructure in India have amounted to ap-
proximately $30 billion over the past 35 years.5
Thus, it will be empirical to say that the disasters result in large number of deaths, both
of human and animals, in short span of time that place overwhelming stress on individuals,
society and the administration. Also, the country is faced with an uncommon challenge of
handling large numbers of survivors seeking medical attention due to the effects of the
hazard. Hence, in this context the preparedness of health sector and its response can play a
major role for limiting the damage caused by the disaster.

30 | Jugal Kishore et al
Current status of disaster management in IndiaThe ferocity and impact of catastrophic events have increased for the recent times in the
country. Traditionally, disasters have been looked upon as aberrations or interruption in nor-
mal day to day activity of the society to be responded primarily with relief. But, there was
growing realization that development cannot be sustained unless all the phases of Disaster
Management Cycle continuum are comprehensively addressed considering the large num-
ber of casualties and economic losses which the country has experienced in the recent past.6
The Government of India thereupon adopted a more pro-active multidisciplinary and holis-
tic approach for prevention, mitigation and preparedness. This paradigm shift in the national
approach to disaster management led to enactment of Disaster Management Act, on 23rd
Dec, 2005, which envisaged the creation of an apex body National Disaster Management
Authority with Prime Minister as a chairperson and likewise constitution of State Disaster
Management Authorities (SDMA) and District Disaster Management Authorities (DDMA).7,8
With the backdrop that the common denominator of all disasters is human suffering,
there is a need of concerted actions from SDMA/DDMA and medical fraternity for preven-
tion and management of mass casualty inflicted due to disasters.
Environment and disaster riskThe connection between environment, development and disasters is rarely disputable.
While it is often recognized that ecosystems are affected by disasters, it is forgotten that
protecting ecosystem services can both save lives and protect livelihoods. Several pathways
link environment management to disaster risk reduction.
Fig1: Environment causes and consequences

ekDRM 2011 | 31
Natural hazards are physical processes that are directly affected by the environmen-
tal interventions. Human endeavors have triggered global warming and thereby affected
the frequency and intensity of extreme climate events. On a local scale, deforestation and
desertification have had demonstrable effects on local rainfall patterns and are complicit
with the occurrence of drought. Thus, many of the impacts associated with climate change
have exacerbated or altered existing hydro-meteorological hazards such as droughts, floods
etc. The UN Millennium Ecosystem Assessment recognizes that Ecological conditions not
only modify the frequency and magnitude of hazard events, but also affect natural barri-
ers that can moderate the impacts of a disaster and protect communities. Wetland ecosys-
tems function as natural sponges that trap and slowly release surface water, rain, snowmelt,
groundwater and floodwaters. Deforestation is often blamed for worsening the effects of
flooding while mangroves, dunes and reefs create physical barriers between communities
and coastal hazards.9
It has also been seen that pre-existing degraded environment reduce the community
resilience when a disaster strikes. Though the environment is able to recover from disaster
events, environmental impacts can result in serious risk to life and livelihoods if not addressed.
Unplanned recovery processes that fail to take the state of ecosystems and ecosystem ser-
vices into account: recovery is a period of immediate development, and without proper con-
sideration of the environment, pre-existing vulnerabilities may be re-created or exacerbated.
Environment impact assessment utilization of local knowledge in disaster managementIdentifying, evaluating and responding to critical environmental issues during a disaster are
key to effective disaster relief and recovery operations. Mapping hazard risk is often a core
function of the environmental management. The Hyogo Framework defines “reducing the
underlying risk factors” as a Priority for Action and specifically recommends environmental
and natural resource management that encourage the sustainable use and management of
ecosystems and promote the integration of risk reduction associated with existing climate
variability and future climate change.
Environmental conservation and disaster management are critical to the livelihoods of
indigenous people who often live in hazard-prone areas. They have built up, through thou-
sands of years of experience and intimate contact with the environment, a vast body of
knowledge on hazards and the environment events. This knowledge is a precious resource
that continues to contribute to environmental conservation and disaster management in
these regions. Indigenous knowledge should be considered as a complement to scientific
knowledge in the development of community based disaster risk management plans and

32 | Jugal Kishore et al
programmes. Also, The proliferation of new technologies and processes for managing natu-
ral resources, including new knowledge of the ecological, social and cultural dimensions of
resource management, presents many opportunities for reducing disaster risk. Communities
around the world are protected from floods and storms by engineered structural defences.
Multi-sectoral development-oriented zoning enables governments and other stakeholders
to assess possible land-use options for different areas and to choose the best options on the
basis of possibilities, limitations and values.9
Health impact assessment of disastersThough each disaster is distinct in the areas it affect with differing vulnerability with diver-
gent social, economic and health conditions, yet there are definite similarities between them.
Also, there is a relationship between the type of disaster and its effect on health. For instance,
earthquakes cause more injuries relative to that caused by floods and tidal waves. The actual
and potential health risks after a disaster do not all occur at the same time. Instead, they tend
to arise at different times and to vary in importance within a disaster-affected area. Thus,
casualties occur mainly at the time and place of impact and require immediate medical care,
while the risks of increased disease transmission take longer to develop and are greatest
where there is overcrowding and standards of sanitation have declined.10 Thus, to initiate
appropriate pre-disaster measures and provide timely, adequate and apt response, health
impact of potential emergencies need to be anticipated in advance.
Epidemiological methods are required to study the health effect of disasters. A disaster
health outcome assessment is a systematic assessment of the current and potential health
problems in a population affected by a disaster. Different methods can be used to examine
the health problems and health needs of the affected population, 11 such as:
� Rapid assessment of health needs;
� (Longitudinal) epidemiological studies using questionnaires;
� Continuous surveillance of health problems using existing registration systems;
� Assessment of the use and distribution of health services; and
� Research into the etiology of the health effects of disasters.
Disaster health outcome assessment is a useful activity as it provides insight into the
health problems of individual survivors, and their possible relationship to disasters. Different
health problems occur at different times after the precipitating event and surveillance for
the health effects is essential for providing an effective public health response over a pro-
longed period of time. For instance, peak psychological problems such as PTSD occur within
one year after the disaster or birth defects that occurred after a long time after Bhopal disas-
ter. A disaster health outcome assessment also is very useful to identify groups of survivors

ekDRM 2011 | 33
that are at increased risk for chronic health problems. The effects of management interven-
tions can also be evaluated by means of a disaster health outcome assessment. Besides pro-
viding information for policy-makers, a disaster health outcome assessment can contribute
to the knowledge and evidence base of disaster health outcomes. Besides authorities may
build or strengthen a pro-active, caring, and transparent reputation by performing a disaster
health outcome assessment about the distributions of risks.
Despite the importance of a disaster health outcome assessment, it is not advocated that
a disaster health outcome assessment be conducted after each disaster. A disaster health out-
come assessment only should be performed if appropriate help and support can be offered.
Public health effects of the disasterThe public health consequences of natural disasters are complex. These ramifications
can be best reduced by appropriate application of public health interventions. Before ex-
ploring into those interventions it is important realize the common problems faced during
almost all disasters. They are as follows:
� Injuries and death
� Social reactions
� Communicable diseases
� Other acute illnesses
� Chronic illnesses
� Mental diseases
� Population displacements
� Climatic changes
� Food and nutrition problems
� Water supply and sanitation problems
� Damage to health infrastructure
Injuries and death
Different types of disasters cause different patterns of injuries, which in turn produce vari-
able levels of morbidity and mortality. Earthquakes, tornadoes, flash floods are often as-
sociated with severe injuries requiring intensive care and maximum fatalities.11 But, the
number of injuries and subsequent fatalities associated with each disaster varies tremen-
dously from event to event. It also depends on the multitude of factors such as its mag-
nitude, proximity to a populated, the soil type, time of the day, population characteristics
and behaviors. Secondary disasters may also follow such as fire outbreak following an
earthquake or the more recent Tsunami and Fukishima nuclear reactor meltdown follow-

34 | Jugal Kishore et al
ing a massive earthquake in Japan. These may, only compounds the problems and in-
crease the casualties.
Social reactions
After any major natural disaster, the general behavior of the affected population is of gen-
eralized panic or stunned waiting. It usually takes minutes to hours for the individuals to
adapt themselves for an organized action. Sometimes, the person’s conflicting roles as the
head of the family and health official may result in delayed reporting of the personnel to the
relief duty until their families and property is safe.10 Usually, there are many informal means
of communication and rumors particularly about epidemics, following the disasters which
may divert the attention of the concerned authorities towards prevention and control of
such events without sound medical justification and thus, deprive the affected people off
the actual care they required during that hour.
Communicable diseases
Often the risk of an outbreak or an epidemic following the disaster is theoretically apparent
but not much reported.12 In one of the review studies13 where more than 600 geophysical
disasters records were scrutinized, it was found that there were only 3 outbreaks related
to those disasters: 1 of measles after the eruption of Pinatubo in Philippines, 1 of coccidi-
oidomycosis after an earthquake in California, and 1 of Plasmodium vivax malaria in Costa
Rica related to an earthquake and heavy rainfall. That lower risk of outbreaks could be due
to availability of prompt humanitarian response in those areas. However, natural disasters
may not result in massive outbreaks of infectious diseases, but in some situations they do
increase the potential for disease transmission. The disruption of pre-existing sanitary condi-
tions such as food, water and sewage disposal may aggravate the risk of occurrence of an
outbreak in the immediate post disaster phase.12Additionally, in the longer run there is in-
crease in the vector borne diseases because of the disruption of vector control methods par-
ticularly following heavy rains and floods. It has been seen in the past that those areas where
there is overcrowding, malnutrition and lack of basic sanitation services, massive outbreaks
of gastro-enteritis, cholera, typhoid etc. have occurred. Thus, it will be more appropriate to
conclude that the more accurate reflection of how well a community can withstand the ad-
verse health effects of a disaster would be found in the strength of public health system in
place prior to the occurrence of disaster.
Some of the communicable diseases and other illnesses during the post disaster phases:
Phase Days Likely health problem
I 0-3 days Disposal of dead bodies, injuries, drowning, snakebites,

ekDRM 2011 | 35
II 4-10 days Cholera, Bacterial dysentery,
III 11 days-3wk Pneumonia, hepatitis, meningitis, polio, measles, Skin and Eye infections,
IV 3-6 wk Malaria, dengue, JE, plague, rehabilitation of injuries,
V > 6 wk Psychological Problems, Malnutrition, HIV and STDs
Other acute illnesses
In contrast to causing infectious diseases, disasters do have the potential to cause short term
impact on the health of the affected population. Earthquake, for example, can cause release
of soil containing spores such as coccidioides immitis, causing clinical coccidioidomycosis.
Other natural hazards such as volcanoes cause both respiratory and ocular problems as a
result of ash, smoke and toxic gases.
Chronic illnesses
Anecdotal accounts of disasters reveal an increased number of acute coronary events such
as heart attacks following the disasters such as earthquake. It may be untrue to say that di-
sasters are responsible for the fatalities caused due to these acute coronary events, they do
appear to result in greater morbidity from chronic conditions such as diabetes, hypertension
and heart disease. Researchers in Japan found that the glycemic control was impaired in
diabetics following the Kobe earthquake.14 Similarly, following Hurricane Iniki on the Island
of Kuai in Hawaii, the mortality rate from diabetes doubled compared to prior to Hurricane.15
Therefore, the conditions for which stress is a risk factor and for which ongoing healthcare is
eminent appear to be affected by the disasters.
Mental diseases
The health effects of disasters extend beyond the physical symptoms and also include
the psychological or emotional stress. Anxiety, neuroses and mild depression are some
of the acute mental problems encountered immediately in the post disaster phase.
Again there are number of factors responsible for variation in the presentation of psy-
chological symptoms. Generally, the mild emotional distress is self-limiting in nature.
But, some proportion of the affected population also seems to experience severe form
of distress, depending upon their prior psychological state and impact of disaster on
them and their families. Another group at risk to suffer from mental distress is the hu-
manitarian volunteers or relief workers. Post Traumatic Stress Disorder (PTSD) or are
the most frequent and debilitating psychological disorder that occurs after traumatic
events and disasters16,17 and can be handled by professionals. But such mental profes-
sional are usually not available.

36 | Jugal Kishore et al
Medically Unexplained Physical Symptoms (MUPS) is another common problem affects
large number of disaster victims in long run.
Population displacements
As discussed previously, disasters mount heavy economic losses due to damage to life as
well as property. Most of the disasters render large chunk of population homeless. Due to
this, large, spontaneous and organized population displacements occur which the public
health services of the area may not be able to cope and thus, result in increased mortality
and morbidity.
Climatic changes
Extreme weather conditions during the disaster double the potential for adverse health ef-
fects on the affected population. For instance, an earthquake during summer months of a
tropical country can expose the individuals who are shelter less, to extreme heat waves that
may secondarily cause heat stroke and compound the morbidity and burden the health
services. However, as long as the population is dry, reasonably well clothed, and able to find
windbreaks, death from exposure does not appear to be a major risk.
Food and nutrition problems
Food shortages in the immediate aftermath are very common. Food stock destruction with-
in the disaster area may reduce the absolute amount of food available, or disruption of dis-
tribution systems may curtail access to food, even if there is no absolute shortage. Flooding
and sea surges often damage household food stocks and crops, disrupt distribution, and
cause major local shortages. But, generalized food shortages severe enough to cause nutri-
tional problems do not occur.
Water supply and sanitation problem
Drinking water supply and sewerage systems are particularly vulnerable to natural hazards
and the disruptions that occur in them pose a serious health risk. Deficiencies in established
amounts and quality of potable water and difficulties in the disposal of excreta and other
wastes result in the deterioration of sanitation, contributing to conditions favorable to the
spread of enteric and other diseases. For example, immediately after the devastating earth-
quake in Turkey in August 1999, an infectious disease surveillance system mainly focused on
diarrheal diseases analyzed 1,468 stool cultures and found main cause of diarrheal outbreak
was Shigella species. This study has emphasized the necessity to set up infectious disease
surveillance systems after such events. 18

ekDRM 2011 | 37
Damage to health infrastructure:
Health systems are also among the most vulnerable to natural disasters. For example, after
the 2004 Indian Ocean tsunami, a large number of health institutions were damaged. These
included hospitals, drug stores, cold rooms, preventive health care offices, health staff ac-
commodation facilities and district health offices. In addition, a large number of vehicles
(ambulances, vans, motorbikes) and most of the medical equipment and office equipment
in the affected areas were totally destroyed. The loss of health personnel included medical
officers, nurses, midwives and support staff. Furthermore, a large number of health staff were
injured, traumatized or displaced by the event, hence were unable to assist the affected. 19
Therefore, health care physical infrastructure and personnel are affected by the disasters
as any other individual in the affected area. This damage occurs at the most in opportune
time, just when the need for provision of emergency care is the most. Besides, non-structural
damage also alters the ability of a health care system to provide adequate care at the time
of catastrophe. The destruction of equipment and supplies, especially the loss of laboratory
functions and pharmaceuticals places an additional burden on a health care agency trying
to provide services to increased number of patients.12Beside this, natural disasters may seri-
ously inflict damage on the services considered vital for smooth functioning of a health care
system such as electricity, water supply, transportation etc. Transportation and tele-commu-
nications may seriously be jeopardized during a catastrophic event which may impede pub-
lic health sector’s ability to respond to disaster.
Health
(related) ef-
fects
Earthquake Floods Land-slides Epidemics Conflict situation
Deaths/ Severe
injuries
Many Few Many Many Many
Requiring
extensive treat-
ment
Many Few Few Few Many
Increased risk of
epidemics
Yes Yes Yes ------ Yes
Damage to
water systems
Severe Light Severe (but
localized)
None Limited (depends
on the factions
fighting)
Table 1: Health (related) effects of natural hazards

38 | Jugal Kishore et al
Other effects: There may be other social effects such as increase in orphans, disabilities,
decline of local spending, unemployment, disruption of normal lifestyles and increase in the
food prices which in turn impact the overall health status of the affected population. There
may increase in theft, molestation, sexual abuse, kidnapping of small children communal dis-
harmony etc. leading to social unrest in the affected area and indirectly affecting the health
of the people. The potential health risks of different disasters20 can be summarized as shown
in table 1. This is evident that health risk is always there in almost all disasters.
Medical preparedness of Disasters in IndiaThe pro-active approach adopted by GOI and NDMA culminated into formulation of the Na-
tional Guidelines on Medical Preparedness and Mass Casualty Management.21 These guide-
lines encompasses medical management in four phases, that is, initially at the Incident site
by the Medical First Responders within the ‘golden hour’ preferably a critical period between
injury and life/limb saving surgery that decides the patient’s outcome; then evacuation in
the ambulances fitted with critical care equipment; followed by prompt treatment in the
hospitals and sequelae of resultant disease/disability; and lastly, prevention of epidemics,
management of chronic health effects and provisioning psychosocial care (medical pre-
paredness). Environmental knowledge plays a significant role planning, implementation and
evaluation of health intervention in disasters.
Health
(related) ef-
fects
Earthquake Floods Land-slides Epidemics Conflict situation
Damage to
health facilities
Severe (struc-
tural & equip-
ment)
Severe
(equip-
ment
usually)
Severe
(but local-
ized)
None Limited (depends
on the factions
fighting)
Damage to
health services
High High Low Moderate High
Food shortage Possible (due
to distribution
problems)
Common Common
(but local-
ized)
None Common
(in prolonged
conflicts)
Major popula-
tion move-
ments
Common (gen-
erally limited)
Common Common
(generally
limited)
Rare Common (gener-
ally limited)

ekDRM 2011 | 39
Some of the initiatives taken in this regard are:6
� From various studies it is found that immediate onsite medical care can save lives. Full
fledged containerized mobile hospitals enabling quick deployment at the time of disas-
ters to treat large number of casualties on the site are in the process of being acquired
and attached with hospitals in the strategic locations.
� Disease surveillance can predict outbreaks and epidemic in the community after disas-
ter. For that fully furnished laboratorties are required. Bio-safety laboratories with few
BSL-3 and BSL-4 are being established at designated nodal institutions. Integrated Dis-
ease Surveillance Project along with upgraded laboratories have proved very useful in
the management of H1N1 pandemic.
� Most of the deaths due to sock can be prevented by intravenous fluid infusion and
blood transfusion. Licensed blood banks critical for management of shock have been
networked to cater for surge requirement during disasters.
� Burn and trauma centers are specialized in handling critical cases. Burn Centres are be-
ing expanded to 30 beds each in all medical colleges, tertiary care hospitals, and districts
having more than 10 Major Accident Hazard (MAH) units with burn risks.
� Trauma Centres of varying bed capacities are being established that range from State
Apex Trauma Centre to Zonal Trauma Centre (25 beds), Regional Trauma Centre (10-15
beds) and District Trauma Centre (10 beds). AIIMS has established state of the art JPN
Apex Trauma Centre.
� Transportation for casualty evacuation by the Integrated Ambulance Network having
basic medical equipment for resuscitation, essential drugs, and two way communica-
tion vis-à-vis the hitherto before Ambulances which functioned only ferried patients.
Of late, casualty evacuations by air, especially by helicopters ambulances, have greatly
improved patient care management capabilities.
� Additional thrust is on telemedicine which entails putting diagnostic equipment and
Information Communication Technology for connectivity between the disaster site and
advanced medical institutes where such linkup have been installed.
� Training in First Aid of the community to improve their response to disaster.
� Recognizing the psychological problems in the survivors’ resultant of disaster’s effects, the
Psychosocial Support and Mental Health Services in the aftermath of disasters was consid-
ered to be addressed in detail. Consequently, its National Guidelines have been released on
20th January, 2010 by Hon’ble Health Minister whereby its framework has been institutional-
ized for all stakeholders to ensure it as an integral part of their role in disaster management.
� Capacity building ventures are being conducted under the aegis of NDMA such as Basic
Life Support (BLS) and Advanced Trauma Life Support Courses are being conducted in
40 | Jugal Kishore et al
collaboration of MoHFW, training capsules on emergency response to CBRN casualties
and mock exercises.
India celebrated World Health Day 2009 with the official slogan “Save lives. Make hospi-
tals safe in emergencies.” 19 that focused on the safety of health facilities and the readiness
of the health workers who treat those affected by emergencies. Health centres and staff are
critical lifelines for vulnerable people in disasters - treating injuries, preventing illnesses and
caring for people’s health needs. Often, already fragile health systems are unable to keep
functioning through a disaster, with immediate and future public health consequences. Now,
construction of new hospitals are conforming international rules are regulations for disaster
resistance. However, at the local state level such norms need to be understood and followed.
These and many more initiatives notwithstanding, India still remains one of the most
severely and seriously affected countries in the world due to natural and manmade disasters.
It is imperative for the administration and governing authorities to provide for setting up of
a comprehensive and effective catastrophe (disaster) management apparatus. Willingness
to channelize substantial financial resources and ability to learn from the experiences of the
past natural events (disasters) is very important in current scenario. People are the one who
are going to face the catastrophe and they should be the ones to be empowered by correct
knowledge so that fear or hopelessness is not created. Besides, a strong and fool proof public
health system is the mandate for reducing the morbidity and mortality during a disaster. A
public health sector which conducts routine surveillance, has good immunization coverage,
maintained water and sanitation services etc, is better equip to handle increased burden of
health care needs during the catastrophic events. Concerted efforts by all the stakeholders
to follow all the national guidelines for appropriate disaster management would pave the
way for ‘safer and disaster resilient India’.
References:
� Anand T, Kishore J. “Dis-Aster” Management should be more scientific. The Radical Hu-
manist 2010;74(6):30-2.
� NCERT. Natural Hazards and Disaster Management. 1st ed. New Delhi: The Secretary, Cen-
tral Board of Secondary Education; 2006.
� International Disaster Database: EM-DAT 2010. Available from: http://www.emdat.be/
result-country-profile.
� Health impact of Disasters presented at 1st regional Conference on Emergency and Hu-
manitarian Action, Dhaka, Bangladesh on 17th-22nd Dec, 1996.
� ICIMOD. Disaster Preparedness for Natural Hazards: Current Status in India. Nepal: ICI-
MOD; 2007.

ekDRM 2011 | 41
� Medical preparedness aspect of Disasters. Available from: http://ndma.gov.in/ndma/
guidelines/MedicalPreparedness.pdf.
� Kishore J. National Health Programs of India. 9th edition. New Delhi: Century Publications;
2010.
� The Gazette of India. The Disaster Management Act, 2005. New Delhi: Published by the
Authority; 2005.
� UNEP. Environment and Disaster risk: Emerging perspectives. ISDR: UNEP;2005.
� General Effects of Disasters on Health. Available from: http://www.paho.org/english/
ped/SP575/SP575_01.pdf
� Berg BD, Grievink L, Gutschmidt K, Lang T, Palmer S, Ruijten M, Stumpel R, Yzermans J. The
Public Health Dimensions of Health-Health Outcome assessment of Disasters. Prehospi-
tal and Disaster Medicine 2008;23(s2):s56-s59.
� Shoaf IK, Rottman SJ. Public health Impact of disasters. Australian Journal of Emergency
Management.2000;58-63.
� Floret N, Viel JV, Mauny F, Hoen B, Piarroux R. Negligible Risk for Epidemics after Geo-
physical Disasters: Results. Emerging Infectious Diseases. 2006;12(4):543-548
� Inui A, Kitaoka H, Majima M, Takamiya S, Uemeto M, Yonenaga C, et al. Effect of the Kobe
Earthquake on Stress and Glycemic Control in Patients With Diabetes Mellitus. Arch In-
tern Med 1998;9:274-78.
� Hendrickson LA, Vogt R. Mortality of Kauai Residents in the 12-Month Period following
Hurricane Iniki. Amer J Epidemio 1996;144(2):188-91.
� Norris FH, Friedman MJ, Watson PJ, et al. 60,000 disaster victims speak: part I. An empiri-
cal review of the empirical literature, 1981–2001. Psychiatry 2002;65:207–39.
� North CS, Nixon SJ, Shariat S, et al. Psychiatric disorders among survivors of the Okla-
homa City bombing. JAMA 1999;282:755–62.
� Vahaboglu H, Gundes S, Karadenizli A, Mutlu B, Cetin S, Kolayli F, Coskunkan F, Dündar V.
Transient increase in diarrheal diseases after the devastating earthquake in Kocaeli, Tur-
key: results of an infectious disease surveillance study. Clin Infect Dis. 2000; 31(6):1386-9.
� WHO. World Health Day 2009. Available from: www.who.int/world-health-day/Kishore J,
Ravneet Kaur, Ravi Kumar J. Management of Health Impacts of Natural Disasters in India.
Annals of IMA AMS 2010: 65-74.
� NDMA. National Guidelines on Medical Preparedness and Mass Casualty Management.
New Delhi: NDMA; 2009.

42 | Christian Jochum
The Role of Land-use Planning in Chemical Disaster Risk Management
Christian Jochum
Safety Distances as a Key Issue in Chemical Disaster Risk ManagementChemical risk management always starts in the plant itself, where primarily loss of contain-
ment has to be prevented by technical and organisational safeguards. In addition (and as the
second layer in the “onion skin” model) any reasonable effort has to be undertaken to miti-
gate possible releases of hazardous chemicals. However, a number of sad experiences dem-
onstrate that safety and mitigation measures may fail. Toxic clouds may travel far outside
the facility as in the Bhopal tragedy, inflammable vapours may ignite beyond the facility´s
border as in Buncefield/GB and Mexico City or an explosion on site may cause a shockwave
killing people in the neighbourhood of the plant as in Toulouse/France or Enschede/NL.
All those events have one commonality: the bigger the distance to the source of the
hazardous chemical the smaller are the effects. Safety distances therefore are essential safe-
ty measures. They are also a key issue for disaster risk management. The farer away people
are from the place of a disaster, the less casualties will occur. The fewer people live around a
major hazard facility the easier will be an evacuation.
Initially most chemical sites have been built far away from other developments. Al-
though pollution was the driving force for that, also safety distances have been kept. This
common-sense approach was rapidly undermined in most cases. Workers wanted to live
close to the facility, other businesses appreciated the vicinity of chemical facilities for differ-
ent reasons, traffic lines had to be built anyway, etc. Especially in densely populated areas
as e.g. in Germany and other countries of the European Union space became so valuable
that eventually most major chemical sites became closely surrounded by residential areas,
schools, hospitals, railway stations, highways, etc., creating a serious potential for disasters.
Chairman, German Commission on Process Safety & Director, European Process Safety Centre

ekDRM 2011 | 43
European Regulation on Land-use Planning around Major-hazard SitesProcess safety and emergency response experts always had been aware of this intrinsic risk.
However, even in the European Union, which traditionally tends to be risk adverse, it was not
before 1996 that land use planning around major hazard sites became regulated in the so
called Seveso II Directive ():
Article 12 (Land-use planning)
� Member States shall ensure that the objectives of preventing major accidents and limit-
ing the consequences of such accidents are taken into account in their land-use policies
and/or other relevant policies.
They shall pursue those objectives through controls on:
� (a) the siting of new establishments,
� (b) modifications to existing establishments covered by Article 10,
� (c) new developments such as transport links, locations frequented by the public
and residential areas in the vicinity of existing establishments, where the siting or
developments are such as to increase the risk or consequences of a major accident.
Member States shall ensure that their land-use and/or other relevant policies and the
procedures for implementing those policies take account of the need, in the long term, to
maintain appropriate distances between establishments covered by this Directive and resi-
dential areas, buildings and areas of public use, major transport routes as far as possible,
recreational areas and areas of particular natural sensitivity or interest and, in the case of
existing establishments, of the need for additional technical measures in accordance with
Article 5 so as not to increase the risks to people.
� The Commission is invited by 31 December 2006, in close cooperation with the Mem-
ber States, to draw up guidelines defining a technical database including risk data and
risk scenarios, to be used for assessing the compatibility between the establishments
covered by this Directive and the areas described in paragraph 1. The definition of this
database shall as far as possible take account of the evaluations made by the competent
authorities, the information obtained from operators and all other relevant information
such as the socioeconomic benefits of development and the mitigating effects of emer-
gency plans.
� Member States shall ensure that all competent authorities and planning authorities re-
sponsible for decisions in this area set up appropriate consultation procedures to facili-
tate implementation of the policies established under paragraph 1. The procedures shall

44 | Christian Jochum
be designed to ensure that technical advice on the risks arising from the establishment
is available, either on a case-by-case or on a generic basis, when decisions are taken.
German Guidance on Land-use Planning
As in most EU countries different authorities are responsible for spatial planning and for the
Seveso Directive implementation was slow. It needed the explosion of a fertilizer storage
at Toulouse/France in 2001 with more than 10 fatalities outside the site that this regulation
started to become effective. In Germany the Commission on Process Safety, which advises
the German Federal Government, issued in 2005 a guidance on land-use planning. It covers
the planning of industrial zones, for which the concrete usage is not yet known (greenfield
developments), as well (and even more important in Germany) developments in the neigh-
bourhood of existing major-hazard sites. The guidance has recently been updated, taking
into account the experience of the first years of implementation. The new version (KAS-18)
is available at www.kas-bmu.de. A short version of it in English will be published soon on the
same website. A short version of the first issue in English is still available there (SFK/TAA-GS-1
short version).
Separation distance recommendations for land-use planning without detail
knowledge
The guidance first deals with the setting out of new industrial and trading areas, for which
the concrete usage is not yet known, which are however designated by the local administra-
tion as a planning law basis for the permissible siting of establishments under the German
Federal Immission Control Act. This “land-use Planning without detail knowledge” would be
applicable for instance if a city which is responsible for spatial planning decides to develop
a new industrial area. In this case the distance to existing or also planned sensitive areas, e.g.
residential areas, is known. The guidance now defines precautionary “separation distances”
for the possible use of certain hazardous substances in the planned industrial area. At that
point of time typically no detailed information exists about the chemical plants which may
be built there. This tool should help in the decision which substances could be used in major-
hazard installation in that area and which not. Eventually this information can be included
in the legally binding land-use plan, restricting the future use of this area to minimize the
consequences of industrial disasters.
For explosives and ammonium nitrate specific German regulations, which already set
safety distances, are to be applied. In recommending separation distances for all other haz-
ardous substances it was decided to use a precautionary deterministic approach, in line with
the major hazards legislation as practiced in Germany. Long term operating experience and

ekDRM 2011 | 45
the registered major accidents in the last 15 years in Germany have been reviewed. As a
result of these studies, as basis for a consequence assessment as source term for a release
a leakage of 490 mm² was adopted (equivalent to the cross-sectional area of a DN 25 pipe).
For highly hazardous substances as phosgene a DN 15 leakage was chosen, as the above
mentioned reviews demonstrated that this comes closer to reality, where such substances
are handled with extreme care. It has to be noted that a number of other European states use
a probabilistic approach to land-use planning instead of this deterministic approach.
As scenarios were chosen fire, vapour cloud explosion with immediate ignition and re-
lease of toxic substances. As permissible thresholds were used for thermal radiation 1.6 kW/
m², for explosions 0.1 bar and for toxic substances the concentration guidance value ERPG-2.
The dispersion model used was the VDI Guideline 3783. The dispersion conditions chosen
for the hazardous substances were average meteorology (including a wind speed of 3 m/s)
in a typical industrial topology (uniform buildings).
There is no simple relationship between toxicity, thermal radiation or explosion pres-
sure wave and the recommended separation distance s. Substance characteristics (e.g. va-
pour pressure) and typical operating conditions lead to differing release rates, which had to
be taken into account. However, consequence modelling of these scenarios cannot be con-
Figure 1: Recommended separation distances for land-use planning without detailed knowledge(for an updated version see KAS-18 at www.kas-bmu.de)

46 | Christian Jochum
sidered as completely realistic, but as a typification. Taking this into account, the substances
have been clustered into distance classes to make the application easier. The guidance had
to be limited to the most prominent substances (see picture 1). However, it sets out a proce-
dure which would allow the development of such separation distances for other substances,
too. It has to be noted that the separation distance recommendations are only related to
people as the subject to be protected. For sensitive environment, e.g. natural reserves, no
guidance exists up to now.
Separation distance recommendations for land-use planning with detailed
knowledge
Unfortunately (speaking economically) greenfield development of industrial sites occurs
rather seldom in Germany nowadays. Much more relevance has development coming closer
to industrial and especially chemical sites. Consumer markets would like to make use of the
good traffic connections near industrial sites, new roads or railway stations may be planned,
etc. Quite frequently other industrial sites near major-hazard facilities may have had to close
down and their land is a valuable asset which attracts investors. Here the guidance gives
“separation distance recommendations for land-use planning with detailed knowledge”.
For existing major-hazard facilities the substances, their licensed quantities and the
technical installations in which they are handled are already known. In this case a specific
individual case study with a systematic hazard analysis is possible. For the determination of
separation distances the following recommendations are made in the guidance:
� If the distance to sensitive areas is less than the separation distance recommendation
for land-use planning without detail knowledge (see picture 1), then an individual case
study is necessary.
� If other legal requirements prescribe a minimum distance for the type of installation
(e.g. Explosives Law, Technical Regulations) then these are to be respected.
� For the individual case study the following recommendations are made with regard to
the scenarios which are to be considered:
� The loss of the complete inventory, the loss of the largest contiguous volume, burst-
ing of a vessel and the shearing of a very large pipe are not to be considered for
land-use planning, as they are too improbable when the state of the art technology
is adhered to.
� For storage in barrels and drums, and storage in gas bottles the release of the con-
tents of a barrel/drum or bottle is to be considered.
� For process installations and in storage facilities it is to be assumed that leaks from
pipe-work, vessels, safety equipment, etc. can occur.
ekDRM 2011 | 47
• In general the starting point is the consideration of a leak area of 490 mm²
(equivalent to DN 25).
• In the individual case study the leak area is determined according to the techni-
cal systems actually in place.
• As a minimum assumption it is recommended that a leak of no less than 80
mm² (equivalent to DN 10) is chosen. (This corresponds to the flange leakage
of larger pipe-work, the shearing of a small line, the leakage due to corrosion
damage, etc.)
• Measures to limit the effects of a release are to be considered in so far as they
are not damaged by the events in the scenario considered.
• lt is explicitly noted that these recommendations cannot replace the consider-
ation of the particular situation in the individual case study.
In a nutshell: whenever the (precautionary) “separation distances for land-use planning
without detailed knowledge” cannot be met, the necessary separation distance between the
existing major-hazard facility and new sensitive developments have to assessed individually,
following similar criteria as developed for greenfields. As all safety measures within the facil-
ity have to be taken into account, the individual separation distance may be considerably
smaller as in the greenfield case.
Theoretically the separation distance could be zero, if the assessment of the installation´s
inner layers of protection (inherently safe processes, high integrity of equipment, very effi-
cient mitigation measures) lead to the conclusion, that there is no major hazard outside the
fence. However, the precautionary approach will usually lead to a separation distance. Also
other planning rules prevent the direct neighbourhood between industrial sites causing
hazards, pollution or noise, and e.g. residential areas.
Other Planning Scenarios
A third quite common case both in Europe as in India are “mixed situations” of major-hazard
facilities and sensitive neighbourhood, grown more or less unplanned over many years. Here
the directive of the European Union is only setting the long term goal to maintain appropri-
ate separation distances and, on a case by case decision, the request for additional technical
measures. Those cases are legally very complex, as operators have been granted licenses to
operate as they do. The rather schematic and strictly precautionary approach of the above
mentioned separation distances can here only serve as a very first approach. Eventually the
interests and rights of all stakeholders have to be balanced in light of the history of these de-
velopments, and this will frequently end at the court. Relocation either of hazardous instal-

48 | Christian Jochum
lations or sensitive neighbourhood is rarely possible, so that here the focus is on improved
safety measures and emergency preparedness.
The fourth case is the planning of a new major-hazard facility close to existing develop-
ments. Here the authority has to make an individual assessment, if such a facility does not
pose an unacceptable risk to its neighbourhood before they grant a license. Although the
procedure for “separation distance recommendations for land-use planning with detailed
knowledge” is not legally applicable here, it may serve as a reference.
Separation Distances and Emergency PlanningOn reaching or exceeding the recommended separation distances, it may be generally as-
sumed that the effects of a major accident within an establishment, based on the assump-
tions made, will not lead to a serious hazard for the population. The “intermediate zone”
resulting from the separation distance recommendation should not be understood as an
area free of buildings. Within these distances less sensitive usage may be planned. This could
be e.g. other industries or office buildings with a clearly defined population which may be
included in the major-hazard facility´s alarm system and trained how to act in emergency
situations.
Outside the separation distances emergency planning still is a must. Although the
consequences for people are minimised by proper land-use planning, the underlying as-
sumptions are “credible worst case scenarios” only. As Bhopal and recently Fukushima have
demonstrated it could come worse. Even if the probability of such catastrophes is very low,
emergency responders have to take that
into account. Also reaching e.g. the ERPG-2
value for toxic substances, which is one of
the definitions of the separation distances,
has to trigger emergency procedures.
As a result, 3 different zones have to
be assumed (see picture 2). Looking from
inside the facility, its fence forms the first
zone and the area of the on-site emergen-
cy plan. Then comes a zone characterised
by the separation distances with limited
use, followed by the outer zone without
limitations of use, but also subject to the
off-site emergency planning. Figure 2: Zoning around major-hazard facilities

ekDRM 2011 | 49
Implementation of the Guidance on Land-use PlanningLand-use planning always is a trade-off between different justified interests: safety and
health, ecology, economy, culture and people. For all these interests different authorities may
be responsible. This makes implementation of land-use regulations difficult. In Germany for
instance, land-use planning is in the responsibility of the municipalities. The EU Seveso II Di-
rective forces them now to consult the authorities competent for major-hazard installations.
However, a local mayor may be more interested in major investments as in major hazards
and therefore may not take the obligatory consultation serious enough. Although the co-
operation between the different authorities improved in the recent years, a growing num-
ber of cases ended up at court. The guidance of the German Commission on Process Safety,
although legally not binding, has been widely accepted by all parties as well as the courts
as a reference. One typical case is pending at the European High Court and a fundamental
judgement can be expected. Anyhow experience in Germany shows that a critical precondi-
tion for effective land-use planning is a good cooperation between the different authorities
responsible for spatial planning and environmental safety.

50 | T. V. Ramachandra
Disasters due to Unplanned Urbanisation
T. V. Ramachandra
IntroductionUrbanisation is a form of metropolitan growth that is a response to often bewildering sets
of economic, social, and political forces and to the physical geography of an area. It is the in-
crease in the population of cities in proportion to the region’s rural population. The 20th cen-
tury is witnessing “the rapid urbanisation of the world’s population”, as the global proportion
of urban population rose dramatically from 13% (220 million) in 1900, to 29% (732 million) in
1950, to 49% (3.2 billion) in 2005 and is projected to rise to 60% (4.9 billion) by 2030 (World
Urbanization Prospects, 2005). Urban ecosystems are the consequence of the intrinsic nature
of humans as social beings to live together (Sudhira et al., 2003; Ramachandra and Uttam Ku-
mar, 2008). The process of urbanisation contributed by infrastructure initiatives, consequent
population growth and migration results in the growth of villages into towns, towns into
cities and cities into metros. Urbanisation and urban sprawl have posed serious challenges
to the decision makers in the city planning and management process involving plethora of
issues like infrastructure development, traffic congestion, and basic amenities (electricity,
water, and sanitation), etc. (Kulkarni and Ramachandra, 2006). Apart from this, major implica-
tions of urbanisation are:
� Loss of wetlands: Urbanisation has telling influences on the natural resources such as
decline in number of wetlands and / or depleting groundwater table.
� Floods: Common consequences of urban development are increased peak discharge
and frequency of floods as land is converted from fields or woodlands to roads and
parking lots, it loses its ability to absorb rainfall. Conversion of water bodies to residen-
tial layouts has compounded the problem by removing the interconnectivities in an
undulating terrain. Encroachment of natural drains, alteration of topography involving
Energy & Wetlands Research Group, Centre for Ecological Sciences, & Centre for Sustainable Technologies, Centre for infrastructure, Sustainable Transportation and Urban Planning (CiSTUP) Indian Institute of Science Bangalore
E-mail: [email protected], [email protected], http://ces.iisc.ernet.in/energy

ekDRM 2011 | 51
the construction of high rise buildings, removal of vegetative cover, reclamation of wet-
lands are the prime reasons for frequent flooding even during normal rainfall post 2000.
� Decline in groundwater table: Studies reveal the removal of waterbodies has led to
the decline in water table. Water table has declined to 300 m from 28 m over a period of
20 years after the reclamation of lake with its catchment for commercial activities. Also,
groundwater table in intensely urbanized area such as whitefield, etc. has now dropped
to 400 to 500m.
� Loss of tree cover: Drastic reduction in cover is observed due to the removal of lane
tress and conversion of plantations to layouts, etc.
� Heat island: Surface and atmospheric temperatures are increased by anthropogenic
heat discharge due to energy consumption, increased land surface coverage by artificial
materials having high heat capacities and conductivities, and the associated decreases
in vegetation and water pervious surfaces, which reduce surface temperature through
evapotranspiration.
� Increased carbon footprint: Due to the adoption of inappropriate building architec-
ture, the consumption of electricity has increased in certain corporation wards drasti-
cally. The building design conducive to tropical climate would have reduced the depen-
dence on electricity. Higher energy consumption, enhanced pollution levels due to the
increase of private vehicles, traffic bottlenecks have contributed to carbon emissions
significantly. Apart from these, mismanagement of solid and liquid wastes has aggra-
vated the situation.
Unplanned urbanisation has drastically altered the drainage characteristics of natural
catchments, or drainage areas, by increasing the volume and rate of surface runoff. Drainage
systems are unable to cope with the increased volume of water and are often encountered
with the blockage due to indiscriminate disposal of solid wastes. Encroachment of wetlands,
floodplains, etc. obstructs floodways causing loss of natural flood storage. Damages from
urban flooding could be categorized as: direct damage – typically material damage caused
by water or flowing water, and indirect damage – e.g. traffic disruptions, administrative and
labour costs, production losses, spreading of diseases, etc.
Studies on the phenomenon of Urban Heat Island (UHI) using satellite derived land
surface temperature (LST) measurements have been conducted using various satellite data
products acquired in thermal region of the electromagnetic spectrum. Currently available
satellite thermal infrared sensors provide different spatial resolution and temporal cover-
age data that can be used to estimate LST. The Geostationary Operational Environmental
Satellite (GOES) has a 4-km resolution in the thermal infrared, while the NOAA-Advanced
Very High Resolution Radiometer (AVHRR) and the Terra and Aqua-MODIS have 1-km spatial

52 | T. V. Ramachandra
resolutions. Significantly high resolution data come from the Terra-Advanced Spaceborne
Thermal Emission and Reflection Radiometer (ASTER) which has a 90-m pixel resolution, the
Landsat-5 Thematic Mapper (TM) which has a 120-m resolution, and Landsat-7 Enhanced
Thematic Mapper (ETM) which has a 60-m resolution. However, these instruments have a
repeat cycle of 16 days (Li et. al., 2004; Ramachandra and Uttam Kumar, 2009). Weng (2001,
2003) examined LST pattern and its relationship with land cover (LC) in Guangzhou and in
the urban clusters in the Zhujiang Delta, China. Nikolakopopulos et al., (2003) have used
Landsat-5 TM and Landsat-7 ETM+ data for creating the temperature profile of Alfios River
Basin. Stathopoulou and Cartalis (2007) have used Landsat ETM+ data to identify daytime
urban heat island using Corine LC data for major cities in Greece. Using a Landsat ETM+
imagery of City of Indianapolis, IN, USA, Weng et al., (2004) examined the surface tempera-
ture UHI in the city. They derived LST and analysed their spatial variations using Landsat
ETM+ thermal measurements with the urban vegetation abundance and investigated their
relationship. UHI studies have traditionally been conducted for isolated locations and with
in situ measurements of air temperatures. The advent of satellite remote sensing technol-
ogy has made it possible to study UHI both remotely and on continental or global scales
(Streutker, 2002). In this work, Landsat data of 1973 (of 79 m spatial resolution), 1992 and
2000 (30 m), IRS LISS-III data of 1999 and 2006 (23.5 m) and MODIS data of 2002 and 2007
(with 250 m to 500 m spatial resolution) are used with supervised pattern classifiers based
on maximum likelihood (ML) estimation. Also, an attempt is made to map land surface tem-
peratures across various LC types to understand heat island effect.
Study AreaGreater Bangalore (77°37’19.54’’ E and 12°59’09.76’’ N) is the principal administrative, cultural,
commercial, industrial, and knowledge capital of the state of Karnataka with an area of 741
sq. km. Bangalore city administrative jurisdiction was widened in 2006 by merging the exist-
ing area of Bangalore city spatial limits with 8 neighbouring Urban Local Bodies (ULBs) and
111 Villages of Bangalore Urban District (Ramachandra and Uttam Kumar, 2008; Sudhira et
al., 2007). Thus, Bangalore has grown spatially more than ten times since 1949 (69 square
kilometers) and is a part of both the Bangalore urban and rural districts (figure 1). Now, Ban-
galore is the fifth largest metropolis in India currently with a population of about 7 million
(figure 2). The mean annual total rainfall is about 880 mm with about 60 rainy days a year
over the last ten years. The summer temperature ranges from 18° C – 38° C, while the winter
temperature ranges from 12° C – 25° C. Thus, Bangalore enjoys a salubrious climate all round
the year. Bangalore is located at an altitude of 920 meters above mean sea level, delineating
four watersheds, viz. Hebbal, Koramangala, Challaghatta and Vrishabhavathi watersheds. The

ekDRM 2011 | 53
undulating terrain in the region has facilitated creation of a large number of tanks providing
for the traditional uses of irrigation, drinking, fishing and washing. This led to Bangalore hav-
ing hundreds of such water bodies through the centuries. Even in early second half of 20th
century, in 1961, the number of lakes and tanks in the city stood at 262 (and spatial extent of
Bangalore was 112 sq km). However, number of lakes and tanks in 1985 was 81 (and spatial
extent of Bangalore was 161 sq km).
Figure 1: Study area – Greater Bangalore.
Figure 2: Population growth and population density.
Materials and MethodsSurvey of India (SOI) toposheets of 1:50000 and 1:250000 scales were used to generate base
layers. Field data were collected with a handheld GPS. Remote sensing data used for the
study are: Landsat MSS (1973), Landsat TM (1992), Landsat ETM+ (2000 and 2009) [Land-

54 | T. V. Ramachandra
sat data downloaded from http://glcf.umiacs.umd.edu/data/], IRS (Indian Remote Sensing)
LISS (Linear Imaging Self Scanner)-III of (1999 and 2006), MODIS (Moderate Resolution Im-
aging Spectroradiometer) Surface Reflectance 7 bands product [downloaded from http://
edcdaac.usgs.gov/main.asp] of 2002, MODIS Land Surface Temperature/Emissivity 8-Day L3
Global and Daily L3 Global (V004 product) [http://lpdaac.usgs.gov/modis/dataproducts.
asp#mod11]. Google Earth data (http://earth.google.com) served in pre and post classifica-
tion process and validation of the results. The methods adopted in the analysis involved:
� Georeferencing of acquired remote sensing data to latitude-longitude coordinate sys-
tem with Evrst 56 datum: Landsat bands, IRS LISS-III MSS bands, MODIS bands 1 and 2
(spatial resolution 250 m) and bands 3 to 7 (spatial resolution 500 m) were geo-correct-
ed with the known ground control points (GCP’s) and projected to Polyconic with Evrst
1956 as the datum, followed by masking and cropping of the study area.
� Band 1, 2, 3 and 4 of Landsat 1973 data to 79 m.
� Band 1, 2, 3 and 4 of Landsat TM of 1992 to 30 m.
� Band 1, 2, 3, 4, 5 and 7 of Lansat ETM+ to 30 m.
� MODIS bands 1 to 7 to 250 m.
� IRS LISS-III band 1, 2 and 3 to 23.5 m.
� Thermal band of TM (resampled to 120m), ETM+ (to 60m) and MODIS (to 1 km) and
Panchromatic bands of ETM+ (resampled to 15 m).
� Supervised Classification using Bayesian Classifier: In supervised classification, the pixel
categorisation process is done by specifying the numerical descriptors of the various LC
types present in a scene. It involves (i) training, (ii) classification and (iii) output.
� Accuracy assessment: Accuracy assessments were done with field knowledge, visual in-
terpretation and also referring Google Earth (http://earth.google.com).
� Computation of Normalised Difference Vegetation Index (NDVI): It separates green veg-
etation from its background soil brightness and retains the ability to minimize topo-
graphic effects while producing a measurement scale ranging from –1 to +1 with NDVI-
values < 0 representing no vegetation.
Derivation of Land Surface Temperature (LST) LST from Landsat TM: The TIR band 6 of Landsat-5 TM was used to calculate the surface
temperature of the area. The digital number (DN) was first converted into radiance LTM
using
LTM
= 0.124 + 0.00563 * DN (Equation 1)
The radiance was converted to equivalent blackbody temperature TTMSurface
at the satel-
lite using

ekDRM 2011 | 55
TTMSurface
= K2/(K
1 – lnL
TM ) – 273 (Equation 2)
The coefficients K1 and K
2 depend on the range of blackbody temperatures. In the black-
body temperature range 260-300K the default values (Singh, S. M., 1988) for Landsat TM are
K1 = 4.127 and K
2 = 1274.7. Brightness temperature is the temperature that a blackbody
would obtain in order to produce the same radiance at the same wavelength (λ = 11.5 μm).
Therefore, additional correction for spectral emissivity (ε) is required to account for the non-
uniform emissivity of the land surface. Spectral emissivity for all objects are very close to
1, yet for more accurate temperature derivation emissivity of each LC class is considered
separately. Emissivity correction is carried out using surface emissivities for the specified LC
(table 1) derived from the methodology described in Snyder et al., (1998) and Stathopoulou
et al. (2006).
The procedure involves combining surface emissivity maps obtained from the Nor-
malized Difference Vegetation Index Thresholds Method (NDVITHM) (Sobrino and Raissouni,
2000) with LC information. The emmissivity corrected land surface temperature (Ts) were
finally computed as follows (Artis and Carnhan, 1982)
1 ( / ) lnB
sB
TT
Tλ ρ ε=
+ × (Equation 3)
where, λ is the wavelength of emitted radiance for which the peak response and the av-
erage of the limiting wavelengths (λ = 11.5 μm) were used, ρ = h x c/σ (1.438 x 10⁻² mK), σ =
Stefan Bolzmann’s constant (5.67 x 10⁻⁸ Wm-2K-4 = 1.38 x 10⁻²³ J/K), h = Planck’s constant (6.626
x 10-34 Jsec), c = velocity of light (2.998 x 10⁸ m/sec), and ε is spectral emissivity.
LST from Landsat ETM+: The TIR image (band 6) was converted to a surface tempera-
ture map according to the following procedure (Weng et al., 2004). The DN of Landsat ETM+
LC type Emissivity
Densely urban 0.946
Mixed urban (Medium Built) 0.964
Vegetation 0.985
Water body 0.990
Others 0.950
Table 1: Surface emissivity values by LC type

56 | T. V. Ramachandra
was first converted into spectral radiance LETM
using equation 4, and then converted to at-
satellite brightness temperature (i.e., black body temperature, TETMSurface
), under the assump-
tion of uniform emissivity (ε ≈ 1) using equation 5 (Landsat Project Science Office, 2002):
LETM
= 0.0370588 x DN + 3.2 (Equation 4)
TETMSurface
= K2/ln (K1/ L
ETM + 1) (Equation 5)
where, TETMSurface
is the effective at-satellite temperature in Kelvin, LETM
is spectral radiance in
watts/(meters squared x ster x μm); and K2 and K
2 are pre-launch calibration constants. For Land-
sat-7 ETM+, K2 = 1282.71 K and K
1 = 666.09 mWcm-2sr-1μm-1 were used (http://ltpwww.gsfc.nasa.
gov/IAS/handbook/handbook_htmls/chapter11/chapter11. html). The emissivity corrected land
surface temperatures Ts were finally computed by equation 3.
Results and DiscussionThe supervised classified images of 1973, 1992, 1999, 2000, 2002, 2006 and 2009 with an
overall accuracy of 72%, 75%, 71%, 77%, 60%, 73% and 86% were obtained using the open
source programs (i.gensig, i.class and i.maxlik) of Geographic Resources Analysis Support
System (http://wgbis.ces.iisc.ernet.in/ grass) as displayed in figure 3. The class statistics is giv-
en in table 2. The implementation of the classifier on Landsat, IRS and MODIS image helped
in the digital data exploratory analysis as were also verified from field visits in July, 2007 and
Google Earth image. From the classified raster maps, urban class was extracted and con-
verted to vector representation for computation of precise area in hectares. There has been
a 632% increase in built up area from 1973 to 2009 leading to a sharp decline of 79% area in
water bodies in Greater Bangalore mostly attributing to intense urbanisation process. Figure
4 shows Greater Bangalore with 265 water bodies (in 1972). The rapid development of urban
sprawl has many potentially detrimental effects including the loss of valuable agricultural
and eco-sensitive (e.g. wetlands, forests) lands, enhanced energy consumption and green-
house gas emissions from increasing private vehicle use (Ramachandra and Shwetmala,
2009). Vegetation has decreased by 32% from 1973 to 1992, by 38% from 1992 to 2002 and
by 63% from 2002 to 2009. Disappearance of water bodies or sharp decline in the number
of waterbodies in Bangalore is mainly due to intense urbanisation and urban sprawl. Many
lakes (54%) were unauthorised encroached for illegal buildings. Field survey (during July-
August 2007) shows that nearly 66% of lakes are sewage fed, 14% surrounded by slums and
72% showed loss of catchment area. Also, lake catchments were used as dumping yards for
either municipal solid waste or building debris. The surrounding of these lakes have illegal

ekDRM 2011 | 57
constructions of buildings and most of the times, slum dwellers occupy the adjoining areas.
At many sites, water is used for washing and household activities and even fishing was ob-
served at one of these sites. Multi-storied buildings have come up on some lake beds that
have totally intervene the natural catchment flow leading to sharp decline and deteriorating
quality of waterbodies. This is correlated with the increase in built up area from the con-
centrated growth model focusing on Bangalore, adopted by the state machinery, affecting
severely open spaces and in particular waterbodies. Some of the lakes have been restored by
the city corporation and the concerned authorities in recent times.
Figure 3: Greater Bangalore in 1973, 1992, 1999, 2000 and 2009.
Class Year
Built up Vegetation Water Bodies Others
1973 Ha 5448 46639 2324 13903
% 7.97 68.27 3.40 20.35
1992 Ha 18650 31579 1790 16303
% 27.30 46.22 2.60 23.86
Table 2: Greater Bangalore LC statistics

58 | T. V. Ramachandra
Class Year
Built up Vegetation Water Bodies Others
1999 Ha 23532 31421 1574 11794
% 34.44 45.99 2.30 17.26
2000 Ha 24163 31272 1542 11346
% 35.37 45.77 2.26 16.61
2002 Ha 26992 28959 1218 11153
% 39.51 42.39 1.80 16.32
2006 Ha 29535 19696 1073 18017
% 43.23 28.83 1.57 26.37
2009 Ha 39910 11153 489 16785
% 58.40 16.32 0.72 24.56
Figure 4: Greater Bangalore with 265 water bodies.

ekDRM 2011 | 59
LST were computed from Landsat TM and ETM thermal bands. The minimum and
maximum temperature from Landsat TM data of 1992 was 12 and 21 with a mean of
16.5±2.5 while for ETM+ data was 13.49 and 26.32 with a mean of 21.75±2.3. MODIS
Land Surface Temperature/Emissivity (LST/E) data with 1 km spatial resolution with a
data type of 16-bit unsigned integer were multiplied by a scale factor of 0.02 (http://
lpdaac.usgs.gov/modis/dataproducts.asp#mod11). The corresponding temperatures
for all data were converted to degree Celsius. Figure 5 shows the LST map and NDVI
of Greater Bangalore in 1992, 2000 and 2007. The minimum (min) and maximum (max)
temperatures were computed as 20.23, 28.29 and 23.79, 34.29 with a mean of 23.71±1.26,
28.86± 1.60 for 2000 and 2007 respectively. Data were calibrated with in-situ measure-
ments. NDVI was computed to study its relationship with LST. The Landsat TM NDVI had a
mean of 0.04±0.4543, ETM+ data had a mean of 0.0252±0.5369 and MODIS had a mean
of -0.0917±0.5131.
Figure 5: LST and NDVI from Landsat TM (1992), MODIS (2002 and 2007).(Note: pixelisation of MODIS 2002 and 2007 is mainly due to coarse spatial resolution ~ 1 Km)
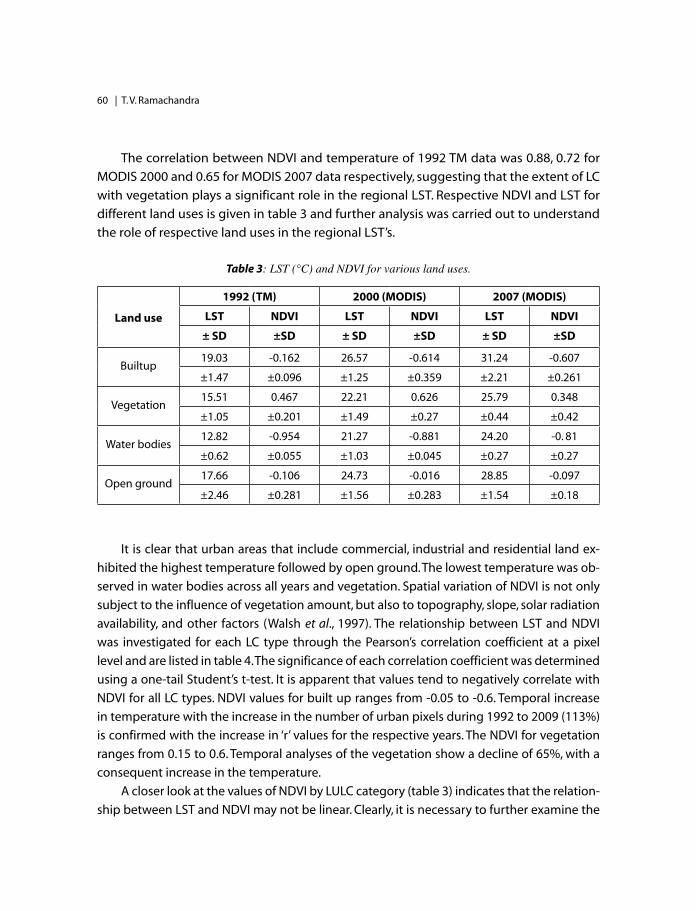
60 | T. V. Ramachandra
The correlation between NDVI and temperature of 1992 TM data was 0.88, 0.72 for
MODIS 2000 and 0.65 for MODIS 2007 data respectively, suggesting that the extent of LC
with vegetation plays a significant role in the regional LST. Respective NDVI and LST for
different land uses is given in table 3 and further analysis was carried out to understand
the role of respective land uses in the regional LST’s.
Land use
1992 (TM) 2000 (MODIS) 2007 (MODIS)
LST NDVI LST NDVI LST NDVI
± SD ±SD ± SD ±SD ± SD ±SD
Builtup19.03 -0.162 26.57 -0.614 31.24 -0.607
±1.47 ±0.096 ±1.25 ±0.359 ±2.21 ±0.261
Vegetation15.51 0.467 22.21 0.626 25.79 0.348
±1.05 ±0.201 ±1.49 ±0.27 ±0.44 ±0.42
Water bodies12.82 -0.954 21.27 -0.881 24.20 -0. 81
±0.62 ±0.055 ±1.03 ±0.045 ±0.27 ±0.27
Open ground17.66 -0.106 24.73 -0.016 28.85 -0.097
±2.46 ±0.281 ±1.56 ±0.283 ±1.54 ±0.18
Table 3: LST (°C) and NDVI for various land uses.
It is clear that urban areas that include commercial, industrial and residential land ex-
hibited the highest temperature followed by open ground. The lowest temperature was ob-
served in water bodies across all years and vegetation. Spatial variation of NDVI is not only
subject to the influence of vegetation amount, but also to topography, slope, solar radiation
availability, and other factors (Walsh et al., 1997). The relationship between LST and NDVI
was investigated for each LC type through the Pearson’s correlation coefficient at a pixel
level and are listed in table 4. The significance of each correlation coefficient was determined
using a one-tail Student’s t-test. It is apparent that values tend to negatively correlate with
NDVI for all LC types. NDVI values for built up ranges from -0.05 to -0.6. Temporal increase
in temperature with the increase in the number of urban pixels during 1992 to 2009 (113%)
is confirmed with the increase in ‘r’ values for the respective years. The NDVI for vegetation
ranges from 0.15 to 0.6. Temporal analyses of the vegetation show a decline of 65%, with a
consequent increase in the temperature.
A closer look at the values of NDVI by LULC category (table 3) indicates that the relation-
ship between LST and NDVI may not be linear. Clearly, it is necessary to further examine the

ekDRM 2011 | 61
existing LST and vegetation abundance relationship using fraction as an indicator. The abun-
dance images using linear unmixing from ETM+ bands were further analysed to see their
contribution to the UHI by separating the pixels that contains 0-20%, 20-40%, 40-60%, 60-
80% and 80-100% of urban pixels. Table 5 gives the average LST for various land use classes.
Land use 1992 2000 2007
Built up -0.7188 -0.7745 -0.7900
Vegetation -0.8720 -0.6211 -0.6071
Open ground -0.6817 -0.5837 -0.6004
Water bodies -0.4152 -0.4182 -0.4999
Table 4: Correlation coefficients between LST and NDVI by LC type (p=0.05)
Class
Abundance
Mean Temperature±
SD of dense urban
Mean Temperature±
SD of mixed urban
Mean Temperature±
SD of vegetation
0-20% 21.99±2.37 21.57±2.36 17.91±2.19
20-40% 22.06±2.15 21.58±2.36 17.39±1.37
40-60% 22.27±2.00 21.67±2.41 17.22±0.89
60-80% 22.33 ±2.22 22.28±2.02 17.13±0.85
80-100% 22.47±1.96 22.37±2.17 17.12±0.91
Table 5: Mean LST for various land use classes for different abundances
Figure 6: Transect lines superimposed on Greater Bangalore boundary along with LST in various directions.

62 | T. V. Ramachandra
8 transacts were laid across the city in different directions (north [N], north-east [NE],
east [E], south-east [SE], south [S], south-west [SW], west [W] and north-west [NW]) and LST
was analysed as shown in figure 6, to understand the temperature dynamics.
The temperature profile was analysed by overlaying the LST map on the Baye’s classi-
fied map to visualise the effect of vegetation, builtup, water bodies and open ground. The
temperature profile plot fell below the mean when a vegetation patch or water body was
encountered on the transact beginning from the center of the city and moving outwards
along the transact. The corresponding graphs are shown in figure 7. The major natural green
area and water bodies responsible for temperature decline are marked with circle. The spa-
tial location of these green areas and water bodies are shown in figure 8.
Figure 7: Temperature profile in various directions. X axis – Movement along the transacts from the city centre, Y axis - Temperature (°C).

ekDRM 2011 | 63
ConclusionUrbanisation and the consequent loss of lakes has led to decrease in catchment yield, wa-
ter storage capacity, wetland area, number of migratory birds, flora and fauna diversity and
ground water table. As land is converted, it loses its ability to absorb rainfall. The relationship
between LST and NDVI investigated through the Pearson’s correlation coefficient at a pixel
level and the significance tested through one-tail Student’s t-test, confirms the relationship
for all LC types. Also, increased urbanisation has resulted in higher population densities in
certain wards, which incidentally have higher LST due to high level of anthropogenic activi-
ties. The growth poles are towards N, NE, S and SE of the city indicating the intense urbaniza-
tion process due to growth agents like setting up of IT corridors, industrial units, etc. Newly
builtup areas in these regions consisted of maximum number of small-scale industries, IT
companies, multistoried building and private houses that came up in the last one decade.
Figure 8: Google Earth image showing the low temperature areas (refer figure 7).[Source: http://earth.google.com/]

64 | T. V. Ramachandra
The growth in northern direction can be attributed to the new International Airport, encour-
aging other commercial and residential hubs. The southern part of the city is experiencing
new residential and commercial layouts and the north-western part of the city outgrowth
corresponds to the Peenya industrial belt along with the Bangalore-Pune National Highway
AcknowledgementWe thank the Ministry of Environment and Forests, Government of India, Indian Institute of
Science and the Ministry of Science and Technology, DST, Government of India for the sus-
tained financial and infrastructure support to energy and wetlands research.
References � Artis, D. A., and Carnahan, W. H. (1982). Survey of emissivity variability in thermography of
urban areas. Remote Sensing of Environment 12: 13-329.
� Kulkarni, V. and Ramachandra T.V. (2006). Environmental Management, Commonwealth
Of Learning, Canada and Indian Institute of Science, Bangalore.
� Landsat Project Science Office. (2002). Landsat 7 science data user’s handbook. God-
dard Space Flight Center, Available from: www.address: http://ltwww.gsfc.nasa.gov/IAS/
handbook/ handbook_toc.html.
� Li, F., Jackson, T. J., Kustas, W, Schmugge, T., J., French, A. N., Cosh, M. L., and Bindlish, R. (2004).
Deriving land surface temperature from Landsat 5 and 7 during SMEX02/SMACEX. Re-
mote Sensing of Environment 92: 521-534.
� Nikolakopoulos, K. G, Vaiopoulos, D. A, Skianis, G. A. (2003). Use of multitemporal remote
sensing thermal data for the creation of temperature profile of Alfios river basin. Geosci-
ence and Remote Sensing Symposium, 21-25 July 2003, IGARSS ‘03. Proceedings,IEEE Inter-
national, 4: 2389-2391.
� Ramachandra T V and Uttam Kumar (2009). Land surface temperature with land cover
dynamics: multi-resolution,spatio-temporal data analysis of Greater Bangalore, Interna-
tional Journal of Geoinformatics, 5 (3):43-53
� Ramachandra T.V and Uttam Kumar (2008). Wetlands of Greater Bangalore, India: Auto-
matic Delineation through Pattern Classifiers, The Greendisk Environmental Journal. Issue
26 (International Electronic Jour. URL: (http://egj.lib.uidaho.edu/index.php/egj/article/
view/3171).
� Ramachandra T.V. and Shwetmala (2009). Emissions from India's Transport sector: State-
wise Synthesis, Atmospheric Environment, 43 (2009) 5510–5517.
� Singh, S., M. (1998). Brightness Temperatures Algorithms of Landsat Thematic Mapper
Data. Remote Sensing of Environment 24: 509-512.

ekDRM 2011 | 65
� Snyder, W. C., Wan, Z., Zhang, Y., and Feng, Y. -Z. (1998). Classification based emissivity for
land surface temperature measurement from space. International Journal of Remote
Sensing 19: 2753-2774.
� Sobrino, J. A., and Raissouni, N. (2000). Toward remote sensing methods for land cover
dynamic monitoring: Application to Morocco. International Journal of Remote Sensing
21: 353-366.
� Stathopoplou, M., Cartalis, C. and Petrakis, M. (2006). Integrating CORINE land cover data
and landsat TM for surface emissivity definitions: an application for the urban area of
Athens, Greece, International Journal of Remote Sensing.
� Stathopoulou, M., and Cartalis, C. (2007). Daytime urban heat island from Landsat ETM+
and Corine land cover data: An application to major cities in Greece. Solar Energy 81:
358-368.
� Streutker, D. R. (2002). A remote sensing study of the urban heat island of Houston, Texas.
International Journal of Remote Sensing 23: 2595-2608.
� Sudhira H.S., Ramachandra T.V., Bala Subramanya M.H. (2007). City Profile: Bangalore., Cit-
ies l24(4): 379-390.
� Sudhira, H.S., Ramachandra, T.V., and Jagadish, K. S. (2003). Urban sprawl: metrics, dynam-
ics and modelling using GIS, International Journal of Applied Earth Observation and Geo-
information 5(2004): 29-39.
� Walsh, S. J., Moody, A., Allen, T. R., and Brown, D. G. (1997). Scale dependence of NDVI and
its relationship to mountainous terrain. In D. A. Quattrochi, & M. F. Goodchild (Eds.), Scale
in Remote Sensing and GIS, pp. 27-55, Boca Raton, FL: Lewis Publishers.
� Weng, Q. (2001). A remote sensing-GIS evaluation of urban expansion and its impact on
surface temperature in the Zhujiang Delta, China. International Journal of Remote Sens-
ing 22: 1999-2014.
� Weng, Q. (2003). Fractal analysis of satellite-detected urban heat island effect. Photo-
grammetric Engineering and Remote Sensing 69: 555-566.
� Weng, Q., Lu, D., and Schubring, J. (2004). Estimation of land surface temperature – veg-
etation abundances relationship for urban heat island studies. Remote Sensing of Envi-
ronment 89: 467-483.
� World Urbanization Prospects. (2005). Revision, Population Division, Department of Eco-
nomic and Social Affaris, UN.
66 | Kathlyn Kissy H. Sumaylo
Natural Resource Management Policy Implications on Disaster Risk
Management Practices: Insights from North-East Cambodia
Kathlyn Kissy H. Sumaylo1
Overview of selected NRM policies in CambodiaLocated in the fertile Mekong River Basin, Cambodia is one of the most disaster-prone areas
in South-East Asia (IOM, 2010; NCDM PDNA, 2010). The kingdom, considered a Least Devel-
oping Country, has very high vulnerability levels in terms of human development indices
(NCDM and WFP, 2003a; MoP and WFP, 2003b) and low adaptive capacity of institutions, liveli-
hoods, communities, and ecosystems to natural disasters and climate change (Helmers and
Jegillos, 2004; Yusuf and Francisco, 2009).
Cambodia suffered from deep social and cultural intergenerational trauma, economic
stagnation, large population displacements into the Thai borders and movements outside
of the country, and institutional fragmentation as a result of nearly twenty years of civil war
from 1975 to 1991. Following the signing of the Paris Peace Accords in October 1991, which
gave then State of Cambodia its first comprehensive political settlement, the United Nations
Transitional Authority in Cambodia (UNTAC), was formed under UN Security Resolution No.
745 to “lead peace restoration efforts, to hold free and fair elections leading to a new consti-
tution and to spearhead the rehabilitation of the country” (UN website). The holding of Cam-
bodia’s first democratic elections under the auspices of the UNTAC in 1993 also paved the
way for the foundations of decentralized governance. With the completion of the post-con-
flict repatriation of displaced Cambodians, the multi-donor integrated development project
1The author was Project Manager of IOM Cambodia’s Building Resilience to Natural Hazards in North-East Cambodiaproject. Insights presented in the paper were drawn from the findings of IOM’s vulnerability assessments to natural hazards in Ratanakiri, Mondulkiri and Stung provinces in 2009 and 2010, [email protected]
ekDRM 2011 | 67
phases, Cambodia Area Rehabilitation and Regeneration Project (CARERE) 1 and 2 and the
Partnerships for Local Governance, shifted their focus from emergency post-war recovery
and rehabilitation to a developmental approach. This new approach addresses Cambodia’s
long-term challenges and needs for institutional governance, planning systems, infrastruc-
ture and capacities delivered under the government program SEILA2. Natural resource man-
agement was a key output under the program’s objective on poverty alleviation, alongside
delivery of rural infrastructures and de-mining. Community-based natural resource manage-
ment was the centrepiece of the SEILA/CARERE’s NRM program in Ratanakiri Province to ad-
dress communal lands, forests and water resources management (UNDP CARERE website).
The program, which was piloted in Ratanakiri Province in the north-eastern region and in
two north-western provinces, produced trained Department of Environment staff in forest
protection; 12 community forest pilots; formation of two Provincial Land Use Planning com-
mittees; and issuance of 7,600 land titles. At the height of the SEILA program implementa-
tion, the first policy stipulation for disaster risk management- the National Committee for
Disaster Management Policy Paper- was also released in 1995.
From 2000, national administrative and legal bases for environmental and natural re-
source management began to take shape. Alongside, decentralization experiments in na-
tional administrative and local development planning were posting development gains.
From 2001 onward, significant NRM and environmental policies and frameworks were put
in place on four areas: land tenure and management; forestry protection; protected areas
and wildlife conservation; and water resources management. These policies intersect with
national and local policy developments on disaster risk reduction and management (DRRM)
within a decentralized governance system, which is broadly described below as they impact
on the DRRM and NRM local policies and practices in North-East Cambodia.
Land tenure and managementThe Land Law of 2001 forms the basis of Cambodia’s present land use, tenure and manage-
ment, setting the legal regime for the ownership of immovable properties in the country as
determined by nature, by purpose and by law3 (Articles 1 and 2, Land Law, 2001). Legally-
2Seila means foundation in Khmer.3Article 10 of Land Law of 2001 defines immovable property by nature as all natural grounds such as forest land, cleared land, land that is cultivated, fallow or uncultivated, land submerged by stagnant or running waters and constructions or improvements firmly affixed to a specific place created by man and not likely to be moved whole, while immovable property by purpose are those fixed to the ground or incorporated into the constructions and which cannot be separated there from without damaging them or altering them, such as trees.

68 | Kathlyn Kissy H. Sumaylo
recognized properties in Cambodia are distinguished into three types: State Public Property,
State Private Property and Private Property The distinction is significant for natural resource
management and environmental conservation as it determines the mode of land tenure,
use and management. For instance, state public properties, having public interest as its pri-
mary purpose “may not be sold or transferred to other legal entities, though subject to oc-
cupancy and use rights that are strictly temporary in nature, such as logging concession in
the forest reserve” (Land Law, 2001; Oberndorf, 2006, p.3). Meanwhile, state private property,
or lands owned by the State and public legal entities that are idle or excess, “may be sold or
transferred to other legal entities, such as to land recipients under the Social Land Conces-
sion framework” (Obendorf, 2006, p.4). Article 14 on state private property strongly stipulates
that that no transformation of a land concession, unless in response to social purposes de-
termined by the State, can be converted into a right of ownership (Land Law, 2001, p.8).
The same law also provides for land concessions, bestowed as a legal right to qualified
persons or entities for economic or social reasons. Economic land concessions (ELCs)4 in Cam-
bodia are characterized by large scale plantations such as rubber, and for agro-industry such as
corn, cashew nuts and soybeans, for a maximum period of 99 years (Sub-Decree No. 146, 2005).
This land use arrangement is a particularly contentious form of natural resource exploitation
because of its associated socio-economic and political implications on land access and tenure
especially on traditionally held agricultural lands, and environmental damages brought about
by excessive land clearing and related activities. While an environmental impact assessment is
required before an approval of a concession activity, many reported ELC commence their op-
erations before the EIA approval and beyond the land area limit set by law. Social land conces-
sions on the other hand are a land allocation mechanism that may be granted to repatriated
persons, poor homeless households for farming or residential purpose, demobilized soldiers;
to those displaced by natural disasters or by infrastructure development and needing resettle-
ment; and to workers of land for ELCs (Sub-Decree No. 19 on Social Land Concessions, 2003).
Forestry protection and managementThe Forestry Law (2002) defines the framework for the sustainable management, har-
vesting, use and development of forests in the Cambodia. The permanent forest re-
4 Sub-decree No. 146 on Economic Land Concession was issued in 27 December 2005, in compliance with the provision of the Land Law of 2001. The SD defines ELC as a mechanism to grant private state land through a specific economic land concession contract to a concessionaire to use for agricultural and industrial-agricultural exploitation.
ekDRM 2011 | 69
serves of the country consist of production forests, protection forests, and conversion
forestland. Production and protection forest sub-classification are particularly signifi-
cant for indigenous people and local communities who have traditionally used the
forest and harvested its by-products. It also provides for the establishment of com-
munity forests as a mechanism to balance traditional use of forest areas for livelihoods,
residence and practice of customary beliefs in the Permanent Forest Reserves with pre-
serving natural balance. The authority to allocate such forest areas for traditional user
rights rests with the Ministry of Agriculture, Forestry and Fisheries. The arrangement is
enforced through a Community Forest Agreement (CFA) between the local commu-
nity and the Forestry Administration cantonment for a maximum period of 15 years.
The implementing guidelines are laid out on the Sub-decree on Community Forestry
Management5 issued in 2003, which includes the formation of community forestry
management committees and the crafting of a forest management plan, scope of use
and harvesting within the designated area, and the roles and responsibilities of the
implementing institutions (Forestry Administration and the Department of Agriculture,
as well as local communities).
Wildlife conservation is another important contribution of the law, which reiterates
stipulations in past sub-decrees and policies on the designation of protected areas in
the country, a number of which are located in the north-eastern provinces of Cambo-
dia. However, the law also prohibits certain forest activities that may lead to pollution,
damage, overharvesting, excessive natural resource exploitation. Shifting cultivation
and harvesting of high-value forest products such as resin or rare species for instance
are not allowed within the permanent forest reserves (Protected Areas Law, 2008).
An equally significant dimension of the law with regard to forest management is the
forest concession management6 in production forest not under use, which could be en-
tered by the Royal Government with any investors or legal entity. Forest concessions must
be entered through a bidding process and shall have an Environmental and Social Impact
Assessment (ESIA) in their Forest Management Plan. They must also ensure that conces-
sion operations do not interfere with customary practices on registered land property
held by indigenous peoples, as mandated by the Land Law of 2001, and customary access
and user rights within and close to the concession areas (Forestry Law, 2002).
5The sub-decree defines community forest is a forest planted under the state’s public property, the rights of which are given to a local community living in or near the forest to manage and utilize it in a sustainable manner. 6See Chapter 5 of the Forestry Law of 2002

70 | Kathlyn Kissy H. Sumaylo
Protected Areas and Wildlife ConservationThe mandate on protected areas is governed by the Protected Area (PA) Law (2008) which
establishes and modifies the scope of protected areas into eight classifications from the
four as provided in the Royal Decree on the Protection of Natural Areas in 19937 . The PA Law
identifies four management zones for each of the eight protected areas: 1) Core zone, or
areas of high conservation values containing threatened and critically endangered species
and access to the zone is allowed only for researchers and officials of the Nature Conserva-
tion and Protection Administration for scientific studies and observation for conservation
and protection of biological resources; 2) Conservation zone, also of high conservation val-
ue, consists of natural resources, ecosystems, watershed areas and natural landscape which
are adjacent to the core zone. Limited access to and strict control of the zone is allowed
for small scale community uses of non-timber forest products to support local ethnic live-
lihoods; 3) Sustainable use zone are areas allocated for national and local development,
and conservation of protected areas for local communities and indigenous ethnic minori-
ties. These include areas for national cultural heritage, eco-tourism, wildlife, preservation
and recreation, and infrastructure development (irrigation, reservoir, hydro-power), mining
and sustainable resin exploitation; and 4) Community zones, which are reserved for the
socio-economic development of local communities and ethnic minorities as well as areas
with existing residences, paddy fields and upland fields8. Criteria for zoning shall be based
on area management objectives, potential values of the area, socio-economic implications,
and geographical location. The law encourages the participation of local communities in
the management of the area.
Water Resources ManagementCambodia sits in the Mekong River Basin which spans six countries in Asia, including Thai-
land, Lao PDR, Viet Nam, China and Myanmar. The Agreement on the Cooperation for the Sus-
tainable Development of the Mekong Basin signed in 1995 forms the basis of the river basin
management trans-boundary cooperation framework by the four countries in the Lower
7The royal decree identified 23 natural areas under four classifications: natural parks, wildlife preserves, protected scenic view areas and multi-purpose areas. The eight classifications under the Protected Areas Law of 2008 are natural parks, protected landscape, wildlife sanctuary, multiple use site, ramsar site, Tonle Sap Biosphere Reserve, natural heritage site, Marine Park, wetland, protected areas, coastal areas for management and conservation, and Provincial/Municipal protected area. 8Article 11, Chapter IV on Zoning, Protected Areas Law; See related discussions in Chapter 2, IOM (2009). Mapping Vulnerability to Natural Hazards in Mondulkiri.

ekDRM 2011 | 71
9The Lower Mekong Basin is home to 60 million people. Its rivers and wetlands provide sources of food, livelihoods, power, transport and trade to many communities and industries, The entire river basin has one of the most productive inland fisheries in the world. Source: http://www.mrcmekong.org/about_mekong/water_work.htm 10Water profile of Cambodia indicates that in early November, when the level of the Mekong decreases, the Tonle Sap River reverses its flow, and water flows from Lake Tonle Sap to the Mekong River and thence to the Mekong Delta. http://www.eoearth.org/article/Water_profile_of_Cambodia 11See Chapter 3 in IOM. (2010). Mapping Vulnerability to Natural Hazards in Stung Treng. Phnom Penh: IOM.
Mekong Basin (Lao PDR, Cambodia, Thailand and Viet Nam)9 , while China and Myanmar sit
as Dialogue Partners (MRC website). The Agreement aims to “optimize the multiple use and
multiple benefits” of water resources and to “minimize the harmful effects that might result
from natural occurrences and man-made activities.” To further operationalize the plan, the
governments of Cambodia and Viet Nam have further signed a Memorandum of Under-
standing (MoU) and Action Plan to promote cooperation on cross-border water resource
management (IOM, 2010, p. 29)
The country has been noted for its unique hydrological system wherein the Mekong
River and the Great Tonle Sap Lake are joined by the Tonle Sap River, which reverses its flow
twice a year.10
Interface of DRRM and NRM: Insights from North-East CambodiaCambodia has suffered from the devastating effects of flood and drought, as well as from
storms and storm surges and strong winds. Between 1987 and 2007, 12 floods killed 1,125
people and caused approximately $300 million in damages (SNAP, 2008). In 2009, Cambodia
was among the countries in Southeast Asia heavily hit by Typhoon Ketsana, which swept
through 14 of its 24 provinces and severely affected 50,000 families. The Ketsana Compre-
hensive Post Disaster Needs Assessment report (2010) led by the National Committee for
Disaster Management reported that agriculture and fisheries were among those severely af-
fected, which cover 80 per cent of the country’s still largely rural population that are heavily
dependent on climate-sensitive livelihoods and natural resources. 11
Cambodia’s institutional mechanism for disaster risk management was first laid out
in a policy paper in 1995 creating the National Committee for Disaster Management to
be the lead agency in coordinating disaster management activities in the country. As
an inter-ministerial body, the NCDM is composed of 22 ministries, representatives of
the Cambodian Armed Forces, Cambodian Red Cross, and Civil Aviation Authority. Royal
Decree No. 0202/040 of 2002 mandated the NCDM to play a leading role in facilitation
and coordination, including the exercise of a comprehensive approach to disaster man-

72 | Kathlyn Kissy H. Sumaylo
agement; the analysis of existing and potential hazards and taking measures to miti-
gate against hazards; and provide and formulate effective disaster preparedness and
response plans.
Structures at the sub-national level are present at the provincial, district, commune and
village levels, in line with the decentralization policy of the government. Since the creation of
the NCDM, major policy developments on DRR have been accomplished nationally and in-
ternationally. International policies and declarations that have translated to national action
plans include the Hyogo Framework of Action which led to the signing and crafting of the
Strategic National Action Plan (SNAP) 2008-2013 on six key areas: institution-building; local
and community based disaster risk management, early warning; IEC and knowledge man-
agement to promote culture of safety and resilience; mainstreaming of DRR and disaster
preparedness at all levels. Another important development was the crafting of the National
Adaptation Programme of Action to Climate Change (2006) in compliance with Cambodia’s
commitment to the United Nations Framework Convention on Climate Change (UNFCCC).
Decentralized mechanisms have been the main channels through which DRRM and NRM
policies are synergized, and harmony is established between sectoral agendas. The Decen-
tralization and Deconcentration (D&D) Strategic Framework (2005) emphasizes the adher-
ence of governmental strategies and programs to the pillars of representation, participation,
accountability, effectiveness, and poverty reduction: all rooted in bringing services and deci-
sion-making processes closer to citizens. The new law on the administrative management of
the Provincial, Capital, District, and Khan councils (2009), also called the Organic Law, spells
out the roles and responsibilities of sub-national councils, including tasks in agriculture, for-
estry, natural resource management and environment, land use, electricity production and
distribution, and water management. 12 Emphasis is placed on allocating the use of resources
within the framework of a larger poverty reduction scheme that considers the needs of vul-
nerable groups; the law also recognizes the need for a disaster management plan along with
the mandated Local Development and Investment plans. Guidelines on Provincial/Capital
Development Plan are being drafted and contain sections on natural resource, environment
and disaster risk analysis for natural disasters and climate change.
The interface of DRRM and NRM in the north-eastern region of Cambodia is multi-fold and
complex. The region, which comprises of the provinces of Ratanakiri, Mondulkiri and Stung
Treng, has for many decades remained isolated from mainstream Cambodian politics and
12Articles 39, 49, and 215 of the Organic Law passed and signed in 2009.

ekDRM 2011 | 73
economy. The region is home to more than 50 per cent of the country’s indigenous peoples
and to some of the most regionally important biodiversity and natural resources (Stephens
and Brown, 2006), natural parks, protected landscapes, and wildlife sanctuaries. A network of
tributaries called the 3-S Rivers (Sesan, Sre Pok and Sekong rivers) flows through the three
provinces from the bordering countries of Viet Nam and Lao PDR before they empty into
the Mekong River. In the last ten years, the region has opened up to economic development,
inviting economic boom from land development and natural resource extraction as well as
cross-border trade and in-migration. Just as the region is endowed with natural resources, it
is also subject to intense natural resource exploitation and environmental degradation. The
three provinces also have very high poverty rates estimated from 41 to 100 per cent accord-
ing to a recent poverty survey for the Cambodian Millennium Development Goals (MoP and
RGC, 2009, p.6). IOM vulnerability assessments in Ratanakiri, Mondulkiri (2009) and Stung
Treng (2010) identified the region as having high disaster risk levels to flood, drought and
insect infestation, although they were not included in the priority areas under the Strate-
gic National Action Plan (SNAP) for Disaster Risk Reduction 2008-2015 (SNAP, 2008). These
provinces are seasonally exposed to slow onset and flash floods caused by a combination of
above average precipitation during the monsoon, overflow of rivers and streams, and water
releases from the upstream hydropower dams; and to agricultural and hydrological droughts
resulting in greater water stress for competing local uses, lower agricultural production, and
insecure clean water sources. Other hazards affecting local populations include insect infes-
tation, animal diseases, emerging and recurrent human diseases, in combination with the
environmental hazard risks from deforestation, rapid changes in hydrological regime of the
Mekong tributaries with contributions from water pollution and upstream hydropower dams,
which further raise the risk levels of communities to extreme weather events.
More than 70 per cent of the communities in all surveyed villages were found to have
medium to high disaster risk levels to flood and drought, with secondary hazard impacts
such as animal disease outbreaks and recurring and emerging human diseases. Climate-in-
duced hazards are emerging hazards that is increasingly being faced by the region. Among
the manifestations of rapid climactic changes include longer duration and intensity of
droughts, highly irregular precipitation levels, increase in average temperatures, and smaller
cycles and frequency of floods which disrupt traditional agricultural farming practices and
contribute to worsening existing health, socio-economic, environmental and material vul-
nerabilities of the communities studied (IOM, 2009a, 2009b, 2010).
The vulnerability assessments further indicate that the key features of social/organiza-
tional vulnerability in the North-East are the 1) lack of vertical linkages between national and
sub-national committees for disaster management, and sub-national authorities and local
74 | Kathlyn Kissy H. Sumaylo
communities on disaster preparedness and response; 2) the absence of coordination mech-
anisms for timely receipt and dissemination of reliable early warning information to affected
populations; and 3) the low priority given to disaster risk reduction as a development issue,
with PCDM and its line departments convening only during the onset of disaster events
Based on IOM’s field assessments, the interactions between environment and natural
resource management policy and program implementation and DRRM in the context of the
north-east region of Cambodia can be summarized in the following key points below:
� The need to build on local and indigenous practices and knowledge of their natural en-
vironments for effective disaster preparedness, response to and recovery from seasonal
natural and environmental hazards.
Traditional knowledge and warning signals are present and considered to be reliable
means for predicting the onset and behaviour of hazards. Rootedness to land and natural
resources as central part of the local identity may serve as an impetus for basic but sustained
community disaster risk management initiatives. However, the increasing unpredictability
of seasonal and climactic patterns, and prolonged and more frequent periods of drought,
renders this knowledge unreliable to changing conditions (IOM, 2009b, p. 3). Traditional
knowledge needs to be complemented by access to safe areas and facilities, timely receipt
and actions based on early warning signs both traditional and modern, and alternative live-
lihood strategies. A broader environment and natural resource management campaign for
local communities is important in raising awareness on the linkage between disaster risk
management and natural resource management.
� Changes to livelihood, food, and social securities driven by environmental degradation
may increase the impact of natural disasters and further exacerbate the vulnerabilities
of affected communities.
Food insecurity and insecure access to water are central features of vulnerability to
natural disasters in the region. While the region is abundant in water sources, the lack of ap-
propriate technology and storage to tap and deliver water to households and paddy fields
is a challenge. Availability of new crop fields is decreasing due to restrictions placed by con-
servation policies, economic land concessions as well as increasing demand from growing
population in the assessed villages. For instance, in Ratanakiri Province, some of the assessed
villages expressed concern over changes in access to natural resources following the pas-
sage of the Protected Area Law. Efforts are underway to ensure community participation in
the co-development of a community protected areas (CPA) management plan. While man-
agement zones are provided by law, there are yet no defined boundaries between protected
area zones. Some areas already identified as community protected areas cover resin and
malva nuts which are harvested by indigenous communities and old crop fields, but pro-
ekDRM 2011 | 75
hibit the clearing of new areas (IOM, 2009b, p. 26). In Stung Treng Province, land conversion
for agriculture, cash crops and resettlement expansion in response to population growth
and migration, and infrastructure development are identified as main threats to manage-
ment of the ramsar site. Conservation for international bird areas (IBA) in the same province
is threatened by extreme exploitation of riverine birds for commercial and local uses, and
habit loss due to flash floods and forest clearance for agriculture and logging. In Mondulkiri
Province, two wildlife sanctuaries face management challenges such as unmonitored timber
poaching, harvesting of wood for fuel, charcoal production and wildlife hunting and trading,
and habit changes due to forest land conversion for settlement and agro-industries. Across
the three provinces, forest areas that were affected include communal forests that are under
the traditional use of indigenous people for resin tapping, grazing lands, wild game, and for
spiritual purposes (IOM, 2010, p. 25).
� Linkages between environmental protection, disaster preparedness, and population
stabilization:
One potentially significant consequence of their high vulnerability to natural disasters
and climate-induced hazards and environmental degradation is on local community’s mo-
bility patterns. Although no large movements have been reported in the North-East, both
temporary and permanent movements that had been documented in the last ten years (IOM
2009a, 2009b, 2010; 3SPN, 2007) which indicate movements as part of local coping strategies
to environmental and natural hazards, including flood and drought, and to socio-economic
factors such as search of new lands for cultivation and settlement. Indigenous communities,
having a tradition of moving within village boundaries, have noted the difficulty of moving
their rice fields or houses in response to these hazards or in the practice of their traditional
beliefs. Even when temporary movements serve as a coping strategy, there are no water and
sanitation facilities and shelters available in safe areas identified by communities. Migration
to safer areas is also limited by the lack of financial resources, the lack of available lands
within the village, and the limitations posed by conservation policies in forest and protected
areas. There is a need to understand how migration can be maximized as a coping strategy
and as part of community-based preparedness and response to floods and drought (i.e.,
identification of safe areas and safe area management, and inclusion of migration/popula-
tion displacements in pre and post disaster risk assessment).
As road and border access to the region improves, local economies experience growth
as well as population growth that stems from seasonal labour migration, permanent in-mi-
gration, and cross-border trade. The combination of these factors makes unplanned popula-
tion movements unsustainable. The survey and development of land use plans down to the
commune level is still at its early stage, and when finalized these plans can better inform

76 | Kathlyn Kissy H. Sumaylo
local officials and communities in their local land use. The experience of Mondulkiri Province
demonstrates the importance of government, NGO and community cooperation in natural
management that is crucial for CBDRM wherein the Forestry Administration led the par-
ticipatory land use planning (PLUP) in partnership with NGOs like the Wildlife Conservation
Society for the Seima Biodiversity Conservation Area. Communities were engaged in iden-
tifying different land uses through a participatory approach resulting in a PLUP agreement
with the community. Under the agreement, each family will be allocated five hectares to use
for their residence and farming activities (IOM, 2009a, p. 23). In Ratanakiri, the Forestry Ad-
ministration in cooperation with local NGOs and indigenous communities has identified 31
areas to be allocated for community forestry. In Stung Treng, local community projects have
been set up by NGOs in three districts, but have yet to be officially endorsed by the Forestry
Administration (IOM, 2010, p.25).
In line with the mandate of the Land Law of 2001 as well as the Sub-Decree on Proce-
dures of Registration of Land of Indigenous Communities, communally held lands by indig-
enous communities can be recognized subject to the establishment of their legal identity
as a community and subsequent legal registration as defined by the Ministry of Interior.
In Ratanakiri Province, two legal identities and in Mondulkiri and one legal identity for a
Phnong indigenous village have been registered (IOM, 2009a, p. 23; IOM, 2009b, p.24).
� Institutional capacities for convergence of DRRM and NRM are crucial in effective devel-
opment planning and rationalized resource mobilization and community engagement
and in addressing the emerging impacts of climate-induced hazards.
Among local communities surveyed particularly in areas where chronic poverty is high,
disaster preparedness was limited to household-level preparations—such as preparing food
stock and evacuating livestock to safety during floods or storage of water during drought—
and some village-based mechanisms such as sharing of boats and identification of safe areas
during evacuation. These disaster preparedness activities proved sufficient in the past dur-
ing small scale floods and drought; however, recent trends indicate unpredictable flooding
and precipitation patterns that have increased in intensity, duration and scale are rendering
these mechanisms insufficient. Overall disaster response capacity is also very limited owing
to the lack of technical and human resource capacity, as well as financial and material re-
sources to undertake emergency response, relief and recovery. Often, Provincial Committee
for Disaster Management (PCDM) officials meet only during onsets of disasters to mobilize
resources from different line departments and from other funding sources, indicating a very
high dependence on external assistance. At the district, commune and village levels, there
are no dedicated technical and material resources to first lines of response at the onset of
disasters nor are there trained local human resources that can be tapped to undertake sys-
ekDRM 2011 | 77
tematic disaster response and evacuation, and assessment of damages and displacements
and assistance to be given to affected populations.
Institutional capacities by the Provincial Committee for Disaster Management (PCDM)
are limited by both technical and financial resources as well as low levels of appreciation
of disaster risk reduction beyond emergency response. Past disaster management efforts
had focused on remedial measures for drought and emergency response during and after
floods and there is very low inter-departmental and administrative coordination on disaster
management. DRR is not identified in the provincial development plan as prioritized de-
velopment issue and has yet to be fully mainstreamed into natural resource management,
environment and health programs in the provinces. Hence, there is no human, technical and
financial resources tied to DRR-related activities. Awareness on climate change is at its earli-
est stage at the institutional and community-levels through the Provincial Department of
Environment and some local non-governmental organizations.
The low level of awareness on climate change makes it challenging for the interaction
of DRR and climate change at field level. Both concepts are new and their application in lo-
cal development planning is limited as yet. IOM assessments had shown that inter-sectoral
departmental coordination by key provincial departments such as the Agriculture, Forestry
and Fisheries, Water Resources and Meteorology, and Environment, for DRR, NRM and climate
change has not yet taken place due to the lack of guidance for the operationalization of
these mandates. The lack of coordination and convergence of sectoral planning and focus
at lower levels of government more importantly reflects the difficulty of such convergence
at the national level, where each responsible ministry under the Strategic National Action
Plan (SNAP) for DRR has defined responsibilities. The shift to a developmental focus of DRR
is gradually taking place but this eventual shift has yet to be supported by national and pro-
vincial wide capacity building and administrative reform process. Clear definition of roles and
responsibilities and budgetary allocation at provincial, sectoral department levels, and other
sub-national levels must be reinforced. Field experience from piloting of the Village Disaster
Management Teams (VDMT) in two provinces had shown that community-based disaster risk
management could only be effective when informal social mechanisms are linked to formal
mechanisms such as through the commune investment and development planning mecha-
nisms. It has also demonstrated how the impacts of climate change and environmental deg-
radation need to be considered in community action planning and risk assessment. Present
mechanisms have not yet been fully maximized to allow for this convergence at the local
level. For instance, natural resource management priorities supported under the DANIDA CB-
NRM funding stream could be channelled as a major DRR measure in the annual Commune
Investment Planning but this has yet to be done. Ongoing administrative streamlining fol-

78 | Kathlyn Kissy H. Sumaylo
lowing the newly passed National Program on Sub-National Democratic Development for
2010–2019 provides for a set of planning guidelines currently on draft at sub-national levels
that include DRR and climate change in the risk assessment and planning priorities.
Concluding StatementPolicy developments in the last two decades in Cambodia have placed environment and
natural resource management as pillars to its development strategy and long-term poverty
reduction targets. The increasing complexity of Cambodia’s socio-economic development
challenges calls for more integrated policy and institutional convergence and solutions
on key issues such as environmental degradation, impacts of natural disasters and climate
change on food security and human vulnerability, and natural resource exploitation. Decen-
tralized mechanisms had shown promising gains in bringing these convergences and man-
dates to sub-national government and local communities.
Historically exposed and devastated by floods and drought and in recent years, by ex-
treme weather events such as the Typhoon Ketsana in 2009, Cambodia has low adaptive
capacity to both natural and climate hazard risks. Two of three north-eastern provinces,
Ratanakiri and Mondulkiri, rank high in vulnerability levels and low in adaptive capacity in a
recent study on climate vulnerability in Asia (Yusuf and Francisco, 2009).
Research assessments from the provinces of Ratanakiri, Mondulkiri and Stung Treng in
North-East Cambodia confirm the high vulnerability levels of local and indigenous commu-
nities as well as ecosystems and institutions to the compounding risks from natural hazards,
environmental degradation driven by such factors as natural resource exploitation, rapid
economic development and in-migration, and climate induced hazards. Institutional capaci-
ties for disaster management are low and synergies between environment and natural re-
source managements are weak. Despite these challenges, pockets of optimism abound for
the contribution of natural resource management and environmental preservation to disas-
ter risk reduction and management practices in the region. Field experiences demonstrate
the clear benefits of community-based disaster risk management (CBDRM) and community-
based natural resource management (CBNRM) as complementary approaches to help ad-
dress local vulnerabilities to natural hazards. Recent policy approval on decentralization
and poverty reduction recognizes the development linkages between address vulnerability
reduction to natural disasters, increasing ecosystem and human resilience, and poverty re-
duction. The development of local institutional, technical and human resource capacities for
NRM and DRRM is crucial in developing adaptive capacity of local communities and ecosys-
tems to recurrent risks of natural hazard and extreme weather events, environment hazards
as well as climate-induced hazards.

ekDRM 2011 | 79
References � Food and Agriculture Organization. (30 September 2008). Water Profile of Cambodia.
Retrieved from http://www.eoearth.org/article/Water_profile_of_Cambodia.
� Helmers, K. & Jegillos, S. (2004) Linkages between flood and drought disasters & Cambo-
dian rural livelihoods and food security. Phnom Penh, International Federation of Red
Cross and Red Crescent Societies and the Cambodia Red Cross Society.
� International Organization for Migration. (2009a) Mapping Vulnerability to Natural Haz-
ards in Mondulkiri. Phnom Penh, International Organization for Migration.
� International Organization for Migration. (2009b) Mapping Vulnerability to Natural Haz-
ards in Ratanakiri. Phnom Penh, International Organization for Migration.
� International Organization for Migration. (2010) Mapping Vulnerability to Natural Haz-
ards in Stung Treng. Phnom Penh, International Organization for Migration.
� Information Technology Section/ Department of Public Information (DPI). (2003). Unit-
ed Nations Transitional Authority in Cambodia.Retrieved from http://www.un.org/en/
peacekeeping/missions/past/untac.htm
� Mekong River Commission. (20 April 2011). About the Mekong. Retrieved from http://
www.mrcmekong.org/about_mekong/about_mekong.htm
� Mekong River Commission. (1995) Agreement for the Cooperation on the Sustainable
Development of the Mekong River Basin. Chang Rai, Thailand, Mekong River Commission.
� Ministry of Planning & United Nations World Food Programme. (2003) Poverty and Vul-
nerability Analysis Mapping in Cambodia: Summary Report. Phnom Penh, Royal Govern-
ment of Cambodia.
� Ministry of Plannning. (2009). Preliminary Results of the CDB-based Research and Analy-
sis Project. Poverty and Select CMDG Maps and Poverty Charts 2003-2008. Phnom Penh,
Royal Government of Cambodia.
� National Committee for Disaster Management. (1995) National Committee for Disaster
Management Policy Document. Phnom Penh, Royal Government of Cambodia.
� National Committee for Disaster Management & United Nations World Food Programme.
(2003) Mapping Vulnerability to Natural Hazards in Cambodia. Phnom Penh, National
Committee for Disaster Management and the United Nations World Food Programme.
� National Committee for Disaster Management & Ministry of Planning. (2008). Strategic
National Action Plan for Disaster Risk Reduction (SNAP) 2008-2013. Phnom Penh, Royal
Government of Cambodia.
� National Committee for Disaster Management. (2010) Comprehensive Post- disaster Needs
� Assessment: Ketsana Recovery and Reconstruction in Cambodia. Phnom Penh, Royal
Government of Cambodia.

80 | Kathlyn Kissy H. Sumaylo
� Obendorf, R. (2006). Legal Analysis of Forest and Land Laws in Cambodia. Phnom Penh,
Community Forestry International.
� Royal Government of Cambodia. (1993). Royal Decree in the Protection of Natural Areas
[Document prepared by the Ministry of Land Management, Urban Planning and Con-
struction]. Phnom Penh, Cambodia.
� Royal Government of Cambodia. (2001) Land Law of 2001 [English translation by the
Ministry of Land Management, Urban Planning, and Construction]. Phnom Penh, Royal
Government of Cambodia.
� Royal Government of Cambodia. (2003a) Sub-Decree on Community Forestry Manage-
ment [Translation provided by GTZ Cambodian-German Forestry Project]. Phnom Penh,
Royal Government of Cambodia.
� Royal Government of Cambodia. (2003b) Sub-Decree No. 19 on Social Land Concessions.
[Document prepared by the Ministry of Land Management, Urban Planning and Con-
struction].Phnom Penh, Cambodia.
� Royal Government of Cambodia. (2005a) Strategic Framework For Decentralization and
Deconcentration Reforms. Phnom Penh, Royal Government of Cambodia.
� Royal Government of Cambodia. (2005b). Sub-Decree No. 146 on Economic Land Con-
cessions. Phnom Penh, Royal Government of Cambodia.
� Ministry of Environment. (2006). National Adaptation Programme of Action to Climate
Change. Phnom Penh, Royal Government of Cambodia.
� Royal Government of Cambodia. (2008) Protected Area Law. Phnom Penh, Royal Gov-
ernment of Cambodia.
� Royal Government of Cambodia. (2008) The Law on Elections of Capital Council, Provin-
cial Council, Municipal Council, District Council and Khan Council (Royal Kram No.NS/
RKM/0508/018). Phnom Penh, Royal Government of Cambodia.
� Royal Government of Cambodia. (2009) Sub-Decree on Procedures of Registration of
Land of Indigenous Communities [Approved by the Council of Ministers, Unofficial Eng-
lish Translation as of 08 August 2009]. Phnom Penh, Royal Government of Cambodia.
� Royal Government of Cambodia. (2010) National Program on Sub-national Democratic
Development 2010-2019. Phnom Penh, Royal Government of Cambodia.
� Stephens, A. & Brown, G. (2005). Indigenous Communities and Development in Ratana-
kiri. Phnom Penh, Community Forestry International.
� 3S Rivers Protection Network (3SPN). (2007) Abandoned Villages Along The Sesan River
in Ratanakiri Province, Northeastern Cambodia. Banlung, Ratanakiri, 3S Rivers Protec-
tion Network.
� United Nations Development Programme (28 June 2001). The SEILA Programme and

ekDRM 2011 | 81
the Cambodia Area Rehabilitation and Regeneration Project. Retrieved from http://mir-
ror.undp.org/carere/index.html
� Yusuf, A. & Francisco, H. (2009). Climate Change Vulnerability Mapping for Southeast Asia.
Singapore, Economy and Environment Program for Southeast Asia (EEPSEA).
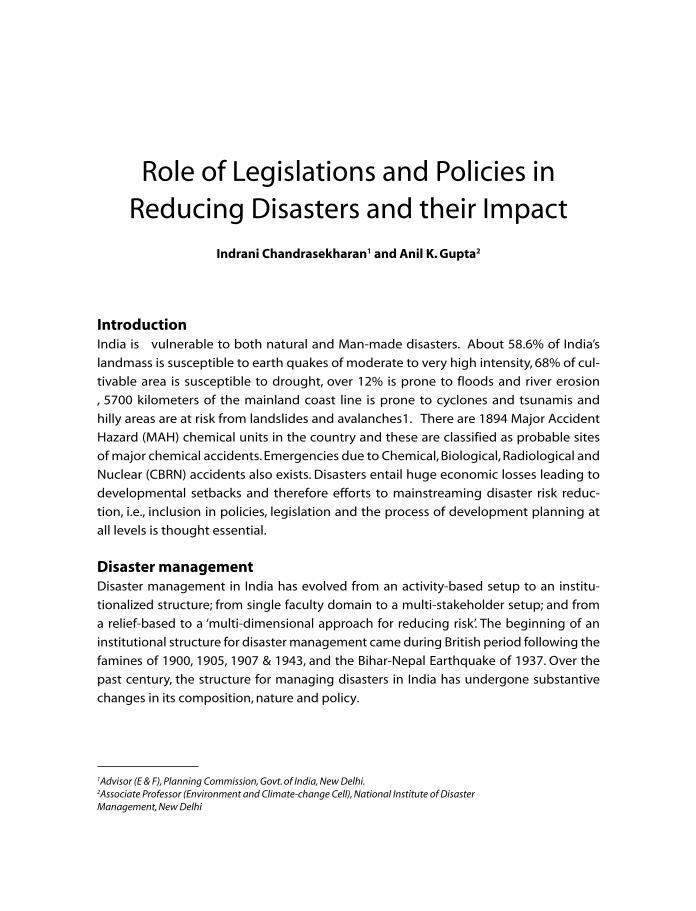
82 | Indrani Chandrasekharan et al
Role of Legislations and Policies in Reducing Disasters and their Impact
Indrani Chandrasekharan1 and Anil K. Gupta2
IntroductionIndia is vulnerable to both natural and Man-made disasters. About 58.6% of India’s
landmass is susceptible to earth quakes of moderate to very high intensity, 68% of cul-
tivable area is susceptible to drought, over 12% is prone to floods and river erosion
, 5700 kilometers of the mainland coast line is prone to cyclones and tsunamis and
hilly areas are at risk from landslides and avalanches1. There are 1894 Major Accident
Hazard (MAH) chemical units in the country and these are classified as probable sites
of major chemical accidents. Emergencies due to Chemical, Biological, Radiological and
Nuclear (CBRN) accidents also exists. Disasters entail huge economic losses leading to
developmental setbacks and therefore efforts to mainstreaming disaster risk reduc-
tion, i.e., inclusion in policies, legislation and the process of development planning at
all levels is thought essential.
Disaster managementDisaster management in India has evolved from an activity-based setup to an institu-
tionalized structure; from single faculty domain to a multi-stakeholder setup; and from
a relief-based to a ‘multi-dimensional approach for reducing risk’. The beginning of an
institutional structure for disaster management came during British period following the
famines of 1900, 1905, 1907 & 1943, and the Bihar-Nepal Earthquake of 1937. Over the
past century, the structure for managing disasters in India has undergone substantive
changes in its composition, nature and policy.
1Advisor (E & F), Planning Commission, Govt. of India, New Delhi.2Associate Professor (Environment and Climate-change Cell), National Institute of Disaster Management, New Delhi
ekDRM 2011 | 83
Policies and Legal regime for Natural and Chemical disastersA Strategy for total risk management, comprise; prevention, preparedness, response and res-
toration, Risk reduction and mitigation, streamlining institutional arrangements for disaster
response, communications and data links and resources. All the components of the strat-
egy need to be explicitly laid down in policies and legislations to ensure compliance.
Legislation is critical to ensure institutional systems, planning and coordination, local
participation and policy implementation. Legislations set standards and boundaries for ac-
tion, i.e., define building codes, training requirements and basic responsibilities of key stake-
holders in risk management.
Legislation on its own cannot induce people to follow the rules hence Monitoring and
Enforcement are needed. In high-risk locations, monitoring and enforcement — and knowl-
edge — of legislation in the short- to medium-term is lacking for want of financial and hu-
man resources .
Natural disastersPost independence, the task for managing disasters rested with the Relief Commissioners
in states, who functioned under the Central Relief Commissioner, with their role limited to
delegation of relief material and money in the affected area. Frequent occurrence of floods
and droughts in the country further limited the scope of disaster issues in India to the two
hazards. Since both floods and droughts had a direct impact on the agriculture sector, disas-
ter management in India came to be associated with agriculture and related issues. Every
five-year plan addressed flood disasters under “Irrigation, Command Area Development and
Flood Control”. A permanent system and institutional setup began in the 1990s. The disaster
management cell was established under the Ministry of Agriculture, following the decla-
ration of the decade of 1990 as the ‘International Decade for Natural Disaster Reduction’
(IDNDR) by the UN General Assembly.
Natural disasters were dealt with under a Central Sector Scheme of Natural Disaster
management. During 1993-94 the Programmes were implemented by the Department of
Agriculture and Co-operation with the objective of disaster preparedness and emphasis on
mitigation and preparedness for enhancing capability to reduce the adverse impact of di-
sasters. A National Centre for Disaster Management (NCDM) at the Indian Institute of Public
Administration was also created for training in the eighth plan. Natural Disaster manage-
ment was always considered as a state subject.
In the tenth Plan , the States were asked to convert the existing State Department of
Relief and Rehabilitation into Department of Disaster Management with the responsibility
of looking at the whole cycle of disaster management- prevention, mitigation, preparedness,

84 | Indrani Chandrasekharan et al
response, relief and rehabilitation. The Department of Disaster Management was also asked
to coordinate the steps taken by the different Departments of the Government. Consider-
ing that mitigation, preparedness and response are multi-disciplinary activities involving a
number of Departments, the State Governments were requested to consider setting up a
State Disaster Management Authority under the Chairmanship of the Chief Secretary with
the Secretaries of Departments of Water Resources, Health, Agriculture, Animal Husbandry,
Roads, Communications, Rural Development, Public Works, Public Health Engineering, Fi-
nance and Home as Members. The Secretary of the Department of Disaster Management was
the member-Secretary and this authority was to ensure coordination of activities towards
mitigation and preparedness as also coordinated response when a disaster strikes. Each State
was also asked to consider setting up specialised search and rescue teams of one coy of the
State Armed Police trained and equipped to carry out specialised search and rescue; one mo-
bile engineering unit with necessary equipment and one medical assistance team. Guidance/
advise required with reference to training and equipment was to be provided by the Disaster
Management Division of the Ministry of Home Affairs, Government of India.

ekDRM 2011 | 85

86 | Indrani Chandrasekharan et al
Policy for Natural Disaster managementThe Policy for Natural Disaster Management was drafted by the National Disaster Manage-
ment Authority (NDMA) in 2009 indicating vulnerable zones on the map of India to various
types of disaster (Map-1-4). The DM policy notified is based on the following 5 themes:
� Community based DM, including last mile integration of the policy, plans and execution.
� Capacity development in all spheres.
� Consolidation of past initiatives and best practices.
� Cooperation with agencies at National and International levels.
� Multi-sectoral synergy.
The objectives as stated in the National Policy on Disaster Management are as under:
� Promoting a culture of prevention, preparedness and resilience at all levels through
knowledge, innovation and education.
� Encouraging mitigation measure based on technology, traditional wisdom and environ-
mental sustainability.
� Mainstreaming disaster management into the developmental planning process.
Maps 1-4

ekDRM 2011 | 87
� Establishing institutional and technological frameworks to create an enabling regula-
tory environment and a compliance regime.
� Ensuring efficient mechanism for identification, assessment and monitoring of disaster
risks.
� Developing contemporary forecasting and early warning systems backed by responsive
and fail-safe communication with information technology support.
� Ensuring efficient response and relief with a caring approach towards the needs of the
vulnerable sections of the society.
� Undertaking reconstruction as an opportunity to build disaster resilient structures and
habitat for ensuring safer living.
� Promoting a productive and proactive partnership with the media for disaster
management.
Chemical disastersIn the Pre-Bhopal phase , legislations in force such as ; Explosives Act, 1884 , The Petroleum
Act, 1934 , Factories Act, 1948 and Rules made there under , The Insecticide Act, 1968 , Static
& Mobile Pressure Vessels Rule, 1981 , Motor Vehicles Act, 1988 focused on on-site safety of
workers. No legal system to regulate, Off-site emergency system, Safe storage and safe
transportation of hazardous substances were in place.
Post Bhopal a Legal Regime consisting of the following Acts and rules were enacted,
including Amendments to the Factories Act, 1948 and Motor Vehicles Act., 1988.
� Environment (Protection) Act, 1986
� Manufacture, Storage and Import of Hazardous Chemical Rules, 1989 amended, 2000
� Chemical Accidents (Emergency Planning, Preparedness and Response) Rules, 1996
� Public Liability Insurance Act, 1991 and rules there under
Policy for Chemical Disaster managementThe National Environment Policy of 2006 aims to mainstream environmental con-
cerns in all development activities. It describes the key environmental challenges both
current and prospective for the country and in addition to others , stresses on the
strategic themes for intervention and broad indications of the legislative and institu-
tional development. The dominant theme of the policy is that while conservation of
environmental resources is necessary to secure livelihoods and well-being of all, the
most secure basis for conservation is to ensure that people dependent on particular
resources obtain better livelihoods from the fact of conserva -tion , than from degrada-
tion of the resource.

88 | Indrani Chandrasekharan et al
One of the principles of the policy is prevention of environmental damage from occur-
ring, rather than attempting to restore degraded environmental resources.
One of the actions proposed is strengthening of the legal arrangements and response
measures for addressing emergencies arising out of transportation, handling, and disposal
of hazardous wastes, as part of the chemical accidents regime.
Reducing Disasters and their Impact through legislations Disaster Management Act, 2005
The Disaster Management Act, was enacted in 2005 for establishing requisite institutional
mechanisms (Fig-1) for drawing up and monitoring the implementation of disaster man-
agement plans, ensuring measures by various wings (Fig-2) of the government for preven-
tion and mitigating the effects of disasters, and for undertaking a holistic, coordinated, and
prompt response to any disaster situation.
The National Disaster Management Authority (NDMA), under the Chairmanship of the
Prime Minister, was set up as mandated. NDMA is an apex body responsible for laying down
policies, plans and guidelines on disaster management to ensure timely and effective re-
sponse to disasters. The Authority in addition to preparing the National Policy on Disaster
Management in 2009 , prepared guidelines on prevention, mitigation, response, and recov-
ery for different types of disasters viz; earthquake, flood, landslides and industrial disasters.
Figure 1

ekDRM 2011 | 89
As per DMA, 2005 the State Governments are required to set up State and district Disas-
ter Management Authorities. The provisions of the Act relevant to the States/UTs have been
brought into force w.e.f. 1 August 2007. As envisaged an eight battalion-strong National Disaster
Response Force has also been set up comprising of 144 specialized response teams on various
types of disasters of which 72 teams are for nuclear, biological, and chemical (NBC) disasters.
Ministry ofAgriculture
Hosts the NDMA, nodal authority for disaster management, coordinatesall programmes for disaster management
Ministry ofHome Affairs
Ministry ofHealth & FamilyWelfare
Ministry ofScience &Technology
Department ofTelecommunication
Department ofAtomic Energy
Nodal ministry for drought. Takes up activities such as droughtcontingency planning, insurance scheme, relief provisions etc incoordination with the nodal agency
Nodal ministry for biological disasters. Also responsible forstrengthening the emergency medical support system to assist in thedisaster response. Takes up activities and formulates policies to dealwith epidemics post-disaster fallouts etc.
IMD provides constant inputs to the nodal agency on the climate andweather forecasts and potential threats. Involved with the researchand technical activities in form of studies, hazard zonation and mappingin the disaster management set up.
Policies for regulating communication facilities at the times ofemergency. Takes up measures to establish emergency communicationsystems in collaboration with the nodal agency.
Part of the disaster management framework at three levels – as NodalMinistry for nuclear disasters, representation in the NCMC andrepresentation in the national executive council under the NDMA.
Disa
ster
managem
ent
fram
ew
ork
inIn
dia
Department ofSpace
Takes up activities related to observation systems, monitoring weatherand climatic parameters, communication systems using satellites andrelated programmes in collaboration with the nodal authority
Ministry ofRailways
Nodal Ministry for railway disasters and safeguarding railways from thenatural disasters. Instrumental in transporting relief materials duringthe disaster response an rehabilitation activities.
Ministry ofDefence
Instrumental in the rescue and relief operations in case of disaster andpeace operation in case of civil strife.
Ministry of CivilAviation
Nodal ministry for aviation disasters. Instrumental in transportationrelief material in the post-disaster phase.
Ministry of WaterResources
Ministry ofUrbanDevelopment
Representation in the NCMC and national executive council under theNDMA. Providing monitoring and forecasting inputs in times of floodemergencies.
Representation in the NCMC. Preparation of building and constructionlaws and codes, vulnerability mapping, etc.
Fig-2: Interface between the key Ministries and the disaster management framework
Environnent Impact Assessment (EIA) Notification, 2006.The Environment Impact Assessment Notification, 2006 envisages preparation of an Environ-
ment Management Plan which details mitigation measures for each item wise activity to be

90 | Indrani Chandrasekharan et al
undertaken during the construction, operation and the entire life cycle to minimize adverse
environmental impacts as a result of the activities of the project. It also delineates the envi-
ronmental monitoring plan for compliance of various environmental regulations and would
state the steps to be taken in case of emergency such as accidents at the site including fire.
Details called for in Form-1 under EIA include risks due to explosions, spillages, fires etc from
storage, handling, use or production of hazardous substances and Effect of natural disasters
causing environmental damage (e.g. floods, earthquakes, landslides, cloudburst etc).
Coastal Regulation Zone notification, 2011With a view to ensure livelihood security to the fisher communities and other local communi-
ties, living in the coastal areas, to conserve and protect coastal stretches, its unique environ-
ment and its marine area and to promote development through sustainable manner based
on scientific principles taking into account the dangers of natural hazards in the coastal areas,
sea level rise due to global warming, the Ministry of Environment and Forests (MoEF )through
the CRZ notification, 2011 declared the coastal stretches of the country and the water area
upto its territorial water limit, excluding the islands of Andaman and Nicobar and Lakshad-
weep and the marine areas surrounding these islands upto its territorial limit, as Coastal Reg-
ulation Zone CRZ) and restricted the setting up and expansion of any industry, operations
or processes and manufacture or handling or storage or disposal of hazardous substances as
specified in the Hazardous Substances (Handling, Management. This was in supersession of
the notification of the Government of India in the MoEF, number S.O.114(E), dated the 19th
February, 1991. The details sought for in respect of disaster management are as under:-
� Whether located within the hazard zone as mapped by Ministry of Environment and
Forests/National Disaster Management Authority?
� Whether the area is prone to cyclone, tsunami, tidal surge, subduction, earthquake etc.?
� Could the project be affected by natural disasters causing environmental damage (e.g.,
floods, earthquakes, landslides, cloudburst)?
Climate Change and Disaster managementTraditionally, disasters in India have been compounded by climatic factors. Being under the
monsoon regime, the country has faced frequent floods, drought and consequent famines.
However, the recent developments in the fields of disaster management and climate change
have overlooked these obvious links and two separate institutional structures have evolved
to service climate change and disasters. Whilst both frameworks have seen parallel develop-
ments, disaster management structure receive greater political priority and command im-
mediate attention among policy makers and users as they are associated with immediate

ekDRM 2011 | 91
and well known risks. Consequently, the disaster management structure in India has a more
evolved setup in comparison with the structure for addressing action on climate change ad-
aptation. The former structure, with strong legislative base, can be an effective entry point for
integrating climate change adaptation concerns with the disaster management initiatives.
Further, the presence of common stakeholders(fig-3) in the interfaces with the frameworks
for disaster management and action for climate change make it a suitable alternative for
exploring possibilities for integration. However, this will require wide-scale capacity building
in the interface institutions. Robust policy measures to enhance the capacity of the interface
institutions and also individuals who will be “gateway” and carriers of knowledge from one
framework to the other will be required.
Dis
aste
rM
an
ag
em
en
tFra
me
wo
rk
Clim
ate
Ch
an
ge
Stru
ctu
re
Ministry of Science &Technology
Ministry of Agriculture
Department of Space
Ministry of Health &Family Welfare
Monitoring and forecastingof extreme weather eventssuch as cyclones,thunderstorms, floods andd h
Policies and measures fordrought management andbuilding the resilience offarmers to deal withdrought pestilence, etc.
Satellite observations andmonitoring of weatherparameters; satellite basedcommunications during
Impact of disasters onpublic health, epidemicsand pandemics; postdisaster emergencymedical responsemechanisms
Climate changemodeling,forecasting thechange inweather elementssuch astemperature,rainfall, etc. overlonger time scales
Impact ofextreme weatherevents andclimaticvariability in formof droughts,temperatureextremes andrainfall shifts onagriculture sector,constructingimpact andvulnerabilityscenarios
Climate changemodeling andimpact scenarios
Impact of climaticvariability such asextremetemperaturesrainfalls andextreme eventson public health,mortality andmorbidity;construction andimpact scenarios
Fig-3: Common stakeholders and parallel interfaces with the disaster management and climate change frameworks

92 | Indrani Chandrasekharan et al
Integration of climate change adaptation concerns in disaster management will need to
be taken up at three levels – integrating adaptation to longer term climate scenarios with
the disaster mitigation and response interventions; regularizing policy networks to take up
climate change adaptation within the disaster management framework; and facilitating
permeability among the parallel structures within the common actors in both frameworks.
Lessons from India can have wider applications as many other countries share the common
challenge of deciding how to best link the two parallel tracks for tackling climate adaptation
and disaster management. The missing links in the institutional interface is indicated in fig-4.
Dis
aste
rM
anag
emen
tFr
amew
ork
Clim
ateC
han
ge
Framew
ork
MoHFW
MoA
Indian AgricultureResearch Institute
Department ofAgriculture &
Ministry of S&T
IITMNCMRWF
IISC
IMD
Emergency ReliefDivision
Malaria Research Centre
Fig-4:-Missing links in the Institutional Interfaces
Interfaces needs to be developed
RecommendationsThe greatest challenge for mainstreaming disaster risk into development planning is politi-
cal will and geographical equity. Following are some recommendations in the area of poli-
cies and legislation:-

ekDRM 2011 | 93
Legislation and Governance
Disaster Management Plan and Environmental Impact Assessment mandated under the
EIA for development projects and On-Site and Off-site emergency plans mandated under
MSIHC and CAEPPR rules should cover Natural and applicable CBRN risks including fall out
of the hazards. Valuation techniques (including the DRI) should be used to project positive
contribution of risk reduction investments in development.
Disaster Preparedness
An attempt at maximizing the scares resources to improve disaster preparedness and re-
sponse is needed.
Disaster Recovery and Reconstruction
R & R plan should be in readiness at all times.
Climate Risk Management
Robust policy measures to enhance the capacity of the interface institutions and also
individuals who will be “gateway” and carriers of knowledge from one framework to
the other will be required. Integration of climate change adaptation concerns in disas-
ter management will need to be taken up at three levels – integrating adaptation to
longer term climate scenarios with the disaster mitigation and response interventions;
regularizing policy networks to take up climate change adaptation within the disaster
management framework; and facilitating permeability among the parallel structures
within the common actors in both frameworks Building on capacities that deal with
existing disaster risk is an effective way to generate capacity to deal with future cli-
mate change risk.
Managing Risk
Natural hazard is one among many potential threats to life and livelihood. People and com-
munities most vulnerable to natural hazards are also vulnerable to other hazards. For the
poor, livelihood strategies is playing off of risks from multiple hazards sources – economic,
social, political and environmental. Disaster risk reduction policy has to take into account
and look for building generic as well as disaster risk specific capacities.
Knowledge for Disaster Risk Assessment
A first step towards more concerted and coordinated action on disaster risk reduction is
clear understanding of the depth and extent of hazard, vulnerability and disaster loss.

94 | Indrani Chandrasekharan et al
Specific recommendations towards this end are to:
� Enhance National indexing of risk and vulnerability, enabling more and better country
and inter-state comparisons.
� Support state and sub-regional risk indexing to enable the production of information
for national decision makers.
� Develop a multi-tiered system of disaster reporting.
� Support context driven risk assessment
References � National policy on Disaster Management, 2009
� A Global report Reducing Disaster risk a challenge for development, UNDP, 2004
� Disaster Prevention, Preparedness and Management and Linkages with Climate Change,
BASIC, paper 10, 2007

ekDRM 2011 | 95
Bamboo Green Belts-Innovative Option for Alternative Livelihood & Sustainable
Coastal Protection K.G. Thara
Coastal Dynamics in India The Indian sub-continent has a long coastline, extending to a length of about 7516.60 Kms
including Daman, Diu, Lakshadweep and Andaman & Nicobar Island. About 23% (ie.,1450
km) of shoreline along the Indian main land is affected by erosion, out of which 700 km is
reasonably protected by construction of seawalls, groins, etc, and 750 km is yet to be pro-
tected. About 8% of the area in the country is prone to cyclone-related disasters such as
storm surge, heavy winds and very heavy rainfall. Between 1891 and 2006, 308 cyclones are
estimated to have crossed the east coast, out of which 103 were severe. The west coast
however witnessed lesser activity, with 48 cyclones, out of which 24 were of severe intensity.
Evaluation of the vulnerability of the east coast of India (Mascarenhan, 2004) from over a
century (1891–2000) of cyclone data reveal that of the cyclones that formed in the Bay of
Bengal, Andhra Pradesh received 32 percent, Orissa 27 percent, Tamil Nadu 26 percent and
West Bengal 15 percent. Though the frequency of occurrence of tropical cyclone is low in the
east coast of India and Bangladesh, these regions are highly risk prone in terms of human
population at risk. In the last 30 years, strength of tropical in the Atlantic region cyclones
has more than doubled nearly doubled for the Western Pacific region. This is attributed to
the increased concentrations of greenhouse gases and concomitant increase of sea surface
temperatures (Emanuel,2005). This change and increased sea activity is most pronounced
in the North Pacific, Indian and Southwest Pacific oceans, while the least change is noticed
in the North Atlantic Ocean.
Head, Disaster Management Centre, Institute of Land & Disaster Management, Trivandrum & Member, State Disaster Management Authority, Government of Kerala [email protected]

96 | K.G. Thara
Coastal Vulnerability of Kerala & Need for ProtectionThe 570 Kms long coastal zone of Kerala is vulnerable not only to the perpetual threat of
coastal erosion but also to the storm surge due to cyclones. The coastal belts of Kerala are
one of the most densely populated regions in the country, which increases its vulnerability.
Kerala constitutes only 1.18 % of the total area of Indian Union but accounts for about 3.1
per cent of Indian population.
The costal plains is important not only as a major physiographic unit of the state, but
also as one of the most thickly populated zones in the world. Almost 16 per cent of the Kera-
la’s population lives along this coastal belt, which is considered to be vulnerable to multitude
of disasters such as beach erosion, cyclone ,tsunami, storm surge, sea level rise etc.
The state is also susceptible to cyclonic winds. 96.9 per cent of the total area in the State
lies in the 140.4km/h wind zone (moderate damage risk zone) and rest lies in 118.8km/h
wind zone. The probable maximum storm surge height in the State is 3.5m and minimum
is 2.3m. If the Storm surge is during high tide, the maximum surge height in the state may
reach 4.2 m and minimum storm height may reach up to 3 meters (BMPTC vulnerability At-
las of India, 2002). The Density of population is 819 persons /km2, which is the third highest
density in the country (Economic review,2010).
Topographically, 54.17 per cent of the area in the state is low lands, the altitude of which
is only 10-300m and the altitude of coastal plains and lagoons which constitutes about 16.40
% of the total area is below 10 m from the mean sea level.
All the above-mentioned factors make the estimated 8,43,587 fishermen population of
the state( Fisheries department, 2004), extremely vulnerable. Fishermen constitute about
3 per cent of the total population and active fishermen are estimated to be 2.2 lakhs. The
physiographical peculiarities, low altitude from mean sea level, small width and high density
of population make the coastal population especially sensitive to sea level rise, high tides,
tsunami and coastal erosion.
Risk Reduction Through Green BeltsThe rapid increase in greenhouse gases in the atmosphere, land degradation, increasing
floods and droughts, deforestation, loss of biodiversity and productivity are leading to an
ecological crisis affecting livelihood options leading to poverty, pollution and unsustainable
development. As the coastal areas are the most vulnerable, it is imperative that scientific
management of disasters and augmentation of resilience through natural interventions
have to be given the highest priority so as to protect the poor, who directly bear the brunt of
these adversaries. This suggests, inter alia, a policy to actively encourage and support planta-
tion of green belts to overcome these constraints.

ekDRM 2011 | 97
In India, interventions for prevention of coastal erosion have primarily been centered
around structural measures such as construction of seawalls, revetment, groynes, off-shore
break waters etc. However, with increasing realisation of the adverse effects observed in the
downstream side of all structural options, need for shifting to non- structural or soft measures
such as vegetative covers, beach nourishment etc is increasingly felt by the policy makers,
scientific and the local communities. Barriers of trees and shrubs which act as bio shields are
increasingly becoming an option for coastal protection because of their multi-fold benefits.
Some coastal plants commonly used as green belts are Nyamplung (Calophyllum ino-
phyllum), Cemara Laut (Causarina equisetifolia), Ketapang (Terminalia cattapa), Waru Laut
(Hibiscus tillaceus), Putat Laut (Barringtonia asiatica), Bintaro (Cerbera manghas). Since the
choice of species for shelterbelts is dictated largely by the local climate , soil conditions,
physical and chemical properties of the substratum and the tolerance to high salt condi-
tions, mangroves are generally the most favoured natural species in tropical coastal regions.
However, these are sensitive to many ecological factors, including changes in water flow,
salinity. Moreover, mangroves over large offshore regions may limit fish-farming opportuni-
ties, and establishment of shelterbelts that are contiguous onshore, may limit the types of
agriculture or forestry that are available in the coastal area.
It is important to note that a shelterbelt protects an area over a distance up to its own
height on the windward side and up to twenty times its height on the leeward side, depend-
ing on the strength of the wind ( Eugene S. Takle, T.C. Chen and Xiaoqing Wu, 2007). In re-
gions where the combination of exposure to tropical cyclones and soil conditions does not
favour the use of mangroves, tall trees such as some varieties of coconut palms and rubber
trees are already in use , especially in locations beyond the inundation. Examples of such
coastal protective belts include a 3000-kilometre shelterbelt built mainly with C. equisetifolia
along China’s southern coast and use of coconut palms and rubber trees on the west coast of
Indonesia (Smith, 2006). Casuarina equisetifolia is also used as a shelterbelt species in tropical
coastal areas because of its height (up to 30 metres), rapid growth rate and high tolerance
to salty environments as well as to high rainfall, although in some regions it is considered
unpopular owing to its invasive habit and lack of support for an accompanying diverse eco-
system.
Bamboo As An OptionIndia ranks second in the world in bamboo reserve and diversity, with 136 species and an
estimated 8.96 million ha. in the forest area. Though a National Bamboo Mission was formed
to promote the growing and promotion of bamboo, the country exploits only one–tenth
of its total potential. The history of using bamboos in day to day life such as construction of

98 | K.G. Thara
houses and buildings, poultry sheds goat farms and for making furniture, cowsheds , fencing
for compound and protection of agricultural land, construction of small bridges, scaffold-
ings, etc., in India dates back more than 5000 years.
Bamboo is increasingly being recognized as a healthy alternative in modern sustainable
architecture and there is tremendous scope for widening its utility both in urban and rural
area. However, the wide scope for product diversification and use of bamboo in different type
of construction such as load bearing structures, thatching ,partition walls, staircase reelings,
flooring , frame in minor RCC work etc is not fully utilised. Bamboo thrives in warm climates
where the earth is kept moist with frequent monsoons and there is also scope for promot-
ing the skill of Artisans and to strengthen the marketing through its value added products.
Ability to mature to a height of 20 meters or more in a mere four years and an extensive root
system which remains intact, allowing for rapid regeneration , are qualities which make bam-
boo an ideal plant for areas threatened with the potentially devastating ecological effects of
soil erosion. Apart from bamboo basketry, woven boats made of bamboo splits are also used
for rescue operations in disaster situations in countries such as Vietnam.
Kerala state has approximately 3600 hectares of shelterbelt plantations and another
1800 hectares is planned to be brought under the green belt to address the escalating risk
factors in the coastal regions. Apart from reducing State’s Vulnerability to Cyclones and
storms, this is expected to stabilize the coast and prevent the erosion of sand by the winds,
protection of life and property from cyclonic storms and floods and ensure sustainability of
coastal zones.
Social and Economic Benefits of Bamboo as a Green BeltIntroducing bamboo in the shelterbelt and coastal forests is proposed as an environmen-
tally attractive, innovative and sustainable option, in the light of its status as an ideal species
capable of achieving conservation of soil and moisture, repair of degraded land, ecological,
food and nutritional, livelihood and economic security ,its manifold uses and industrial ap-
plications.
Most species of bamboo produce mature fibre in about three years and grows much
faster than any tree species. Some species grow up to one metre a day, with the majority
reaching a height of 30 metres or more. Despite the National Bamboo mission actively in-
volved in the promotion, research and marketing of bamboo and bamboo based handi-
crafts, its use as a coastal protection belt is yet to be explored in a large scale. Bamboo can
also be used in many building products, including bamboo-glass fiber composites, plywood
substitutes, and laminated flooring and are ideal in disaster resistant construction. By virtue
of its structural advantages such as strength and light weight, bamboo buildings are inher-

ekDRM 2011 | 99
ently resistant to wind and earthquake forces. These properties can be effectively exploited
through promotional plantations and construction initiatives along the coast.
Bamboo as an Alternative Source of Livelihood & Income GenerationIn recent years, the demand for bamboo has increased within the country and abroad as a raw
material for furniture making, as panel boards substituting wood, as agricultural implements,
house/construction related uses and also as a vegetable. It can also act as the ‘poor Man’s steel’
in disaster resistant construction techniques. Bamboo plantations are expected to :
� Increase employment opportunities
� Provide an alternative source for employment
� They are renewable, are harvested with no harm to their natural habitat, and produce
materials that promote a healthy human environment
It is pertinent to note that 54 per cent of fishermen in Kerala, have an income of less than
thousand rupees per month only and are below poverty line. Sixty four percent of fisher men
household in Kerala are in debt because of financial loans they have availed for purchase
of fishing implements. Coast related disasters simply strip these populations off their only
means of livelihood, spiraling them into more and more debts and deprivation. The tsu-
nami of 2004 stand a testimony to the severe damage and destruction they can wreak in
infrastructure, assets, services and economic activities. Bamboo cultivation would help the
fishermen and fisherwomen to become more self –reliant by ensuring a minimum wage,
through a simultaneous promotion of bamboo-based handicrafts and innovative construc-
tion technologies. This is significant especially in a country which has a 7516 Km stretch of
sea coast.
ConclusionsDynamics of the coastal stretch of the country and the high risk of the communities to mul-
titudes of hazards such as cyclone, storm surge, beach erosion, sea level rise, tsunami , high
tides etc makes it imperative to protect thee life and property of these populated areas.
Adverse effect observed in the downstream side of all structural options necessitates pro-
motion of soft-structural measures for reducing or preventing impacts of cyclone, sea surge
and beach erosion. Introduction of bamboo as an innovative option in green belts will not
only ensure environmental conservation and eco development, but also help our economy
by generating alternative income and employment opportunities for those communities
whose livelihood options are threatened during any disasters. Qualities such as ability to
mature to a height of 20 meters or more in a mere four years and an extensive root system
100 | K.G. Thara
which remains intact make bamboo an ideal plant for areas threatened by coastal hazards
and its structural advantage can also be exploited in the construction of disaster resistant
construction.
Acknowledgements � Economic Review, 2004, State Planning Board, Government of Kerala
� Economic Review, 2010, State Planning Board, Government of Kerala
� Emanuel, K.A. 2005. Increasing destructiveness of tropical cyclones over the past 30
years, Nature, 436: 686–688
� Eugene S. Takle, T.-C. Chen and Xiaoqing Wu ,2007, Protective functions of coastal
forests and trees against wind and salt spray, FAO Corporate document repository
� Mascarenhan, A, 2004. Oceanographic validity of buffer zones for the east coast of
India: A hydro-meteorological perspective. Current Science, 867: l399–407
� Selvam,V., Ravishankar, T., Karunagaran, V.M., Ramasubramaniar, R., Eganathan, P. & A.K.
Parida. 2005. Toolkit for establishing coastal bioshield. Centre for Research on Sustain-
able Agriculture and Rural Development, M.S. Swaminathan Research Foundation
� Smith, M, 2006. The right way to rebuild Asia’s coastal barrier. Mangrove forests can
act as ‘bioshields’ against storms. SciDev.Net. 12 January
� Vulnerability Atlas of India, 2002, Building materials &technology Promotion Council

ekDRM 2011 | 101
Professor & Head, Department of Forestry Dolphin (P.G.) Institute of Bio-medical & Natural Sciences Dehradun- 248007, Uttarakhand, INDIA [email protected]
Invasive Alien Species – A Massive But Slow Way to Catastrophes
Sas Biswas
IntroductionAn invasive species is of floral or faunal origin, alien to an ecosystem. International Union
for Conservation of Nature and Natural Resources ( IUCN) defines alien invasive species as
an alien species which becomes established in natural or semi natural ecosystems or habi-
tats threatening native biodiversity. Such species occupies a larger area of indigenous spe-
cies, thus it becomes gregarious and dominant and ultimately causes ecological stress and
economic loss. Invasive alien species are recognized as one of the leading threats to the
environment and biodiversity imposing enormous costs on agriculture, forestry, fisheries,
and other human enterprises, as well as on human health. Rapidly accelerating trade, tour-
ism, transport, and travel over the past century have dramatically enhanced the spread of
invasive species, allowing them to surmount natural geographic barriers. Issues related to
invasive flora and fauna have been stressed in different international concerns such as in
Convention on Biological Diversity (CBD), IUCN, World Trade Organization (WTO) addressing
to various aspects of mitigation and eradication. Ship ballast water is presently one of the
most common ways that the alien species are introduced into foreign lands. In order to pre-
vent an ecological crisis international community is aiming at developing new technologies
and legislation such as the Ballast Water Convention.
Climate change and invasive alien speciesGlobal climate change which is now a reality has begun to show its impacts on the biological
world. These impacts include alterations in species distributions and changes in abundance
within existing distributions and interaction among the species and the ecosystems.

102 | Sas Biswas
Invasive species find the changes in climate and the topography more conducive
for their colonization, establishment and spread. The slow change in climate results into
slow but sure impact of invasive alien species. McNeely (2000) believes that as the climate
changes, patterns of production and trade in agricultural commodities are likely to change
as well, with crops adapted to tropical conditions being grown more competitively in higher
latitudes and altitudes. The sources of tropical invasive species that may contaminate such
crops will also increase.
Ecological Aspects of InvasionAccording to Williamson (1998) of those species that are introduced, about 10% become
established. So, as a rule of thumb, about 1% of introductions are likely to become invasive.
The probability of a species becoming invasive increases with the initial population size, so
species introduced intentionally and marketed over a long period of time often have greater
likelihood of establishment. Species having larger native geographic ranges are more likely
to be invasive than those with smaller native ranges. A species that is invasive in one country
or location is likely to be invasive in an ecologically or climatologically similar country or lo-
cation. Species with specialized pollinators are unlikely to be invasive unless their pollinators
are also introduced. Successful invasions generally require that the new habitat be compat-
ible, especially in terms of climate conditions (McNeely,2000).
Biological Features and Early Warning on Invasiveness of FloraRejmanek and his colleagues (2000) explained in general that small genome size within a
generic status of taxa indicates plant invasiveness in disturbed landscapes; invasiveness of
woody taxa in disturbed landscapes is associated with small seed mass, short juvenile pe-
riod, and short intervals between large seed crops; vegetative forms of reproduction are an
important factor, with the importance of this factor increasing with latitude; species of exotic
nature are more likely to be invasive than alien taxa with close relatives in the native flora;
taxa that depend on generalized pollinators and seed dispersers rather than specialized ones
are more likely to be invasive; and species with numerous, relatively small, soil-stored seeds
are pre-adapted for human dispersal, and hence invasion. It is mentioned that the disease
organisms of invasive nature reproduce fast hence can spread quickly. The age of reproduc-
tive maturity, disturbance frequency, habitat disturbance and fecundity are characteristic of
invasiveness . Propagules of plants as spores and seeds travel over long distances by water,
wind, domesticated animals etc at remarkably high speeds.
Monocarpic plants and parthenogenetically developed species of fauna become spo-
radic, gregarious and ultimately invasive after having distributed phyto/ zoogeographically.

ekDRM 2011 | 103
Factors Responsible for InvasionHuman-driven changes in land use (e.g., clearing of forests to create more edge habitats)
and climate (e.g., longer growing seasons) provide new and expanded habitats where in-
vasives can thrive. In fact, the invasion of natural system by aggressive, non-native species
has been identified as one of the most significant drivers of modern environmental change,
second only to direct habitat conversion. When invasive alien species disrupt ecological
processes, they can reduce the economic viability of local, resource-dependent economies
leading to social instability and economic hardship. The invasive alien species in the begin-
ning are slow in dispersal, establishment, colonization, invasion, spreading and out- compet-
ing before becoming gregarious and becoming obnoxious. This could be in slow motion for
the present requiring rapid action and management at faster pace.
Invasives – Massive but Slow Way to Catastrophes Invasion of several species through vegetative and reproductive stages of succession can
be considered in slow motion at present, awaiting conducive and opportune time and
space to make disastrous effect. Species such as Prosopis chilensis (P. juliflora), water hyacinth
(Eichhornia crassipes), Salvinia, Lantana, Mimosa, Mikania, Parthenium, Eupatorium, etc. are
aggressively invasive, very destructive and their spread remains unchecked. Some of our
best forests have been suffering from the infestation of Lantana, Parthenium, Eupatorium,
etc. Similarly, the bane of tropical wetlands is the pernicious weed water hyacinth. Scotch
broom (Cytisus scoparius) and Ulex europaeus are destroying very large patches of prime sho-
la grasslands of the Nilgiris. In open canopy forests exotic weeds like Mikania micrantha and
Chromolaena are taking over while Mimosa invisa is choking the grasslands in the northeast.
It is considered that 40% of the species in the Indian flora are alien, of which 25% are invasive.
The major adventive weeds becoming gregariously invasive are Lantana camara, Partheni-
um hysterophorus, Eupatorium species, Chromolaena odoratum, Mikania micrantha, Ageratum
haustonianum, Salvinia molesta, Mimosa pigra etc. Parthenium is an exotic species of tropical
American origin and invaded into bioclimatic to agro-climatic regions to urban landscape.
Its invasion was first reported in the year 1951 from Pune in Maharashtra. This species is an
aggressive colonizer of degraded areas and exposed soil such as fallow wastelands, road-
sides and overgrazed pastures. Mikania micrantha, a perennial fast growing invasive of neo-
tropical origin has become rampant in north eastern and south west regions of India and
have resulted into loss of biological diversity, prevention of regeneration and growth and
development of forest species etc. Lantana was introduced in India as an ornamental during
1809-1810 and has spread fast in different habitats particularly in the areas disturbed by
various activities by man. High nutrient extraction efficiency has contributed to its coloniza-

104 | Sas Biswas
tion on the degraded sites with shallow soils.
Invasions are sometimes caused by deliberate release, whereas often the species by
virtue of its reproductive behavior and ecological need become rampant. Several methods
such as mechanical, cultural, chemical and biological have been attempted to check the for-
est invasive species such as Lantana and Parthenium. The environmental requirements of
invasive species cause a change in soil structure, its profile, decomposition, nutrient content
of soil, moisture availability etc. The effective management of invasive species depends upon
the knowledge about their morphology, phenology, ecology, physiology, allelopathic cycle,
nutrient requirement, utilization etc.
Various insect pests and pathogens of plants have become introduced into newer lo-
calities along with the planting material such as seeds, cuttings, corms, rhizomes etc. Among
the most common examples of invasive insect pests of forest plants are Quadrispidiotus per-
niciosus (poplars, willows), Icerya puchasi, (Acacias), Heteropsylla cubana (Leucaena), Pineus
leavis (pines), etc. Some of the invasive pathogenic fungi of forest introduced in India are
Cercospora pini-densiflorae (needle cast of pines), Cryphonectria cubensis (stem canker of eu-
calypts), Monochaetia unicornis (Cankers Cupressus, junipers), Sarocladium oryzae (on bam-
boo) etc. The recent outbreak of eucalyptus gall insect (Leptocybe invasa) epidemic in south
India and its unhindered spread to the northern parts of India is a striking example of an
invasive insect species reaching India with imported planting material. Some of the invasive
pathogenic fungi introduced in India are Cercospora pini-densiflorae (needle cast of pines),
Cryphonectria cubensis (stem canker of eucalypts), Monochaetia unicornis (cankers in cupres-
sus, junipers), Sarocladium oryzae (bamboo blight), Ceratocystis ulmi (Dutch elm disease of
Ulmus spp.), Cylindrocladium spp. (blight in eucalypts), etc. Several of the aforementioned
species were slow in establishment at onset but later became invasive and obnoxious.
Management strategiesManagement strategies on invasive alien species should aim at carrying out studies on the
Impact of alien species on the ecosystem goods and services of an area vulnerable to inva-
sion, Identification of activities responsible for spread of invasive species for threat value
assessment and conservation of affected species, Integrated management approach cover-
ing bio-control, bio-mitigation and phyto-sanitation, development of mechanism for surveil-
lance of invasive species covering recording and early warning, besides rapid action, build-
ing capacity and sensitization of stakeholders, and development of National Strategy and
Action Plan covering invasive species of different ecosystems and landscape.

ekDRM 2011 | 105
References � Biswas Sas. (2010) Disaster in slow motion for rapid action and management – a con-
cern of invasive alien species. Paper presented in a Training programme, 19th January
2010, organized by Forest Research Institute, Dehradun and National Institute of Disas-
ter Management, New Delhi
� McNeely J. (2000) Global strategy for addressing the problem of invasive alien species-
A result of the Global Invasive Species Programme (GISP) IUCN-The World Conservation
Union, 1196 Gland, Switzerland
� Rejmánek, M., D.M. Richardson, S.I. Higgins and M. Pitcairn (2000) Ecology of invasive
plants: State of the art. Chapter for GISP synthesis volume.
� Williamson, M. (1998). Measuring the impact of plant invaders in Britain: In Starfinger, S.,
K.Edwards, I. Kowarik and M. Williamson (eds.): Plant Invasions. Ecological Mechanisms
and Human Responses, Leiden, Backhuys: 57-70.

106 | Anil K. Gupta et al
Environmental Knowledge for Management of Hydro-meteorological
Disasters
Anil K. Gupta 1, Sreeja S. Nair2 and Vinod K. Sharma3
IntroductionIn recent years, 90% of natural disasters worldwide have been related to water and climate;
floods account for nearly 70% of the people affected in Asia. During the period 2000 to
2006, 2,163 water-related disasters were reported globally in the EM-DAT database, killing
more than 290,000 people, afflicting more than 1.5 billion people and inflicting more than
US$422 billion in damages. The United Nations University Institute for Environment and Hu-
man Security (UNU-EHS) warns that unless preventative efforts are stepped up, the number
of people vulnerable to flood disasters worldwide is expected to mushroom to two billion
by 2050 as a result of climate change, deforestation, rising sea levels and population growth
in flood-prone lands.
In general, all water-related disasters events increased between 1980 and the end of the
twentieth century. Floods and windstorm events increased drastically from 1997 to 2006,
but other types of disaster did not increase significantly in this period. Floods doubled dur-
ing the period 1997 to 2006 and windstorms increased more than 1.5 times. Drought was
severe at the beginning of the 1980s and gained momentum again during the late 1990s
and afterwards. The numbers of landslides and water-borne epidemics were at their high-
est during the period 1998–2000 and then decreased. Waves and surges increased between
1980 and 2006.
1Associate Professor, National Institute of Disaster Management (Govt. of India), New Delhi.2Assistant Professor, National Institute of Disaster Management (Govt. of India), New Delhi3Professor, Indian Institute of Public Administration, New DelhiEmail: [email protected], [email protected], [email protected]

ekDRM 2011 | 107
United National International Decade for Disaster Reduction (IDNDR) has devoted its
1997 year campaign on the theme ‘water..….too much….too little , leading cause of disas-
ters’ is still relevant even after 15 years of worldwide efforts of understanding and reduc-
ing risk of natural disasters. Environmental changes in particular – climate-change, natural
resource degradation and land-use changes, are known to cause new hazards besides ag-
gravating impact of existing hydro-meteorological disaster risks. Loss of environmental re-
sources and ecosystem resilience noted worldwide and in particular in developing regions
like India, has been identified as a key concern in managing the livelihoods, agricultural
productivity, health and thus, the overall vulnerability toward impact of water and climate
related disasters. Management of land-resources and land-use has significant role in reduc-
ing risk and vulnerability especially of the climatic disasters and in coastal and mountain
environments. Coastal zone management is recognized with serious concern for reducing
the risk of major disasters like catastrophic cyclone, tsunami, coastal erosion, flooding, salt
water intrusion, etc. In mountain areas the approached of ecosystem management in par-
ticular the watershed protection, rangeland management, joint forest management, etc. are
directly associated with resilience against climatic disasters.
Volcanic eruptions
2%
Windstorms
28%
Forest/scrub fires
5%
Floods
37%
Extreme
Temperature
5%
Earthquakes
8%
Droughts and
famines
9%
Avalanches and
landslides
6%
Figure 1: Global natural hazards by categories (1993-2002) (WMO).
Irony from experience is that the disaster manager’s often fail to recognize the envi-
ronmental dimensions of disaster risk, vulnerability and also of the post-disaster actions,
whereas environmental managers seldom focus on evaluating disaster risk aspects within
their studies. There is also a need to analyze and/or to develop approaches, tools, techniques
and methodologies, legislative framework, statistical and decision support systems of envi-
ronmental management for their role in disaster risk management.

108 | Anil K. Gupta et al
“Development is neither a simple, nor straightforward linear process. It is a multi-dimen-
sional exercise that seeks to transform society by addressing the entire complex of inter-
woven strands, living impulses, which are part of an organic whole” (Haqqani, 2003). With
increasing number of environmental hazard-induced disasters leading to ever increasing
human tragedy and economic costs, the international community is calling for the substan-
tial reduction of disaster risk by 2015. The Hyogo Framework for Action sets out the path
for the International Strategy for Disaster Reduction (ISDR), and since its adoption in 2005,
disaster risk reduction (DRR) has a come a long way with respect to concept development
and practical application.
United Nations agencies including UNEP, UNDP, IUCN, UN-ISDR and UNU Institute of
Environment and Human Security, jointly with many international organizations like ADPC,
WWF, GFMC, ProAct Network, SEI, and the Council of Europe, have formed a Partnership for
Environment and Disaster Risk Reduction (PEDRR) in year 2008 with headquarter at Geneva.
UN-OCHA has setup a joint Environment Unit with UNEP to emphasize environmental as-
pects of disasters and their management. UN-ISDR and IUCN have come up with a number
of publications on linkage of environment and disasters with particular focus on hydro-
meteorological risks. However, at national levels the initiatives for emphasizing the linkages
between the two are yet to be institutionalized in India.
Figure 2: Environment-development interface for disasters and adaptation.
Environment and Disasters Environmental degradation is the deterioration of the environment through depletion of re-
sources such as air, water and soil; the destruction of ecosystems, habitat and the loss of natural
homeostasis. It is defined as any change or disturbance to the environment perceived to be del-
eterious or undesirable, be it quantitative or qualitative.

ekDRM 2011 | 109
Environmental degradation is one of the Ten Threats officially cautioned by the High
Level Threat Panel of the United Nations including World Resources Institute, UNEP, UNDP
and the World Bank. Disasters are the events of environmental extremes which are inevitable
entities of this living world. Over the years, with the increasing human intrusion in the natu-
ral systems and the changing global environment, the frequency and impact of the disasters
is augmenting. Following are the three major faces of environmental change primarily re-
sponsible for causing or aggravating hydro-meteorological disasters (figure 2):
� Climate-change
� Natural resources
� Land-use changes
Environment and disasters are inextricably linked, particularly in context of hydro-mete-
orological hazards, climatic risks and epidemiological challenges. It is now widely recognized
in terms of following interface:
Environmental degradation leads to water & climate related disasters: Environmental deg-
radation can occur owing to natural processes or due to human induced impacts. Alteration
of natural systems and processes, destruction of habitats, loss of quality of environment and
exploitation of resources are the broad indicators of environmental degradation. Climate-
change and natural resource degradation are known to generate or aggravate disasters es-
pecially of the hydro-meteorological origin. Increasing trend in these disasters like floods,
drought, cyclone, pest-attack, fires, (and erosion, slides or epidemics) as secondary impacts),
worldwide and especially in continents of Asia and Africa is a serious concern for govern-
ments and communities.
Environmental degradation causes vulnerability: Besides causing new hazards and aggra-
vating precursors of disaster events, degradation of environment increases socio-economic
vulnerability by reducing water, food and nutrition, sanitation and health, livelihoods, hous-
ing, bioproductivity, entrepreneurship, and thus, overall economics jeopardizing the coping
capacity of people. Low capacities result in high exposures to hazard prone locations and
conditions of high disaster risk. Poor environmental quality and degraded natural resources
also cause social conflicts and political instability.
Disasters impact environment: Disaster events are also known for causing serious im-
pacts on environment affecting natural processes, natural resources and ecosystems, and
thereby creating conditions for secondary or future disasters including complex emergen-
cies. Natural disasters can also trigger chemical or technological disasters. Environmental
sustainability is also compromised during disaster management operations and recovery
process due to improper disposal of disaster and relief wastes, acute exploitation of natural
resources and inappropriate land-use/landscape modifications.
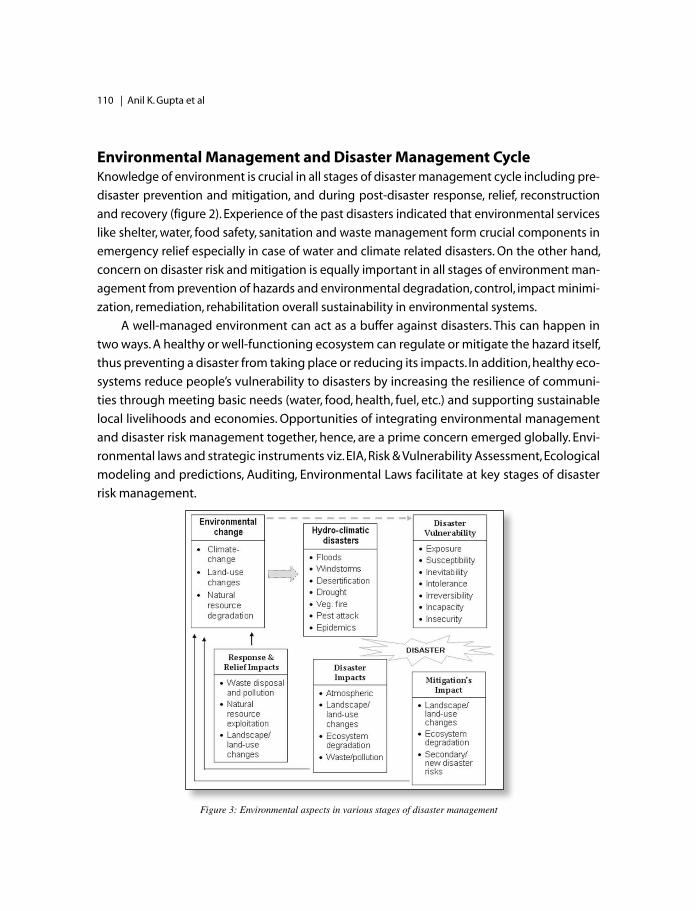
110 | Anil K. Gupta et al
Environmental Management and Disaster Management CycleKnowledge of environment is crucial in all stages of disaster management cycle including pre-
disaster prevention and mitigation, and during post-disaster response, relief, reconstruction
and recovery (figure 2). Experience of the past disasters indicated that environmental services
like shelter, water, food safety, sanitation and waste management form crucial components in
emergency relief especially in case of water and climate related disasters. On the other hand,
concern on disaster risk and mitigation is equally important in all stages of environment man-
agement from prevention of hazards and environmental degradation, control, impact minimi-
zation, remediation, rehabilitation overall sustainability in environmental systems.
A well-managed environment can act as a buffer against disasters. This can happen in
two ways. A healthy or well-functioning ecosystem can regulate or mitigate the hazard itself,
thus preventing a disaster from taking place or reducing its impacts. In addition, healthy eco-
systems reduce people’s vulnerability to disasters by increasing the resilience of communi-
ties through meeting basic needs (water, food, health, fuel, etc.) and supporting sustainable
local livelihoods and economies. Opportunities of integrating environmental management
and disaster risk management together, hence, are a prime concern emerged globally. Envi-
ronmental laws and strategic instruments viz. EIA, Risk & Vulnerability Assessment, Ecological
modeling and predictions, Auditing, Environmental Laws facilitate at key stages of disaster
risk management.
Figure 3: Environmental aspects in various stages of disaster management
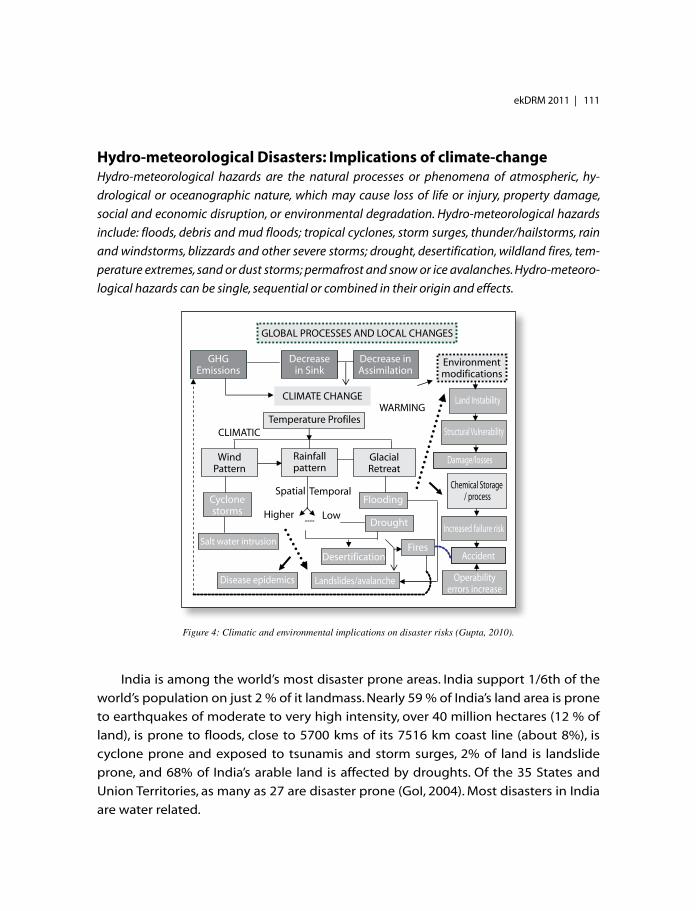
ekDRM 2011 | 111
Hydro-meteorological Disasters: Implications of climate-changeHydro-meteorological hazards are the natural processes or phenomena of atmospheric, hy-
drological or oceanographic nature, which may cause loss of life or injury, property damage,
social and economic disruption, or environmental degradation. Hydro-meteorological hazards
include: floods, debris and mud floods; tropical cyclones, storm surges, thunder/hailstorms, rain
and windstorms, blizzards and other severe storms; drought, desertification, wildland fires, tem-
perature extremes, sand or dust storms; permafrost and snow or ice avalanches. Hydro-meteoro-
logical hazards can be single, sequential or combined in their origin and effects.
Figure 4: Climatic and environmental implications on disaster risks (Gupta, 2010).
India is among the world’s most disaster prone areas. India support 1/6th of the
world’s population on just 2 % of it landmass. Nearly 59 % of India’s land area is prone
to earthquakes of moderate to very high intensity, over 40 million hectares (12 % of
land), is prone to floods, close to 5700 kms of its 7516 km coast line (about 8%), is
cyclone prone and exposed to tsunamis and storm surges, 2% of land is landslide
prone, and 68% of India’s arable land is affected by droughts. Of the 35 States and
Union Territories, as many as 27 are disaster prone (GoI, 2004). Most disasters in India
are water related.
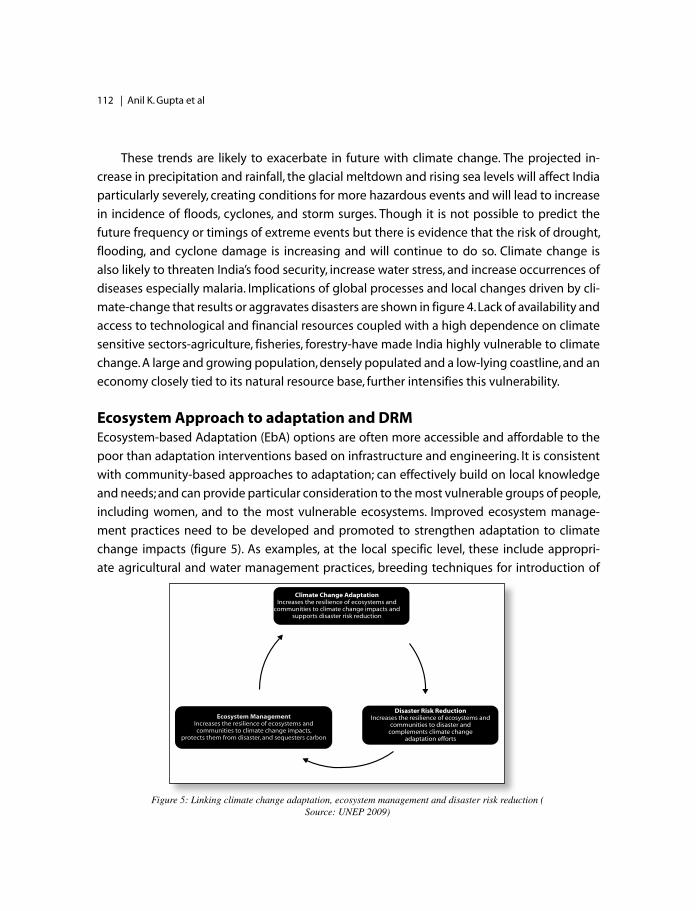
112 | Anil K. Gupta et al
These trends are likely to exacerbate in future with climate change. The projected in-
crease in precipitation and rainfall, the glacial meltdown and rising sea levels will affect India
particularly severely, creating conditions for more hazardous events and will lead to increase
in incidence of floods, cyclones, and storm surges. Though it is not possible to predict the
future frequency or timings of extreme events but there is evidence that the risk of drought,
flooding, and cyclone damage is increasing and will continue to do so. Climate change is
also likely to threaten India’s food security, increase water stress, and increase occurrences of
diseases especially malaria. Implications of global processes and local changes driven by cli-
mate-change that results or aggravates disasters are shown in figure 4. Lack of availability and
access to technological and financial resources coupled with a high dependence on climate
sensitive sectors-agriculture, fisheries, forestry-have made India highly vulnerable to climate
change. A large and growing population, densely populated and a low-lying coastline, and an
economy closely tied to its natural resource base, further intensifies this vulnerability.
Ecosystem Approach to adaptation and DRMEcosystem-based Adaptation (EbA) options are often more accessible and affordable to the
poor than adaptation interventions based on infrastructure and engineering. It is consistent
with community-based approaches to adaptation; can effectively build on local knowledge
and needs; and can provide particular consideration to the most vulnerable groups of people,
including women, and to the most vulnerable ecosystems. Improved ecosystem manage-
ment practices need to be developed and promoted to strengthen adaptation to climate
change impacts (figure 5). As examples, at the local specific level, these include appropri-
ate agricultural and water management practices, breeding techniques for introduction of
Figure 5: Linking climate change adaptation, ecosystem management and disaster risk reduction (Source: UNEP 2009)

ekDRM 2011 | 113
drought-tolerant, salt-tolerant, and standing-water tolerant crops and tree species; improved
livestock management and fodder management practices. At the systems level, this might
include alternative cropping or land-use model, strengthening the extension system, or sup-
porting more effective decentralized planning processes for watershed management that
can enhance more locally specific adaptive processes. A more systematic approach of inte-
grated natural resource management for cyclone risk management is shown in figure 6.
Figure 6: Coastal management framework for short-term and long-term mitigation for cyclone disaster
EIA as a decision making tool helps in identifying viable and sustainable option for
structural or non-structural measure of disaster mitigation, whereas post-disaster EIA
forms a part of damage, loss and needs assessment that enables planning for reconstruc-
tion and recovery. Although most EIAs implicitly have focus on natural disaster risk in the
project site context and include a Disaster Management as part of EMP, the information
contained therein the state of environment section and predictions under the section on
environmental impacts can be used for carrying out detailed risk assessment and disaster
management planning as well. However, there is a need to carry out a systematic analysis
of these policies and laws for applying these legal provisions for various activities under
disaster management. Role of environmental knowledge in disaster risk management is
depicted in figure 7.

114 | Anil K. Gupta et al
Legal and Institutional FrameworkDisaster management has primarily been a concern for emergency response and a post-
disaster focused approach until the realization of paradigm shift from ‘response and relief’
to ‘prevention and preparedness’. The climate-change awareness globally has brought-in a
greater understanding on role of global, regional and local environmental aspects in disaster
management (risk assessments, mitigation, early warning and effective response). In many
countries, the framework of disaster management has been functional in total separation
from the systems that deal with environmental protection and natural resources manage-
ment. However, at international level the guiding documents like Agenda-21, Hyogo Frame-
work of Action, Millennium Ecosystem Assessment, IPCC 4th Assessment Report, Ramasar
Convention, Convention on Desertification, and many other strategic documents have re-
cently emphasized environmental aspects of disaster management and vice versa with in-
tense focus.
At national levels as well, for example in India, the disaster management act and policy
has defined ‘substantial damage to….environment’ as a disaster, and has focused on envi-
ronmental compatibility and sustainable development as strategic issue in disaster man-
agement cycle. On the other hand, policies and legal framework on environment – water,
forests, agriculture, land-use, atmosphere and climate-change, waste management, besides
constitutional provisions on environment, have provided options for reducing hazards and
vulnerability in context of disasters. For example, the National strategy on climate-change
Figure 7. Central concept of environmental knowledge for disaster risk management (ekDRM)

ekDRM 2011 | 115
actions and missions thereof, policy statement on conservation of natural resources, coastal
zone regulation, area specific notifications like one on Doon valley, are of key importance in
disaster risk management.
In India the National Disaster Management Authority is the apex national organization
for developing guidelines and plans on various aspects of disaster management, whereas
Ministry of Environment & Forests is nodal agency for environmental protection includ-
ing dealing with issues of climate-change, forest and habitat conservation, environmental
quality, EIA, coastal zone, river conservation, Himalayan ecosystem, etc. Various aspects of
land-use and natural resources are dealt by different Ministries/Departments like Rural De-
velopment (Deptt of Land Resources), Water Resources, Agriculture, Earth Sciences, Science
& Technology, Biodiversity Board, etc. National Institute of Disaster Management has also set-
up a specialized ‘Environment, Climate-change and Disasters Cell’ for interdisciplinary activi-
ties under Hydro-meteorological disasters division of the institute. Similarly Indian Institute
of Public Administration has institutionalized a Centre for Environment, Climate-change and
Drought Management for focused activities of research and capacity building.
Since the environmental degradations resulting into disaster risk are either slow onset
process or have wider geographic extents, local administrators and planner’s understanding
usually not sound enough to analyze cause-consequence relationship may result in inappro-
priate strategies for disaster mitigation and response. However, many good case examples
of utilizing environmental knowledge and management into disaster risk management and
also disaster risk reduction’s significance in sustainable environment are available particu-
larly in context of hydro-meteorological disasters in mountain and coastal areas and also in
context of urban flooding, epidemics and agro-ecosystems.
References � Patwardhan, Anand, et al., 2003. ‘Impacts of Climate Change on Coastal Zones’. In: Shuk-
la, P.R. Sharma Subodh K., Ravindranath, N.H, Garg, A. and Bhattacharya, S.,(Eds). Climate
Change and India; Vulnerability Assessment and Adaptation. Universities Press(India) , Hy-
derabad, India.326-359
� DEFRA/GoI, 2005b. ‘Climate Change Impacts on Sea Level in India. Key Sheet 4’. National
Institute of
� German Advisory Council on Global Change (WBGU), 2008. Climate Change as a Security
Risk. Earthscan, UK 2008.
� GoI, 2004. Disaster Management in India - A Status Report. National Disaster Management
Division, Ministry of Home Affairs, Government of India, MHA/GOI/28/06/2004, Jun 2004.
� Gupta, A.K., I.V. Suresh, J. Misra and M. Yunus (2002). Environmental risk mapping ap-

116 | Anil K. Gupta et al
proach: risk minimization tool for development of industrial growth centres in develop-
ing countries. J. Cleaner Prod., 10: 271-281.
� Gupta, A.K., M. Yunus and J. Misra (1998). Disaster Reduction and Sustainable Develop-
ment. Enviro-news. 4: 06.
� Gupta, A.K., P. Tyagi & M. Yunus (2007). Disaster-risk Management Concept and Environ-
mental Perspectives: Issues for Integrating Climate-change Risks, Ecological & Land-use
Vulnerability and Environmental Resilience in Strategic Planning. J. Trop. Ecology.
� Gupta, Anil K (2010). State-level Regional Multi-stakeholder Consultations on Climate
Change Adaptation & Disaster Risk Reduction, at (a) Lucknow, (b) Jaipur, (c) Patna, (d)
Ahmedabad, (e) Chennai, in relation to MoEF-UNDP-GEF project, and subsequently fol-
lowing National Steering Committee meetings at MoEF and inter-institutional discus-
sions at NIDM, UNDP, etc. A Report.
� Gupta, Anil K. (1999). Science, Sustainability and Social Purpose: Barriers to Effective Ar-
ticulation, Dialogue and Utilization of Formal and Informal Science in Public Policy. Int. J.
Sustainable Dev., UK, 2(3): 368-371.
� Gupta, Anil K. and Yunus, M. (2004). India and the WSSD (Rio + 10), Johannesburg: Issues
of national concern and international Strategies. Current Science, 87(1): 37-43.
� Gupta, Anil K., Inakollu V. S., Misra Jyoti, Yunus M. (2002), Environmental risk mapping ap-
proach: Risk minimization tool for development of industrial growth centres in develop-
ing countries. Journal of Cleaner Production, 10 (5):271-281.
� Gupta, Anil K., M. Yunus and J. Misra (1998). Disaster Reduction and Sustainable Develop-
ment. Enviro-news. 4: 06.
� Gupta, Anil K., Nair, Sreeja S. and Shard (2009). Chemical Disaster Management: Proceed-
ing Volume of the National Workshop (30 Sept.-01 Oct. 2008, New Delhi). Ministry of
Environment & Forests (GoI) and National Institute of Disaster Management, New Delhi.
� Gupta, Anil K., Nair, Sreeja S., and Sehgal V. K. (2009), Hydro-meteorological disasters and
climate change: conceptual issues and data needs for integrating adaptation into envi-
ronment and development framework, Earth Science India Volume-2(I), 2009
� Gupta, Anil K., Nair, Sreeja S., Chopde, S. and Singh P.K. (2010). Risk to Resilience: Strategic
Tools for Disaster Risk Management. NIDM New Delhi and ISET-Colorado, P 116.
� Murari Lal et al., 2001. ‘Future Climate Change: Implications for Indian Summer Monsoon
and its Variability’. Current Science 81(9):1196-1297.
� Nair Sreeja S. and Gupta Anil K. (2009). Siting of industries in a multi-hazard environment:
Applications of GIS and MIS. In: Chemical and Industrial Disaster Management (Proc. In-
ternational Conference), FICCI, NDMA, New Delhi 2009.
� Santosh Kumar, 2006. ‘Hazard, risk, vulnerability and climate change in India’. Proceed-

ekDRM 2011 | 117
ings of the International Conference on Adaptation to Climate Variability and Change, Jan
5-7, 2006, New Delhi, India. Institute for Social and Environment Transition (ISET), Boulder,
Colorado, USA and Winrock International (WII), Delhi, India.22-27
� Shukla, P.R. Sharma Subodh K., Ravindranath, N.H, Garg, A. and Bhattacharya, S.,(Eds),
2003. Climate Change and India; Vulnerability Assessment and Adaptation. Universities
Press (India), Hyderabad, India.
� UNDP, 2007b. Managing Risks of a Changing Climate to Support Development. Report of
the Asia Regional Workshop, 23-26 Apr 2007, Kathmandu, Nepal, UNDP Regional Center
Bangkok, Thailand. http://regionalcenterbangkok.undp.or.th.
� UNEP (2008). Environmental Needs Assessment in Post-Disaster Situations - A Practical
Guide for Implementation (March 2008).
� http://oneresponse.info/crosscutting/environment/publicdocuments/UNEP_PDNA_
draft.pdf

118 | Charles Kelly et al
Disasters and the Environment: A Review of Opportunities
Charles Kelly and N.M. Prusty
IntroductionThe intersection of the environment and disasters has been gaining increasing salience in
recent years. The United Nations Environment Program (UNEP) has a unit devoted to disaster
issues3 and cooperates with the UN Office for the Coordination of Humanitarian Assistance
(OCHA) on a joint environmental emergencies response unit.3 The American Red Cross and
World Wildlife Fund (WWF) US have recently cooperated on developing guidance on en-
vironmental sound recovery3. A number of other organizations focus on the nexus of the
environment and disasters, for instance ProAct Network3 and Groupe URD,3 among others.
Efforts by these organizations and others have led to the creation of a number of guides
and tools to assess the impact of disasters on the environment, the environment on the envi-
ronment and relief and recover on the environment. UNEP’s Disasters and Conflict Program
has assembled a wide range of these guides and tools on disasters and the environment into
a single web-based point of access8.
It is also increasingly common for environmental issues to be given some level of atten-
tion following disasters. For instance, both UNEP3 and the US Agency for International De-
velopment (Kelly and Solberg, 2011) conducted rapid disaster impact assessments following
the 2010 Haiti earthquake. The Ministry of Environment, WWF Chile / WWF Internacional and
Antofagasta Minerals conducted a rapid assessment following the 2010 Chile earthquake
and tsunami (Ministry of Environment, 2010).
Environment Advisors were assigned to the Shelter Cluster10 in Haiti following the 2010
earthquake and the 2009 earthquake in Sumatra, Indonesia. UNEP has been active in post
conflict and post disasters assessments, including Haiti, Sudan and the Democratic Republic
of the Congo, as well as in on-going conflict in Darfur. Both ProAct Network and Groupe URD
have been active in developing reports on environment and disaster related issues, or per-
1 Freelance International Disaster Management Consultant, [email protected] 2 Centre for Development and Disaster Management Support Services-A Strategy Centre, New Delhi
ekDRM 2011 | 119
forming field work on specific environment-disaster issues (e.g., improved energy supplies
in Darfur10).
Yet, with all this action to date, recognition of the importance of the environment in
the post disaster (relief and recovery) context still does not ahve a high salience in relief or
recovery policy making or operations.
� While rapid environmental impact assessments are done, the results rarely seem to be
used.
� While an environment advisor may be assigned to one sector in one disaster response
(e.g. Haiti), another of similar scale disaster will receive may limited and late support, at
best (e.g., Pakistan).
� While relief and recover personnel may raise environment-related questions, finding an-
swers to such questions is neither systematic nor linked to decision making structures.
For instance, well documented lessons on the provision of fuel efficient stoves have
been relearned in several recent disaster responses.
� While the value of environmental impacts reviews are well established for large scale ex-
penditures such as one finds in disaster recovery, actual recovery plans often avoid such
reviews for reasons of expediency, and later result in avoidable environmental damage
and a waste of natural resources and recovery funding. For instance, the $11.6 billion
recovery plan for the Haiti earthquake1 received no formal environmental review. As a
result, there was no overall idea of the scale of natural resources needed for the recovery
or whether there were environmentally more positive options to the plans proposed.
It may seem that the integration of the environment into disaster relief and recovery is
a glass half empty: despite considerable effort to bring the environment into the disaster
recovery process, real progress and impacts have been limited, with lessons not learned and
mistakes repeated.
Rather, the remainder of this paper will take a glass half full approach and discuss oppor-
tunities for further integrating environmental issues into relief and recovery. The intent is to
lay out a set of action points of sorts to identify where further progress can be made towards
a fuller integration of environmental issues into the recovery from disaster.
Opportunities to Integrate the Environment into Disaster Recovery
A Preamble
The integration of the environment into disaster recovery is usually presented in terms of
projects to improve environmental conditions, frequently involving tree planting. The fol-
lowing sections focus on managing the impact of recovery assistance on the environment

120 | Charles Kelly et al
rather than on using recovery funds to impact specific segments (e.g., deforested hillsides)
of the environment. While environmental improvement efforts have considerable merit,
they can’t be pursued in ignorance of the environmental impacts of excessive resource use
for housing construction or the siting of this housing in areas liable to flooding, two com-
mon environment-links challenges follows disasters.
Force Results From Assessments
A range of post disaster environmental impact assessment tools exist, including:
� The Environmental Needs Assessment in Post-Disaster Situations: A Practical Guide for
Implementation (UNEP, 2008),
� Fast Environmental Assessment Tool (Joint Environment Unit, 2009),
� Technical Manual for Post-Disaster Rapid Environmental Assessment (Ecoengineering
Caribbean Limited, 2003), and
� Guidelines for Rapid Environmental Impact Assessment (Kelly, 2005).
However, as indicated above, when these tools are used they do not always have a clear
and definable impact on recovery plans or process. This failure of impact assessments to
have an impact can arise because the assessment results:
� Are not relevant to immediate relief and recovery requirements,
� Are not presented in a way which are understandable,
� Point out significant gaps in on-going operations (and thus are embarrassing enough
to be ignored),
� Lack a champion within the upper levels of the recovery planning and management
structure.
Of the four, the most challenging is the last, the lack of a champion for assessment re-
sults. Solving the other three issues still will not mean they will be acted on if there is no
person or unit which can ensure the results will be used. This need for a champion is particu-
larly acute where procedure or policy allows recovery planning and assistance to proceed
without normal environmental reviews (often justified by a lack of time to conduct environ-
mental reviews).
The person or unit to champion assessment results may not be evident from an orga-
nization chart. Investigation may be needed to identify who within the recovery structure is
most amenable to considering environmental issues, and most capable to having the issues
addressed. Why a champion may take up the environmental assessment results could lie in
a pro-environmental perspective. But it is more likely the reason lies in an interest to avoid

ekDRM 2011 | 121
problems (and impact assessments normally identify problems), particularly when environ-
ment-linked problems have been encountered in the past. Even when a champion is found,
interest may only be in one or two issues, which necessitates accepting that one entry point
is better than none.
Where a champion can’t be located it may become necessary to more directly force the
assessment results on the recovery process. The most traditional approach to doing this is to
engage with local environmental organizations and have them use their capacity for advo-
cacy to promote the assessment results. An alternative, but somewhat more risky, approach
is for those involved in the assessment to directly advocate for the assessment results,
through the print and electronic media, including blogs and similar communication tools.
The risk, of course, that the recovery institution will simply ignore or pay lip service this
type of forcing of the assessment results. At the same time, post disaster environmental im-
pact assessment results which are not acted on are useless so some process for forcing assess-
ment results may need to be pursued if the assessment process is not an exercise in futility.
Any Entry Point is Better than no entry Point at all
As suggested above, one entry point is better than none. This may mean that only a few of
the issues identified in an assessment can be effectively pursued within the recovery struc-
ture. When faced with limited entry points it would be idea to select those which match the
prioritization of recovery programming, for instance, putting environmentally sound waste
management over reforesting hillsides.
However, the reality is that entry points, and particularly those created by champions
with specific interests, may be of very limited scope and allow for addressing only one or
two low priority issues. At the same time, successfully addressing environmental issues at
one entry point may lead to greater involvement in other environmental issues across the
recovery effort.
Another entry point issue arises as to when environmental issues are to be assessed
and considered. In theory, initial assessments should begin as soon as immediate lifesaving
needs are being met, and assessment results should be available to decision makers as soon
as plans are being developed for the recovery process. In most cases, given that the environ-
ment is not seen as a post-disaster priority, the assessment process can begin weeks or even
months after the disaster.
In this context a rapid assessment of environmental issues may not mean rapidly after a
disaster but done rapidly due to limited funding or time. Even if an environmental impact as-
sessment is done months into the recovery period the results can provide guidance on how
to redirect on-going assistance or re-direct assistance to address unmet needs.

122 | Charles Kelly et al
In the same way, if environment-focused assistance, such as training in environmentally
sustainable recovery or assistance on specific issues such as waste and debris management
begins several months after a disaster then these interventions should be used to establish
and expand the scope of environment-focused recovery efforts. In the end, a late entry point
is better than no entry point at all.
Pick the best possible fruit
As suggested above, it may not be possible for all the issues defined in a post disaster assess-
ment to be address immediately, or over the course of the recovery process at all. As a result,
it is necessary to prioritize assessment identified actions by considering (a) what is of great-
est need to be done and (b) what will have the greatest impact when it is done.
This trade-off process is not one which can be set in stone and should include consulta-
tions with the disaster survivors (a core part of any post disaster impact assessment). The
process of deciding which assessment results to push forward on, and how to do the push-
ing, needs to strive not for the perfect fruit, or the lowest hanging fruit, but the best possible
fruit which reflects the needs identified by the assessment, the disaster survivors and the
resources and institutional support available.
Demonstrate value
Whether one or more champions have been identified or not, post disaster environmental
impact assessments and environment-related technical support need to demonstrate that
they can add clear value to relief and recovery operations. The perception is often that en-
vironmental issues are not urgent in the post-disaster period and can be addressed later in
the recovery effort, if at all.
This view often arises from the perception that post disaster environmental interven-
tions are linked to longer term improvements to the environment, through actions such as
tree planting or watershed management. Such interventions, while important in the long
term, are often not seen as critical to relief and recovery.
To gain relevancy in relief and recovery efforts, environment-focused assessments and
technical support need to focus on the immediate problems facing these efforts. Such envi-
ronment-linked interventions include, among others,
� Debris management, including quickly removing and recycling debris,
� Standardized transitional or permanent shelter design to reduce environmentally dam-
aging resource requirements, such as the use of fired bricks when alternatives are avail-
able.
� Liquid and solid waste management, particularly establishing waste management sys-

ekDRM 2011 | 123
tems which improve hygiene and sanitation conditions and limit the spread of diseases,
� Advice on avoiding recovery assistance which will lead to an overexploitation of natural
resources, for instance in the provision of boats and equipment which increase fishing
capacities above those existing before a disaster, and
� Natural hazard assessments to ensure that temporary or permanent settlements are not
located in unacceptably hazardous locations.
This list is not exhaustive. The challenge for environment-focused personnel in the relief
or recovery phases is to find ways in which calling attention to environmental issues also
generates solutions which can solve problems or make relief and recovery efforts more ef-
fective. In other words, assessment and technical support should not just raise environmen-
tal problems, but also provide practical solutions which demonstrate the value of integrat-
ing an environmental perspective into relief and recovery.
Change from the field up
The idea of environmental champion discussed above implies this role is filled by persons
or units higher up in the relief and recovery establishment. In fact, significant pro-environ-
mental action can also be initiated at the field level, and particularly through a mid-level
management which is aware of environment-base opportunities.
For instance, a field manager running camp for relocated disaster survivors can have a
considerable influence over waste management, sanitation and general living conditions in
the camp. In a similar fashion, the manager of WASH activities for a group of communities
can have a significant influence on how latrines are constructed, the supply and use of water
or whether waste is dumped in a swamp or composted.
It is necessary to reach out to field personnel and provide them with the tools and
knowledge needed to implement relief and recovery projects in environmentally wise ways.
Such an effort is incorporated into the Global Shelter Cluster’s assignment of an environ-
mental advisor to some country-level Clusters. A broader approach to support the capaci-
ties of field personnel is incorporated onto the World Wildlife Fund and American Red Cross
Green Recovery and Reconstruction Training Toolkit for Humanitarian Aid and associ-
ated training (World Wildlife Fund and the American Red Cross, 2010). Other support is avail-
able on such issues as stoves, transitional shelter and refugees, with additional field guid-
ance expected in the near future.
The real challenge is to ensuring this wealth of information on environmentally sound
relief and recovery reaches the field staff who need specific information. Making the infor-
mation available on the web (as it currently the case) is important. But, given the work load

124 | Charles Kelly et al
pressure which many field personnel face it is unlikely that most will have to time or back-
ground to effectively search for and digest information on environmentally sound relief and
recovery.
As a result, it is likely to be more effective to have an out-reach capacity in the field,
through the use of environmental advisors. These advisors do not necessarily need to be
experts in relief and recovery (although this will not hurt) but would need to focus on
� Defining what critical environment-related issues are being faced in the field and
� Package information available on addressing these issues in a way which can be used by
field personnel in a quick and easy manner.
As noted, posting environmental advisors has been done by the Global Shelter Cluster.
This effort needs to expand to additional sectors as well as become a standard part of relief
and recovery operations rather than being an occasional event.
Knowledge as power, and a foot in the door
The process of furnishing environment-focused information as describe above provides
the environmental community a degree of power to influence the way in which relief and
recovery aid is provided and the impacts which can be expected. Further, many post di-
saster reconstruction challenges relate to location within the environment (e.g., where to
locate disaster displaced, where to rebuild roads, etc.). An environmental, and more specifi-
cally, an ecosystem services approach to assessing recovery options and impacts can be of
considerably utility in the reconstruction process in defining how best to site and provide
recovery assistance.
Here again, the focus is not (only) on defining what the environmental issues with recon-
struction or recovery efforts are in general, but defining how these process can be sustained
by wise use of the environment and how potential problems can be solved in a similar man-
ner. Given the common misperception noted that a focus on the environment is limited to
longer term improvement of natural conditions, knowledge about the environment needs
to be used to improve the overall recovery process and specifically focus on improvements
to specific recovery activities. Providing one package of knowledge which improves one ele-
ment of the recovery effort also provides a foot in the door for greater access to improve the
overall environmental sustainability of recovery efforts.
ConclusionsThis paper argues that progress in integrating an environmental perspective into disaster
relief and recovery has been uneven but also somewhat successful. The paper suggests that
many of the tools and guidance needed for a better integration of environmental perspec-
ekDRM 2011 | 125
tive into relief and recovery are already available. Under these circumstances, moving the
integration process forward requires efforts in six areas:
� Effectively using assessment results,
� Finding entry points into the relief and recovery process,
� Focusing on the best possible match of reducing negative environmental impacts and
recovery programming,
� Demonstrating the clear value of an environmental perspective on recovery,
� Ensuring field personnel know about how to effectively integrate an environmental per-
spective into their work, and
� Using knowledge about the environment to influence and shape the recovery agenda,
The prospect is for environmental considerations, and an awareness of environmental
issues, to be increasingly accepted as an integral part of relief and recovery. However, this
process can occur though demonstrated failures of relief and recovery due to a failure to
consider environmental impacts and options. Or this process can occur though a more pro-
active integration and problem avoidance, as suggested above. The argument for this latter
course is that it will lead to better relief and recovery, and less suffering and hardship for the
disaster survivors. And anything which will reduce the suffering of disaster survivors should
be pursued with vigor.
References � Ecoengineering Caribbean Limited (2003), Technical Manual for Post-Disaster Rapid
Environmental Assessment, Volumes 1 and 2, Environment & Sustainable Develop-
ment Unit, Organization of the Eastern Caribbean States, St. Augustine (http://www.
caribank.org/titanweb/cdb/webcms.nsf/AllDoc/9E2B73C29C5CB1A1042573D1005463
60/$File/OECSManualVolume_1_Final.pdf ).
� Kelly, C (2005), Guidelines for Rapid Environmental Impact Assessment, AON Benfield
Greig Hazard Research Centre, University College London, and Care International, http://
postconflict.unep.ch/liberia/displacement/documents/Benfield_Care_Guidelines_Rap-
id_Environmental_Impact_Assessme.pdf.
� Kelly, C and Solberg, Scott (2011), Rapid Environmental Impact Assessment: Haiti
Earthquake - January 12, 2010, Sun Mountain International, CHF International and US
Agency for International Development, http://chfinternational.org/files/PNADS052.pdf.
� Joint Environment Unit (2009), Fast Environmental Assessment Tool (FEAT), Unit-
ed Nations Environment Program and Office for the Coordination of Humanitar-
ian Assistance, Geneva and New York (http://ochanet.unocha.org/p/Documents/FEAT_
Version_1.1.pdf ).

126 | Charles Kelly et al
� Ministry of Environment, Government of Chile, WWF Chile/WWF Internacional and An-
tofagasta Minerals (2011), Final Report, Rapid Environmental Impact Assessment,
Chile Earthquake and Tsunami, 27 February 2010, http://www.worldwildlife.org/
what/partners/humanitarian/WWFBinaryitem19130.pdf
� UNEP (2008), The Environmental Needs Assessment in Post-Disaster Situations: A
Practical Guide for Implementation, with the Cluster Working Group on Early Recov-
ery, http://oneresponse.info/Disasters/Haiti/Environment/publicdocuments/Environ-
mental%20Needs%20Assessment%20in%20%20Post-Disaster%20Situations%20A%20
practical%20guide%20for%20implementation,%20UNEP.pdf
� World Wildlife Fund and the American Red Cross (2010), Green Recovery and Reconstruc-
tion Training Toolkit for Humanitarian Aid, Washington, http://green-recovery.org/
Web References
� http://hqweb.unep.org/conflictsanddisasters/.
� http://www.unocha.org/what-we-do/coordination-tools/environmental-emergencies.
� http://green-recovery.org/.
� http://proactnetwork.org/.
� http://www.urd.org/?lang=en.
� http://postconflict.unep.ch/humanitarianaction/04_07.html.
� See bottom of the page at http://oneresponse.info/Disasters/Haiti/Environment/Pages/
default.aspx for UNEP assessment reports.
� The Cluster System has been established by the Interagency Standing Committee
(http://www.humanitarianinfo.org/iasc/) for the effective management of post disaster
assistance. More on the Cluster approach can be found at http://oneresponse.info/Co-
ordination/ClusterApproach/Pages/Cluster%20Approach.aspx.
� http://proactnetwork.org/proactwebsite/index.php/en/policyresearchtoolsguidance/
darfur-alternative-energy.
� http://www.womenscommission.org/programs/firewood.
� http://proactnetwork.org/proactwebsite/media/download/resources/EA-Tools/Kelly_
Emergency%20Shelter%20Environmental%20Checklist-V%201_2005.pdf.
� http://proactnetwork.org/proactwebsite/media/download/resources/Ressource_Pack/
UNHCR%20Practicing%20sound%20environmental%20management%20Refugees.pdf.
� http://www.urd.org/spip.php?article322.
