endesa chile ir presentation - enel generación chile · endesa chile ir presentation ye 2012 2...
TRANSCRIPT
Endesa Chile IR presentationAs of December 2012

Endesa Chile IR presentation YE 2012
2
Multinational electricity generation company based in Chile.
Efficient and diversified investment portfolio of generation assets.
Part of an important worldwide electricity group (Enel, Endesa, Enersis).
Our company
Vast experience, with over 69 years of history.
Conservative commercial policy leading to revenue and margin stability.
Among the most actively traded companies in Chilean stock markets.

Endesa Chile IR presentation YE 2012
3
•COSTANERA, 70%
•EL CHOCÓN, 65%•EDEGEL, 62%•EMGESA, 27%
•ENDESA BRASIL, 39%
AMPLA
COELCE
FORTALEZA
CDSA
CIEN
61%
92%
60%
PEHUENCHE, 93%
CELTA, 100%
SAN ISIDRO, 96%
ENDESA ECO, 100%
CANELA, 75%
Ownership Structure
60%14%
6%
5%4%
11%
ENERSIS
Chilean Pension Funds
Institutional Shareholders
ADR Holders
Minority Shareholders
Other Institutional Shareholders

Endesa Chile IR presentation YE 2012
4
A unique portfolio in LATAM’s Generation business
COLOMBIA
2,914 MW inst. capacity
Hydro: 2,470 MW
Thermal : 444 MW
20% market share
No. 2
5,961 MW inst. capacity
Hydro: 3.456 MW
Thermal : 2,418 MW
NCRE: 87 MW
33% market share
PERU
1,657 MW inst. capacity
Hydro: 746 MW
Thermal : 911 MW
24% market share
CHILE
BRAZIL
987 MW inst. capacity
Hydro: 665 MW
Thermal : 322 MW
1% market share in
generation
Consolidated installed capacity: 14,185 MW
Capacity including Brazil: 15,172 MW
Consolidated energy sales 2012: 59,020 GWh
3,652 MW inst. capacity
Hydro: 1,328 MW
Thermal: 2.324 MW
12% market share
ARGENTINA
No. 1
No. 1
No. 1

Endesa Chile IR presentation YE 2012
5
Results affected by the drought in Chile and high fuel costs
1Amounts expressed in US$, using the average exchange rate for the period (Ch$486.59 per US$).2 Net of “Foreign currency exchange differences”.
3 Closing share price for each year.
Indicator2011
MM ch$
2012
MM ch$Change
2012
MM US$1
Revenues 2,404,490 2,369,386 (1%)4,869
Operational Expenses (1,217,260) (1,328,703) 9%(2,731)
Contribution margin 1,187,230 1,040,684 (12%)2,139
EBITDA 973,890 833,850 (14%)1,714
EBIT 787,971 632,209 (20%)1,299
Net finance expenses2
(114,829) (135,294)18%
(278)
Net income before
taxes 791,719 604,513 (24%)
1,242
Net income 581,155 419,043 (28%)861
Net attributable income 446,874 234,335 (48%)482
EBITDA Margin 40.5% 35.2% (13%) -
Profit Margin 24.2% 17.7% (27%) -
E.P.S. 54.5 28.6 (51%) 2
P/E3 14.1 27.2 106% -

Endesa Chile IR presentation YE 2012
Chile42%
Colombia20%
Peru12%
Argentina26%
Chile38%
Colombia25%
Peru16%
Argentina21%
Chile35%
Colombia45%
Peru17%
Argentina3%
6
EBITDA by Country
Total Installed Capacity: 14,185 MW
EBITDA 2012:
US$ 1,714 million
Total Generation : 53,517 GWh
Endesa Brasil
• Endesa Chile’s ownership: 40% (38.9%direct).
• Net Attributable Income1: US$ 221 million.
1 Considers the total contributions of Endesa Brasil recognized by Endesa Chile as an equity method investment.
Endesa Chile IR presentation YE 2012
66%
30%
4%
53%
19%
28%
65%
30%
5%
18%
82%
61%
31%
8%
51%
19%
30%
64%27%
9% 19%
81%
7
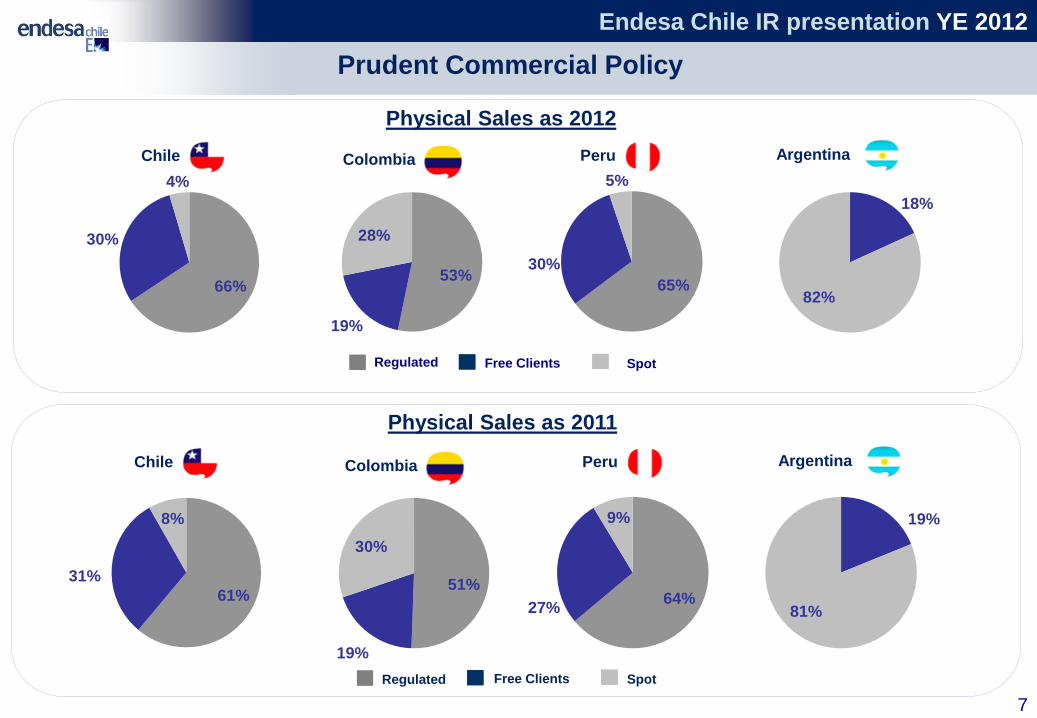
Prudent Commercial Policy
Regulated SpotFree Clients
Physical Sales as 2011
Chile Colombia Peru
Regulated SpotFree Clients
Argentina
Physical Sales as 2012
Chile Colombia Peru Argentina
Endesa Chile IR presentation YE 2012
8
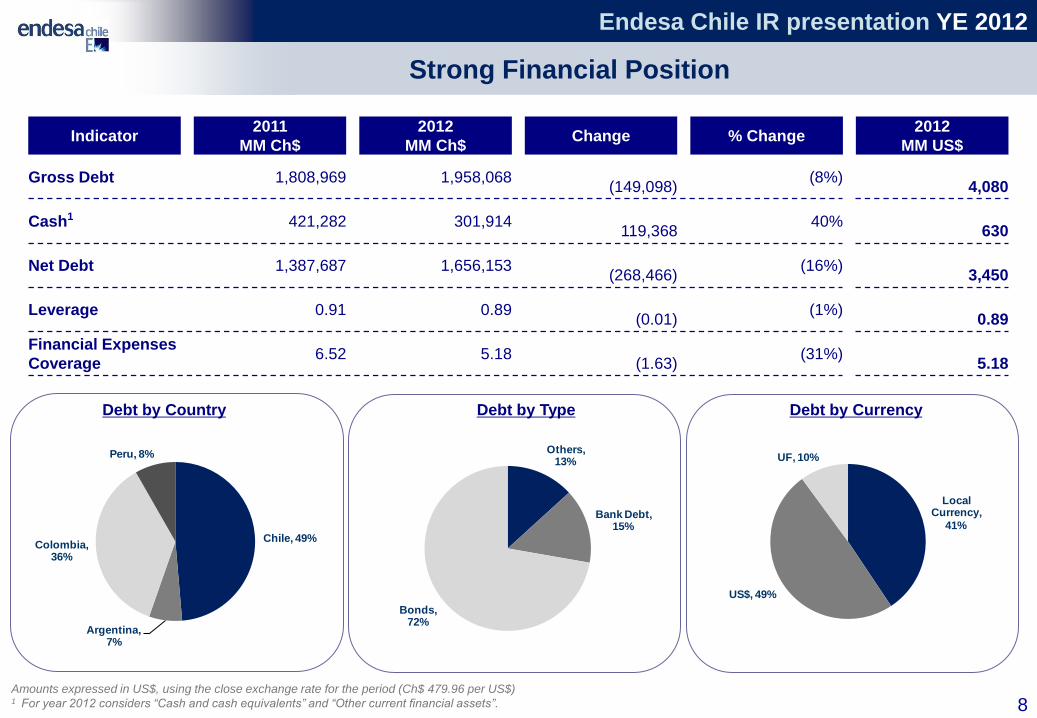
Debt by Type Debt by CurrencyDebt by Country
Amounts expressed in US$, using the close exchange rate for the period (Ch$ 479.96 per US$)1 For year 2012 considers “Cash and cash equivalents” and “Other current financial assets”.
Strong Financial Position
Chile, 49%
Argentina, 7%
Colombia, 36%
Peru, 8%
Local Currency,
41%
US$, 49%
UF, 10%Others,
13%
Bank Debt, 15%
Bonds, 72%
Indicator2011
MM Ch$
2012
MM Ch$Change % Change
2012
MM US$
Gross Debt 1,808,969 1,958,068(149,098)
(8%)4,080
Cash1 421,282 301,914119,368
40%630
Net Debt 1,387,687 1,656,153(268,466)
(16%)3,450
Leverage 0.91 0.89(0.01)
(1%)0.89
Financial Expenses
Coverage6.52 5.18
(1.63)(31%)
5.18

Endesa Chile IR presentation YE 2012
9
1 Payments for additions of fixed assets.2 For year 2012 considers only the interim dividend paid on January 24th, 2013.
Amounts are expressed in US$, using the average exchange rate for each period.
Free Cash Flow (US$ million)
2.248
(305)
(564)
(308)
1.070
(394)
2.098
(235)
(499)(353)
1.012
(523)
2.014
(251)
(551)(435)
776
(462)
1.714
(300)
(538)(381)
494
(51)
EBITDA Net Financial Result CAPEX Income Tax FCF Dividends
2009 2010 2011 2012
Endesa Chile IR presentation YE 2012
10
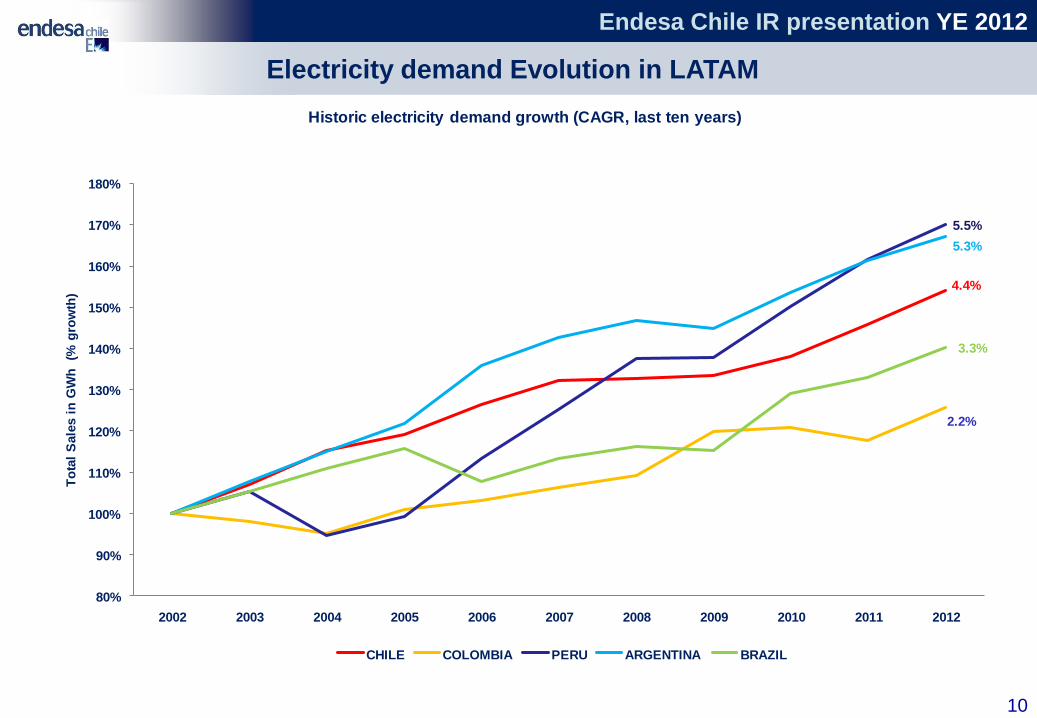
Electricity demand Evolution in LATAM
4.4%
2.2%
5.3%
5.5%
3.3%
80%
90%
100%
110%
120%
130%
140%
150%
160%
170%
180%
2002 2003 2004 2005 2006 2007 2008 2009 2010 2011 2012
To
tal
Sale
s i
n G
Wh
(%
gro
wth
)
Historic electricity demand growth (CAGR, last ten years)
CHILE COLOMBIA PERU ARGENTINA BRAZIL

Endesa Chile IR presentation YE 2012
11
Direct relation between GDP and electricity demand
ARGENTINA
AUSTRALIA
AUSTRIA
BOLIVIA
BRAZIL
CANADA
CHILE
COLOMBIA
FRANCE
GERMANY
INDIA
ITALY
JAPAN
MEXICO
PERU
SPAIN
UNITED KINGDOM
UNITED STATES
CHINA
RUSSIA
FINLAND
GREECE
IRELAND
0
2000
4000
6000
8000
10000
12000
14000
16000
18000
0 5000 10000 15000 20000 25000 30000 35000 40000 45000
Ele
ctr
icit
y c
on
su
mp
tio
n,
per
cap
ita (
Kw
h p
er
year)
Income per capita (Fixed PPP $)
Data source: International Energy Agency (EIA) and The World Bank.
Chile aims to be in the group of developed countries.
There is no development without energy.

Endesa Chile IR presentation YE 2012
12
Expected Evolution for Endesa Chile Installed Capacity
13,845 13.845 13.845 13.845
350 350 350
400 400
145 145 88
150
188
740
490
2011 2012 Under Construction On Basic Engineering
Percentage increase over installed capacity, year 2011 (13.845 MW)
Year 2011 Bocamina II Quimbo Salaco Renaico Los Condores Curibamba Punta Alcalde Neltume
3%
6%
18%

Endesa Chile IR presentation YE 2012
13
Bocamina II
• Thermal, coal fired power plant
• Located in Coronel, Bío-Bío region
• 350 MW of installed capacity
• Estimated load factor: 65%
• Capex: US$ 841 MM Investment
• On October 29th, 2012, Bocamina II started its
commercial operations with the formal approval
from the authority.
• Approx 510 GWh1 generated during year 2012.
New Plant Start-Up Increasing Capacity
1IEstimated generation including tests.
Endesa Chile IR presentation YE 2012
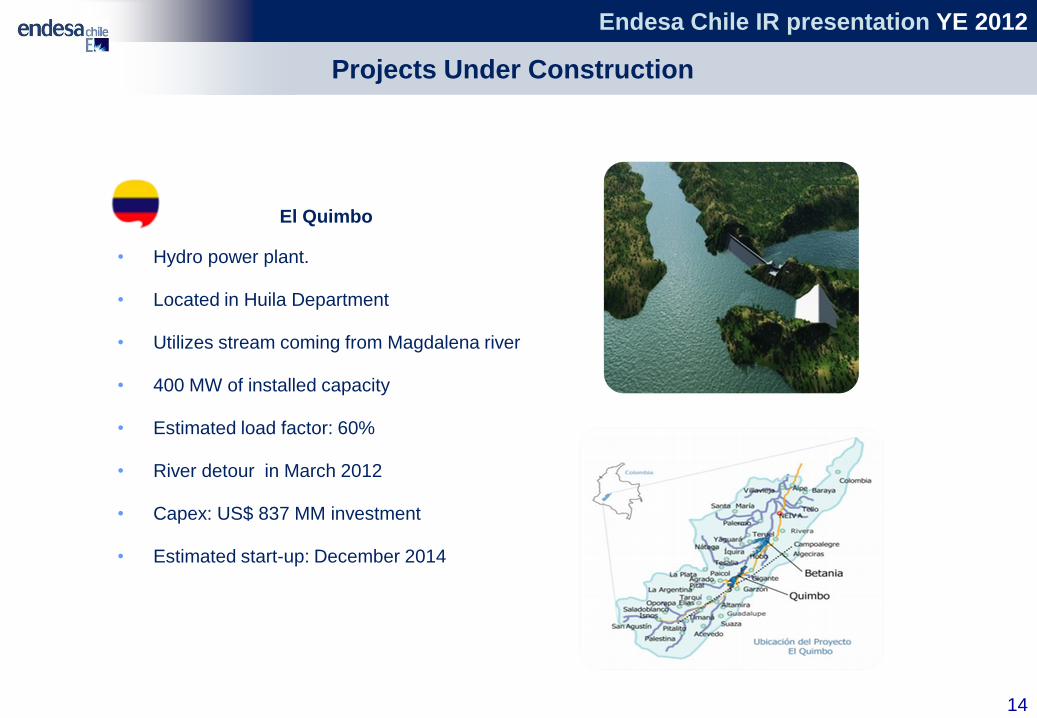
El Quimbo
• Hydro power plant.
• Located in Huila Department
• Utilizes stream coming from Magdalena river
• 400 MW of installed capacity
• Estimated load factor: 60%
• River detour in March 2012
• Capex: US$ 837 MM investment
• Estimated start-up: December 2014
14
Projects Under Construction
Endesa Chile IR presentation YE 2012
15
Projects Under Construction
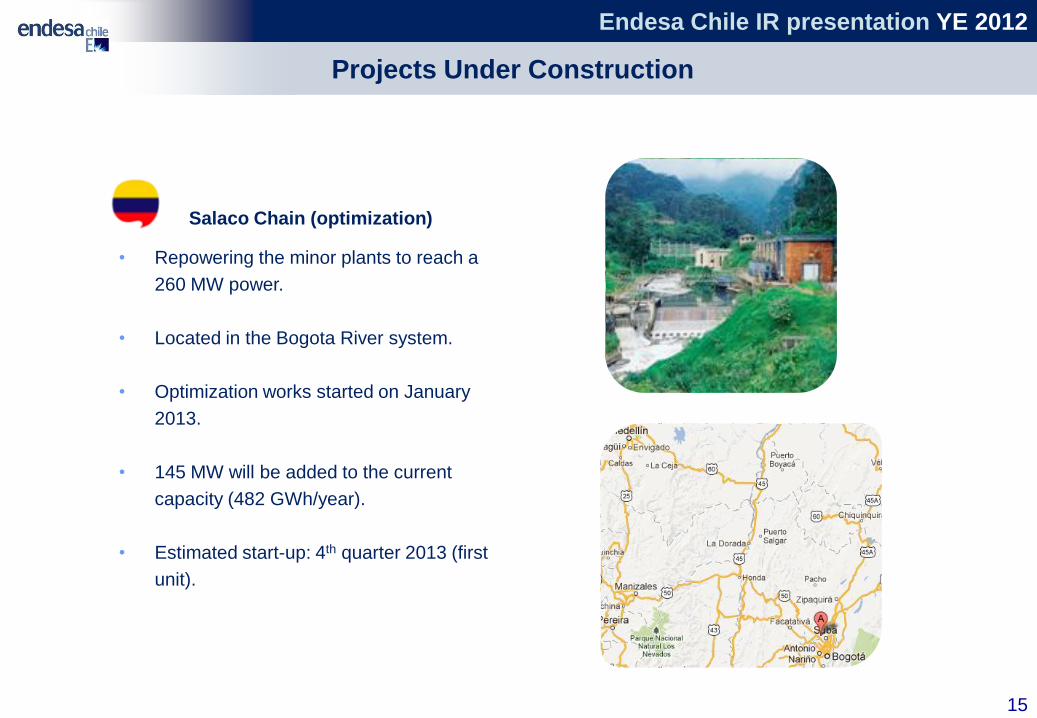
Salaco Chain (optimization)
• Repowering the minor plants to reach a
260 MW power.
• Located in the Bogota River system.
• Optimization works started on January
2013.
• 145 MW will be added to the current
capacity (482 GWh/year).
• Estimated start-up: 4th quarter 2013 (first
unit).

Endesa Chile IR presentation YE 2012
16
Projects Under Study
Los Cóndores
• Hydro power plant
• Located in San Clemente, in Maule
region
• 150 MW of installed capacity
• Estimated load factor: 46%
• EIS approved.
Punta Alcalde
• Thermal, coal-steam power plant
• Located in Huasco, in Atacama region
(SIC)
• 740 MW of installed capacity
• Estimated load factor: 83%
• EIS approved by the Ministers
Committee on Dec 03th 2012
Endesa Chile IR presentation YE 2012
17
Projects Under Study
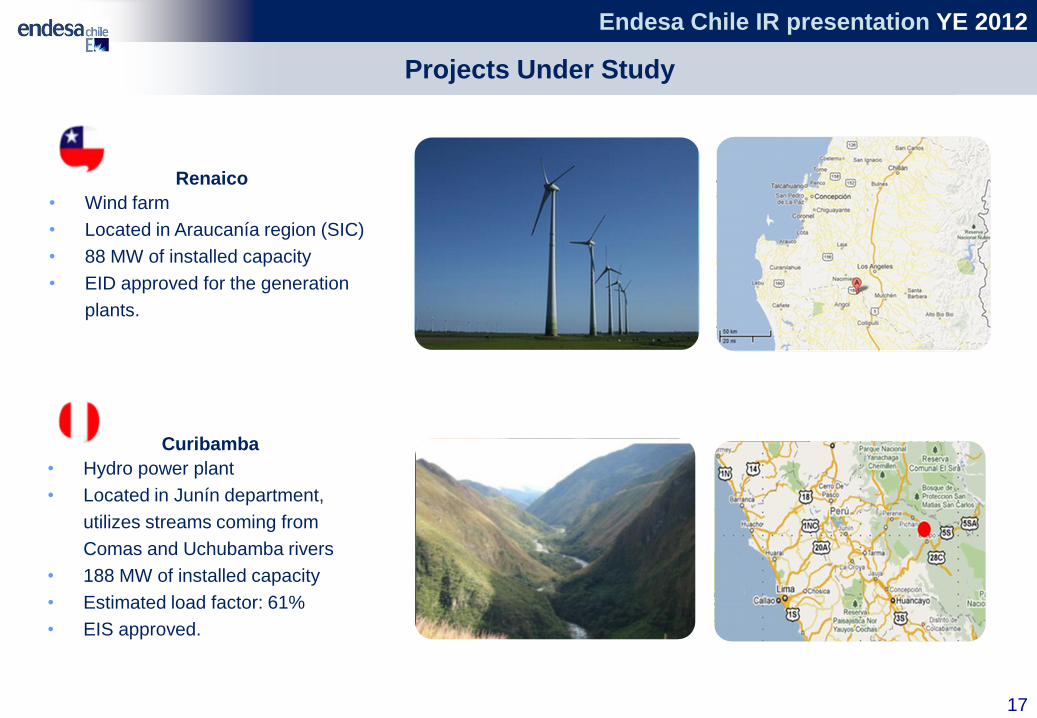
Curibamba
• Hydro power plant
• Located in Junín department,
utilizes streams coming from
Comas and Uchubamba rivers
• 188 MW of installed capacity
• Estimated load factor: 61%
• EIS approved.
Renaico
• Wind farm
• Located in Araucanía region (SIC)
• 88 MW of installed capacity
• EID approved for the generation
plants.

Endesa Chile IR presentation YE 2012
18
Projects Under Study
Neltume
• Hydro power plant, run of the river
• Located in Panguipulli, in Los Ríos
region (SIC).
• 490 MW of installed capacity.
Endesa Chile IR presentation YE 2012
19
Projects Under Study
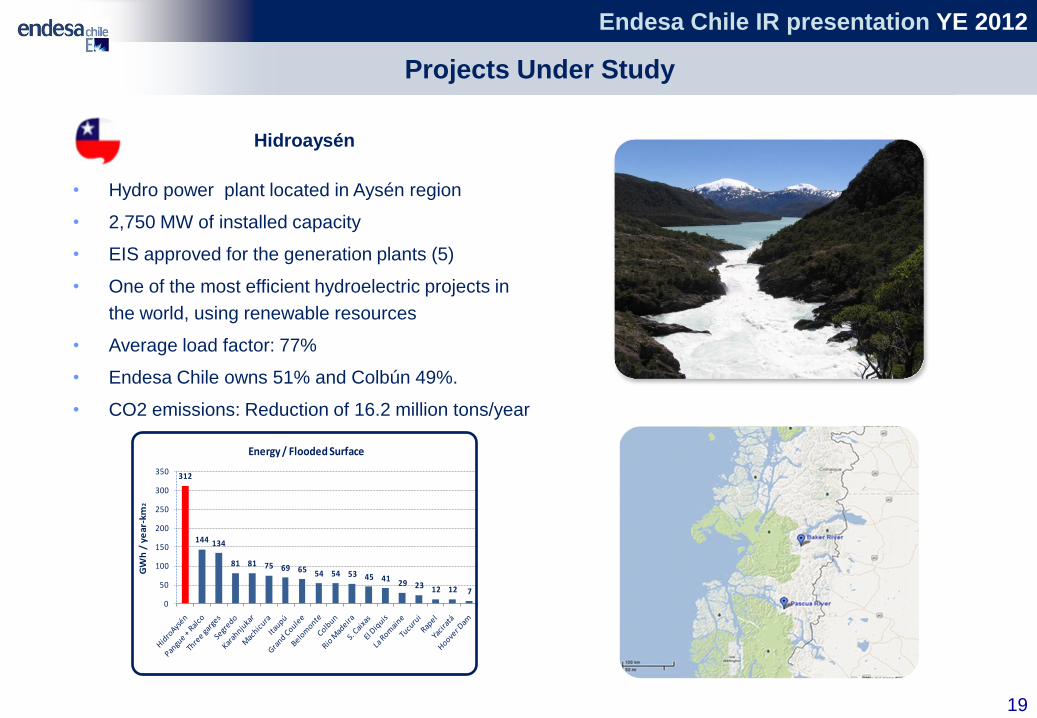
Hidroaysén
• Hydro power plant located in Aysén region
• 2,750 MW of installed capacity
• EIS approved for the generation plants (5)
• One of the most efficient hydroelectric projects in
the world, using renewable resources
• Average load factor: 77%
• Endesa Chile owns 51% and Colbún 49%.
• CO2 emissions: Reduction of 16.2 million tons/year
312
144 134
81 81 75 69 65 54 54 53 45 4129 23 12 12 7
0
50
100
150
200
250
300
350
GW
h /
ye
ar-k
m2
Energy / Flooded Surface

Endesa Chile IR presentation YE 2012
10,072 10,393 9,428
13,963 15,364
12,102 13,297
2006 2007 2008 2009 2010 2011 2012
1 Amounts expressed in US$, using the average exchange rate for each period.2 Amounts expressed in US$, using the last exchange rate for each period.3 Considers only the interim dividend paid in January 24, 2013 20
Dividends
(Ch$ per Share)EBITDA
(US$ Million)
Market Value
(US$ Million)
Market Value and Dividends
1
Source: Intern using Bloomberg
2
1.503 1.671
2.033 2.248
2.098 2.014
1.714
2006 2007 2008 2009 2010 2011 2012
13.8
21.3
26.8
32.5
27.2
3,04
2007 2008 2009 2010 2011 2012
3.02
3

Endesa Chile IR presentation YE 2012
21
Contact us at:
Juan Pablo Vicuña
Investor Relations Executive
(56-2) 2630 9585
Susana Rey
Investor Relations Director
(56-2) 2630 9606
Catalina Gonzalez
Head of Investor Relations
(56-2) 2630 9603
Guillermo Berguecio
Investor Relations Executive
(56-2) 2630 9506
Endesa Chile’s Investor Relations Team
Endesa Chile IR presentation YE 2012
22
EXHIBITS
Endesa Chile IR presentation YE 2012
23
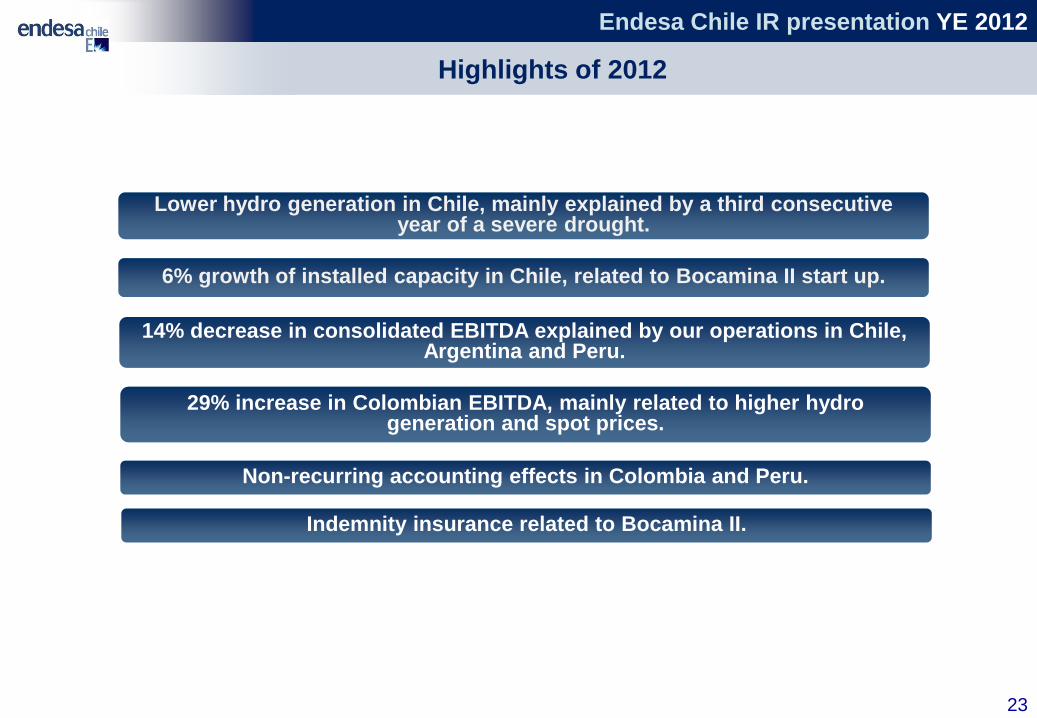
Lower hydro generation in Chile, mainly explained by a third consecutive year of a severe drought.
Highlights of 2012
29% increase in Colombian EBITDA, mainly related to higher hydro generation and spot prices.
Non-recurring accounting effects in Colombia and Peru.
6% growth of installed capacity in Chile, related to Bocamina II start up.
14% decrease in consolidated EBITDA explained by our operations in Chile, Argentina and Peru.
Indemnity insurance related to Bocamina II.

Endesa Chile IR presentation YE 2012
24
Argentina
Costanera: 2,324 MW
El Chocón: 1,328 MWHydro
1,328 MW
Installed Capacity: 3,652 MW
Market Share: 12%
Total Generation: 11,289 GWh
EL CHOCÓN
COSTANERA
Thermal
2,324 MW
El Chocón
Costanera
CIEN Line
(2x1,050 MW)
Interconnection
with Brazil
Million US$ 2011 2012 Change
Revenues 99 101 2%
EBITDA 55 56 3%
EBITDA Margin 54.9% 55.8% 2%
Physical Sales (GWh) 2,888 3,197 11%
Million US$ 2011 2012 Change
Revenues 702 607 (14%)
EBITDA 41 (4) (110%)
EBITDA Margin 5.8% (1%) (112%)
Physical Sales (GWh) 8,493 8,655 2%
Endesa Chile IR presentation YE 2012
25
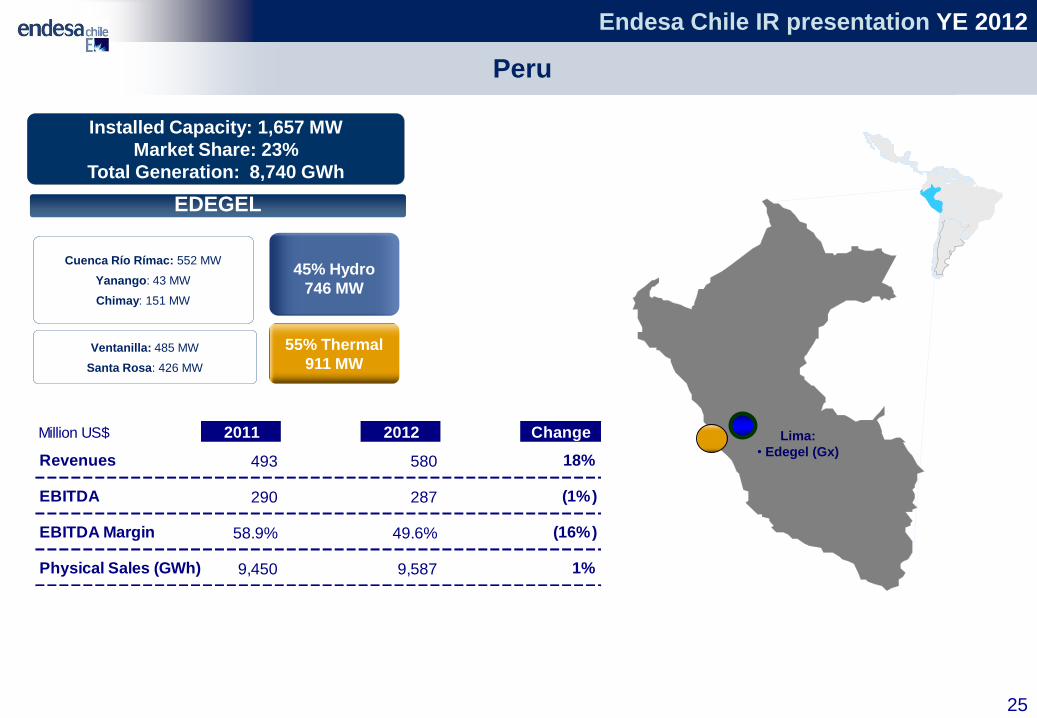
Lima:
• Edegel (Gx)
Ventanilla: 485 MW
Santa Rosa: 426 MW
55% Thermal
911 MW
Cuenca Río Rímac: 552 MW
Yanango: 43 MW
Chimay: 151 MW
45% Hydro
746 MW
Installed Capacity: 1,657 MW
Market Share: 23%
Total Generation: 8,740 GWh
EDEGEL
Peru
Million US$ 2011 2012 Change
Revenues 493 580 18%
EBITDA 290 287 (1%)
EBITDA Margin 58.9% 49.6% (16%)
Physical Sales (GWh) 9,450 9,587 1%

Endesa Chile IR presentation YE 2012
26
Installed Capacity1: 5,961 MW
Market Share: 33%
Total Generation: 20,194 GWh
ENDESA CHILE
D. Almagro–Taltal
Bocamina Laja
Maule
Bio Bio
Tarapaca
Huasco
San Isidro
Los Molles
Cachapoal
Santiago
Los Molles: 18 MW
Rapel-Sauzal: 466 MW
Maule: 875 MW
Laja: 940 MW
Ralco-Pangue: 1,157 MW
58% Hydro
3,456 MW
41% Thermal
2,418 MW
Tarapaca-G.Atacama: 572 MW
D. Almagro–Taltal: 269 MW
Huasco: 64 MW
San Isidro 1 and 2: 778 MW
Bocamina: 128 MW
Bocamina II: 350 MW
TG Quintero: 257 MW
1% NCRE
87 MW
Canela: 18 MW
Canela II: 60 MW
Ojos de Agua: 9MW
Chile
Million US$ 2011 2012 Change
Revenues 2,624 2,391 (9%)
EBITDA 1,019 602 (41%)
EBITDA Margin 38.8% 25.2% (35%)
Physical Sales (GWh) 22,070 21,277 (4%)
Endesa Chile IR presentation YE 2012
27
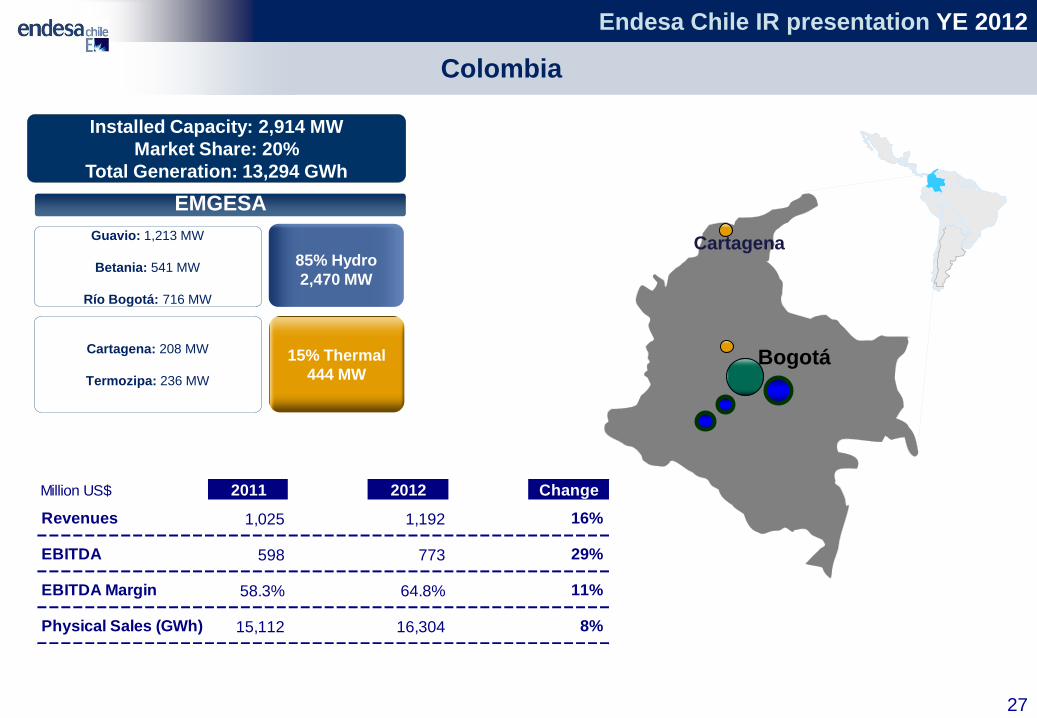
Guavio: 1,213 MW
Betania: 541 MW
Río Bogotá: 716 MW
85% Hydro
2,470 MW
15% Thermal
444 MW
Cartagena: 208 MW
Termozipa: 236 MW
Installed Capacity: 2,914 MW
Market Share: 20%
Total Generation: 13,294 GWh
EMGESA
Cartagena
Bogotá
Colombia
Million US$ 2011 2012 Change
Revenues 1,025 1,192 16%
EBITDA 598 773 29%
EBITDA Margin 58.3% 64.8% 11%
Physical Sales (GWh) 15,112 16,304 8%

Endesa Chile IR presentation YE 2012
28
Fortaleza: 322 MWThermal
322 MW
Cachoeira: 665 MW Hydro
665 MW
Installed Capacity: 987 MW
Market Share: 1%
Total Generation: 5,177 GWh
CACHOEIRA
FORTALEZA
Fortaleza
Rio de Janeiro
Two 500 Km lines
Total interconnection capacity: 2,100 MW
CIEN1: Transmission
Brazil-Argentina Interconnection
Brazil
Cachoeira
1Includes CIEN, CTM and TESA
Million US$ 2011 2012 Change
Revenues 260 319 23%
EBITDA 193 229 19%
EBITDA Margin 74.0% 71.9% (3%)
Physical Sales (GWh) 3,986 4,344 9%
Million US$ 2011 2012 Change
Revenues 266 286 7%
EBITDA 118 99 (16%)
EBITDA Margin 44.3% 34.8% (21%)
Physical Sales (GWh) 2,842 2,947 4%
Million US$ 2011 2012 Change
Revenues 123 149 21%
EBITDA 174 105 (40%)
EBITDA Margin 141.6% 70.3% (50%)

Endesa Chile IR presentation YE 2012
29
Installed Capacity, and Energy Generation
Installed
Capacity
Generation
MW 12M 2012
Chile Colombia Brazil Peru Argentina Total
Total 5,961 2,914 986.7 1,657 3,652 15,172
Hydro 3,456 2,471 665 746 1,328 8,666
Nuclear - - - - - -
Coal 636 236 - - - 872
Oil-Gas 1,782 208 322 911 2,324 5,547
CHP / Renewables 87 - - - - 87
MWh 12M 2012
chg. Vs. 12M 2011
Chile Colombia Brazil Peru Argentina Total
Total 20,194 -2.5% 13,294 10.0% 5,177 24.6% 8,740 -4.5% 11,289 4.5% 58,694 3.1%
Hydro 11,171 -5.9% 12,692 9.2% 3,722 19.3% 4,599 -0.3% 2,801 16.5% 34,985 4.0%
Nuclear 0 - 0 - 0 - 0 - 0 - 0 -
Coal 2,337 28.4% 398 51.0% 0 - 0 - 0 - 2,735 31.3%
Oil-Gas 6,483 -5.4% 203 -1.5% 1,454 40.7% 4,141 -8.7% 8,488 1.1% 20,770 -1.2%
CHP / Renewables 204 17.6% 0 - 0 - 0 - 0 - 204 17.6%
Endesa Chile IR presentation YE 2012
30
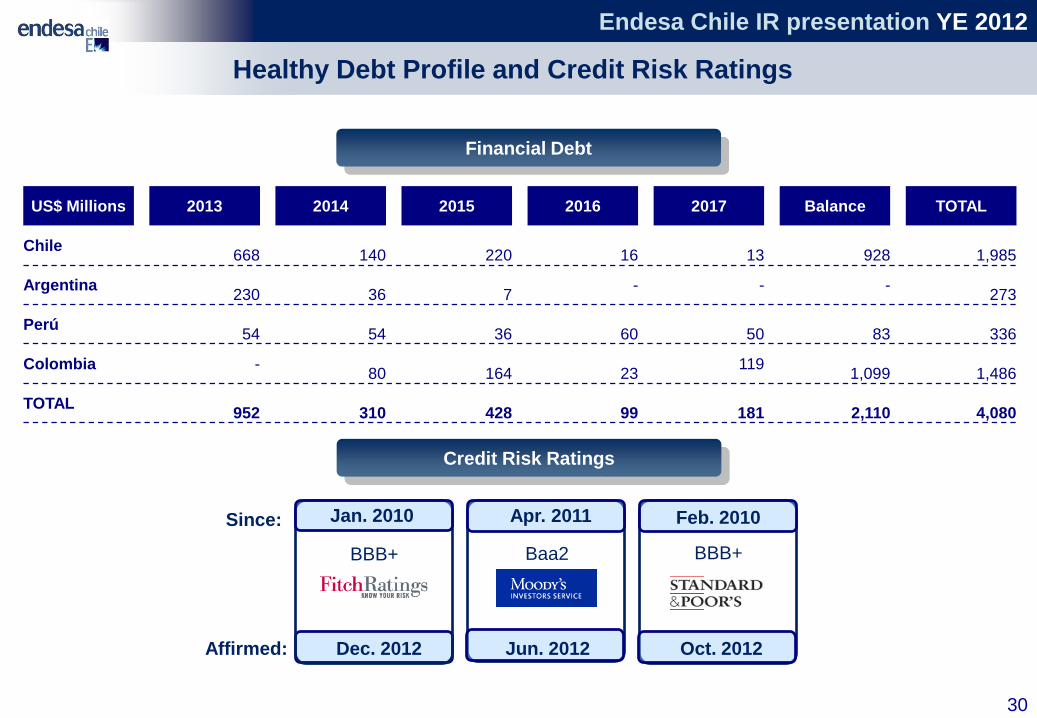
Feb. 2010Jan. 2010 Apr. 2011
BBB+ Baa2 BBB+
Since:
Affirmed: Dec. 2012 Oct. 2012
Credit Risk Ratings
Jun. 2012
Financial Debt
Healthy Debt Profile and Credit Risk Ratings
US$ Millions 2013 2014 2015 2016 2017 Balance TOTAL
Chile668 140 220 16 13 928 1,985
Argentina230 36 7
- - -273
Perú54 54 36 60 50 83 336
Colombia -80 164 23
119 1,099 1,486
TOTAL952 310 428 99 181 2,110 4,080

Endesa Chile IR presentation YE 2012
31
Net debt/EBITDA EBITDA/Net financial expenses
1 EBITDA / (Financial expenses + Income (Loss) for indexed assets and liabilities + Foreign currency exchange differences, net)
Endesa Chile 2011 2012
Financial Expense Coverage1 6.5 5.2
ROE (%) 18.1% 9.2%
ROA (%) 9.2% 6.4%
Principal Financial Ratios
5.6
7.4
8.9
8.0
5.7
2008 2009 2010 2011 2012
2.0
1.5 1.5 1.5
2.0
2008 2009 2010 2011 2012
Endesa Chile IR presentation YE 2012
32
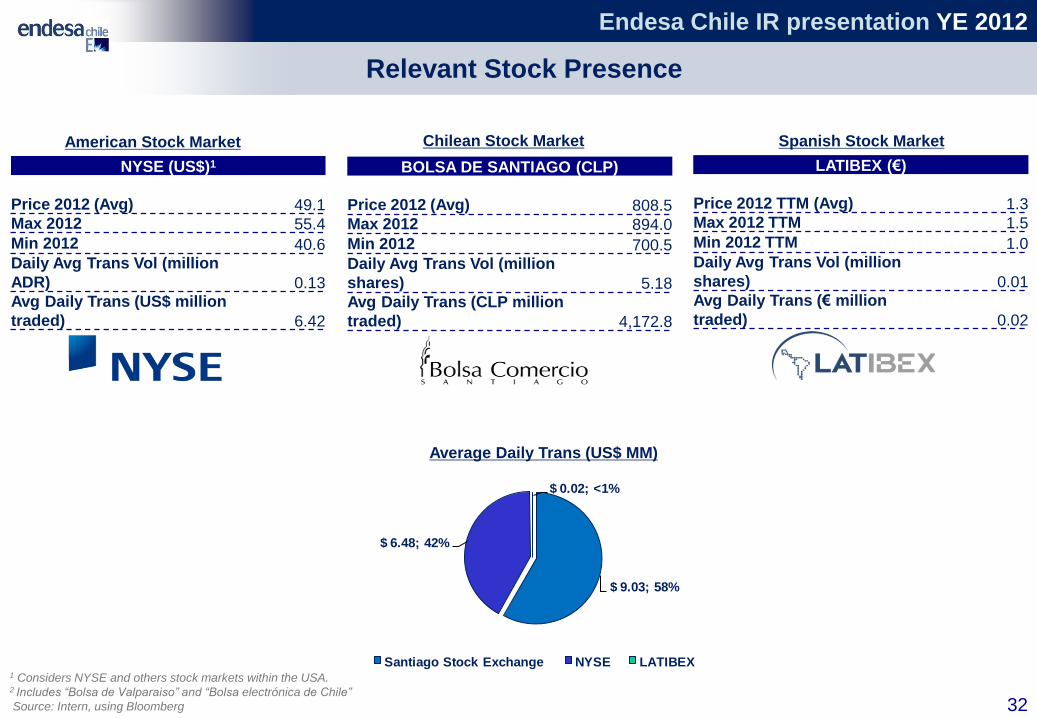
American Stock Market Spanish Stock Market
NYSE (US$)1
Price 2012 (Avg) 49.1Max 2012 55.4
Min 2012 40.6Daily Avg Trans Vol (million
ADR) 0.13Avg Daily Trans (US$ million
traded) 6.42
LATIBEX (€)
Price 2012 TTM (Avg) 1.3Max 2012 TTM 1.5
Min 2012 TTM 1.0Daily Avg Trans Vol (million
shares) 0.01Avg Daily Trans (€ million
traded) 0.02
Chilean Stock Market
BOLSA DE SANTIAGO (CLP)
Price 2012 (Avg) 808.5Max 2012 894.0
Min 2012 700.5Daily Avg Trans Vol (million
shares) 5.18Avg Daily Trans (CLP million
traded) 4,172.8
Relevant Stock Presence
1 Considers NYSE and others stock markets within the USA.2 Includes “Bolsa de Valparaiso” and “Bolsa electrónica de Chile”
Source: Intern, using Bloomberg
Average Daily Trans (US$ MM)
$ 9.03; 58%
$ 6.48; 42%
$ 0.02; <1%
Santiago Stock Exchange NYSE LATIBEX
Endesa Chile IR presentation YE 2012
33
“This document is the property of ENDESA and therefore must not be disseminated or published without ENDESA's prior written consent.
The content of this document is provided for information purposes only and therefore has no contractual substance and should not be used as part of or construed as a legal contract.
ENDESA does not assume any responsibility for the information contained in this document and does not offer any implicit or explicit guarantees of the impartiality, accuracy and completeness of
this information and the opinions and statements contained therein. It shall also not be liable for any loss or damages that could arise as a result of using this information.
ENDESA does not guarantee that the forward-looking statements in this document will apply in the future in the terms set forth. Neither ENDESA nor its subsidiaries intend to update suchestimates, forecasts and objectives contained herein, except where required to do so by law”.